Troy, ID
Troy Map
Troy Overview
945
TOTAL POPULATION
474
MALE POPULATION
471
FEMALE POPULATION
100.64
MALES / 100 FEMALES
99.37
FEMALES / 100 MALES
38.9
MEDIAN AGE
3.2
AVG FAMILY SIZE
2.5
AVG HOUSEHOLD SIZE
$32,319
PER CAPITA INCOME
$92,313
AVG FAMILY INCOME
$74,444
AVG HOUSEHOLD INCOME
29.7%
WAGE / INCOME GAP [ % ]
70.3¢/ $1
WAGE / INCOME GAP [ $ ]
0.33
INEQUALITY / GINI INDEX
474
LABOR FORCE [ PEOPLE ]
68.4%
PERCENT IN LABOR FORCE
4.9%
UNEMPLOYMENT RATE
Troy Zip Codes
Troy Area Codes
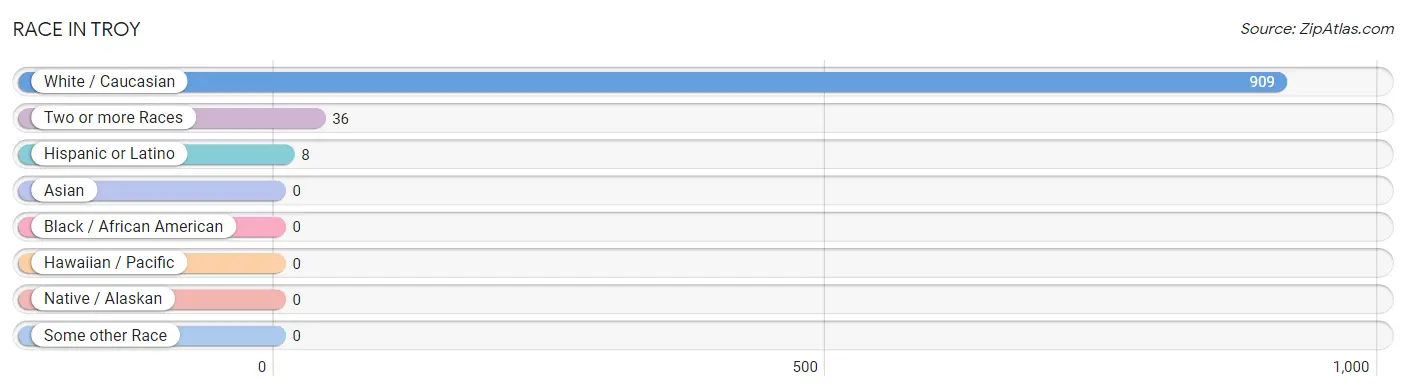
Race in Troy
The most populous races in Troy are White / Caucasian (909 | 96.2%), Two or more Races (36 | 3.8%), and Hispanic or Latino (8 | 0.9%).
| Race | # Population | % Population |
| Asian | 0 | 0.0% |
| Black / African American | 0 | 0.0% |
| Hawaiian / Pacific | 0 | 0.0% |
| Hispanic or Latino | 8 | 0.9% |
| Native / Alaskan | 0 | 0.0% |
| White / Caucasian | 909 | 96.2% |
| Two or more Races | 36 | 3.8% |
| Some other Race | 0 | 0.0% |
| Total | 945 | 100.0% |
Ancestry in Troy
The most populous ancestries reported in Troy are German (165 | 17.5%), Irish (148 | 15.7%), English (109 | 11.5%), Swedish (101 | 10.7%), and European (53 | 5.6%), together accounting for 61.0% of all Troy residents.

| Ancestry | # Population | % Population |
| American | 18 | 1.9% |
| Cherokee | 1 | 0.1% |
| Croatian | 8 | 0.9% |
| Danish | 15 | 1.6% |
| Dutch | 10 | 1.1% |
| English | 109 | 11.5% |
| European | 53 | 5.6% |
| French Canadian | 3 | 0.3% |
| German | 165 | 17.5% |
| Greek | 3 | 0.3% |
| Hungarian | 6 | 0.6% |
| Irish | 148 | 15.7% |
| Italian | 25 | 2.6% |
| Korean | 5 | 0.5% |
| Mexican | 8 | 0.9% |
| Norwegian | 48 | 5.1% |
| Pennsylvania German | 4 | 0.4% |
| Polish | 3 | 0.3% |
| Scandinavian | 2 | 0.2% |
| Scotch-Irish | 15 | 1.6% |
| Scottish | 6 | 0.6% |
| Swedish | 101 | 10.7% |
| Swiss | 12 | 1.3% |
| Ukrainian | 3 | 0.3% | View All 24 Rows |
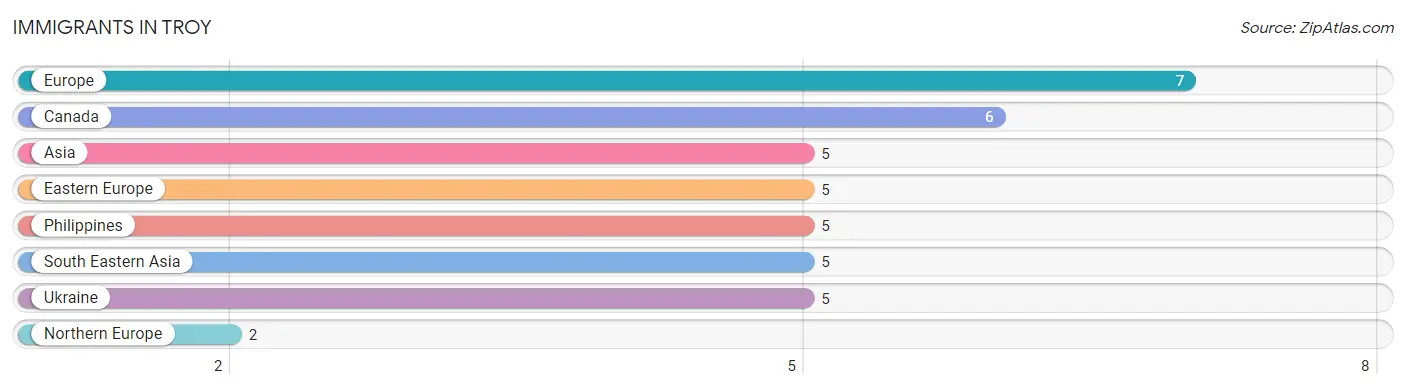
Immigrants in Troy
The most numerous immigrant groups reported in Troy came from Europe (7 | 0.7%), Canada (6 | 0.6%), Asia (5 | 0.5%), Eastern Europe (5 | 0.5%), and Philippines (5 | 0.5%), together accounting for 3.0% of all Troy residents.
| Immigration Origin | # Population | % Population |
| Asia | 5 | 0.5% |
| Canada | 6 | 0.6% |
| Eastern Europe | 5 | 0.5% |
| Europe | 7 | 0.7% |
| Northern Europe | 2 | 0.2% |
| Philippines | 5 | 0.5% |
| South Eastern Asia | 5 | 0.5% |
| Ukraine | 5 | 0.5% | View All 8 Rows |
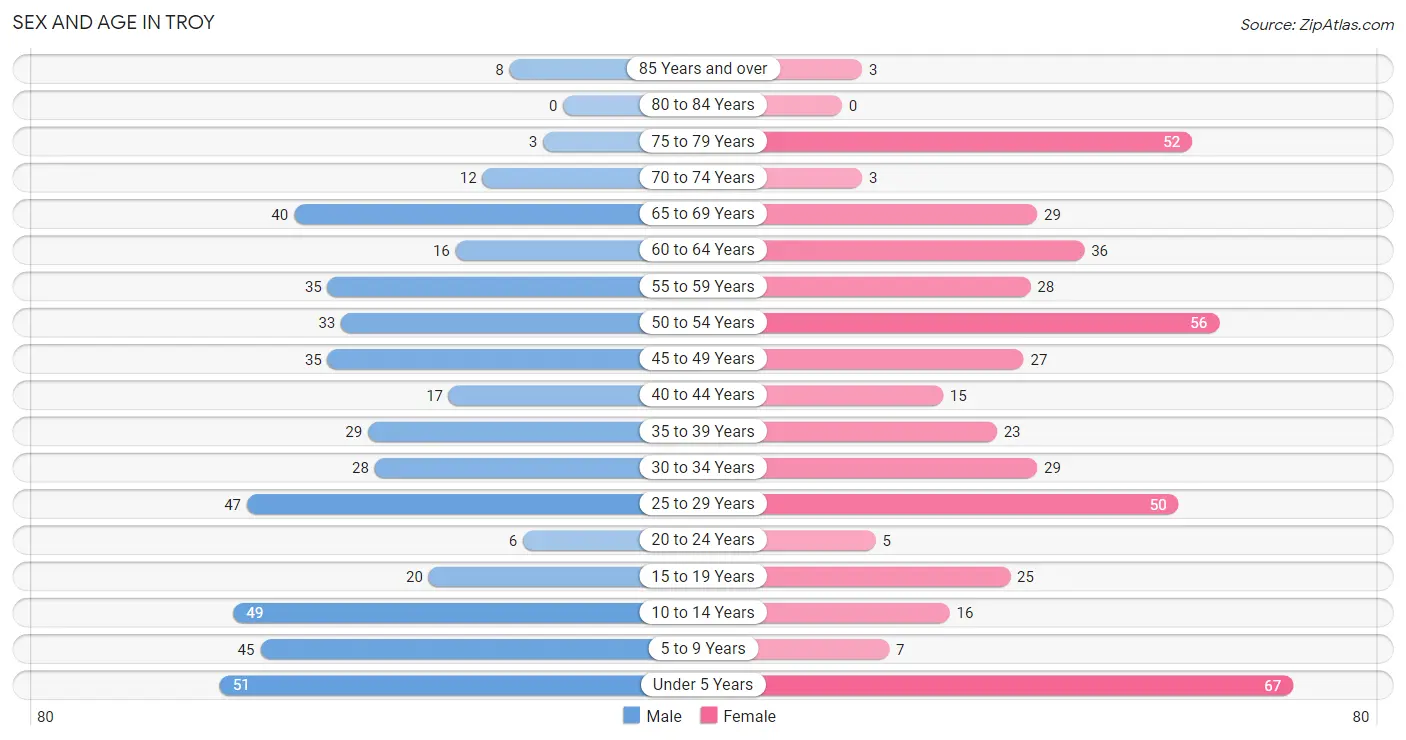
Sex and Age in Troy
Sex and Age in Troy
The most populous age groups in Troy are Under 5 Years (51 | 10.8%) for men and Under 5 Years (67 | 14.2%) for women.
| Age Bracket | Male | Female |
| Under 5 Years | 51 (10.8%) | 67 (14.2%) |
| 5 to 9 Years | 45 (9.5%) | 7 (1.5%) |
| 10 to 14 Years | 49 (10.3%) | 16 (3.4%) |
| 15 to 19 Years | 20 (4.2%) | 25 (5.3%) |
| 20 to 24 Years | 6 (1.3%) | 5 (1.1%) |
| 25 to 29 Years | 47 (9.9%) | 50 (10.6%) |
| 30 to 34 Years | 28 (5.9%) | 29 (6.2%) |
| 35 to 39 Years | 29 (6.1%) | 23 (4.9%) |
| 40 to 44 Years | 17 (3.6%) | 15 (3.2%) |
| 45 to 49 Years | 35 (7.4%) | 27 (5.7%) |
| 50 to 54 Years | 33 (7.0%) | 56 (11.9%) |
| 55 to 59 Years | 35 (7.4%) | 28 (5.9%) |
| 60 to 64 Years | 16 (3.4%) | 36 (7.6%) |
| 65 to 69 Years | 40 (8.4%) | 29 (6.2%) |
| 70 to 74 Years | 12 (2.5%) | 3 (0.6%) |
| 75 to 79 Years | 3 (0.6%) | 52 (11.0%) |
| 80 to 84 Years | 0 (0.0%) | 0 (0.0%) |
| 85 Years and over | 8 (1.7%) | 3 (0.6%) |
| Total | 474 (100.0%) | 471 (100.0%) |
Families and Households in Troy
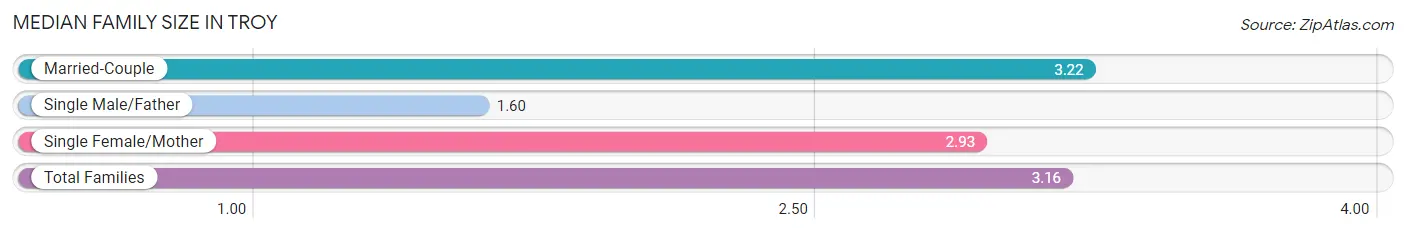
Median Family Size in Troy
The median family size in Troy is 3.16 persons per family, with married-couple families (221 | 87.4%) accounting for the largest median family size of 3.22 persons per family. On the other hand, single male/father families (5 | 2.0%) represent the smallest median family size with 1.60 persons per family.
| Family Type | # Families | Family Size |
| Married-Couple | 221 (87.4%) | 3.22 |
| Single Male/Father | 5 (2.0%) | 1.60 |
| Single Female/Mother | 27 (10.7%) | 2.93 |
| Total Families | 253 (100.0%) | 3.16 |
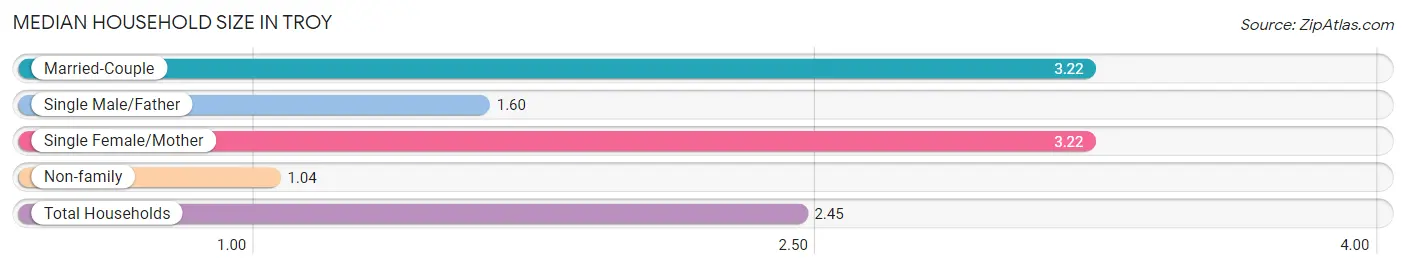
Median Household Size in Troy
The median household size in Troy is 2.45 persons per household, with married-couple households (221 | 57.3%) accounting for the largest median household size of 3.22 persons per household. non-family households (133 | 34.5%) represent the smallest median household size with 1.04 persons per household.
| Household Type | # Households | Household Size |
| Married-Couple | 221 (57.3%) | 3.22 |
| Single Male/Father | 5 (1.3%) | 1.60 |
| Single Female/Mother | 27 (7.0%) | 3.22 |
| Non-family | 133 (34.5%) | 1.04 |
| Total Households | 386 (100.0%) | 2.45 |
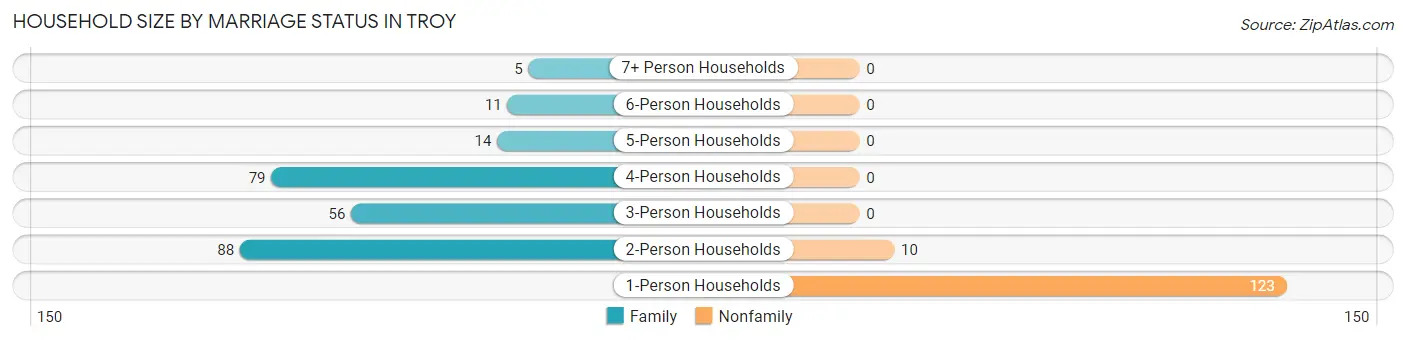
Household Size by Marriage Status in Troy
Out of a total of 386 households in Troy, 253 (65.5%) are family households, while 133 (34.5%) are nonfamily households. The most numerous type of family households are 2-person households, comprising 88, and the most common type of nonfamily households are 1-person households, comprising 123.
| Household Size | Family Households | Nonfamily Households |
| 1-Person Households | - | 123 (31.9%) |
| 2-Person Households | 88 (22.8%) | 10 (2.6%) |
| 3-Person Households | 56 (14.5%) | 0 (0.0%) |
| 4-Person Households | 79 (20.5%) | 0 (0.0%) |
| 5-Person Households | 14 (3.6%) | 0 (0.0%) |
| 6-Person Households | 11 (2.9%) | 0 (0.0%) |
| 7+ Person Households | 5 (1.3%) | 0 (0.0%) |
| Total | 253 (65.5%) | 133 (34.5%) |
Female Fertility in Troy
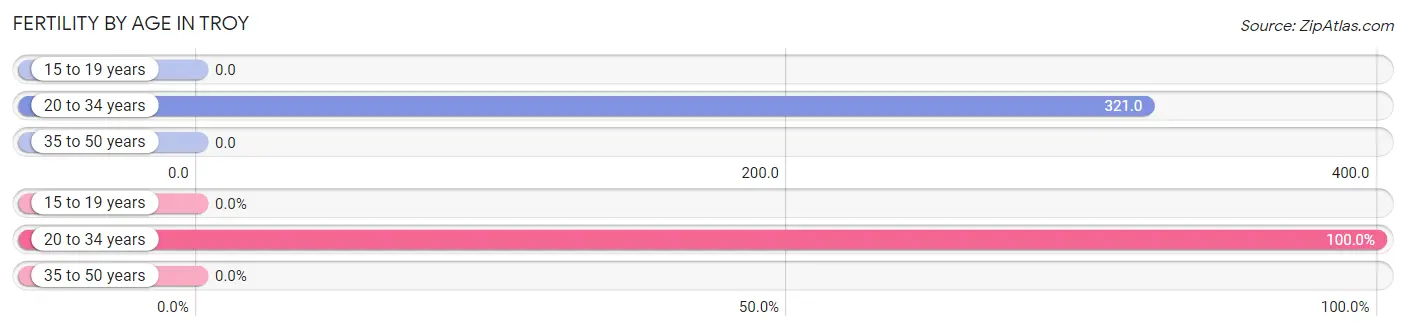
Fertility by Age in Troy
Average fertility rate in Troy is 155.0 births per 1,000 women. Women in the age bracket of 20 to 34 years have the highest fertility rate with 321.0 births per 1,000 women. Women in the age bracket of 20 to 34 years acount for 100.0% of all women with births.
| Age Bracket | Women with Births | Births / 1,000 Women |
| 15 to 19 years | 0 (0.0%) | 0.0 |
| 20 to 34 years | 27 (100.0%) | 321.0 |
| 35 to 50 years | 0 (0.0%) | 0.0 |
| Total | 27 (100.0%) | 155.0 |
Fertility by Age by Marriage Status in Troy
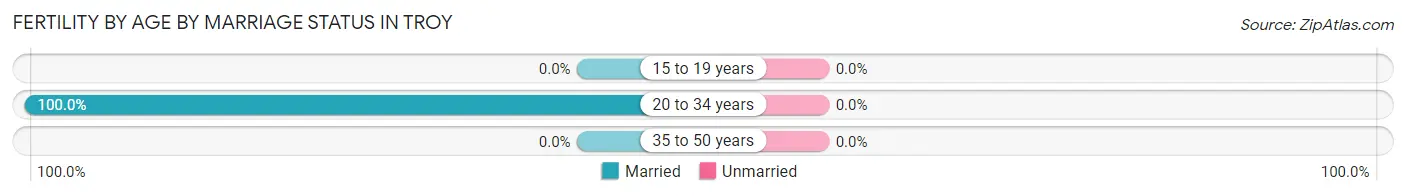
| Age Bracket | Married | Unmarried |
| 15 to 19 years | 0 (0.0%) | 0 (0.0%) |
| 20 to 34 years | 27 (100.0%) | 0 (0.0%) |
| 35 to 50 years | 0 (0.0%) | 0 (0.0%) |
| Total | 27 (100.0%) | 0 (0.0%) |
Fertility by Education in Troy
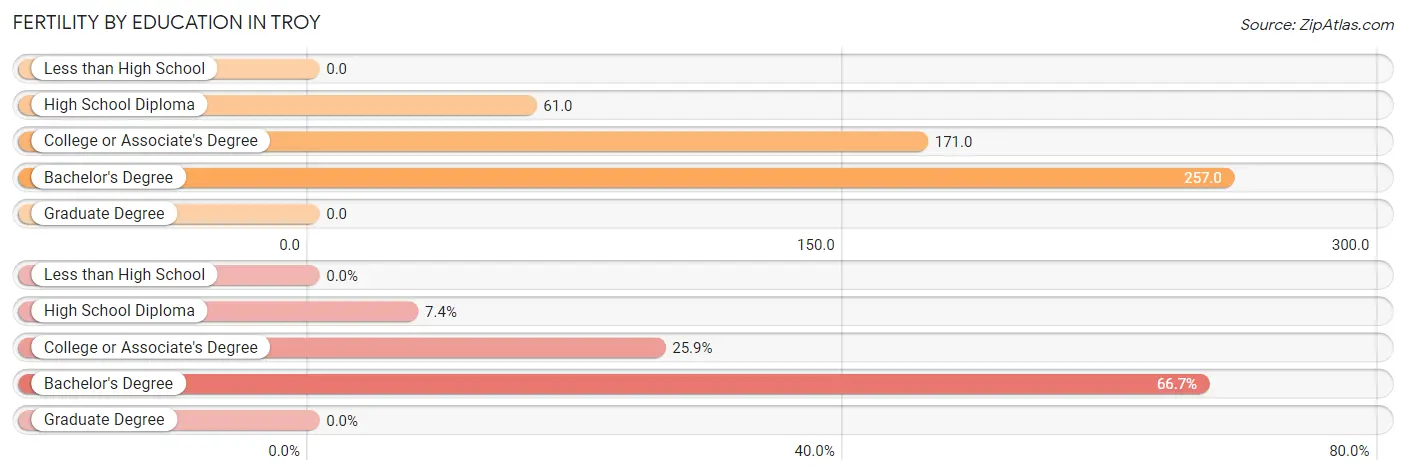
| Educational Attainment | Women with Births | Births / 1,000 Women |
| Less than High School | 0 (0.0%) | 0.0 |
| High School Diploma | 2 (7.4%) | 61.0 |
| College or Associate's Degree | 7 (25.9%) | 171.0 |
| Bachelor's Degree | 18 (66.7%) | 257.0 |
| Graduate Degree | 0 (0.0%) | 0.0 |
| Total | 27 (100.0%) | 155.0 |
Fertility by Education by Marriage Status in Troy
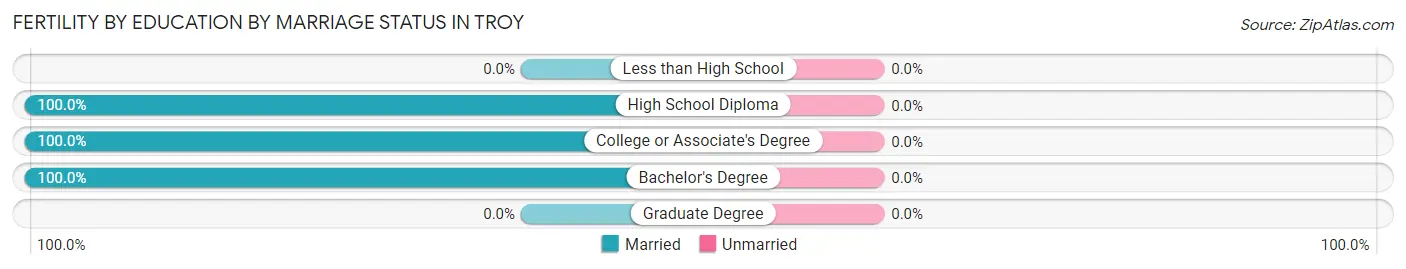
| Educational Attainment | Married | Unmarried |
| Less than High School | 0 (0.0%) | 0 (0.0%) |
| High School Diploma | 2 (100.0%) | 0 (0.0%) |
| College or Associate's Degree | 7 (100.0%) | 0 (0.0%) |
| Bachelor's Degree | 18 (100.0%) | 0 (0.0%) |
| Graduate Degree | 0 (0.0%) | 0 (0.0%) |
| Total | 27 (100.0%) | 0 (0.0%) |
Income in Troy
Income Overview in Troy
Per Capita Income in Troy is $32,319, while median incomes of families and households are $92,313 and $74,444 respectively.
| Characteristic | Number | Measure |
| Per Capita Income | 945 | $32,319 |
| Median Family Income | 253 | $92,313 |
| Mean Family Income | 253 | $97,044 |
| Median Household Income | 386 | $74,444 |
| Mean Household Income | 386 | $80,535 |
| Income Deficit | 253 | $0 |
| Wage / Income Gap (%) | 945 | 29.72% |
| Wage / Income Gap ($) | 945 | 70.28¢ per $1 |
| Gini / Inequality Index | 945 | 0.33 |
Earnings by Sex in Troy
Average Earnings in Troy are $42,461, $55,278 for men and $38,850 for women, a difference of 29.7%.
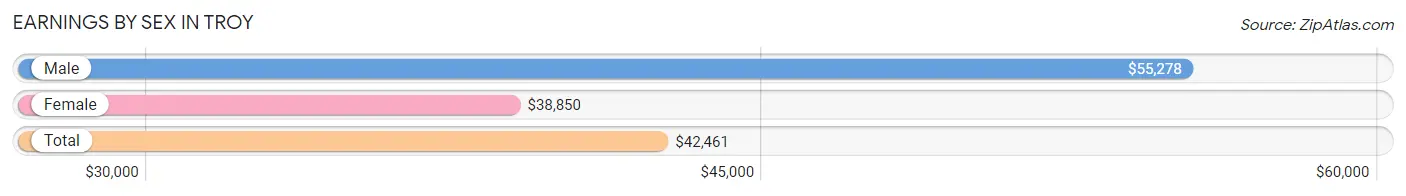
| Sex | Number | Average Earnings |
| Male | 284 (55.4%) | $55,278 |
| Female | 229 (44.6%) | $38,850 |
| Total | 513 (100.0%) | $42,461 |
Earnings by Sex by Income Bracket in Troy
The most common earnings brackets in Troy are $75,000 to $99,999 for men (71 | 25.0%) and $40,000 to $44,999 for women (32 | 14.0%).
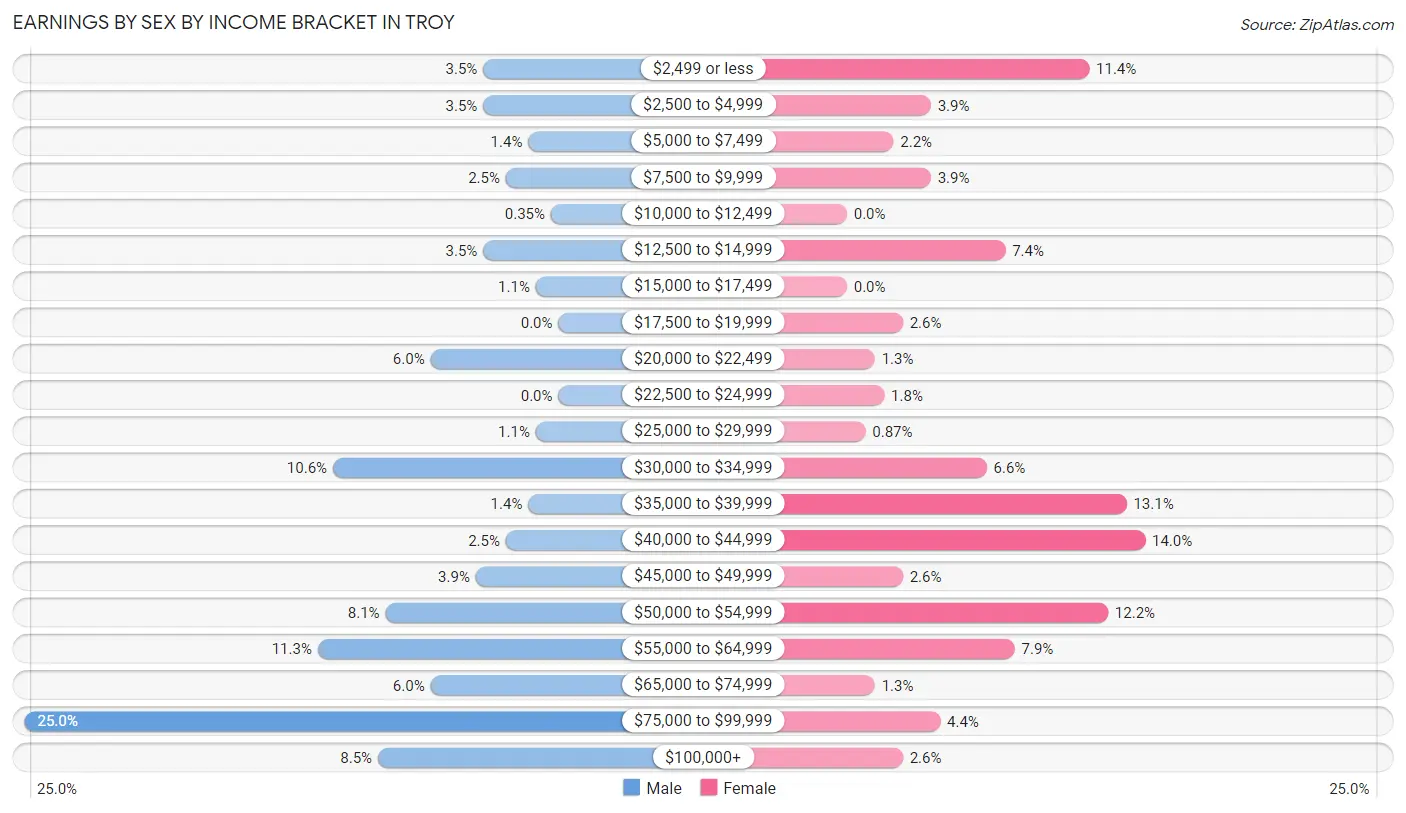
| Income | Male | Female |
| $2,499 or less | 10 (3.5%) | 26 (11.4%) |
| $2,500 to $4,999 | 10 (3.5%) | 9 (3.9%) |
| $5,000 to $7,499 | 4 (1.4%) | 5 (2.2%) |
| $7,500 to $9,999 | 7 (2.5%) | 9 (3.9%) |
| $10,000 to $12,499 | 1 (0.4%) | 0 (0.0%) |
| $12,500 to $14,999 | 10 (3.5%) | 17 (7.4%) |
| $15,000 to $17,499 | 3 (1.1%) | 0 (0.0%) |
| $17,500 to $19,999 | 0 (0.0%) | 6 (2.6%) |
| $20,000 to $22,499 | 17 (6.0%) | 3 (1.3%) |
| $22,500 to $24,999 | 0 (0.0%) | 4 (1.8%) |
| $25,000 to $29,999 | 3 (1.1%) | 2 (0.9%) |
| $30,000 to $34,999 | 30 (10.6%) | 15 (6.6%) |
| $35,000 to $39,999 | 4 (1.4%) | 30 (13.1%) |
| $40,000 to $44,999 | 7 (2.5%) | 32 (14.0%) |
| $45,000 to $49,999 | 11 (3.9%) | 6 (2.6%) |
| $50,000 to $54,999 | 23 (8.1%) | 28 (12.2%) |
| $55,000 to $64,999 | 32 (11.3%) | 18 (7.9%) |
| $65,000 to $74,999 | 17 (6.0%) | 3 (1.3%) |
| $75,000 to $99,999 | 71 (25.0%) | 10 (4.4%) |
| $100,000+ | 24 (8.5%) | 6 (2.6%) |
| Total | 284 (100.0%) | 229 (100.0%) |
Earnings by Sex by Educational Attainment in Troy
Average earnings in Troy are $56,736 for men and $39,450 for women, a difference of 30.5%. Men with an educational attainment of bachelor's degree enjoy the highest average annual earnings of $79,750, while those with college or associate's degree education earn the least with $52,917. Women with an educational attainment of graduate degree earn the most with the average annual earnings of $53,125, while those with college or associate's degree education have the smallest earnings of $35,250.
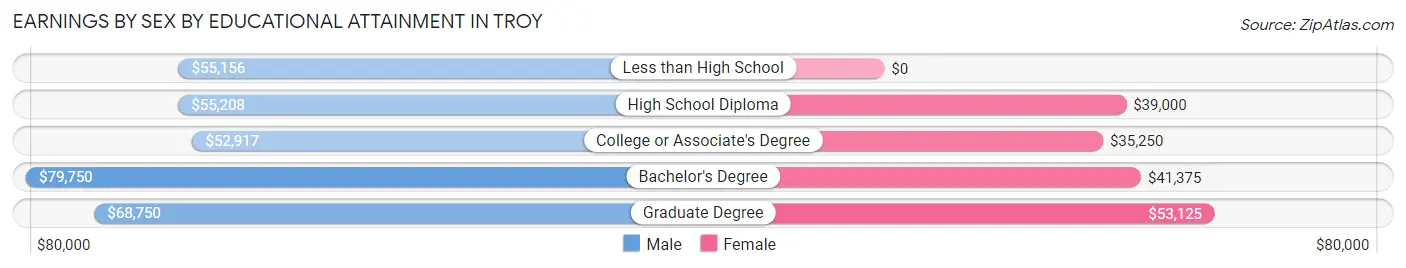
| Educational Attainment | Male Income | Female Income |
| Less than High School | $55,156 | $0 |
| High School Diploma | $55,208 | $39,000 |
| College or Associate's Degree | $52,917 | $35,250 |
| Bachelor's Degree | $79,750 | $41,375 |
| Graduate Degree | $68,750 | $53,125 |
| Total | $56,736 | $39,450 |
Family Income in Troy
Family Income Brackets in Troy
According to the Troy family income data, there are 91 families falling into the $75,000 to $99,999 income range, which is the most common income bracket and makes up 36.0% of all families.
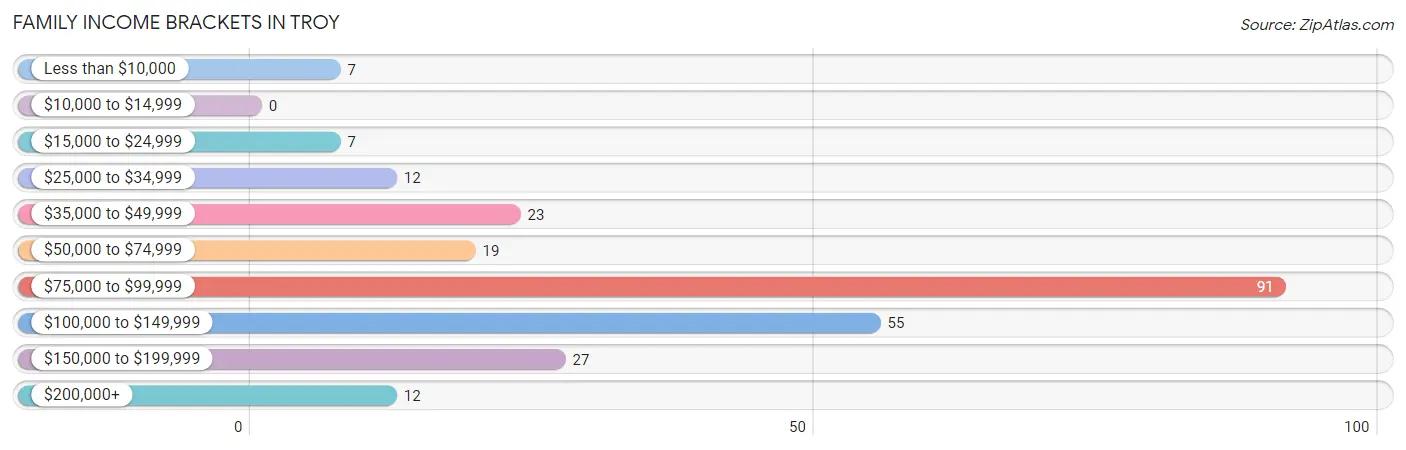
| Income Bracket | # Families | % Families |
| Less than $10,000 | 7 | 2.8% |
| $10,000 to $14,999 | 0 | 0.0% |
| $15,000 to $24,999 | 7 | 2.8% |
| $25,000 to $34,999 | 12 | 4.7% |
| $35,000 to $49,999 | 23 | 9.1% |
| $50,000 to $74,999 | 19 | 7.5% |
| $75,000 to $99,999 | 91 | 36.0% |
| $100,000 to $149,999 | 55 | 21.7% |
| $150,000 to $199,999 | 27 | 10.7% |
| $200,000+ | 12 | 4.7% |
Family Income by Famaliy Size in Troy
6-person families (11 | 4.3%) account for the highest median family income in Troy with $152,708 per family, while 2-person families (88 | 34.8%) have the highest median income of $45,625 per family member.
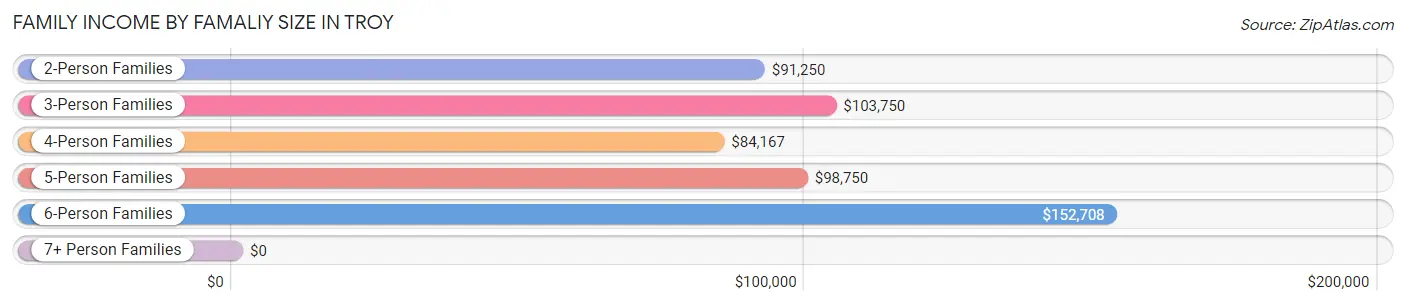
| Income Bracket | # Families | Median Income |
| 2-Person Families | 88 (34.8%) | $91,250 |
| 3-Person Families | 63 (24.9%) | $103,750 |
| 4-Person Families | 72 (28.5%) | $84,167 |
| 5-Person Families | 14 (5.5%) | $98,750 |
| 6-Person Families | 11 (4.3%) | $152,708 |
| 7+ Person Families | 5 (2.0%) | $0 |
| Total | 253 (100.0%) | $92,313 |
Family Income by Number of Earners in Troy
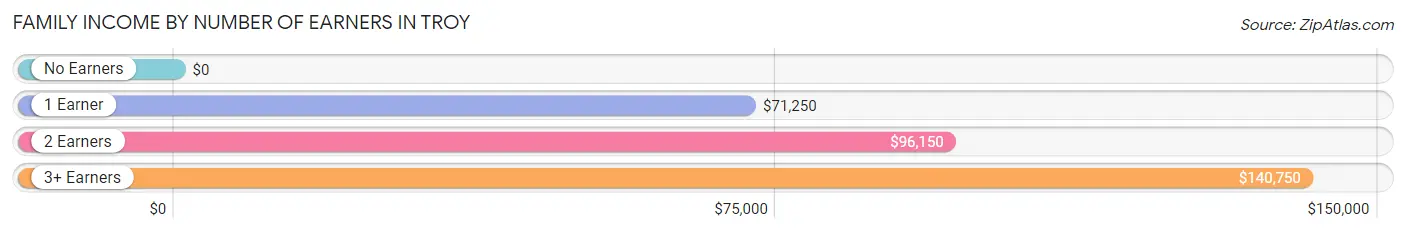
| Number of Earners | # Families | Median Income |
| No Earners | 15 (5.9%) | $0 |
| 1 Earner | 78 (30.8%) | $71,250 |
| 2 Earners | 113 (44.7%) | $96,150 |
| 3+ Earners | 47 (18.6%) | $140,750 |
| Total | 253 (100.0%) | $92,313 |
Household Income in Troy
Household Income Brackets in Troy
With 91 households falling in the category, the $75,000 to $99,999 income range is the most frequent in Troy, accounting for 23.6% of all households. In contrast, only 1 households (0.3%) fall into the $10,000 to $14,999 income bracket, making it the least populous group.
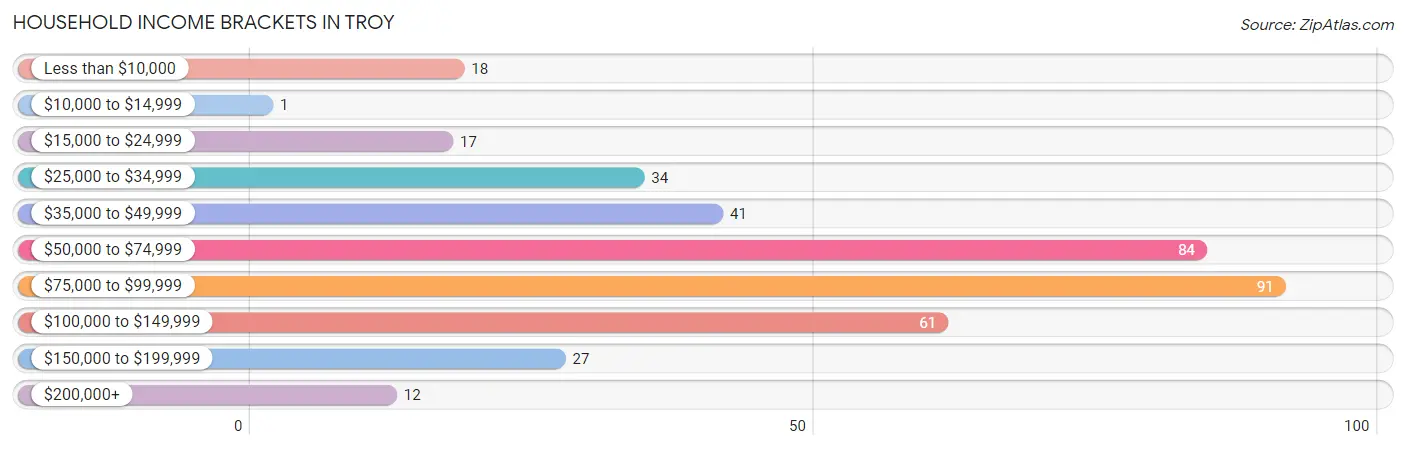
| Income Bracket | # Households | % Households |
| Less than $10,000 | 18 | 4.7% |
| $10,000 to $14,999 | 1 | 0.3% |
| $15,000 to $24,999 | 17 | 4.4% |
| $25,000 to $34,999 | 34 | 8.8% |
| $35,000 to $49,999 | 41 | 10.6% |
| $50,000 to $74,999 | 84 | 21.8% |
| $75,000 to $99,999 | 91 | 23.6% |
| $100,000 to $149,999 | 61 | 15.8% |
| $150,000 to $199,999 | 27 | 7.0% |
| $200,000+ | 12 | 3.1% |
Household Income by Householder Age in Troy
The median household income in Troy is $74,444, with the highest median household income of $95,250 found in the 45 to 64 years age bracket for the primary householder. A total of 159 households (41.2%) fall into this category. Meanwhile, the 15 to 24 years age bracket for the primary householder has the lowest median household income of $0, with 1 households (0.3%) in this group.
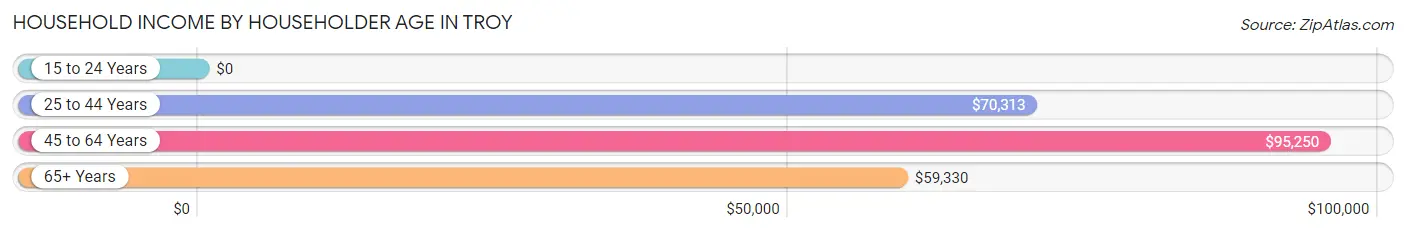
| Income Bracket | # Households | Median Income |
| 15 to 24 Years | 1 (0.3%) | $0 |
| 25 to 44 Years | 119 (30.8%) | $70,313 |
| 45 to 64 Years | 159 (41.2%) | $95,250 |
| 65+ Years | 107 (27.7%) | $59,330 |
| Total | 386 (100.0%) | $74,444 |
Poverty in Troy
Income Below Poverty by Sex and Age in Troy
With 7.8% poverty level for males and 6.8% for females among the residents of Troy, 5 year old males and 65 to 74 year old females are the most vulnerable to poverty, with 7 males (28.0%) and 15 females (46.9%) in their respective age groups living below the poverty level.
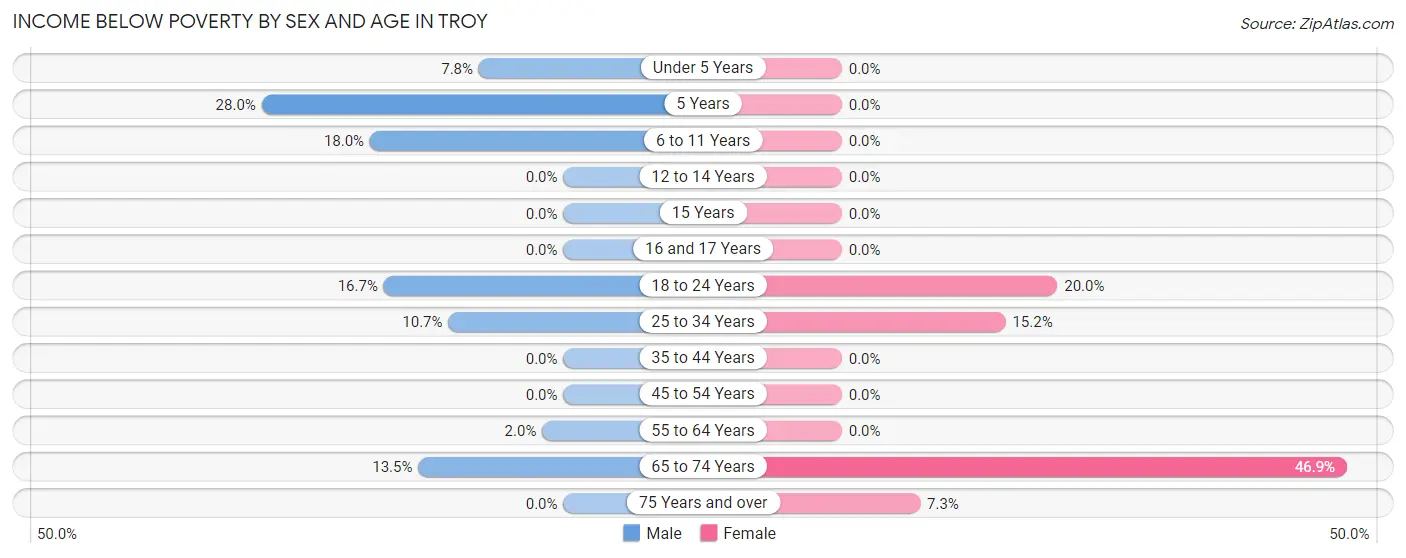
| Age Bracket | Male | Female |
| Under 5 Years | 4 (7.8%) | 0 (0.0%) |
| 5 Years | 7 (28.0%) | 0 (0.0%) |
| 6 to 11 Years | 7 (17.9%) | 0 (0.0%) |
| 12 to 14 Years | 0 (0.0%) | 0 (0.0%) |
| 15 Years | 0 (0.0%) | 0 (0.0%) |
| 16 and 17 Years | 0 (0.0%) | 0 (0.0%) |
| 18 to 24 Years | 3 (16.7%) | 1 (20.0%) |
| 25 to 34 Years | 8 (10.7%) | 12 (15.2%) |
| 35 to 44 Years | 0 (0.0%) | 0 (0.0%) |
| 45 to 54 Years | 0 (0.0%) | 0 (0.0%) |
| 55 to 64 Years | 1 (2.0%) | 0 (0.0%) |
| 65 to 74 Years | 7 (13.5%) | 15 (46.9%) |
| 75 Years and over | 0 (0.0%) | 4 (7.3%) |
| Total | 37 (7.8%) | 32 (6.8%) |
Income Above Poverty by Sex and Age in Troy
According to the poverty statistics in Troy, males aged 12 to 14 years and females aged under 5 years are the age groups that are most secure financially, with 100.0% of males and 100.0% of females in these age groups living above the poverty line.
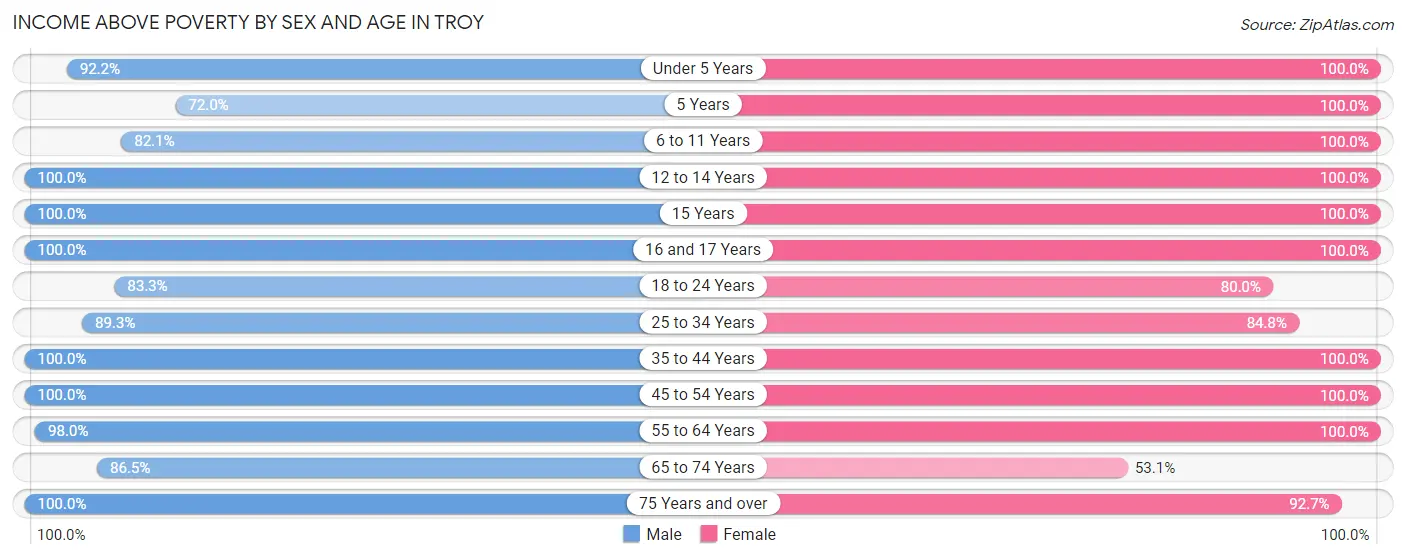
| Age Bracket | Male | Female |
| Under 5 Years | 47 (92.2%) | 67 (100.0%) |
| 5 Years | 18 (72.0%) | 2 (100.0%) |
| 6 to 11 Years | 32 (82.1%) | 18 (100.0%) |
| 12 to 14 Years | 30 (100.0%) | 3 (100.0%) |
| 15 Years | 3 (100.0%) | 14 (100.0%) |
| 16 and 17 Years | 5 (100.0%) | 11 (100.0%) |
| 18 to 24 Years | 15 (83.3%) | 4 (80.0%) |
| 25 to 34 Years | 67 (89.3%) | 67 (84.8%) |
| 35 to 44 Years | 46 (100.0%) | 38 (100.0%) |
| 45 to 54 Years | 68 (100.0%) | 83 (100.0%) |
| 55 to 64 Years | 50 (98.0%) | 64 (100.0%) |
| 65 to 74 Years | 45 (86.5%) | 17 (53.1%) |
| 75 Years and over | 11 (100.0%) | 51 (92.7%) |
| Total | 437 (92.2%) | 439 (93.2%) |
Income Below Poverty Among Married-Couple Families in Troy
The poverty statistics for married-couple families in Troy show that 4.5% or 10 of the total 221 families live below the poverty line. Families with no children have the highest poverty rate of 6.2%, comprising of 7 families. On the other hand, families with 3 or 4 children have the lowest poverty rate of 0.0%, which includes 0 families.
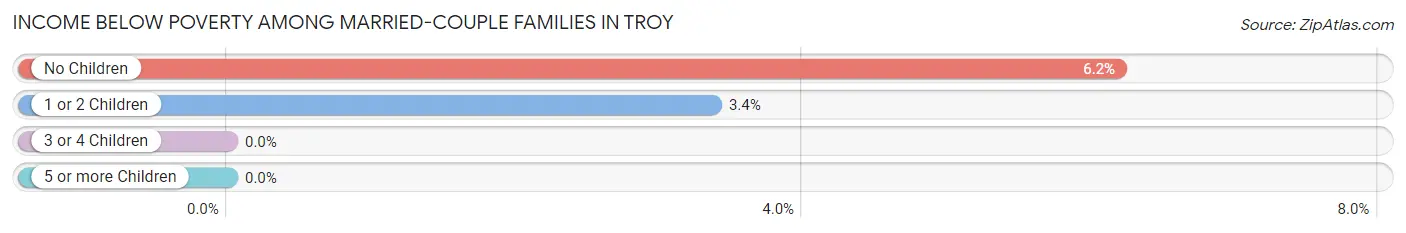
| Children | Above Poverty | Below Poverty |
| No Children | 106 (93.8%) | 7 (6.2%) |
| 1 or 2 Children | 86 (96.6%) | 3 (3.4%) |
| 3 or 4 Children | 19 (100.0%) | 0 (0.0%) |
| 5 or more Children | 0 (0.0%) | 0 (0.0%) |
| Total | 211 (95.5%) | 10 (4.5%) |
Income Below Poverty Among Single-Parent Households in Troy
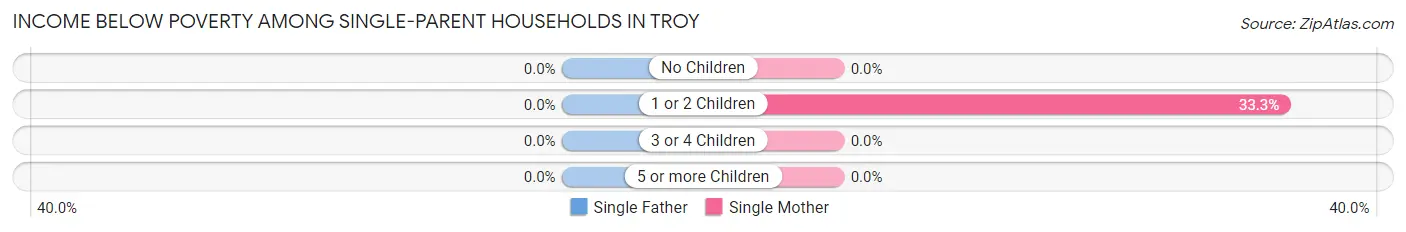
| Children | Single Father | Single Mother |
| No Children | 0 (0.0%) | 0 (0.0%) |
| 1 or 2 Children | 0 (0.0%) | 7 (33.3%) |
| 3 or 4 Children | 0 (0.0%) | 0 (0.0%) |
| 5 or more Children | 0 (0.0%) | 0 (0.0%) |
| Total | 0 (0.0%) | 7 (25.9%) |
Income Below Poverty Among Married-Couple vs Single-Parent Households in Troy
The poverty data for Troy shows that 10 of the married-couple family households (4.5%) and 7 of the single-parent households (21.9%) are living below the poverty level. Within the married-couple family households, those with no children have the highest poverty rate, with 7 households (6.2%) falling below the poverty line. Among the single-parent households, those with 1 or 2 children have the highest poverty rate, with 7 household (28.0%) living below poverty.
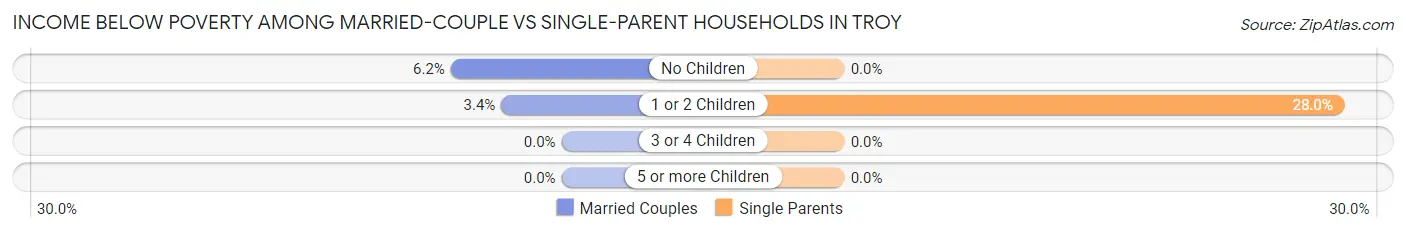
| Children | Married-Couple Families | Single-Parent Households |
| No Children | 7 (6.2%) | 0 (0.0%) |
| 1 or 2 Children | 3 (3.4%) | 7 (28.0%) |
| 3 or 4 Children | 0 (0.0%) | 0 (0.0%) |
| 5 or more Children | 0 (0.0%) | 0 (0.0%) |
| Total | 10 (4.5%) | 7 (21.9%) |
Employment Characteristics in Troy
Employment by Class of Employer in Troy
Among the 433 employed individuals in Troy, private company employees (203 | 46.9%), local government employees (91 | 21.0%), and state government employees (83 | 19.2%) make up the most common classes of employment.
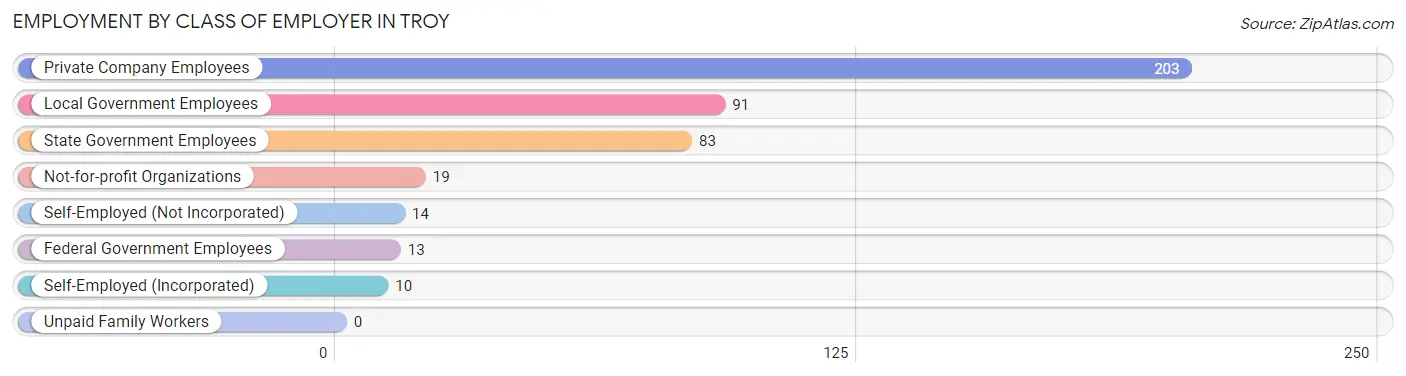
| Employer Class | # Employees | % Employees |
| Private Company Employees | 203 | 46.9% |
| Self-Employed (Incorporated) | 10 | 2.3% |
| Self-Employed (Not Incorporated) | 14 | 3.2% |
| Not-for-profit Organizations | 19 | 4.4% |
| Local Government Employees | 91 | 21.0% |
| State Government Employees | 83 | 19.2% |
| Federal Government Employees | 13 | 3.0% |
| Unpaid Family Workers | 0 | 0.0% |
| Total | 433 | 100.0% |
Employment Status by Age in Troy
According to the labor force statistics for Troy, out of the total population over 16 years of age (693), 68.4% or 474 individuals are in the labor force, with 4.9% or 23 of them unemployed. The age group with the highest labor force participation rate is 20 to 24 years, with 90.9% or 10 individuals in the labor force. Within the labor force, the 20 to 24 years age range has the highest percentage of unemployed individuals, with 60.0% or 6 of them being unemployed.
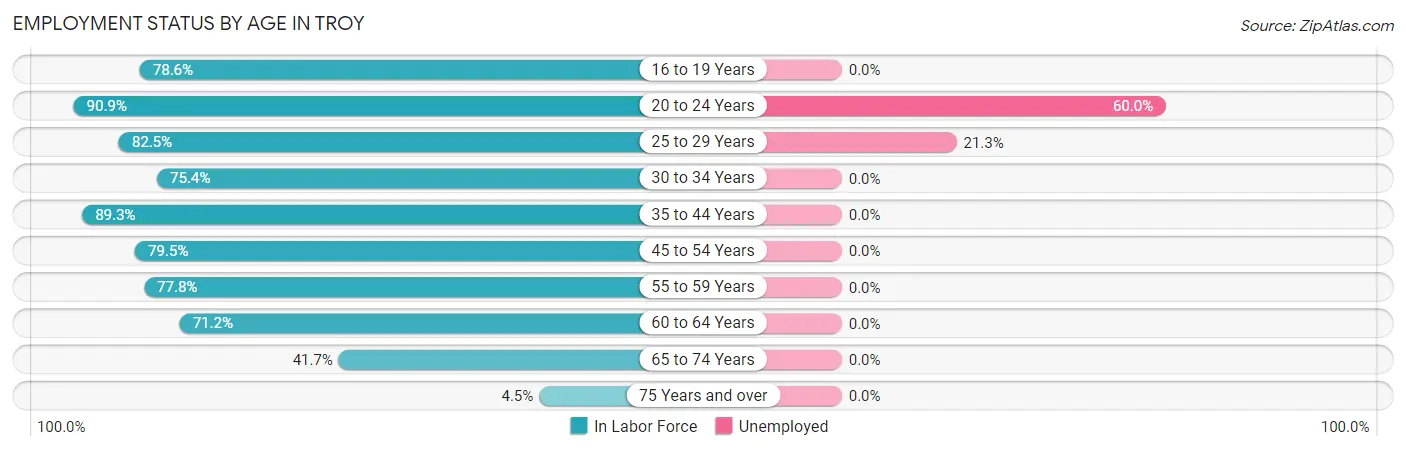
| Age Bracket | In Labor Force | Unemployed |
| 16 to 19 Years | 22 (78.6%) | 0 (0.0%) |
| 20 to 24 Years | 10 (90.9%) | 6 (60.0%) |
| 25 to 29 Years | 80 (82.5%) | 17 (21.3%) |
| 30 to 34 Years | 43 (75.4%) | 0 (0.0%) |
| 35 to 44 Years | 75 (89.3%) | 0 (0.0%) |
| 45 to 54 Years | 120 (79.5%) | 0 (0.0%) |
| 55 to 59 Years | 49 (77.8%) | 0 (0.0%) |
| 60 to 64 Years | 37 (71.2%) | 0 (0.0%) |
| 65 to 74 Years | 35 (41.7%) | 0 (0.0%) |
| 75 Years and over | 3 (4.5%) | 0 (0.0%) |
| Total | 474 (68.4%) | 23 (4.9%) |
Employment Status by Educational Attainment in Troy
According to labor force statistics for Troy, 80.2% of individuals (404) out of the total population between 25 and 64 years of age (504) are in the labor force, with 4.2% or 17 of them being unemployed. The group with the highest labor force participation rate are those with the educational attainment of less than high school, with 100.0% or 15 individuals in the labor force. Within the labor force, individuals with less than high school education have the highest percentage of unemployment, with 13.3% or 2 of them being unemployed.
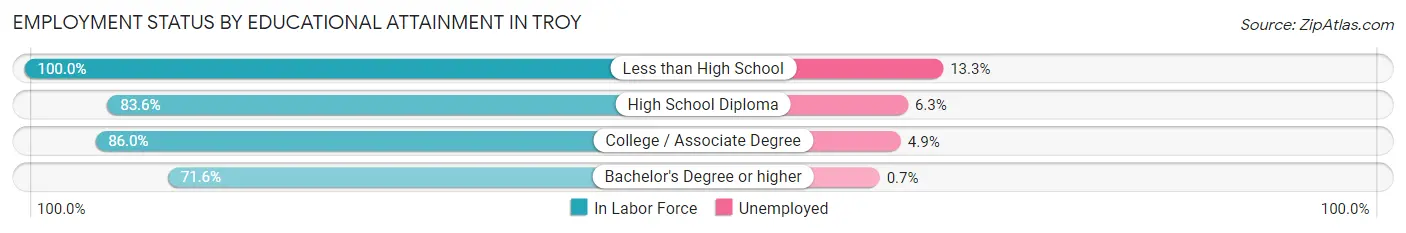
| Educational Attainment | In Labor Force | Unemployed |
| Less than High School | 15 (100.0%) | 2 (13.3%) |
| High School Diploma | 127 (83.6%) | 10 (6.3%) |
| College / Associate Degree | 123 (86.0%) | 7 (4.9%) |
| Bachelor's Degree or higher | 139 (71.6%) | 1 (0.7%) |
| Total | 404 (80.2%) | 21 (4.2%) |
Employment Occupations by Sex in Troy
Management, Business, Science and Arts Occupations
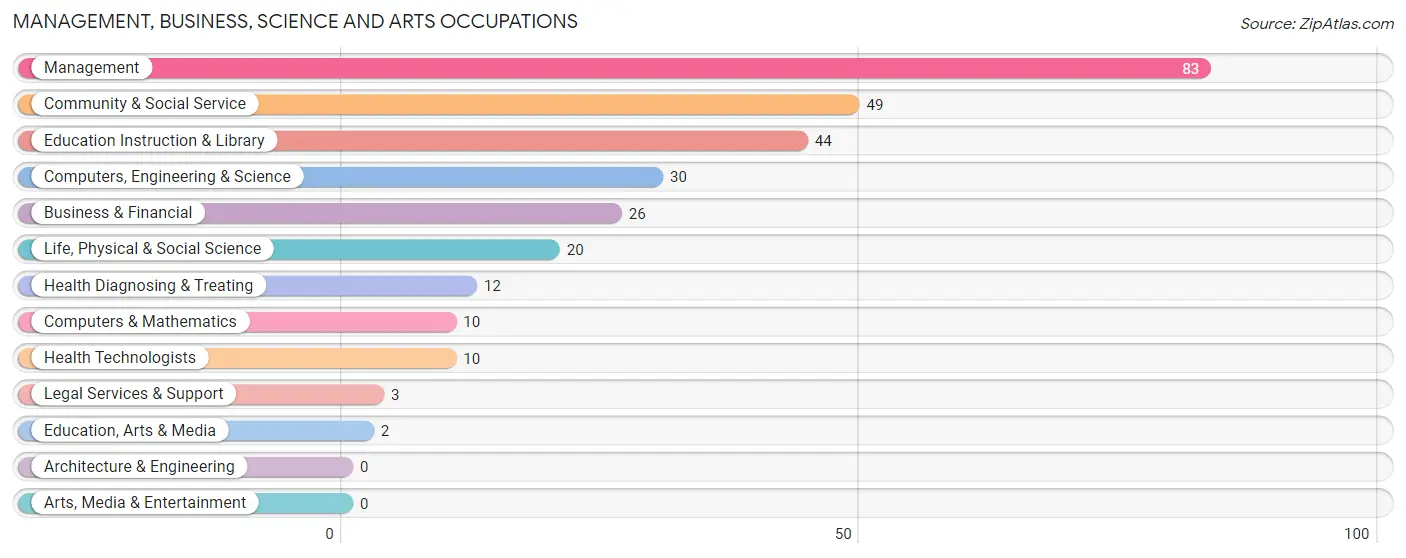
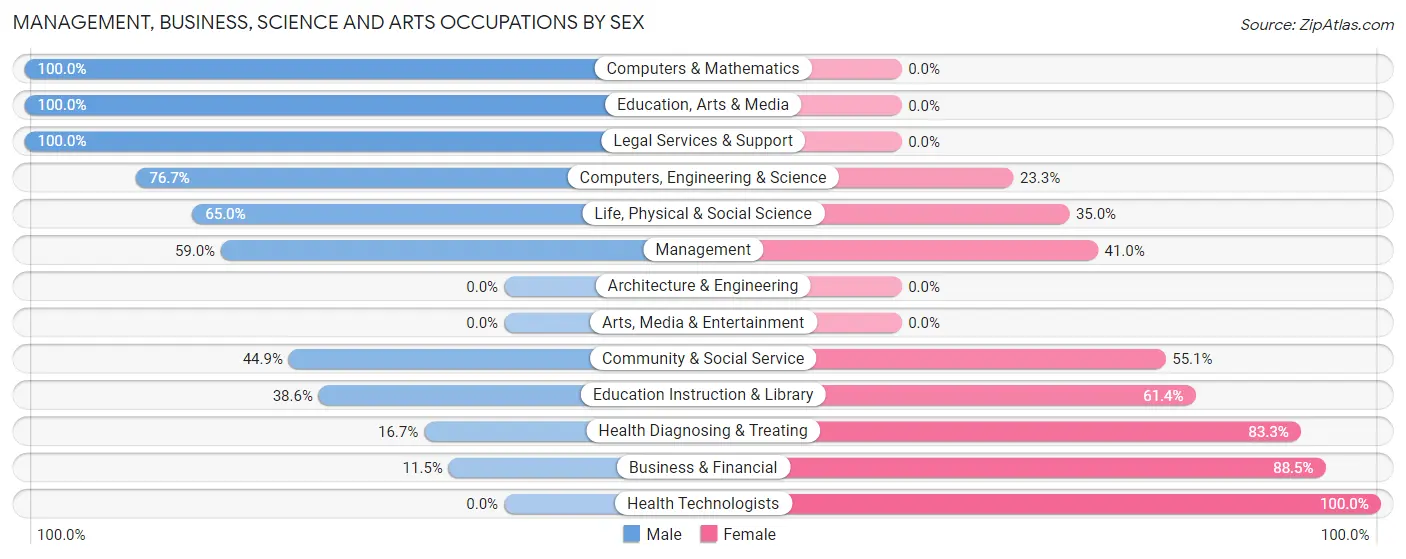
The most common Management, Business, Science and Arts occupations in Troy are Management (83 | 18.4%), Community & Social Service (49 | 10.9%), Education Instruction & Library (44 | 9.8%), Computers, Engineering & Science (30 | 6.7%), and Business & Financial (26 | 5.8%).
Management, Business, Science and Arts Occupations by Sex
Within the Management, Business, Science and Arts occupations in Troy, the most male-oriented occupations are Computers & Mathematics (100.0%), Education, Arts & Media (100.0%), and Legal Services & Support (100.0%), while the most female-oriented occupations are Health Technologists (100.0%), Business & Financial (88.5%), and Health Diagnosing & Treating (83.3%).
| Occupation | Male | Female |
| Management | 49 (59.0%) | 34 (41.0%) |
| Business & Financial | 3 (11.5%) | 23 (88.5%) |
| Computers, Engineering & Science | 23 (76.7%) | 7 (23.3%) |
| Computers & Mathematics | 10 (100.0%) | 0 (0.0%) |
| Architecture & Engineering | 0 (0.0%) | 0 (0.0%) |
| Life, Physical & Social Science | 13 (65.0%) | 7 (35.0%) |
| Community & Social Service | 22 (44.9%) | 27 (55.1%) |
| Education, Arts & Media | 2 (100.0%) | 0 (0.0%) |
| Legal Services & Support | 3 (100.0%) | 0 (0.0%) |
| Education Instruction & Library | 17 (38.6%) | 27 (61.4%) |
| Arts, Media & Entertainment | 0 (0.0%) | 0 (0.0%) |
| Health Diagnosing & Treating | 2 (16.7%) | 10 (83.3%) |
| Health Technologists | 0 (0.0%) | 10 (100.0%) |
| Total (Category) | 99 (49.5%) | 101 (50.5%) |
| Total (Overall) | 264 (58.5%) | 187 (41.5%) |
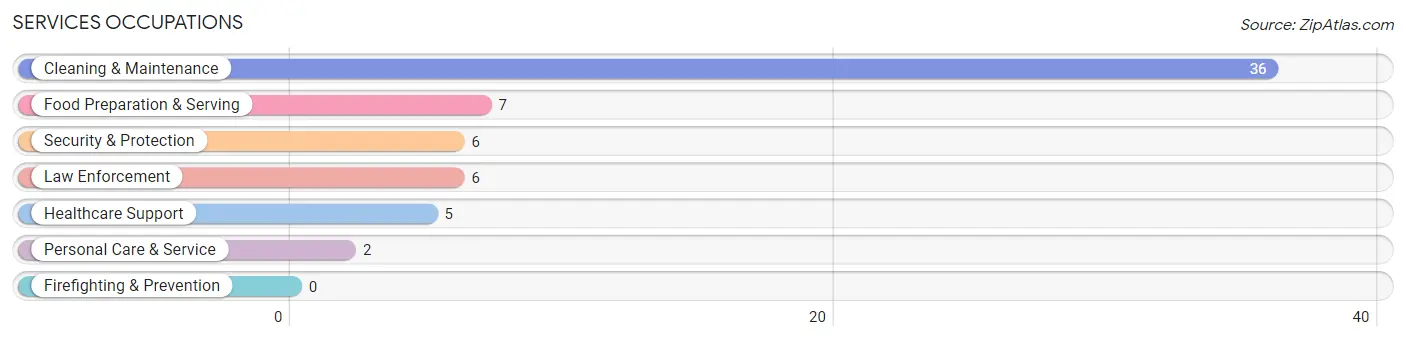
Services Occupations
The most common Services occupations in Troy are Cleaning & Maintenance (36 | 8.0%), Food Preparation & Serving (7 | 1.5%), Security & Protection (6 | 1.3%), Law Enforcement (6 | 1.3%), and Healthcare Support (5 | 1.1%).
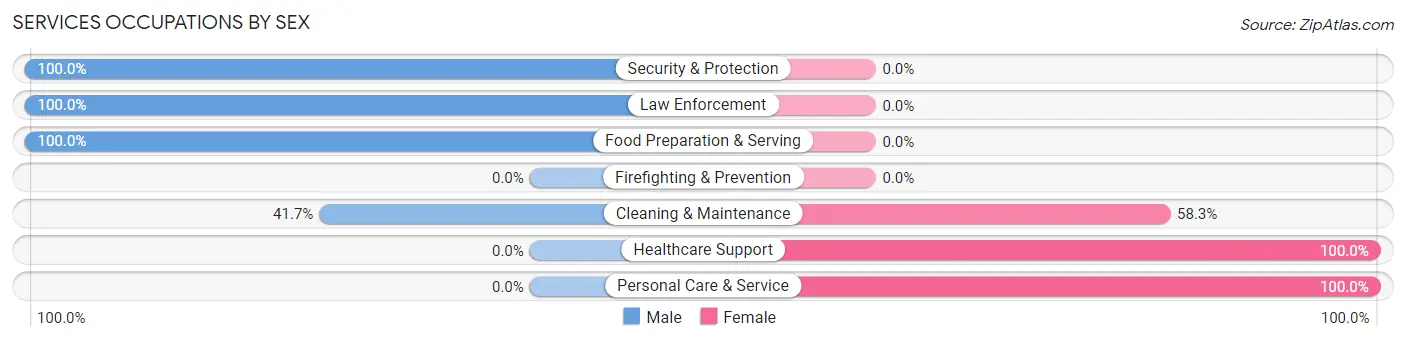
Services Occupations by Sex
Within the Services occupations in Troy, the most male-oriented occupations are Security & Protection (100.0%), Law Enforcement (100.0%), and Food Preparation & Serving (100.0%), while the most female-oriented occupations are Healthcare Support (100.0%), Personal Care & Service (100.0%), and Cleaning & Maintenance (58.3%).
| Occupation | Male | Female |
| Healthcare Support | 0 (0.0%) | 5 (100.0%) |
| Security & Protection | 6 (100.0%) | 0 (0.0%) |
| Firefighting & Prevention | 0 (0.0%) | 0 (0.0%) |
| Law Enforcement | 6 (100.0%) | 0 (0.0%) |
| Food Preparation & Serving | 7 (100.0%) | 0 (0.0%) |
| Cleaning & Maintenance | 15 (41.7%) | 21 (58.3%) |
| Personal Care & Service | 0 (0.0%) | 2 (100.0%) |
| Total (Category) | 28 (50.0%) | 28 (50.0%) |
| Total (Overall) | 264 (58.5%) | 187 (41.5%) |
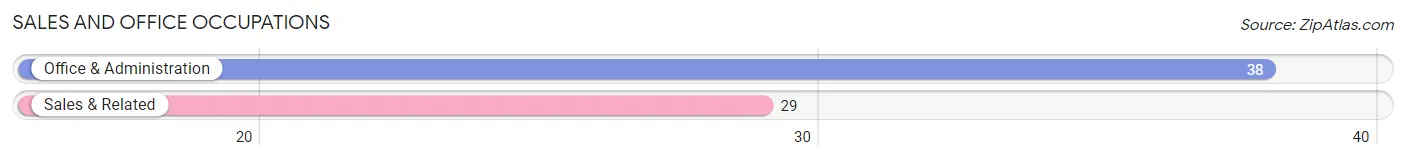
Sales and Office Occupations
The most common Sales and Office occupations in Troy are Office & Administration (38 | 8.4%), and Sales & Related (29 | 6.4%).
Sales and Office Occupations by Sex
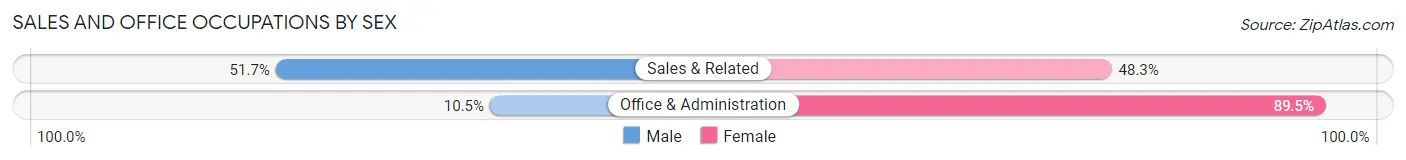
| Occupation | Male | Female |
| Sales & Related | 15 (51.7%) | 14 (48.3%) |
| Office & Administration | 4 (10.5%) | 34 (89.5%) |
| Total (Category) | 19 (28.4%) | 48 (71.6%) |
| Total (Overall) | 264 (58.5%) | 187 (41.5%) |
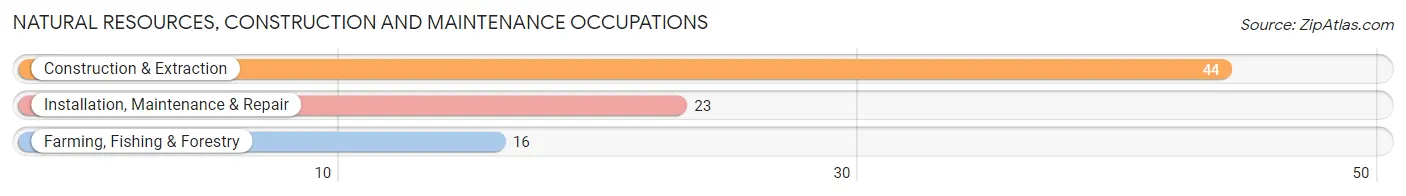
Natural Resources, Construction and Maintenance Occupations
The most common Natural Resources, Construction and Maintenance occupations in Troy are Construction & Extraction (44 | 9.8%), Installation, Maintenance & Repair (23 | 5.1%), and Farming, Fishing & Forestry (16 | 3.5%).
Natural Resources, Construction and Maintenance Occupations by Sex
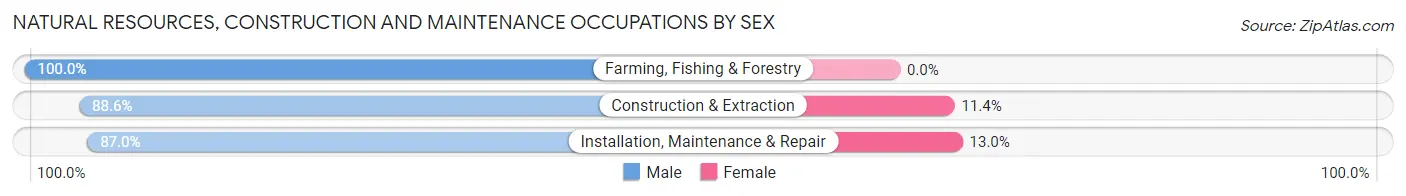
| Occupation | Male | Female |
| Farming, Fishing & Forestry | 16 (100.0%) | 0 (0.0%) |
| Construction & Extraction | 39 (88.6%) | 5 (11.4%) |
| Installation, Maintenance & Repair | 20 (87.0%) | 3 (13.0%) |
| Total (Category) | 75 (90.4%) | 8 (9.6%) |
| Total (Overall) | 264 (58.5%) | 187 (41.5%) |
Production, Transportation and Moving Occupations
The most common Production, Transportation and Moving occupations in Troy are Production (39 | 8.6%), and Transportation (6 | 1.3%).
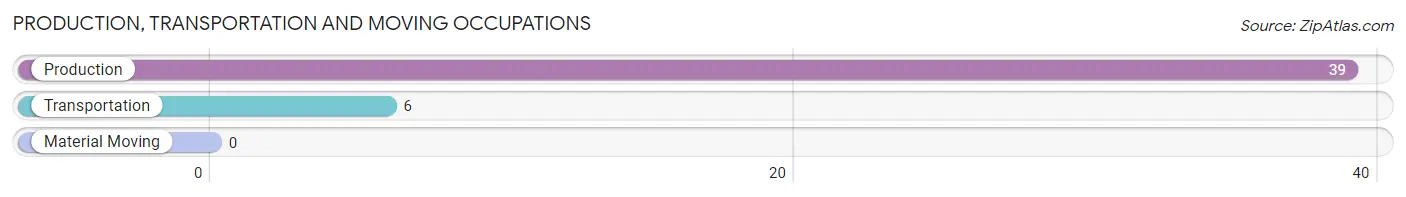
Production, Transportation and Moving Occupations by Sex
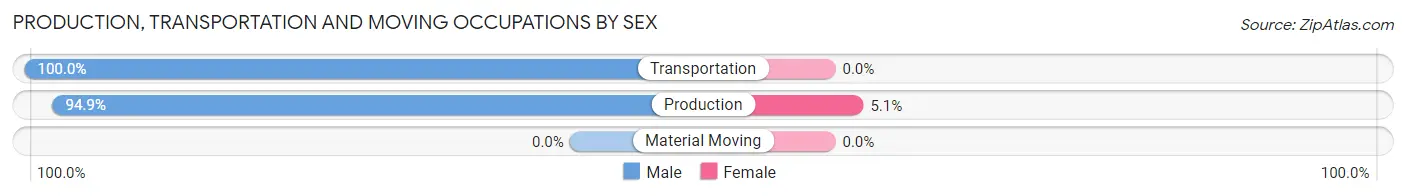
| Occupation | Male | Female |
| Production | 37 (94.9%) | 2 (5.1%) |
| Transportation | 6 (100.0%) | 0 (0.0%) |
| Material Moving | 0 (0.0%) | 0 (0.0%) |
| Total (Category) | 43 (95.6%) | 2 (4.4%) |
| Total (Overall) | 264 (58.5%) | 187 (41.5%) |
Employment Industries by Sex in Troy
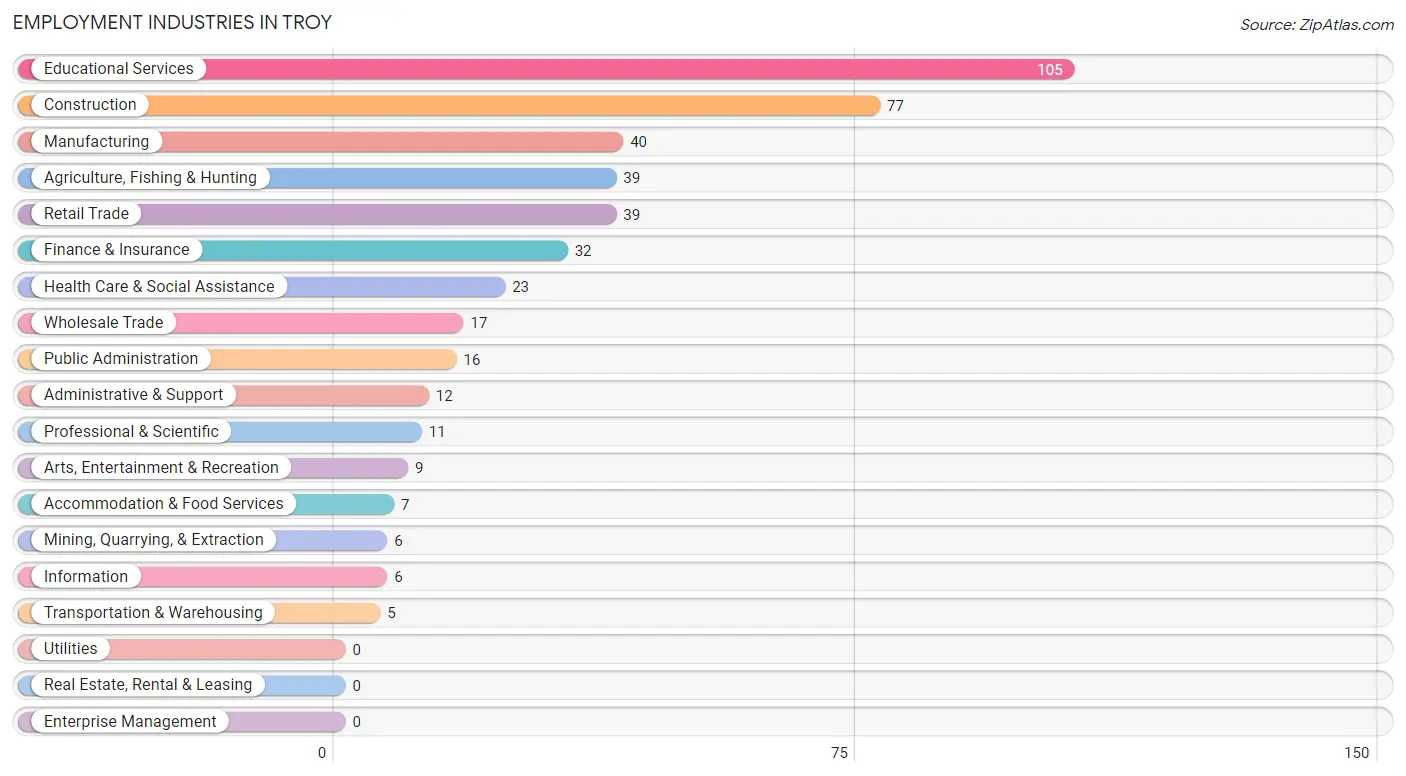
Employment Industries in Troy
The major employment industries in Troy include Educational Services (105 | 23.3%), Construction (77 | 17.1%), Manufacturing (40 | 8.9%), Agriculture, Fishing & Hunting (39 | 8.6%), and Retail Trade (39 | 8.6%).
Employment Industries by Sex in Troy
The Troy industries that see more men than women are Mining, Quarrying, & Extraction (100.0%), Professional & Scientific (100.0%), and Administrative & Support (100.0%), whereas the industries that tend to have a higher number of women are Wholesale Trade (100.0%), Finance & Insurance (100.0%), and Arts, Entertainment & Recreation (100.0%).
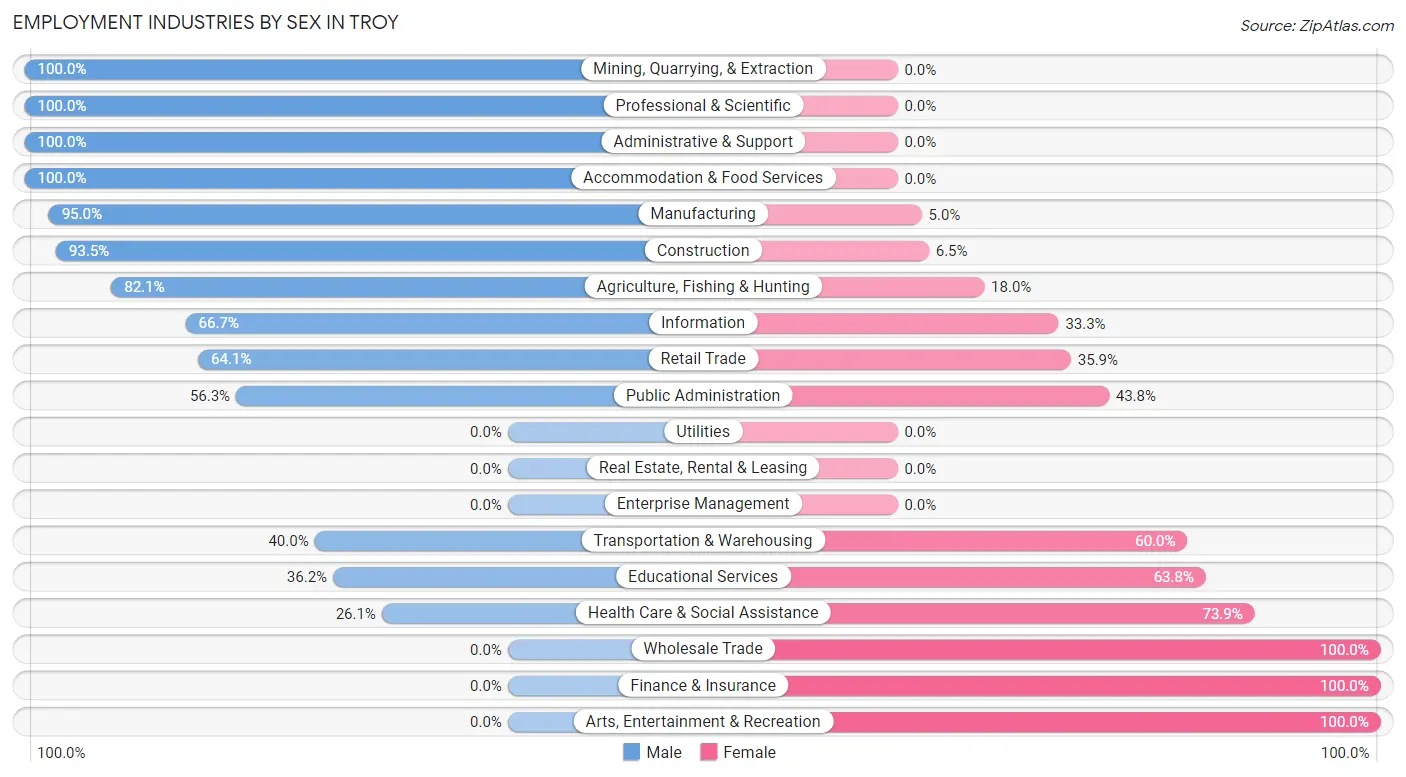
| Industry | Male | Female |
| Agriculture, Fishing & Hunting | 32 (82.1%) | 7 (17.9%) |
| Mining, Quarrying, & Extraction | 6 (100.0%) | 0 (0.0%) |
| Construction | 72 (93.5%) | 5 (6.5%) |
| Manufacturing | 38 (95.0%) | 2 (5.0%) |
| Wholesale Trade | 0 (0.0%) | 17 (100.0%) |
| Retail Trade | 25 (64.1%) | 14 (35.9%) |
| Transportation & Warehousing | 2 (40.0%) | 3 (60.0%) |
| Utilities | 0 (0.0%) | 0 (0.0%) |
| Information | 4 (66.7%) | 2 (33.3%) |
| Finance & Insurance | 0 (0.0%) | 32 (100.0%) |
| Real Estate, Rental & Leasing | 0 (0.0%) | 0 (0.0%) |
| Professional & Scientific | 11 (100.0%) | 0 (0.0%) |
| Enterprise Management | 0 (0.0%) | 0 (0.0%) |
| Administrative & Support | 12 (100.0%) | 0 (0.0%) |
| Educational Services | 38 (36.2%) | 67 (63.8%) |
| Health Care & Social Assistance | 6 (26.1%) | 17 (73.9%) |
| Arts, Entertainment & Recreation | 0 (0.0%) | 9 (100.0%) |
| Accommodation & Food Services | 7 (100.0%) | 0 (0.0%) |
| Public Administration | 9 (56.2%) | 7 (43.8%) |
| Total | 264 (58.5%) | 187 (41.5%) |
Education in Troy
School Enrollment in Troy
The most common levels of schooling among the 175 students in Troy are middle school (58 | 33.1%), elementary school (40 | 22.9%), and high school (29 | 16.6%).
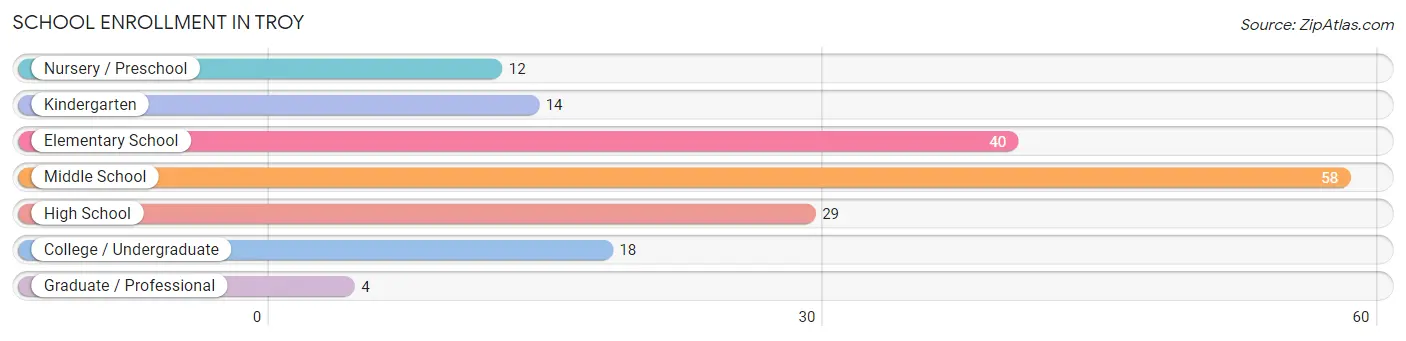
| School Level | # Students | % Students |
| Nursery / Preschool | 12 | 6.9% |
| Kindergarten | 14 | 8.0% |
| Elementary School | 40 | 22.9% |
| Middle School | 58 | 33.1% |
| High School | 29 | 16.6% |
| College / Undergraduate | 18 | 10.3% |
| Graduate / Professional | 4 | 2.3% |
| Total | 175 | 100.0% |
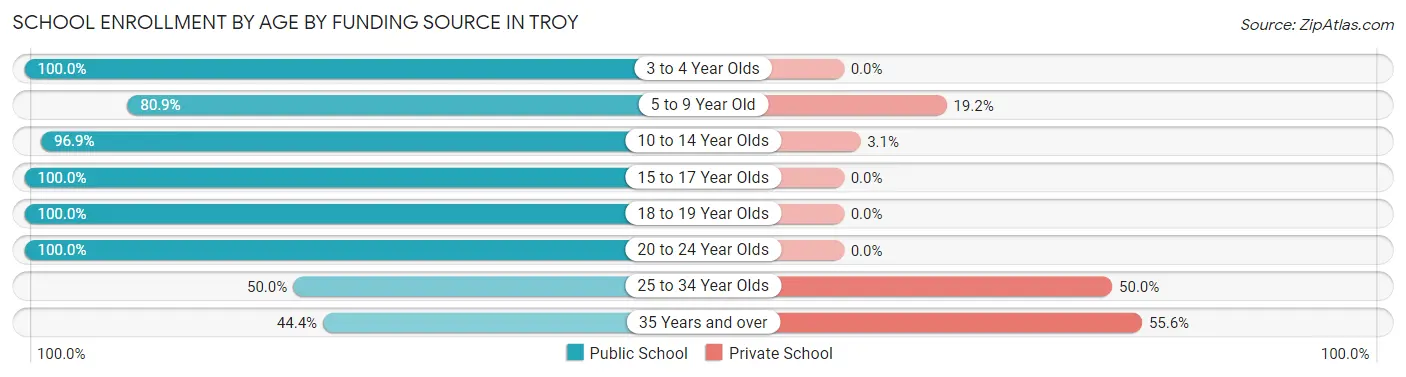
School Enrollment by Age by Funding Source in Troy
Out of a total of 175 students who are enrolled in schools in Troy, 18 (10.3%) attend a private institution, while the remaining 157 (89.7%) are enrolled in public schools. The age group of 35 years and over has the highest likelihood of being enrolled in private schools, with 5 (55.6% in the age bracket) enrolled. Conversely, the age group of 3 to 4 year olds has the lowest likelihood of being enrolled in a private school, with 1 (100.0% in the age bracket) attending a public institution.
| Age Bracket | Public School | Private School |
| 3 to 4 Year Olds | 1 (100.0%) | 0 (0.0%) |
| 5 to 9 Year Old | 38 (80.8%) | 9 (19.2%) |
| 10 to 14 Year Olds | 63 (96.9%) | 2 (3.1%) |
| 15 to 17 Year Olds | 33 (100.0%) | 0 (0.0%) |
| 18 to 19 Year Olds | 12 (100.0%) | 0 (0.0%) |
| 20 to 24 Year Olds | 4 (100.0%) | 0 (0.0%) |
| 25 to 34 Year Olds | 2 (50.0%) | 2 (50.0%) |
| 35 Years and over | 4 (44.4%) | 5 (55.6%) |
| Total | 157 (89.7%) | 18 (10.3%) |
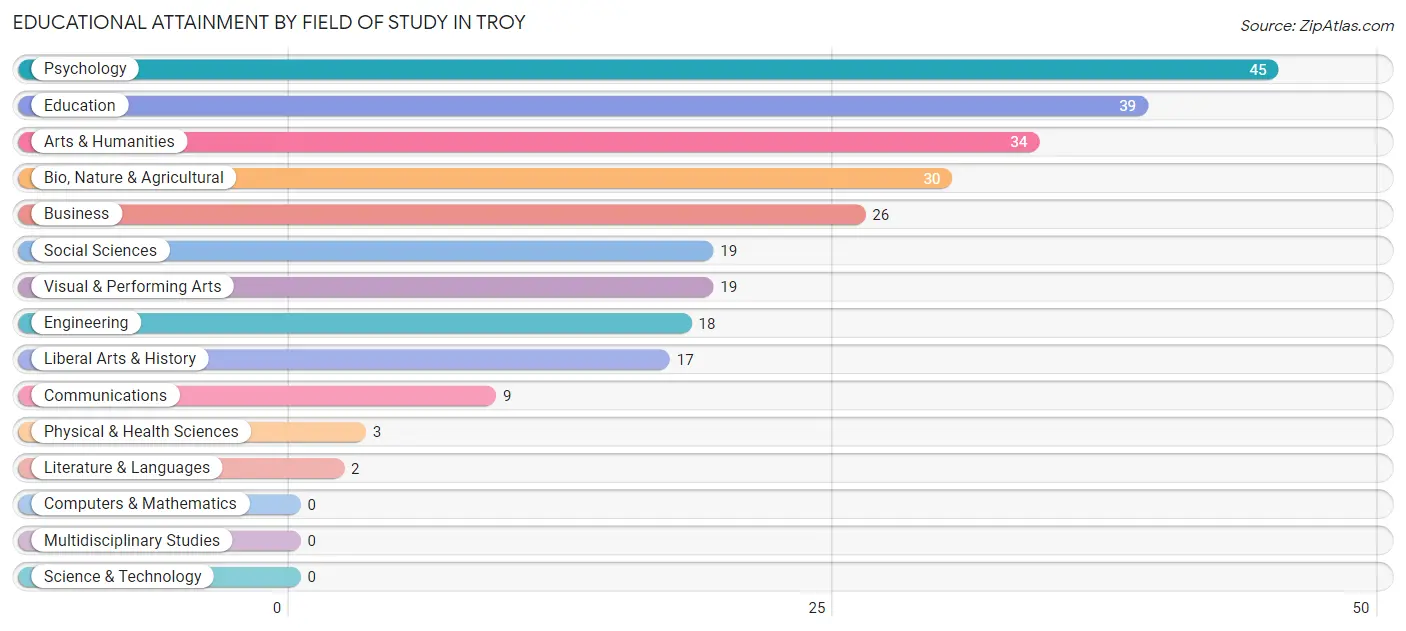
Educational Attainment by Field of Study in Troy
Psychology (45 | 17.2%), education (39 | 14.9%), arts & humanities (34 | 13.0%), bio, nature & agricultural (30 | 11.5%), and business (26 | 10.0%) are the most common fields of study among 261 individuals in Troy who have obtained a bachelor's degree or higher.
| Field of Study | # Graduates | % Graduates |
| Computers & Mathematics | 0 | 0.0% |
| Bio, Nature & Agricultural | 30 | 11.5% |
| Physical & Health Sciences | 3 | 1.1% |
| Psychology | 45 | 17.2% |
| Social Sciences | 19 | 7.3% |
| Engineering | 18 | 6.9% |
| Multidisciplinary Studies | 0 | 0.0% |
| Science & Technology | 0 | 0.0% |
| Business | 26 | 10.0% |
| Education | 39 | 14.9% |
| Literature & Languages | 2 | 0.8% |
| Liberal Arts & History | 17 | 6.5% |
| Visual & Performing Arts | 19 | 7.3% |
| Communications | 9 | 3.5% |
| Arts & Humanities | 34 | 13.0% |
| Total | 261 | 100.0% |
Transportation & Commute in Troy
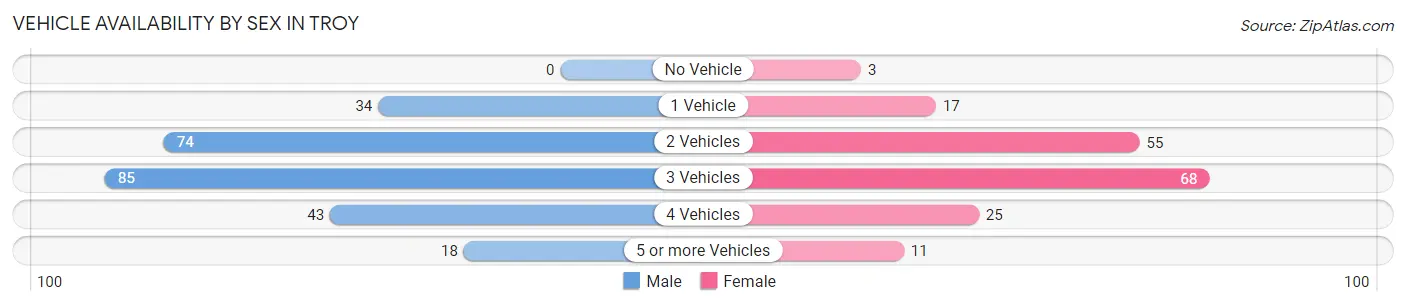
Vehicle Availability by Sex in Troy
The most prevalent vehicle ownership categories in Troy are males with 3 vehicles (85, accounting for 33.5%) and females with 3 vehicles (68, making up 47.5%).
| Vehicles Available | Male | Female |
| No Vehicle | 0 (0.0%) | 3 (1.7%) |
| 1 Vehicle | 34 (13.4%) | 17 (9.5%) |
| 2 Vehicles | 74 (29.1%) | 55 (30.7%) |
| 3 Vehicles | 85 (33.5%) | 68 (38.0%) |
| 4 Vehicles | 43 (16.9%) | 25 (14.0%) |
| 5 or more Vehicles | 18 (7.1%) | 11 (6.1%) |
| Total | 254 (100.0%) | 179 (100.0%) |
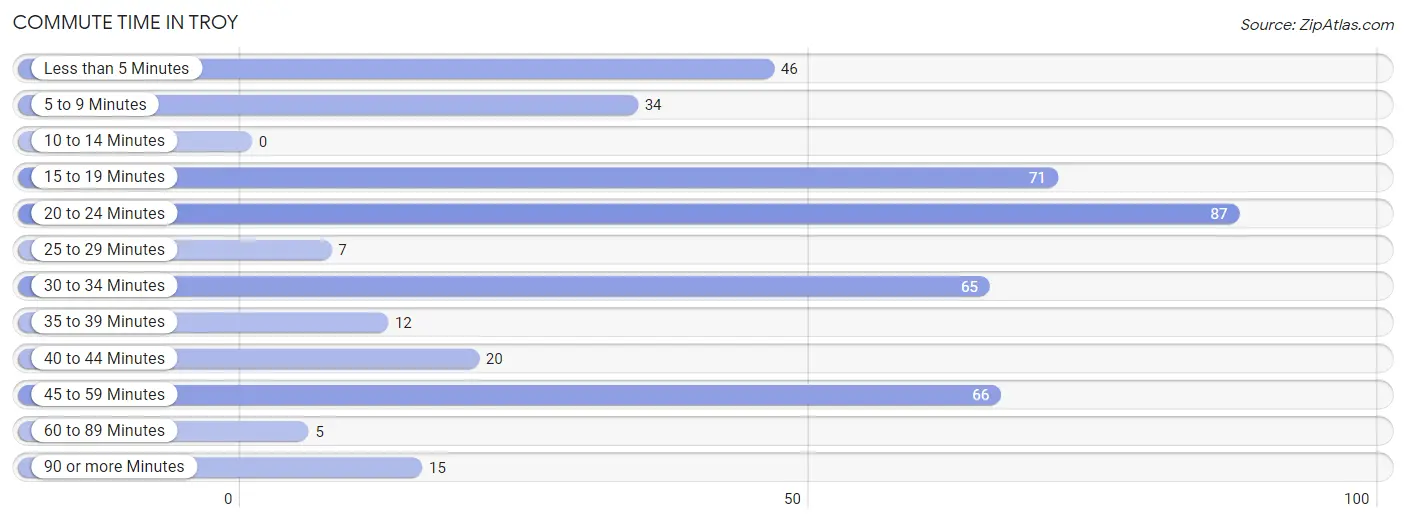
Commute Time in Troy
The most frequently occuring commute durations in Troy are 20 to 24 minutes (87 commuters, 20.3%), 15 to 19 minutes (71 commuters, 16.6%), and 45 to 59 minutes (66 commuters, 15.4%).
| Commute Time | # Commuters | % Commuters |
| Less than 5 Minutes | 46 | 10.7% |
| 5 to 9 Minutes | 34 | 7.9% |
| 10 to 14 Minutes | 0 | 0.0% |
| 15 to 19 Minutes | 71 | 16.6% |
| 20 to 24 Minutes | 87 | 20.3% |
| 25 to 29 Minutes | 7 | 1.6% |
| 30 to 34 Minutes | 65 | 15.2% |
| 35 to 39 Minutes | 12 | 2.8% |
| 40 to 44 Minutes | 20 | 4.7% |
| 45 to 59 Minutes | 66 | 15.4% |
| 60 to 89 Minutes | 5 | 1.2% |
| 90 or more Minutes | 15 | 3.5% |
Commute Time by Sex in Troy
The most common commute times in Troy are 30 to 34 minutes (55 commuters, 21.9%) for males and 20 to 24 minutes (50 commuters, 28.2%) for females.
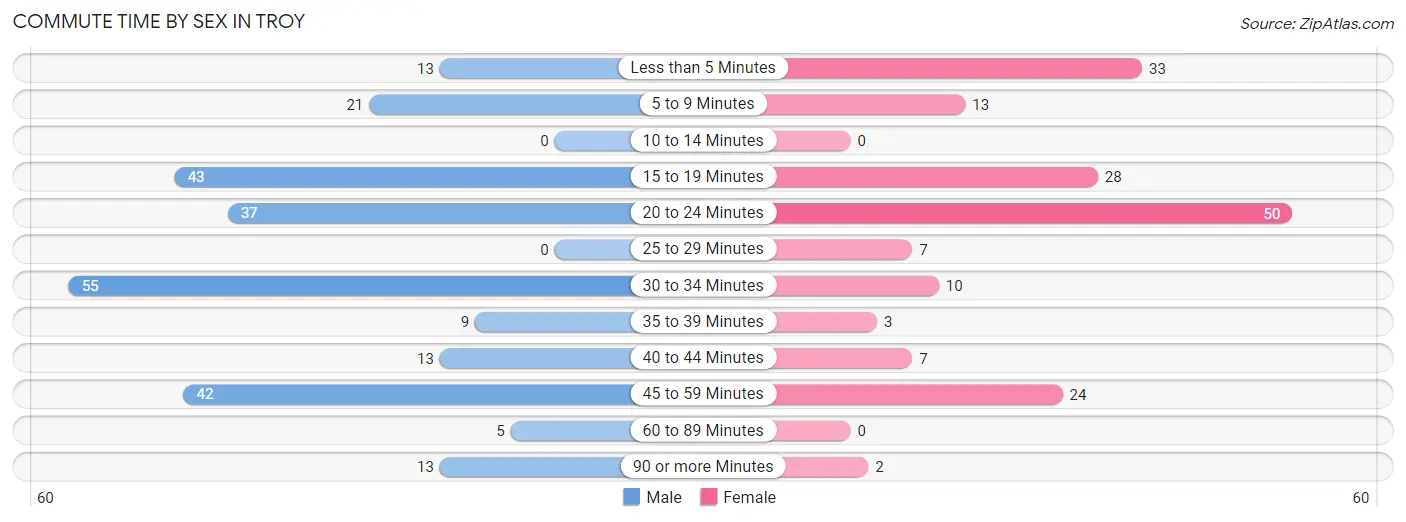
| Commute Time | Male | Female |
| Less than 5 Minutes | 13 (5.2%) | 33 (18.6%) |
| 5 to 9 Minutes | 21 (8.4%) | 13 (7.3%) |
| 10 to 14 Minutes | 0 (0.0%) | 0 (0.0%) |
| 15 to 19 Minutes | 43 (17.1%) | 28 (15.8%) |
| 20 to 24 Minutes | 37 (14.7%) | 50 (28.2%) |
| 25 to 29 Minutes | 0 (0.0%) | 7 (4.0%) |
| 30 to 34 Minutes | 55 (21.9%) | 10 (5.7%) |
| 35 to 39 Minutes | 9 (3.6%) | 3 (1.7%) |
| 40 to 44 Minutes | 13 (5.2%) | 7 (4.0%) |
| 45 to 59 Minutes | 42 (16.7%) | 24 (13.6%) |
| 60 to 89 Minutes | 5 (2.0%) | 0 (0.0%) |
| 90 or more Minutes | 13 (5.2%) | 2 (1.1%) |
Time of Departure to Work by Sex in Troy
The most frequent times of departure to work in Troy are 7:30 AM to 7:59 AM (53, 21.1%) for males and 7:30 AM to 7:59 AM (54, 30.5%) for females.
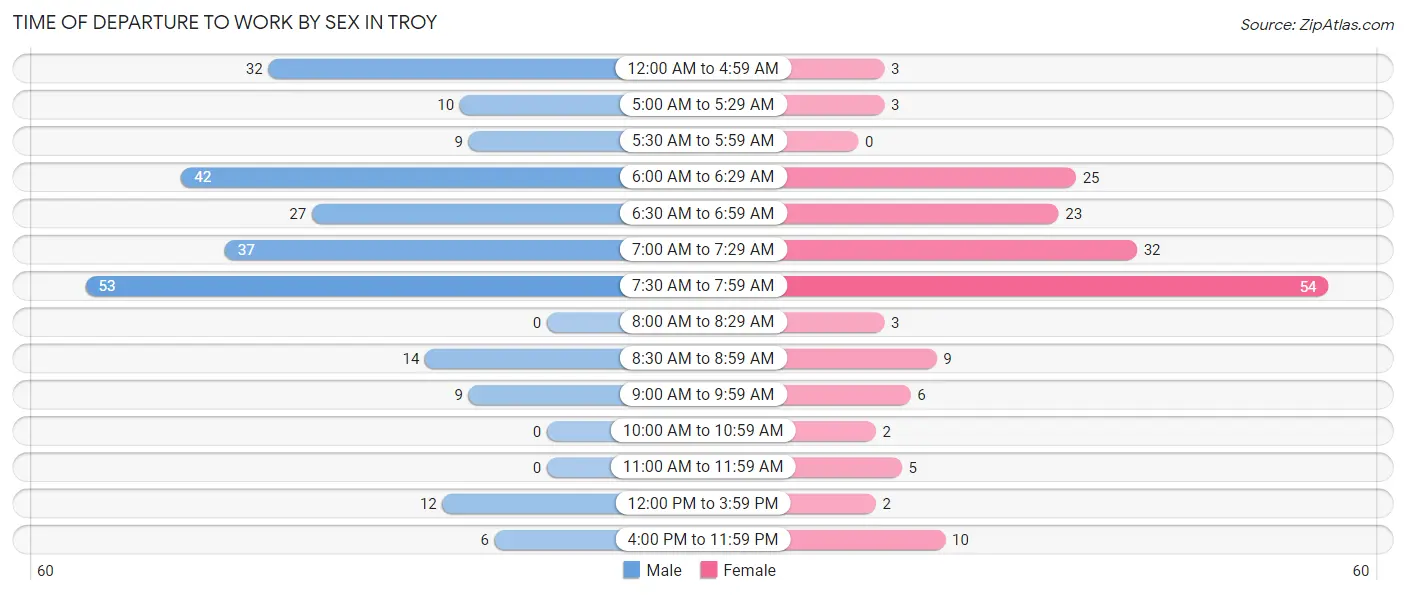
| Time of Departure | Male | Female |
| 12:00 AM to 4:59 AM | 32 (12.8%) | 3 (1.7%) |
| 5:00 AM to 5:29 AM | 10 (4.0%) | 3 (1.7%) |
| 5:30 AM to 5:59 AM | 9 (3.6%) | 0 (0.0%) |
| 6:00 AM to 6:29 AM | 42 (16.7%) | 25 (14.1%) |
| 6:30 AM to 6:59 AM | 27 (10.8%) | 23 (13.0%) |
| 7:00 AM to 7:29 AM | 37 (14.7%) | 32 (18.1%) |
| 7:30 AM to 7:59 AM | 53 (21.1%) | 54 (30.5%) |
| 8:00 AM to 8:29 AM | 0 (0.0%) | 3 (1.7%) |
| 8:30 AM to 8:59 AM | 14 (5.6%) | 9 (5.1%) |
| 9:00 AM to 9:59 AM | 9 (3.6%) | 6 (3.4%) |
| 10:00 AM to 10:59 AM | 0 (0.0%) | 2 (1.1%) |
| 11:00 AM to 11:59 AM | 0 (0.0%) | 5 (2.8%) |
| 12:00 PM to 3:59 PM | 12 (4.8%) | 2 (1.1%) |
| 4:00 PM to 11:59 PM | 6 (2.4%) | 10 (5.7%) |
| Total | 251 (100.0%) | 177 (100.0%) |
Housing Occupancy in Troy
Occupancy by Ownership in Troy
Of the total 386 dwellings in Troy, owner-occupied units account for 333 (86.3%), while renter-occupied units make up 53 (13.7%).
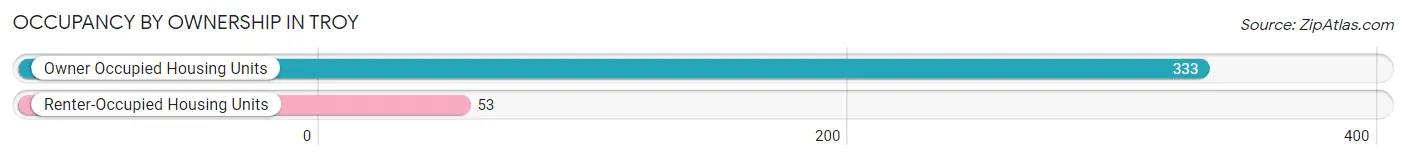
| Occupancy | # Housing Units | % Housing Units |
| Owner Occupied Housing Units | 333 | 86.3% |
| Renter-Occupied Housing Units | 53 | 13.7% |
| Total Occupied Housing Units | 386 | 100.0% |
Occupancy by Household Size in Troy
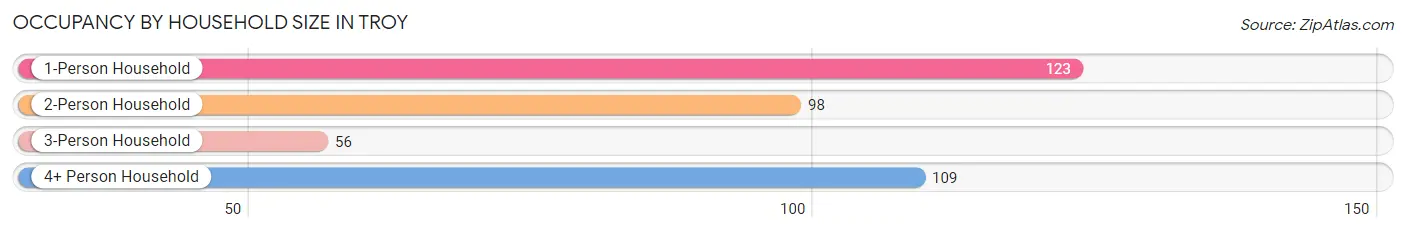
| Household Size | # Housing Units | % Housing Units |
| 1-Person Household | 123 | 31.9% |
| 2-Person Household | 98 | 25.4% |
| 3-Person Household | 56 | 14.5% |
| 4+ Person Household | 109 | 28.2% |
| Total Housing Units | 386 | 100.0% |
Occupancy by Ownership by Household Size in Troy
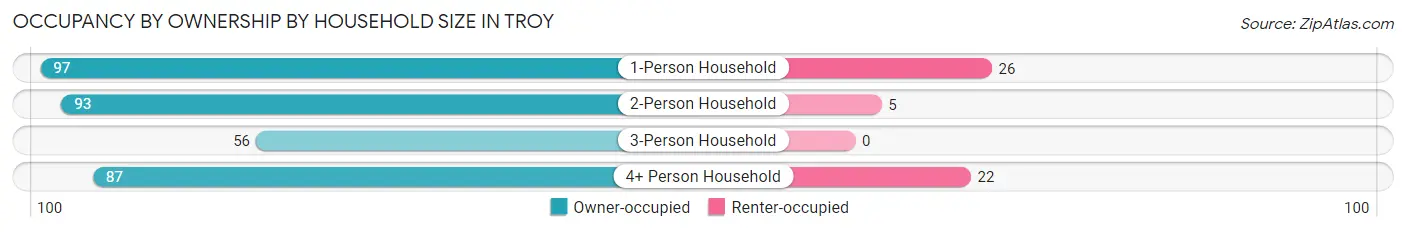
| Household Size | Owner-occupied | Renter-occupied |
| 1-Person Household | 97 (78.9%) | 26 (21.1%) |
| 2-Person Household | 93 (94.9%) | 5 (5.1%) |
| 3-Person Household | 56 (100.0%) | 0 (0.0%) |
| 4+ Person Household | 87 (79.8%) | 22 (20.2%) |
| Total Housing Units | 333 (86.3%) | 53 (13.7%) |
Occupancy by Educational Attainment in Troy
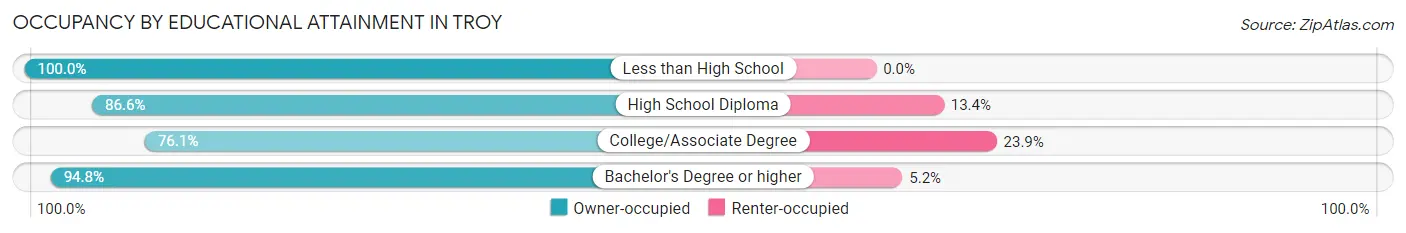
| Household Size | Owner-occupied | Renter-occupied |
| Less than High School | 1 (100.0%) | 0 (0.0%) |
| High School Diploma | 84 (86.6%) | 13 (13.4%) |
| College/Associate Degree | 102 (76.1%) | 32 (23.9%) |
| Bachelor's Degree or higher | 146 (94.8%) | 8 (5.2%) |
Occupancy by Age of Householder in Troy
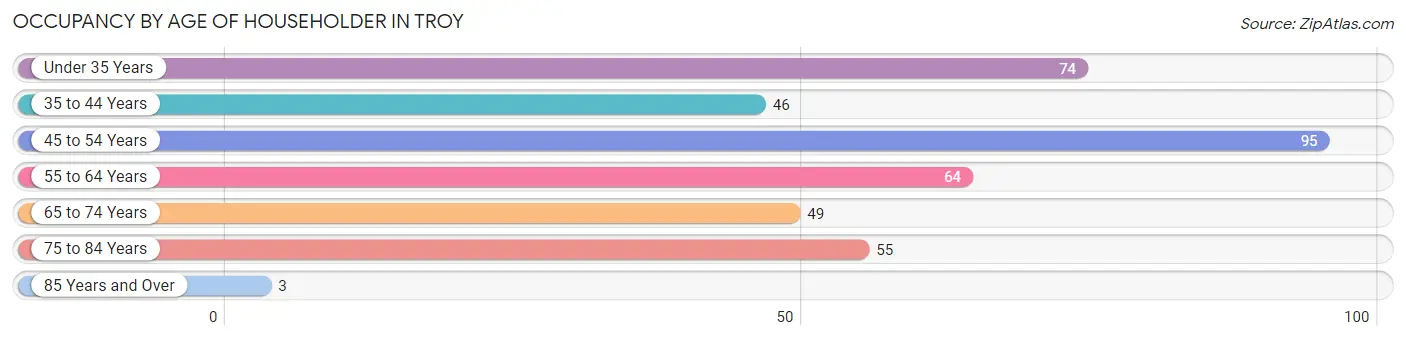
| Age Bracket | # Households | % Households |
| Under 35 Years | 74 | 19.2% |
| 35 to 44 Years | 46 | 11.9% |
| 45 to 54 Years | 95 | 24.6% |
| 55 to 64 Years | 64 | 16.6% |
| 65 to 74 Years | 49 | 12.7% |
| 75 to 84 Years | 55 | 14.2% |
| 85 Years and Over | 3 | 0.8% |
| Total | 386 | 100.0% |
Housing Finances in Troy
Median Income by Occupancy in Troy
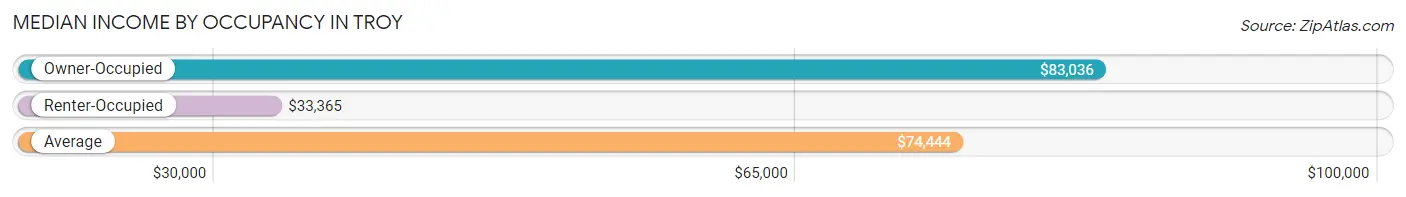
| Occupancy Type | # Households | Median Income |
| Owner-Occupied | 333 (86.3%) | $83,036 |
| Renter-Occupied | 53 (13.7%) | $33,365 |
| Average | 386 (100.0%) | $74,444 |
Occupancy by Householder Income Bracket in Troy
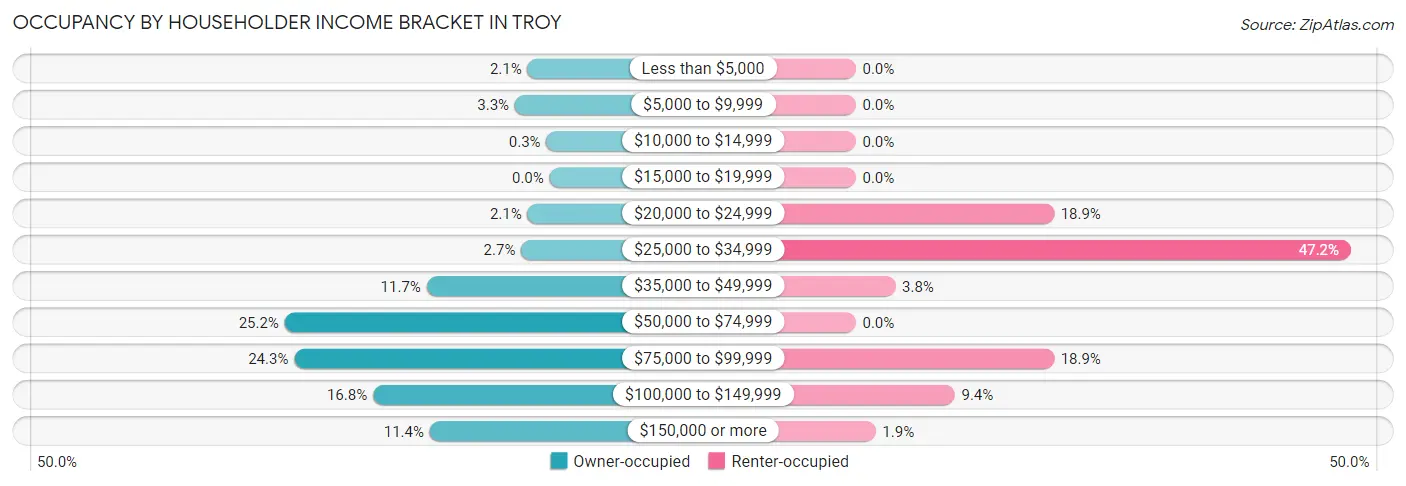
| Income Bracket | Owner-occupied | Renter-occupied |
| Less than $5,000 | 7 (2.1%) | 0 (0.0%) |
| $5,000 to $9,999 | 11 (3.3%) | 0 (0.0%) |
| $10,000 to $14,999 | 1 (0.3%) | 0 (0.0%) |
| $15,000 to $19,999 | 0 (0.0%) | 0 (0.0%) |
| $20,000 to $24,999 | 7 (2.1%) | 10 (18.9%) |
| $25,000 to $34,999 | 9 (2.7%) | 25 (47.2%) |
| $35,000 to $49,999 | 39 (11.7%) | 2 (3.8%) |
| $50,000 to $74,999 | 84 (25.2%) | 0 (0.0%) |
| $75,000 to $99,999 | 81 (24.3%) | 10 (18.9%) |
| $100,000 to $149,999 | 56 (16.8%) | 5 (9.4%) |
| $150,000 or more | 38 (11.4%) | 1 (1.9%) |
| Total | 333 (100.0%) | 53 (100.0%) |
Monthly Housing Cost Tiers in Troy
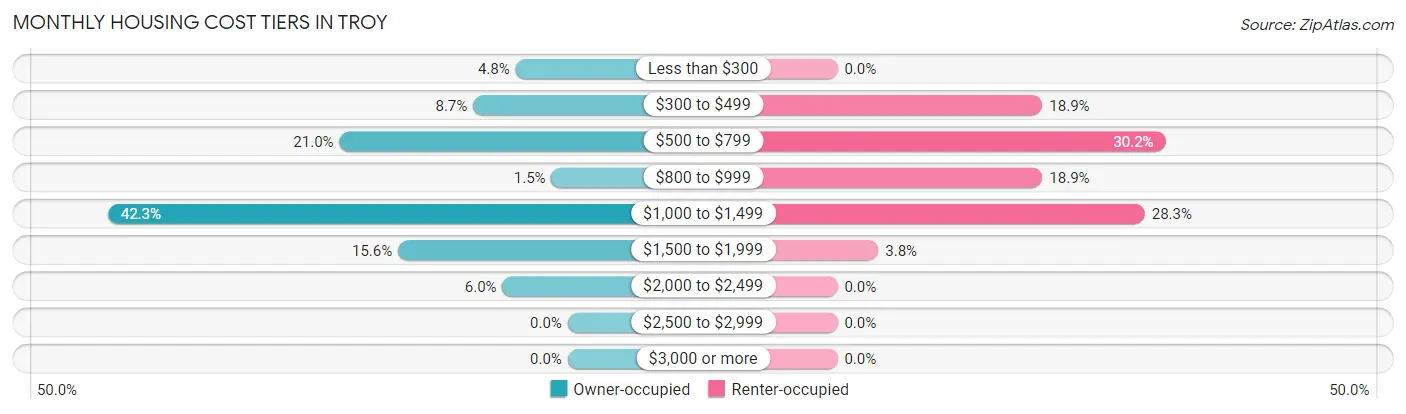
| Monthly Cost | Owner-occupied | Renter-occupied |
| Less than $300 | 16 (4.8%) | 0 (0.0%) |
| $300 to $499 | 29 (8.7%) | 10 (18.9%) |
| $500 to $799 | 70 (21.0%) | 16 (30.2%) |
| $800 to $999 | 5 (1.5%) | 10 (18.9%) |
| $1,000 to $1,499 | 141 (42.3%) | 15 (28.3%) |
| $1,500 to $1,999 | 52 (15.6%) | 2 (3.8%) |
| $2,000 to $2,499 | 20 (6.0%) | 0 (0.0%) |
| $2,500 to $2,999 | 0 (0.0%) | 0 (0.0%) |
| $3,000 or more | 0 (0.0%) | 0 (0.0%) |
| Total | 333 (100.0%) | 53 (100.0%) |
Physical Housing Characteristics in Troy
Housing Structures in Troy
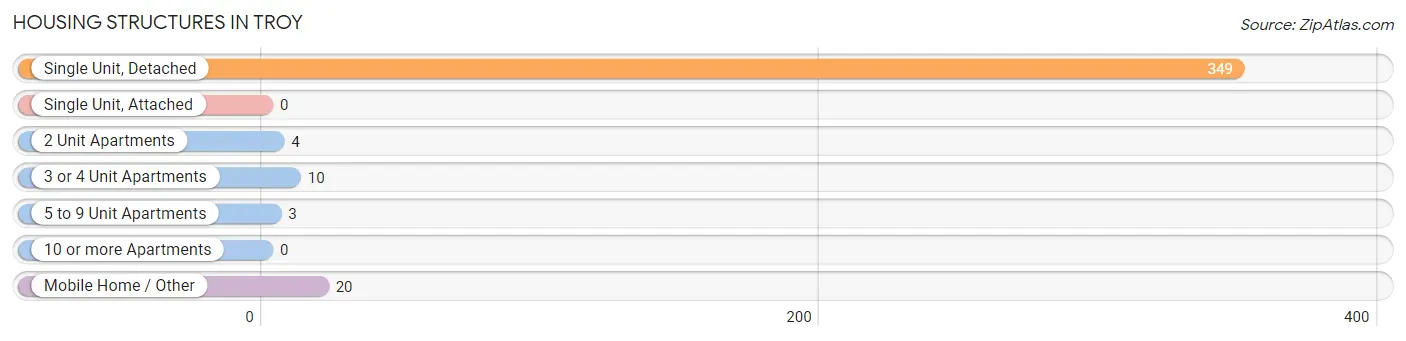
| Structure Type | # Housing Units | % Housing Units |
| Single Unit, Detached | 349 | 90.4% |
| Single Unit, Attached | 0 | 0.0% |
| 2 Unit Apartments | 4 | 1.0% |
| 3 or 4 Unit Apartments | 10 | 2.6% |
| 5 to 9 Unit Apartments | 3 | 0.8% |
| 10 or more Apartments | 0 | 0.0% |
| Mobile Home / Other | 20 | 5.2% |
| Total | 386 | 100.0% |
Housing Structures by Occupancy in Troy
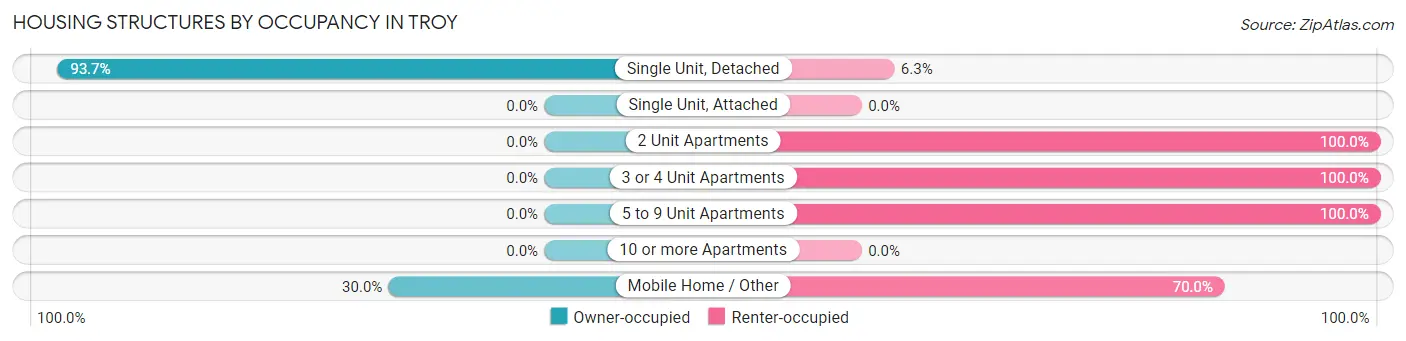
| Structure Type | Owner-occupied | Renter-occupied |
| Single Unit, Detached | 327 (93.7%) | 22 (6.3%) |
| Single Unit, Attached | 0 (0.0%) | 0 (0.0%) |
| 2 Unit Apartments | 0 (0.0%) | 4 (100.0%) |
| 3 or 4 Unit Apartments | 0 (0.0%) | 10 (100.0%) |
| 5 to 9 Unit Apartments | 0 (0.0%) | 3 (100.0%) |
| 10 or more Apartments | 0 (0.0%) | 0 (0.0%) |
| Mobile Home / Other | 6 (30.0%) | 14 (70.0%) |
| Total | 333 (86.3%) | 53 (13.7%) |
Housing Structures by Number of Rooms in Troy
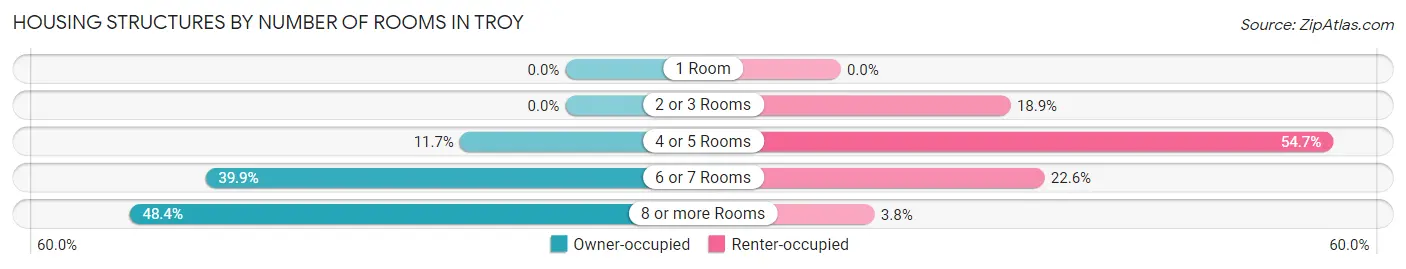
| Number of Rooms | Owner-occupied | Renter-occupied |
| 1 Room | 0 (0.0%) | 0 (0.0%) |
| 2 or 3 Rooms | 0 (0.0%) | 10 (18.9%) |
| 4 or 5 Rooms | 39 (11.7%) | 29 (54.7%) |
| 6 or 7 Rooms | 133 (39.9%) | 12 (22.6%) |
| 8 or more Rooms | 161 (48.3%) | 2 (3.8%) |
| Total | 333 (100.0%) | 53 (100.0%) |
Housing Structure by Heating Type in Troy
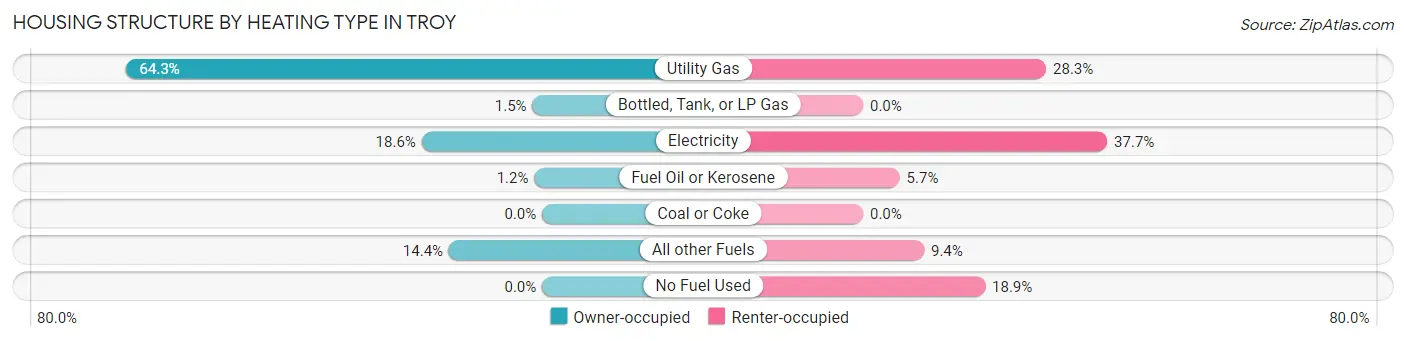
| Heating Type | Owner-occupied | Renter-occupied |
| Utility Gas | 214 (64.3%) | 15 (28.3%) |
| Bottled, Tank, or LP Gas | 5 (1.5%) | 0 (0.0%) |
| Electricity | 62 (18.6%) | 20 (37.7%) |
| Fuel Oil or Kerosene | 4 (1.2%) | 3 (5.7%) |
| Coal or Coke | 0 (0.0%) | 0 (0.0%) |
| All other Fuels | 48 (14.4%) | 5 (9.4%) |
| No Fuel Used | 0 (0.0%) | 10 (18.9%) |
| Total | 333 (100.0%) | 53 (100.0%) |
Household Vehicle Usage in Troy
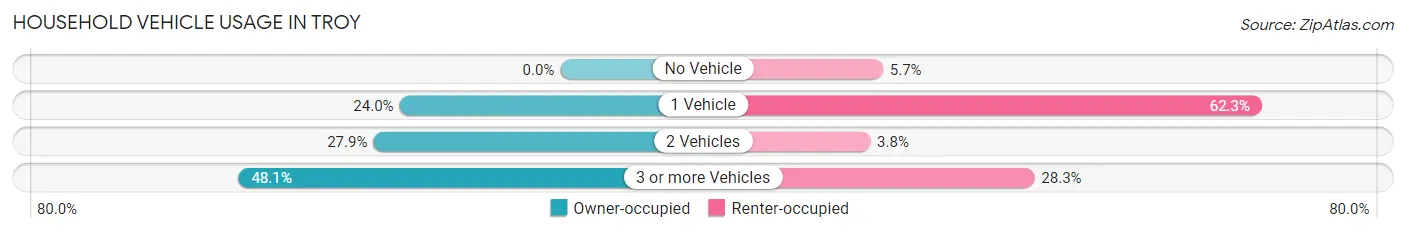
| Vehicles per Household | Owner-occupied | Renter-occupied |
| No Vehicle | 0 (0.0%) | 3 (5.7%) |
| 1 Vehicle | 80 (24.0%) | 33 (62.3%) |
| 2 Vehicles | 93 (27.9%) | 2 (3.8%) |
| 3 or more Vehicles | 160 (48.0%) | 15 (28.3%) |
| Total | 333 (100.0%) | 53 (100.0%) |
Real Estate & Mortgages in Troy
Real Estate and Mortgage Overview in Troy
| Characteristic | Without Mortgage | With Mortgage |
| Housing Units | 104 | 229 |
| Median Property Value | $266,900 | $248,700 |
| Median Household Income | $59,554 | $36 |
| Monthly Housing Costs | $525 | $0 |
| Real Estate Taxes | $1,343 | $7 |
Property Value by Mortgage Status in Troy
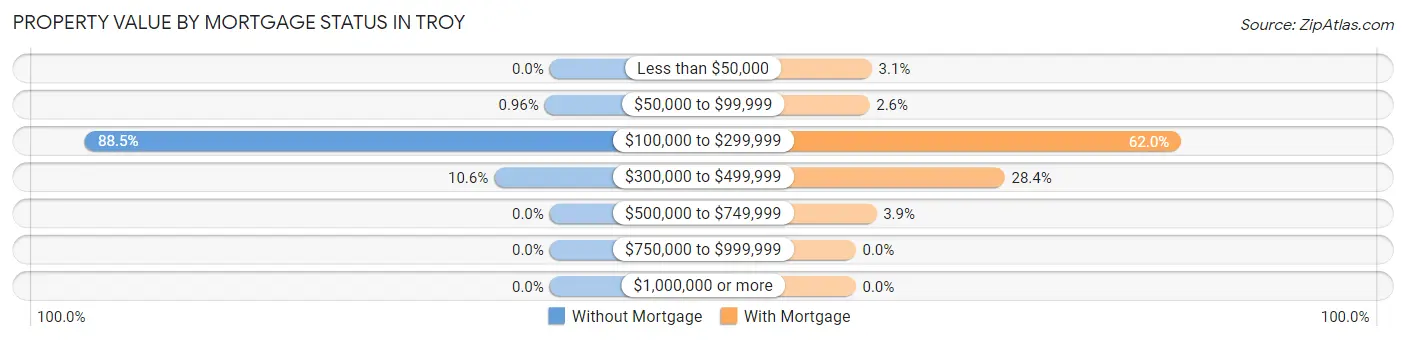
| Property Value | Without Mortgage | With Mortgage |
| Less than $50,000 | 0 (0.0%) | 7 (3.1%) |
| $50,000 to $99,999 | 1 (1.0%) | 6 (2.6%) |
| $100,000 to $299,999 | 92 (88.5%) | 142 (62.0%) |
| $300,000 to $499,999 | 11 (10.6%) | 65 (28.4%) |
| $500,000 to $749,999 | 0 (0.0%) | 9 (3.9%) |
| $750,000 to $999,999 | 0 (0.0%) | 0 (0.0%) |
| $1,000,000 or more | 0 (0.0%) | 0 (0.0%) |
| Total | 104 (100.0%) | 229 (100.0%) |
Household Income by Mortgage Status in Troy
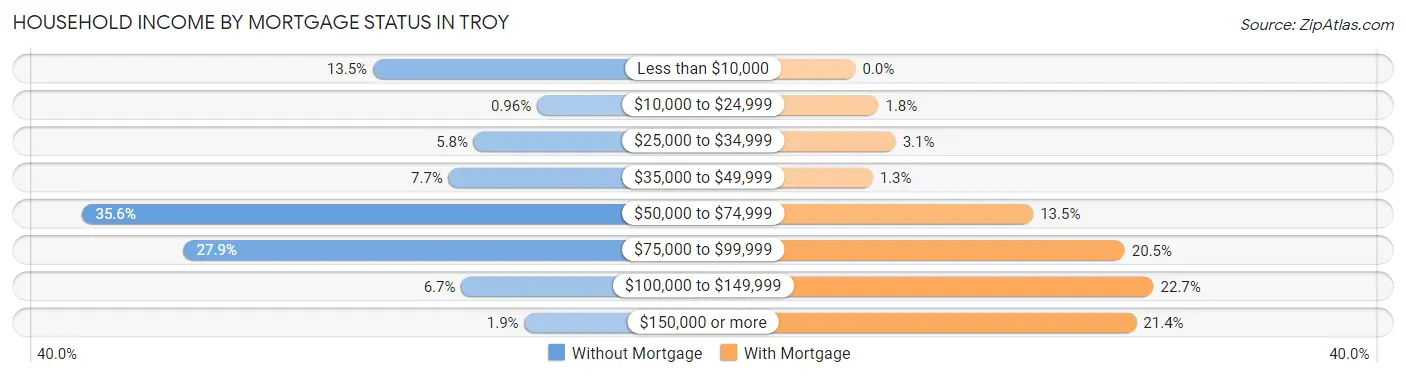
| Household Income | Without Mortgage | With Mortgage |
| Less than $10,000 | 14 (13.5%) | 0 (0.0%) |
| $10,000 to $24,999 | 1 (1.0%) | 4 (1.8%) |
| $25,000 to $34,999 | 6 (5.8%) | 7 (3.1%) |
| $35,000 to $49,999 | 8 (7.7%) | 3 (1.3%) |
| $50,000 to $74,999 | 37 (35.6%) | 31 (13.5%) |
| $75,000 to $99,999 | 29 (27.9%) | 47 (20.5%) |
| $100,000 to $149,999 | 7 (6.7%) | 52 (22.7%) |
| $150,000 or more | 2 (1.9%) | 49 (21.4%) |
| Total | 104 (100.0%) | 229 (100.0%) |
Property Value to Household Income Ratio in Troy
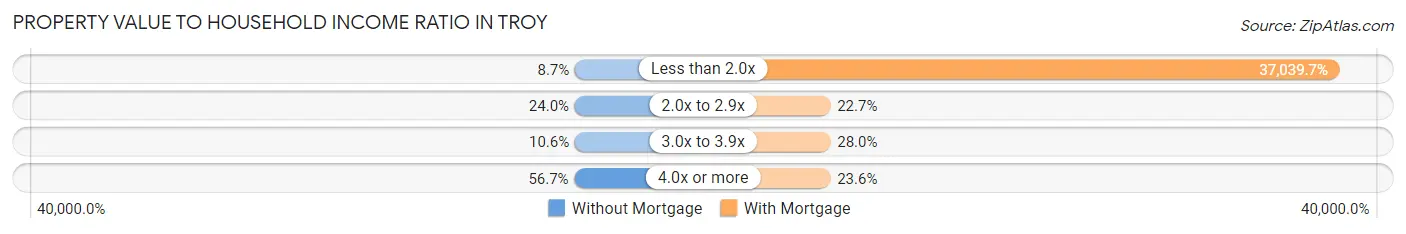
| Value-to-Income Ratio | Without Mortgage | With Mortgage |
| Less than 2.0x | 9 (8.6%) | 84,821 (37,039.7%) |
| 2.0x to 2.9x | 25 (24.0%) | 52 (22.7%) |
| 3.0x to 3.9x | 11 (10.6%) | 64 (28.0%) |
| 4.0x or more | 59 (56.7%) | 54 (23.6%) |
| Total | 104 (100.0%) | 229 (100.0%) |
Real Estate Taxes by Mortgage Status in Troy
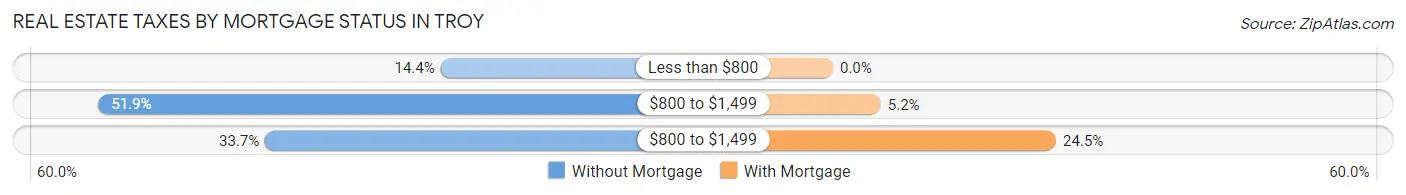
| Property Taxes | Without Mortgage | With Mortgage |
| Less than $800 | 15 (14.4%) | 0 (0.0%) |
| $800 to $1,499 | 54 (51.9%) | 12 (5.2%) |
| $800 to $1,499 | 35 (33.7%) | 56 (24.4%) |
| Total | 104 (100.0%) | 229 (100.0%) |
Health & Disability in Troy
Health Insurance Coverage by Age in Troy
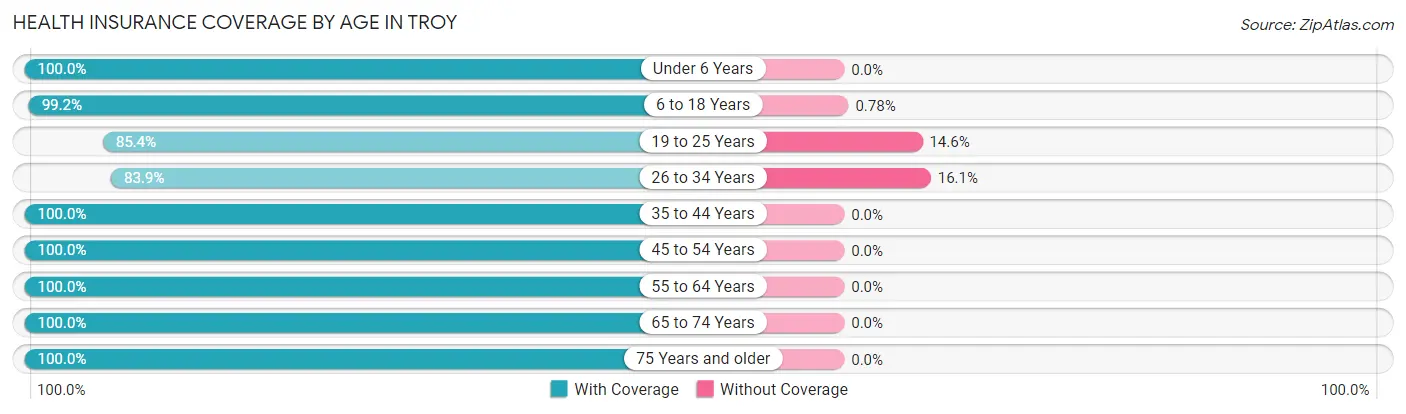
| Age Bracket | With Coverage | Without Coverage |
| Under 6 Years | 145 (100.0%) | 0 (0.0%) |
| 6 to 18 Years | 127 (99.2%) | 1 (0.8%) |
| 19 to 25 Years | 41 (85.4%) | 7 (14.6%) |
| 26 to 34 Years | 104 (83.9%) | 20 (16.1%) |
| 35 to 44 Years | 84 (100.0%) | 0 (0.0%) |
| 45 to 54 Years | 151 (100.0%) | 0 (0.0%) |
| 55 to 64 Years | 115 (100.0%) | 0 (0.0%) |
| 65 to 74 Years | 84 (100.0%) | 0 (0.0%) |
| 75 Years and older | 66 (100.0%) | 0 (0.0%) |
| Total | 917 (97.0%) | 28 (3.0%) |
Health Insurance Coverage by Citizenship Status in Troy
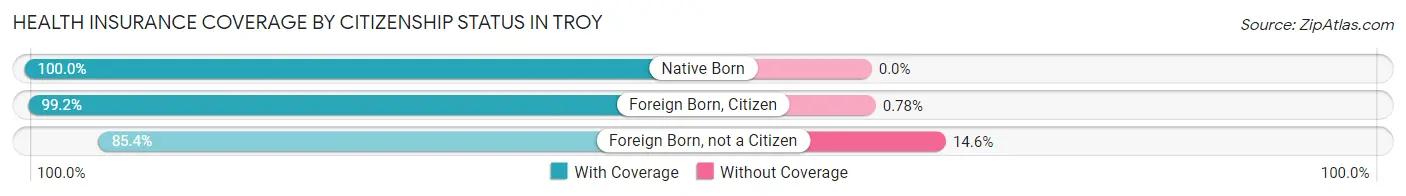
| Citizenship Status | With Coverage | Without Coverage |
| Native Born | 145 (100.0%) | 0 (0.0%) |
| Foreign Born, Citizen | 127 (99.2%) | 1 (0.8%) |
| Foreign Born, not a Citizen | 41 (85.4%) | 7 (14.6%) |
Health Insurance Coverage by Household Income in Troy
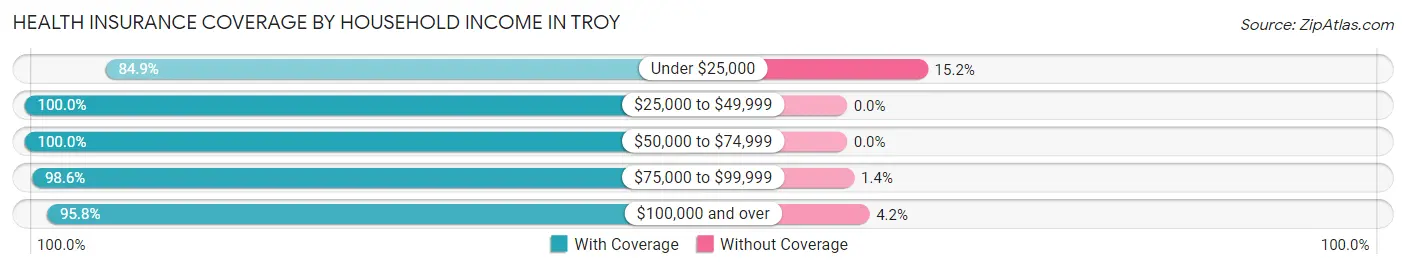
| Household Income | With Coverage | Without Coverage |
| Under $25,000 | 56 (84.9%) | 10 (15.1%) |
| $25,000 to $49,999 | 165 (100.0%) | 0 (0.0%) |
| $50,000 to $74,999 | 139 (100.0%) | 0 (0.0%) |
| $75,000 to $99,999 | 215 (98.6%) | 3 (1.4%) |
| $100,000 and over | 342 (95.8%) | 15 (4.2%) |
Public vs Private Health Insurance Coverage by Age in Troy
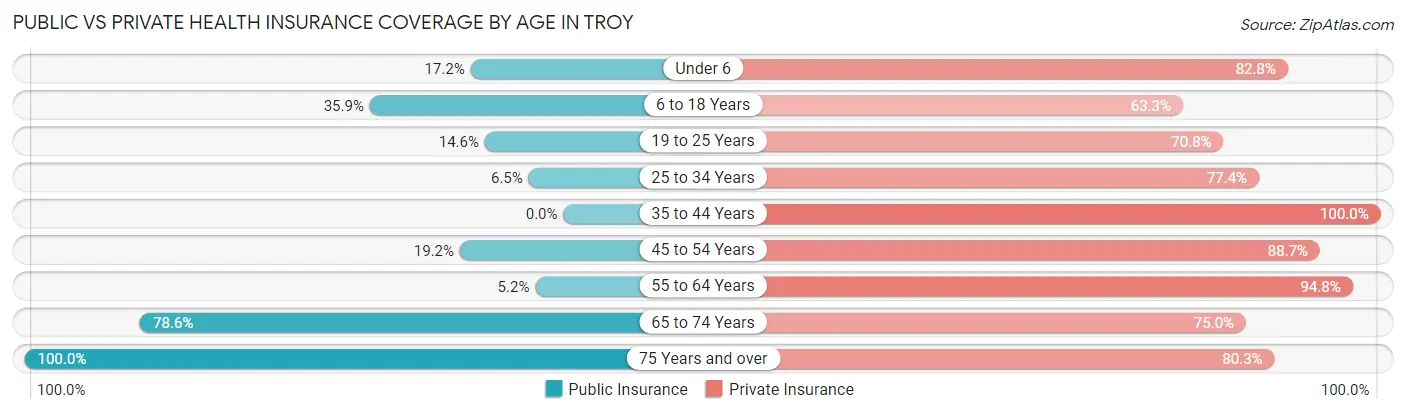
| Age Bracket | Public Insurance | Private Insurance |
| Under 6 | 25 (17.2%) | 120 (82.8%) |
| 6 to 18 Years | 46 (35.9%) | 81 (63.3%) |
| 19 to 25 Years | 7 (14.6%) | 34 (70.8%) |
| 25 to 34 Years | 8 (6.5%) | 96 (77.4%) |
| 35 to 44 Years | 0 (0.0%) | 84 (100.0%) |
| 45 to 54 Years | 29 (19.2%) | 134 (88.7%) |
| 55 to 64 Years | 6 (5.2%) | 109 (94.8%) |
| 65 to 74 Years | 66 (78.6%) | 63 (75.0%) |
| 75 Years and over | 66 (100.0%) | 53 (80.3%) |
| Total | 253 (26.8%) | 774 (81.9%) |
Disability Status by Sex by Age in Troy
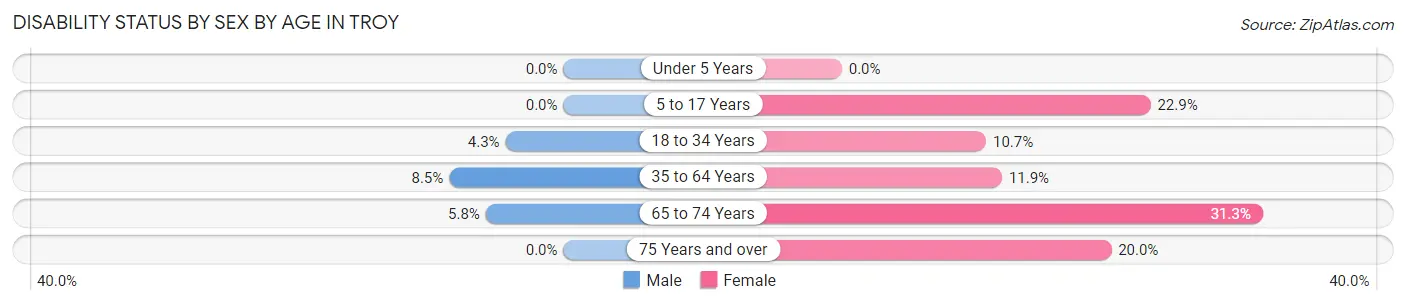
| Age Bracket | Male | Female |
| Under 5 Years | 0 (0.0%) | 0 (0.0%) |
| 5 to 17 Years | 0 (0.0%) | 11 (22.9%) |
| 18 to 34 Years | 4 (4.3%) | 9 (10.7%) |
| 35 to 64 Years | 14 (8.5%) | 22 (11.9%) |
| 65 to 74 Years | 3 (5.8%) | 10 (31.2%) |
| 75 Years and over | 0 (0.0%) | 11 (20.0%) |
Disability Class by Sex by Age in Troy
Disability Class: Hearing Difficulty
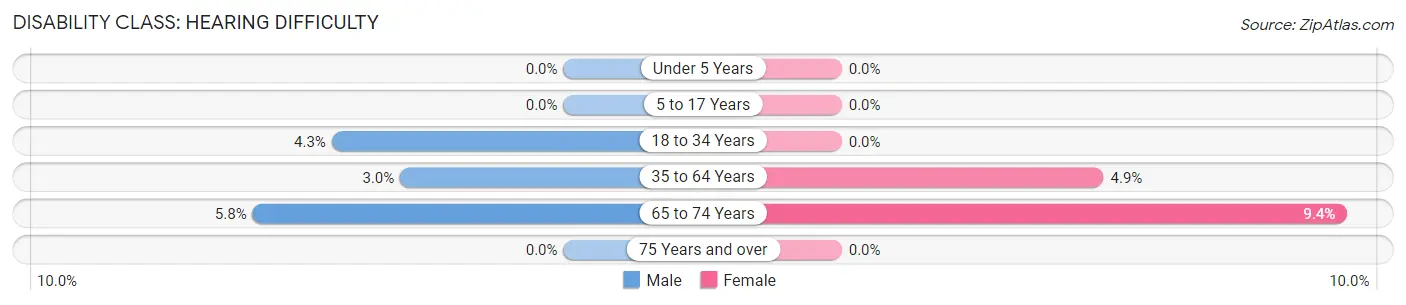
| Age Bracket | Male | Female |
| Under 5 Years | 0 (0.0%) | 0 (0.0%) |
| 5 to 17 Years | 0 (0.0%) | 0 (0.0%) |
| 18 to 34 Years | 4 (4.3%) | 0 (0.0%) |
| 35 to 64 Years | 5 (3.0%) | 9 (4.9%) |
| 65 to 74 Years | 3 (5.8%) | 3 (9.4%) |
| 75 Years and over | 0 (0.0%) | 0 (0.0%) |
Disability Class: Vision Difficulty
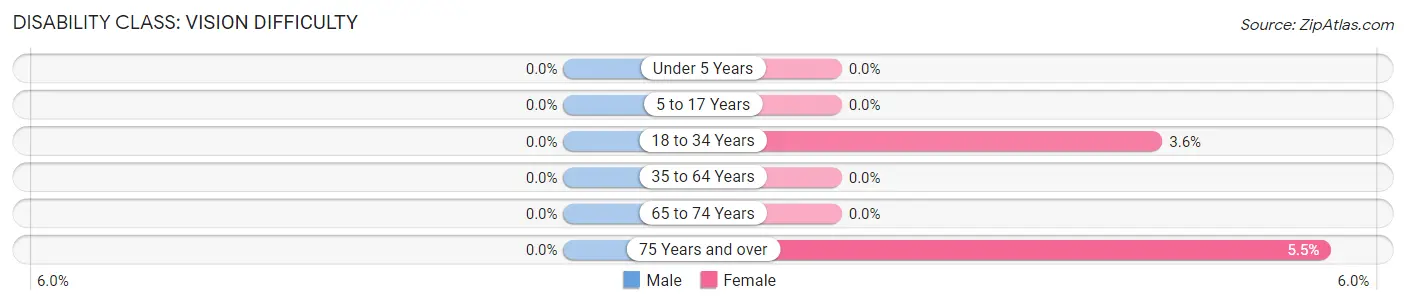
| Age Bracket | Male | Female |
| Under 5 Years | 0 (0.0%) | 0 (0.0%) |
| 5 to 17 Years | 0 (0.0%) | 0 (0.0%) |
| 18 to 34 Years | 0 (0.0%) | 3 (3.6%) |
| 35 to 64 Years | 0 (0.0%) | 0 (0.0%) |
| 65 to 74 Years | 0 (0.0%) | 0 (0.0%) |
| 75 Years and over | 0 (0.0%) | 3 (5.4%) |
Disability Class: Cognitive Difficulty
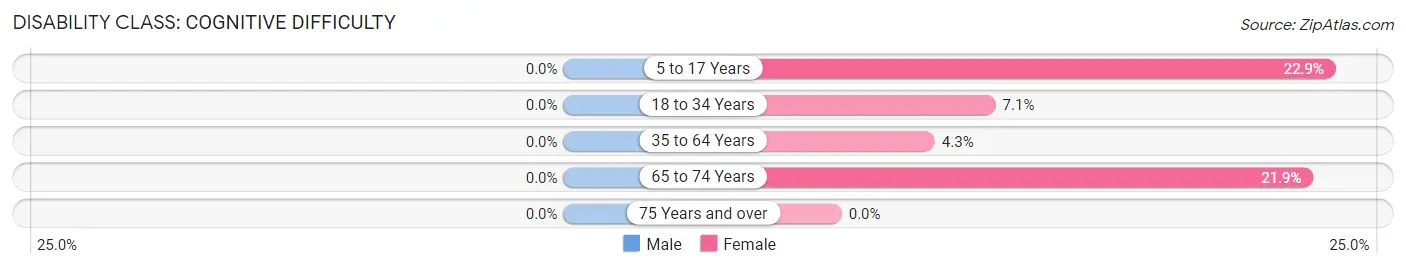
| Age Bracket | Male | Female |
| 5 to 17 Years | 0 (0.0%) | 11 (22.9%) |
| 18 to 34 Years | 0 (0.0%) | 6 (7.1%) |
| 35 to 64 Years | 0 (0.0%) | 8 (4.3%) |
| 65 to 74 Years | 0 (0.0%) | 7 (21.9%) |
| 75 Years and over | 0 (0.0%) | 0 (0.0%) |
Disability Class: Ambulatory Difficulty
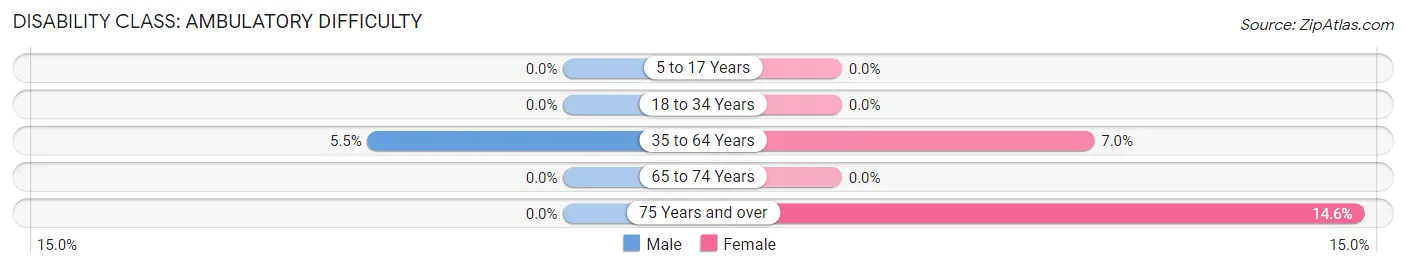
| Age Bracket | Male | Female |
| 5 to 17 Years | 0 (0.0%) | 0 (0.0%) |
| 18 to 34 Years | 0 (0.0%) | 0 (0.0%) |
| 35 to 64 Years | 9 (5.4%) | 13 (7.0%) |
| 65 to 74 Years | 0 (0.0%) | 0 (0.0%) |
| 75 Years and over | 0 (0.0%) | 8 (14.5%) |
Disability Class: Self-Care Difficulty
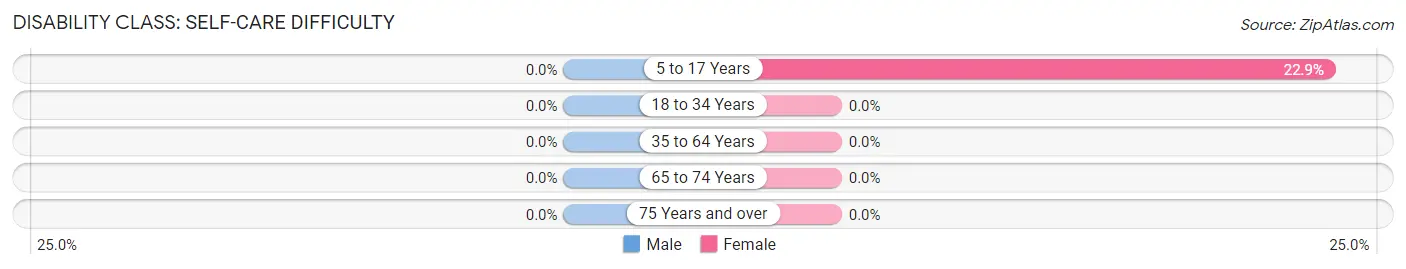
| Age Bracket | Male | Female |
| 5 to 17 Years | 0 (0.0%) | 11 (22.9%) |
| 18 to 34 Years | 0 (0.0%) | 0 (0.0%) |
| 35 to 64 Years | 0 (0.0%) | 0 (0.0%) |
| 65 to 74 Years | 0 (0.0%) | 0 (0.0%) |
| 75 Years and over | 0 (0.0%) | 0 (0.0%) |
Technology Access in Troy
Computing Device Access in Troy
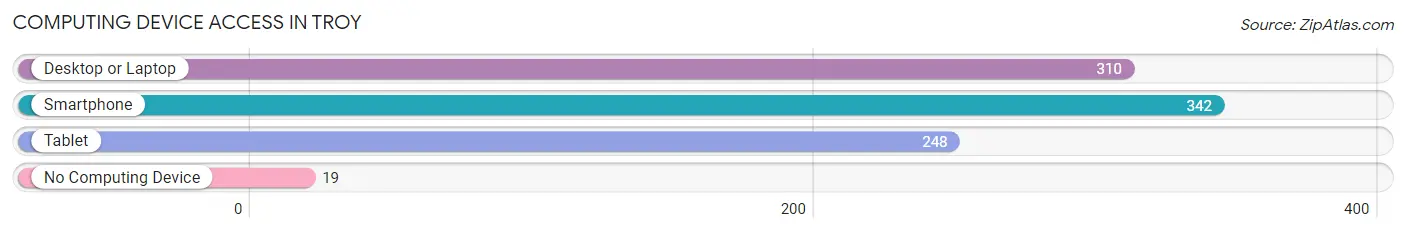
| Device Type | # Households | % Households |
| Desktop or Laptop | 310 | 80.3% |
| Smartphone | 342 | 88.6% |
| Tablet | 248 | 64.2% |
| No Computing Device | 19 | 4.9% |
| Total | 386 | 100.0% |
Internet Access in Troy
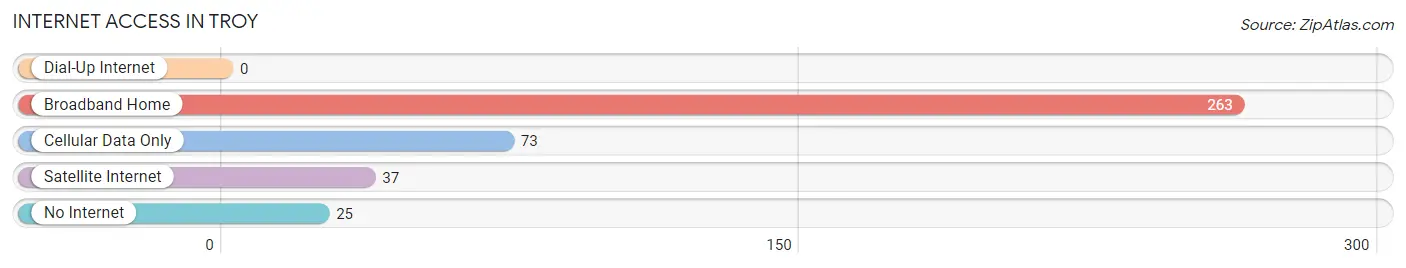
| Internet Type | # Households | % Households |
| Dial-Up Internet | 0 | 0.0% |
| Broadband Home | 263 | 68.1% |
| Cellular Data Only | 73 | 18.9% |
| Satellite Internet | 37 | 9.6% |
| No Internet | 25 | 6.5% |
| Total | 386 | 100.0% |
Troy Summary
Troy, Idaho is a small city located in Latah County in the northern part of the state. It is situated in the Palouse region of the Pacific Northwest, and is surrounded by rolling hills and farmland. The city has a population of 1,845 as of the 2020 census, and is the county seat of Latah County.
History
Troy was founded in 1883 by a group of settlers from Troy, New York. The settlers were looking for a place to settle and start a new life, and they chose the area around Troy, Idaho. The city was named after the city in New York, and the settlers quickly began to build homes and businesses. The first post office was established in 1884, and the city was officially incorporated in 1887.
Troy quickly became a thriving agricultural center, with many of the settlers growing wheat, oats, and barley. The city also became a hub for the timber industry, with many of the local sawmills providing lumber for the surrounding area.
In the early 1900s, Troy began to experience a population boom, as many of the settlers began to move to the city from other parts of the state. This influx of people helped to spur the growth of the city, and by the 1920s, Troy had become a bustling small city.
Geography
Troy is located in the northern part of Latah County, in the Palouse region of the Pacific Northwest. The city is situated in a valley surrounded by rolling hills and farmland. The city is located at an elevation of 2,072 feet, and is approximately 20 miles south of the Idaho-Washington border.
The city is located in a temperate climate, with hot summers and cold winters. The average temperature in the summer is around 80 degrees Fahrenheit, and the average temperature in the winter is around 30 degrees Fahrenheit.
Economy
Troy’s economy is largely based on agriculture and timber. The city is home to several large farms, and the surrounding area is known for its production of wheat, oats, and barley. The city is also home to several sawmills, which provide lumber for the surrounding area.
In addition to agriculture and timber, Troy is also home to several small businesses, including restaurants, retail stores, and service providers. The city is also home to a small airport, which serves the surrounding area.
Demographics
As of the 2020 census, Troy had a population of 1,845. The racial makeup of the city was 94.3% White, 0.7% Native American, 0.3% Asian, 0.2% Black, 0.1% Pacific Islander, and 4.4% from other races. The median household income in Troy was $41,944, and the median age was 39.7 years.
Conclusion
Troy, Idaho is a small city located in Latah County in the northern part of the state. It is situated in the Palouse region of the Pacific Northwest, and is surrounded by rolling hills and farmland. The city has a population of 1,845 as of the 2020 census, and is the county seat of Latah County. Troy’s economy is largely based on agriculture and timber, and the city is home to several small businesses. The city is also home to a small airport, which serves the surrounding area.
Common Questions
What is the Total Population of Troy?
Total Population of Troy is 945.
What is the Total Male Population of Troy?
Total Male Population of Troy is 474.
What is the Total Female Population of Troy?
Total Female Population of Troy is 471.
What is the Ratio of Males per 100 Females in Troy?
There are 100.64 Males per 100 Females in Troy.
What is the Ratio of Females per 100 Males in Troy?
There are 99.37 Females per 100 Males in Troy.
What is the Median Population Age in Troy?
Median Population Age in Troy is 38.9 Years.
What is the Average Family Size in Troy
Average Family Size in Troy is 3.2 People.
What is the Average Household Size in Troy
Average Household Size in Troy is 2.5 People.
What is Per Capita Income in Troy?
Per Capita income in Troy is $32,319.
What is the Median Family Income in Troy?
Median Family Income in Troy is $92,313.
What is the Median Household income in Troy?
Median Household Income in Troy is $74,444.
What is Income or Wage Gap in Troy?
Income or Wage Gap in Troy is 29.7%.
Women in Troy earn 70.3 cents for every dollar earned by a man.
What is Inequality or Gini Index in Troy?
Inequality or Gini Index in Troy is 0.33.
How Large is the Labor Force in Troy?
There are 474 People in the Labor Forcein in Troy.
What is the Percentage of People in the Labor Force in Troy?
68.4% of People are in the Labor Force in Troy.
What is the Unemployment Rate in Troy?
Unemployment Rate in Troy is 4.9%.