Tensed, ID
Tensed Map

Tensed Overview
72
TOTAL POPULATION
36
MALE POPULATION
36
FEMALE POPULATION
100.00
MALES / 100 FEMALES
100.00
FEMALES / 100 MALES
52.8
MEDIAN AGE
3.0
AVG FAMILY SIZE
1.7
AVG HOUSEHOLD SIZE
$23,640
PER CAPITA INCOME
$23,750
AVG HOUSEHOLD INCOME
0.52
INEQUALITY / GINI INDEX
26
LABOR FORCE [ PEOPLE ]
40.0%
PERCENT IN LABOR FORCE
7.7%
UNEMPLOYMENT RATE
Tensed Zip Codes
Tensed Area Codes
Race in Tensed
The most populous races in Tensed are White / Caucasian (53 | 73.6%), Native / Alaskan (13 | 18.1%), and Two or more Races (6 | 8.3%).
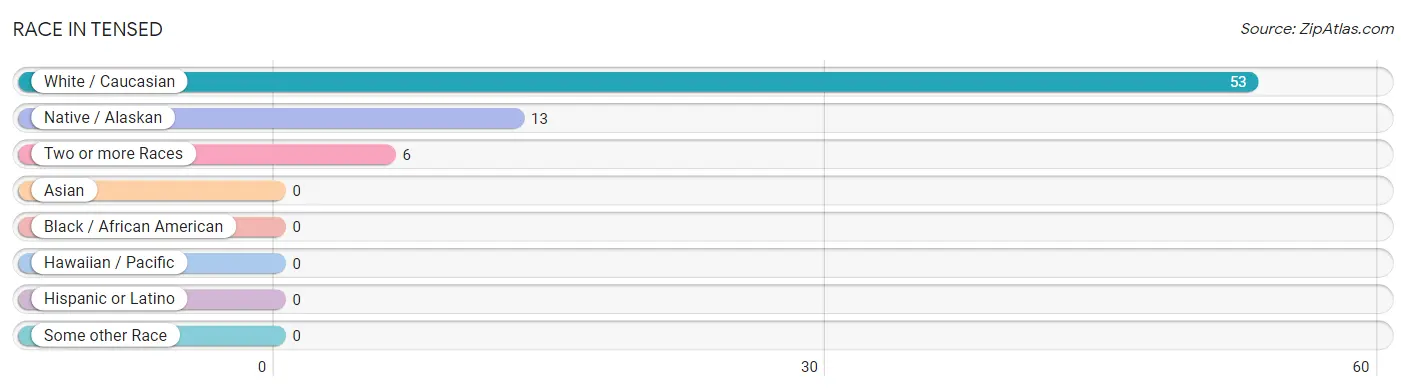
| Race | # Population | % Population |
| Asian | 0 | 0.0% |
| Black / African American | 0 | 0.0% |
| Hawaiian / Pacific | 0 | 0.0% |
| Hispanic or Latino | 0 | 0.0% |
| Native / Alaskan | 13 | 18.1% |
| White / Caucasian | 53 | 73.6% |
| Two or more Races | 6 | 8.3% |
| Some other Race | 0 | 0.0% |
| Total | 72 | 100.0% |
Ancestry in Tensed
The most populous ancestries reported in Tensed are German (34 | 47.2%), Dutch (12 | 16.7%), English (5 | 6.9%), Irish (4 | 5.6%), and Norwegian (3 | 4.2%), together accounting for 80.6% of all Tensed residents.
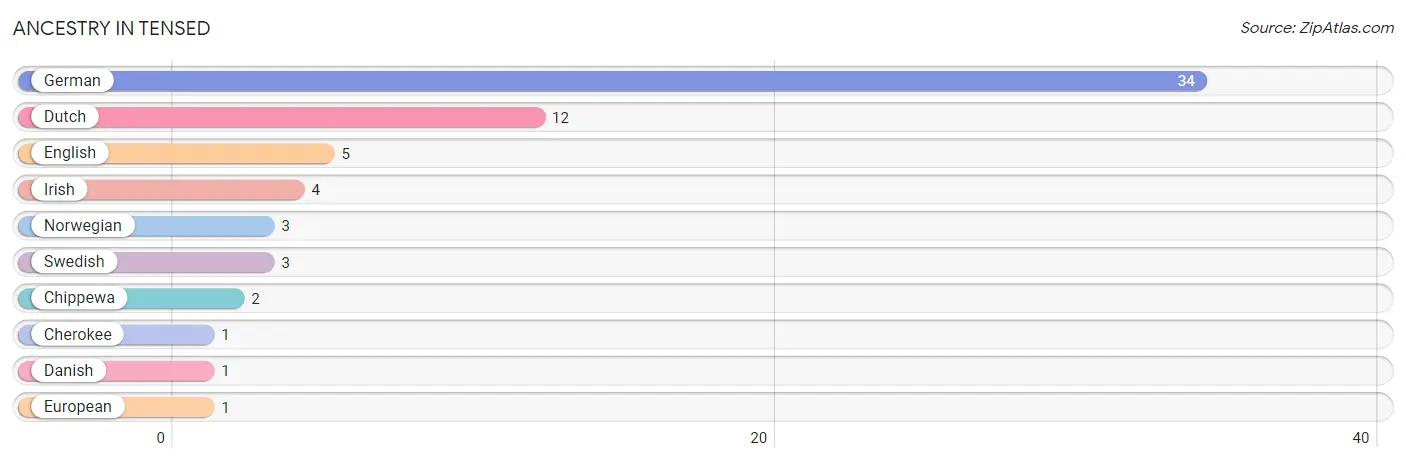
| Ancestry | # Population | % Population |
| Cherokee | 1 | 1.4% |
| Chippewa | 2 | 2.8% |
| Danish | 1 | 1.4% |
| Dutch | 12 | 16.7% |
| English | 5 | 6.9% |
| European | 1 | 1.4% |
| German | 34 | 47.2% |
| Irish | 4 | 5.6% |
| Norwegian | 3 | 4.2% |
| Swedish | 3 | 4.2% | View All 10 Rows |
Immigrants in Tensed

| Immigration Origin | # Population | % Population | View All 0 Rows |
Sex and Age in Tensed
Sex and Age in Tensed
The most populous age groups in Tensed are 20 to 24 Years (6 | 16.7%) for men and 70 to 74 Years (8 | 22.2%) for women.
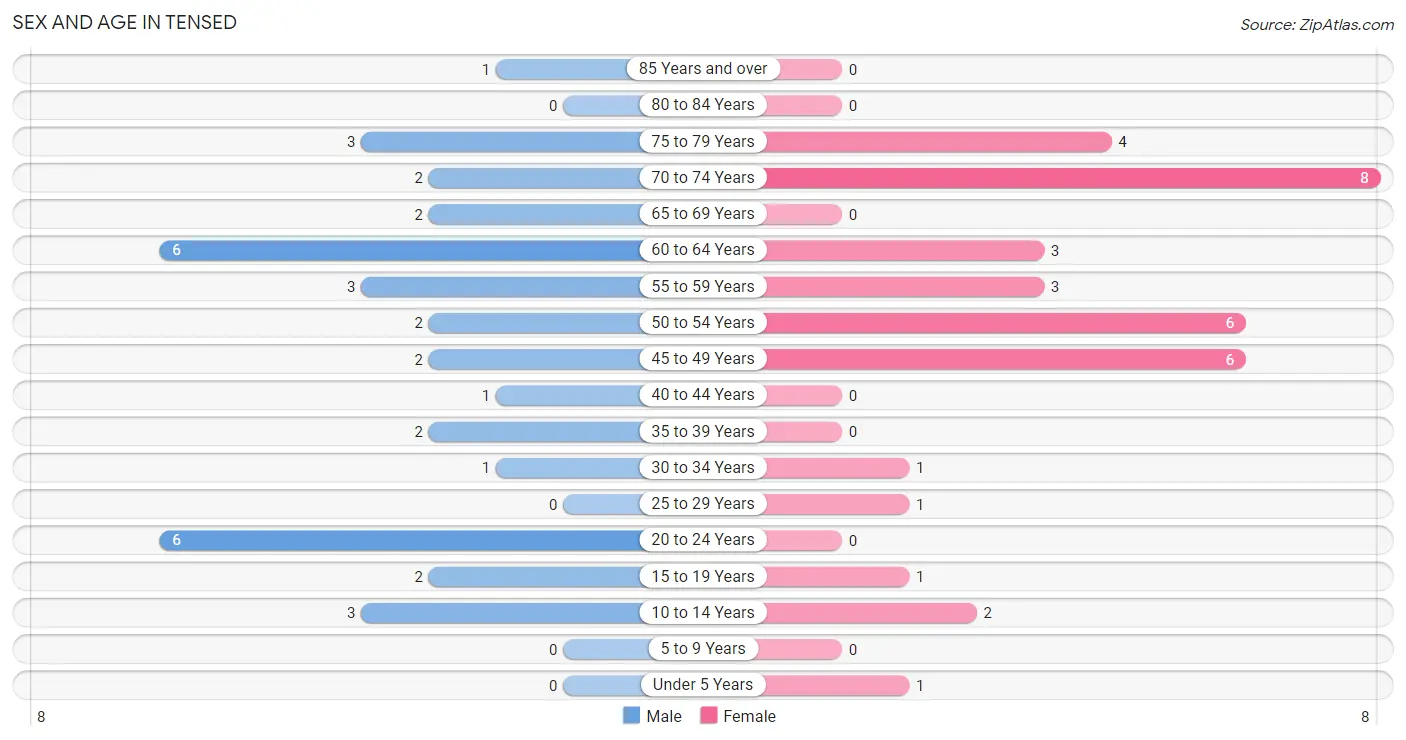
| Age Bracket | Male | Female |
| Under 5 Years | 0 (0.0%) | 1 (2.8%) |
| 5 to 9 Years | 0 (0.0%) | 0 (0.0%) |
| 10 to 14 Years | 3 (8.3%) | 2 (5.6%) |
| 15 to 19 Years | 2 (5.6%) | 1 (2.8%) |
| 20 to 24 Years | 6 (16.7%) | 0 (0.0%) |
| 25 to 29 Years | 0 (0.0%) | 1 (2.8%) |
| 30 to 34 Years | 1 (2.8%) | 1 (2.8%) |
| 35 to 39 Years | 2 (5.6%) | 0 (0.0%) |
| 40 to 44 Years | 1 (2.8%) | 0 (0.0%) |
| 45 to 49 Years | 2 (5.6%) | 6 (16.7%) |
| 50 to 54 Years | 2 (5.6%) | 6 (16.7%) |
| 55 to 59 Years | 3 (8.3%) | 3 (8.3%) |
| 60 to 64 Years | 6 (16.7%) | 3 (8.3%) |
| 65 to 69 Years | 2 (5.6%) | 0 (0.0%) |
| 70 to 74 Years | 2 (5.6%) | 8 (22.2%) |
| 75 to 79 Years | 3 (8.3%) | 4 (11.1%) |
| 80 to 84 Years | 0 (0.0%) | 0 (0.0%) |
| 85 Years and over | 1 (2.8%) | 0 (0.0%) |
| Total | 36 (100.0%) | 36 (100.0%) |
Families and Households in Tensed
Median Family Size in Tensed
The median family size in Tensed is 3.00 persons per family, with single male/father families (1 | 7.1%) accounting for the largest median family size of 12 persons per family. On the other hand, married-couple families (7 | 50.0%) represent the smallest median family size with 2.14 persons per family.
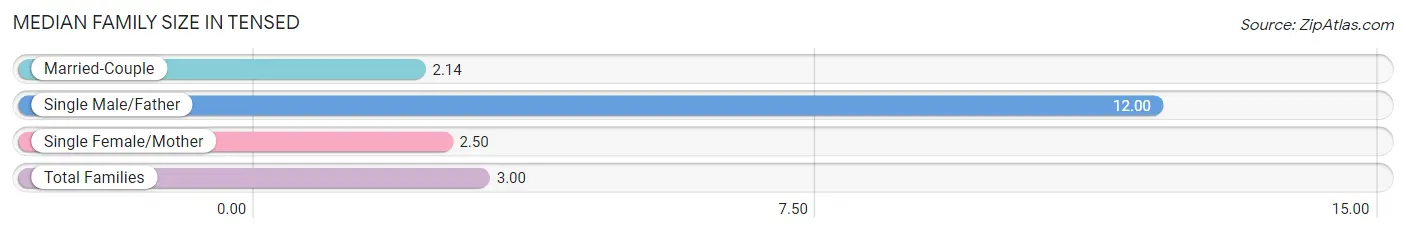
| Family Type | # Families | Family Size |
| Married-Couple | 7 (50.0%) | 2.14 |
| Single Male/Father | 1 (7.1%) | 12.00 |
| Single Female/Mother | 6 (42.9%) | 2.50 |
| Total Families | 14 (100.0%) | 3.00 |
Median Household Size in Tensed
The median household size in Tensed is 1.71 persons per household, with single male/father households (1 | 2.4%) accounting for the largest median household size of 12 persons per household. non-family households (28 | 66.7%) represent the smallest median household size with 1.07 persons per household.
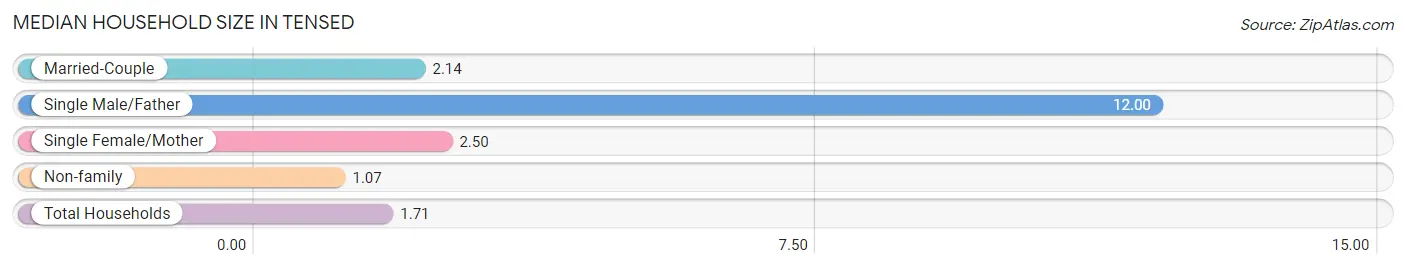
| Household Type | # Households | Household Size |
| Married-Couple | 7 (16.7%) | 2.14 |
| Single Male/Father | 1 (2.4%) | 12.00 |
| Single Female/Mother | 6 (14.3%) | 2.50 |
| Non-family | 28 (66.7%) | 1.07 |
| Total Households | 42 (100.0%) | 1.71 |
Household Size by Marriage Status in Tensed
Out of a total of 42 households in Tensed, 14 (33.3%) are family households, while 28 (66.7%) are nonfamily households. The most numerous type of family households are 2-person households, comprising 9, and the most common type of nonfamily households are 1-person households, comprising 26.
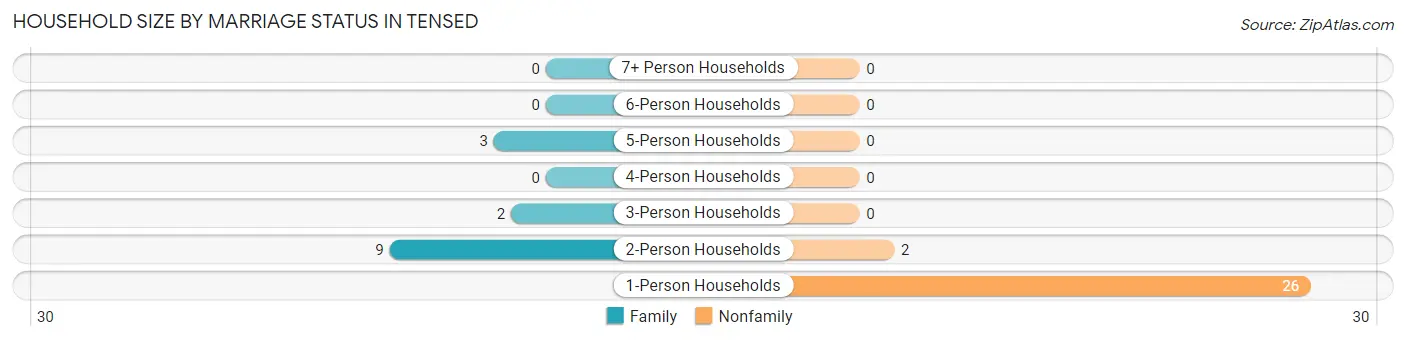
| Household Size | Family Households | Nonfamily Households |
| 1-Person Households | - | 26 (61.9%) |
| 2-Person Households | 9 (21.4%) | 2 (4.8%) |
| 3-Person Households | 2 (4.8%) | 0 (0.0%) |
| 4-Person Households | 0 (0.0%) | 0 (0.0%) |
| 5-Person Households | 3 (7.1%) | 0 (0.0%) |
| 6-Person Households | 0 (0.0%) | 0 (0.0%) |
| 7+ Person Households | 0 (0.0%) | 0 (0.0%) |
| Total | 14 (33.3%) | 28 (66.7%) |
Female Fertility in Tensed
Fertility by Age in Tensed
Average fertility rate in Tensed is 91.0 births per 1,000 women. Women in the age bracket of 15 to 19 years have the highest fertility rate with 1,000.0 births per 1,000 women. Women in the age bracket of 15 to 19 years acount for 100.0% of all women with births.
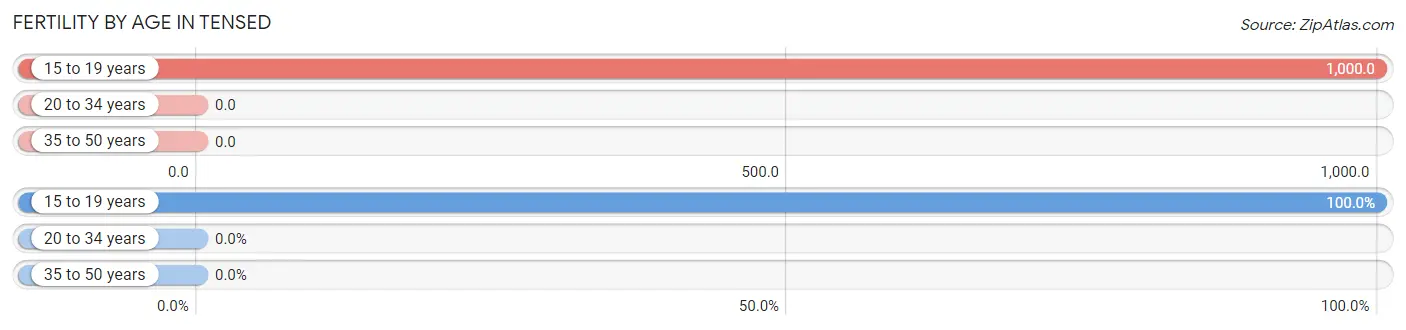
| Age Bracket | Women with Births | Births / 1,000 Women |
| 15 to 19 years | 1 (100.0%) | 1,000.0 |
| 20 to 34 years | 0 (0.0%) | 0.0 |
| 35 to 50 years | 0 (0.0%) | 0.0 |
| Total | 1 (100.0%) | 91.0 |
Fertility by Age by Marriage Status in Tensed
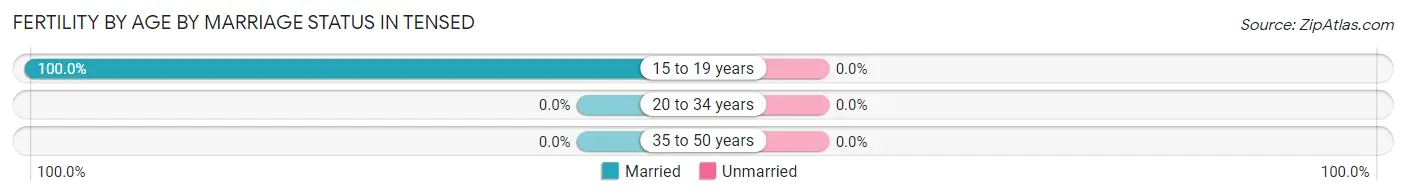
| Age Bracket | Married | Unmarried |
| 15 to 19 years | 1 (100.0%) | 0 (0.0%) |
| 20 to 34 years | 0 (0.0%) | 0 (0.0%) |
| 35 to 50 years | 0 (0.0%) | 0 (0.0%) |
| Total | 1 (100.0%) | 0 (0.0%) |
Fertility by Education in Tensed
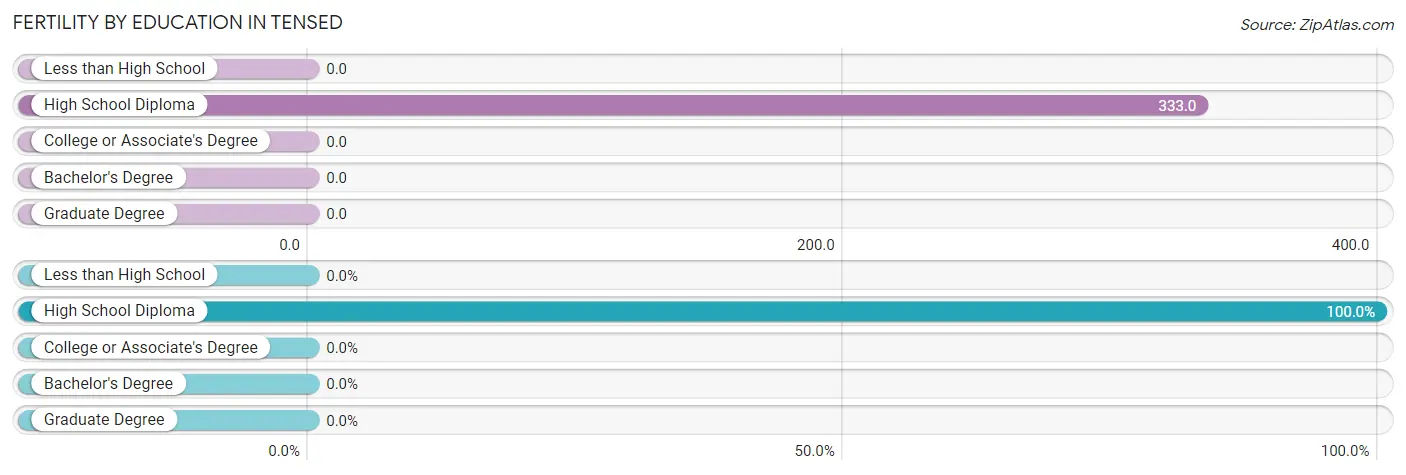
| Educational Attainment | Women with Births | Births / 1,000 Women |
| Less than High School | 0 (0.0%) | 0.0 |
| High School Diploma | 1 (100.0%) | 333.0 |
| College or Associate's Degree | 0 (0.0%) | 0.0 |
| Bachelor's Degree | 0 (0.0%) | 0.0 |
| Graduate Degree | 0 (0.0%) | 0.0 |
| Total | 1 (100.0%) | 91.0 |
Fertility by Education by Marriage Status in Tensed
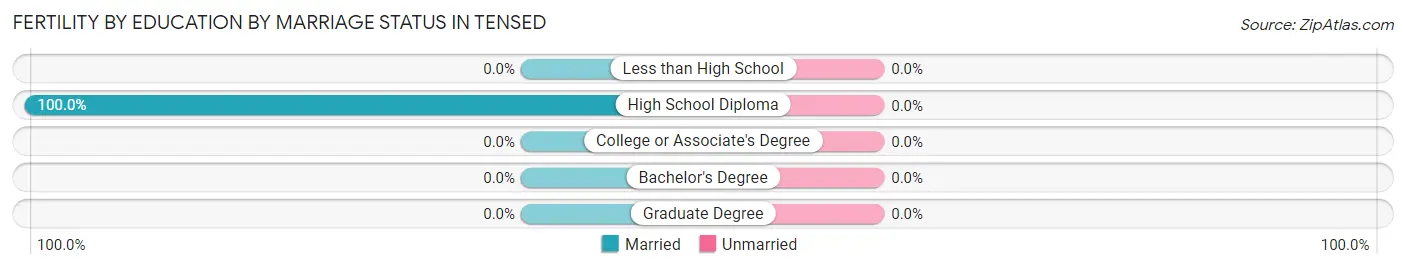
| Educational Attainment | Married | Unmarried |
| Less than High School | 0 (0.0%) | 0 (0.0%) |
| High School Diploma | 1 (100.0%) | 0 (0.0%) |
| College or Associate's Degree | 0 (0.0%) | 0 (0.0%) |
| Bachelor's Degree | 0 (0.0%) | 0 (0.0%) |
| Graduate Degree | 0 (0.0%) | 0 (0.0%) |
| Total | 1 (100.0%) | 0 (0.0%) |
Income in Tensed
Income Overview in Tensed
| Characteristic | Number | Measure |
| Per Capita Income | 72 | $23,640 |
| Median Family Income | 14 | $0 |
| Mean Family Income | 14 | $73,221 |
| Median Household Income | 42 | $23,750 |
| Mean Household Income | 42 | $38,614 |
| Income Deficit | 14 | $0 |
| Wage / Income Gap (%) | 72 | 0.00% |
| Wage / Income Gap ($) | 72 | 100.00¢ per $1 |
| Gini / Inequality Index | 72 | 0.52 |
Earnings by Sex in Tensed
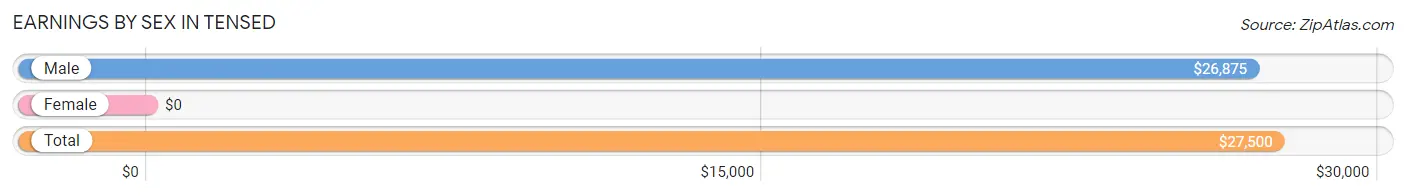
| Sex | Number | Average Earnings |
| Male | 15 (46.9%) | $26,875 |
| Female | 17 (53.1%) | $0 |
| Total | 32 (100.0%) | $27,500 |
Earnings by Sex by Income Bracket in Tensed
The most common earnings brackets in Tensed are $40,000 to $44,999 for men (4 | 26.7%) and $2,499 or less for women (4 | 23.5%).
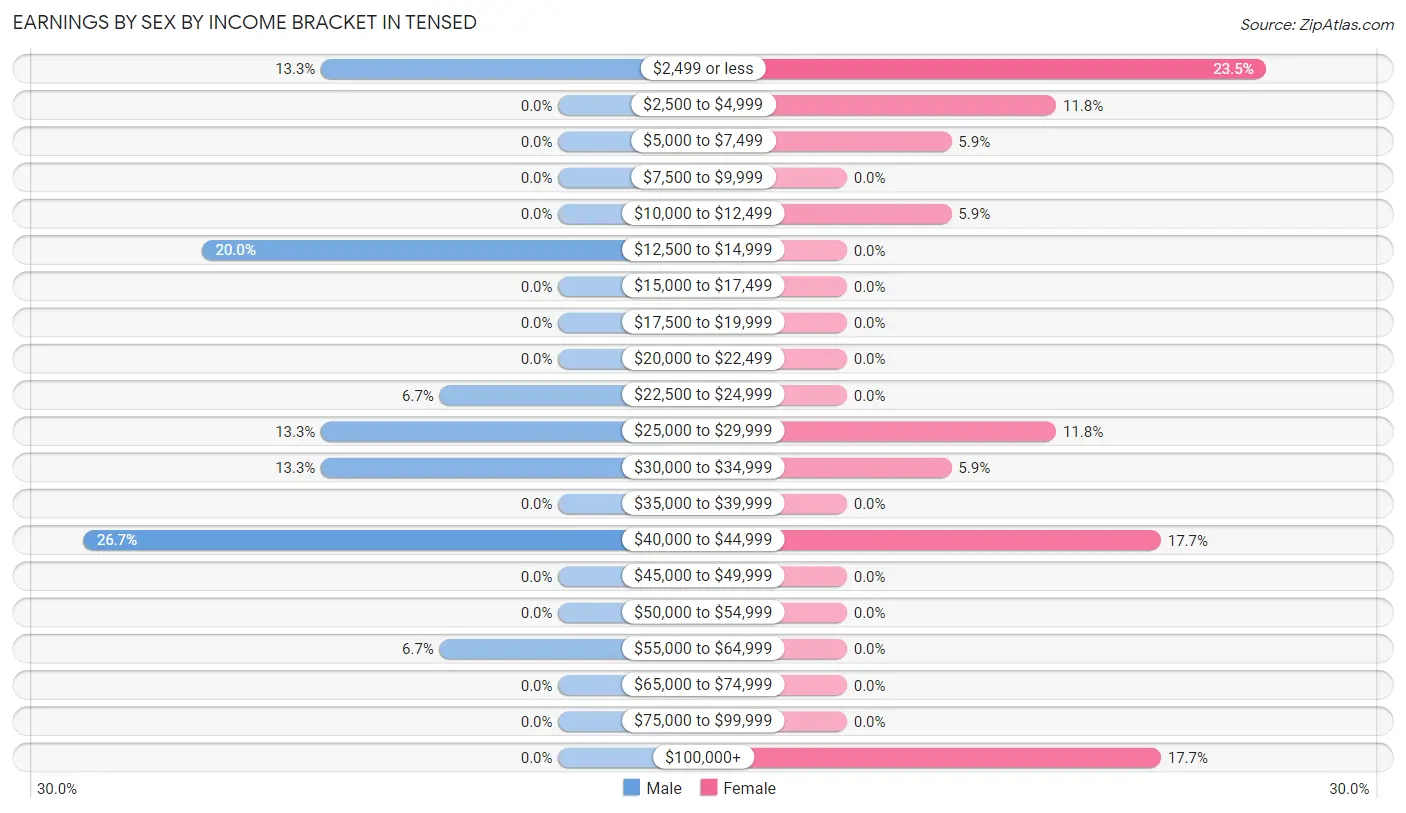
| Income | Male | Female |
| $2,499 or less | 2 (13.3%) | 4 (23.5%) |
| $2,500 to $4,999 | 0 (0.0%) | 2 (11.8%) |
| $5,000 to $7,499 | 0 (0.0%) | 1 (5.9%) |
| $7,500 to $9,999 | 0 (0.0%) | 0 (0.0%) |
| $10,000 to $12,499 | 0 (0.0%) | 1 (5.9%) |
| $12,500 to $14,999 | 3 (20.0%) | 0 (0.0%) |
| $15,000 to $17,499 | 0 (0.0%) | 0 (0.0%) |
| $17,500 to $19,999 | 0 (0.0%) | 0 (0.0%) |
| $20,000 to $22,499 | 0 (0.0%) | 0 (0.0%) |
| $22,500 to $24,999 | 1 (6.7%) | 0 (0.0%) |
| $25,000 to $29,999 | 2 (13.3%) | 2 (11.8%) |
| $30,000 to $34,999 | 2 (13.3%) | 1 (5.9%) |
| $35,000 to $39,999 | 0 (0.0%) | 0 (0.0%) |
| $40,000 to $44,999 | 4 (26.7%) | 3 (17.6%) |
| $45,000 to $49,999 | 0 (0.0%) | 0 (0.0%) |
| $50,000 to $54,999 | 0 (0.0%) | 0 (0.0%) |
| $55,000 to $64,999 | 1 (6.7%) | 0 (0.0%) |
| $65,000 to $74,999 | 0 (0.0%) | 0 (0.0%) |
| $75,000 to $99,999 | 0 (0.0%) | 0 (0.0%) |
| $100,000+ | 0 (0.0%) | 3 (17.6%) |
| Total | 15 (100.0%) | 17 (100.0%) |
Earnings by Sex by Educational Attainment in Tensed
| Educational Attainment | Male Income | Female Income |
| Less than High School | - | - |
| High School Diploma | - | - |
| College or Associate's Degree | - | - |
| Bachelor's Degree | - | - |
| Graduate Degree | - | - |
| Total | $26,250 | $0 |
Family Income in Tensed
Family Income Brackets in Tensed
According to the Tensed family income data, there are 5 families falling into the $15,000 to $24,999 income range, which is the most common income bracket and makes up 35.7% of all families.
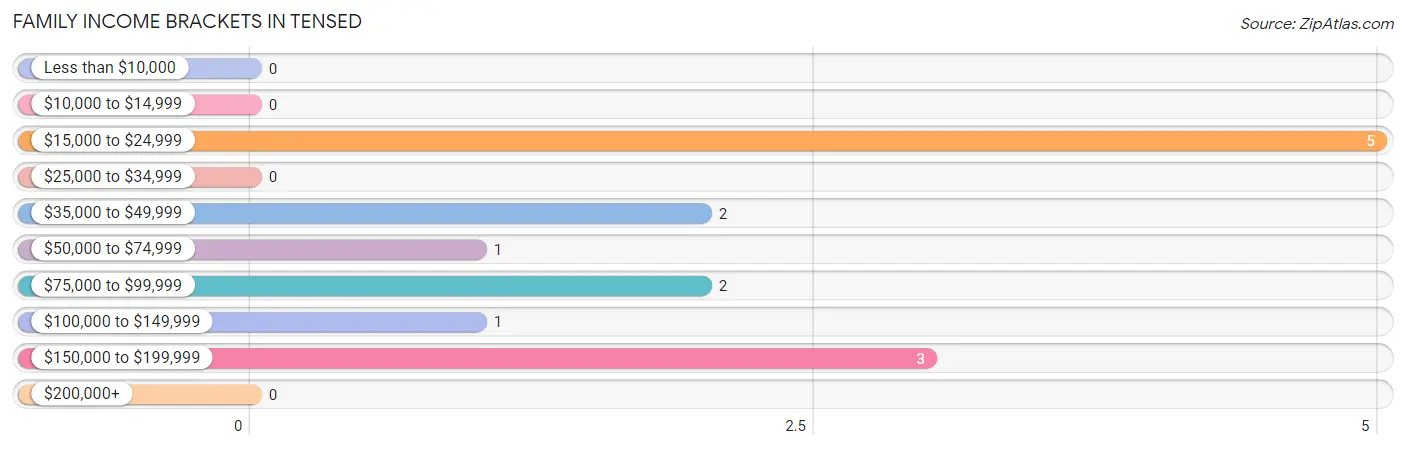
| Income Bracket | # Families | % Families |
| Less than $10,000 | 0 | 0.0% |
| $10,000 to $14,999 | 0 | 0.0% |
| $15,000 to $24,999 | 5 | 35.7% |
| $25,000 to $34,999 | 0 | 0.0% |
| $35,000 to $49,999 | 2 | 14.3% |
| $50,000 to $74,999 | 1 | 7.1% |
| $75,000 to $99,999 | 2 | 14.3% |
| $100,000 to $149,999 | 1 | 7.1% |
| $150,000 to $199,999 | 3 | 21.4% |
| $200,000+ | 0 | 0.0% |
Family Income by Famaliy Size in Tensed
| Income Bracket | # Families | Median Income |
| 2-Person Families | 9 (64.3%) | $0 |
| 3-Person Families | 2 (14.3%) | $0 |
| 4-Person Families | 0 (0.0%) | $0 |
| 5-Person Families | 3 (21.4%) | $0 |
| 6-Person Families | 0 (0.0%) | $0 |
| 7+ Person Families | 0 (0.0%) | $0 |
| Total | 14 (100.0%) | $0 |
Family Income by Number of Earners in Tensed
| Number of Earners | # Families | Median Income |
| No Earners | 3 (21.4%) | $0 |
| 1 Earner | 4 (28.6%) | $0 |
| 2 Earners | 4 (28.6%) | $0 |
| 3+ Earners | 3 (21.4%) | $0 |
| Total | 14 (100.0%) | $0 |
Household Income in Tensed
Household Income Brackets in Tensed
With 12 households falling in the category, the $15,000 to $24,999 income range is the most frequent in Tensed, accounting for 28.6% of all households.
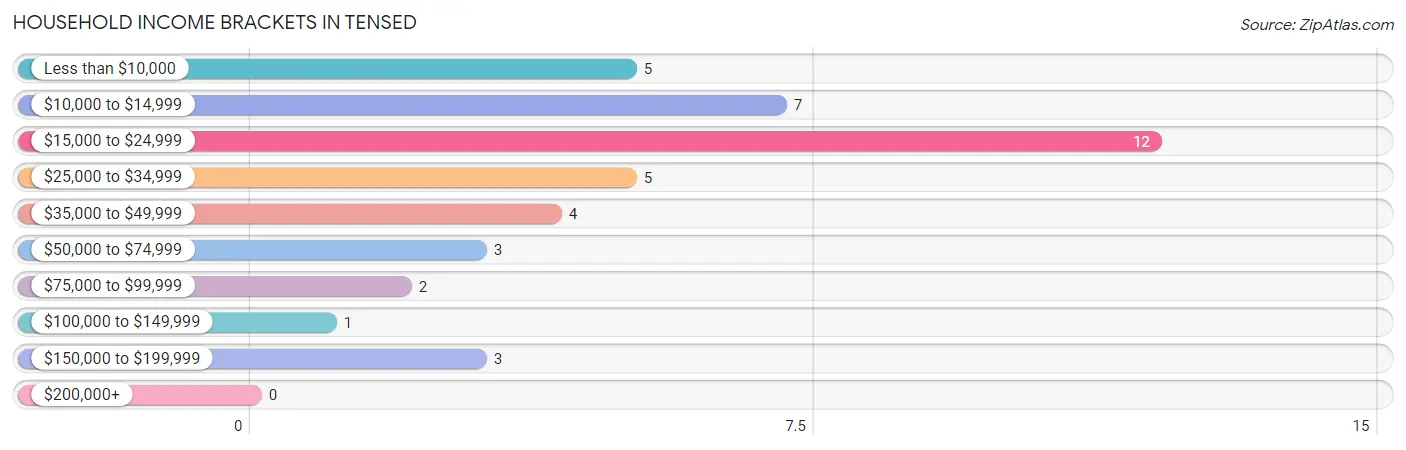
| Income Bracket | # Households | % Households |
| Less than $10,000 | 5 | 11.9% |
| $10,000 to $14,999 | 7 | 16.7% |
| $15,000 to $24,999 | 12 | 28.6% |
| $25,000 to $34,999 | 5 | 11.9% |
| $35,000 to $49,999 | 4 | 9.5% |
| $50,000 to $74,999 | 3 | 7.1% |
| $75,000 to $99,999 | 2 | 4.8% |
| $100,000 to $149,999 | 1 | 2.4% |
| $150,000 to $199,999 | 3 | 7.1% |
| $200,000+ | 0 | 0.0% |
Household Income by Householder Age in Tensed
The median household income in Tensed is $23,750, with the highest median household income of $56,250 found in the 25 to 44 years age bracket for the primary householder. A total of 3 households (7.1%) fall into this category. Meanwhile, the 15 to 24 years age bracket for the primary householder has the lowest median household income of $0, with 1 households (2.4%) in this group.
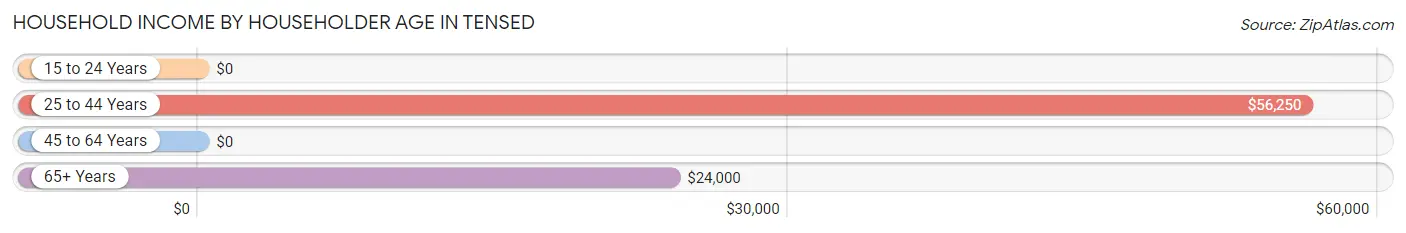
| Income Bracket | # Households | Median Income |
| 15 to 24 Years | 1 (2.4%) | $0 |
| 25 to 44 Years | 3 (7.1%) | $56,250 |
| 45 to 64 Years | 20 (47.6%) | $0 |
| 65+ Years | 18 (42.9%) | $24,000 |
| Total | 42 (100.0%) | $23,750 |
Poverty in Tensed
Income Below Poverty by Sex and Age in Tensed
With 22.2% poverty level for males and 27.8% for females among the residents of Tensed, 45 to 54 year old males and 25 to 34 year old females are the most vulnerable to poverty, with 4 males (100.0%) and 1 females (50.0%) in their respective age groups living below the poverty level.
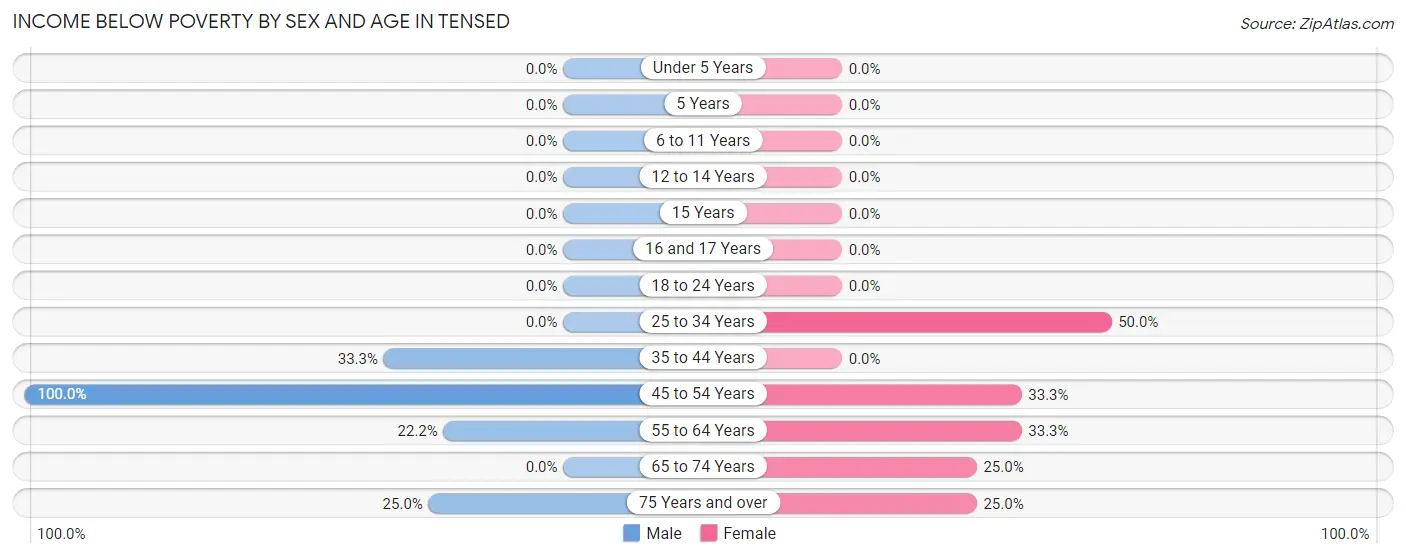
| Age Bracket | Male | Female |
| Under 5 Years | 0 (0.0%) | 0 (0.0%) |
| 5 Years | 0 (0.0%) | 0 (0.0%) |
| 6 to 11 Years | 0 (0.0%) | 0 (0.0%) |
| 12 to 14 Years | 0 (0.0%) | 0 (0.0%) |
| 15 Years | 0 (0.0%) | 0 (0.0%) |
| 16 and 17 Years | 0 (0.0%) | 0 (0.0%) |
| 18 to 24 Years | 0 (0.0%) | 0 (0.0%) |
| 25 to 34 Years | 0 (0.0%) | 1 (50.0%) |
| 35 to 44 Years | 1 (33.3%) | 0 (0.0%) |
| 45 to 54 Years | 4 (100.0%) | 4 (33.3%) |
| 55 to 64 Years | 2 (22.2%) | 2 (33.3%) |
| 65 to 74 Years | 0 (0.0%) | 2 (25.0%) |
| 75 Years and over | 1 (25.0%) | 1 (25.0%) |
| Total | 8 (22.2%) | 10 (27.8%) |
Income Above Poverty by Sex and Age in Tensed
According to the poverty statistics in Tensed, males aged 12 to 14 years and females aged under 5 years are the age groups that are most secure financially, with 100.0% of males and 100.0% of females in these age groups living above the poverty line.
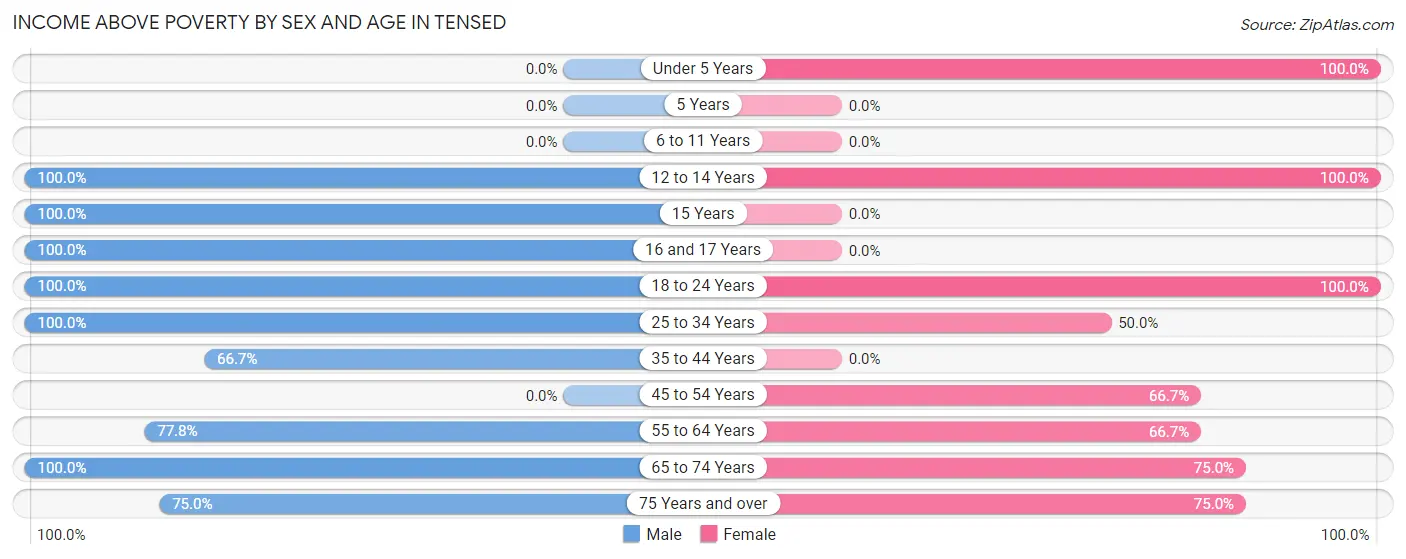
| Age Bracket | Male | Female |
| Under 5 Years | 0 (0.0%) | 1 (100.0%) |
| 5 Years | 0 (0.0%) | 0 (0.0%) |
| 6 to 11 Years | 0 (0.0%) | 0 (0.0%) |
| 12 to 14 Years | 3 (100.0%) | 2 (100.0%) |
| 15 Years | 1 (100.0%) | 0 (0.0%) |
| 16 and 17 Years | 1 (100.0%) | 0 (0.0%) |
| 18 to 24 Years | 6 (100.0%) | 1 (100.0%) |
| 25 to 34 Years | 1 (100.0%) | 1 (50.0%) |
| 35 to 44 Years | 2 (66.7%) | 0 (0.0%) |
| 45 to 54 Years | 0 (0.0%) | 8 (66.7%) |
| 55 to 64 Years | 7 (77.8%) | 4 (66.7%) |
| 65 to 74 Years | 4 (100.0%) | 6 (75.0%) |
| 75 Years and over | 3 (75.0%) | 3 (75.0%) |
| Total | 28 (77.8%) | 26 (72.2%) |
Income Below Poverty Among Married-Couple Families in Tensed
The poverty statistics for married-couple families in Tensed show that 28.6% or 2 of the total 7 families live below the poverty line. Families with no children have the highest poverty rate of 33.3%, comprising of 2 families. On the other hand, families with 1 or 2 children have the lowest poverty rate of 0.0%, which includes 0 families.
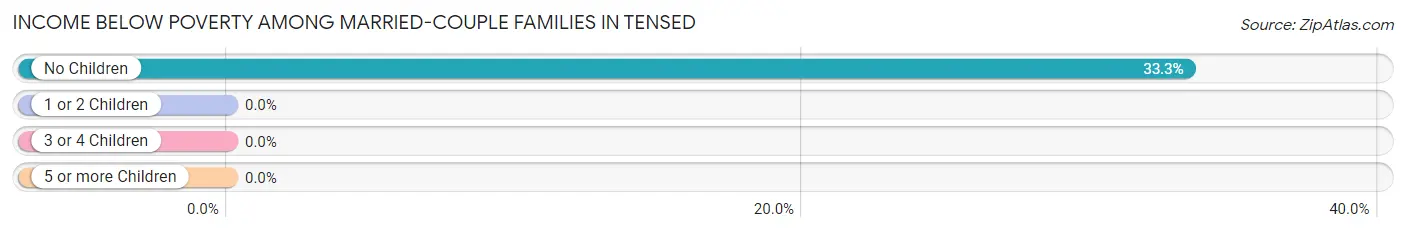
| Children | Above Poverty | Below Poverty |
| No Children | 4 (66.7%) | 2 (33.3%) |
| 1 or 2 Children | 1 (100.0%) | 0 (0.0%) |
| 3 or 4 Children | 0 (0.0%) | 0 (0.0%) |
| 5 or more Children | 0 (0.0%) | 0 (0.0%) |
| Total | 5 (71.4%) | 2 (28.6%) |
Income Below Poverty Among Single-Parent Households in Tensed
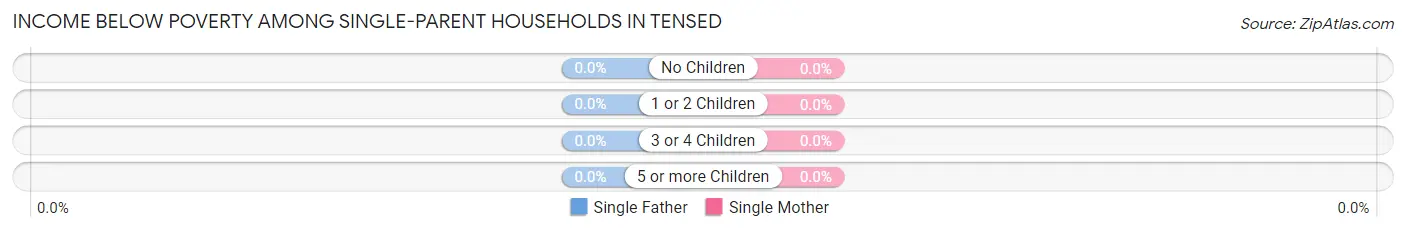
| Children | Single Father | Single Mother |
| No Children | 0 (0.0%) | 0 (0.0%) |
| 1 or 2 Children | 0 (0.0%) | 0 (0.0%) |
| 3 or 4 Children | 0 (0.0%) | 0 (0.0%) |
| 5 or more Children | 0 (0.0%) | 0 (0.0%) |
| Total | 0 (0.0%) | 0 (0.0%) |
Income Below Poverty Among Married-Couple vs Single-Parent Households in Tensed
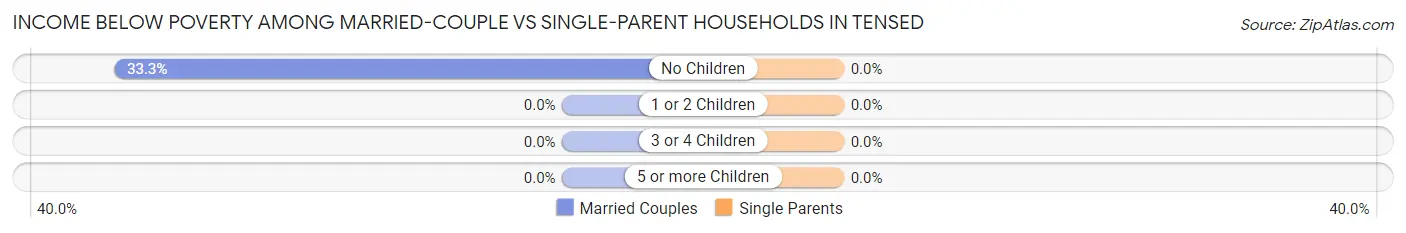
| Children | Married-Couple Families | Single-Parent Households |
| No Children | 2 (33.3%) | 0 (0.0%) |
| 1 or 2 Children | 0 (0.0%) | 0 (0.0%) |
| 3 or 4 Children | 0 (0.0%) | 0 (0.0%) |
| 5 or more Children | 0 (0.0%) | 0 (0.0%) |
| Total | 2 (28.6%) | 0 (0.0%) |
Employment Characteristics in Tensed
Employment by Class of Employer in Tensed
Among the 23 employed individuals in Tensed, private company employees (9 | 39.1%), local government employees (9 | 39.1%), and not-for-profit organizations (3 | 13.0%) make up the most common classes of employment.
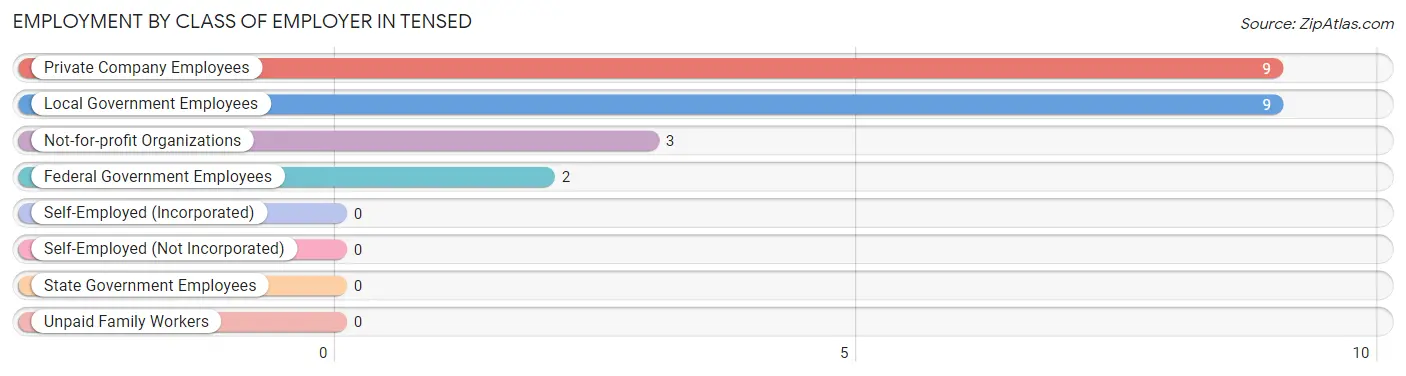
| Employer Class | # Employees | % Employees |
| Private Company Employees | 9 | 39.1% |
| Self-Employed (Incorporated) | 0 | 0.0% |
| Self-Employed (Not Incorporated) | 0 | 0.0% |
| Not-for-profit Organizations | 3 | 13.0% |
| Local Government Employees | 9 | 39.1% |
| State Government Employees | 0 | 0.0% |
| Federal Government Employees | 2 | 8.7% |
| Unpaid Family Workers | 0 | 0.0% |
| Total | 23 | 100.0% |
Employment Status by Age in Tensed
According to the labor force statistics for Tensed, out of the total population over 16 years of age (65), 40.0% or 26 individuals are in the labor force, with 7.7% or 2 of them unemployed. The age group with the highest labor force participation rate is 20 to 24 years, with 100.0% or 6 individuals in the labor force. Within the labor force, the 30 to 34 years age range has the highest percentage of unemployed individuals, with 100.0% or 1 of them being unemployed.
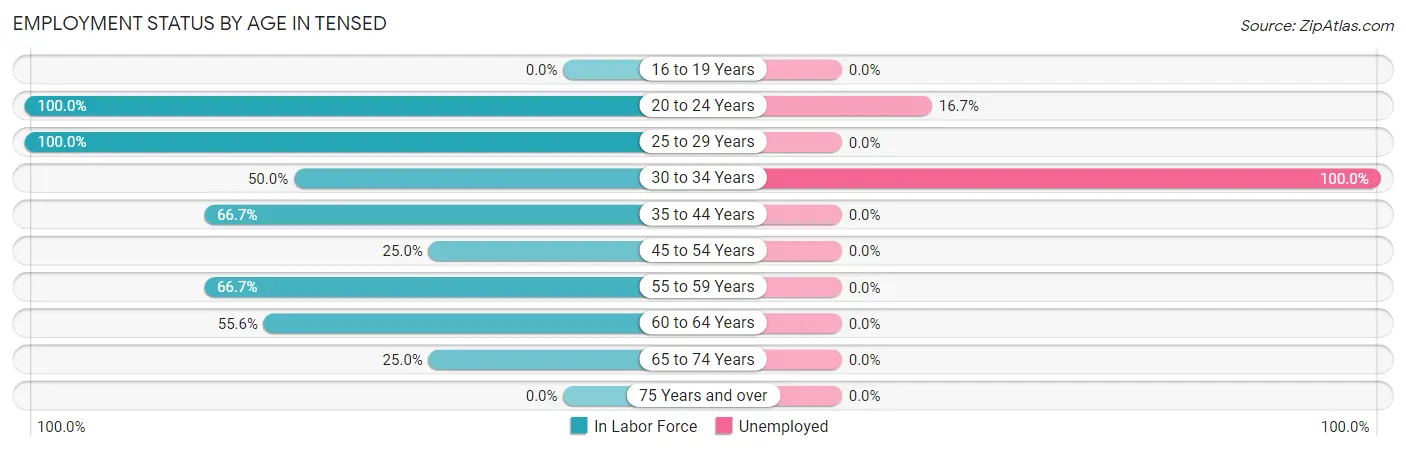
| Age Bracket | In Labor Force | Unemployed |
| 16 to 19 Years | 0 (0.0%) | 0 (0.0%) |
| 20 to 24 Years | 6 (100.0%) | 1 (16.7%) |
| 25 to 29 Years | 1 (100.0%) | 0 (0.0%) |
| 30 to 34 Years | 1 (50.0%) | 1 (100.0%) |
| 35 to 44 Years | 2 (66.7%) | 0 (0.0%) |
| 45 to 54 Years | 4 (25.0%) | 0 (0.0%) |
| 55 to 59 Years | 4 (66.7%) | 0 (0.0%) |
| 60 to 64 Years | 5 (55.6%) | 0 (0.0%) |
| 65 to 74 Years | 3 (25.0%) | 0 (0.0%) |
| 75 Years and over | 0 (0.0%) | 0 (0.0%) |
| Total | 26 (40.0%) | 2 (7.7%) |
Employment Status by Educational Attainment in Tensed
According to labor force statistics for Tensed, 45.9% of individuals (17) out of the total population between 25 and 64 years of age (37) are in the labor force, with 5.9% or 1 of them being unemployed. The group with the highest labor force participation rate are those with the educational attainment of bachelor's degree or higher, with 100.0% or 7 individuals in the labor force. Within the labor force, individuals with high school diploma education have the highest percentage of unemployment, with 16.7% or 1 of them being unemployed.
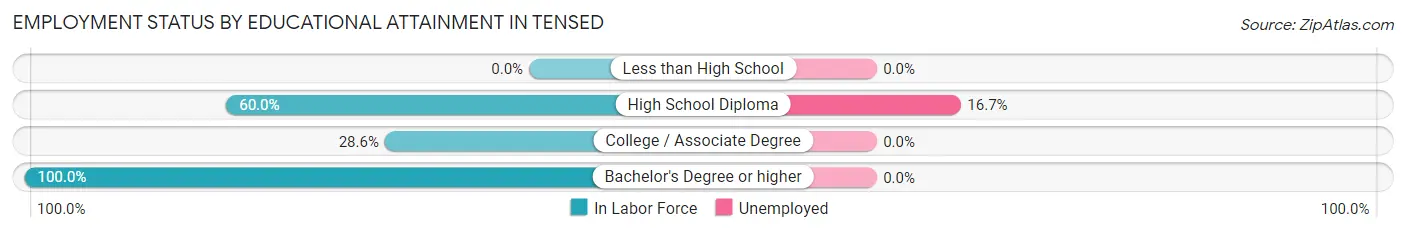
| Educational Attainment | In Labor Force | Unemployed |
| Less than High School | 0 (0.0%) | 0 (0.0%) |
| High School Diploma | 6 (60.0%) | 2 (16.7%) |
| College / Associate Degree | 4 (28.6%) | 0 (0.0%) |
| Bachelor's Degree or higher | 7 (100.0%) | 0 (0.0%) |
| Total | 17 (45.9%) | 2 (5.9%) |
Employment Occupations by Sex in Tensed
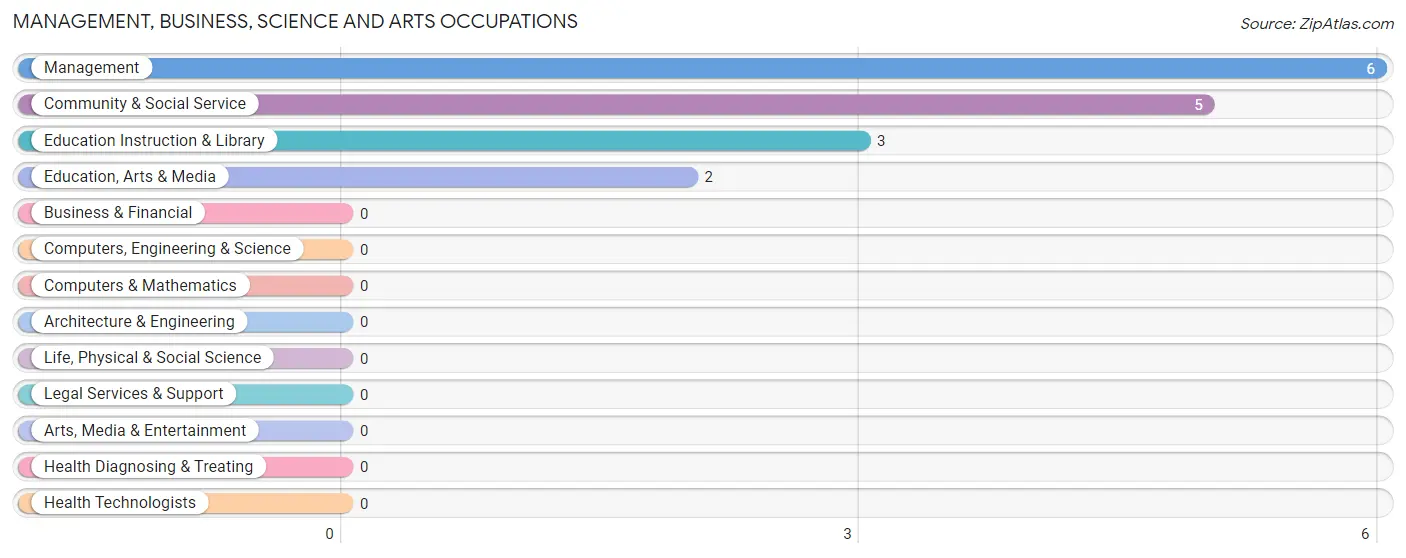
Management, Business, Science and Arts Occupations
The most common Management, Business, Science and Arts occupations in Tensed are Management (6 | 25.0%), Community & Social Service (5 | 20.8%), Education Instruction & Library (3 | 12.5%), and Education, Arts & Media (2 | 8.3%).
Management, Business, Science and Arts Occupations by Sex
Within the Management, Business, Science and Arts occupations in Tensed, the most male-oriented occupations are Education, Arts & Media (100.0%), Management (50.0%), and Community & Social Service (40.0%), while the most female-oriented occupations are Education Instruction & Library (100.0%), Community & Social Service (60.0%), and Management (50.0%).
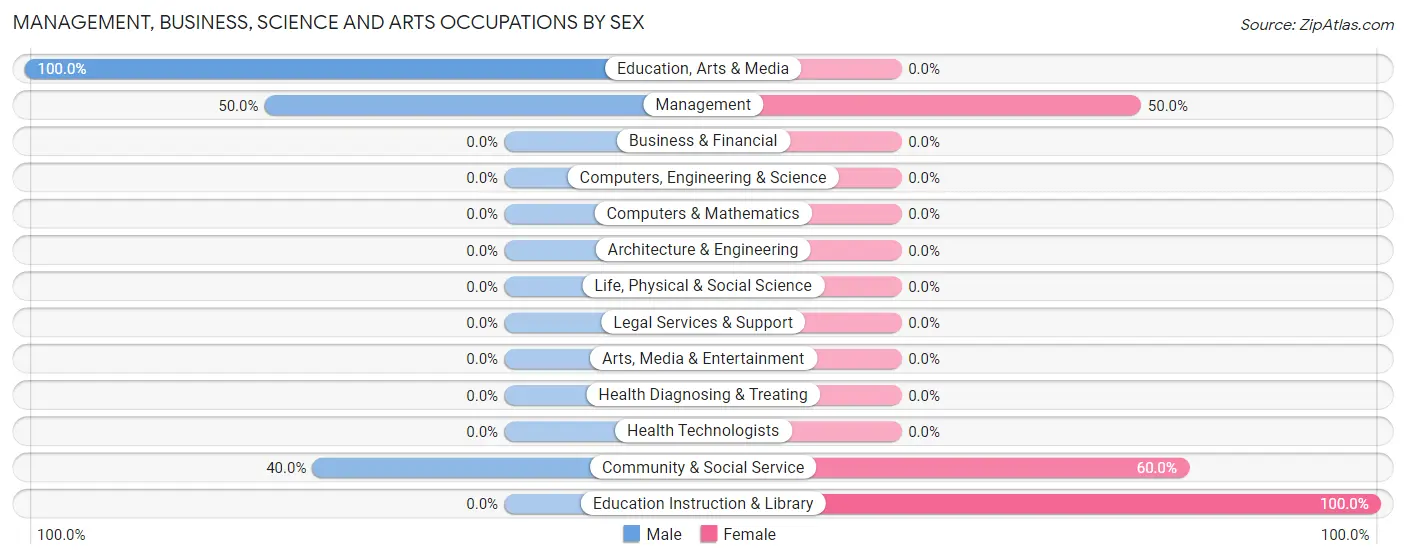
| Occupation | Male | Female |
| Management | 3 (50.0%) | 3 (50.0%) |
| Business & Financial | 0 (0.0%) | 0 (0.0%) |
| Computers, Engineering & Science | 0 (0.0%) | 0 (0.0%) |
| Computers & Mathematics | 0 (0.0%) | 0 (0.0%) |
| Architecture & Engineering | 0 (0.0%) | 0 (0.0%) |
| Life, Physical & Social Science | 0 (0.0%) | 0 (0.0%) |
| Community & Social Service | 2 (40.0%) | 3 (60.0%) |
| Education, Arts & Media | 2 (100.0%) | 0 (0.0%) |
| Legal Services & Support | 0 (0.0%) | 0 (0.0%) |
| Education Instruction & Library | 0 (0.0%) | 3 (100.0%) |
| Arts, Media & Entertainment | 0 (0.0%) | 0 (0.0%) |
| Health Diagnosing & Treating | 0 (0.0%) | 0 (0.0%) |
| Health Technologists | 0 (0.0%) | 0 (0.0%) |
| Total (Category) | 5 (45.5%) | 6 (54.5%) |
| Total (Overall) | 12 (50.0%) | 12 (50.0%) |
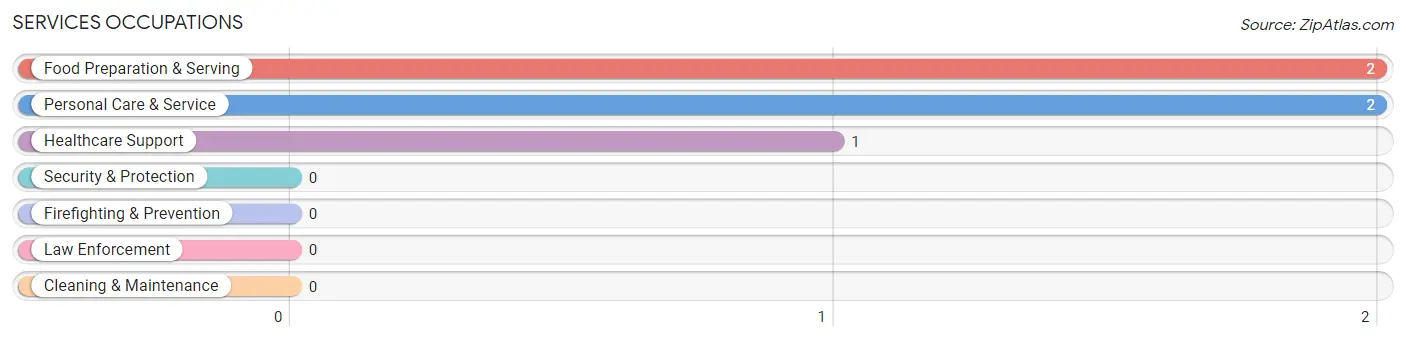
Services Occupations
The most common Services occupations in Tensed are Food Preparation & Serving (2 | 8.3%), Personal Care & Service (2 | 8.3%), and Healthcare Support (1 | 4.2%).
Services Occupations by Sex
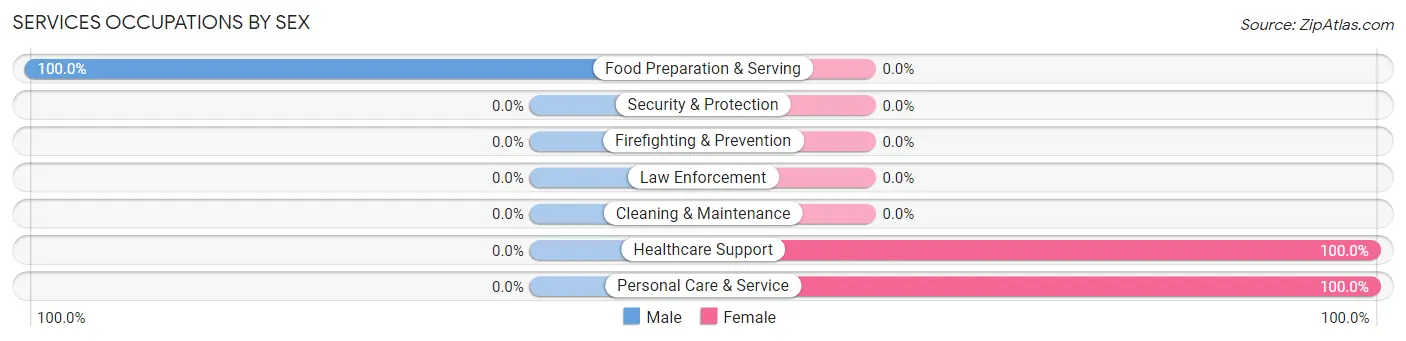
| Occupation | Male | Female |
| Healthcare Support | 0 (0.0%) | 1 (100.0%) |
| Security & Protection | 0 (0.0%) | 0 (0.0%) |
| Firefighting & Prevention | 0 (0.0%) | 0 (0.0%) |
| Law Enforcement | 0 (0.0%) | 0 (0.0%) |
| Food Preparation & Serving | 2 (100.0%) | 0 (0.0%) |
| Cleaning & Maintenance | 0 (0.0%) | 0 (0.0%) |
| Personal Care & Service | 0 (0.0%) | 2 (100.0%) |
| Total (Category) | 2 (40.0%) | 3 (60.0%) |
| Total (Overall) | 12 (50.0%) | 12 (50.0%) |
Sales and Office Occupations
The most common Sales and Office occupations in Tensed are Office & Administration (2 | 8.3%), and Sales & Related (1 | 4.2%).
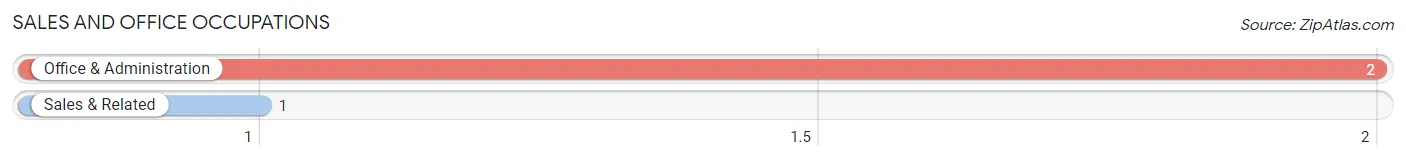
Sales and Office Occupations by Sex
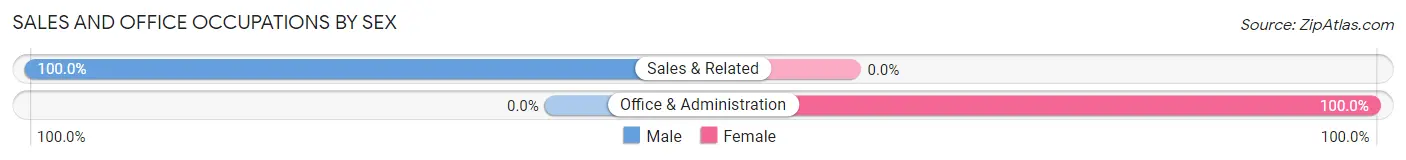
| Occupation | Male | Female |
| Sales & Related | 1 (100.0%) | 0 (0.0%) |
| Office & Administration | 0 (0.0%) | 2 (100.0%) |
| Total (Category) | 1 (33.3%) | 2 (66.7%) |
| Total (Overall) | 12 (50.0%) | 12 (50.0%) |
Natural Resources, Construction and Maintenance Occupations
The most common Natural Resources, Construction and Maintenance occupations in Tensed are , and Construction & Extraction (1 | 4.2%).
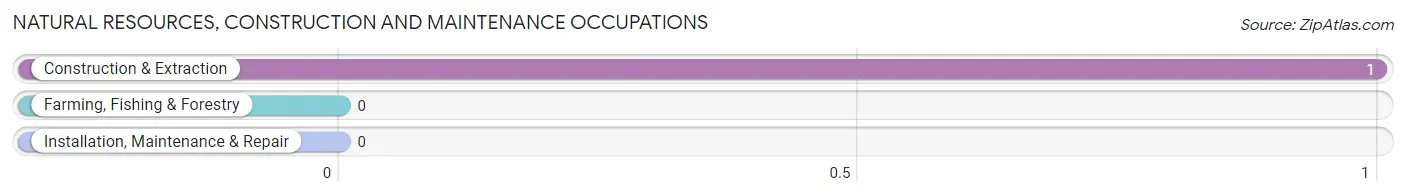
Natural Resources, Construction and Maintenance Occupations by Sex
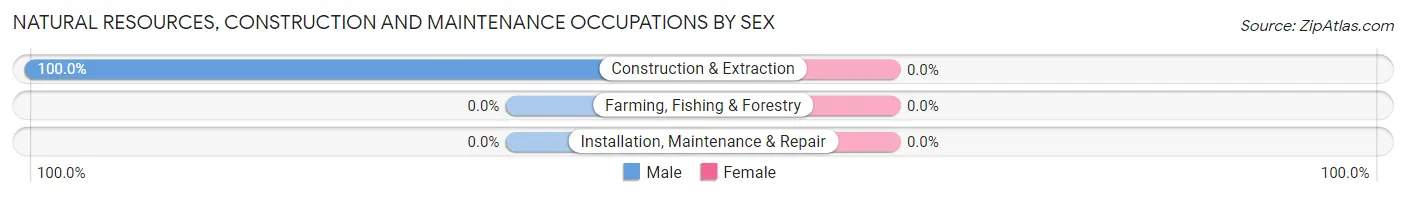
| Occupation | Male | Female |
| Farming, Fishing & Forestry | 0 (0.0%) | 0 (0.0%) |
| Construction & Extraction | 1 (100.0%) | 0 (0.0%) |
| Installation, Maintenance & Repair | 0 (0.0%) | 0 (0.0%) |
| Total (Category) | 1 (100.0%) | 0 (0.0%) |
| Total (Overall) | 12 (50.0%) | 12 (50.0%) |
Production, Transportation and Moving Occupations
The most common Production, Transportation and Moving occupations in Tensed are Production (3 | 12.5%), and Material Moving (1 | 4.2%).
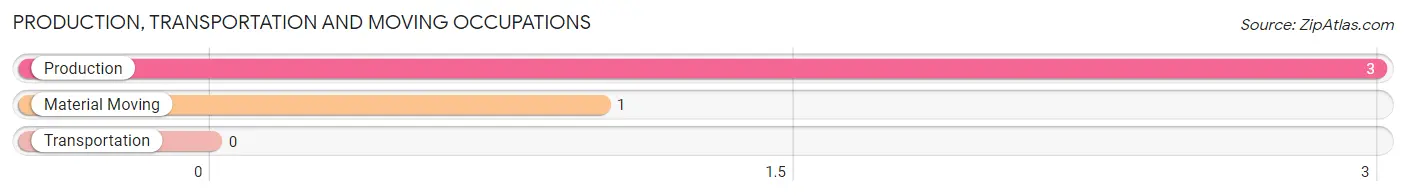
Production, Transportation and Moving Occupations by Sex
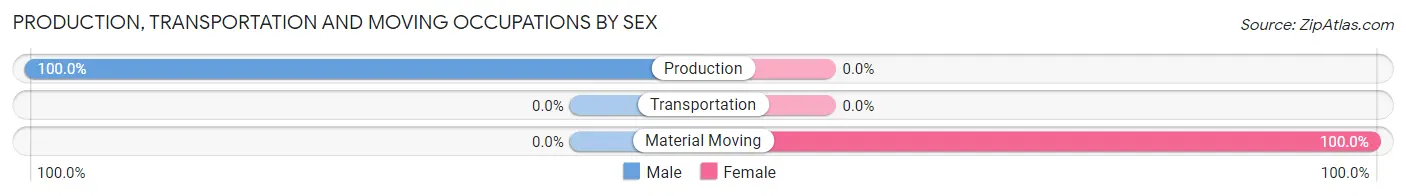
| Occupation | Male | Female |
| Production | 3 (100.0%) | 0 (0.0%) |
| Transportation | 0 (0.0%) | 0 (0.0%) |
| Material Moving | 0 (0.0%) | 1 (100.0%) |
| Total (Category) | 3 (75.0%) | 1 (25.0%) |
| Total (Overall) | 12 (50.0%) | 12 (50.0%) |
Employment Industries by Sex in Tensed
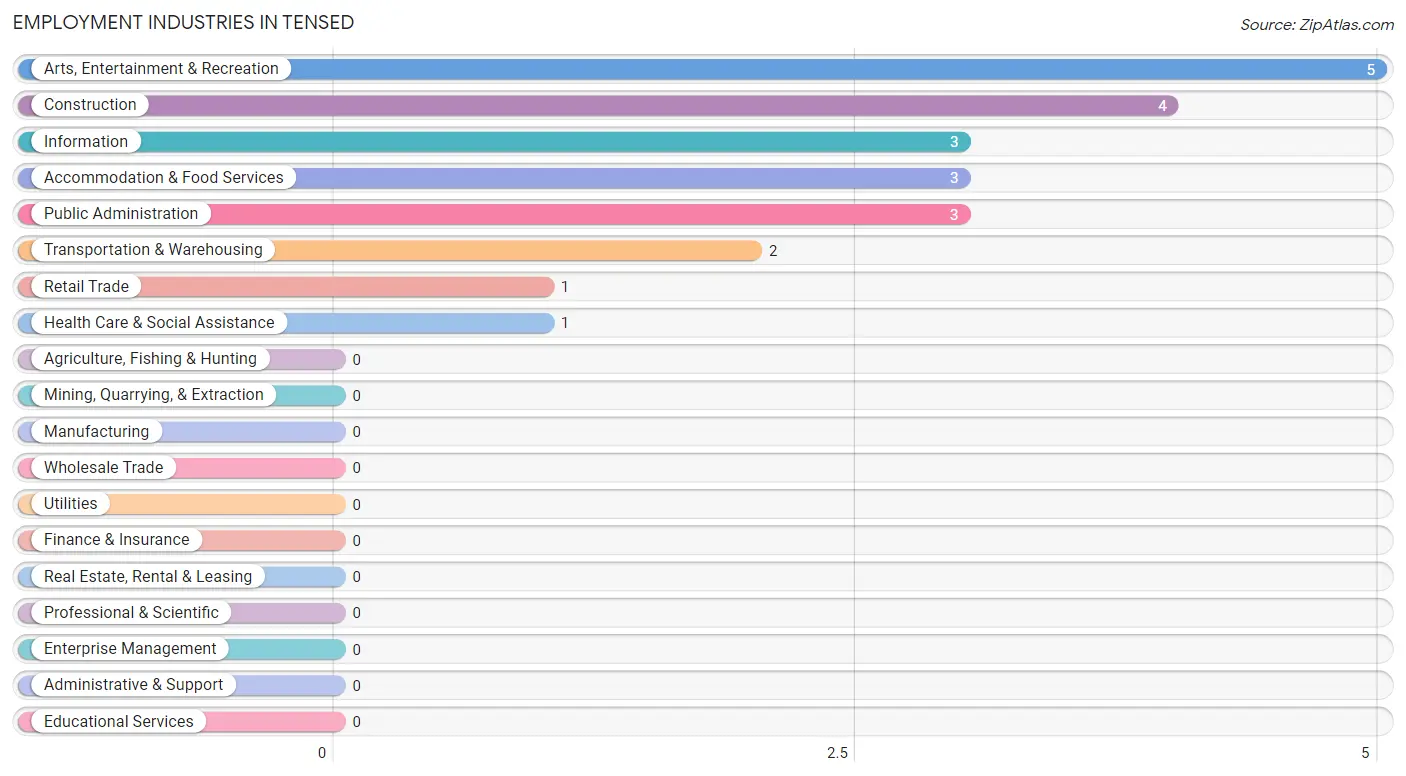
Employment Industries in Tensed
The major employment industries in Tensed include Arts, Entertainment & Recreation (5 | 20.8%), Construction (4 | 16.7%), Information (3 | 12.5%), Accommodation & Food Services (3 | 12.5%), and Public Administration (3 | 12.5%).
Employment Industries by Sex in Tensed
The Tensed industries that see more men than women are Construction (100.0%), Retail Trade (100.0%), and Public Administration (100.0%), whereas the industries that tend to have a higher number of women are Transportation & Warehousing (100.0%), Information (100.0%), and Health Care & Social Assistance (100.0%).
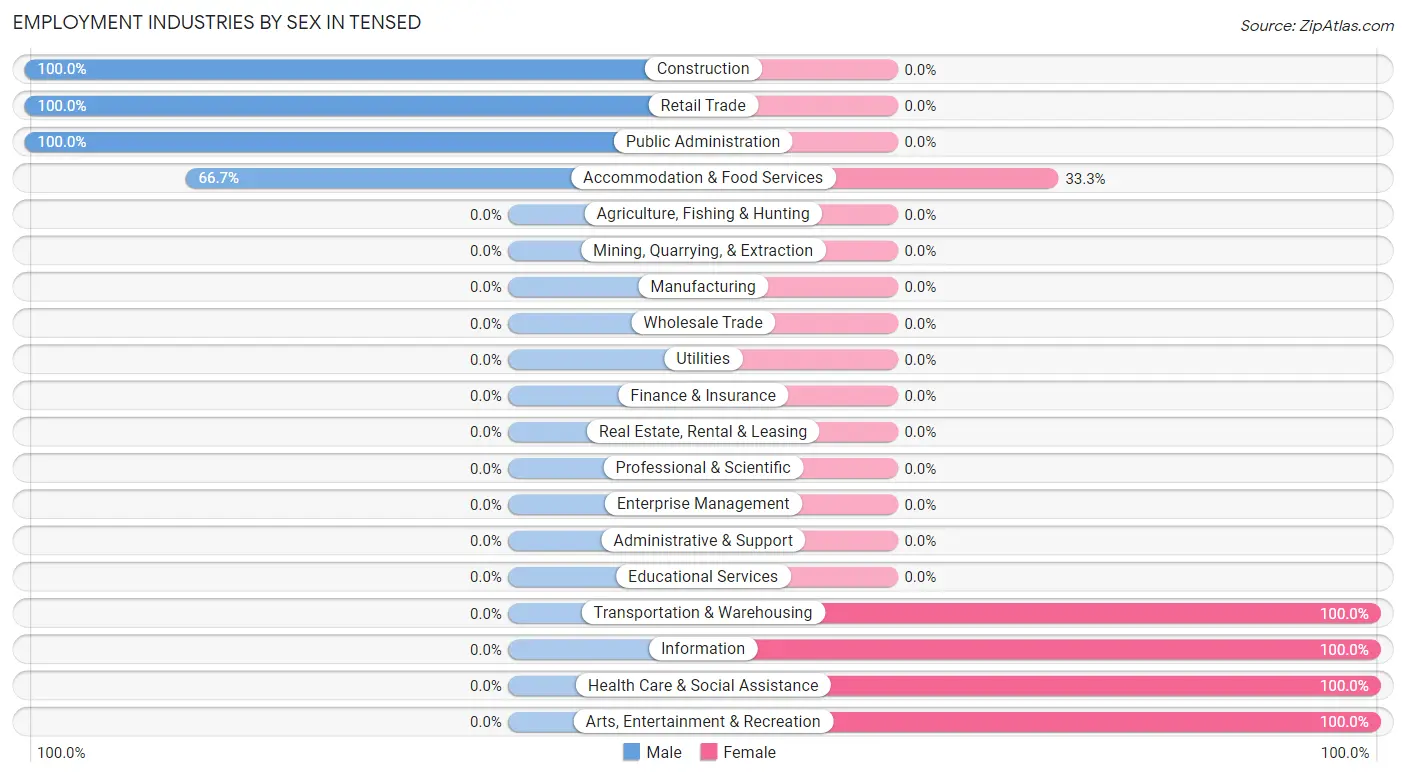
| Industry | Male | Female |
| Agriculture, Fishing & Hunting | 0 (0.0%) | 0 (0.0%) |
| Mining, Quarrying, & Extraction | 0 (0.0%) | 0 (0.0%) |
| Construction | 4 (100.0%) | 0 (0.0%) |
| Manufacturing | 0 (0.0%) | 0 (0.0%) |
| Wholesale Trade | 0 (0.0%) | 0 (0.0%) |
| Retail Trade | 1 (100.0%) | 0 (0.0%) |
| Transportation & Warehousing | 0 (0.0%) | 2 (100.0%) |
| Utilities | 0 (0.0%) | 0 (0.0%) |
| Information | 0 (0.0%) | 3 (100.0%) |
| Finance & Insurance | 0 (0.0%) | 0 (0.0%) |
| Real Estate, Rental & Leasing | 0 (0.0%) | 0 (0.0%) |
| Professional & Scientific | 0 (0.0%) | 0 (0.0%) |
| Enterprise Management | 0 (0.0%) | 0 (0.0%) |
| Administrative & Support | 0 (0.0%) | 0 (0.0%) |
| Educational Services | 0 (0.0%) | 0 (0.0%) |
| Health Care & Social Assistance | 0 (0.0%) | 1 (100.0%) |
| Arts, Entertainment & Recreation | 0 (0.0%) | 5 (100.0%) |
| Accommodation & Food Services | 2 (66.7%) | 1 (33.3%) |
| Public Administration | 3 (100.0%) | 0 (0.0%) |
| Total | 12 (50.0%) | 12 (50.0%) |
Education in Tensed
School Enrollment in Tensed
The most common levels of schooling among the 8 students in Tensed are high school (4 | 50.0%), middle school (3 | 37.5%), and graduate / professional (1 | 12.5%).
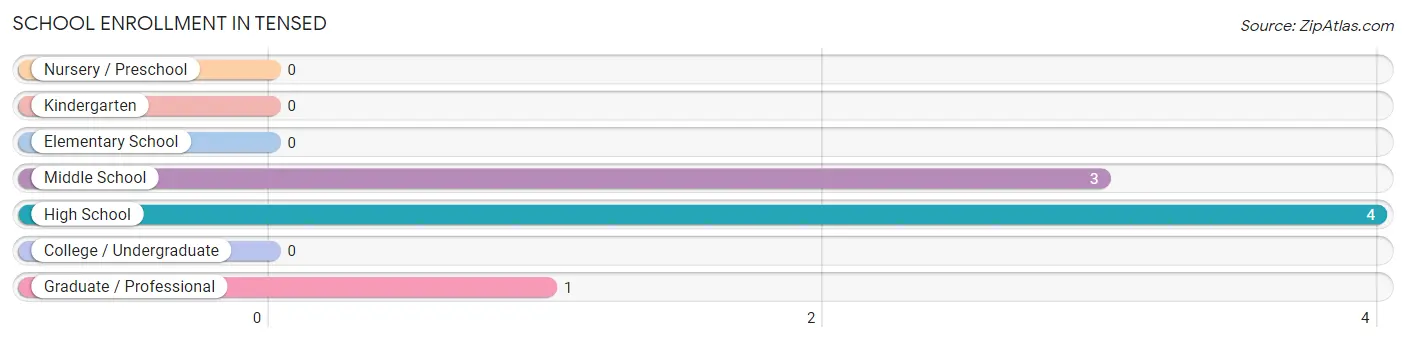
| School Level | # Students | % Students |
| Nursery / Preschool | 0 | 0.0% |
| Kindergarten | 0 | 0.0% |
| Elementary School | 0 | 0.0% |
| Middle School | 3 | 37.5% |
| High School | 4 | 50.0% |
| College / Undergraduate | 0 | 0.0% |
| Graduate / Professional | 1 | 12.5% |
| Total | 8 | 100.0% |
School Enrollment by Age by Funding Source in Tensed
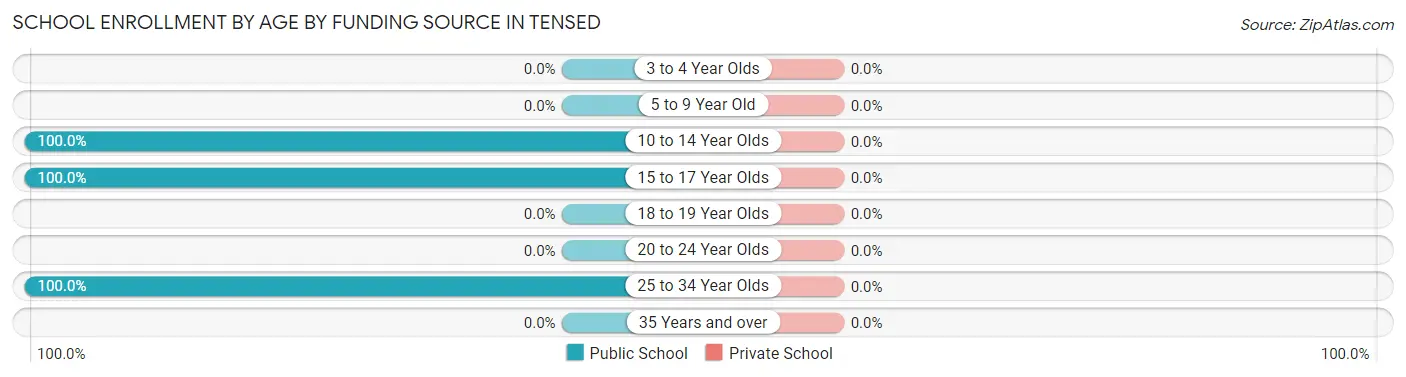
| Age Bracket | Public School | Private School |
| 3 to 4 Year Olds | 0 (0.0%) | 0 (0.0%) |
| 5 to 9 Year Old | 0 (0.0%) | 0 (0.0%) |
| 10 to 14 Year Olds | 5 (100.0%) | 0 (0.0%) |
| 15 to 17 Year Olds | 2 (100.0%) | 0 (0.0%) |
| 18 to 19 Year Olds | 0 (0.0%) | 0 (0.0%) |
| 20 to 24 Year Olds | 0 (0.0%) | 0 (0.0%) |
| 25 to 34 Year Olds | 1 (100.0%) | 0 (0.0%) |
| 35 Years and over | 0 (0.0%) | 0 (0.0%) |
| Total | 8 (100.0%) | 0 (0.0%) |
Educational Attainment by Field of Study in Tensed
Social sciences (3 | 27.3%), liberal arts & history (3 | 27.3%), arts & humanities (3 | 27.3%), multidisciplinary studies (1 | 9.1%), and education (1 | 9.1%) are the most common fields of study among 11 individuals in Tensed who have obtained a bachelor's degree or higher.
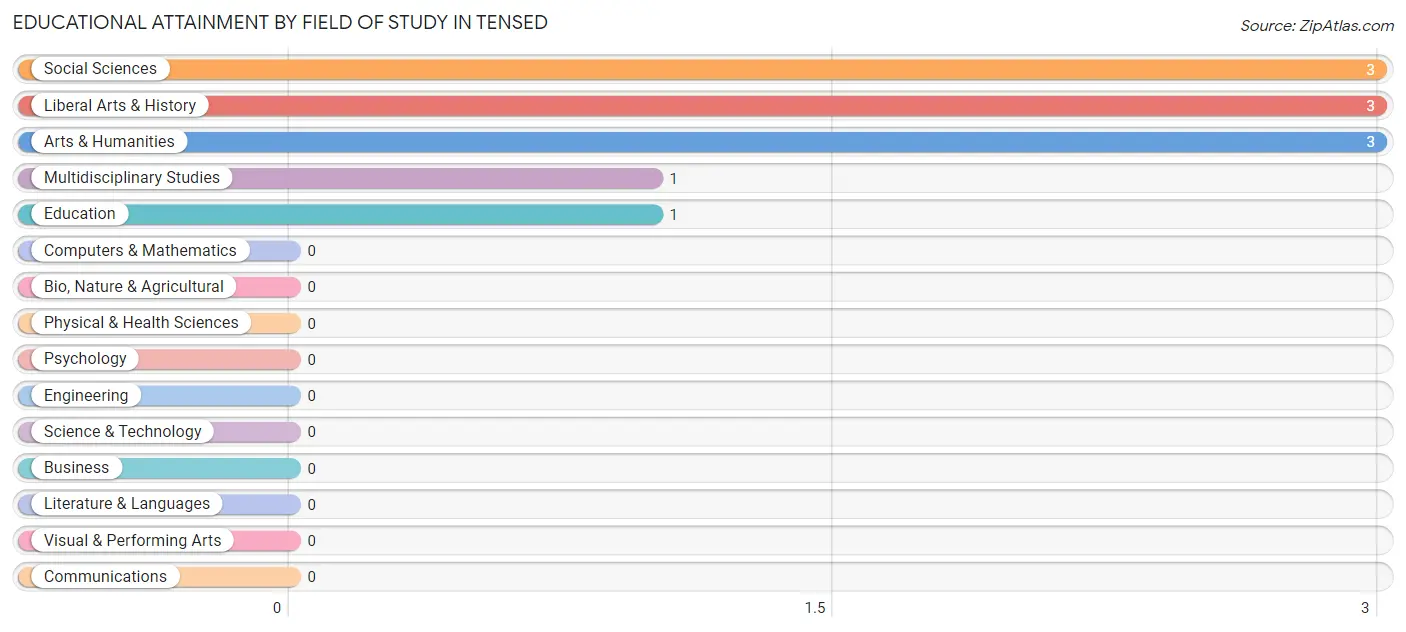
| Field of Study | # Graduates | % Graduates |
| Computers & Mathematics | 0 | 0.0% |
| Bio, Nature & Agricultural | 0 | 0.0% |
| Physical & Health Sciences | 0 | 0.0% |
| Psychology | 0 | 0.0% |
| Social Sciences | 3 | 27.3% |
| Engineering | 0 | 0.0% |
| Multidisciplinary Studies | 1 | 9.1% |
| Science & Technology | 0 | 0.0% |
| Business | 0 | 0.0% |
| Education | 1 | 9.1% |
| Literature & Languages | 0 | 0.0% |
| Liberal Arts & History | 3 | 27.3% |
| Visual & Performing Arts | 0 | 0.0% |
| Communications | 0 | 0.0% |
| Arts & Humanities | 3 | 27.3% |
| Total | 11 | 100.0% |
Transportation & Commute in Tensed
Vehicle Availability by Sex in Tensed
The most prevalent vehicle ownership categories in Tensed are males with 2 vehicles (6, accounting for 50.0%) and females with 2 vehicles (5, making up 54.5%).
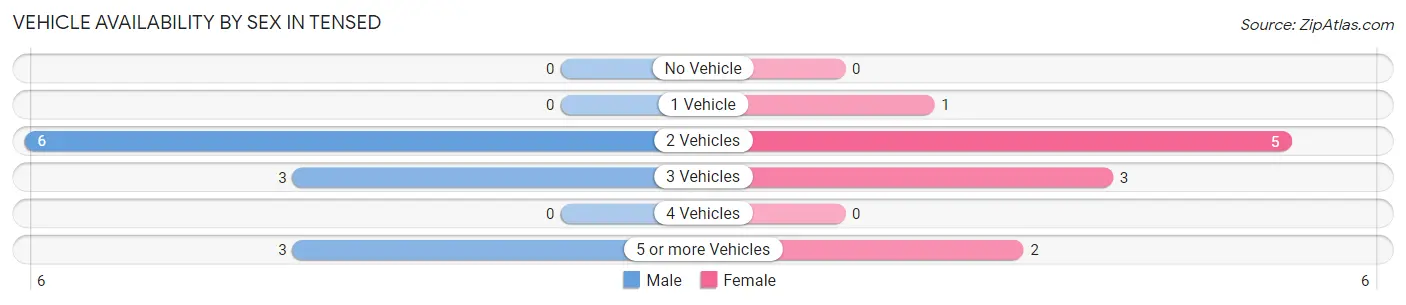
| Vehicles Available | Male | Female |
| No Vehicle | 0 (0.0%) | 0 (0.0%) |
| 1 Vehicle | 0 (0.0%) | 1 (9.1%) |
| 2 Vehicles | 6 (50.0%) | 5 (45.5%) |
| 3 Vehicles | 3 (25.0%) | 3 (27.3%) |
| 4 Vehicles | 0 (0.0%) | 0 (0.0%) |
| 5 or more Vehicles | 3 (25.0%) | 2 (18.2%) |
| Total | 12 (100.0%) | 11 (100.0%) |
Commute Time in Tensed
The most frequently occuring commute durations in Tensed are 60 to 89 minutes (5 commuters, 23.8%), less than 5 minutes (3 commuters, 14.3%), and 5 to 9 minutes (3 commuters, 14.3%).

| Commute Time | # Commuters | % Commuters |
| Less than 5 Minutes | 3 | 14.3% |
| 5 to 9 Minutes | 3 | 14.3% |
| 10 to 14 Minutes | 0 | 0.0% |
| 15 to 19 Minutes | 1 | 4.8% |
| 20 to 24 Minutes | 2 | 9.5% |
| 25 to 29 Minutes | 2 | 9.5% |
| 30 to 34 Minutes | 3 | 14.3% |
| 35 to 39 Minutes | 0 | 0.0% |
| 40 to 44 Minutes | 0 | 0.0% |
| 45 to 59 Minutes | 0 | 0.0% |
| 60 to 89 Minutes | 5 | 23.8% |
| 90 or more Minutes | 2 | 9.5% |
Commute Time by Sex in Tensed
The most common commute times in Tensed are 60 to 89 minutes (4 commuters, 40.0%) for males and 5 to 9 minutes (3 commuters, 27.3%) for females.
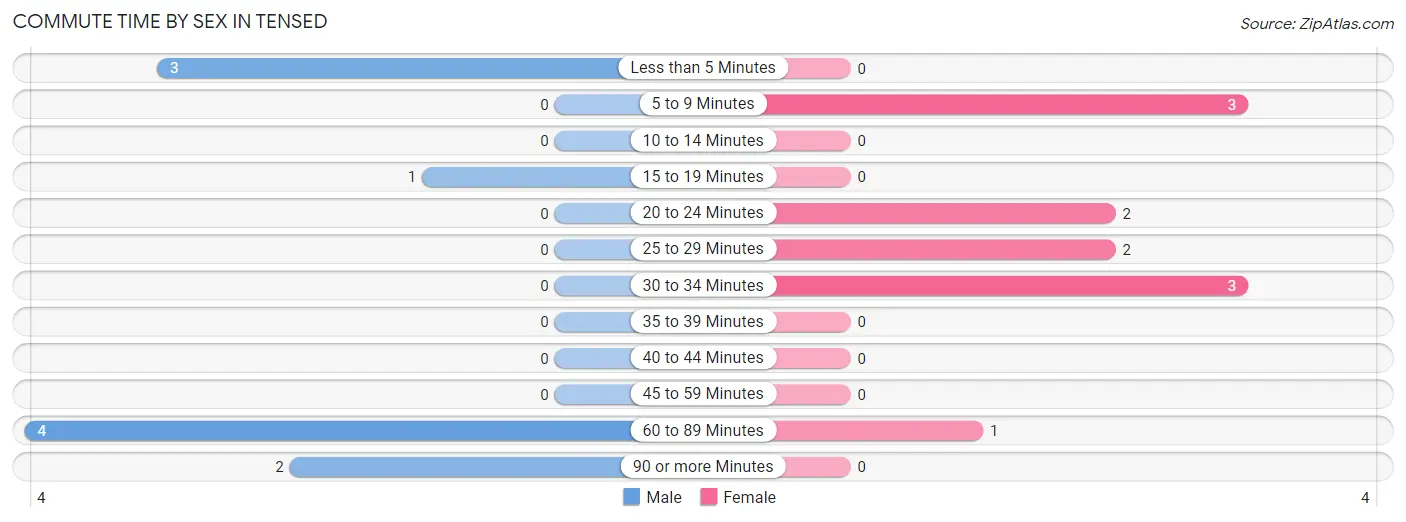
| Commute Time | Male | Female |
| Less than 5 Minutes | 3 (30.0%) | 0 (0.0%) |
| 5 to 9 Minutes | 0 (0.0%) | 3 (27.3%) |
| 10 to 14 Minutes | 0 (0.0%) | 0 (0.0%) |
| 15 to 19 Minutes | 1 (10.0%) | 0 (0.0%) |
| 20 to 24 Minutes | 0 (0.0%) | 2 (18.2%) |
| 25 to 29 Minutes | 0 (0.0%) | 2 (18.2%) |
| 30 to 34 Minutes | 0 (0.0%) | 3 (27.3%) |
| 35 to 39 Minutes | 0 (0.0%) | 0 (0.0%) |
| 40 to 44 Minutes | 0 (0.0%) | 0 (0.0%) |
| 45 to 59 Minutes | 0 (0.0%) | 0 (0.0%) |
| 60 to 89 Minutes | 4 (40.0%) | 1 (9.1%) |
| 90 or more Minutes | 2 (20.0%) | 0 (0.0%) |
Time of Departure to Work by Sex in Tensed
The most frequent times of departure to work in Tensed are 12:00 AM to 4:59 AM (3, 30.0%) for males and 4:00 PM to 11:59 PM (5, 45.5%) for females.
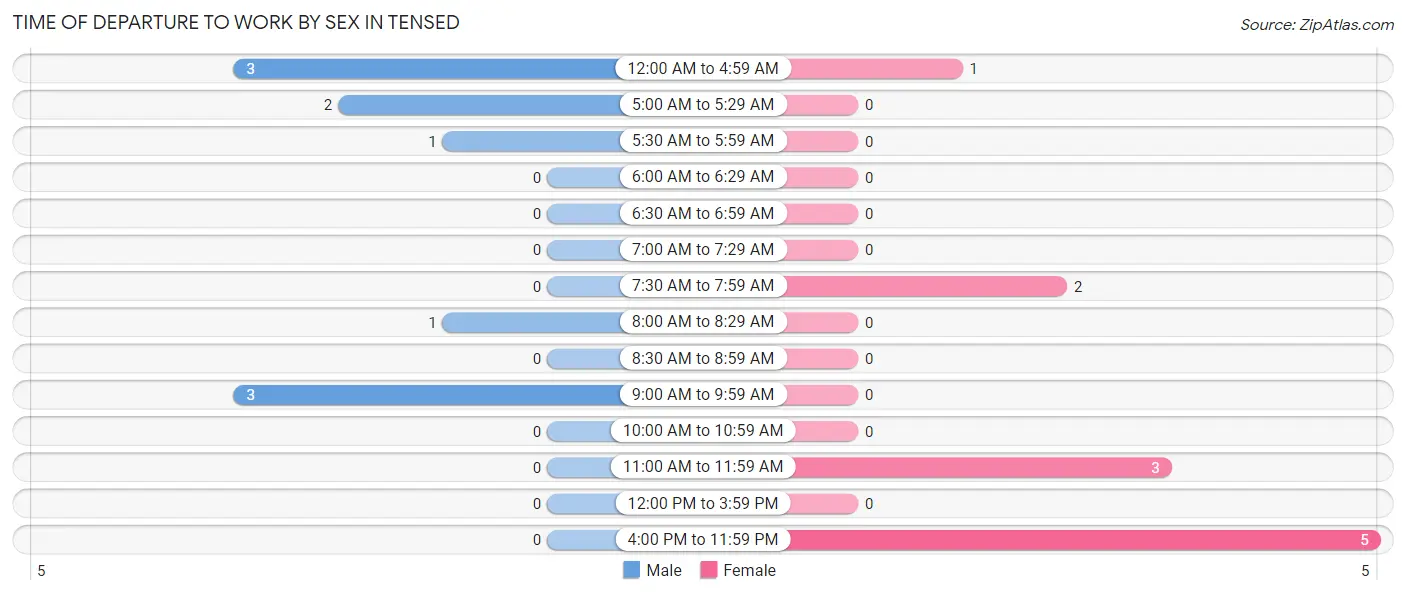
| Time of Departure | Male | Female |
| 12:00 AM to 4:59 AM | 3 (30.0%) | 1 (9.1%) |
| 5:00 AM to 5:29 AM | 2 (20.0%) | 0 (0.0%) |
| 5:30 AM to 5:59 AM | 1 (10.0%) | 0 (0.0%) |
| 6:00 AM to 6:29 AM | 0 (0.0%) | 0 (0.0%) |
| 6:30 AM to 6:59 AM | 0 (0.0%) | 0 (0.0%) |
| 7:00 AM to 7:29 AM | 0 (0.0%) | 0 (0.0%) |
| 7:30 AM to 7:59 AM | 0 (0.0%) | 2 (18.2%) |
| 8:00 AM to 8:29 AM | 1 (10.0%) | 0 (0.0%) |
| 8:30 AM to 8:59 AM | 0 (0.0%) | 0 (0.0%) |
| 9:00 AM to 9:59 AM | 3 (30.0%) | 0 (0.0%) |
| 10:00 AM to 10:59 AM | 0 (0.0%) | 0 (0.0%) |
| 11:00 AM to 11:59 AM | 0 (0.0%) | 3 (27.3%) |
| 12:00 PM to 3:59 PM | 0 (0.0%) | 0 (0.0%) |
| 4:00 PM to 11:59 PM | 0 (0.0%) | 5 (45.5%) |
| Total | 10 (100.0%) | 11 (100.0%) |
Housing Occupancy in Tensed
Occupancy by Ownership in Tensed
Of the total 42 dwellings in Tensed, owner-occupied units account for 24 (57.1%), while renter-occupied units make up 18 (42.9%).
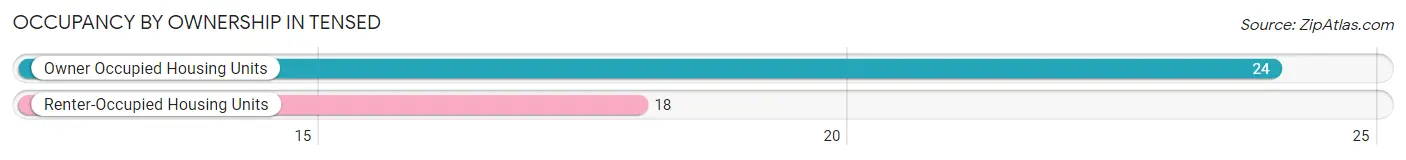
| Occupancy | # Housing Units | % Housing Units |
| Owner Occupied Housing Units | 24 | 57.1% |
| Renter-Occupied Housing Units | 18 | 42.9% |
| Total Occupied Housing Units | 42 | 100.0% |
Occupancy by Household Size in Tensed
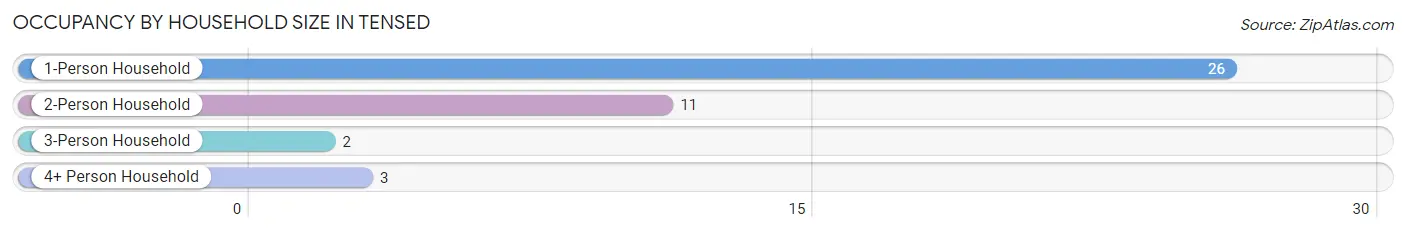
| Household Size | # Housing Units | % Housing Units |
| 1-Person Household | 26 | 61.9% |
| 2-Person Household | 11 | 26.2% |
| 3-Person Household | 2 | 4.8% |
| 4+ Person Household | 3 | 7.1% |
| Total Housing Units | 42 | 100.0% |
Occupancy by Ownership by Household Size in Tensed
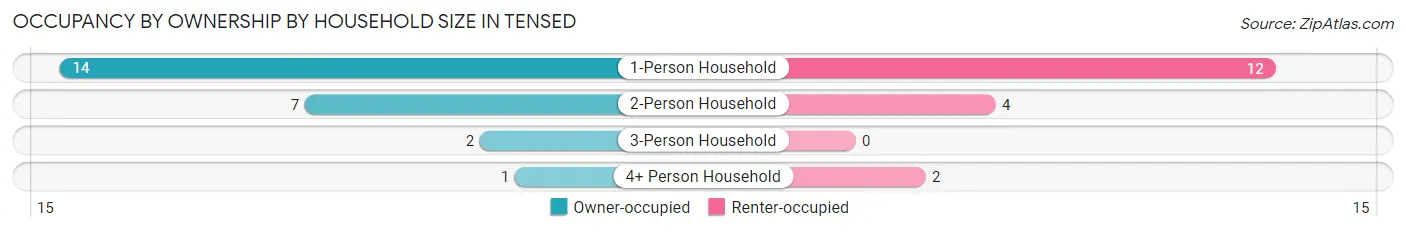
| Household Size | Owner-occupied | Renter-occupied |
| 1-Person Household | 14 (53.8%) | 12 (46.2%) |
| 2-Person Household | 7 (63.6%) | 4 (36.4%) |
| 3-Person Household | 2 (100.0%) | 0 (0.0%) |
| 4+ Person Household | 1 (33.3%) | 2 (66.7%) |
| Total Housing Units | 24 (57.1%) | 18 (42.9%) |
Occupancy by Educational Attainment in Tensed
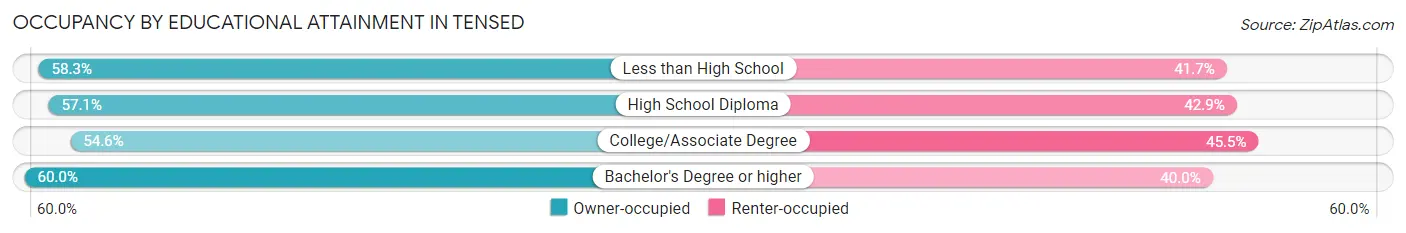
| Household Size | Owner-occupied | Renter-occupied |
| Less than High School | 7 (58.3%) | 5 (41.7%) |
| High School Diploma | 8 (57.1%) | 6 (42.9%) |
| College/Associate Degree | 6 (54.5%) | 5 (45.5%) |
| Bachelor's Degree or higher | 3 (60.0%) | 2 (40.0%) |
Occupancy by Age of Householder in Tensed
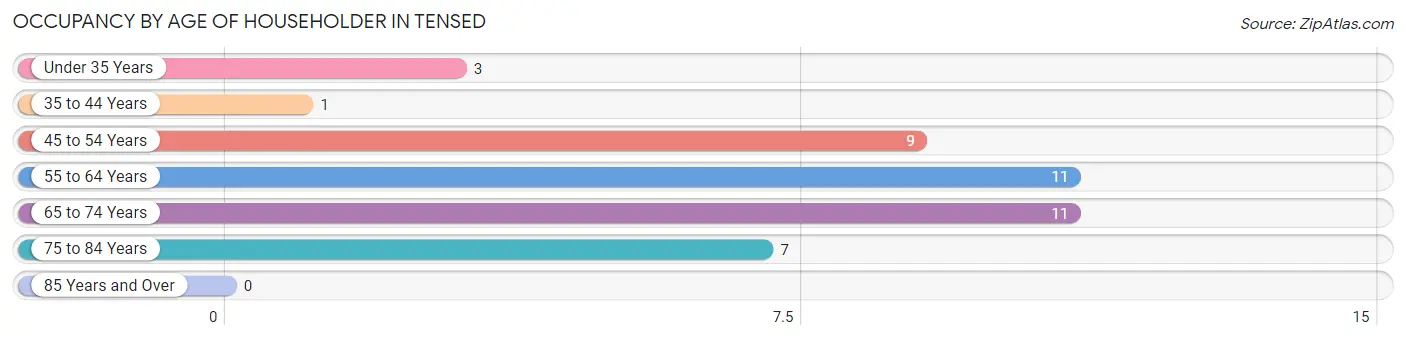
| Age Bracket | # Households | % Households |
| Under 35 Years | 3 | 7.1% |
| 35 to 44 Years | 1 | 2.4% |
| 45 to 54 Years | 9 | 21.4% |
| 55 to 64 Years | 11 | 26.2% |
| 65 to 74 Years | 11 | 26.2% |
| 75 to 84 Years | 7 | 16.7% |
| 85 Years and Over | 0 | 0.0% |
| Total | 42 | 100.0% |
Housing Finances in Tensed
Median Income by Occupancy in Tensed
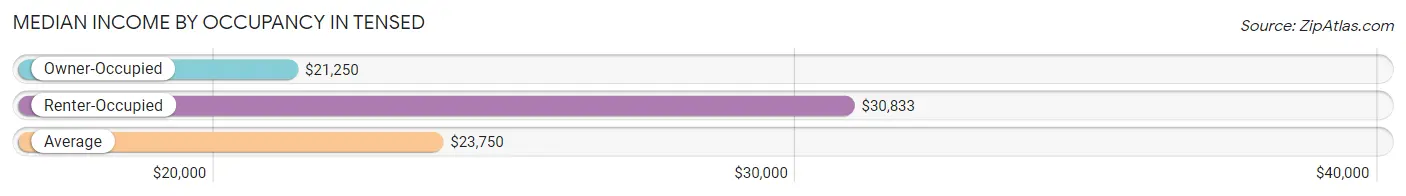
| Occupancy Type | # Households | Median Income |
| Owner-Occupied | 24 (57.1%) | $21,250 |
| Renter-Occupied | 18 (42.9%) | $30,833 |
| Average | 42 (100.0%) | $23,750 |
Occupancy by Householder Income Bracket in Tensed
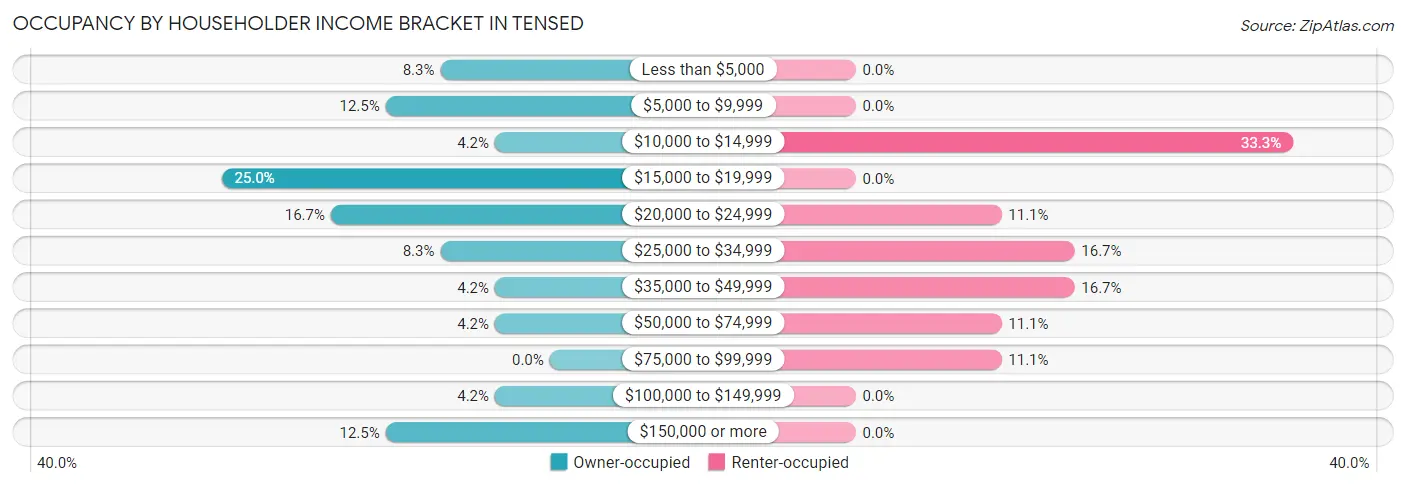
| Income Bracket | Owner-occupied | Renter-occupied |
| Less than $5,000 | 2 (8.3%) | 0 (0.0%) |
| $5,000 to $9,999 | 3 (12.5%) | 0 (0.0%) |
| $10,000 to $14,999 | 1 (4.2%) | 6 (33.3%) |
| $15,000 to $19,999 | 6 (25.0%) | 0 (0.0%) |
| $20,000 to $24,999 | 4 (16.7%) | 2 (11.1%) |
| $25,000 to $34,999 | 2 (8.3%) | 3 (16.7%) |
| $35,000 to $49,999 | 1 (4.2%) | 3 (16.7%) |
| $50,000 to $74,999 | 1 (4.2%) | 2 (11.1%) |
| $75,000 to $99,999 | 0 (0.0%) | 2 (11.1%) |
| $100,000 to $149,999 | 1 (4.2%) | 0 (0.0%) |
| $150,000 or more | 3 (12.5%) | 0 (0.0%) |
| Total | 24 (100.0%) | 18 (100.0%) |
Monthly Housing Cost Tiers in Tensed
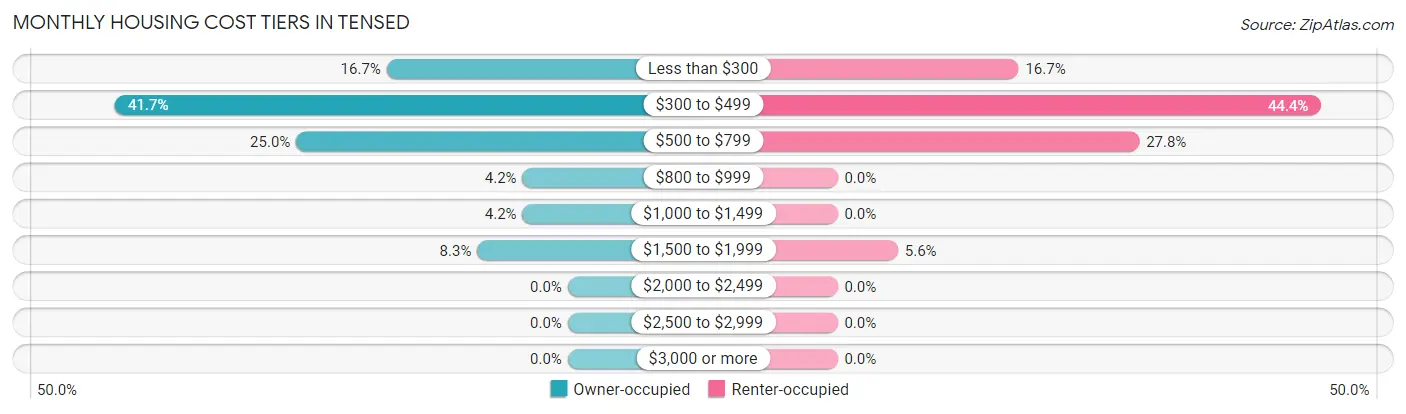
| Monthly Cost | Owner-occupied | Renter-occupied |
| Less than $300 | 4 (16.7%) | 3 (16.7%) |
| $300 to $499 | 10 (41.7%) | 8 (44.4%) |
| $500 to $799 | 6 (25.0%) | 5 (27.8%) |
| $800 to $999 | 1 (4.2%) | 0 (0.0%) |
| $1,000 to $1,499 | 1 (4.2%) | 0 (0.0%) |
| $1,500 to $1,999 | 2 (8.3%) | 1 (5.6%) |
| $2,000 to $2,499 | 0 (0.0%) | 0 (0.0%) |
| $2,500 to $2,999 | 0 (0.0%) | 0 (0.0%) |
| $3,000 or more | 0 (0.0%) | 0 (0.0%) |
| Total | 24 (100.0%) | 18 (100.0%) |
Physical Housing Characteristics in Tensed
Housing Structures in Tensed
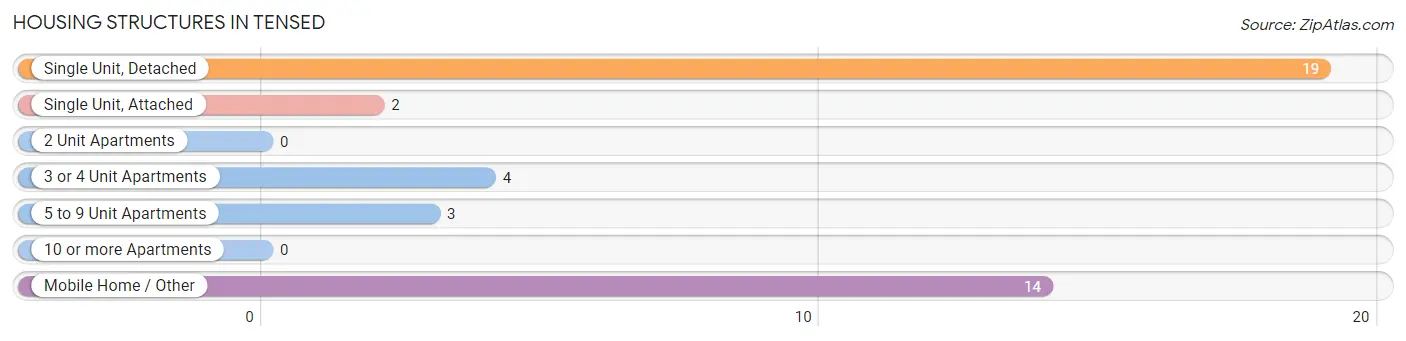
| Structure Type | # Housing Units | % Housing Units |
| Single Unit, Detached | 19 | 45.2% |
| Single Unit, Attached | 2 | 4.8% |
| 2 Unit Apartments | 0 | 0.0% |
| 3 or 4 Unit Apartments | 4 | 9.5% |
| 5 to 9 Unit Apartments | 3 | 7.1% |
| 10 or more Apartments | 0 | 0.0% |
| Mobile Home / Other | 14 | 33.3% |
| Total | 42 | 100.0% |
Housing Structures by Occupancy in Tensed
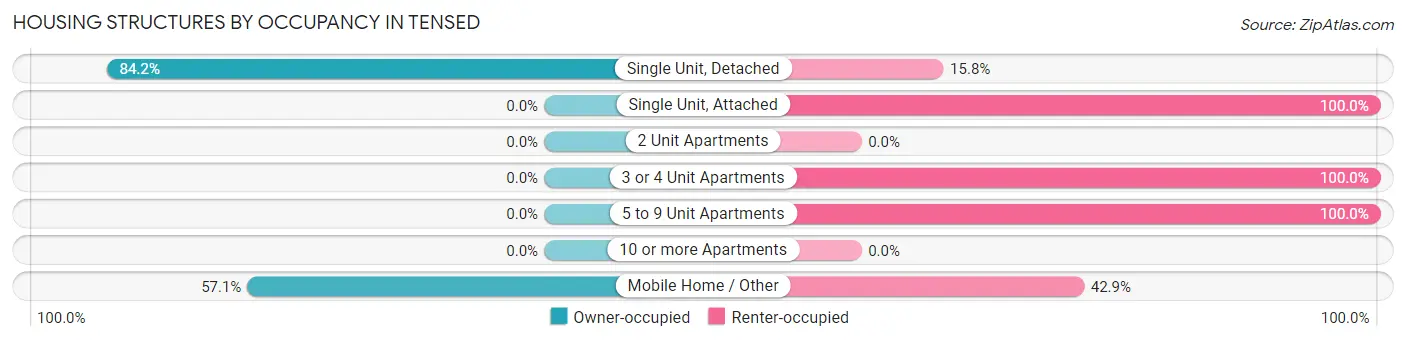
| Structure Type | Owner-occupied | Renter-occupied |
| Single Unit, Detached | 16 (84.2%) | 3 (15.8%) |
| Single Unit, Attached | 0 (0.0%) | 2 (100.0%) |
| 2 Unit Apartments | 0 (0.0%) | 0 (0.0%) |
| 3 or 4 Unit Apartments | 0 (0.0%) | 4 (100.0%) |
| 5 to 9 Unit Apartments | 0 (0.0%) | 3 (100.0%) |
| 10 or more Apartments | 0 (0.0%) | 0 (0.0%) |
| Mobile Home / Other | 8 (57.1%) | 6 (42.9%) |
| Total | 24 (57.1%) | 18 (42.9%) |
Housing Structures by Number of Rooms in Tensed
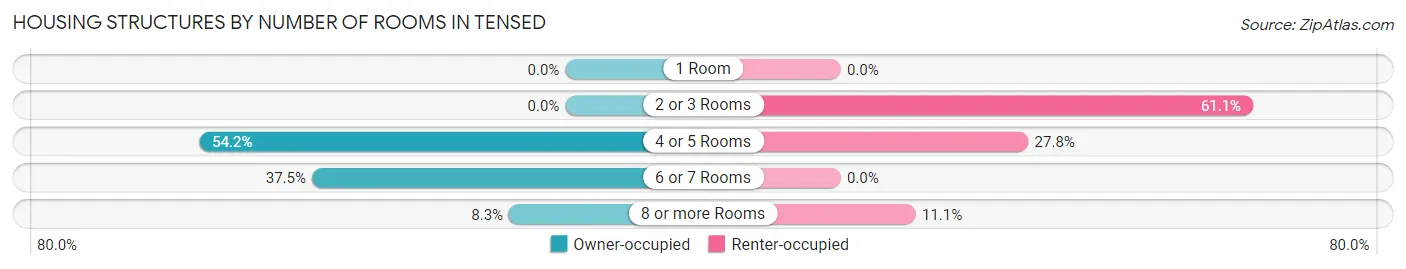
| Number of Rooms | Owner-occupied | Renter-occupied |
| 1 Room | 0 (0.0%) | 0 (0.0%) |
| 2 or 3 Rooms | 0 (0.0%) | 11 (61.1%) |
| 4 or 5 Rooms | 13 (54.2%) | 5 (27.8%) |
| 6 or 7 Rooms | 9 (37.5%) | 0 (0.0%) |
| 8 or more Rooms | 2 (8.3%) | 2 (11.1%) |
| Total | 24 (100.0%) | 18 (100.0%) |
Housing Structure by Heating Type in Tensed
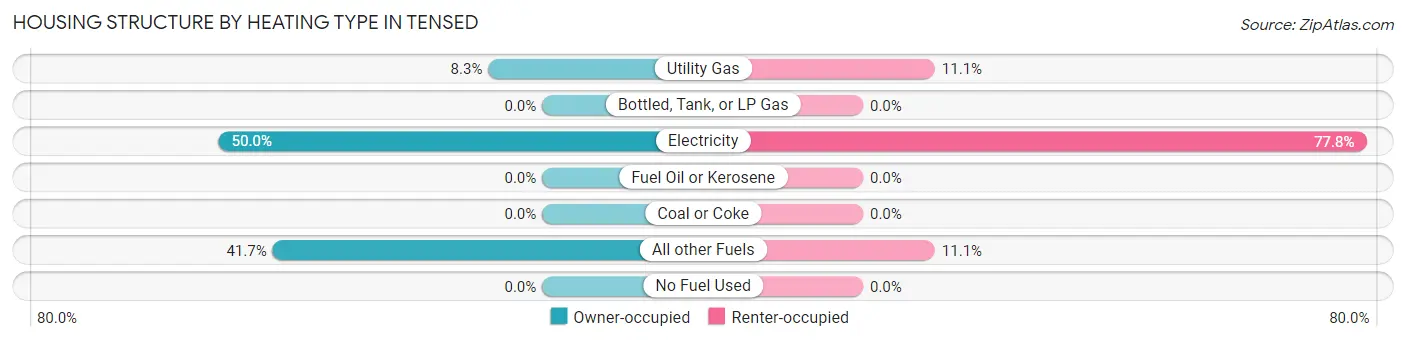
| Heating Type | Owner-occupied | Renter-occupied |
| Utility Gas | 2 (8.3%) | 2 (11.1%) |
| Bottled, Tank, or LP Gas | 0 (0.0%) | 0 (0.0%) |
| Electricity | 12 (50.0%) | 14 (77.8%) |
| Fuel Oil or Kerosene | 0 (0.0%) | 0 (0.0%) |
| Coal or Coke | 0 (0.0%) | 0 (0.0%) |
| All other Fuels | 10 (41.7%) | 2 (11.1%) |
| No Fuel Used | 0 (0.0%) | 0 (0.0%) |
| Total | 24 (100.0%) | 18 (100.0%) |
Household Vehicle Usage in Tensed
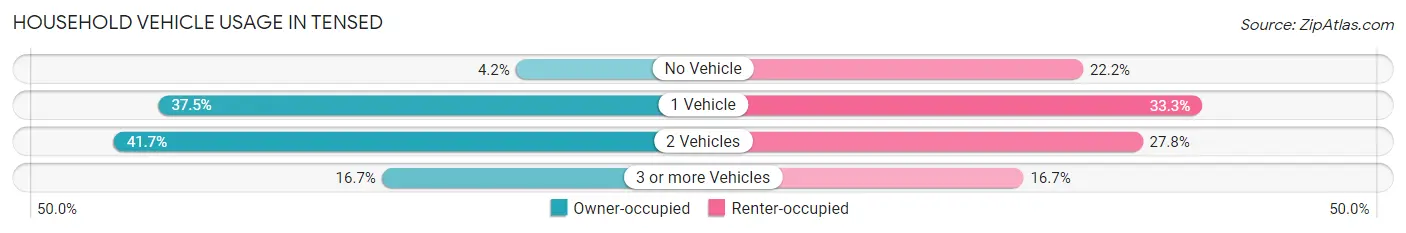
| Vehicles per Household | Owner-occupied | Renter-occupied |
| No Vehicle | 1 (4.2%) | 4 (22.2%) |
| 1 Vehicle | 9 (37.5%) | 6 (33.3%) |
| 2 Vehicles | 10 (41.7%) | 5 (27.8%) |
| 3 or more Vehicles | 4 (16.7%) | 3 (16.7%) |
| Total | 24 (100.0%) | 18 (100.0%) |
Real Estate & Mortgages in Tensed
Real Estate and Mortgage Overview in Tensed
| Characteristic | Without Mortgage | With Mortgage |
| Housing Units | 19 | 5 |
| Median Property Value | $98,300 | $258,300 |
| Median Household Income | - | - |
| Monthly Housing Costs | $388 | $0 |
| Real Estate Taxes | $950 | $0 |
Property Value by Mortgage Status in Tensed
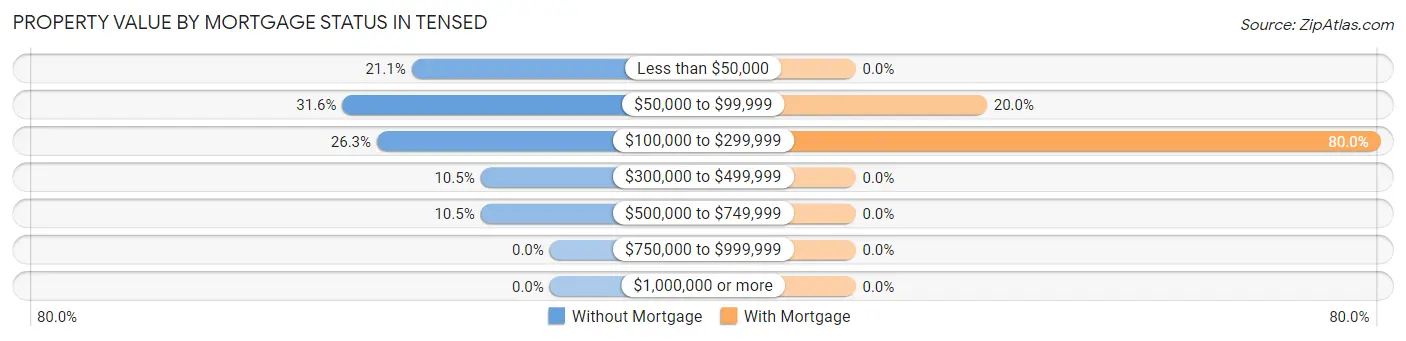
| Property Value | Without Mortgage | With Mortgage |
| Less than $50,000 | 4 (21.0%) | 0 (0.0%) |
| $50,000 to $99,999 | 6 (31.6%) | 1 (20.0%) |
| $100,000 to $299,999 | 5 (26.3%) | 4 (80.0%) |
| $300,000 to $499,999 | 2 (10.5%) | 0 (0.0%) |
| $500,000 to $749,999 | 2 (10.5%) | 0 (0.0%) |
| $750,000 to $999,999 | 0 (0.0%) | 0 (0.0%) |
| $1,000,000 or more | 0 (0.0%) | 0 (0.0%) |
| Total | 19 (100.0%) | 5 (100.0%) |
Household Income by Mortgage Status in Tensed
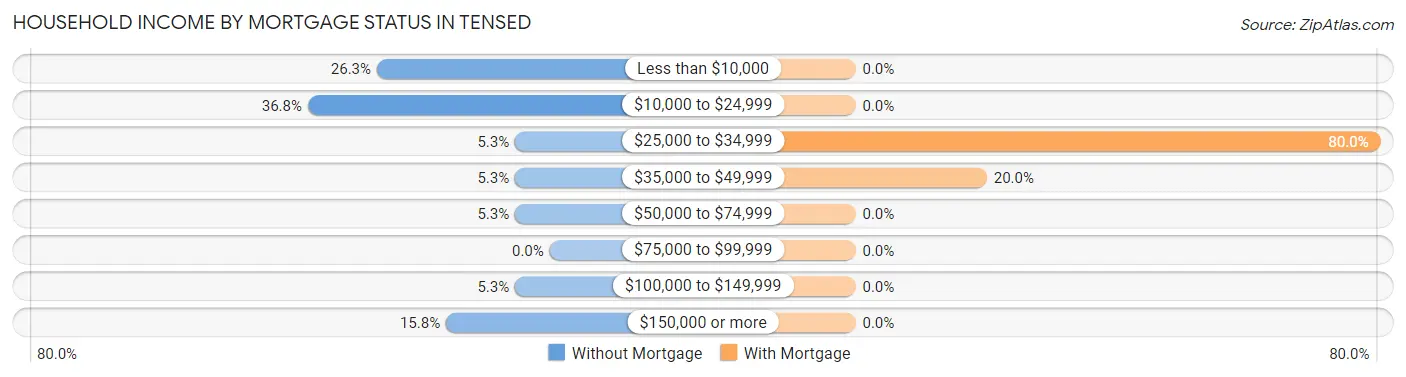
| Household Income | Without Mortgage | With Mortgage |
| Less than $10,000 | 5 (26.3%) | 0 (0.0%) |
| $10,000 to $24,999 | 7 (36.8%) | 0 (0.0%) |
| $25,000 to $34,999 | 1 (5.3%) | 4 (80.0%) |
| $35,000 to $49,999 | 1 (5.3%) | 1 (20.0%) |
| $50,000 to $74,999 | 1 (5.3%) | 0 (0.0%) |
| $75,000 to $99,999 | 0 (0.0%) | 0 (0.0%) |
| $100,000 to $149,999 | 1 (5.3%) | 0 (0.0%) |
| $150,000 or more | 3 (15.8%) | 0 (0.0%) |
| Total | 19 (100.0%) | 5 (100.0%) |
Property Value to Household Income Ratio in Tensed

| Value-to-Income Ratio | Without Mortgage | With Mortgage |
| Less than 2.0x | 5 (26.3%) | 23,750 (475,000.0%) |
| 2.0x to 2.9x | 1 (5.3%) | 0 (0.0%) |
| 3.0x to 3.9x | 3 (15.8%) | 0 (0.0%) |
| 4.0x or more | 10 (52.6%) | 1 (20.0%) |
| Total | 19 (100.0%) | 5 (100.0%) |
Real Estate Taxes by Mortgage Status in Tensed
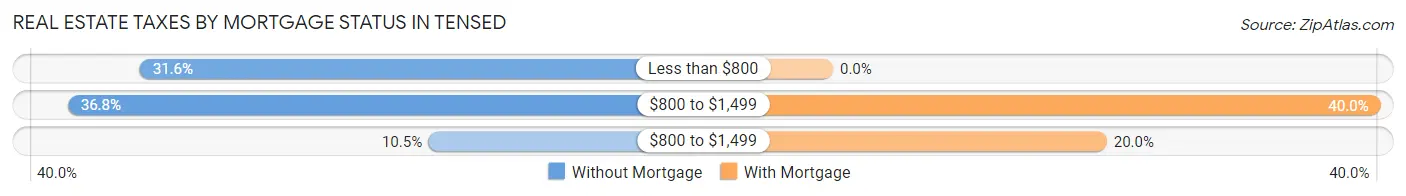
| Property Taxes | Without Mortgage | With Mortgage |
| Less than $800 | 6 (31.6%) | 0 (0.0%) |
| $800 to $1,499 | 7 (36.8%) | 2 (40.0%) |
| $800 to $1,499 | 2 (10.5%) | 1 (20.0%) |
| Total | 19 (100.0%) | 5 (100.0%) |
Health & Disability in Tensed
Health Insurance Coverage by Age in Tensed
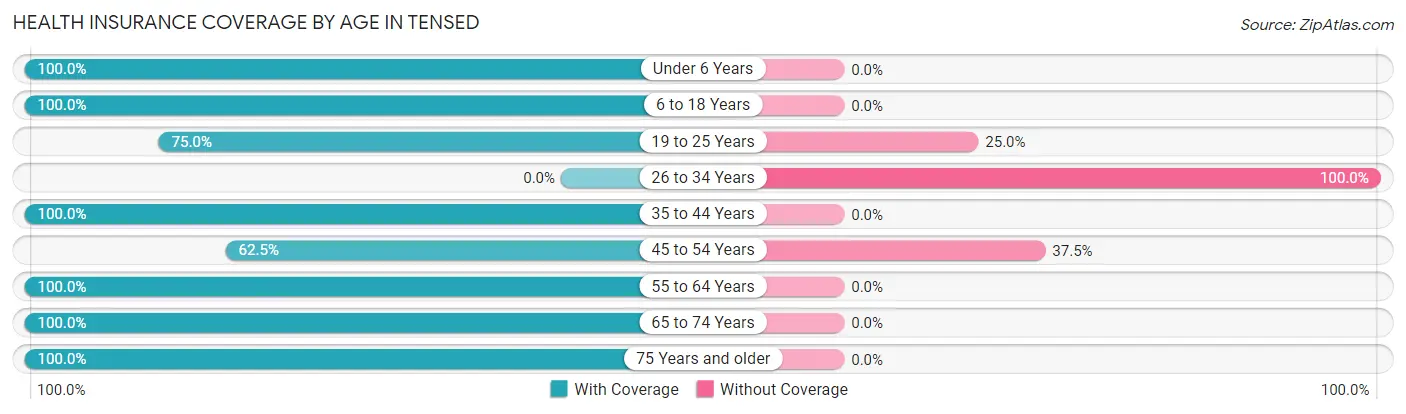
| Age Bracket | With Coverage | Without Coverage |
| Under 6 Years | 1 (100.0%) | 0 (0.0%) |
| 6 to 18 Years | 7 (100.0%) | 0 (0.0%) |
| 19 to 25 Years | 6 (75.0%) | 2 (25.0%) |
| 26 to 34 Years | 0 (0.0%) | 2 (100.0%) |
| 35 to 44 Years | 3 (100.0%) | 0 (0.0%) |
| 45 to 54 Years | 10 (62.5%) | 6 (37.5%) |
| 55 to 64 Years | 15 (100.0%) | 0 (0.0%) |
| 65 to 74 Years | 12 (100.0%) | 0 (0.0%) |
| 75 Years and older | 8 (100.0%) | 0 (0.0%) |
| Total | 62 (86.1%) | 10 (13.9%) |
Health Insurance Coverage by Citizenship Status in Tensed
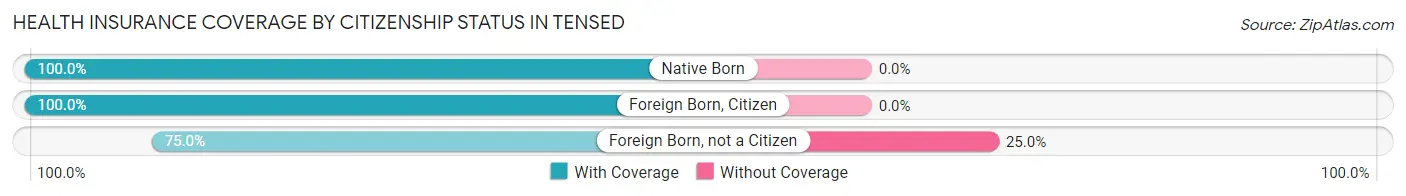
| Citizenship Status | With Coverage | Without Coverage |
| Native Born | 1 (100.0%) | 0 (0.0%) |
| Foreign Born, Citizen | 7 (100.0%) | 0 (0.0%) |
| Foreign Born, not a Citizen | 6 (75.0%) | 2 (25.0%) |
Health Insurance Coverage by Household Income in Tensed
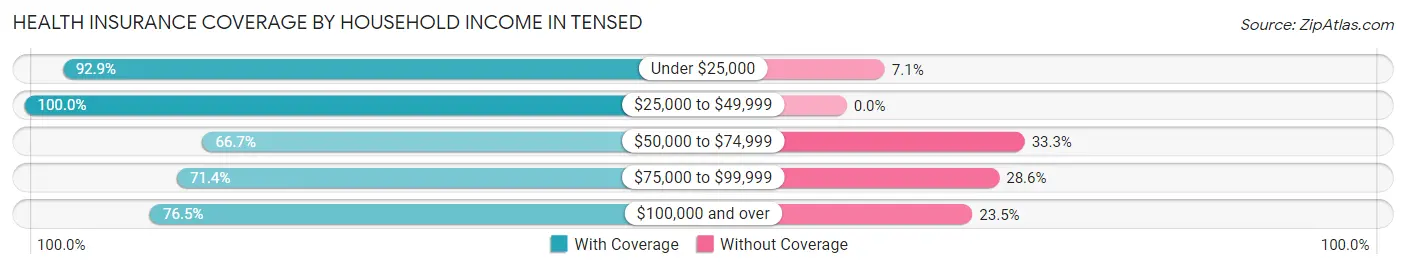
| Household Income | With Coverage | Without Coverage |
| Under $25,000 | 26 (92.9%) | 2 (7.1%) |
| $25,000 to $49,999 | 14 (100.0%) | 0 (0.0%) |
| $50,000 to $74,999 | 4 (66.7%) | 2 (33.3%) |
| $75,000 to $99,999 | 5 (71.4%) | 2 (28.6%) |
| $100,000 and over | 13 (76.5%) | 4 (23.5%) |
Public vs Private Health Insurance Coverage by Age in Tensed
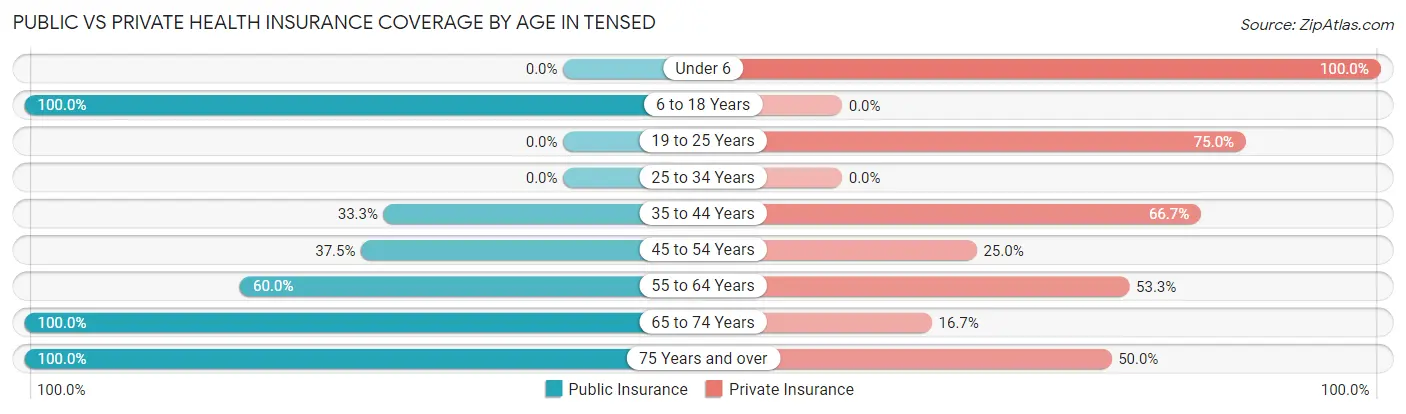
| Age Bracket | Public Insurance | Private Insurance |
| Under 6 | 0 (0.0%) | 1 (100.0%) |
| 6 to 18 Years | 7 (100.0%) | 0 (0.0%) |
| 19 to 25 Years | 0 (0.0%) | 6 (75.0%) |
| 25 to 34 Years | 0 (0.0%) | 0 (0.0%) |
| 35 to 44 Years | 1 (33.3%) | 2 (66.7%) |
| 45 to 54 Years | 6 (37.5%) | 4 (25.0%) |
| 55 to 64 Years | 9 (60.0%) | 8 (53.3%) |
| 65 to 74 Years | 12 (100.0%) | 2 (16.7%) |
| 75 Years and over | 8 (100.0%) | 4 (50.0%) |
| Total | 43 (59.7%) | 27 (37.5%) |
Disability Status by Sex by Age in Tensed
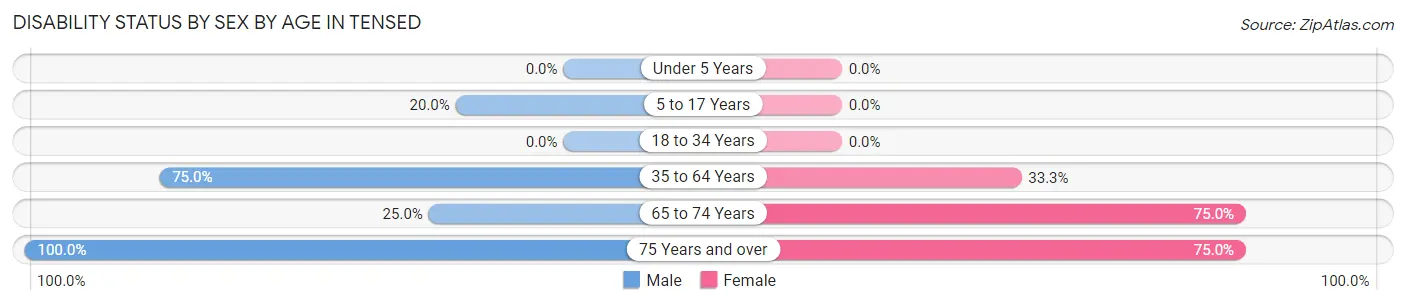
| Age Bracket | Male | Female |
| Under 5 Years | 0 (0.0%) | 0 (0.0%) |
| 5 to 17 Years | 1 (20.0%) | 0 (0.0%) |
| 18 to 34 Years | 0 (0.0%) | 0 (0.0%) |
| 35 to 64 Years | 12 (75.0%) | 6 (33.3%) |
| 65 to 74 Years | 1 (25.0%) | 6 (75.0%) |
| 75 Years and over | 4 (100.0%) | 3 (75.0%) |
Disability Class by Sex by Age in Tensed
Disability Class: Hearing Difficulty
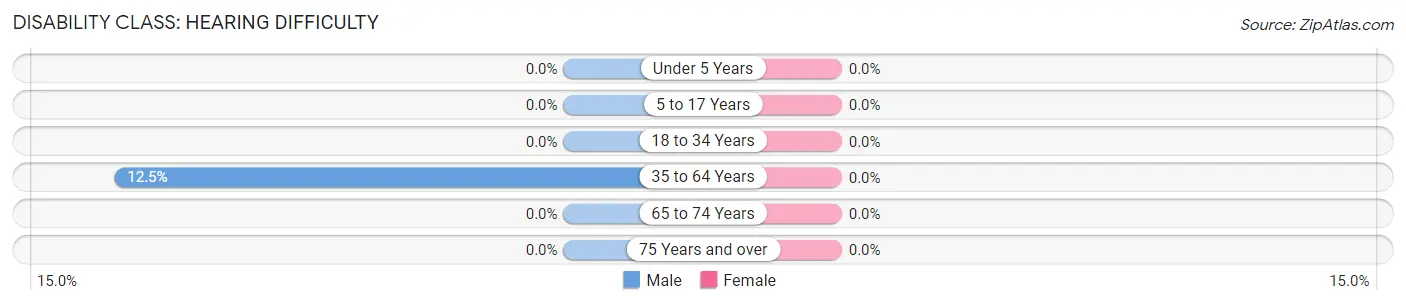
| Age Bracket | Male | Female |
| Under 5 Years | 0 (0.0%) | 0 (0.0%) |
| 5 to 17 Years | 0 (0.0%) | 0 (0.0%) |
| 18 to 34 Years | 0 (0.0%) | 0 (0.0%) |
| 35 to 64 Years | 2 (12.5%) | 0 (0.0%) |
| 65 to 74 Years | 0 (0.0%) | 0 (0.0%) |
| 75 Years and over | 0 (0.0%) | 0 (0.0%) |
Disability Class: Vision Difficulty
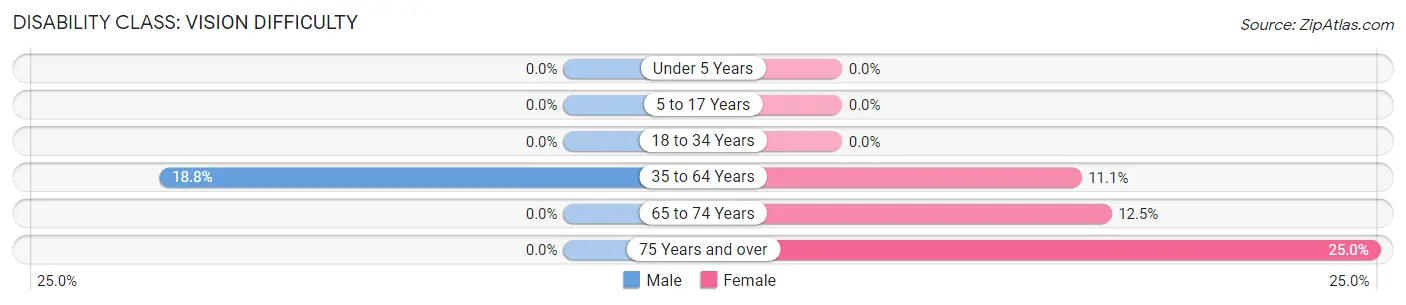
| Age Bracket | Male | Female |
| Under 5 Years | 0 (0.0%) | 0 (0.0%) |
| 5 to 17 Years | 0 (0.0%) | 0 (0.0%) |
| 18 to 34 Years | 0 (0.0%) | 0 (0.0%) |
| 35 to 64 Years | 3 (18.8%) | 2 (11.1%) |
| 65 to 74 Years | 0 (0.0%) | 1 (12.5%) |
| 75 Years and over | 0 (0.0%) | 1 (25.0%) |
Disability Class: Cognitive Difficulty
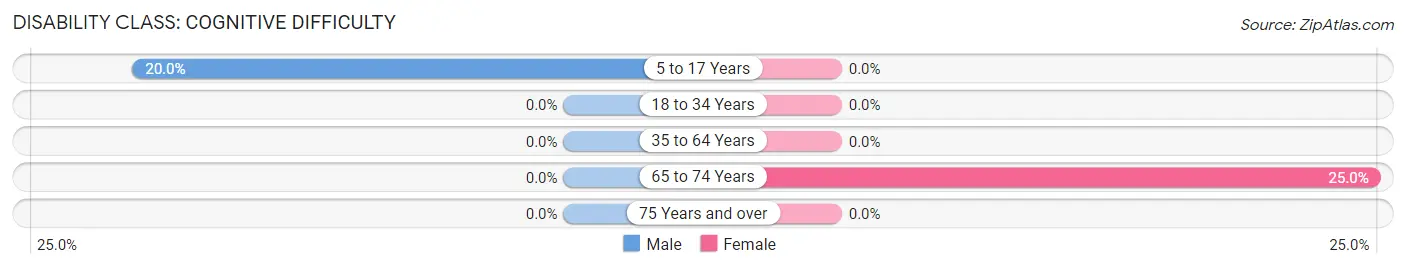
| Age Bracket | Male | Female |
| 5 to 17 Years | 1 (20.0%) | 0 (0.0%) |
| 18 to 34 Years | 0 (0.0%) | 0 (0.0%) |
| 35 to 64 Years | 0 (0.0%) | 0 (0.0%) |
| 65 to 74 Years | 0 (0.0%) | 2 (25.0%) |
| 75 Years and over | 0 (0.0%) | 0 (0.0%) |
Disability Class: Ambulatory Difficulty
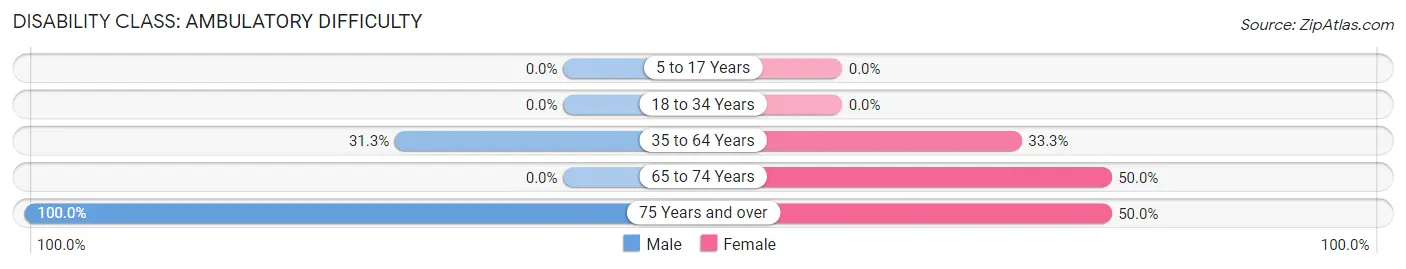
| Age Bracket | Male | Female |
| 5 to 17 Years | 0 (0.0%) | 0 (0.0%) |
| 18 to 34 Years | 0 (0.0%) | 0 (0.0%) |
| 35 to 64 Years | 5 (31.2%) | 6 (33.3%) |
| 65 to 74 Years | 0 (0.0%) | 4 (50.0%) |
| 75 Years and over | 4 (100.0%) | 2 (50.0%) |
Disability Class: Self-Care Difficulty
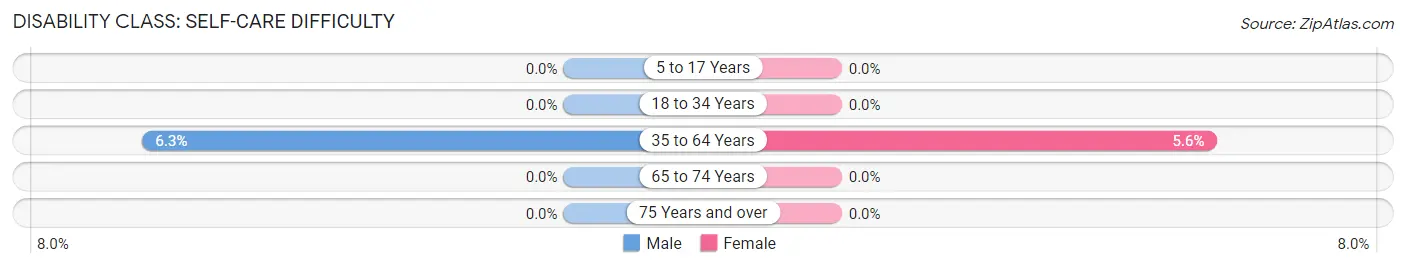
| Age Bracket | Male | Female |
| 5 to 17 Years | 0 (0.0%) | 0 (0.0%) |
| 18 to 34 Years | 0 (0.0%) | 0 (0.0%) |
| 35 to 64 Years | 1 (6.2%) | 1 (5.6%) |
| 65 to 74 Years | 0 (0.0%) | 0 (0.0%) |
| 75 Years and over | 0 (0.0%) | 0 (0.0%) |
Technology Access in Tensed
Computing Device Access in Tensed
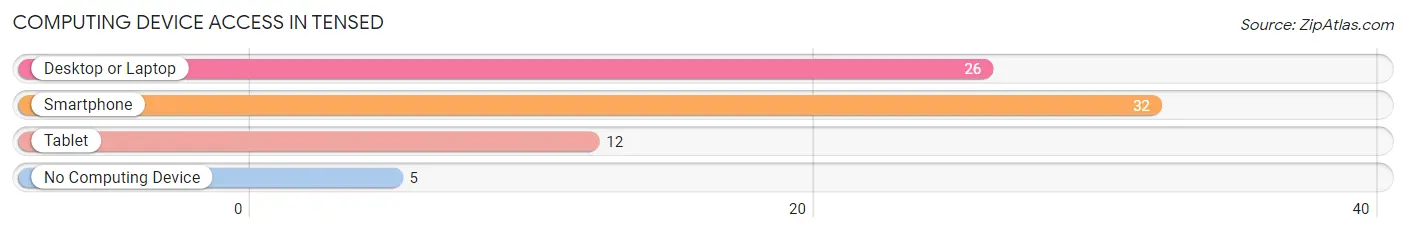
| Device Type | # Households | % Households |
| Desktop or Laptop | 26 | 61.9% |
| Smartphone | 32 | 76.2% |
| Tablet | 12 | 28.6% |
| No Computing Device | 5 | 11.9% |
| Total | 42 | 100.0% |
Internet Access in Tensed
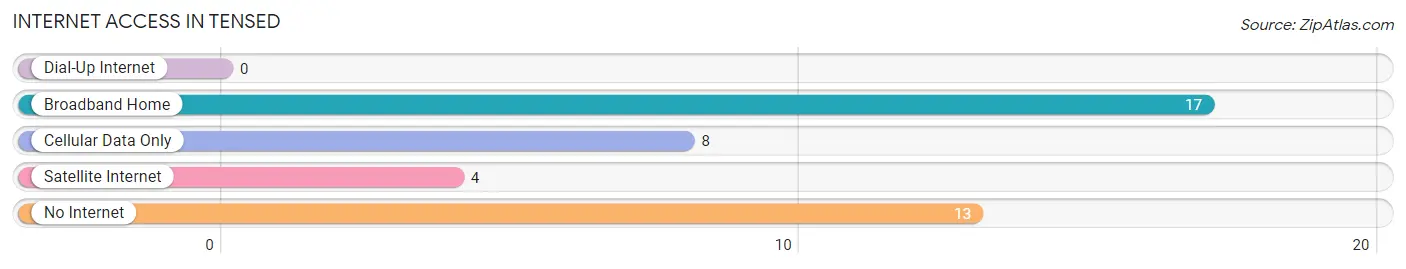
| Internet Type | # Households | % Households |
| Dial-Up Internet | 0 | 0.0% |
| Broadband Home | 17 | 40.5% |
| Cellular Data Only | 8 | 19.1% |
| Satellite Internet | 4 | 9.5% |
| No Internet | 13 | 30.9% |
| Total | 42 | 100.0% |
Tensed Summary
History
The history of the region dates back to the early 19th century when it was part of the Ottoman Empire. In 1878, the region was ceded to the Russian Empire following the Russo-Turkish War. During the Soviet era, the region was part of the Transcaucasian Socialist Federative Soviet Republic. After the fall of the Soviet Union in 1991, the region declared its independence and became the Republic of Azerbaijan.
Since then, the country has experienced a period of political and economic transformation. In 1993, Heydar Aliyev was elected president and began a period of economic and political reform. He was succeeded by Ilham Aliyev in 2003, who has continued the reforms and has overseen a period of economic growth and development.
Geography
Azerbaijan is located in the South Caucasus region of Eurasia, at the crossroads of Eastern Europe and Western Asia. It is bordered by Russia to the north, Georgia to the northwest, Armenia to the west, and Iran to the south. The Caspian Sea lies to the east of the country.
Azerbaijan has a total area of 86,600 square kilometers, making it the largest country in the South Caucasus region. The terrain is mostly flat and low-lying, with the Greater Caucasus Mountains to the north and the Lesser Caucasus Mountains to the south. The highest point in the country is Bazarduzu Peak, at 4,466 meters.
Economy
Azerbaijan has a market-based economy that is heavily reliant on oil and gas exports. The country is the second-largest producer of oil in the former Soviet Union, and its economy is heavily dependent on the energy sector.
The country has experienced rapid economic growth in recent years, with GDP growth averaging around 10% per year since 2003. This growth has been driven by increased oil and gas production, as well as increased investment in the non-oil sector.
The government has implemented a number of reforms to improve the business environment and attract foreign investment. These include reducing taxes, simplifying the regulatory environment, and improving access to finance.
Demographics
Azerbaijan has a population of 10.1 million people, making it the largest country in the South Caucasus region. The population is predominantly ethnic Azerbaijani, with minorities of Armenians, Russians, and other ethnic groups.
The majority of the population is Muslim, with a small minority of Christians. The official language is Azerbaijani, although Russian is also widely spoken.
The population is relatively young, with a median age of 30.3 years. The population is also growing rapidly, with a fertility rate of 2.2 children per woman. The life expectancy at birth is 72.3 years.
Common Questions
What is the Total Population of Tensed?
Total Population of Tensed is 72.
What is the Total Male Population of Tensed?
Total Male Population of Tensed is 36.
What is the Total Female Population of Tensed?
Total Female Population of Tensed is 36.
What is the Ratio of Males per 100 Females in Tensed?
There are 100.00 Males per 100 Females in Tensed.
What is the Ratio of Females per 100 Males in Tensed?
There are 100.00 Females per 100 Males in Tensed.
What is the Median Population Age in Tensed?
Median Population Age in Tensed is 52.8 Years.
What is the Average Family Size in Tensed
Average Family Size in Tensed is 3.0 People.
What is the Average Household Size in Tensed
Average Household Size in Tensed is 1.7 People.
What is Per Capita Income in Tensed?
Per Capita income in Tensed is $23,640.
What is the Median Household income in Tensed?
Median Household Income in Tensed is $23,750.
What is Inequality or Gini Index in Tensed?
Inequality or Gini Index in Tensed is 0.52.
How Large is the Labor Force in Tensed?
There are 26 People in the Labor Forcein in Tensed.
What is the Percentage of People in the Labor Force in Tensed?
40.0% of People are in the Labor Force in Tensed.
What is the Unemployment Rate in Tensed?
Unemployment Rate in Tensed is 7.7%.