Swan Valley, ID
Swan Valley Map
Swan Valley Overview
255
TOTAL POPULATION
132
MALE POPULATION
123
FEMALE POPULATION
107.32
MALES / 100 FEMALES
93.18
FEMALES / 100 MALES
43.6
MEDIAN AGE
2.9
AVG FAMILY SIZE
2.8
AVG HOUSEHOLD SIZE
$62,625
PER CAPITA INCOME
$85,000
AVG HOUSEHOLD INCOME
0.46
INEQUALITY / GINI INDEX
118
LABOR FORCE [ PEOPLE ]
62.1%
PERCENT IN LABOR FORCE
5.9%
UNEMPLOYMENT RATE
Swan Valley Zip Codes
Swan Valley Area Codes
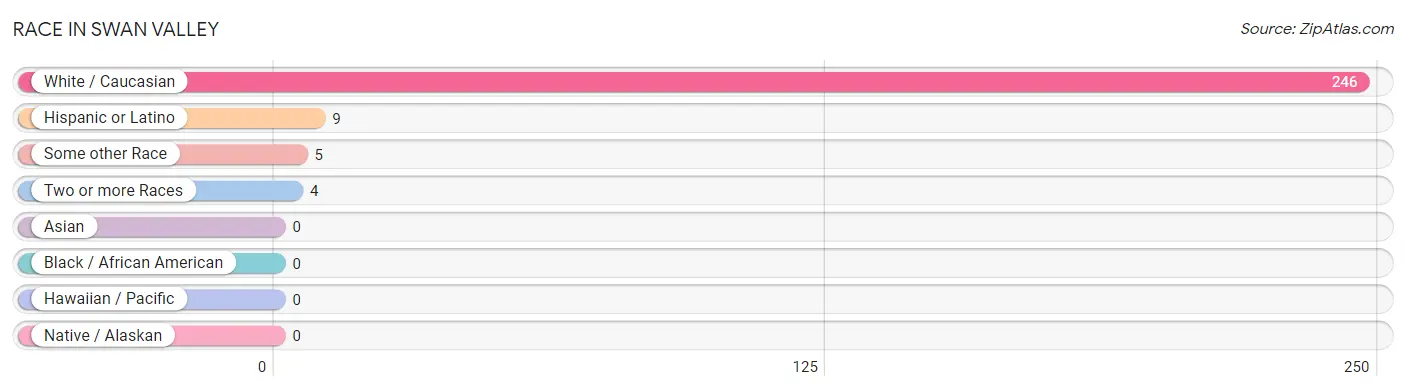
Race in Swan Valley
The most populous races in Swan Valley are White / Caucasian (246 | 96.5%), Hispanic or Latino (9 | 3.5%), and Some other Race (5 | 2.0%).
| Race | # Population | % Population |
| Asian | 0 | 0.0% |
| Black / African American | 0 | 0.0% |
| Hawaiian / Pacific | 0 | 0.0% |
| Hispanic or Latino | 9 | 3.5% |
| Native / Alaskan | 0 | 0.0% |
| White / Caucasian | 246 | 96.5% |
| Two or more Races | 4 | 1.6% |
| Some other Race | 5 | 2.0% |
| Total | 255 | 100.0% |
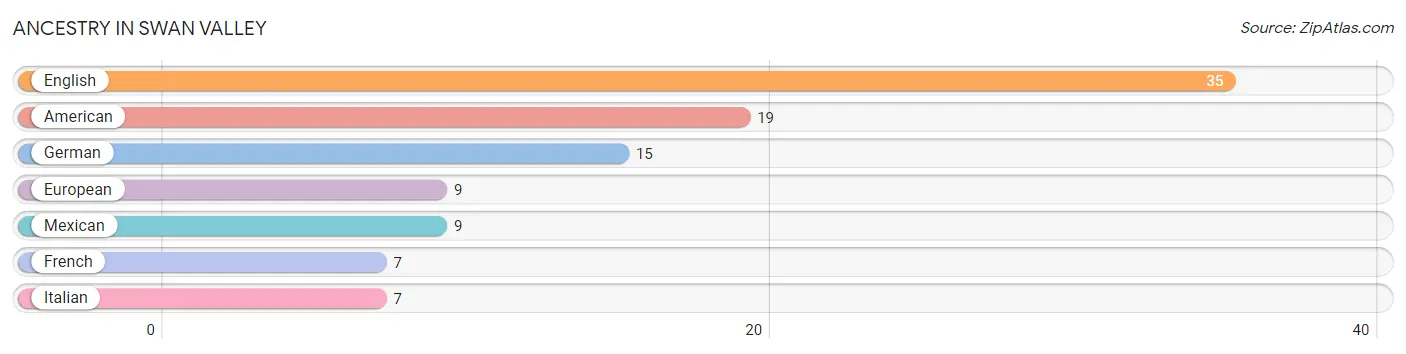
Ancestry in Swan Valley
The most populous ancestries reported in Swan Valley are English (35 | 13.7%), American (19 | 7.4%), German (15 | 5.9%), European (9 | 3.5%), and Mexican (9 | 3.5%), together accounting for 34.1% of all Swan Valley residents.
| Ancestry | # Population | % Population |
| American | 19 | 7.4% |
| English | 35 | 13.7% |
| European | 9 | 3.5% |
| French | 7 | 2.8% |
| German | 15 | 5.9% |
| Italian | 7 | 2.8% |
| Mexican | 9 | 3.5% | View All 7 Rows |
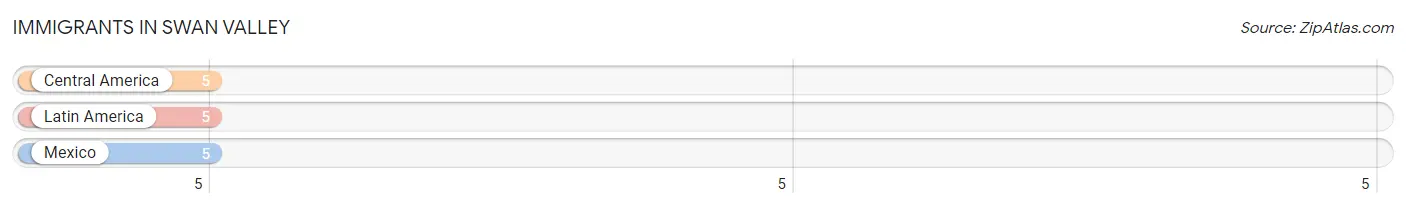
Immigrants in Swan Valley
The most numerous immigrant groups reported in Swan Valley came from Central America (5 | 2.0%), Latin America (5 | 2.0%), and Mexico (5 | 2.0%), together accounting for 5.9% of all Swan Valley residents.
| Immigration Origin | # Population | % Population |
| Central America | 5 | 2.0% |
| Latin America | 5 | 2.0% |
| Mexico | 5 | 2.0% | View All 3 Rows |
Sex and Age in Swan Valley
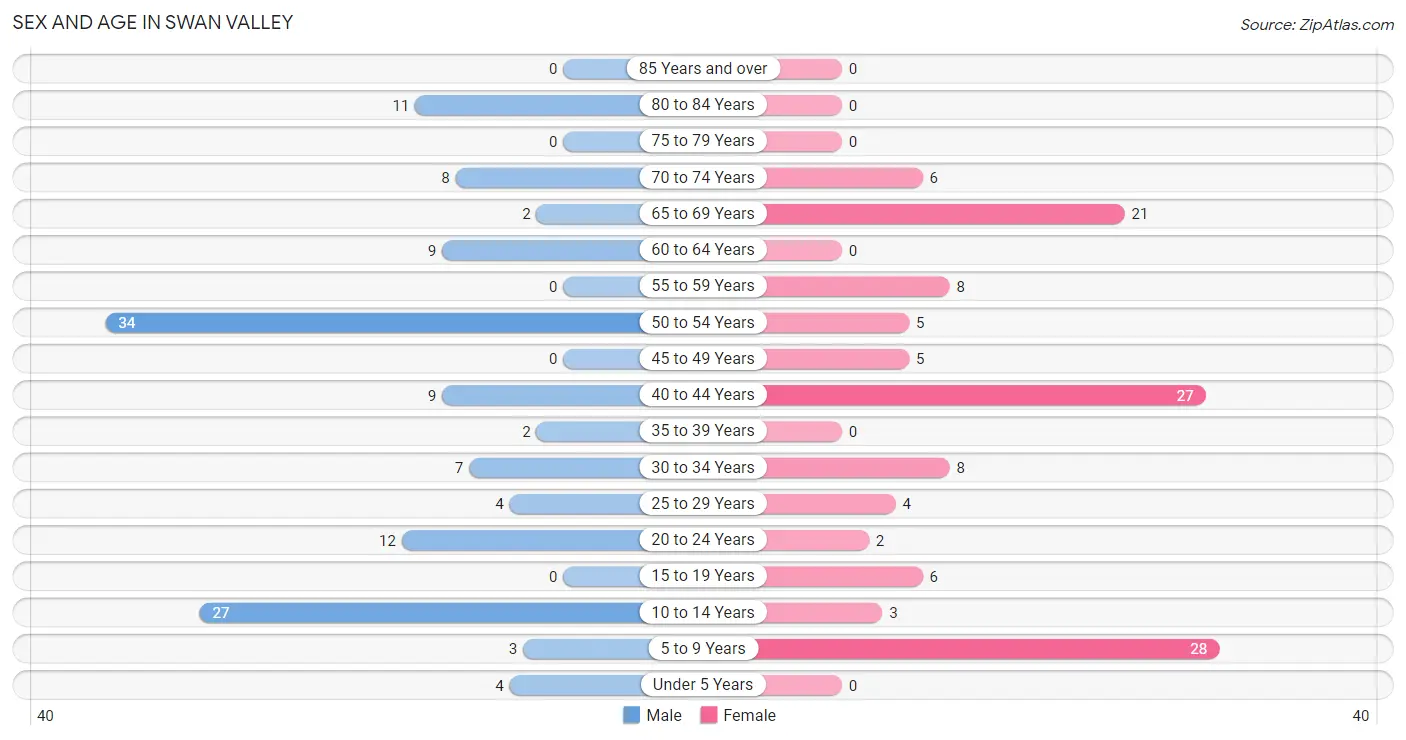
Sex and Age in Swan Valley
The most populous age groups in Swan Valley are 50 to 54 Years (34 | 25.8%) for men and 5 to 9 Years (28 | 22.8%) for women.
| Age Bracket | Male | Female |
| Under 5 Years | 4 (3.0%) | 0 (0.0%) |
| 5 to 9 Years | 3 (2.3%) | 28 (22.8%) |
| 10 to 14 Years | 27 (20.4%) | 3 (2.4%) |
| 15 to 19 Years | 0 (0.0%) | 6 (4.9%) |
| 20 to 24 Years | 12 (9.1%) | 2 (1.6%) |
| 25 to 29 Years | 4 (3.0%) | 4 (3.3%) |
| 30 to 34 Years | 7 (5.3%) | 8 (6.5%) |
| 35 to 39 Years | 2 (1.5%) | 0 (0.0%) |
| 40 to 44 Years | 9 (6.8%) | 27 (22.0%) |
| 45 to 49 Years | 0 (0.0%) | 5 (4.1%) |
| 50 to 54 Years | 34 (25.8%) | 5 (4.1%) |
| 55 to 59 Years | 0 (0.0%) | 8 (6.5%) |
| 60 to 64 Years | 9 (6.8%) | 0 (0.0%) |
| 65 to 69 Years | 2 (1.5%) | 21 (17.1%) |
| 70 to 74 Years | 8 (6.1%) | 6 (4.9%) |
| 75 to 79 Years | 0 (0.0%) | 0 (0.0%) |
| 80 to 84 Years | 11 (8.3%) | 0 (0.0%) |
| 85 Years and over | 0 (0.0%) | 0 (0.0%) |
| Total | 132 (100.0%) | 123 (100.0%) |
Families and Households in Swan Valley
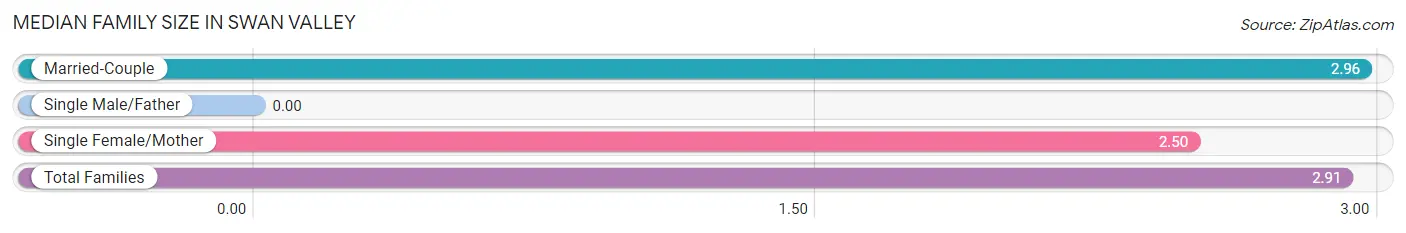
Median Family Size in Swan Valley
| Family Type | # Families | Family Size |
| Married-Couple | 72 (90.0%) | 2.96 |
| Single Male/Father | 0 (0.0%) | - |
| Single Female/Mother | 8 (10.0%) | 2.50 |
| Total Families | 80 (100.0%) | 2.91 |
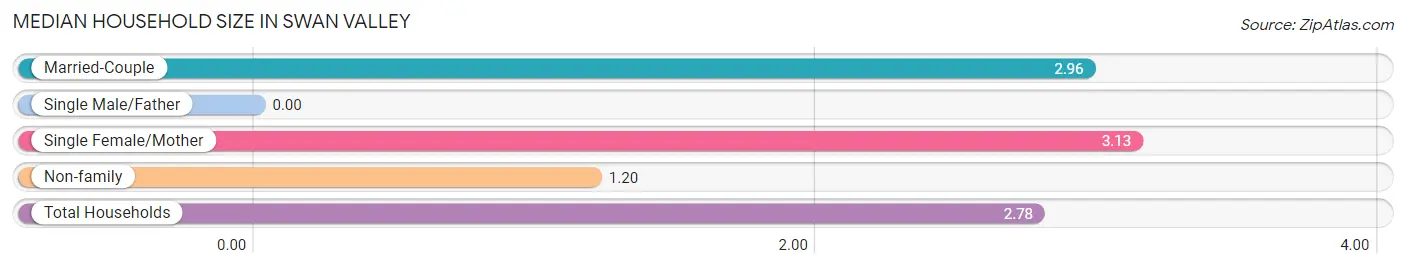
Median Household Size in Swan Valley
| Household Type | # Households | Household Size |
| Married-Couple | 72 (80.0%) | 2.96 |
| Single Male/Father | 0 (0.0%) | - |
| Single Female/Mother | 8 (8.9%) | 3.13 |
| Non-family | 10 (11.1%) | 1.20 |
| Total Households | 90 (100.0%) | 2.78 |
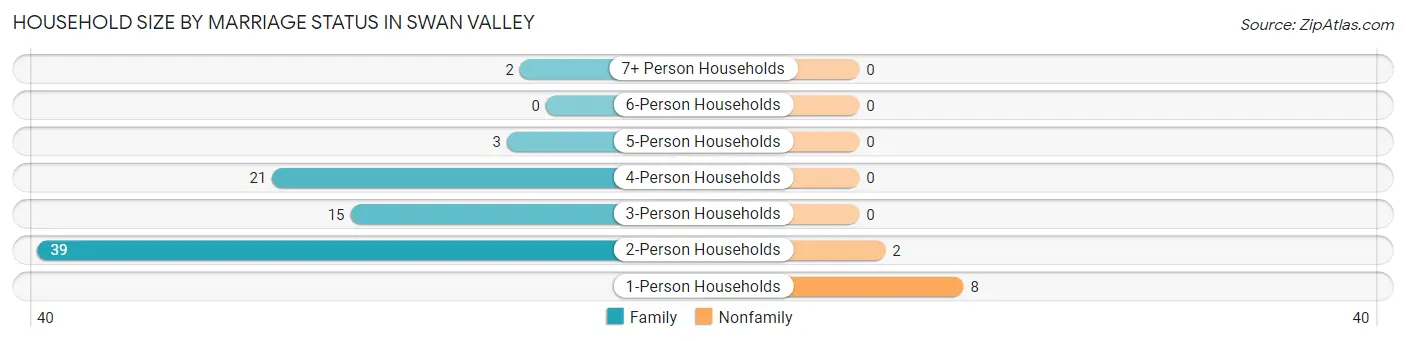
Household Size by Marriage Status in Swan Valley
Out of a total of 90 households in Swan Valley, 80 (88.9%) are family households, while 10 (11.1%) are nonfamily households. The most numerous type of family households are 2-person households, comprising 39, and the most common type of nonfamily households are 1-person households, comprising 8.
| Household Size | Family Households | Nonfamily Households |
| 1-Person Households | - | 8 (8.9%) |
| 2-Person Households | 39 (43.3%) | 2 (2.2%) |
| 3-Person Households | 15 (16.7%) | 0 (0.0%) |
| 4-Person Households | 21 (23.3%) | 0 (0.0%) |
| 5-Person Households | 3 (3.3%) | 0 (0.0%) |
| 6-Person Households | 0 (0.0%) | 0 (0.0%) |
| 7+ Person Households | 2 (2.2%) | 0 (0.0%) |
| Total | 80 (88.9%) | 10 (11.1%) |
Female Fertility in Swan Valley
Fertility by Age in Swan Valley
| Age Bracket | Women with Births | Births / 1,000 Women |
| 15 to 19 years | 0 (0.0%) | 0.0 |
| 20 to 34 years | 0 (0.0%) | 0.0 |
| 35 to 50 years | 0 (0.0%) | 0.0 |
| Total | 0 (0.0%) | 0.0 |
Fertility by Age by Marriage Status in Swan Valley
| Age Bracket | Married | Unmarried |
| 15 to 19 years | 0 (0.0%) | 0 (0.0%) |
| 20 to 34 years | 0 (0.0%) | 0 (0.0%) |
| 35 to 50 years | 0 (0.0%) | 0 (0.0%) |
| Total | 0 (0.0%) | 0 (0.0%) |
Fertility by Education in Swan Valley
| Educational Attainment | Women with Births | Births / 1,000 Women |
| Less than High School | 0 (0.0%) | 0.0 |
| High School Diploma | 0 (0.0%) | 0.0 |
| College or Associate's Degree | 0 (0.0%) | 0.0 |
| Bachelor's Degree | 0 (0.0%) | 0.0 |
| Graduate Degree | 0 (0.0%) | 0.0 |
| Total | 0 (0.0%) | 0.0 |
Fertility by Education by Marriage Status in Swan Valley
| Educational Attainment | Married | Unmarried |
| Less than High School | 0 (0.0%) | 0 (0.0%) |
| High School Diploma | 0 (0.0%) | 0 (0.0%) |
| College or Associate's Degree | 0 (0.0%) | 0 (0.0%) |
| Bachelor's Degree | 0 (0.0%) | 0 (0.0%) |
| Graduate Degree | 0 (0.0%) | 0 (0.0%) |
| Total | 0 (0.0%) | 0 (0.0%) |
Income in Swan Valley
Income Overview in Swan Valley
| Characteristic | Number | Measure |
| Per Capita Income | 255 | $62,625 |
| Median Family Income | 80 | $0 |
| Mean Family Income | 80 | $188,678 |
| Median Household Income | 90 | $85,000 |
| Mean Household Income | 90 | $178,781 |
| Income Deficit | 80 | $0 |
| Wage / Income Gap (%) | 255 | 0.00% |
| Wage / Income Gap ($) | 255 | 100.00¢ per $1 |
| Gini / Inequality Index | 255 | 0.46 |
Earnings by Sex in Swan Valley
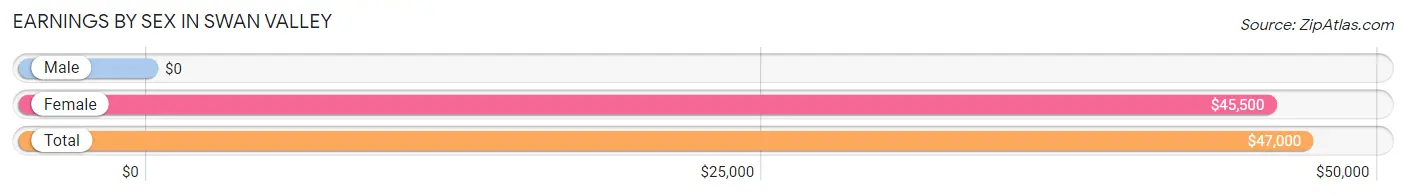
| Sex | Number | Average Earnings |
| Male | 72 (59.0%) | $0 |
| Female | 50 (41.0%) | $45,500 |
| Total | 122 (100.0%) | $47,000 |
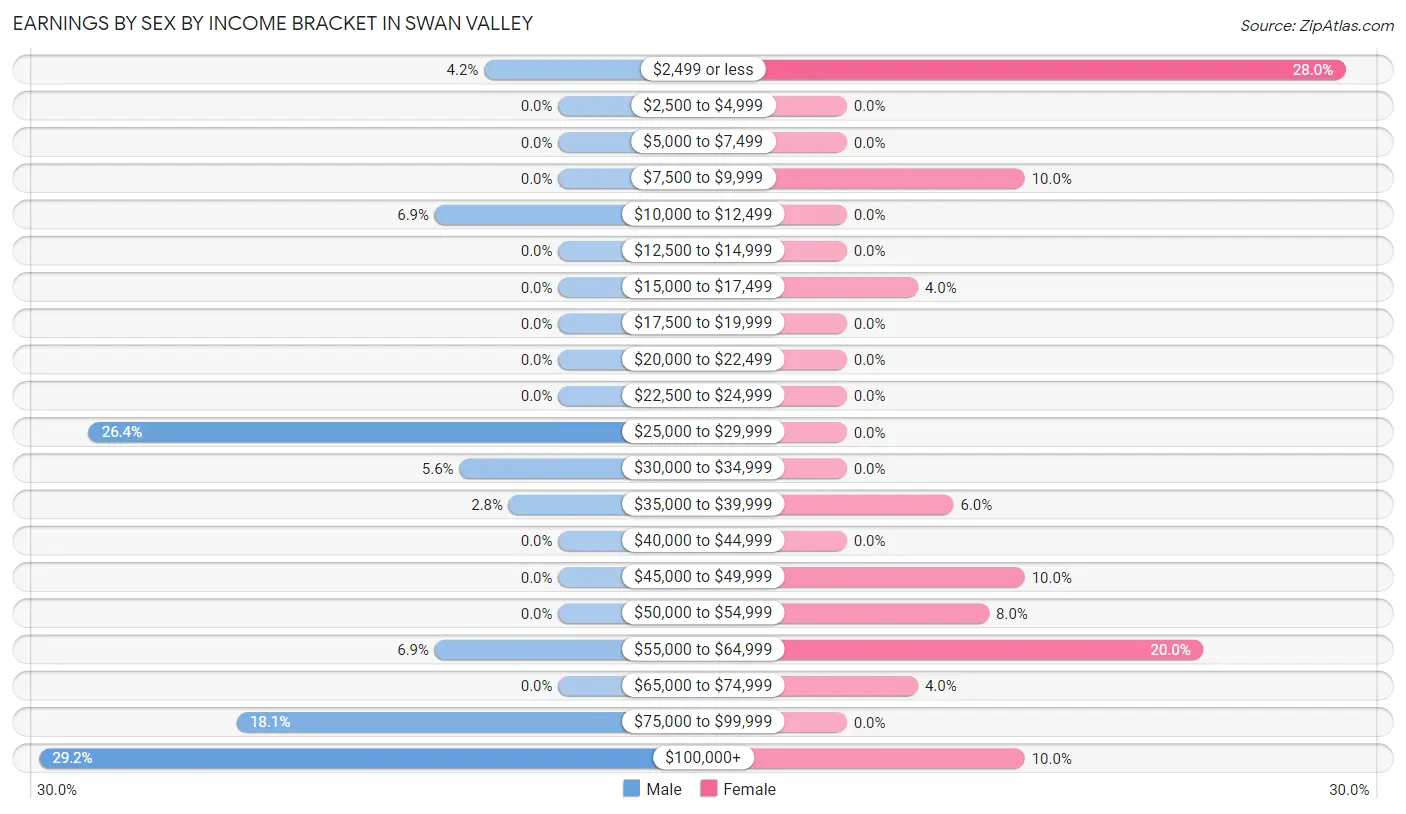
Earnings by Sex by Income Bracket in Swan Valley
The most common earnings brackets in Swan Valley are $100,000+ for men (21 | 29.2%) and $2,499 or less for women (14 | 28.0%).
| Income | Male | Female |
| $2,499 or less | 3 (4.2%) | 14 (28.0%) |
| $2,500 to $4,999 | 0 (0.0%) | 0 (0.0%) |
| $5,000 to $7,499 | 0 (0.0%) | 0 (0.0%) |
| $7,500 to $9,999 | 0 (0.0%) | 5 (10.0%) |
| $10,000 to $12,499 | 5 (6.9%) | 0 (0.0%) |
| $12,500 to $14,999 | 0 (0.0%) | 0 (0.0%) |
| $15,000 to $17,499 | 0 (0.0%) | 2 (4.0%) |
| $17,500 to $19,999 | 0 (0.0%) | 0 (0.0%) |
| $20,000 to $22,499 | 0 (0.0%) | 0 (0.0%) |
| $22,500 to $24,999 | 0 (0.0%) | 0 (0.0%) |
| $25,000 to $29,999 | 19 (26.4%) | 0 (0.0%) |
| $30,000 to $34,999 | 4 (5.6%) | 0 (0.0%) |
| $35,000 to $39,999 | 2 (2.8%) | 3 (6.0%) |
| $40,000 to $44,999 | 0 (0.0%) | 0 (0.0%) |
| $45,000 to $49,999 | 0 (0.0%) | 5 (10.0%) |
| $50,000 to $54,999 | 0 (0.0%) | 4 (8.0%) |
| $55,000 to $64,999 | 5 (6.9%) | 10 (20.0%) |
| $65,000 to $74,999 | 0 (0.0%) | 2 (4.0%) |
| $75,000 to $99,999 | 13 (18.1%) | 0 (0.0%) |
| $100,000+ | 21 (29.2%) | 5 (10.0%) |
| Total | 72 (100.0%) | 50 (100.0%) |
Earnings by Sex by Educational Attainment in Swan Valley
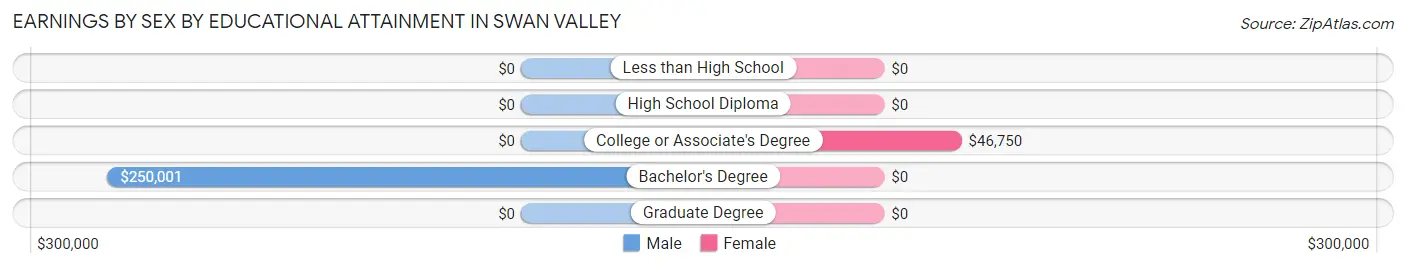
| Educational Attainment | Male Income | Female Income |
| Less than High School | - | - |
| High School Diploma | - | - |
| College or Associate's Degree | - | - |
| Bachelor's Degree | $250,001 | $0 |
| Graduate Degree | - | - |
| Total | - | - |
Family Income in Swan Valley
Family Income Brackets in Swan Valley
According to the Swan Valley family income data, there are 28 families falling into the $200,000+ income range, which is the most common income bracket and makes up 35.0% of all families.
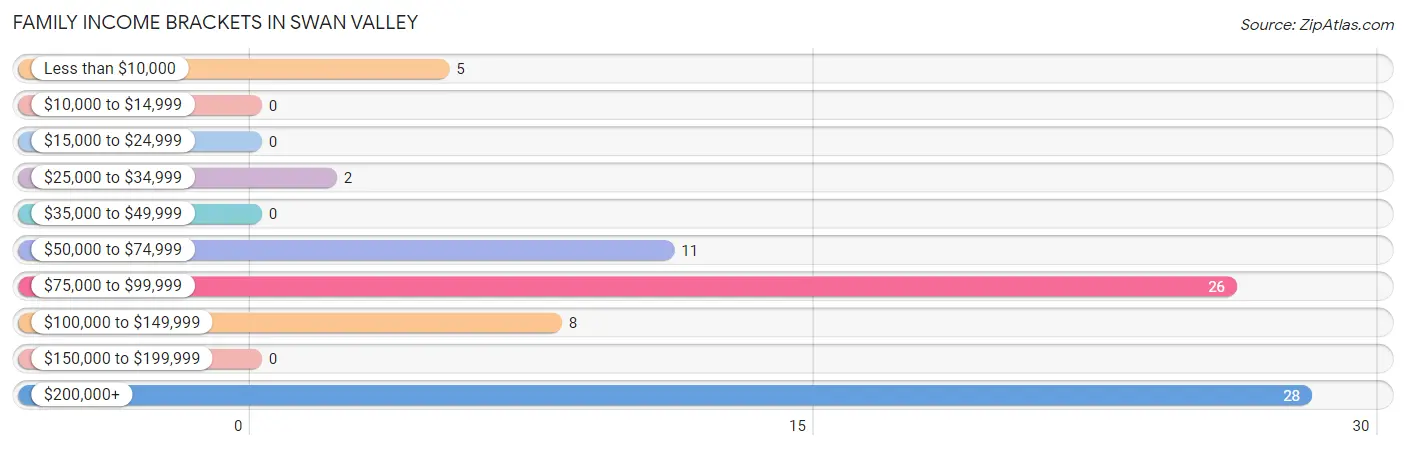
| Income Bracket | # Families | % Families |
| Less than $10,000 | 5 | 6.3% |
| $10,000 to $14,999 | 0 | 0.0% |
| $15,000 to $24,999 | 0 | 0.0% |
| $25,000 to $34,999 | 2 | 2.5% |
| $35,000 to $49,999 | 0 | 0.0% |
| $50,000 to $74,999 | 11 | 13.8% |
| $75,000 to $99,999 | 26 | 32.5% |
| $100,000 to $149,999 | 8 | 10.0% |
| $150,000 to $199,999 | 0 | 0.0% |
| $200,000+ | 28 | 35.0% |
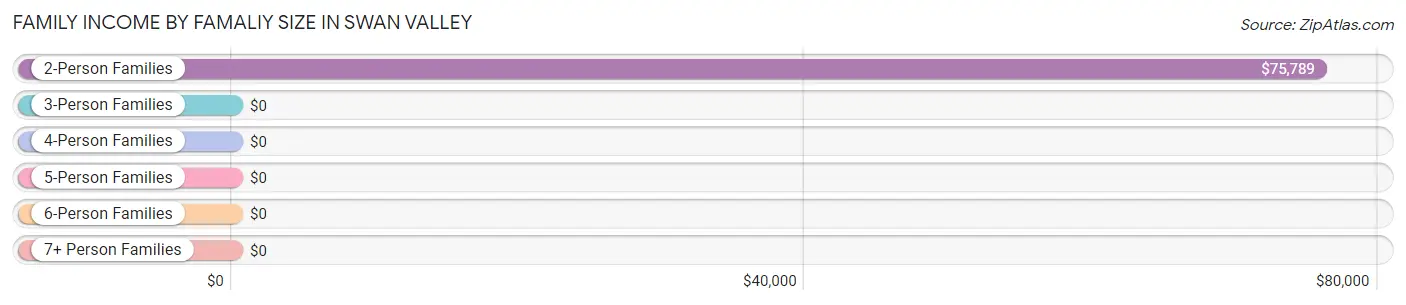
Family Income by Famaliy Size in Swan Valley
2-person families (44 | 55.0%) account for the highest median family income in Swan Valley with $75,789 per family, while 2-person families (44 | 55.0%) have the highest median income of $37,894 per family member.
| Income Bracket | # Families | Median Income |
| 2-Person Families | 44 (55.0%) | $75,789 |
| 3-Person Families | 10 (12.5%) | $0 |
| 4-Person Families | 21 (26.3%) | $0 |
| 5-Person Families | 3 (3.7%) | $0 |
| 6-Person Families | 0 (0.0%) | $0 |
| 7+ Person Families | 2 (2.5%) | $0 |
| Total | 80 (100.0%) | $0 |
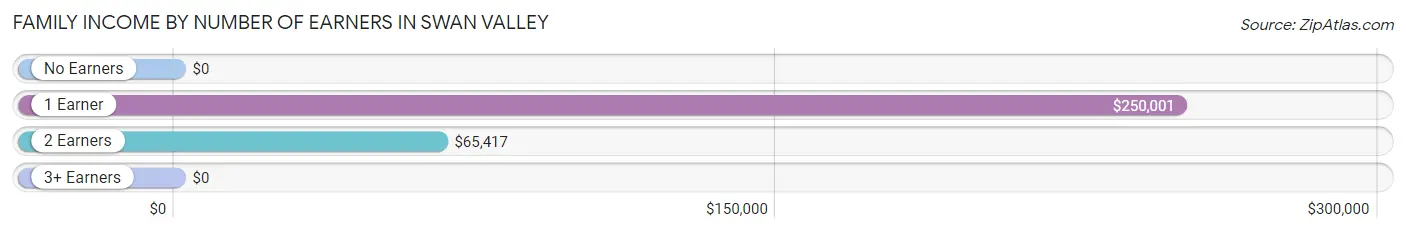
Family Income by Number of Earners in Swan Valley
| Number of Earners | # Families | Median Income |
| No Earners | 24 (30.0%) | $0 |
| 1 Earner | 30 (37.5%) | $250,001 |
| 2 Earners | 16 (20.0%) | $65,417 |
| 3+ Earners | 10 (12.5%) | $0 |
| Total | 80 (100.0%) | $0 |
Household Income in Swan Valley
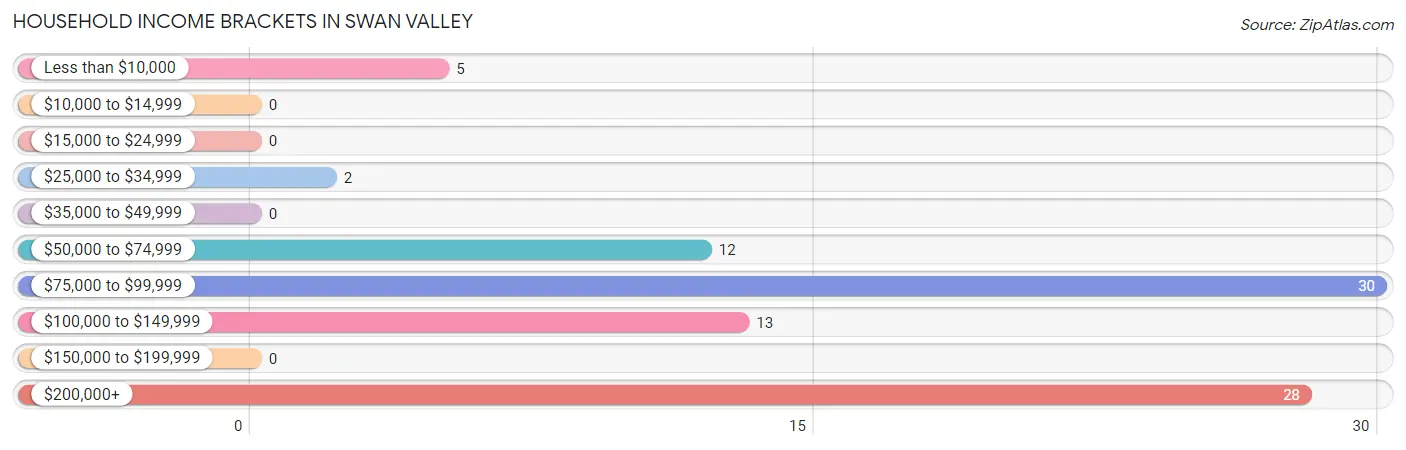
Household Income Brackets in Swan Valley
With 30 households falling in the category, the $75,000 to $99,999 income range is the most frequent in Swan Valley, accounting for 33.3% of all households.
| Income Bracket | # Households | % Households |
| Less than $10,000 | 5 | 5.6% |
| $10,000 to $14,999 | 0 | 0.0% |
| $15,000 to $24,999 | 0 | 0.0% |
| $25,000 to $34,999 | 2 | 2.2% |
| $35,000 to $49,999 | 0 | 0.0% |
| $50,000 to $74,999 | 12 | 13.3% |
| $75,000 to $99,999 | 30 | 33.3% |
| $100,000 to $149,999 | 13 | 14.4% |
| $150,000 to $199,999 | 0 | 0.0% |
| $200,000+ | 28 | 31.1% |
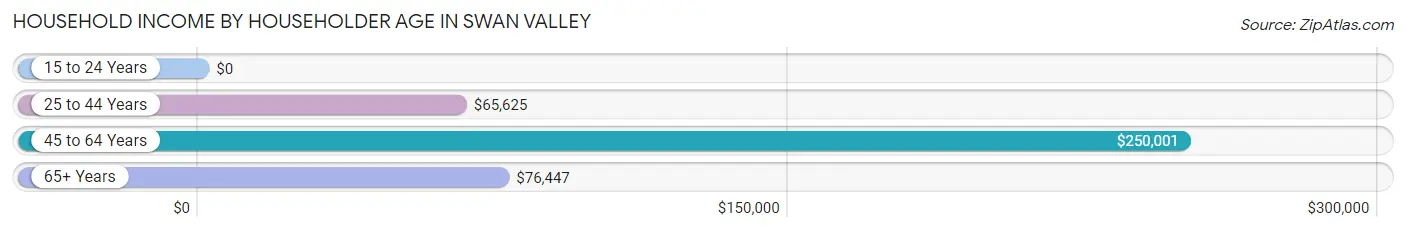
Household Income by Householder Age in Swan Valley
The median household income in Swan Valley is $85,000, with the highest median household income of $250,001 found in the 45 to 64 years age bracket for the primary householder. A total of 39 households (43.3%) fall into this category.
| Income Bracket | # Households | Median Income |
| 15 to 24 Years | 0 (0.0%) | $0 |
| 25 to 44 Years | 19 (21.1%) | $65,625 |
| 45 to 64 Years | 39 (43.3%) | $250,001 |
| 65+ Years | 32 (35.6%) | $76,447 |
| Total | 90 (100.0%) | $85,000 |
Poverty in Swan Valley
Income Below Poverty by Sex and Age in Swan Valley
With 12.9% poverty level for males and 8.9% for females among the residents of Swan Valley, under 5 year old males and 55 to 64 year old females are the most vulnerable to poverty, with 4 males (100.0%) and 4 females (50.0%) in their respective age groups living below the poverty level.
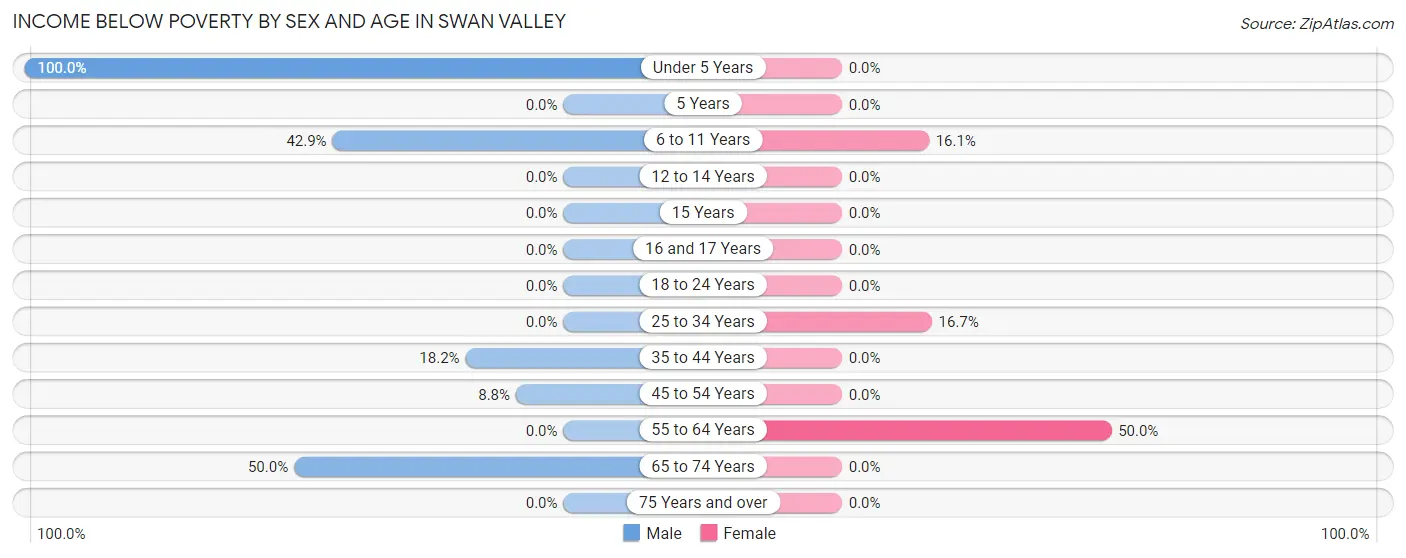
| Age Bracket | Male | Female |
| Under 5 Years | 4 (100.0%) | 0 (0.0%) |
| 5 Years | 0 (0.0%) | 0 (0.0%) |
| 6 to 11 Years | 3 (42.9%) | 5 (16.1%) |
| 12 to 14 Years | 0 (0.0%) | 0 (0.0%) |
| 15 Years | 0 (0.0%) | 0 (0.0%) |
| 16 and 17 Years | 0 (0.0%) | 0 (0.0%) |
| 18 to 24 Years | 0 (0.0%) | 0 (0.0%) |
| 25 to 34 Years | 0 (0.0%) | 2 (16.7%) |
| 35 to 44 Years | 2 (18.2%) | 0 (0.0%) |
| 45 to 54 Years | 3 (8.8%) | 0 (0.0%) |
| 55 to 64 Years | 0 (0.0%) | 4 (50.0%) |
| 65 to 74 Years | 5 (50.0%) | 0 (0.0%) |
| 75 Years and over | 0 (0.0%) | 0 (0.0%) |
| Total | 17 (12.9%) | 11 (8.9%) |
Income Above Poverty by Sex and Age in Swan Valley
According to the poverty statistics in Swan Valley, males aged 12 to 14 years and females aged 18 to 24 years are the age groups that are most secure financially, with 100.0% of males and 100.0% of females in these age groups living above the poverty line.
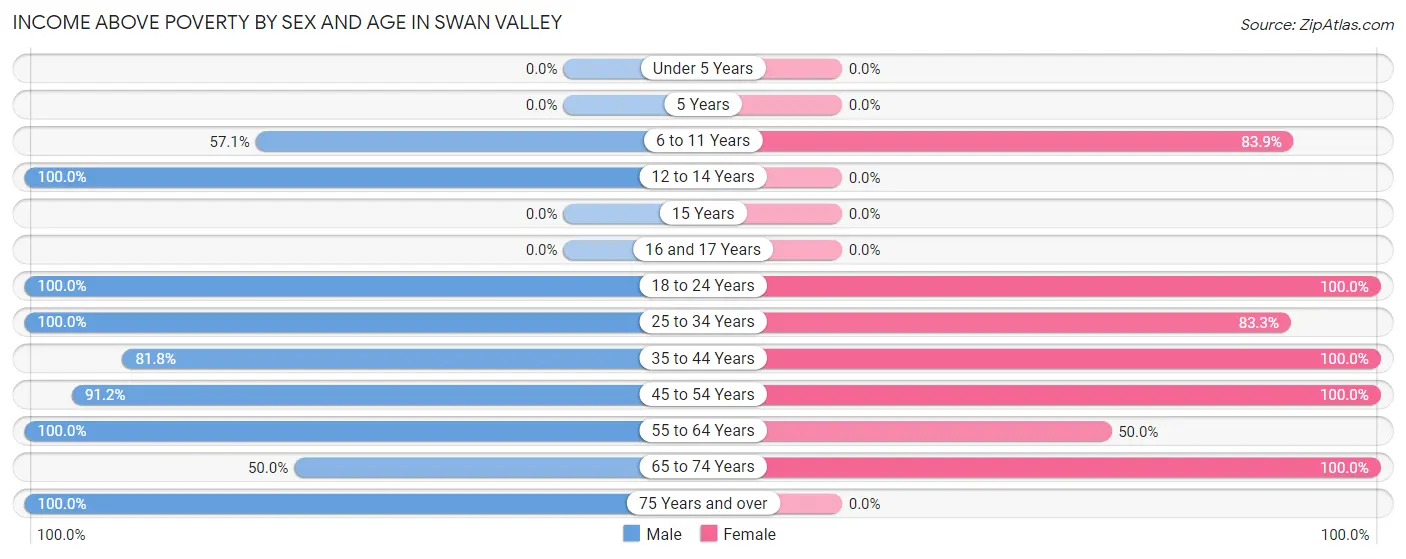
| Age Bracket | Male | Female |
| Under 5 Years | 0 (0.0%) | 0 (0.0%) |
| 5 Years | 0 (0.0%) | 0 (0.0%) |
| 6 to 11 Years | 4 (57.1%) | 26 (83.9%) |
| 12 to 14 Years | 23 (100.0%) | 0 (0.0%) |
| 15 Years | 0 (0.0%) | 0 (0.0%) |
| 16 and 17 Years | 0 (0.0%) | 0 (0.0%) |
| 18 to 24 Years | 12 (100.0%) | 8 (100.0%) |
| 25 to 34 Years | 11 (100.0%) | 10 (83.3%) |
| 35 to 44 Years | 9 (81.8%) | 27 (100.0%) |
| 45 to 54 Years | 31 (91.2%) | 10 (100.0%) |
| 55 to 64 Years | 9 (100.0%) | 4 (50.0%) |
| 65 to 74 Years | 5 (50.0%) | 27 (100.0%) |
| 75 Years and over | 11 (100.0%) | 0 (0.0%) |
| Total | 115 (87.1%) | 112 (91.1%) |
Income Below Poverty Among Married-Couple Families in Swan Valley
The poverty statistics for married-couple families in Swan Valley show that 9.7% or 7 of the total 72 families live below the poverty line. Families with 5 or more children have the highest poverty rate of 100.0%, comprising of 2 families. On the other hand, families with 1 or 2 children have the lowest poverty rate of 0.0%, which includes 0 families.
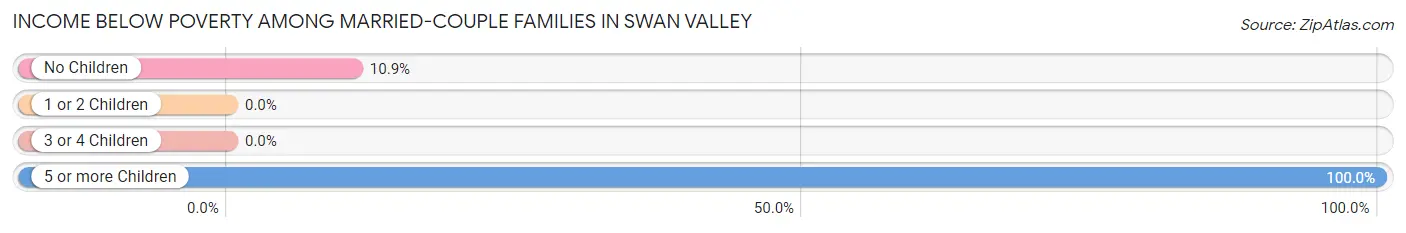
| Children | Above Poverty | Below Poverty |
| No Children | 41 (89.1%) | 5 (10.9%) |
| 1 or 2 Children | 24 (100.0%) | 0 (0.0%) |
| 3 or 4 Children | 0 (0.0%) | 0 (0.0%) |
| 5 or more Children | 0 (0.0%) | 2 (100.0%) |
| Total | 65 (90.3%) | 7 (9.7%) |
Income Below Poverty Among Single-Parent Households in Swan Valley
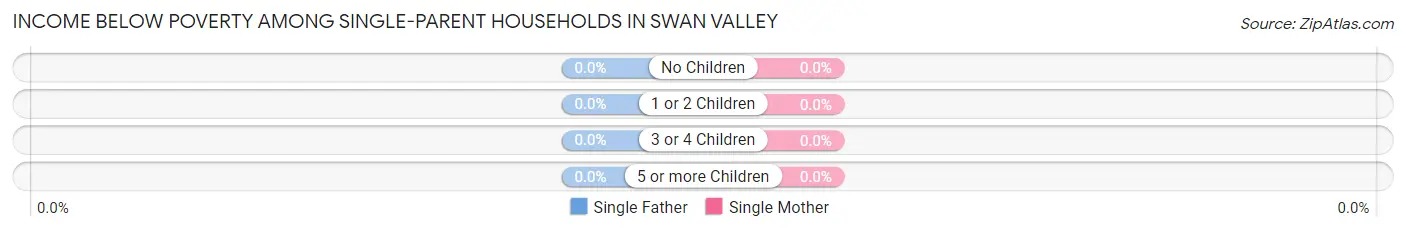
| Children | Single Father | Single Mother |
| No Children | 0 (0.0%) | 0 (0.0%) |
| 1 or 2 Children | 0 (0.0%) | 0 (0.0%) |
| 3 or 4 Children | 0 (0.0%) | 0 (0.0%) |
| 5 or more Children | 0 (0.0%) | 0 (0.0%) |
| Total | 0 (0.0%) | 0 (0.0%) |
Income Below Poverty Among Married-Couple vs Single-Parent Households in Swan Valley
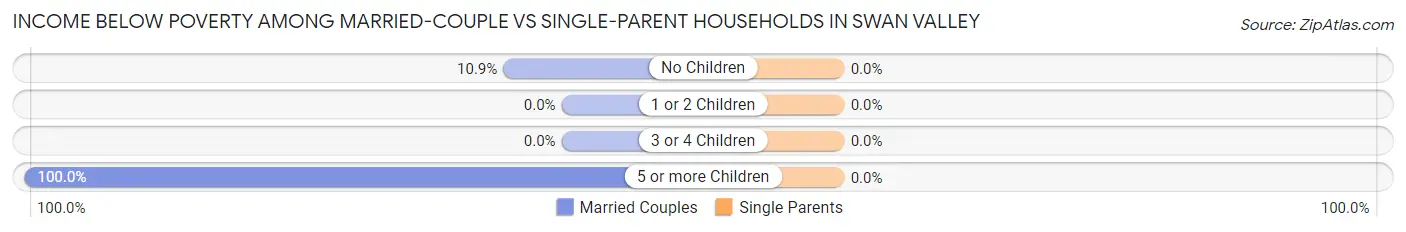
| Children | Married-Couple Families | Single-Parent Households |
| No Children | 5 (10.9%) | 0 (0.0%) |
| 1 or 2 Children | 0 (0.0%) | 0 (0.0%) |
| 3 or 4 Children | 0 (0.0%) | 0 (0.0%) |
| 5 or more Children | 2 (100.0%) | 0 (0.0%) |
| Total | 7 (9.7%) | 0 (0.0%) |
Employment Characteristics in Swan Valley
Employment by Class of Employer in Swan Valley
Among the 111 employed individuals in Swan Valley, private company employees (70 | 63.1%), self-employed (incorporated) (21 | 18.9%), and self-employed (not incorporated) (15 | 13.5%) make up the most common classes of employment.
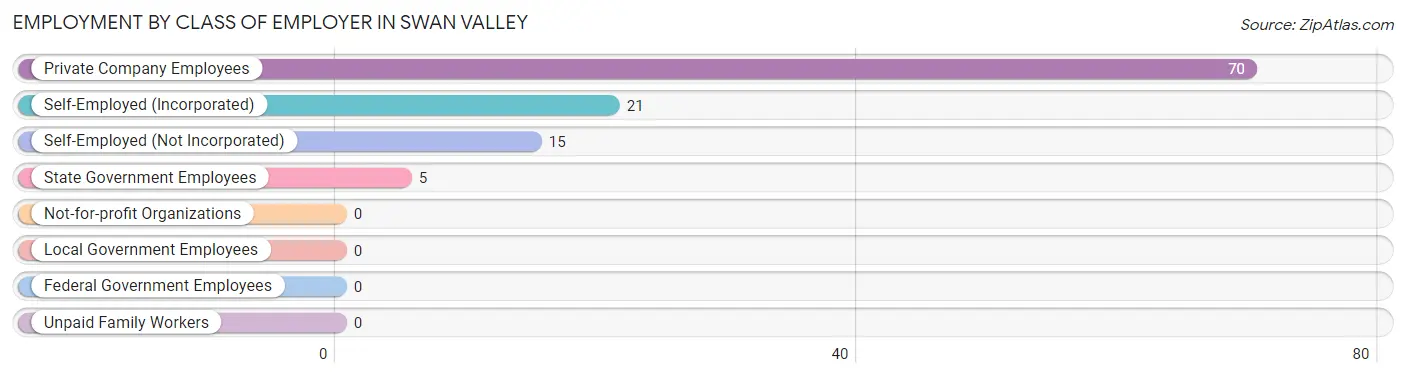
| Employer Class | # Employees | % Employees |
| Private Company Employees | 70 | 63.1% |
| Self-Employed (Incorporated) | 21 | 18.9% |
| Self-Employed (Not Incorporated) | 15 | 13.5% |
| Not-for-profit Organizations | 0 | 0.0% |
| Local Government Employees | 0 | 0.0% |
| State Government Employees | 5 | 4.5% |
| Federal Government Employees | 0 | 0.0% |
| Unpaid Family Workers | 0 | 0.0% |
| Total | 111 | 100.0% |
Employment Status by Age in Swan Valley
According to the labor force statistics for Swan Valley, out of the total population over 16 years of age (190), 62.1% or 118 individuals are in the labor force, with 5.9% or 7 of them unemployed. The age group with the highest labor force participation rate is 16 to 19 years, with 100.0% or 6 individuals in the labor force. Within the labor force, the 30 to 34 years age range has the highest percentage of unemployed individuals, with 53.8% or 7 of them being unemployed.
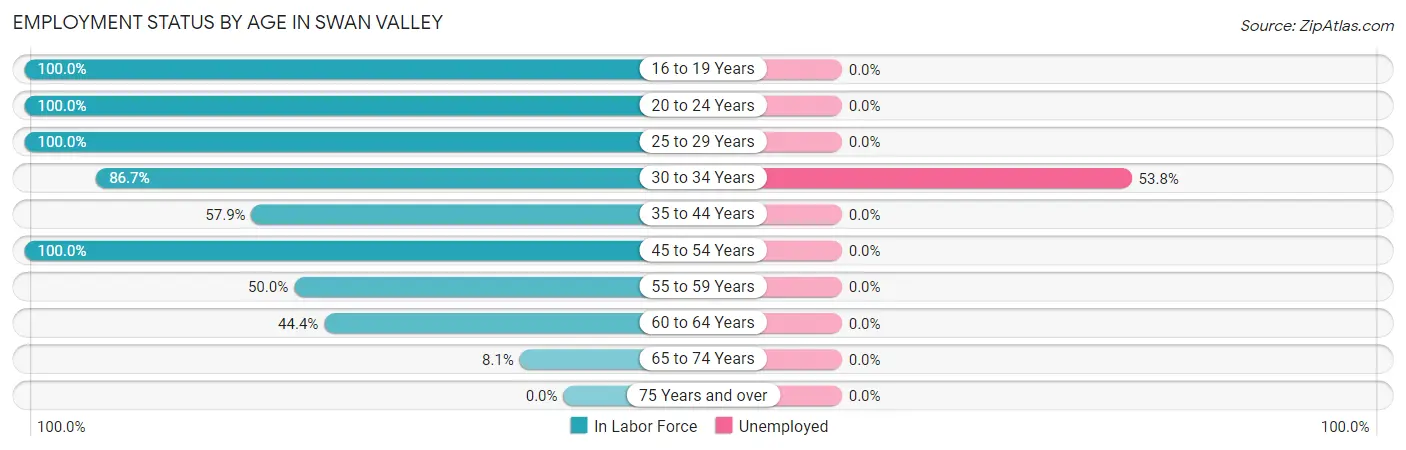
| Age Bracket | In Labor Force | Unemployed |
| 16 to 19 Years | 6 (100.0%) | 0 (0.0%) |
| 20 to 24 Years | 14 (100.0%) | 0 (0.0%) |
| 25 to 29 Years | 8 (100.0%) | 0 (0.0%) |
| 30 to 34 Years | 13 (86.7%) | 7 (53.8%) |
| 35 to 44 Years | 22 (57.9%) | 0 (0.0%) |
| 45 to 54 Years | 44 (100.0%) | 0 (0.0%) |
| 55 to 59 Years | 4 (50.0%) | 0 (0.0%) |
| 60 to 64 Years | 4 (44.4%) | 0 (0.0%) |
| 65 to 74 Years | 3 (8.1%) | 0 (0.0%) |
| 75 Years and over | 0 (0.0%) | 0 (0.0%) |
| Total | 118 (62.1%) | 7 (5.9%) |
Employment Status by Educational Attainment in Swan Valley
According to labor force statistics for Swan Valley, 77.9% of individuals (95) out of the total population between 25 and 64 years of age (122) are in the labor force, with 7.4% or 7 of them being unemployed. The group with the highest labor force participation rate are those with the educational attainment of college / associate degree, with 100.0% or 38 individuals in the labor force. Within the labor force, individuals with college / associate degree education have the highest percentage of unemployment, with 18.4% or 7 of them being unemployed.
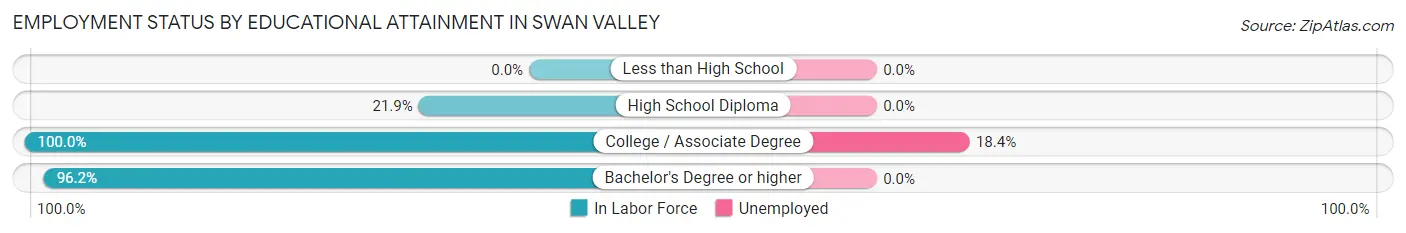
| Educational Attainment | In Labor Force | Unemployed |
| Less than High School | 0 (0.0%) | 0 (0.0%) |
| High School Diploma | 7 (21.9%) | 0 (0.0%) |
| College / Associate Degree | 38 (100.0%) | 7 (18.4%) |
| Bachelor's Degree or higher | 50 (96.2%) | 0 (0.0%) |
| Total | 95 (77.9%) | 9 (7.4%) |
Employment Occupations by Sex in Swan Valley
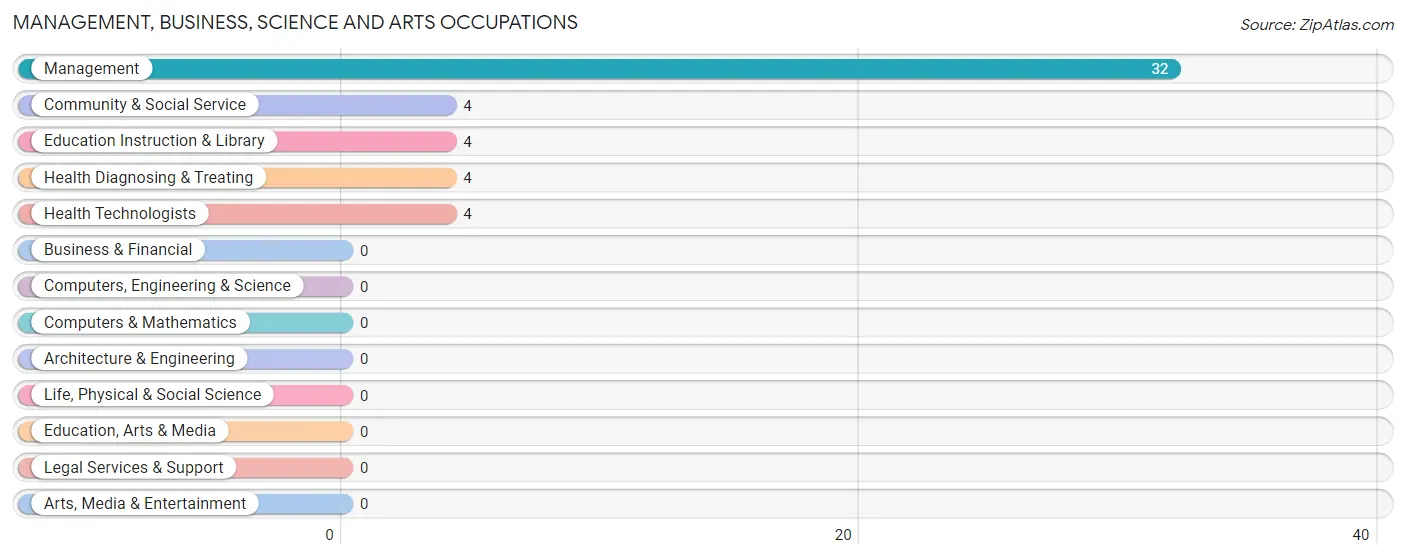
Management, Business, Science and Arts Occupations
The most common Management, Business, Science and Arts occupations in Swan Valley are Management (32 | 28.8%), Community & Social Service (4 | 3.6%), Education Instruction & Library (4 | 3.6%), Health Diagnosing & Treating (4 | 3.6%), and Health Technologists (4 | 3.6%).
Management, Business, Science and Arts Occupations by Sex
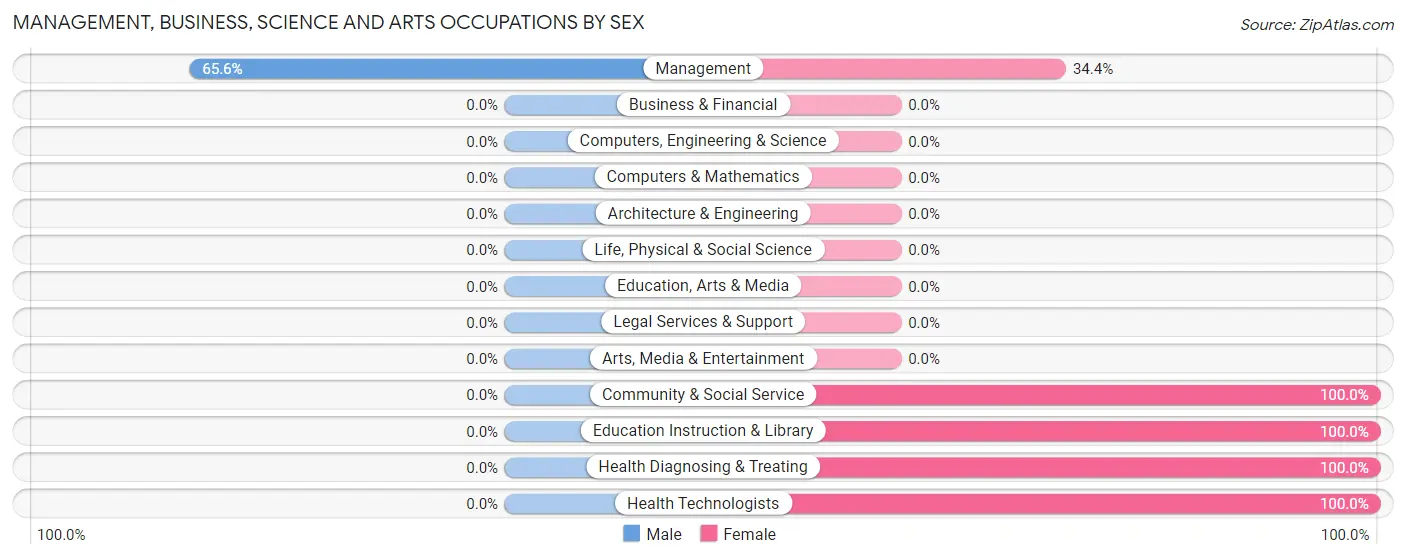
| Occupation | Male | Female |
| Management | 21 (65.6%) | 11 (34.4%) |
| Business & Financial | 0 (0.0%) | 0 (0.0%) |
| Computers, Engineering & Science | 0 (0.0%) | 0 (0.0%) |
| Computers & Mathematics | 0 (0.0%) | 0 (0.0%) |
| Architecture & Engineering | 0 (0.0%) | 0 (0.0%) |
| Life, Physical & Social Science | 0 (0.0%) | 0 (0.0%) |
| Community & Social Service | 0 (0.0%) | 4 (100.0%) |
| Education, Arts & Media | 0 (0.0%) | 0 (0.0%) |
| Legal Services & Support | 0 (0.0%) | 0 (0.0%) |
| Education Instruction & Library | 0 (0.0%) | 4 (100.0%) |
| Arts, Media & Entertainment | 0 (0.0%) | 0 (0.0%) |
| Health Diagnosing & Treating | 0 (0.0%) | 4 (100.0%) |
| Health Technologists | 0 (0.0%) | 4 (100.0%) |
| Total (Category) | 21 (52.5%) | 19 (47.5%) |
| Total (Overall) | 65 (58.6%) | 46 (41.4%) |
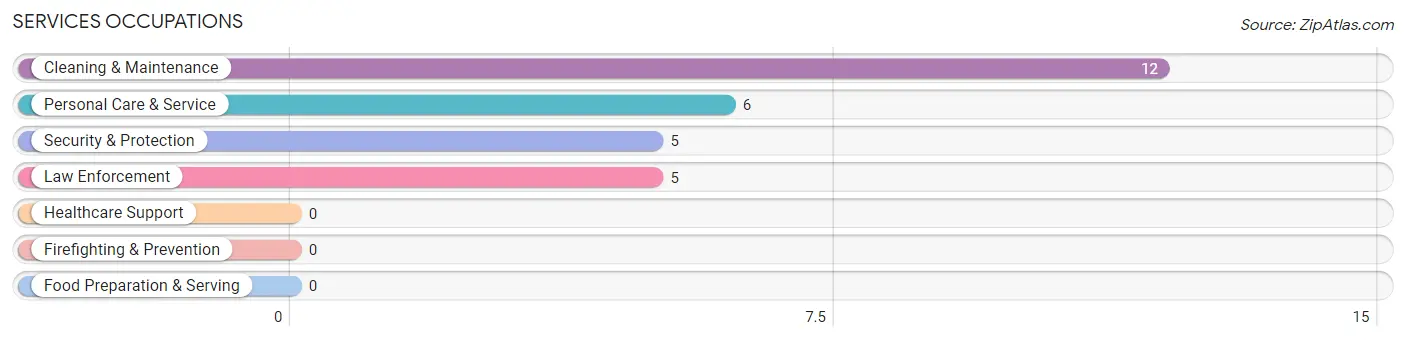
Services Occupations
The most common Services occupations in Swan Valley are Cleaning & Maintenance (12 | 10.8%), Personal Care & Service (6 | 5.4%), Security & Protection (5 | 4.5%), and Law Enforcement (5 | 4.5%).
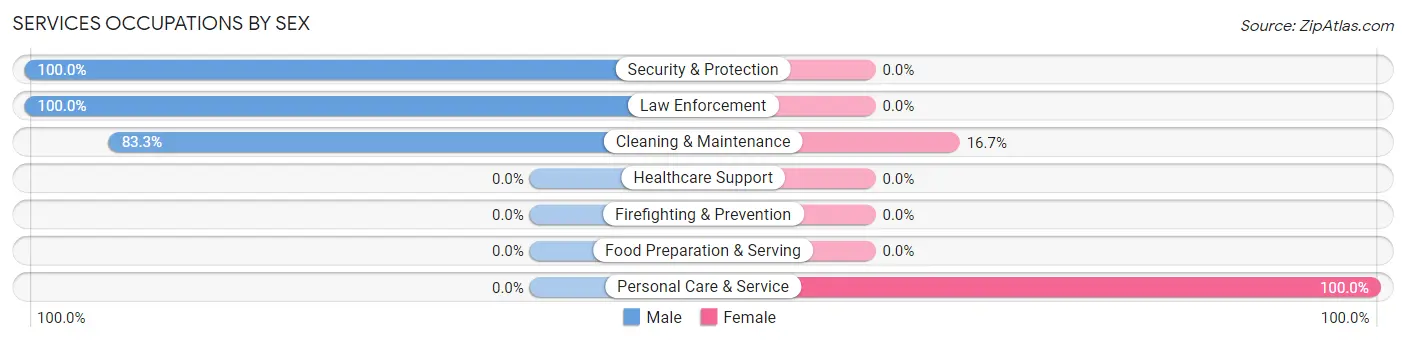
Services Occupations by Sex
Within the Services occupations in Swan Valley, the most male-oriented occupations are Security & Protection (100.0%), Law Enforcement (100.0%), and Cleaning & Maintenance (83.3%), while the most female-oriented occupations are Personal Care & Service (100.0%), and Cleaning & Maintenance (16.7%).
| Occupation | Male | Female |
| Healthcare Support | 0 (0.0%) | 0 (0.0%) |
| Security & Protection | 5 (100.0%) | 0 (0.0%) |
| Firefighting & Prevention | 0 (0.0%) | 0 (0.0%) |
| Law Enforcement | 5 (100.0%) | 0 (0.0%) |
| Food Preparation & Serving | 0 (0.0%) | 0 (0.0%) |
| Cleaning & Maintenance | 10 (83.3%) | 2 (16.7%) |
| Personal Care & Service | 0 (0.0%) | 6 (100.0%) |
| Total (Category) | 15 (65.2%) | 8 (34.8%) |
| Total (Overall) | 65 (58.6%) | 46 (41.4%) |
Sales and Office Occupations
The most common Sales and Office occupations in Swan Valley are Sales & Related (9 | 8.1%), and Office & Administration (5 | 4.5%).
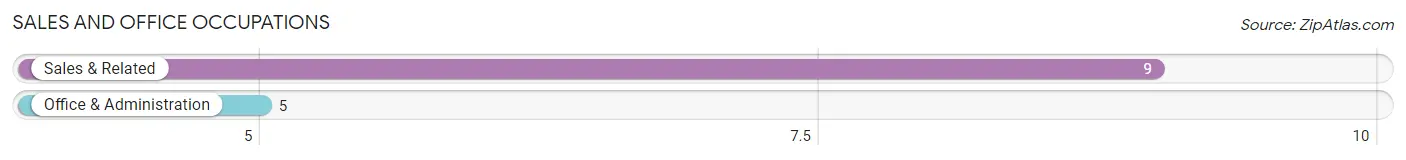
Sales and Office Occupations by Sex
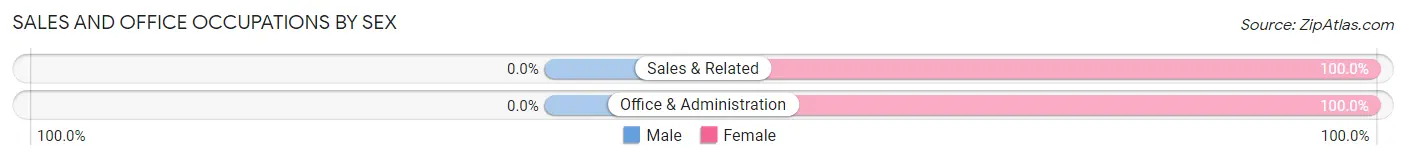
| Occupation | Male | Female |
| Sales & Related | 0 (0.0%) | 9 (100.0%) |
| Office & Administration | 0 (0.0%) | 5 (100.0%) |
| Total (Category) | 0 (0.0%) | 14 (100.0%) |
| Total (Overall) | 65 (58.6%) | 46 (41.4%) |
Natural Resources, Construction and Maintenance Occupations
The most common Natural Resources, Construction and Maintenance occupations in Swan Valley are Construction & Extraction (8 | 7.2%), and Installation, Maintenance & Repair (4 | 3.6%).
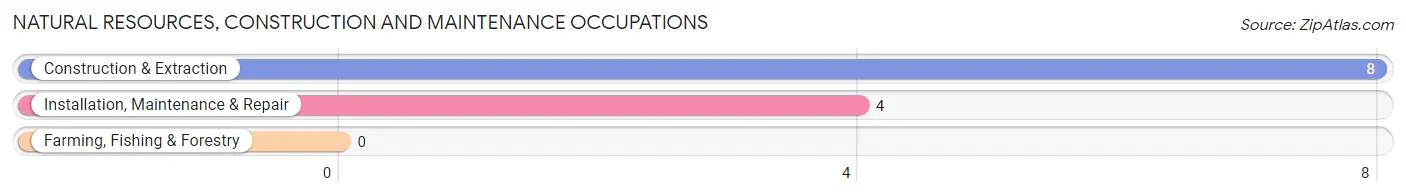
Natural Resources, Construction and Maintenance Occupations by Sex
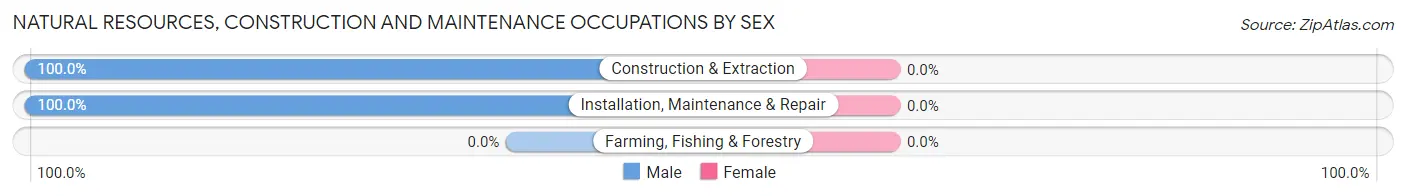
| Occupation | Male | Female |
| Farming, Fishing & Forestry | 0 (0.0%) | 0 (0.0%) |
| Construction & Extraction | 8 (100.0%) | 0 (0.0%) |
| Installation, Maintenance & Repair | 4 (100.0%) | 0 (0.0%) |
| Total (Category) | 12 (100.0%) | 0 (0.0%) |
| Total (Overall) | 65 (58.6%) | 46 (41.4%) |
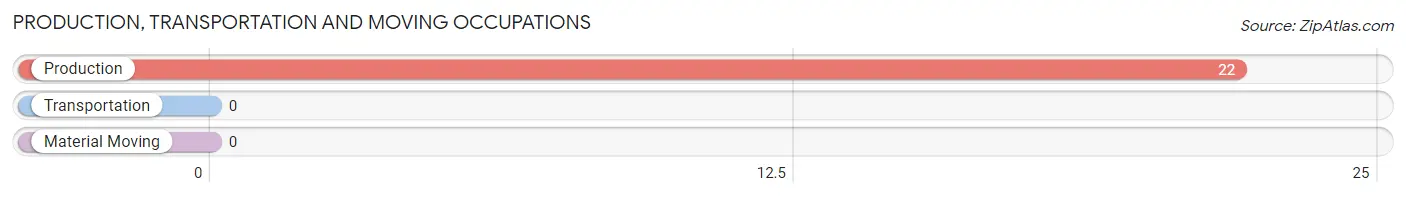
Production, Transportation and Moving Occupations
The most common Production, Transportation and Moving occupations in Swan Valley are , and Production (22 | 19.8%).
Production, Transportation and Moving Occupations by Sex
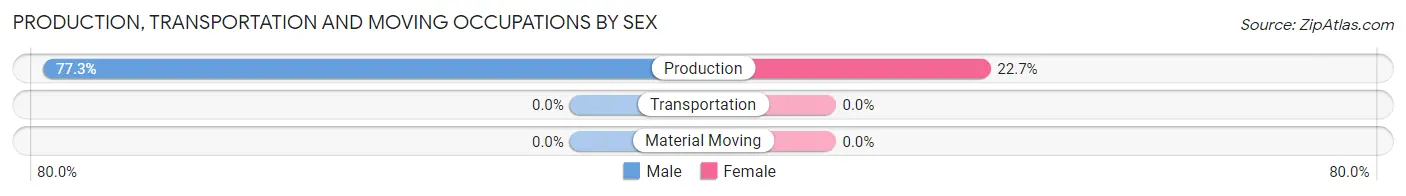
| Occupation | Male | Female |
| Production | 17 (77.3%) | 5 (22.7%) |
| Transportation | 0 (0.0%) | 0 (0.0%) |
| Material Moving | 0 (0.0%) | 0 (0.0%) |
| Total (Category) | 17 (77.3%) | 5 (22.7%) |
| Total (Overall) | 65 (58.6%) | 46 (41.4%) |
Employment Industries by Sex in Swan Valley
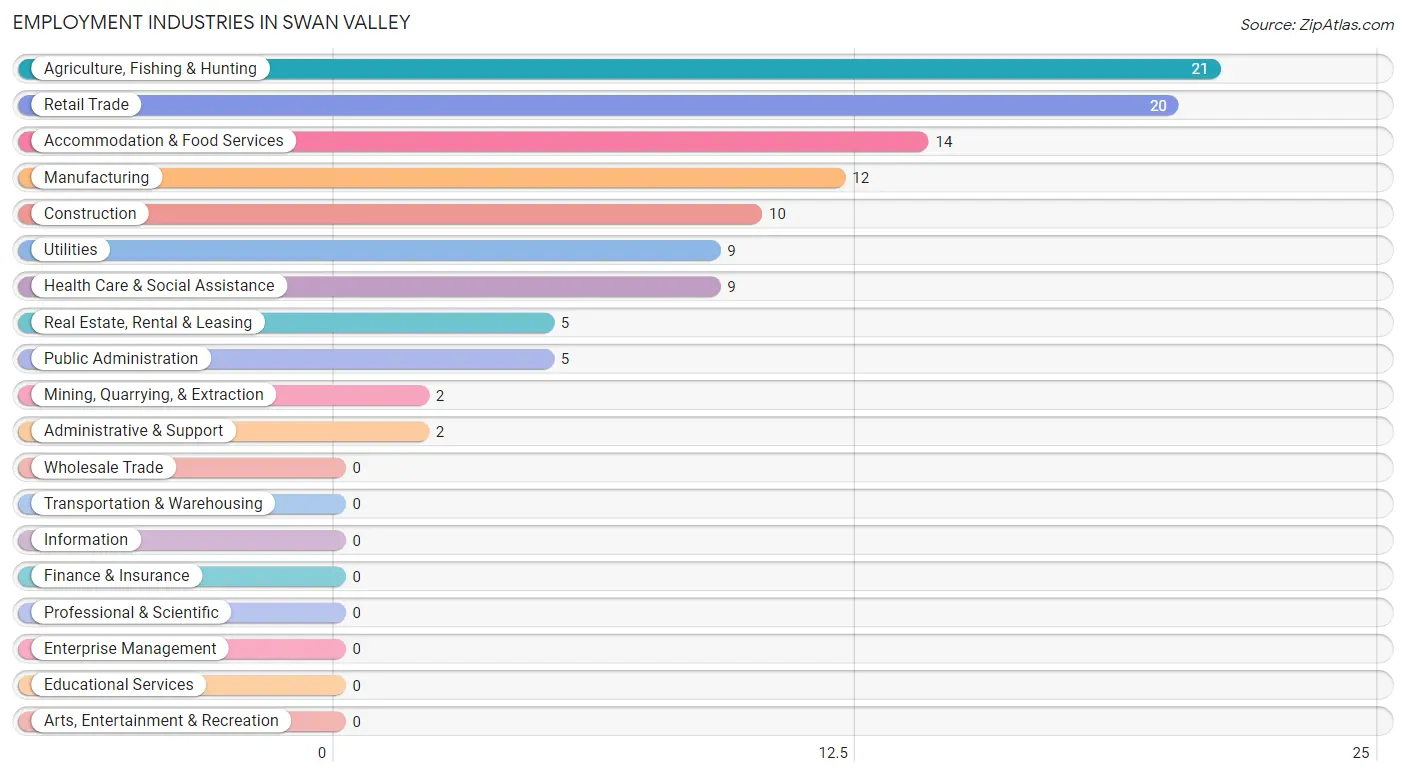
Employment Industries in Swan Valley
The major employment industries in Swan Valley include Agriculture, Fishing & Hunting (21 | 18.9%), Retail Trade (20 | 18.0%), Accommodation & Food Services (14 | 12.6%), Manufacturing (12 | 10.8%), and Construction (10 | 9.0%).
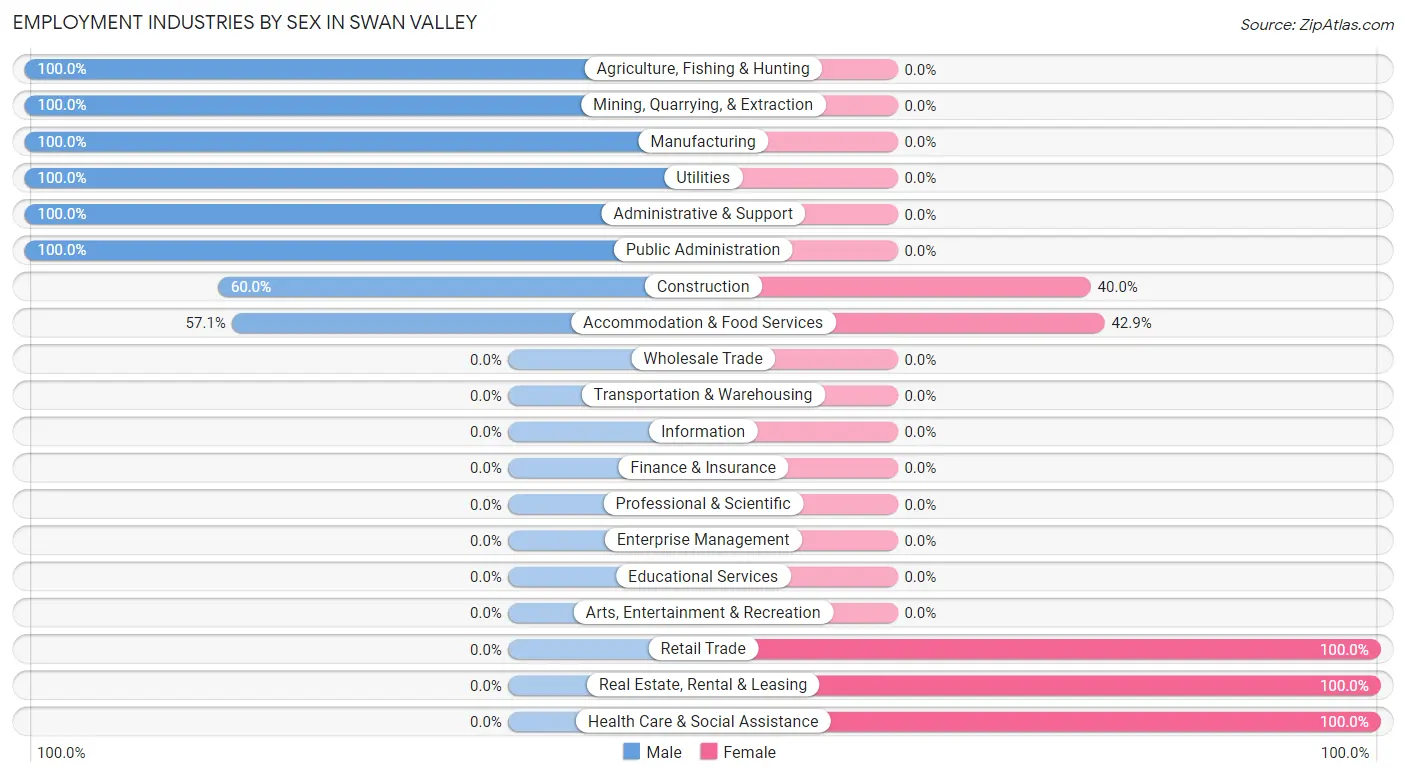
Employment Industries by Sex in Swan Valley
The Swan Valley industries that see more men than women are Agriculture, Fishing & Hunting (100.0%), Mining, Quarrying, & Extraction (100.0%), and Manufacturing (100.0%), whereas the industries that tend to have a higher number of women are Retail Trade (100.0%), Real Estate, Rental & Leasing (100.0%), and Health Care & Social Assistance (100.0%).
| Industry | Male | Female |
| Agriculture, Fishing & Hunting | 21 (100.0%) | 0 (0.0%) |
| Mining, Quarrying, & Extraction | 2 (100.0%) | 0 (0.0%) |
| Construction | 6 (60.0%) | 4 (40.0%) |
| Manufacturing | 12 (100.0%) | 0 (0.0%) |
| Wholesale Trade | 0 (0.0%) | 0 (0.0%) |
| Retail Trade | 0 (0.0%) | 20 (100.0%) |
| Transportation & Warehousing | 0 (0.0%) | 0 (0.0%) |
| Utilities | 9 (100.0%) | 0 (0.0%) |
| Information | 0 (0.0%) | 0 (0.0%) |
| Finance & Insurance | 0 (0.0%) | 0 (0.0%) |
| Real Estate, Rental & Leasing | 0 (0.0%) | 5 (100.0%) |
| Professional & Scientific | 0 (0.0%) | 0 (0.0%) |
| Enterprise Management | 0 (0.0%) | 0 (0.0%) |
| Administrative & Support | 2 (100.0%) | 0 (0.0%) |
| Educational Services | 0 (0.0%) | 0 (0.0%) |
| Health Care & Social Assistance | 0 (0.0%) | 9 (100.0%) |
| Arts, Entertainment & Recreation | 0 (0.0%) | 0 (0.0%) |
| Accommodation & Food Services | 8 (57.1%) | 6 (42.9%) |
| Public Administration | 5 (100.0%) | 0 (0.0%) |
| Total | 65 (58.6%) | 46 (41.4%) |
Education in Swan Valley
School Enrollment in Swan Valley
The most common levels of schooling among the 65 students in Swan Valley are elementary school (34 | 52.3%), middle school (27 | 41.5%), and nursery / preschool (2 | 3.1%).
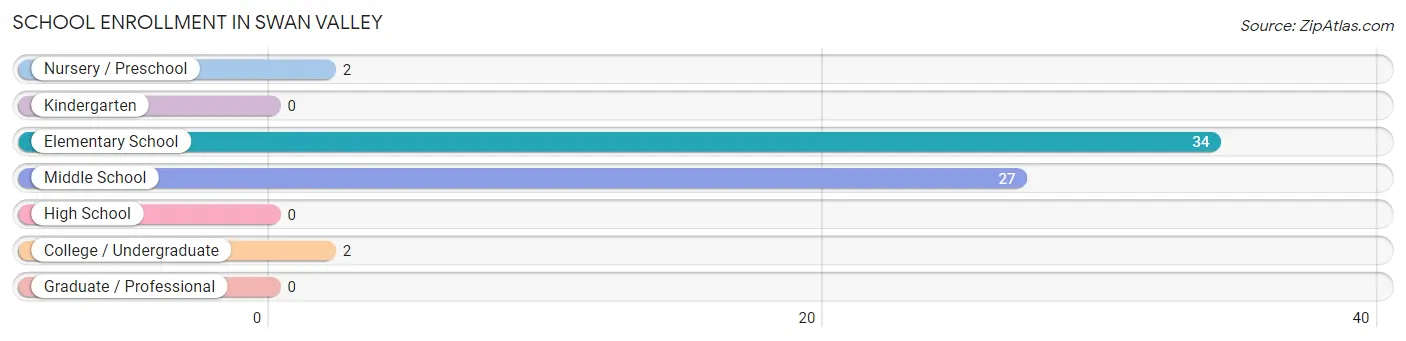
| School Level | # Students | % Students |
| Nursery / Preschool | 2 | 3.1% |
| Kindergarten | 0 | 0.0% |
| Elementary School | 34 | 52.3% |
| Middle School | 27 | 41.5% |
| High School | 0 | 0.0% |
| College / Undergraduate | 2 | 3.1% |
| Graduate / Professional | 0 | 0.0% |
| Total | 65 | 100.0% |
School Enrollment by Age by Funding Source in Swan Valley
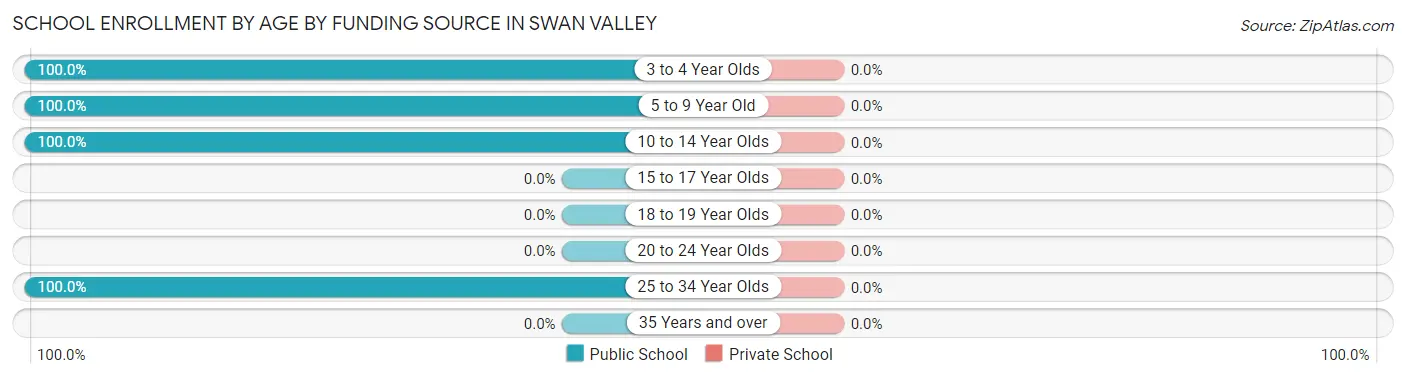
| Age Bracket | Public School | Private School |
| 3 to 4 Year Olds | 2 (100.0%) | 0 (0.0%) |
| 5 to 9 Year Old | 31 (100.0%) | 0 (0.0%) |
| 10 to 14 Year Olds | 30 (100.0%) | 0 (0.0%) |
| 15 to 17 Year Olds | 0 (0.0%) | 0 (0.0%) |
| 18 to 19 Year Olds | 0 (0.0%) | 0 (0.0%) |
| 20 to 24 Year Olds | 0 (0.0%) | 0 (0.0%) |
| 25 to 34 Year Olds | 2 (100.0%) | 0 (0.0%) |
| 35 Years and over | 0 (0.0%) | 0 (0.0%) |
| Total | 65 (100.0%) | 0 (0.0%) |
Educational Attainment by Field of Study in Swan Valley
Business (60 | 74.1%), science & technology (7 | 8.6%), physical & health sciences (5 | 6.2%), engineering (4 | 4.9%), and bio, nature & agricultural (3 | 3.7%) are the most common fields of study among 81 individuals in Swan Valley who have obtained a bachelor's degree or higher.
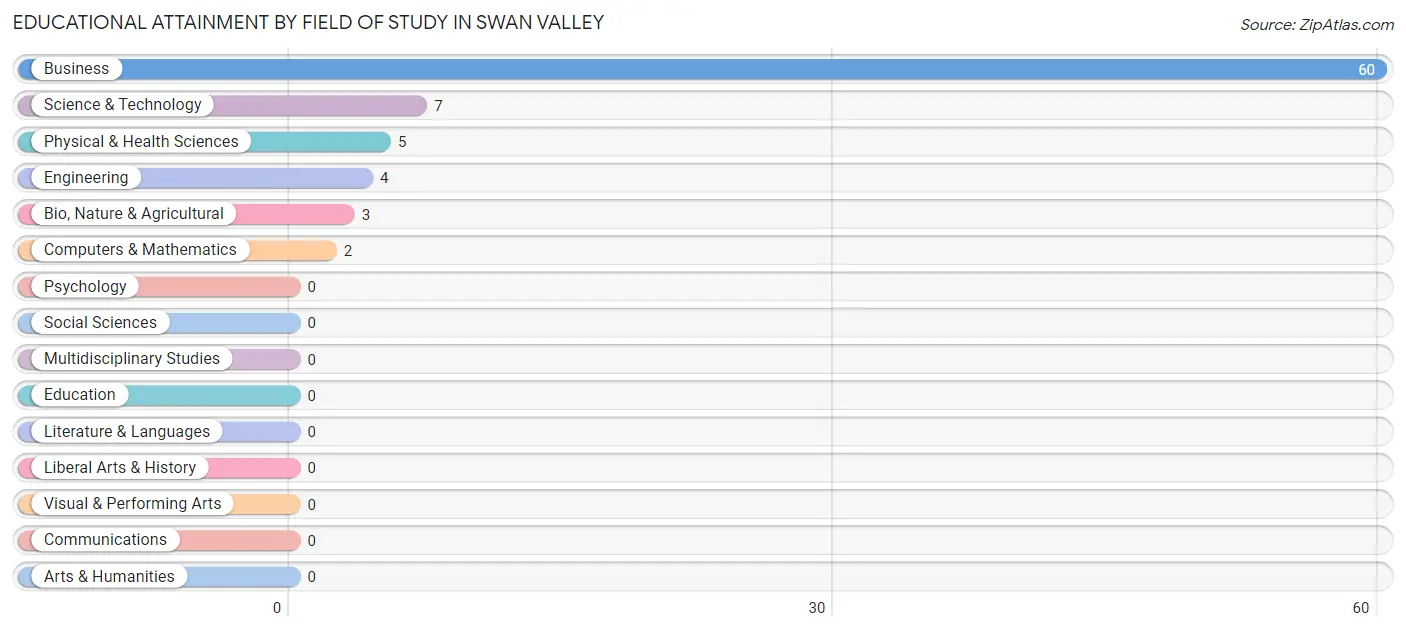
| Field of Study | # Graduates | % Graduates |
| Computers & Mathematics | 2 | 2.5% |
| Bio, Nature & Agricultural | 3 | 3.7% |
| Physical & Health Sciences | 5 | 6.2% |
| Psychology | 0 | 0.0% |
| Social Sciences | 0 | 0.0% |
| Engineering | 4 | 4.9% |
| Multidisciplinary Studies | 0 | 0.0% |
| Science & Technology | 7 | 8.6% |
| Business | 60 | 74.1% |
| Education | 0 | 0.0% |
| Literature & Languages | 0 | 0.0% |
| Liberal Arts & History | 0 | 0.0% |
| Visual & Performing Arts | 0 | 0.0% |
| Communications | 0 | 0.0% |
| Arts & Humanities | 0 | 0.0% |
| Total | 81 | 100.0% |
Transportation & Commute in Swan Valley
Vehicle Availability by Sex in Swan Valley
The most prevalent vehicle ownership categories in Swan Valley are males with 4 vehicles (23, accounting for 38.3%) and females with 4 vehicles (9, making up 50.0%).
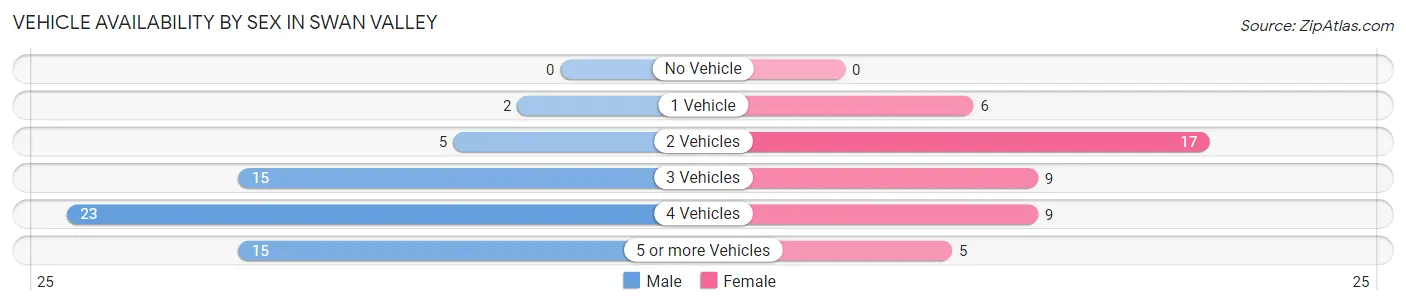
| Vehicles Available | Male | Female |
| No Vehicle | 0 (0.0%) | 0 (0.0%) |
| 1 Vehicle | 2 (3.3%) | 6 (13.0%) |
| 2 Vehicles | 5 (8.3%) | 17 (37.0%) |
| 3 Vehicles | 15 (25.0%) | 9 (19.6%) |
| 4 Vehicles | 23 (38.3%) | 9 (19.6%) |
| 5 or more Vehicles | 15 (25.0%) | 5 (10.9%) |
| Total | 60 (100.0%) | 46 (100.0%) |
Commute Time in Swan Valley
The most frequently occuring commute durations in Swan Valley are 20 to 24 minutes (25 commuters, 29.8%), less than 5 minutes (16 commuters, 19.1%), and 60 to 89 minutes (14 commuters, 16.7%).
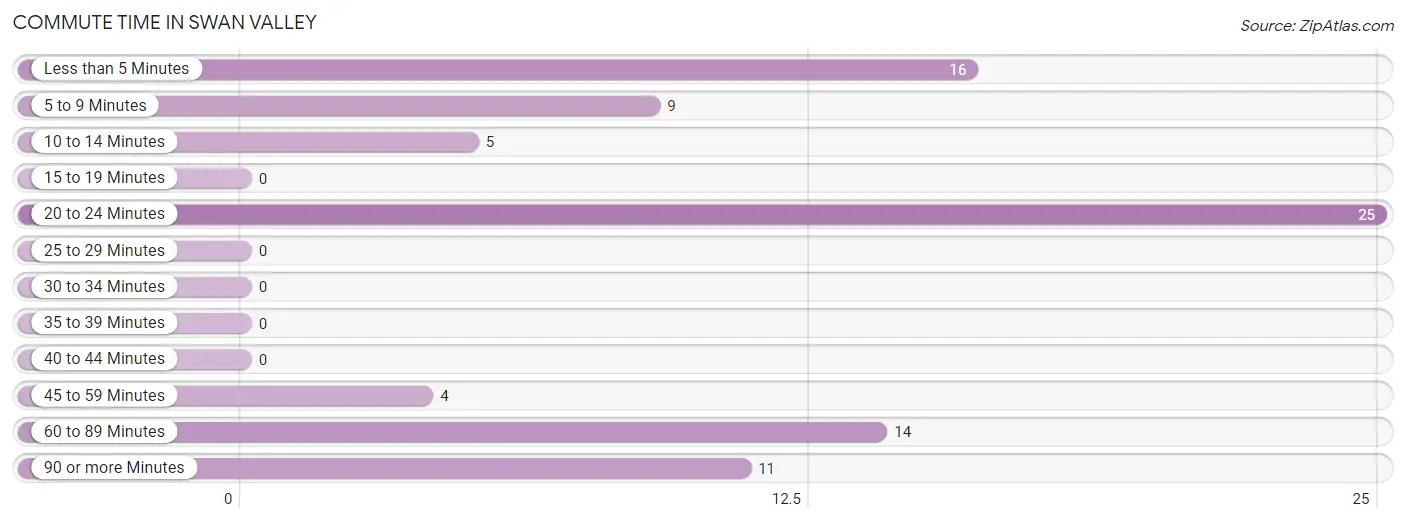
| Commute Time | # Commuters | % Commuters |
| Less than 5 Minutes | 16 | 19.1% |
| 5 to 9 Minutes | 9 | 10.7% |
| 10 to 14 Minutes | 5 | 5.9% |
| 15 to 19 Minutes | 0 | 0.0% |
| 20 to 24 Minutes | 25 | 29.8% |
| 25 to 29 Minutes | 0 | 0.0% |
| 30 to 34 Minutes | 0 | 0.0% |
| 35 to 39 Minutes | 0 | 0.0% |
| 40 to 44 Minutes | 0 | 0.0% |
| 45 to 59 Minutes | 4 | 4.8% |
| 60 to 89 Minutes | 14 | 16.7% |
| 90 or more Minutes | 11 | 13.1% |
Commute Time by Sex in Swan Valley
The most common commute times in Swan Valley are 20 to 24 minutes (21 commuters, 38.2%) for males and less than 5 minutes (16 commuters, 55.2%) for females.
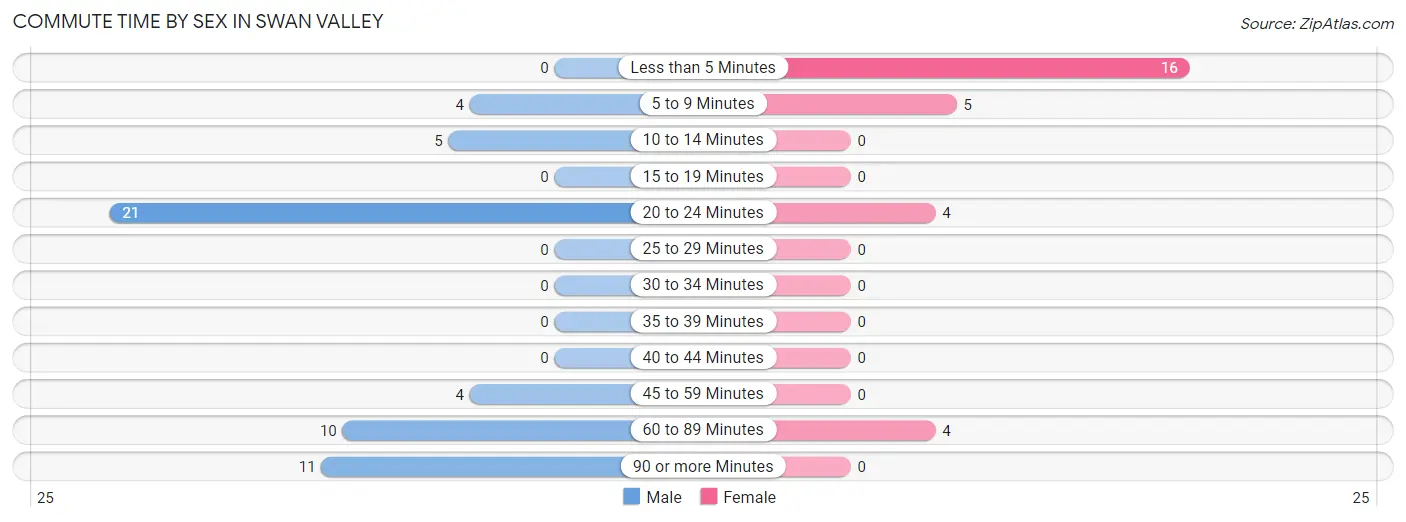
| Commute Time | Male | Female |
| Less than 5 Minutes | 0 (0.0%) | 16 (55.2%) |
| 5 to 9 Minutes | 4 (7.3%) | 5 (17.2%) |
| 10 to 14 Minutes | 5 (9.1%) | 0 (0.0%) |
| 15 to 19 Minutes | 0 (0.0%) | 0 (0.0%) |
| 20 to 24 Minutes | 21 (38.2%) | 4 (13.8%) |
| 25 to 29 Minutes | 0 (0.0%) | 0 (0.0%) |
| 30 to 34 Minutes | 0 (0.0%) | 0 (0.0%) |
| 35 to 39 Minutes | 0 (0.0%) | 0 (0.0%) |
| 40 to 44 Minutes | 0 (0.0%) | 0 (0.0%) |
| 45 to 59 Minutes | 4 (7.3%) | 0 (0.0%) |
| 60 to 89 Minutes | 10 (18.2%) | 4 (13.8%) |
| 90 or more Minutes | 11 (20.0%) | 0 (0.0%) |
Time of Departure to Work by Sex in Swan Valley
The most frequent times of departure to work in Swan Valley are 5:30 AM to 5:59 AM (25, 45.5%) for males and 6:30 AM to 6:59 AM (11, 37.9%) for females.
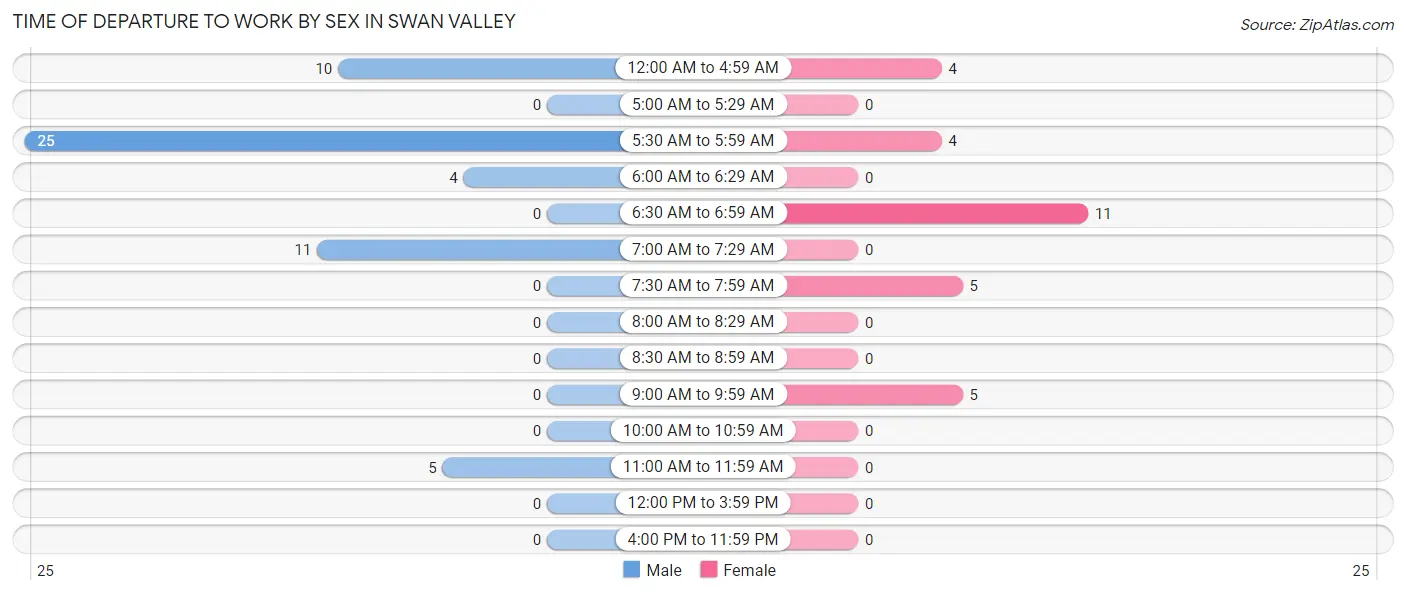
| Time of Departure | Male | Female |
| 12:00 AM to 4:59 AM | 10 (18.2%) | 4 (13.8%) |
| 5:00 AM to 5:29 AM | 0 (0.0%) | 0 (0.0%) |
| 5:30 AM to 5:59 AM | 25 (45.5%) | 4 (13.8%) |
| 6:00 AM to 6:29 AM | 4 (7.3%) | 0 (0.0%) |
| 6:30 AM to 6:59 AM | 0 (0.0%) | 11 (37.9%) |
| 7:00 AM to 7:29 AM | 11 (20.0%) | 0 (0.0%) |
| 7:30 AM to 7:59 AM | 0 (0.0%) | 5 (17.2%) |
| 8:00 AM to 8:29 AM | 0 (0.0%) | 0 (0.0%) |
| 8:30 AM to 8:59 AM | 0 (0.0%) | 0 (0.0%) |
| 9:00 AM to 9:59 AM | 0 (0.0%) | 5 (17.2%) |
| 10:00 AM to 10:59 AM | 0 (0.0%) | 0 (0.0%) |
| 11:00 AM to 11:59 AM | 5 (9.1%) | 0 (0.0%) |
| 12:00 PM to 3:59 PM | 0 (0.0%) | 0 (0.0%) |
| 4:00 PM to 11:59 PM | 0 (0.0%) | 0 (0.0%) |
| Total | 55 (100.0%) | 29 (100.0%) |
Housing Occupancy in Swan Valley
Occupancy by Ownership in Swan Valley
Of the total 90 dwellings in Swan Valley, owner-occupied units account for 81 (90.0%), while renter-occupied units make up 9 (10.0%).
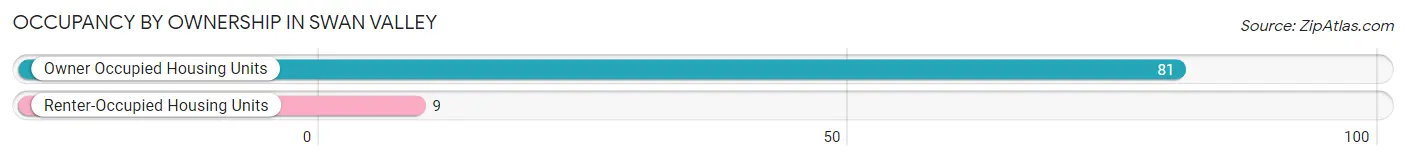
| Occupancy | # Housing Units | % Housing Units |
| Owner Occupied Housing Units | 81 | 90.0% |
| Renter-Occupied Housing Units | 9 | 10.0% |
| Total Occupied Housing Units | 90 | 100.0% |
Occupancy by Household Size in Swan Valley
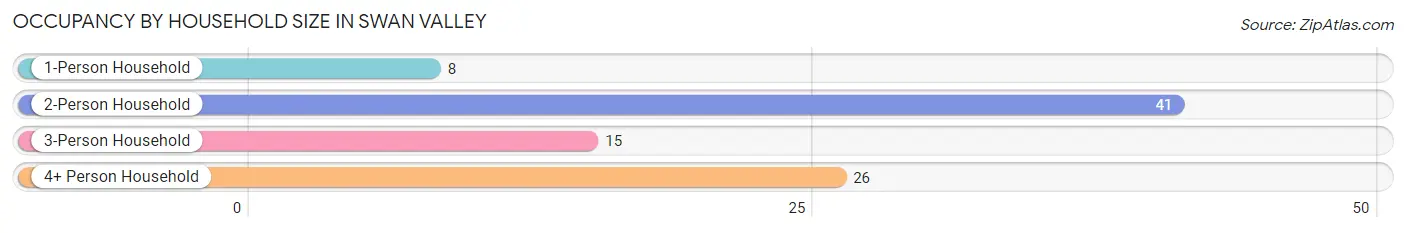
| Household Size | # Housing Units | % Housing Units |
| 1-Person Household | 8 | 8.9% |
| 2-Person Household | 41 | 45.6% |
| 3-Person Household | 15 | 16.7% |
| 4+ Person Household | 26 | 28.9% |
| Total Housing Units | 90 | 100.0% |
Occupancy by Ownership by Household Size in Swan Valley
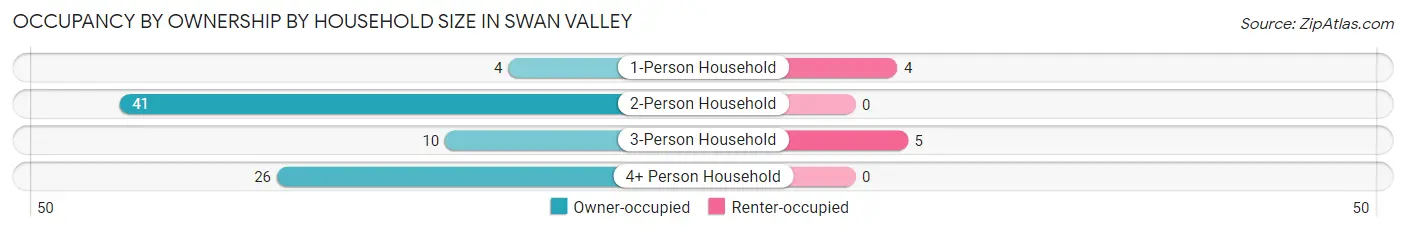
| Household Size | Owner-occupied | Renter-occupied |
| 1-Person Household | 4 (50.0%) | 4 (50.0%) |
| 2-Person Household | 41 (100.0%) | 0 (0.0%) |
| 3-Person Household | 10 (66.7%) | 5 (33.3%) |
| 4+ Person Household | 26 (100.0%) | 0 (0.0%) |
| Total Housing Units | 81 (90.0%) | 9 (10.0%) |
Occupancy by Educational Attainment in Swan Valley
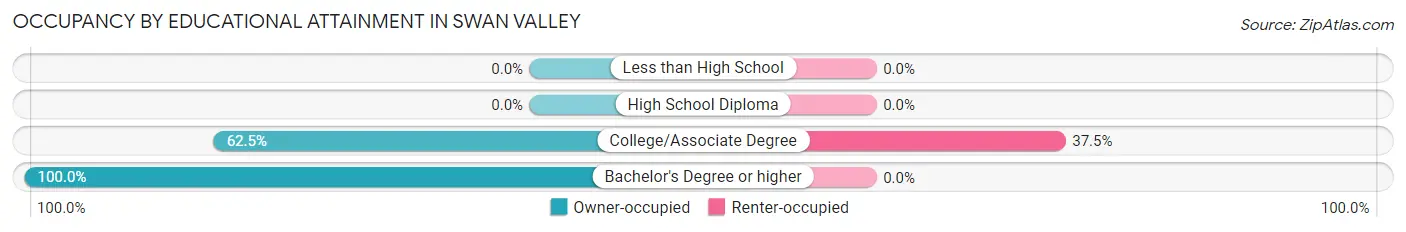
| Household Size | Owner-occupied | Renter-occupied |
| Less than High School | 0 (0.0%) | 0 (0.0%) |
| High School Diploma | 0 (0.0%) | 0 (0.0%) |
| College/Associate Degree | 15 (62.5%) | 9 (37.5%) |
| Bachelor's Degree or higher | 66 (100.0%) | 0 (0.0%) |
Occupancy by Age of Householder in Swan Valley
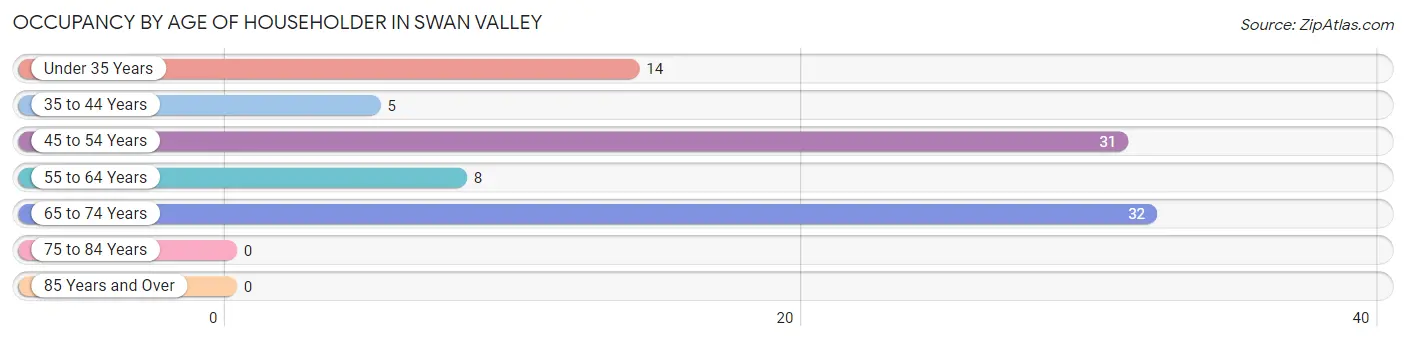
| Age Bracket | # Households | % Households |
| Under 35 Years | 14 | 15.6% |
| 35 to 44 Years | 5 | 5.6% |
| 45 to 54 Years | 31 | 34.4% |
| 55 to 64 Years | 8 | 8.9% |
| 65 to 74 Years | 32 | 35.6% |
| 75 to 84 Years | 0 | 0.0% |
| 85 Years and Over | 0 | 0.0% |
| Total | 90 | 100.0% |
Housing Finances in Swan Valley
Median Income by Occupancy in Swan Valley
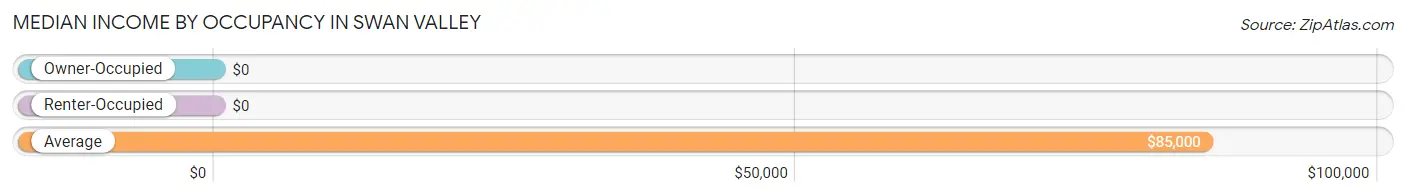
| Occupancy Type | # Households | Median Income |
| Owner-Occupied | 81 (90.0%) | $0 |
| Renter-Occupied | 9 (10.0%) | $0 |
| Average | 90 (100.0%) | $85,000 |
Occupancy by Householder Income Bracket in Swan Valley
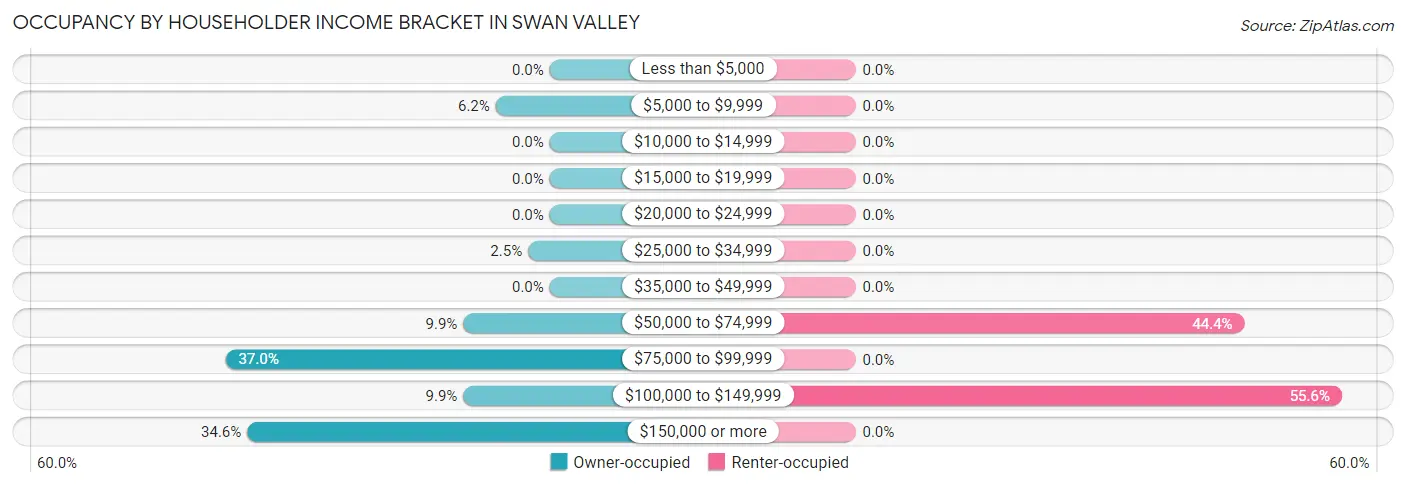
| Income Bracket | Owner-occupied | Renter-occupied |
| Less than $5,000 | 0 (0.0%) | 0 (0.0%) |
| $5,000 to $9,999 | 5 (6.2%) | 0 (0.0%) |
| $10,000 to $14,999 | 0 (0.0%) | 0 (0.0%) |
| $15,000 to $19,999 | 0 (0.0%) | 0 (0.0%) |
| $20,000 to $24,999 | 0 (0.0%) | 0 (0.0%) |
| $25,000 to $34,999 | 2 (2.5%) | 0 (0.0%) |
| $35,000 to $49,999 | 0 (0.0%) | 0 (0.0%) |
| $50,000 to $74,999 | 8 (9.9%) | 4 (44.4%) |
| $75,000 to $99,999 | 30 (37.0%) | 0 (0.0%) |
| $100,000 to $149,999 | 8 (9.9%) | 5 (55.6%) |
| $150,000 or more | 28 (34.6%) | 0 (0.0%) |
| Total | 81 (100.0%) | 9 (100.0%) |
Monthly Housing Cost Tiers in Swan Valley
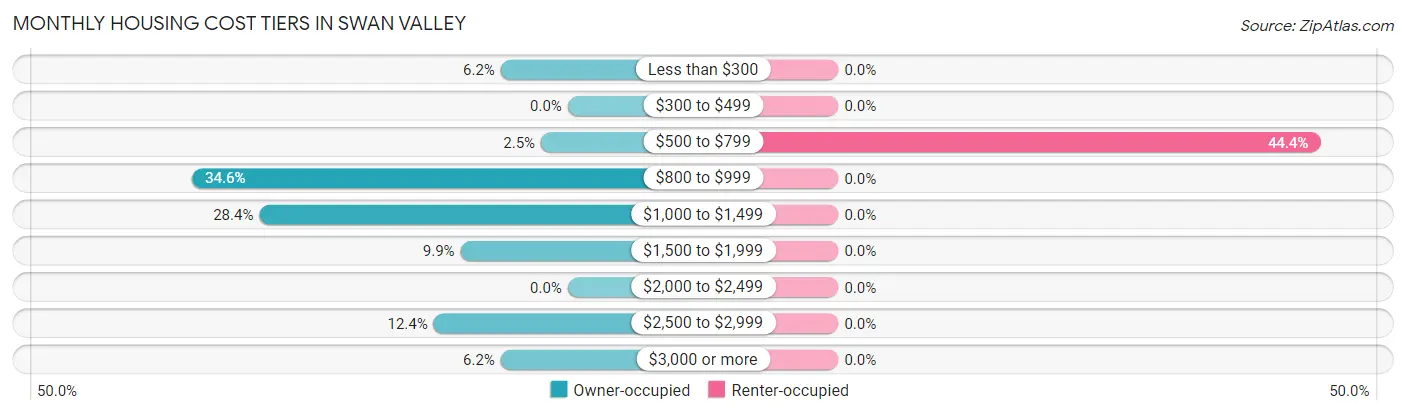
| Monthly Cost | Owner-occupied | Renter-occupied |
| Less than $300 | 5 (6.2%) | 0 (0.0%) |
| $300 to $499 | 0 (0.0%) | 0 (0.0%) |
| $500 to $799 | 2 (2.5%) | 4 (44.4%) |
| $800 to $999 | 28 (34.6%) | 0 (0.0%) |
| $1,000 to $1,499 | 23 (28.4%) | 0 (0.0%) |
| $1,500 to $1,999 | 8 (9.9%) | 0 (0.0%) |
| $2,000 to $2,499 | 0 (0.0%) | 0 (0.0%) |
| $2,500 to $2,999 | 10 (12.3%) | 0 (0.0%) |
| $3,000 or more | 5 (6.2%) | 0 (0.0%) |
| Total | 81 (100.0%) | 9 (100.0%) |
Physical Housing Characteristics in Swan Valley
Housing Structures in Swan Valley
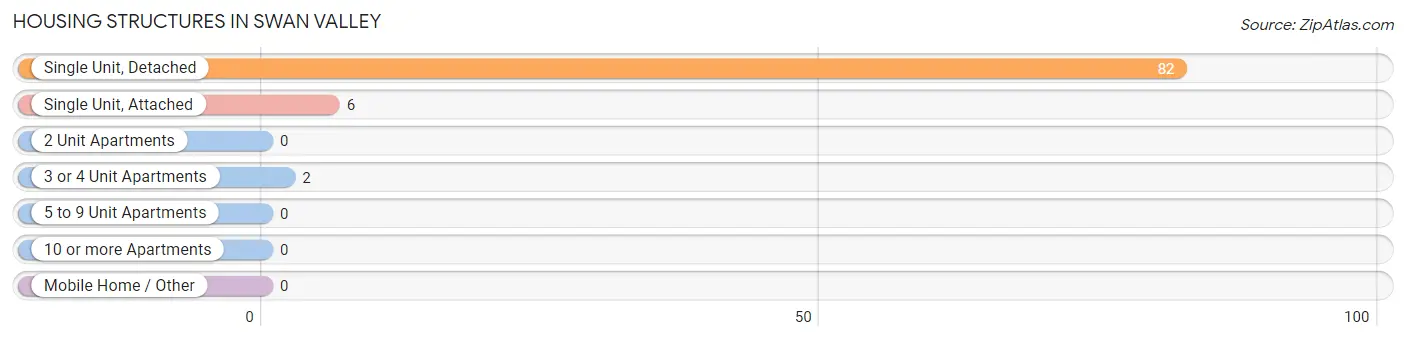
| Structure Type | # Housing Units | % Housing Units |
| Single Unit, Detached | 82 | 91.1% |
| Single Unit, Attached | 6 | 6.7% |
| 2 Unit Apartments | 0 | 0.0% |
| 3 or 4 Unit Apartments | 2 | 2.2% |
| 5 to 9 Unit Apartments | 0 | 0.0% |
| 10 or more Apartments | 0 | 0.0% |
| Mobile Home / Other | 0 | 0.0% |
| Total | 90 | 100.0% |
Housing Structures by Occupancy in Swan Valley
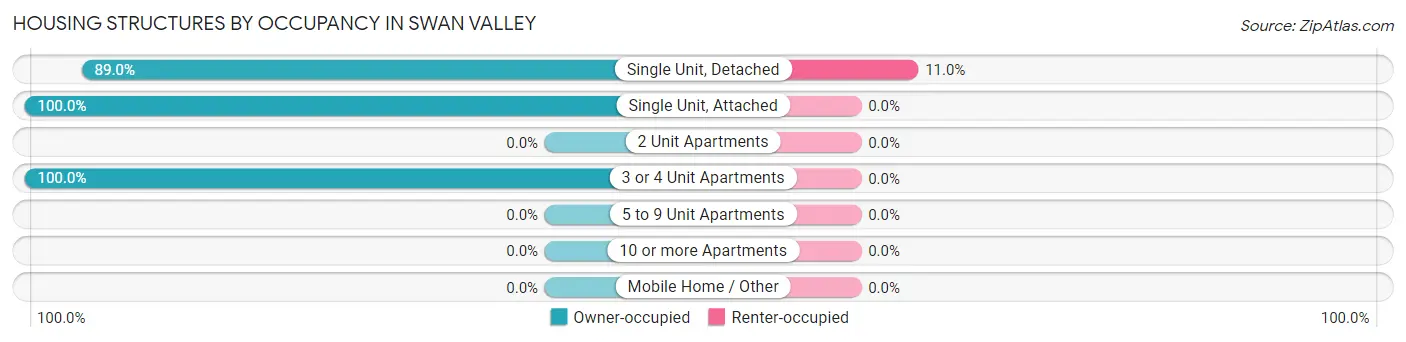
| Structure Type | Owner-occupied | Renter-occupied |
| Single Unit, Detached | 73 (89.0%) | 9 (11.0%) |
| Single Unit, Attached | 6 (100.0%) | 0 (0.0%) |
| 2 Unit Apartments | 0 (0.0%) | 0 (0.0%) |
| 3 or 4 Unit Apartments | 2 (100.0%) | 0 (0.0%) |
| 5 to 9 Unit Apartments | 0 (0.0%) | 0 (0.0%) |
| 10 or more Apartments | 0 (0.0%) | 0 (0.0%) |
| Mobile Home / Other | 0 (0.0%) | 0 (0.0%) |
| Total | 81 (90.0%) | 9 (10.0%) |
Housing Structures by Number of Rooms in Swan Valley
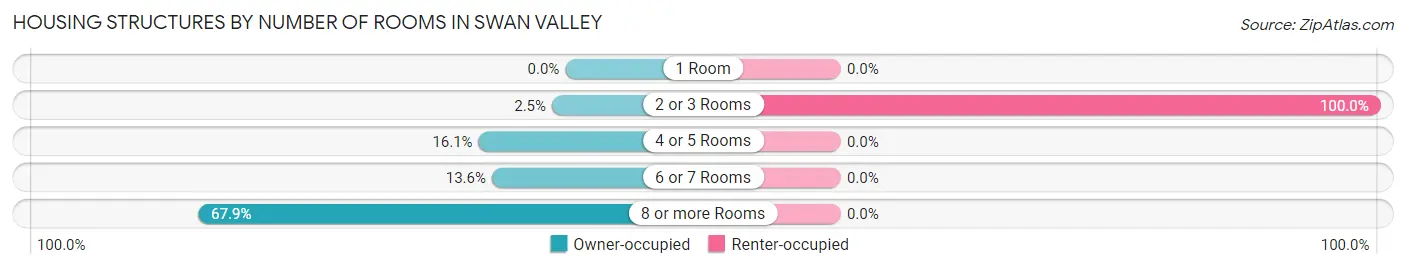
| Number of Rooms | Owner-occupied | Renter-occupied |
| 1 Room | 0 (0.0%) | 0 (0.0%) |
| 2 or 3 Rooms | 2 (2.5%) | 9 (100.0%) |
| 4 or 5 Rooms | 13 (16.1%) | 0 (0.0%) |
| 6 or 7 Rooms | 11 (13.6%) | 0 (0.0%) |
| 8 or more Rooms | 55 (67.9%) | 0 (0.0%) |
| Total | 81 (100.0%) | 9 (100.0%) |
Housing Structure by Heating Type in Swan Valley
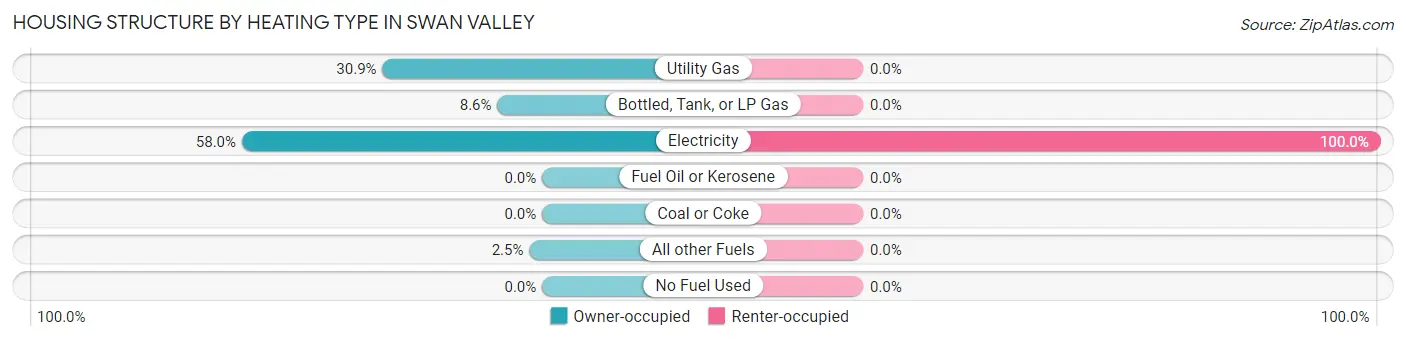
| Heating Type | Owner-occupied | Renter-occupied |
| Utility Gas | 25 (30.9%) | 0 (0.0%) |
| Bottled, Tank, or LP Gas | 7 (8.6%) | 0 (0.0%) |
| Electricity | 47 (58.0%) | 9 (100.0%) |
| Fuel Oil or Kerosene | 0 (0.0%) | 0 (0.0%) |
| Coal or Coke | 0 (0.0%) | 0 (0.0%) |
| All other Fuels | 2 (2.5%) | 0 (0.0%) |
| No Fuel Used | 0 (0.0%) | 0 (0.0%) |
| Total | 81 (100.0%) | 9 (100.0%) |
Household Vehicle Usage in Swan Valley
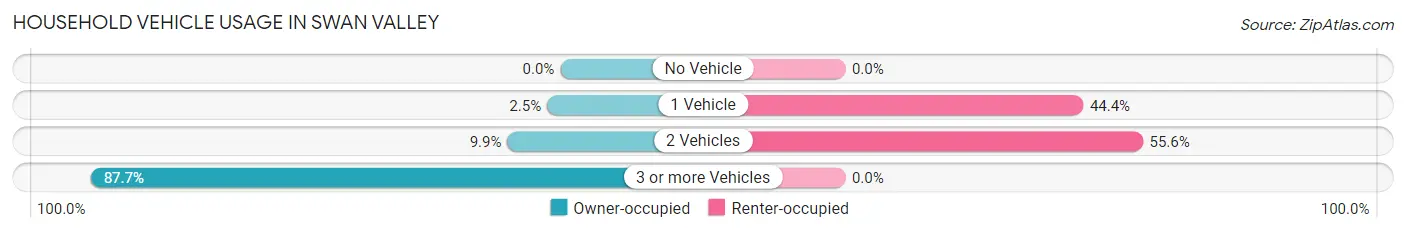
| Vehicles per Household | Owner-occupied | Renter-occupied |
| No Vehicle | 0 (0.0%) | 0 (0.0%) |
| 1 Vehicle | 2 (2.5%) | 4 (44.4%) |
| 2 Vehicles | 8 (9.9%) | 5 (55.6%) |
| 3 or more Vehicles | 71 (87.6%) | 0 (0.0%) |
| Total | 81 (100.0%) | 9 (100.0%) |
Real Estate & Mortgages in Swan Valley
Real Estate and Mortgage Overview in Swan Valley
| Characteristic | Without Mortgage | With Mortgage |
| Housing Units | 28 | 53 |
| Median Property Value | $857,100 | $445,200 |
| Median Household Income | $250,001 | $5 |
| Monthly Housing Costs | $933 | $5 |
| Real Estate Taxes | $4,391 | $0 |
Property Value by Mortgage Status in Swan Valley
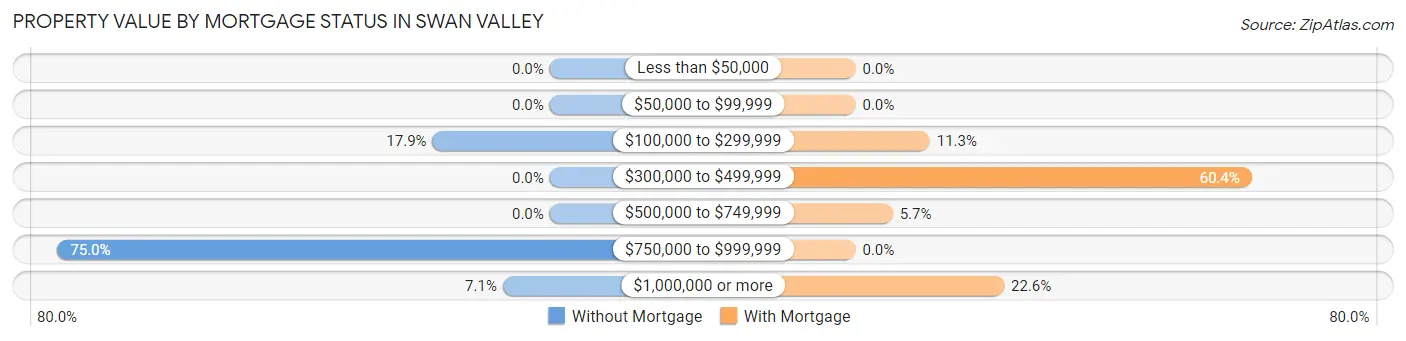
| Property Value | Without Mortgage | With Mortgage |
| Less than $50,000 | 0 (0.0%) | 0 (0.0%) |
| $50,000 to $99,999 | 0 (0.0%) | 0 (0.0%) |
| $100,000 to $299,999 | 5 (17.9%) | 6 (11.3%) |
| $300,000 to $499,999 | 0 (0.0%) | 32 (60.4%) |
| $500,000 to $749,999 | 0 (0.0%) | 3 (5.7%) |
| $750,000 to $999,999 | 21 (75.0%) | 0 (0.0%) |
| $1,000,000 or more | 2 (7.1%) | 12 (22.6%) |
| Total | 28 (100.0%) | 53 (100.0%) |
Household Income by Mortgage Status in Swan Valley
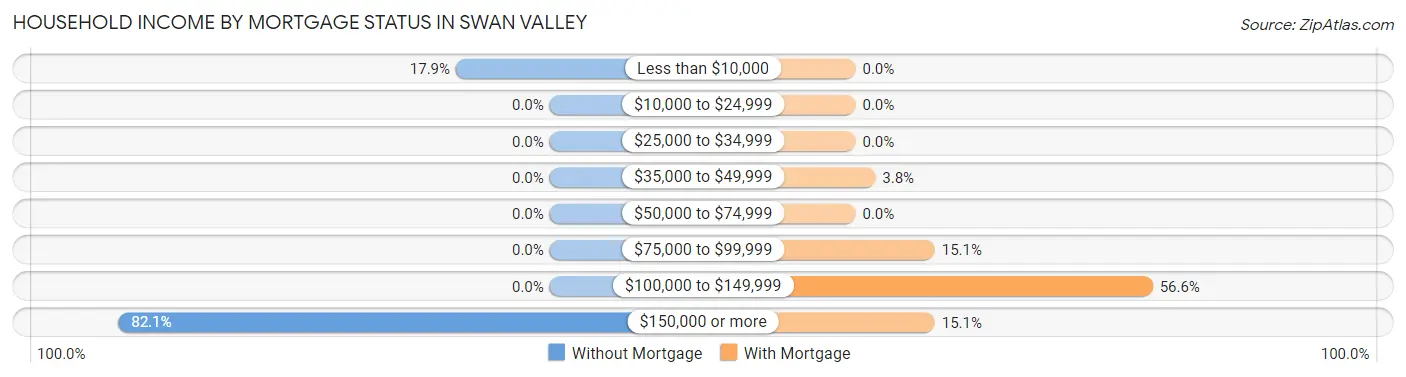
| Household Income | Without Mortgage | With Mortgage |
| Less than $10,000 | 5 (17.9%) | 0 (0.0%) |
| $10,000 to $24,999 | 0 (0.0%) | 0 (0.0%) |
| $25,000 to $34,999 | 0 (0.0%) | 0 (0.0%) |
| $35,000 to $49,999 | 0 (0.0%) | 2 (3.8%) |
| $50,000 to $74,999 | 0 (0.0%) | 0 (0.0%) |
| $75,000 to $99,999 | 0 (0.0%) | 8 (15.1%) |
| $100,000 to $149,999 | 0 (0.0%) | 30 (56.6%) |
| $150,000 or more | 23 (82.1%) | 8 (15.1%) |
| Total | 28 (100.0%) | 53 (100.0%) |
Property Value to Household Income Ratio in Swan Valley
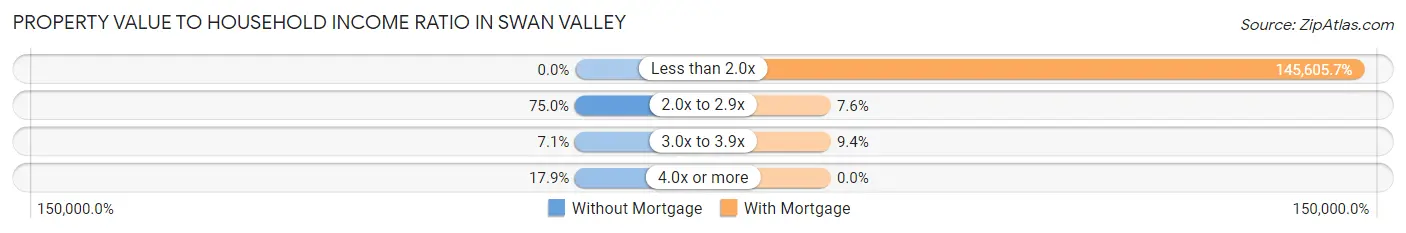
| Value-to-Income Ratio | Without Mortgage | With Mortgage |
| Less than 2.0x | 0 (0.0%) | 77,171 (145,605.7%) |
| 2.0x to 2.9x | 21 (75.0%) | 4 (7.5%) |
| 3.0x to 3.9x | 2 (7.1%) | 5 (9.4%) |
| 4.0x or more | 5 (17.9%) | 0 (0.0%) |
| Total | 28 (100.0%) | 53 (100.0%) |
Real Estate Taxes by Mortgage Status in Swan Valley
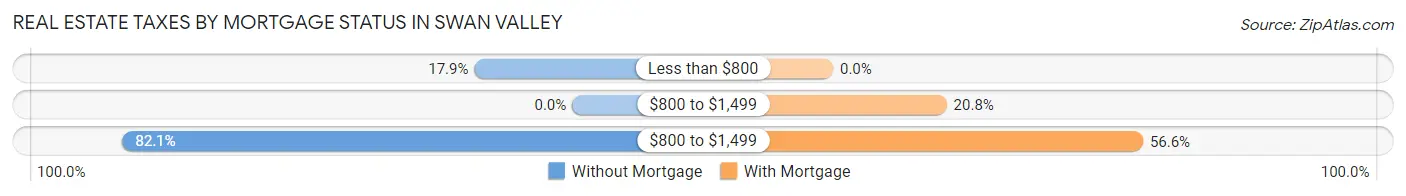
| Property Taxes | Without Mortgage | With Mortgage |
| Less than $800 | 5 (17.9%) | 0 (0.0%) |
| $800 to $1,499 | 0 (0.0%) | 11 (20.7%) |
| $800 to $1,499 | 23 (82.1%) | 30 (56.6%) |
| Total | 28 (100.0%) | 53 (100.0%) |
Health & Disability in Swan Valley
Health Insurance Coverage by Age in Swan Valley
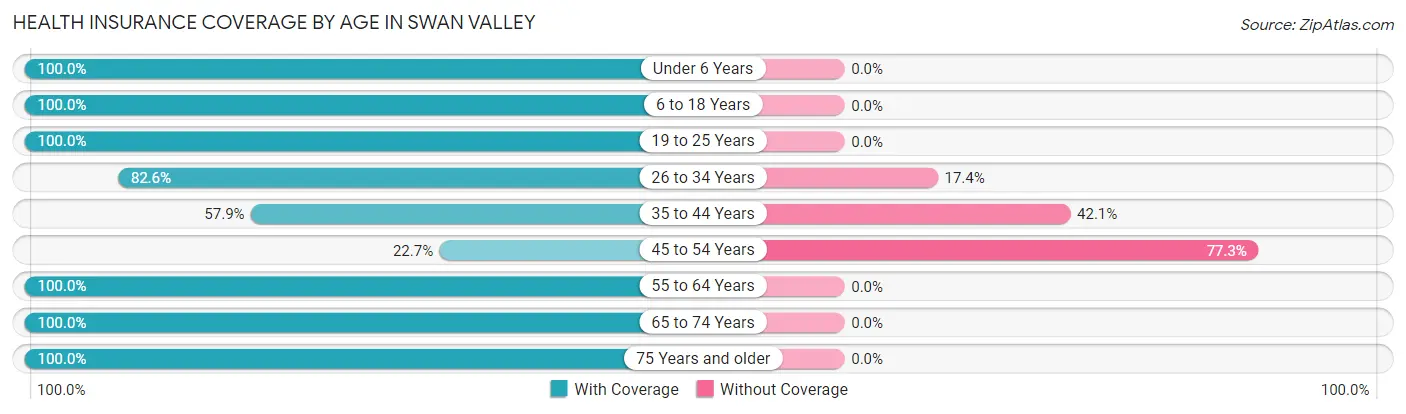
| Age Bracket | With Coverage | Without Coverage |
| Under 6 Years | 4 (100.0%) | 0 (0.0%) |
| 6 to 18 Years | 67 (100.0%) | 0 (0.0%) |
| 19 to 25 Years | 14 (100.0%) | 0 (0.0%) |
| 26 to 34 Years | 19 (82.6%) | 4 (17.4%) |
| 35 to 44 Years | 22 (57.9%) | 16 (42.1%) |
| 45 to 54 Years | 10 (22.7%) | 34 (77.3%) |
| 55 to 64 Years | 17 (100.0%) | 0 (0.0%) |
| 65 to 74 Years | 37 (100.0%) | 0 (0.0%) |
| 75 Years and older | 11 (100.0%) | 0 (0.0%) |
| Total | 201 (78.8%) | 54 (21.2%) |
Health Insurance Coverage by Citizenship Status in Swan Valley
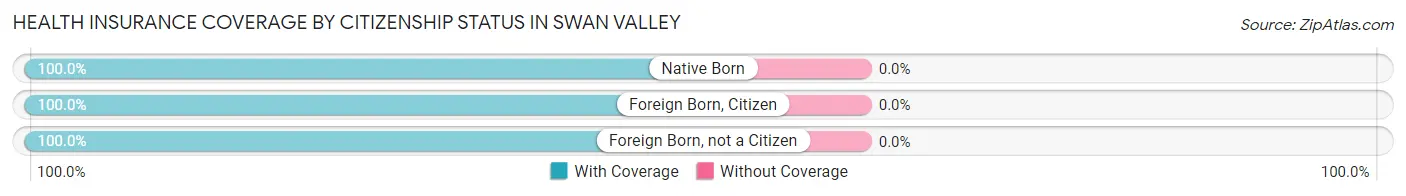
| Citizenship Status | With Coverage | Without Coverage |
| Native Born | 4 (100.0%) | 0 (0.0%) |
| Foreign Born, Citizen | 67 (100.0%) | 0 (0.0%) |
| Foreign Born, not a Citizen | 14 (100.0%) | 0 (0.0%) |
Health Insurance Coverage by Household Income in Swan Valley
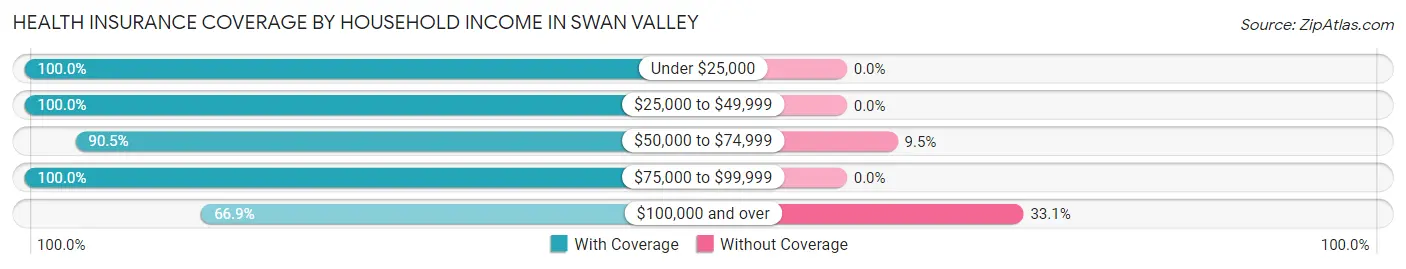
| Household Income | With Coverage | Without Coverage |
| Under $25,000 | 9 (100.0%) | 0 (0.0%) |
| $25,000 to $49,999 | 16 (100.0%) | 0 (0.0%) |
| $50,000 to $74,999 | 19 (90.5%) | 2 (9.5%) |
| $75,000 to $99,999 | 62 (100.0%) | 0 (0.0%) |
| $100,000 and over | 95 (66.9%) | 47 (33.1%) |
Public vs Private Health Insurance Coverage by Age in Swan Valley
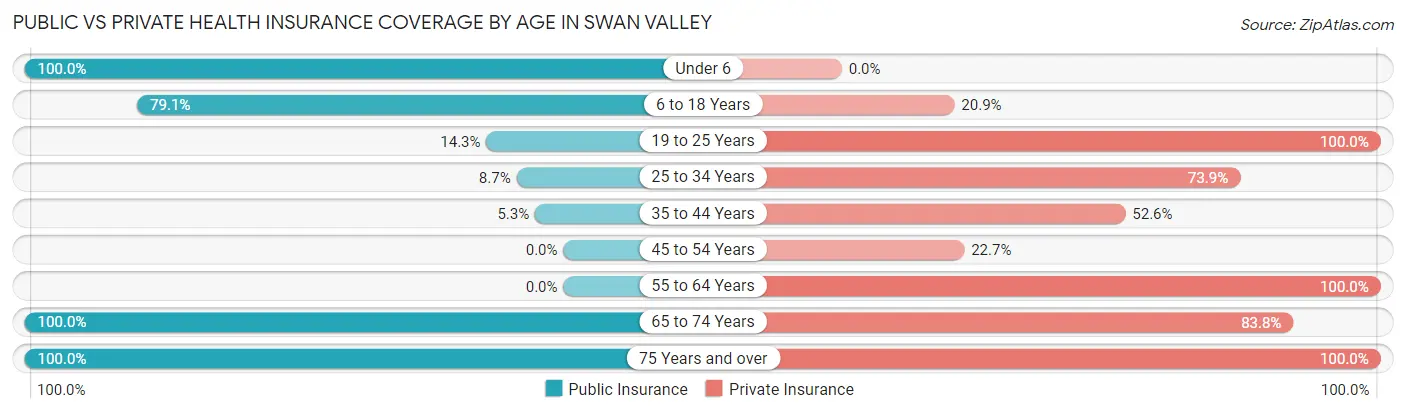
| Age Bracket | Public Insurance | Private Insurance |
| Under 6 | 4 (100.0%) | 0 (0.0%) |
| 6 to 18 Years | 53 (79.1%) | 14 (20.9%) |
| 19 to 25 Years | 2 (14.3%) | 14 (100.0%) |
| 25 to 34 Years | 2 (8.7%) | 17 (73.9%) |
| 35 to 44 Years | 2 (5.3%) | 20 (52.6%) |
| 45 to 54 Years | 0 (0.0%) | 10 (22.7%) |
| 55 to 64 Years | 0 (0.0%) | 17 (100.0%) |
| 65 to 74 Years | 37 (100.0%) | 31 (83.8%) |
| 75 Years and over | 11 (100.0%) | 11 (100.0%) |
| Total | 111 (43.5%) | 134 (52.5%) |
Disability Status by Sex by Age in Swan Valley
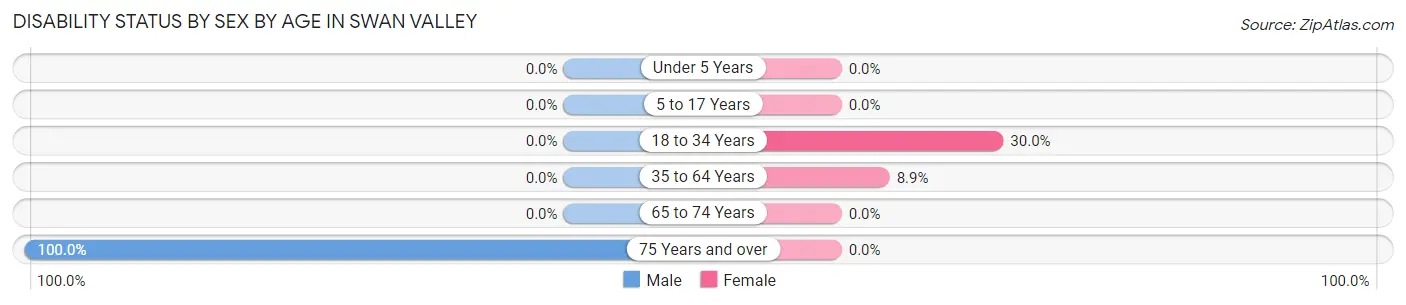
| Age Bracket | Male | Female |
| Under 5 Years | 0 (0.0%) | 0 (0.0%) |
| 5 to 17 Years | 0 (0.0%) | 0 (0.0%) |
| 18 to 34 Years | 0 (0.0%) | 6 (30.0%) |
| 35 to 64 Years | 0 (0.0%) | 4 (8.9%) |
| 65 to 74 Years | 0 (0.0%) | 0 (0.0%) |
| 75 Years and over | 11 (100.0%) | 0 (0.0%) |
Disability Class by Sex by Age in Swan Valley
Disability Class: Hearing Difficulty
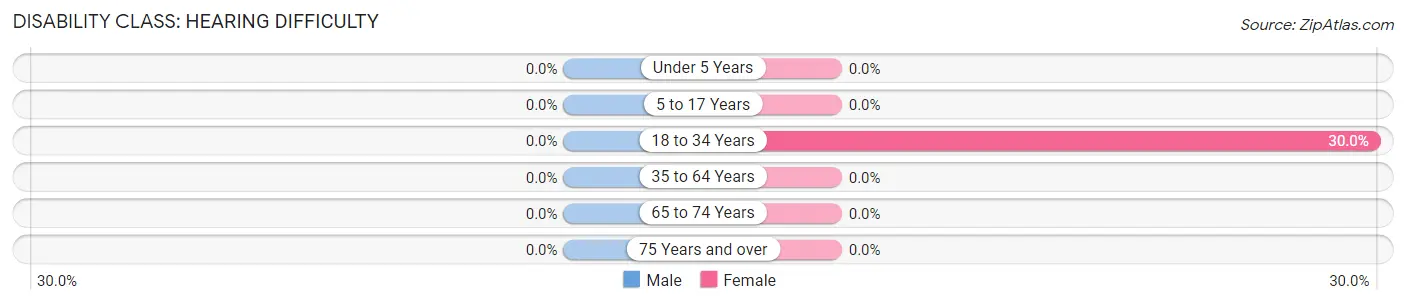
| Age Bracket | Male | Female |
| Under 5 Years | 0 (0.0%) | 0 (0.0%) |
| 5 to 17 Years | 0 (0.0%) | 0 (0.0%) |
| 18 to 34 Years | 0 (0.0%) | 6 (30.0%) |
| 35 to 64 Years | 0 (0.0%) | 0 (0.0%) |
| 65 to 74 Years | 0 (0.0%) | 0 (0.0%) |
| 75 Years and over | 0 (0.0%) | 0 (0.0%) |
Disability Class: Vision Difficulty
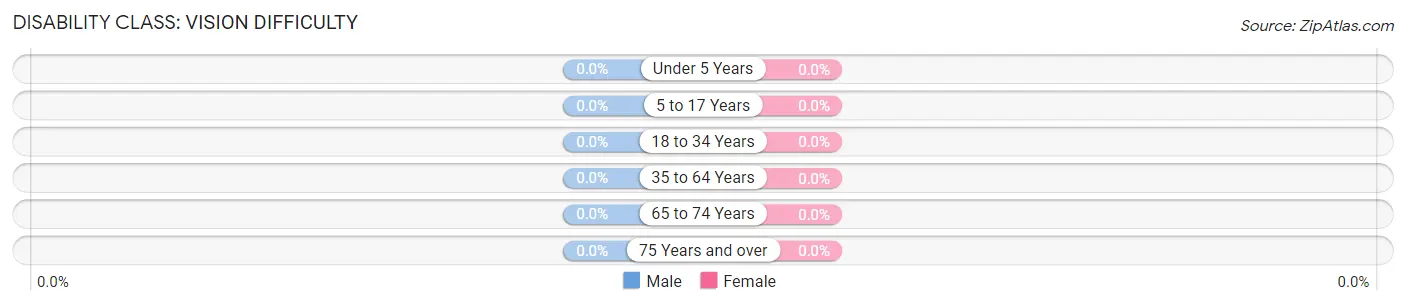
| Age Bracket | Male | Female |
| Under 5 Years | 0 (0.0%) | 0 (0.0%) |
| 5 to 17 Years | 0 (0.0%) | 0 (0.0%) |
| 18 to 34 Years | 0 (0.0%) | 0 (0.0%) |
| 35 to 64 Years | 0 (0.0%) | 0 (0.0%) |
| 65 to 74 Years | 0 (0.0%) | 0 (0.0%) |
| 75 Years and over | 0 (0.0%) | 0 (0.0%) |
Disability Class: Cognitive Difficulty
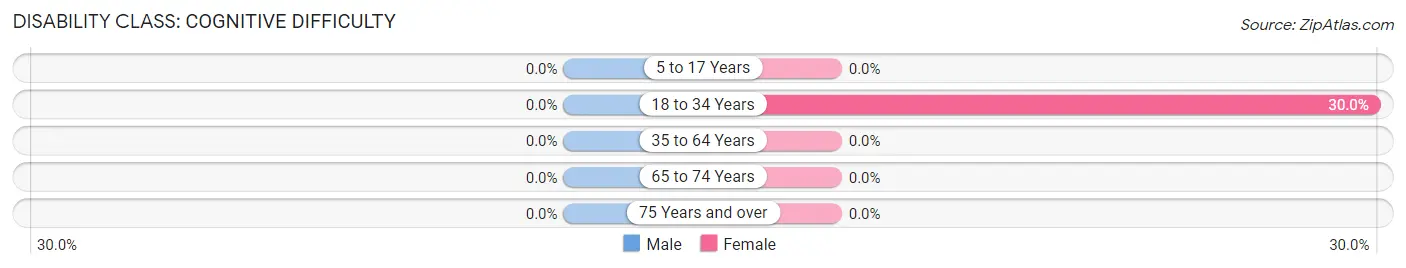
| Age Bracket | Male | Female |
| 5 to 17 Years | 0 (0.0%) | 0 (0.0%) |
| 18 to 34 Years | 0 (0.0%) | 6 (30.0%) |
| 35 to 64 Years | 0 (0.0%) | 0 (0.0%) |
| 65 to 74 Years | 0 (0.0%) | 0 (0.0%) |
| 75 Years and over | 0 (0.0%) | 0 (0.0%) |
Disability Class: Ambulatory Difficulty
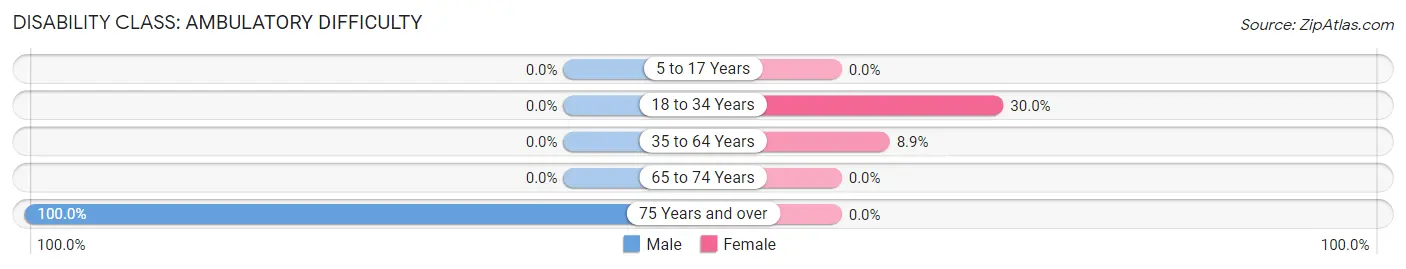
| Age Bracket | Male | Female |
| 5 to 17 Years | 0 (0.0%) | 0 (0.0%) |
| 18 to 34 Years | 0 (0.0%) | 6 (30.0%) |
| 35 to 64 Years | 0 (0.0%) | 4 (8.9%) |
| 65 to 74 Years | 0 (0.0%) | 0 (0.0%) |
| 75 Years and over | 11 (100.0%) | 0 (0.0%) |
Disability Class: Self-Care Difficulty
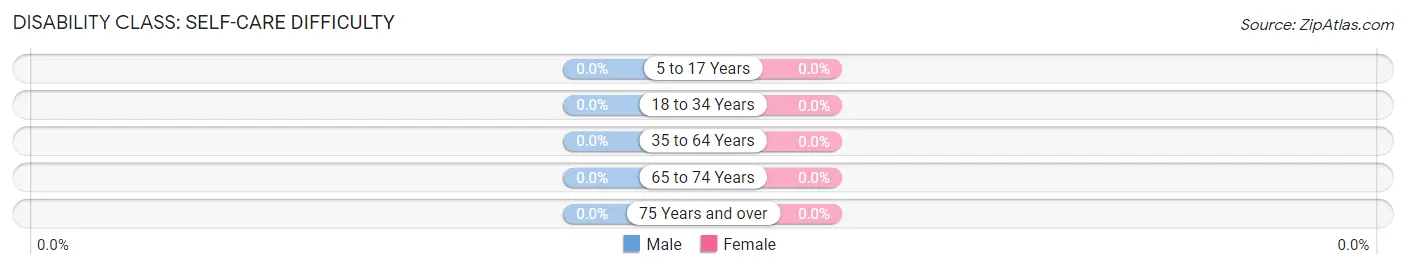
| Age Bracket | Male | Female |
| 5 to 17 Years | 0 (0.0%) | 0 (0.0%) |
| 18 to 34 Years | 0 (0.0%) | 0 (0.0%) |
| 35 to 64 Years | 0 (0.0%) | 0 (0.0%) |
| 65 to 74 Years | 0 (0.0%) | 0 (0.0%) |
| 75 Years and over | 0 (0.0%) | 0 (0.0%) |
Technology Access in Swan Valley
Computing Device Access in Swan Valley
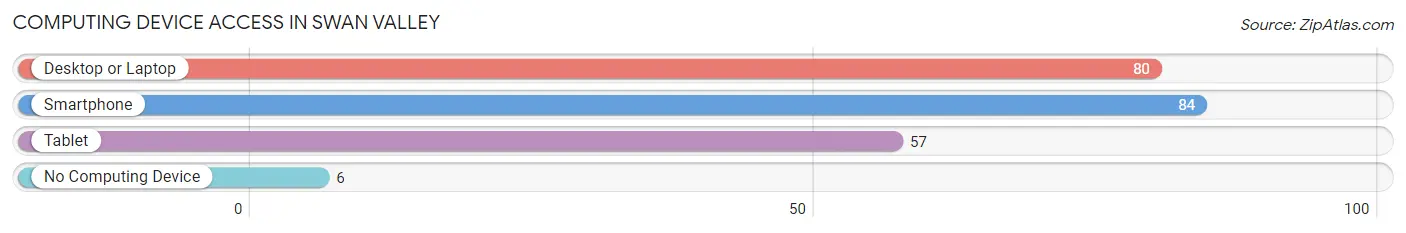
| Device Type | # Households | % Households |
| Desktop or Laptop | 80 | 88.9% |
| Smartphone | 84 | 93.3% |
| Tablet | 57 | 63.3% |
| No Computing Device | 6 | 6.7% |
| Total | 90 | 100.0% |
Internet Access in Swan Valley
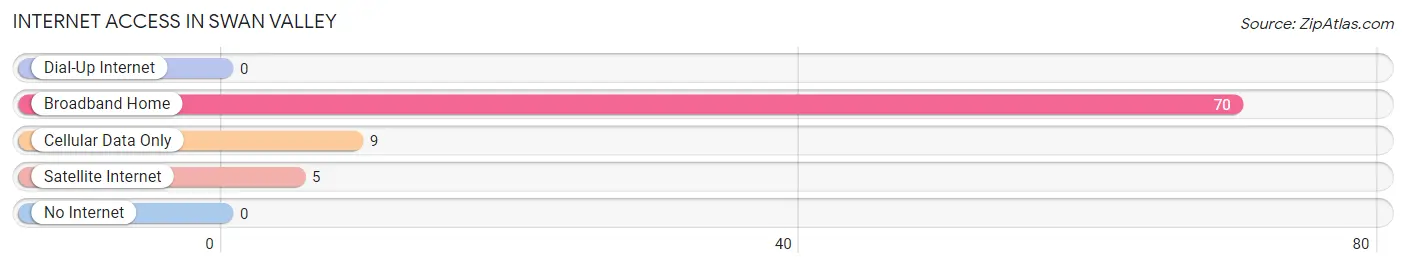
| Internet Type | # Households | % Households |
| Dial-Up Internet | 0 | 0.0% |
| Broadband Home | 70 | 77.8% |
| Cellular Data Only | 9 | 10.0% |
| Satellite Internet | 5 | 5.6% |
| No Internet | 0 | 0.0% |
| Total | 90 | 100.0% |
Swan Valley Summary
Swan Valley is a small, rural community located in Bonneville County, Idaho. It is situated in the Snake River Valley, approximately 20 miles east of Idaho Falls. The population of Swan Valley was estimated to be 545 in 2019.
History
Swan Valley was first settled in the late 1800s by Mormon pioneers. The first settlers were members of the Church of Jesus Christ of Latter-day Saints, who were sent to the area to establish a settlement. The settlement was named after the nearby Swan Creek, which was named after the swans that were seen in the area.
The first settlers built a small log cabin and began to farm the land. They grew potatoes, wheat, and other crops. The settlers also raised cattle and sheep. The first post office was established in 1883.
In the early 1900s, the area began to grow and more settlers moved to the area. The town was incorporated in 1909. The first school was built in 1910 and the first church was built in 1911.
Geography
Swan Valley is located in the Snake River Valley, approximately 20 miles east of Idaho Falls. The town is situated at an elevation of 4,890 feet. The area is surrounded by mountains, including the Grand Teton Mountains to the east and the Snake River Mountains to the west.
The climate in Swan Valley is semi-arid, with hot summers and cold winters. The average annual temperature is 44°F. The average annual precipitation is 11.5 inches.
Economy
The economy of Swan Valley is largely based on agriculture and tourism. The area is known for its potato farming, and the town is home to several potato processing plants. The area is also known for its outdoor recreation opportunities, including fishing, hunting, camping, and hiking.
Tourism is an important part of the local economy. The nearby Grand Teton National Park attracts visitors from all over the world. The area is also home to several resorts and lodges, which provide accommodations for visitors.
Demographics
As of 2019, the population of Swan Valley was estimated to be 545. The population is predominantly white, with a small percentage of Native American and Hispanic residents. The median household income is $45,000. The median age is 44.
Conclusion
Swan Valley is a small, rural community located in Bonneville County, Idaho. It is situated in the Snake River Valley, approximately 20 miles east of Idaho Falls. The population of Swan Valley was estimated to be 545 in 2019. The economy of Swan Valley is largely based on agriculture and tourism. The area is known for its potato farming, and the town is home to several potato processing plants. The area is also known for its outdoor recreation opportunities, including fishing, hunting, camping, and hiking. The population is predominantly white, with a small percentage of Native American and Hispanic residents. The median household income is $45,000. The median age is 44.
Common Questions
What is the Total Population of Swan Valley?
Total Population of Swan Valley is 255.
What is the Total Male Population of Swan Valley?
Total Male Population of Swan Valley is 132.
What is the Total Female Population of Swan Valley?
Total Female Population of Swan Valley is 123.
What is the Ratio of Males per 100 Females in Swan Valley?
There are 107.32 Males per 100 Females in Swan Valley.
What is the Ratio of Females per 100 Males in Swan Valley?
There are 93.18 Females per 100 Males in Swan Valley.
What is the Median Population Age in Swan Valley?
Median Population Age in Swan Valley is 43.6 Years.
What is the Average Family Size in Swan Valley
Average Family Size in Swan Valley is 2.9 People.
What is the Average Household Size in Swan Valley
Average Household Size in Swan Valley is 2.8 People.
What is Per Capita Income in Swan Valley?
Per Capita income in Swan Valley is $62,625.
What is the Median Household income in Swan Valley?
Median Household Income in Swan Valley is $85,000.
What is Inequality or Gini Index in Swan Valley?
Inequality or Gini Index in Swan Valley is 0.46.
How Large is the Labor Force in Swan Valley?
There are 118 People in the Labor Forcein in Swan Valley.
What is the Percentage of People in the Labor Force in Swan Valley?
62.1% of People are in the Labor Force in Swan Valley.
What is the Unemployment Rate in Swan Valley?
Unemployment Rate in Swan Valley is 5.9%.