Rockford Bay, ID
Rockford Bay Map
Rockford Bay Overview
306
TOTAL POPULATION
164
MALE POPULATION
142
FEMALE POPULATION
115.49
MALES / 100 FEMALES
86.59
FEMALES / 100 MALES
57.6
MEDIAN AGE
2.8
AVG FAMILY SIZE
2.4
AVG HOUSEHOLD SIZE
$83,691
PER CAPITA INCOME
$127,500
AVG FAMILY INCOME
$123,750
AVG HOUSEHOLD INCOME
48.1%
WAGE / INCOME GAP [ % ]
51.9¢/ $1
WAGE / INCOME GAP [ $ ]
0.57
INEQUALITY / GINI INDEX
96
LABOR FORCE [ PEOPLE ]
38.2%
PERCENT IN LABOR FORCE
11.5%
UNEMPLOYMENT RATE
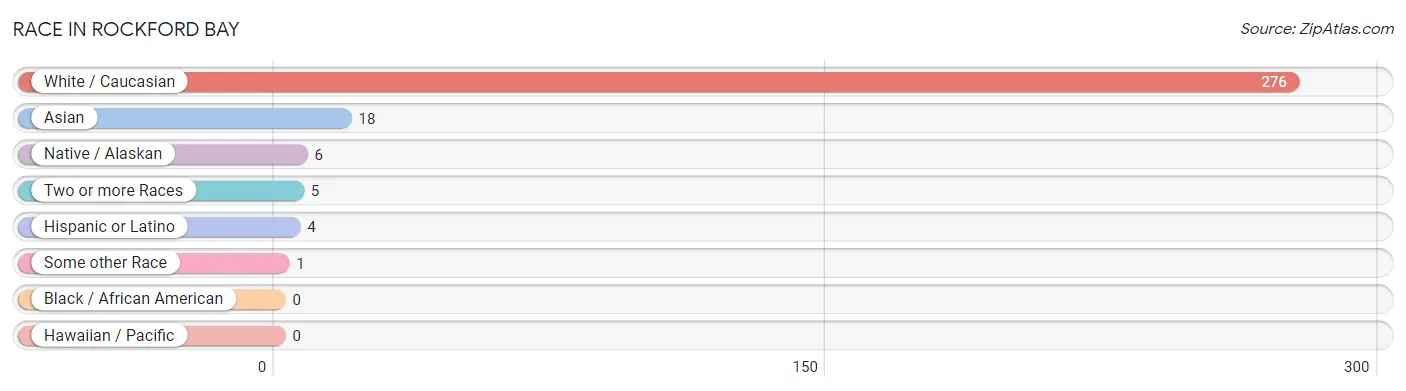
Race in Rockford Bay
The most populous races in Rockford Bay are White / Caucasian (276 | 90.2%), Asian (18 | 5.9%), and Native / Alaskan (6 | 2.0%).
| Race | # Population | % Population |
| Asian | 18 | 5.9% |
| Black / African American | 0 | 0.0% |
| Hawaiian / Pacific | 0 | 0.0% |
| Hispanic or Latino | 4 | 1.3% |
| Native / Alaskan | 6 | 2.0% |
| White / Caucasian | 276 | 90.2% |
| Two or more Races | 5 | 1.6% |
| Some other Race | 1 | 0.3% |
| Total | 306 | 100.0% |
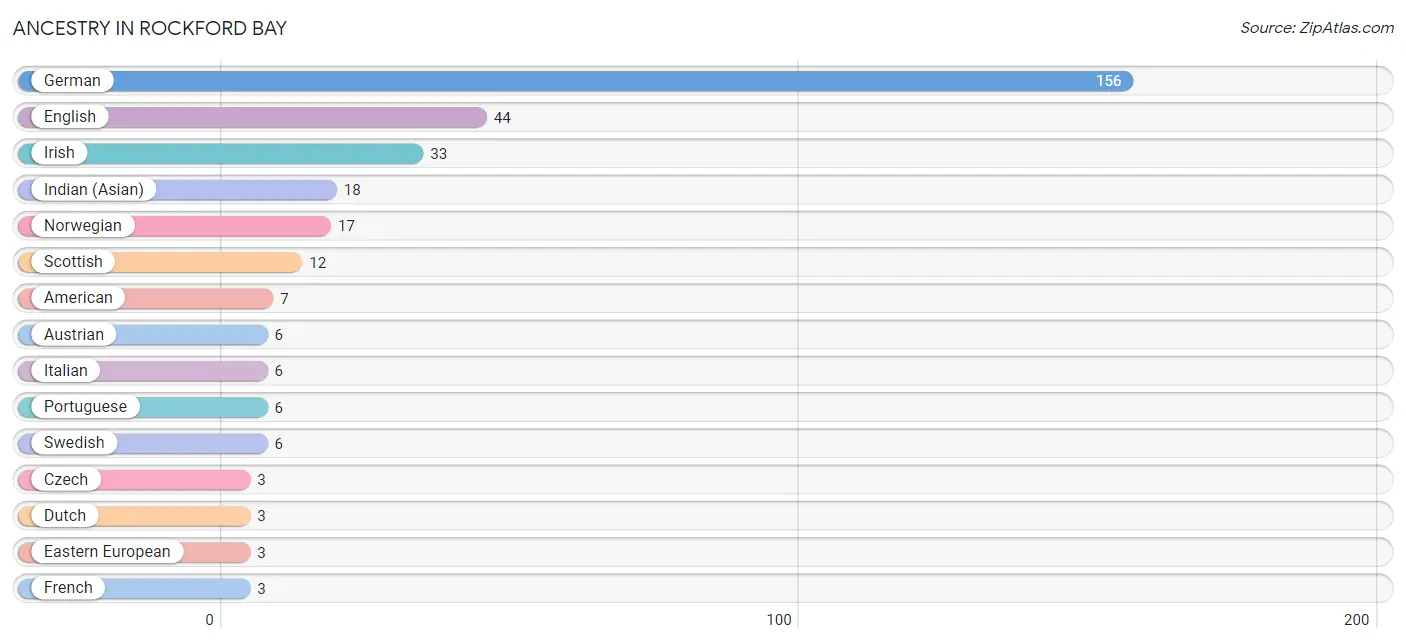
Ancestry in Rockford Bay
The most populous ancestries reported in Rockford Bay are German (156 | 51.0%), English (44 | 14.4%), Irish (33 | 10.8%), Indian (Asian) (18 | 5.9%), and Norwegian (17 | 5.6%), together accounting for 87.6% of all Rockford Bay residents.
| Ancestry | # Population | % Population |
| American | 7 | 2.3% |
| Austrian | 6 | 2.0% |
| Czech | 3 | 1.0% |
| Dutch | 3 | 1.0% |
| Eastern European | 3 | 1.0% |
| English | 44 | 14.4% |
| European | 2 | 0.6% |
| French | 3 | 1.0% |
| German | 156 | 51.0% |
| Indian (Asian) | 18 | 5.9% |
| Irish | 33 | 10.8% |
| Italian | 6 | 2.0% |
| Mexican | 3 | 1.0% |
| Northern European | 2 | 0.6% |
| Norwegian | 17 | 5.6% |
| Portuguese | 6 | 2.0% |
| Puerto Rican | 1 | 0.3% |
| Scottish | 12 | 3.9% |
| Swedish | 6 | 2.0% |
| Swiss | 3 | 1.0% | View All 20 Rows |
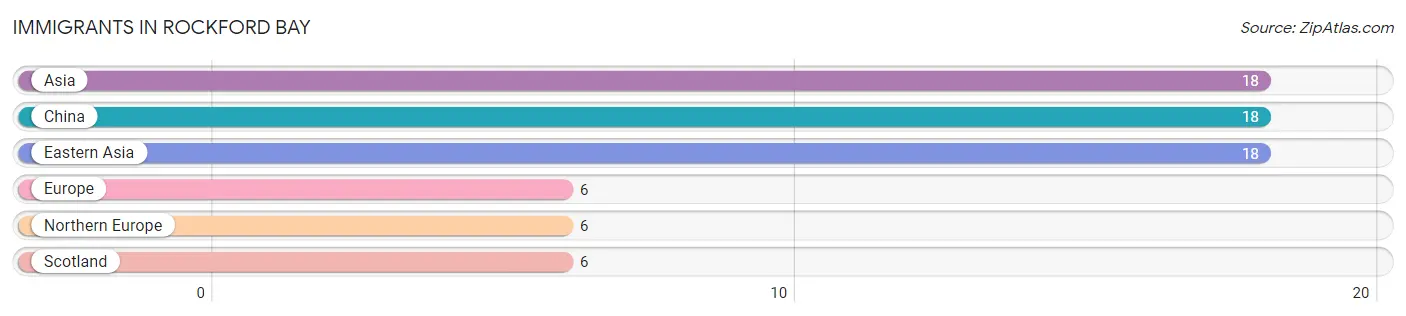
Immigrants in Rockford Bay
The most numerous immigrant groups reported in Rockford Bay came from Asia (18 | 5.9%), China (18 | 5.9%), Eastern Asia (18 | 5.9%), Europe (6 | 2.0%), and Northern Europe (6 | 2.0%), together accounting for 21.6% of all Rockford Bay residents.
| Immigration Origin | # Population | % Population |
| Asia | 18 | 5.9% |
| China | 18 | 5.9% |
| Eastern Asia | 18 | 5.9% |
| Europe | 6 | 2.0% |
| Northern Europe | 6 | 2.0% |
| Scotland | 6 | 2.0% | View All 6 Rows |
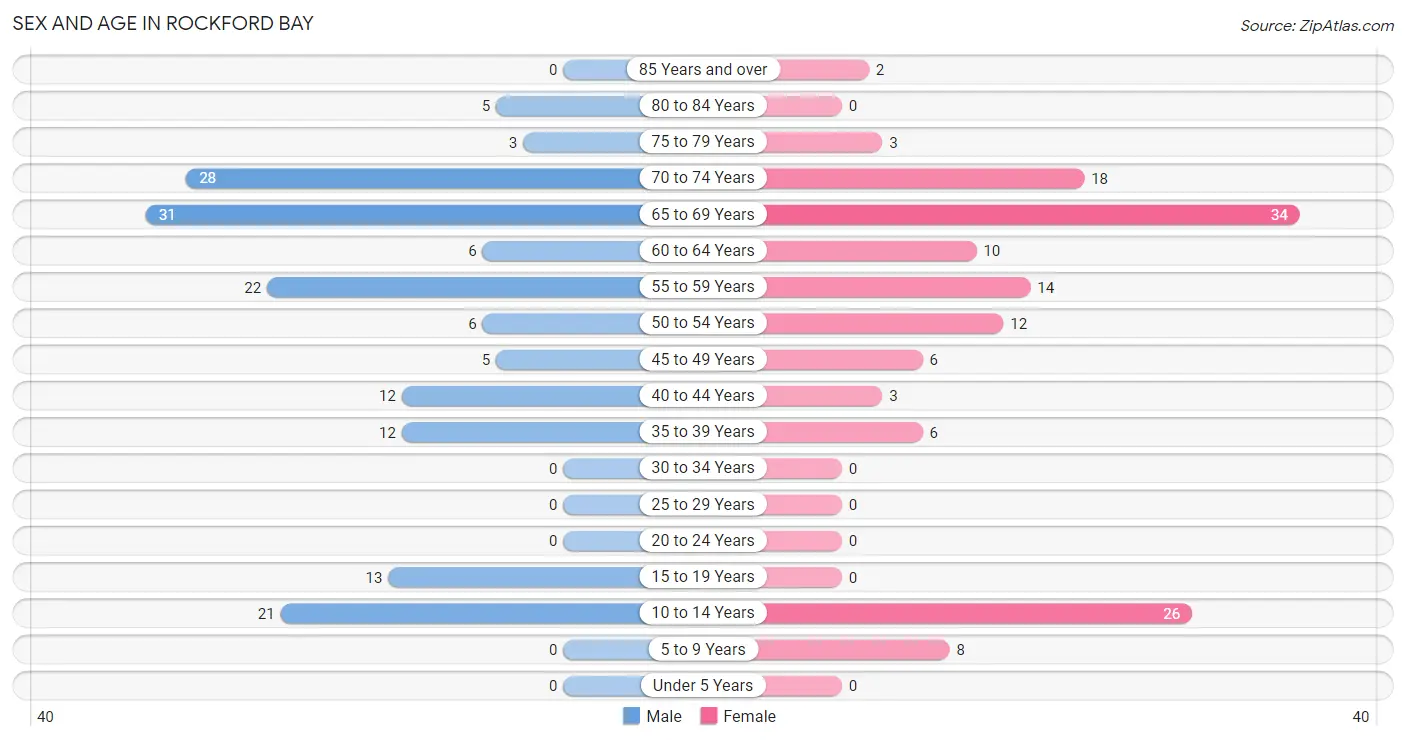
Sex and Age in Rockford Bay
Sex and Age in Rockford Bay
The most populous age groups in Rockford Bay are 65 to 69 Years (31 | 18.9%) for men and 65 to 69 Years (34 | 23.9%) for women.
| Age Bracket | Male | Female |
| Under 5 Years | 0 (0.0%) | 0 (0.0%) |
| 5 to 9 Years | 0 (0.0%) | 8 (5.6%) |
| 10 to 14 Years | 21 (12.8%) | 26 (18.3%) |
| 15 to 19 Years | 13 (7.9%) | 0 (0.0%) |
| 20 to 24 Years | 0 (0.0%) | 0 (0.0%) |
| 25 to 29 Years | 0 (0.0%) | 0 (0.0%) |
| 30 to 34 Years | 0 (0.0%) | 0 (0.0%) |
| 35 to 39 Years | 12 (7.3%) | 6 (4.2%) |
| 40 to 44 Years | 12 (7.3%) | 3 (2.1%) |
| 45 to 49 Years | 5 (3.0%) | 6 (4.2%) |
| 50 to 54 Years | 6 (3.7%) | 12 (8.5%) |
| 55 to 59 Years | 22 (13.4%) | 14 (9.9%) |
| 60 to 64 Years | 6 (3.7%) | 10 (7.0%) |
| 65 to 69 Years | 31 (18.9%) | 34 (23.9%) |
| 70 to 74 Years | 28 (17.1%) | 18 (12.7%) |
| 75 to 79 Years | 3 (1.8%) | 3 (2.1%) |
| 80 to 84 Years | 5 (3.0%) | 0 (0.0%) |
| 85 Years and over | 0 (0.0%) | 2 (1.4%) |
| Total | 164 (100.0%) | 142 (100.0%) |
Families and Households in Rockford Bay
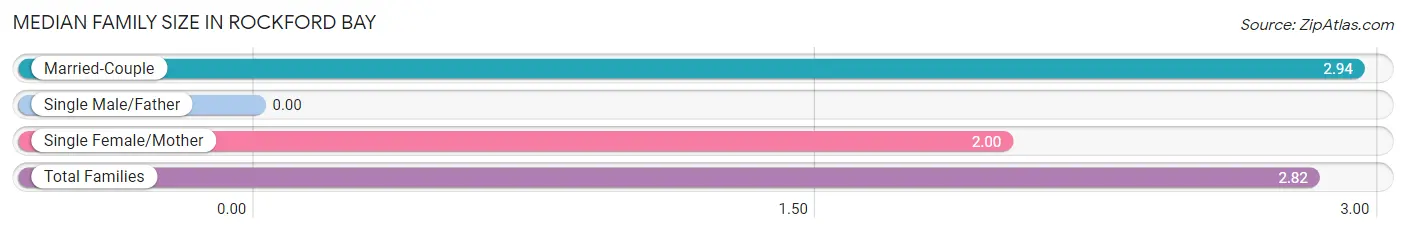
Median Family Size in Rockford Bay
| Family Type | # Families | Family Size |
| Married-Couple | 82 (87.2%) | 2.94 |
| Single Male/Father | 0 (0.0%) | - |
| Single Female/Mother | 12 (12.8%) | 2.00 |
| Total Families | 94 (100.0%) | 2.82 |
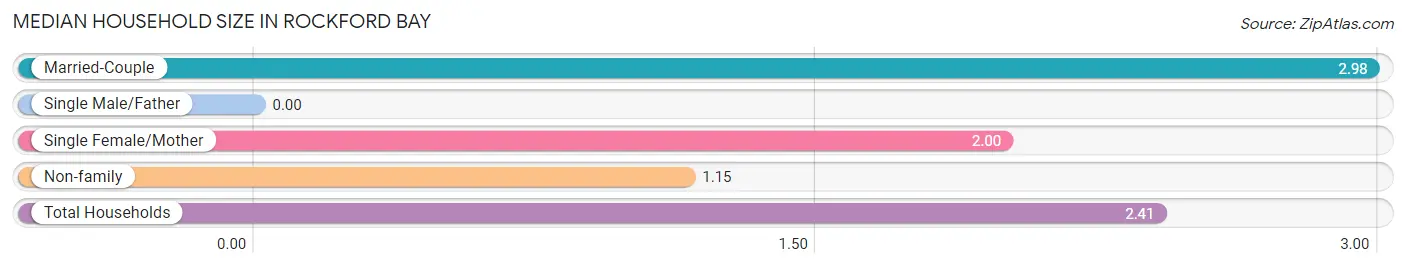
Median Household Size in Rockford Bay
| Household Type | # Households | Household Size |
| Married-Couple | 82 (64.6%) | 2.98 |
| Single Male/Father | 0 (0.0%) | - |
| Single Female/Mother | 12 (9.5%) | 2.00 |
| Non-family | 33 (26.0%) | 1.15 |
| Total Households | 127 (100.0%) | 2.41 |
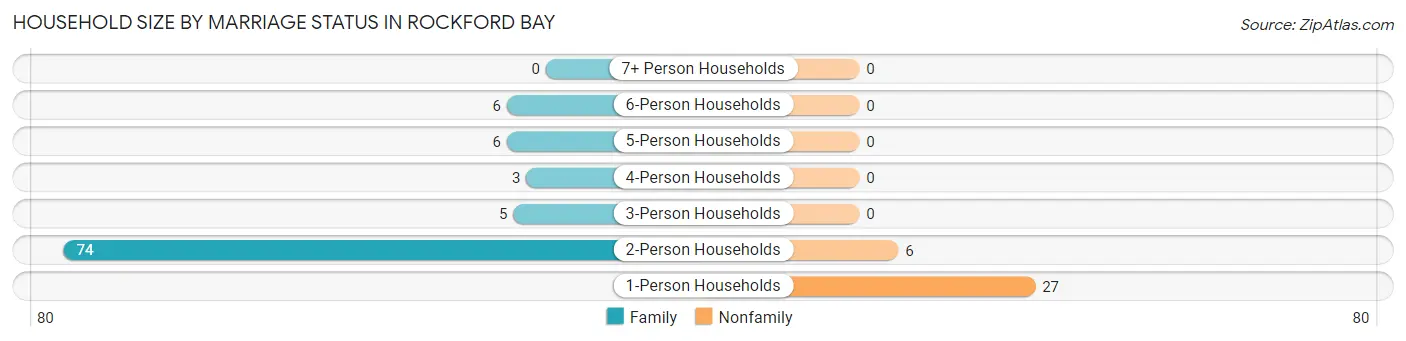
Household Size by Marriage Status in Rockford Bay
Out of a total of 127 households in Rockford Bay, 94 (74.0%) are family households, while 33 (26.0%) are nonfamily households. The most numerous type of family households are 2-person households, comprising 74, and the most common type of nonfamily households are 1-person households, comprising 27.
| Household Size | Family Households | Nonfamily Households |
| 1-Person Households | - | 27 (21.3%) |
| 2-Person Households | 74 (58.3%) | 6 (4.7%) |
| 3-Person Households | 5 (3.9%) | 0 (0.0%) |
| 4-Person Households | 3 (2.4%) | 0 (0.0%) |
| 5-Person Households | 6 (4.7%) | 0 (0.0%) |
| 6-Person Households | 6 (4.7%) | 0 (0.0%) |
| 7+ Person Households | 0 (0.0%) | 0 (0.0%) |
| Total | 94 (74.0%) | 33 (26.0%) |
Female Fertility in Rockford Bay
Fertility by Age in Rockford Bay
| Age Bracket | Women with Births | Births / 1,000 Women |
| 15 to 19 years | 0 (0.0%) | 0.0 |
| 20 to 34 years | 0 (0.0%) | 0.0 |
| 35 to 50 years | 0 (0.0%) | 0.0 |
| Total | 0 (0.0%) | 0.0 |
Fertility by Age by Marriage Status in Rockford Bay
| Age Bracket | Married | Unmarried |
| 15 to 19 years | 0 (0.0%) | 0 (0.0%) |
| 20 to 34 years | 0 (0.0%) | 0 (0.0%) |
| 35 to 50 years | 0 (0.0%) | 0 (0.0%) |
| Total | 0 (0.0%) | 0 (0.0%) |
Fertility by Education in Rockford Bay
| Educational Attainment | Women with Births | Births / 1,000 Women |
| Less than High School | 0 (0.0%) | 0.0 |
| High School Diploma | 0 (0.0%) | 0.0 |
| College or Associate's Degree | 0 (0.0%) | 0.0 |
| Bachelor's Degree | 0 (0.0%) | 0.0 |
| Graduate Degree | 0 (0.0%) | 0.0 |
| Total | 0 (0.0%) | 0.0 |
Fertility by Education by Marriage Status in Rockford Bay
| Educational Attainment | Married | Unmarried |
| Less than High School | 0 (0.0%) | 0 (0.0%) |
| High School Diploma | 0 (0.0%) | 0 (0.0%) |
| College or Associate's Degree | 0 (0.0%) | 0 (0.0%) |
| Bachelor's Degree | 0 (0.0%) | 0 (0.0%) |
| Graduate Degree | 0 (0.0%) | 0 (0.0%) |
| Total | 0 (0.0%) | 0 (0.0%) |
Income in Rockford Bay
Income Overview in Rockford Bay
Per Capita Income in Rockford Bay is $83,691, while median incomes of families and households are $127,500 and $123,750 respectively.
| Characteristic | Number | Measure |
| Per Capita Income | 306 | $83,691 |
| Median Family Income | 94 | $127,500 |
| Mean Family Income | 94 | $204,409 |
| Median Household Income | 127 | $123,750 |
| Mean Household Income | 127 | $194,625 |
| Income Deficit | 94 | $0 |
| Wage / Income Gap (%) | 306 | 48.12% |
| Wage / Income Gap ($) | 306 | 51.88¢ per $1 |
| Gini / Inequality Index | 306 | 0.57 |
Earnings by Sex in Rockford Bay
Average Earnings in Rockford Bay are $58,000, $85,938 for men and $44,583 for women, a difference of 48.1%.
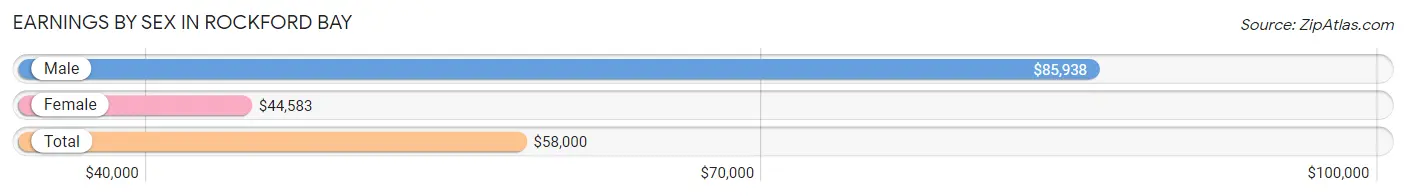
| Sex | Number | Average Earnings |
| Male | 61 (62.2%) | $85,938 |
| Female | 37 (37.8%) | $44,583 |
| Total | 98 (100.0%) | $58,000 |
Earnings by Sex by Income Bracket in Rockford Bay
The most common earnings brackets in Rockford Bay are $100,000+ for men (22 | 36.1%) and $100,000+ for women (11 | 29.7%).
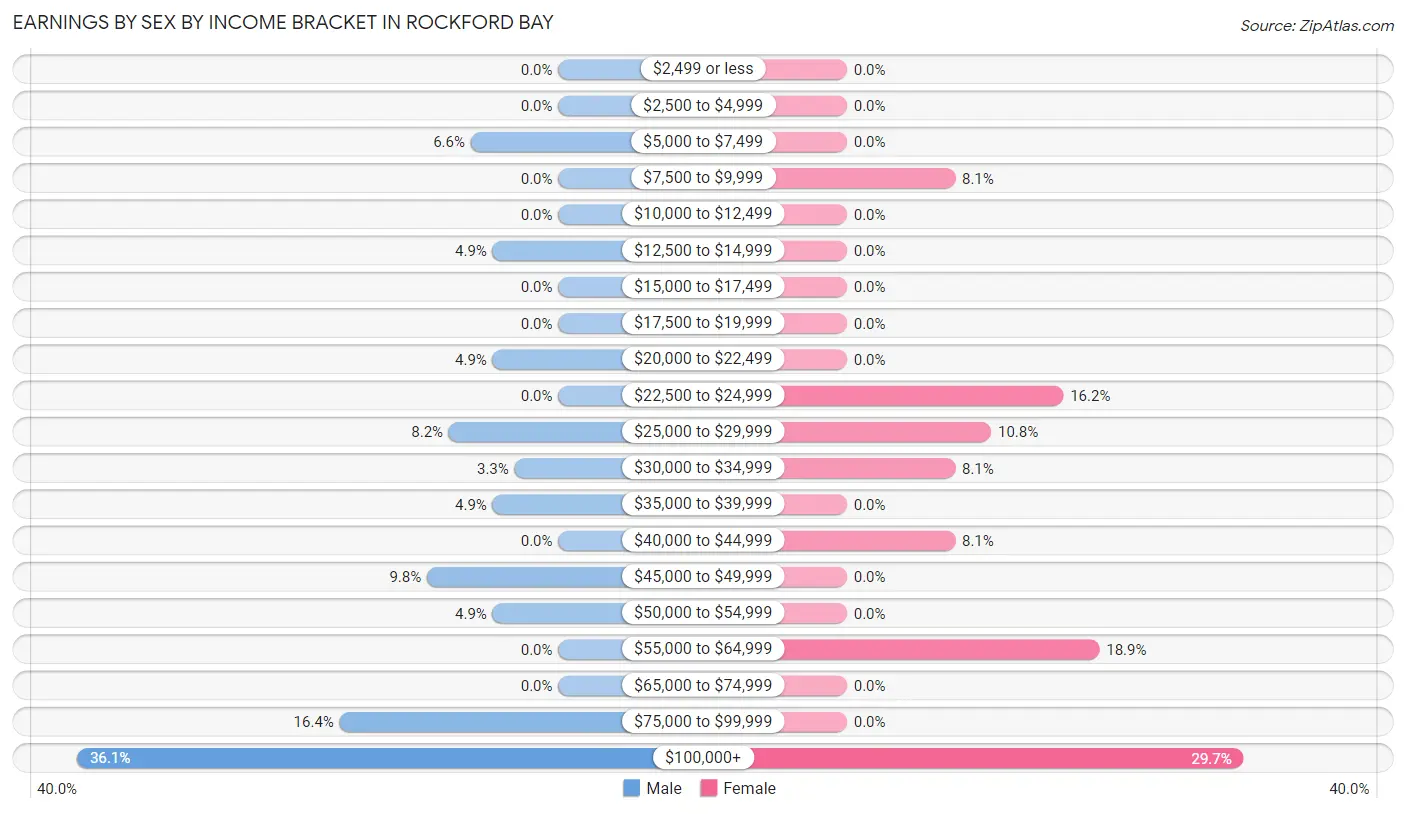
| Income | Male | Female |
| $2,499 or less | 0 (0.0%) | 0 (0.0%) |
| $2,500 to $4,999 | 0 (0.0%) | 0 (0.0%) |
| $5,000 to $7,499 | 4 (6.6%) | 0 (0.0%) |
| $7,500 to $9,999 | 0 (0.0%) | 3 (8.1%) |
| $10,000 to $12,499 | 0 (0.0%) | 0 (0.0%) |
| $12,500 to $14,999 | 3 (4.9%) | 0 (0.0%) |
| $15,000 to $17,499 | 0 (0.0%) | 0 (0.0%) |
| $17,500 to $19,999 | 0 (0.0%) | 0 (0.0%) |
| $20,000 to $22,499 | 3 (4.9%) | 0 (0.0%) |
| $22,500 to $24,999 | 0 (0.0%) | 6 (16.2%) |
| $25,000 to $29,999 | 5 (8.2%) | 4 (10.8%) |
| $30,000 to $34,999 | 2 (3.3%) | 3 (8.1%) |
| $35,000 to $39,999 | 3 (4.9%) | 0 (0.0%) |
| $40,000 to $44,999 | 0 (0.0%) | 3 (8.1%) |
| $45,000 to $49,999 | 6 (9.8%) | 0 (0.0%) |
| $50,000 to $54,999 | 3 (4.9%) | 0 (0.0%) |
| $55,000 to $64,999 | 0 (0.0%) | 7 (18.9%) |
| $65,000 to $74,999 | 0 (0.0%) | 0 (0.0%) |
| $75,000 to $99,999 | 10 (16.4%) | 0 (0.0%) |
| $100,000+ | 22 (36.1%) | 11 (29.7%) |
| Total | 61 (100.0%) | 37 (100.0%) |
Earnings by Sex by Educational Attainment in Rockford Bay
Average earnings in Rockford Bay are $85,938 for men and $44,583 for women, a difference of 48.1%. Men with an educational attainment of bachelor's degree enjoy the highest average annual earnings of $97,292, while those with college or associate's degree education earn the least with $43,750. Women with an educational attainment of college or associate's degree earn the most with the average annual earnings of $42,917, while those with college or associate's degree education have the smallest earnings of $42,917.
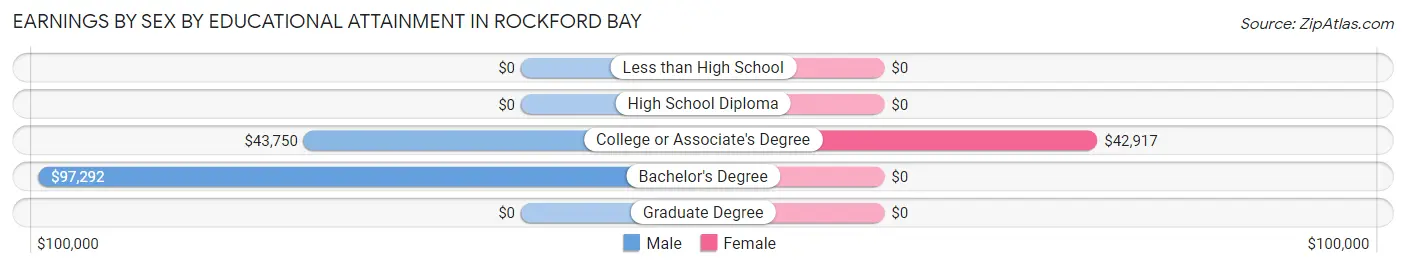
| Educational Attainment | Male Income | Female Income |
| Less than High School | - | - |
| High School Diploma | - | - |
| College or Associate's Degree | $43,750 | $42,917 |
| Bachelor's Degree | $97,292 | $0 |
| Graduate Degree | - | - |
| Total | $85,938 | $44,583 |
Family Income in Rockford Bay
Family Income Brackets in Rockford Bay
According to the Rockford Bay family income data, there are 25 families falling into the $200,000+ income range, which is the most common income bracket and makes up 26.6% of all families.
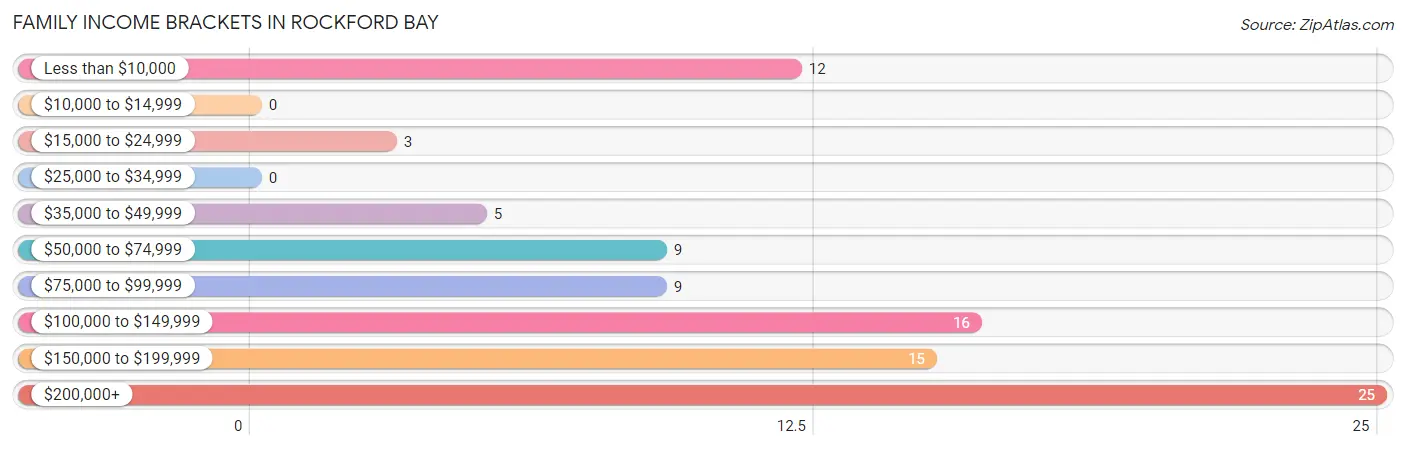
| Income Bracket | # Families | % Families |
| Less than $10,000 | 12 | 12.8% |
| $10,000 to $14,999 | 0 | 0.0% |
| $15,000 to $24,999 | 3 | 3.2% |
| $25,000 to $34,999 | 0 | 0.0% |
| $35,000 to $49,999 | 5 | 5.3% |
| $50,000 to $74,999 | 9 | 9.6% |
| $75,000 to $99,999 | 9 | 9.6% |
| $100,000 to $149,999 | 16 | 17.0% |
| $150,000 to $199,999 | 15 | 16.0% |
| $200,000+ | 25 | 26.6% |
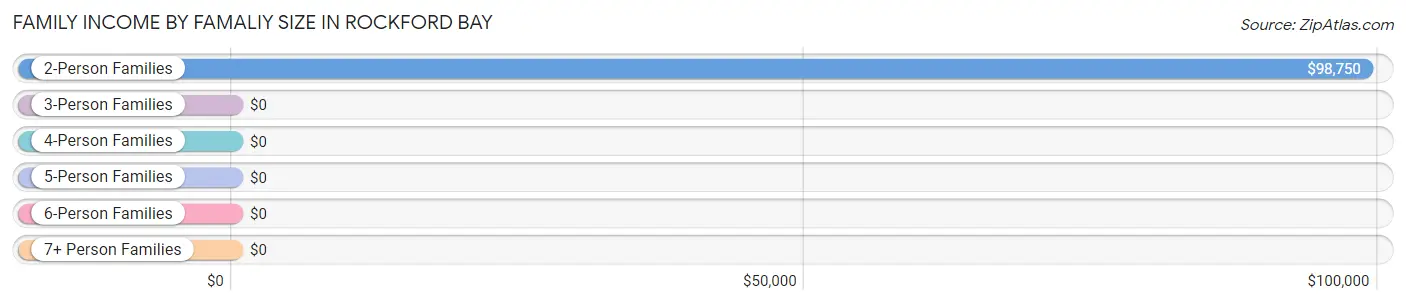
Family Income by Famaliy Size in Rockford Bay
2-person families (76 | 80.8%) account for the highest median family income in Rockford Bay with $98,750 per family, while 2-person families (76 | 80.8%) have the highest median income of $49,375 per family member.
| Income Bracket | # Families | Median Income |
| 2-Person Families | 76 (80.8%) | $98,750 |
| 3-Person Families | 3 (3.2%) | $0 |
| 4-Person Families | 3 (3.2%) | $0 |
| 5-Person Families | 6 (6.4%) | $0 |
| 6-Person Families | 6 (6.4%) | $0 |
| 7+ Person Families | 0 (0.0%) | $0 |
| Total | 94 (100.0%) | $127,500 |
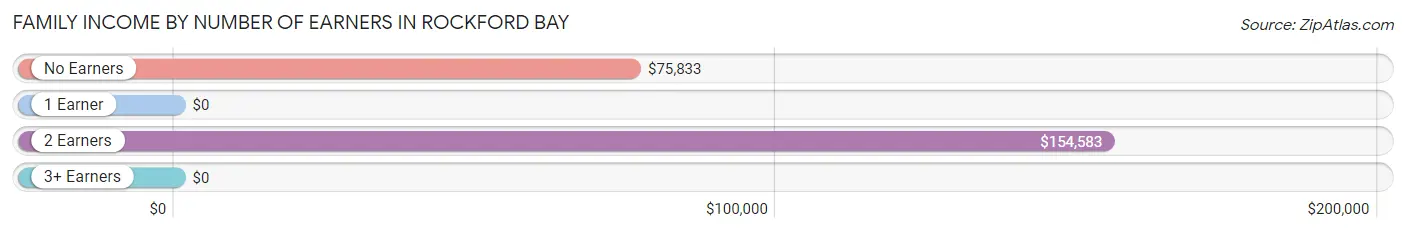
Family Income by Number of Earners in Rockford Bay
| Number of Earners | # Families | Median Income |
| No Earners | 50 (53.2%) | $75,833 |
| 1 Earner | 22 (23.4%) | $0 |
| 2 Earners | 22 (23.4%) | $154,583 |
| 3+ Earners | 0 (0.0%) | $0 |
| Total | 94 (100.0%) | $127,500 |
Household Income in Rockford Bay
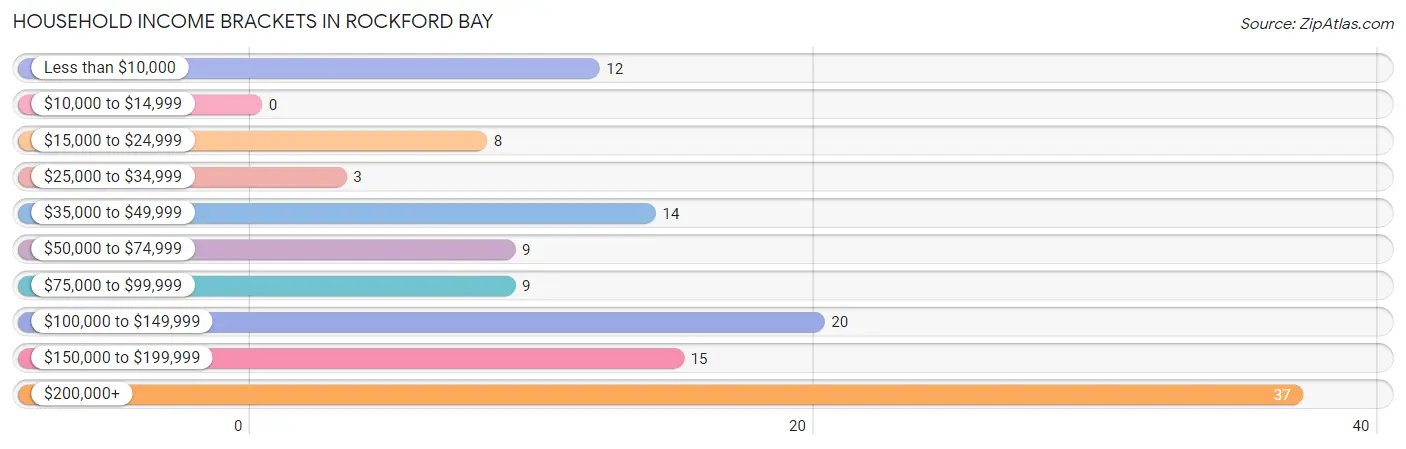
Household Income Brackets in Rockford Bay
With 37 households falling in the category, the $200,000+ income range is the most frequent in Rockford Bay, accounting for 29.1% of all households.
| Income Bracket | # Households | % Households |
| Less than $10,000 | 12 | 9.4% |
| $10,000 to $14,999 | 0 | 0.0% |
| $15,000 to $24,999 | 8 | 6.3% |
| $25,000 to $34,999 | 3 | 2.4% |
| $35,000 to $49,999 | 14 | 11.0% |
| $50,000 to $74,999 | 9 | 7.1% |
| $75,000 to $99,999 | 9 | 7.1% |
| $100,000 to $149,999 | 20 | 15.7% |
| $150,000 to $199,999 | 15 | 11.8% |
| $200,000+ | 37 | 29.1% |
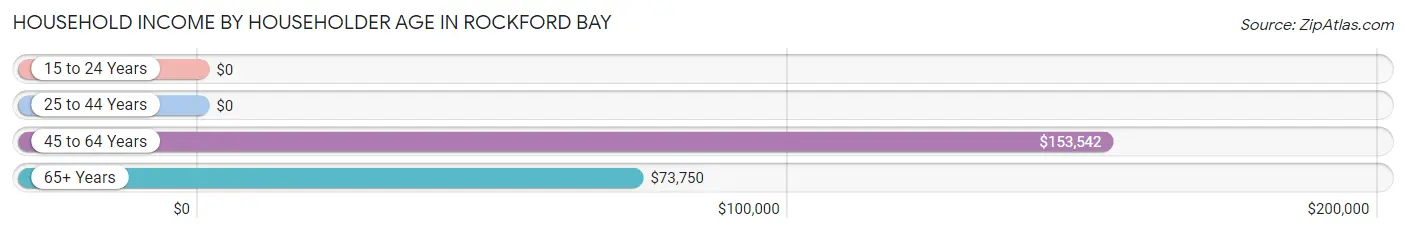
Household Income by Householder Age in Rockford Bay
The median household income in Rockford Bay is $123,750, with the highest median household income of $153,542 found in the 45 to 64 years age bracket for the primary householder. A total of 41 households (32.3%) fall into this category.
| Income Bracket | # Households | Median Income |
| 15 to 24 Years | 0 (0.0%) | $0 |
| 25 to 44 Years | 9 (7.1%) | $0 |
| 45 to 64 Years | 41 (32.3%) | $153,542 |
| 65+ Years | 77 (60.6%) | $73,750 |
| Total | 127 (100.0%) | $123,750 |
Poverty in Rockford Bay
Income Below Poverty by Sex and Age in Rockford Bay
With 7.3% poverty level for males and 8.5% for females among the residents of Rockford Bay, 35 to 44 year old males and 65 to 74 year old females are the most vulnerable to poverty, with 12 males (50.0%) and 12 females (23.1%) in their respective age groups living below the poverty level.
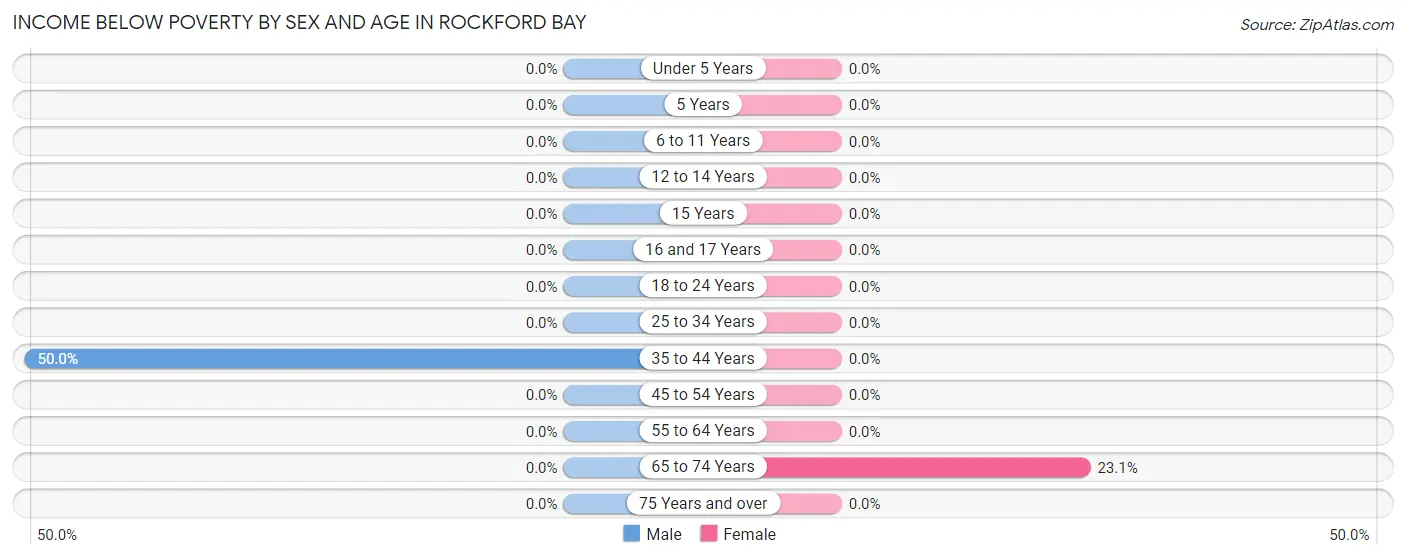
| Age Bracket | Male | Female |
| Under 5 Years | 0 (0.0%) | 0 (0.0%) |
| 5 Years | 0 (0.0%) | 0 (0.0%) |
| 6 to 11 Years | 0 (0.0%) | 0 (0.0%) |
| 12 to 14 Years | 0 (0.0%) | 0 (0.0%) |
| 15 Years | 0 (0.0%) | 0 (0.0%) |
| 16 and 17 Years | 0 (0.0%) | 0 (0.0%) |
| 18 to 24 Years | 0 (0.0%) | 0 (0.0%) |
| 25 to 34 Years | 0 (0.0%) | 0 (0.0%) |
| 35 to 44 Years | 12 (50.0%) | 0 (0.0%) |
| 45 to 54 Years | 0 (0.0%) | 0 (0.0%) |
| 55 to 64 Years | 0 (0.0%) | 0 (0.0%) |
| 65 to 74 Years | 0 (0.0%) | 12 (23.1%) |
| 75 Years and over | 0 (0.0%) | 0 (0.0%) |
| Total | 12 (7.3%) | 12 (8.5%) |
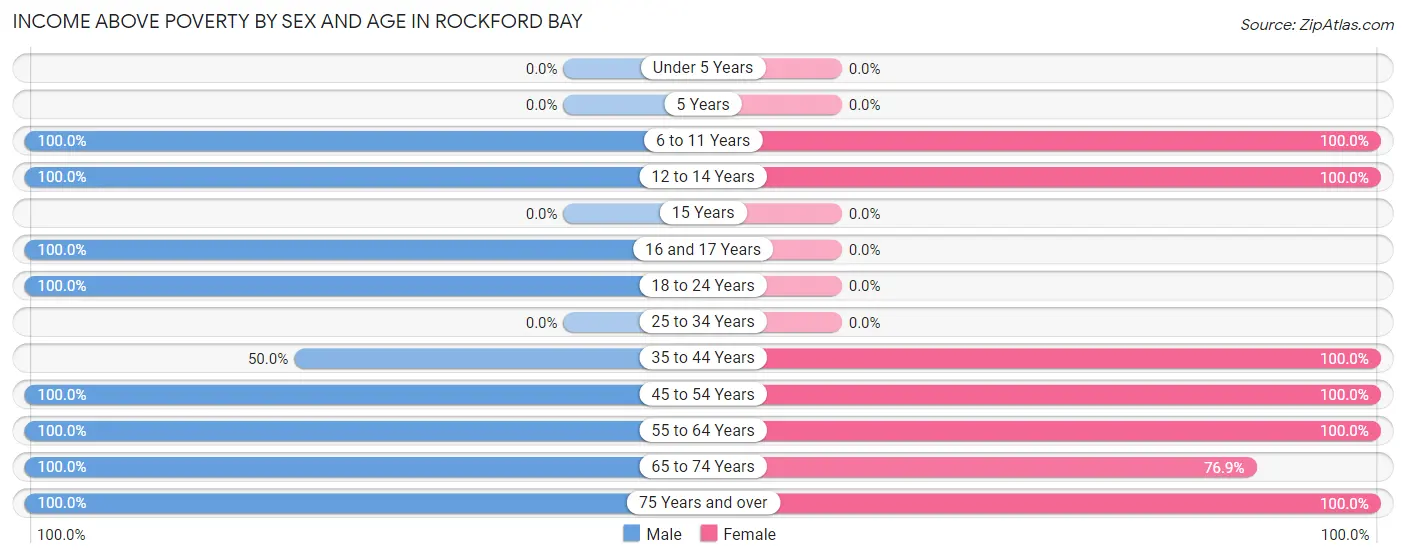
Income Above Poverty by Sex and Age in Rockford Bay
According to the poverty statistics in Rockford Bay, males aged 6 to 11 years and females aged 6 to 11 years are the age groups that are most secure financially, with 100.0% of males and 100.0% of females in these age groups living above the poverty line.
| Age Bracket | Male | Female |
| Under 5 Years | 0 (0.0%) | 0 (0.0%) |
| 5 Years | 0 (0.0%) | 0 (0.0%) |
| 6 to 11 Years | 14 (100.0%) | 8 (100.0%) |
| 12 to 14 Years | 7 (100.0%) | 26 (100.0%) |
| 15 Years | 0 (0.0%) | 0 (0.0%) |
| 16 and 17 Years | 10 (100.0%) | 0 (0.0%) |
| 18 to 24 Years | 3 (100.0%) | 0 (0.0%) |
| 25 to 34 Years | 0 (0.0%) | 0 (0.0%) |
| 35 to 44 Years | 12 (50.0%) | 9 (100.0%) |
| 45 to 54 Years | 11 (100.0%) | 18 (100.0%) |
| 55 to 64 Years | 28 (100.0%) | 24 (100.0%) |
| 65 to 74 Years | 59 (100.0%) | 40 (76.9%) |
| 75 Years and over | 8 (100.0%) | 5 (100.0%) |
| Total | 152 (92.7%) | 130 (91.5%) |
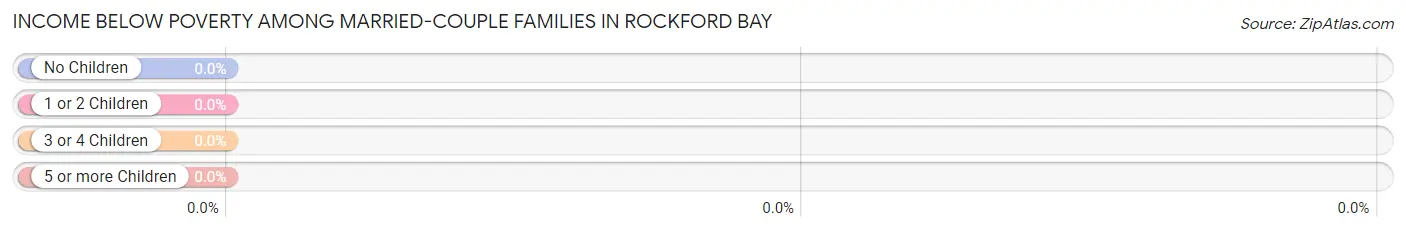
Income Below Poverty Among Married-Couple Families in Rockford Bay
| Children | Above Poverty | Below Poverty |
| No Children | 64 (100.0%) | 0 (0.0%) |
| 1 or 2 Children | 6 (100.0%) | 0 (0.0%) |
| 3 or 4 Children | 12 (100.0%) | 0 (0.0%) |
| 5 or more Children | 0 (0.0%) | 0 (0.0%) |
| Total | 82 (100.0%) | 0 (0.0%) |
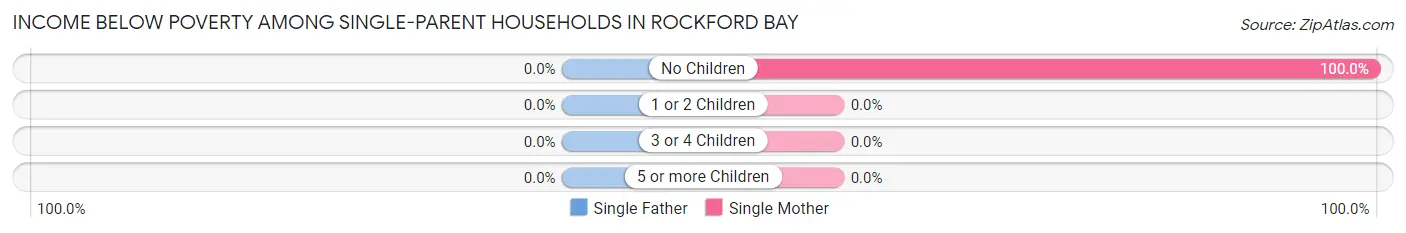
Income Below Poverty Among Single-Parent Households in Rockford Bay
| Children | Single Father | Single Mother |
| No Children | 0 (0.0%) | 12 (100.0%) |
| 1 or 2 Children | 0 (0.0%) | 0 (0.0%) |
| 3 or 4 Children | 0 (0.0%) | 0 (0.0%) |
| 5 or more Children | 0 (0.0%) | 0 (0.0%) |
| Total | 0 (0.0%) | 12 (100.0%) |
Income Below Poverty Among Married-Couple vs Single-Parent Households in Rockford Bay
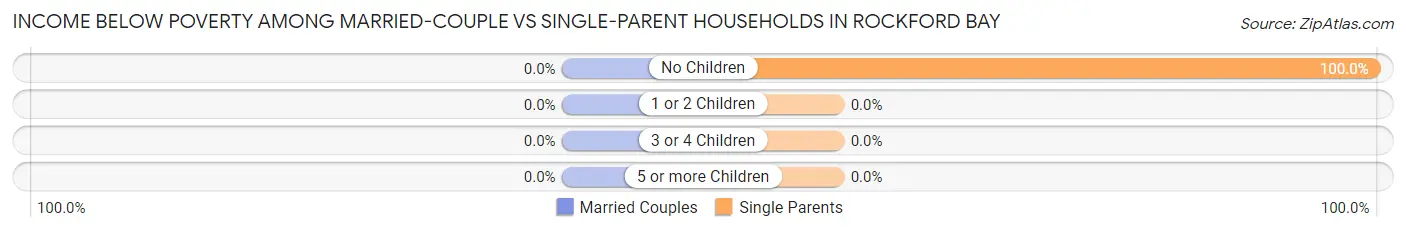
| Children | Married-Couple Families | Single-Parent Households |
| No Children | 0 (0.0%) | 12 (100.0%) |
| 1 or 2 Children | 0 (0.0%) | 0 (0.0%) |
| 3 or 4 Children | 0 (0.0%) | 0 (0.0%) |
| 5 or more Children | 0 (0.0%) | 0 (0.0%) |
| Total | 0 (0.0%) | 12 (100.0%) |
Employment Characteristics in Rockford Bay
Employment by Class of Employer in Rockford Bay
Among the 82 employed individuals in Rockford Bay, private company employees (41 | 50.0%), self-employed (incorporated) (14 | 17.1%), and self-employed (not incorporated) (10 | 12.2%) make up the most common classes of employment.
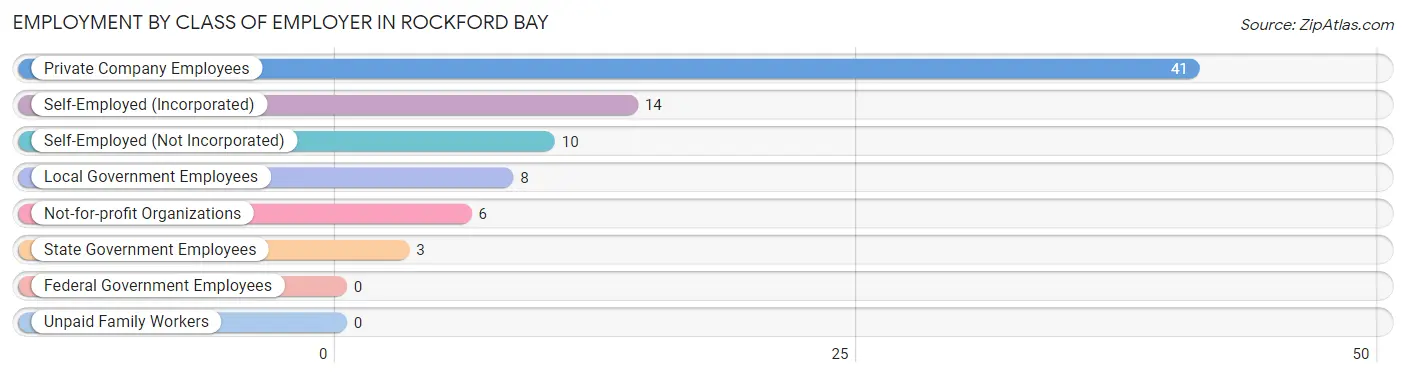
| Employer Class | # Employees | % Employees |
| Private Company Employees | 41 | 50.0% |
| Self-Employed (Incorporated) | 14 | 17.1% |
| Self-Employed (Not Incorporated) | 10 | 12.2% |
| Not-for-profit Organizations | 6 | 7.3% |
| Local Government Employees | 8 | 9.8% |
| State Government Employees | 3 | 3.7% |
| Federal Government Employees | 0 | 0.0% |
| Unpaid Family Workers | 0 | 0.0% |
| Total | 82 | 100.0% |
Employment Status by Age in Rockford Bay
According to the labor force statistics for Rockford Bay, out of the total population over 16 years of age (251), 38.2% or 96 individuals are in the labor force, with 11.5% or 11 of them unemployed. The age group with the highest labor force participation rate is 45 to 54 years, with 100.0% or 29 individuals in the labor force. Within the labor force, the 35 to 44 years age range has the highest percentage of unemployed individuals, with 28.6% or 6 of them being unemployed.
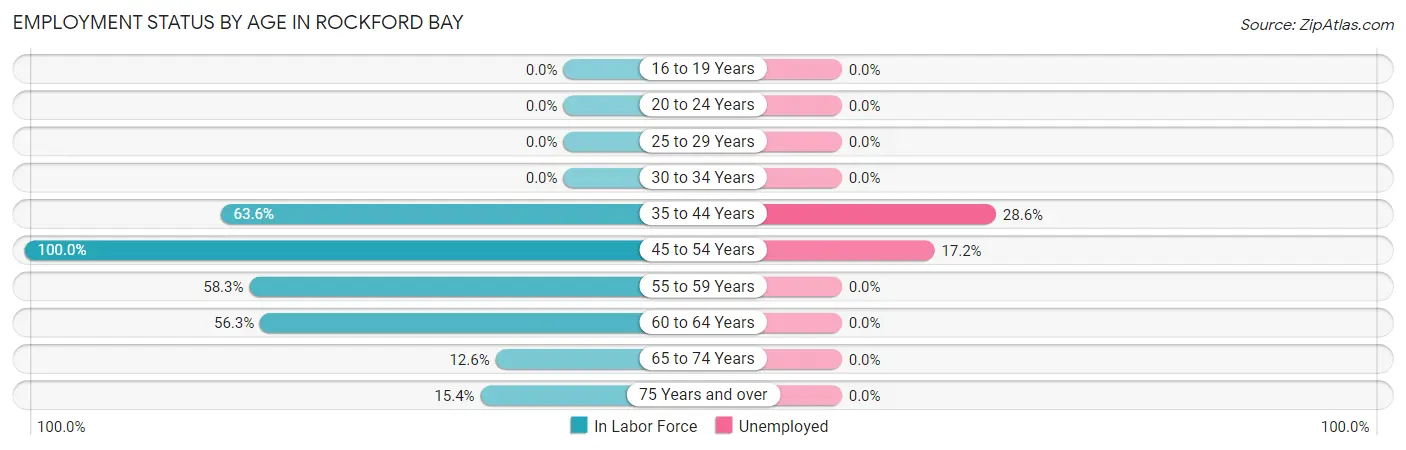
| Age Bracket | In Labor Force | Unemployed |
| 16 to 19 Years | 0 (0.0%) | 0 (0.0%) |
| 20 to 24 Years | 0 (0.0%) | 0 (0.0%) |
| 25 to 29 Years | 0 (0.0%) | 0 (0.0%) |
| 30 to 34 Years | 0 (0.0%) | 0 (0.0%) |
| 35 to 44 Years | 21 (63.6%) | 6 (28.6%) |
| 45 to 54 Years | 29 (100.0%) | 5 (17.2%) |
| 55 to 59 Years | 21 (58.3%) | 0 (0.0%) |
| 60 to 64 Years | 9 (56.3%) | 0 (0.0%) |
| 65 to 74 Years | 14 (12.6%) | 0 (0.0%) |
| 75 Years and over | 2 (15.4%) | 0 (0.0%) |
| Total | 96 (38.2%) | 11 (11.5%) |
Employment Status by Educational Attainment in Rockford Bay
According to labor force statistics for Rockford Bay, 70.2% of individuals (80) out of the total population between 25 and 64 years of age (114) are in the labor force, with 13.8% or 11 of them being unemployed. The group with the highest labor force participation rate are those with the educational attainment of college / associate degree, with 83.3% or 20 individuals in the labor force. Within the labor force, individuals with high school diploma education have the highest percentage of unemployment, with 55.6% or 5 of them being unemployed.
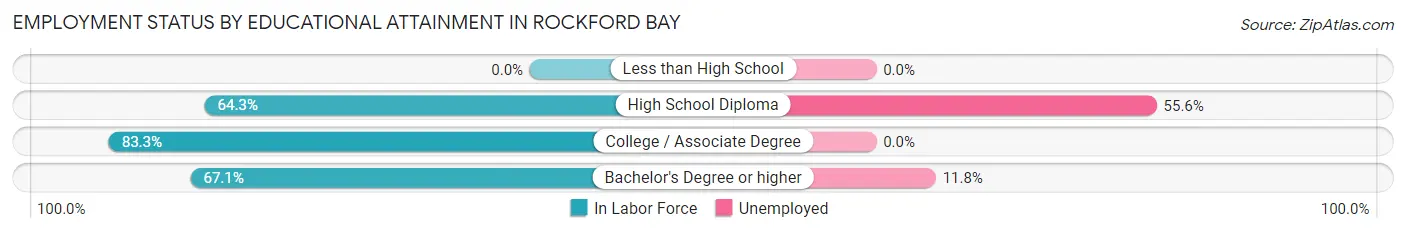
| Educational Attainment | In Labor Force | Unemployed |
| Less than High School | 0 (0.0%) | 0 (0.0%) |
| High School Diploma | 9 (64.3%) | 8 (55.6%) |
| College / Associate Degree | 20 (83.3%) | 0 (0.0%) |
| Bachelor's Degree or higher | 51 (67.1%) | 9 (11.8%) |
| Total | 80 (70.2%) | 16 (13.8%) |
Employment Occupations by Sex in Rockford Bay
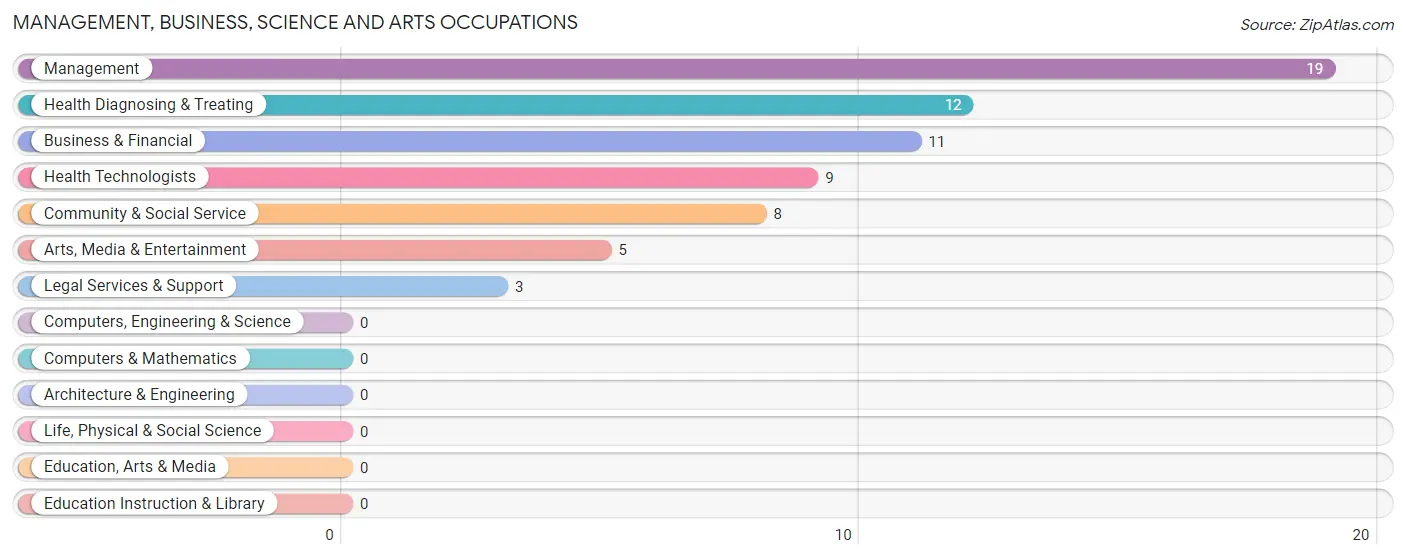
Management, Business, Science and Arts Occupations
The most common Management, Business, Science and Arts occupations in Rockford Bay are Management (19 | 22.4%), Health Diagnosing & Treating (12 | 14.1%), Business & Financial (11 | 12.9%), Health Technologists (9 | 10.6%), and Community & Social Service (8 | 9.4%).
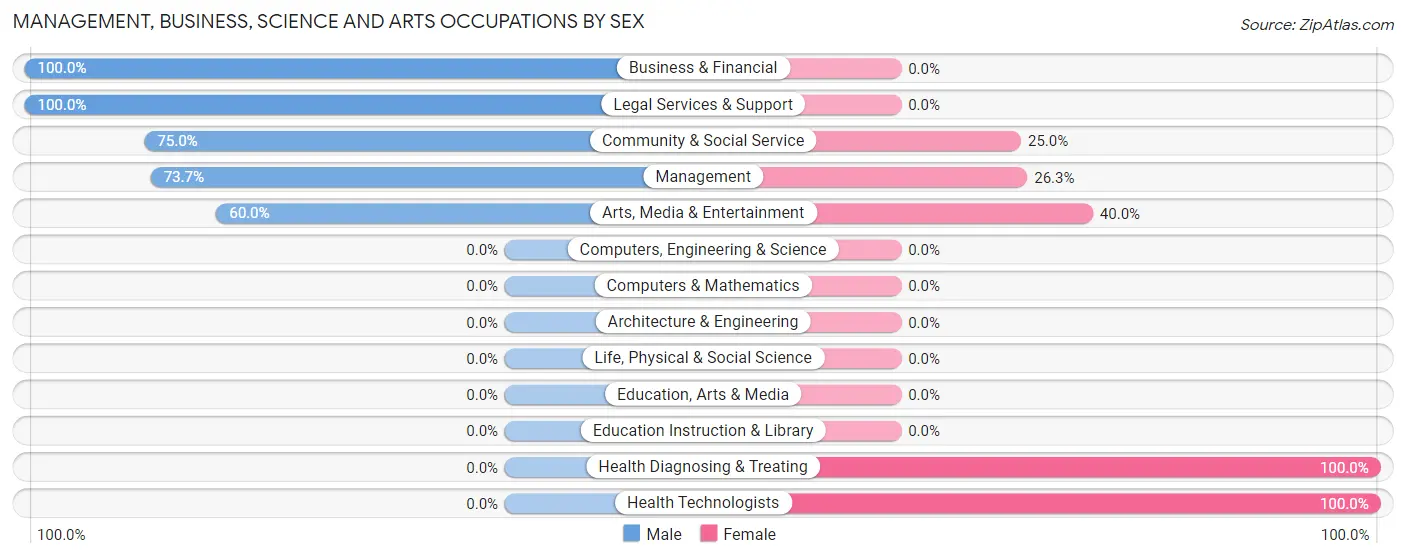
Management, Business, Science and Arts Occupations by Sex
Within the Management, Business, Science and Arts occupations in Rockford Bay, the most male-oriented occupations are Business & Financial (100.0%), Legal Services & Support (100.0%), and Community & Social Service (75.0%), while the most female-oriented occupations are Health Diagnosing & Treating (100.0%), Health Technologists (100.0%), and Arts, Media & Entertainment (40.0%).
| Occupation | Male | Female |
| Management | 14 (73.7%) | 5 (26.3%) |
| Business & Financial | 11 (100.0%) | 0 (0.0%) |
| Computers, Engineering & Science | 0 (0.0%) | 0 (0.0%) |
| Computers & Mathematics | 0 (0.0%) | 0 (0.0%) |
| Architecture & Engineering | 0 (0.0%) | 0 (0.0%) |
| Life, Physical & Social Science | 0 (0.0%) | 0 (0.0%) |
| Community & Social Service | 6 (75.0%) | 2 (25.0%) |
| Education, Arts & Media | 0 (0.0%) | 0 (0.0%) |
| Legal Services & Support | 3 (100.0%) | 0 (0.0%) |
| Education Instruction & Library | 0 (0.0%) | 0 (0.0%) |
| Arts, Media & Entertainment | 3 (60.0%) | 2 (40.0%) |
| Health Diagnosing & Treating | 0 (0.0%) | 12 (100.0%) |
| Health Technologists | 0 (0.0%) | 9 (100.0%) |
| Total (Category) | 31 (62.0%) | 19 (38.0%) |
| Total (Overall) | 52 (61.2%) | 33 (38.8%) |
Services Occupations
Services Occupations by Sex
| Occupation | Male | Female |
| Healthcare Support | 0 (0.0%) | 0 (0.0%) |
| Security & Protection | 0 (0.0%) | 0 (0.0%) |
| Firefighting & Prevention | 0 (0.0%) | 0 (0.0%) |
| Law Enforcement | 0 (0.0%) | 0 (0.0%) |
| Food Preparation & Serving | 0 (0.0%) | 0 (0.0%) |
| Cleaning & Maintenance | 0 (0.0%) | 0 (0.0%) |
| Personal Care & Service | 0 (0.0%) | 0 (0.0%) |
| Total (Category) | 0 (0.0%) | 0 (0.0%) |
| Total (Overall) | 52 (61.2%) | 33 (38.8%) |
Sales and Office Occupations
The most common Sales and Office occupations in Rockford Bay are Office & Administration (11 | 12.9%), and Sales & Related (6 | 7.1%).
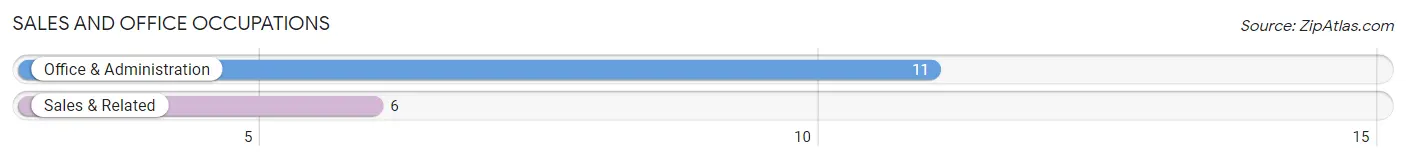
Sales and Office Occupations by Sex
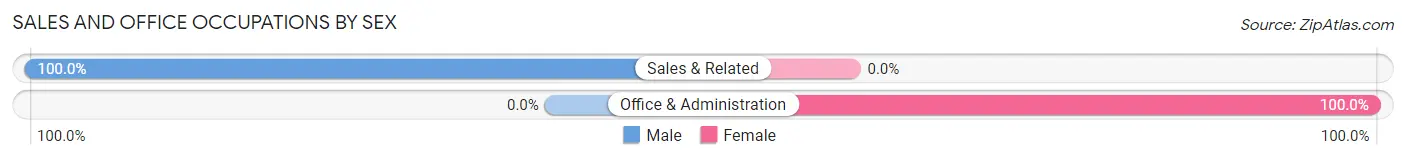
| Occupation | Male | Female |
| Sales & Related | 6 (100.0%) | 0 (0.0%) |
| Office & Administration | 0 (0.0%) | 11 (100.0%) |
| Total (Category) | 6 (35.3%) | 11 (64.7%) |
| Total (Overall) | 52 (61.2%) | 33 (38.8%) |
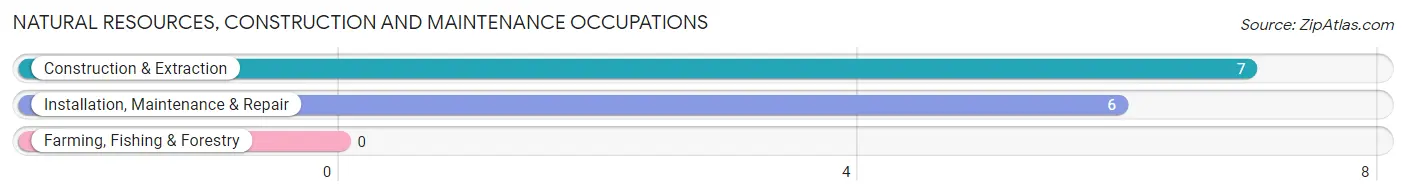
Natural Resources, Construction and Maintenance Occupations
The most common Natural Resources, Construction and Maintenance occupations in Rockford Bay are Construction & Extraction (7 | 8.2%), and Installation, Maintenance & Repair (6 | 7.1%).
Natural Resources, Construction and Maintenance Occupations by Sex
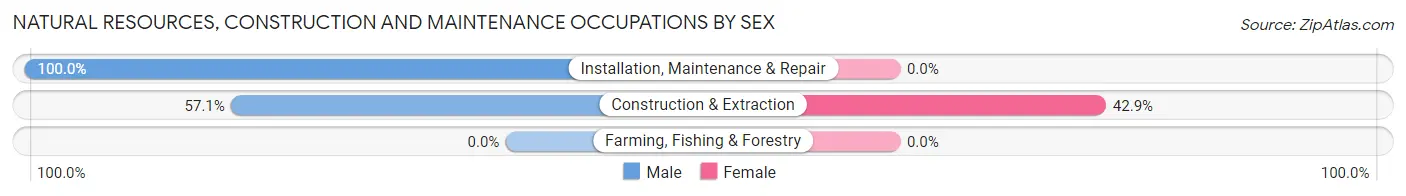
| Occupation | Male | Female |
| Farming, Fishing & Forestry | 0 (0.0%) | 0 (0.0%) |
| Construction & Extraction | 4 (57.1%) | 3 (42.9%) |
| Installation, Maintenance & Repair | 6 (100.0%) | 0 (0.0%) |
| Total (Category) | 10 (76.9%) | 3 (23.1%) |
| Total (Overall) | 52 (61.2%) | 33 (38.8%) |
Production, Transportation and Moving Occupations
The most common Production, Transportation and Moving occupations in Rockford Bay are , and Transportation (5 | 5.9%).
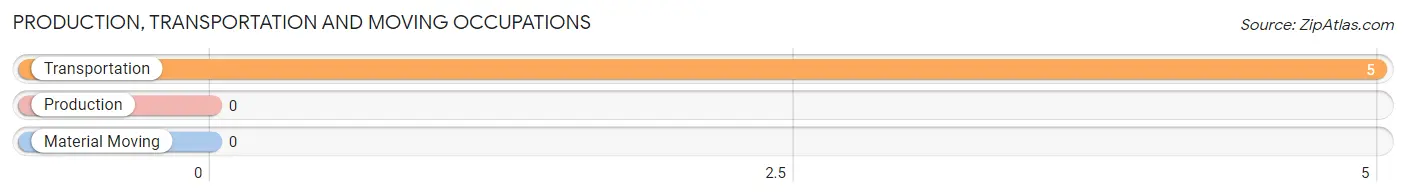
Production, Transportation and Moving Occupations by Sex
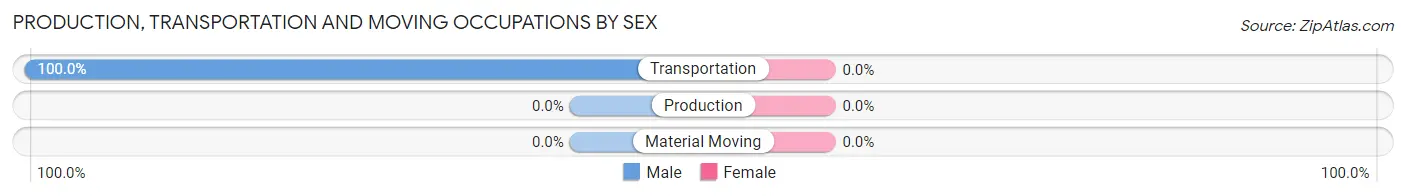
| Occupation | Male | Female |
| Production | 0 (0.0%) | 0 (0.0%) |
| Transportation | 5 (100.0%) | 0 (0.0%) |
| Material Moving | 0 (0.0%) | 0 (0.0%) |
| Total (Category) | 5 (100.0%) | 0 (0.0%) |
| Total (Overall) | 52 (61.2%) | 33 (38.8%) |
Employment Industries by Sex in Rockford Bay
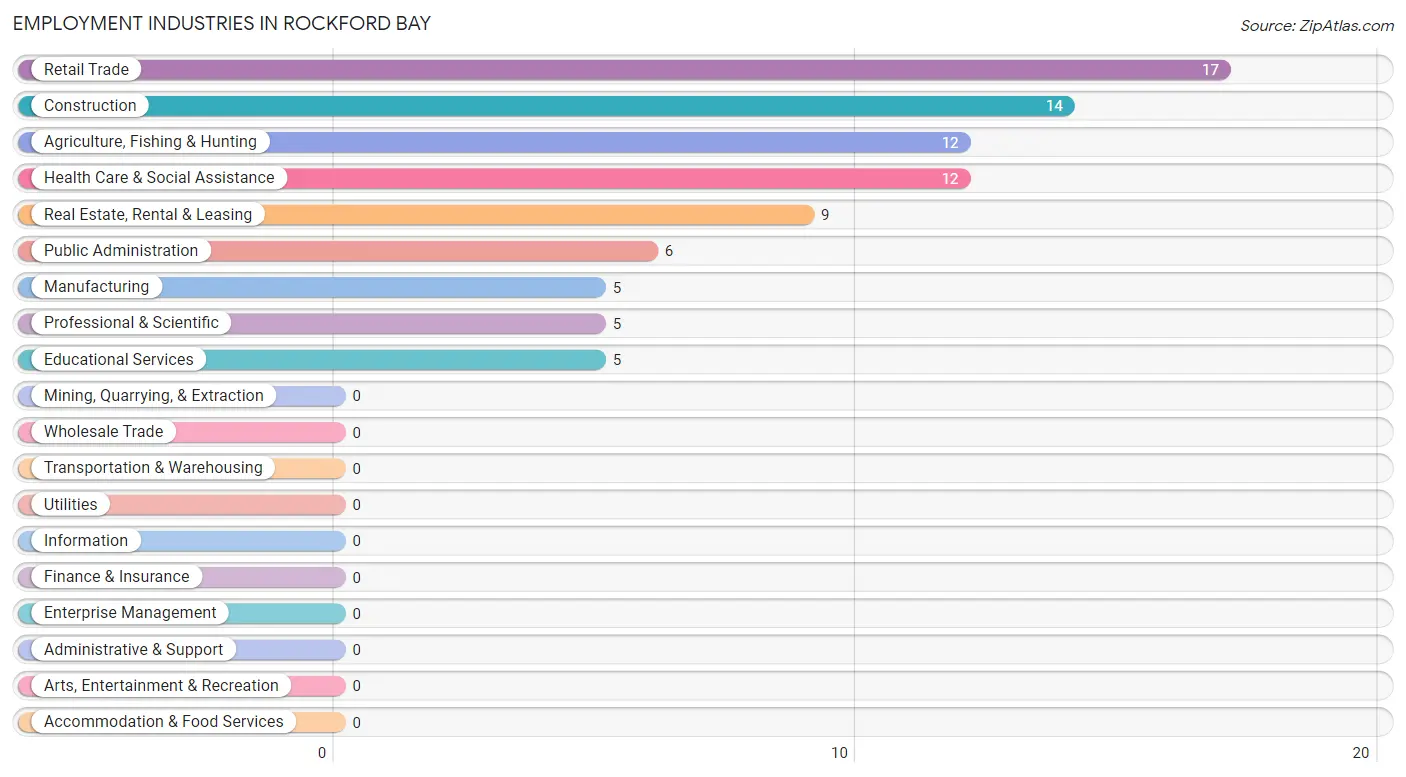
Employment Industries in Rockford Bay
The major employment industries in Rockford Bay include Retail Trade (17 | 20.0%), Construction (14 | 16.5%), Agriculture, Fishing & Hunting (12 | 14.1%), Health Care & Social Assistance (12 | 14.1%), and Real Estate, Rental & Leasing (9 | 10.6%).
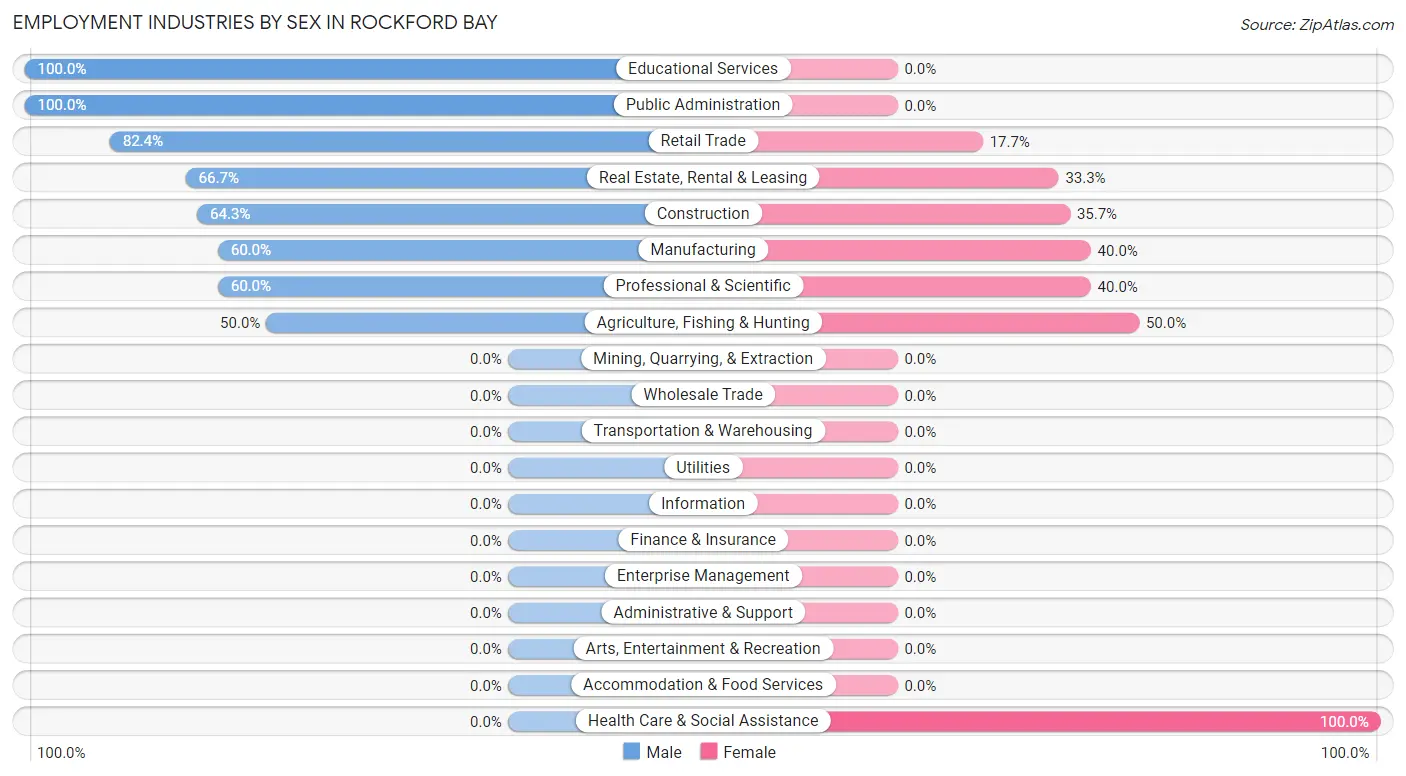
Employment Industries by Sex in Rockford Bay
The Rockford Bay industries that see more men than women are Educational Services (100.0%), Public Administration (100.0%), and Retail Trade (82.4%), whereas the industries that tend to have a higher number of women are Health Care & Social Assistance (100.0%), Agriculture, Fishing & Hunting (50.0%), and Manufacturing (40.0%).
| Industry | Male | Female |
| Agriculture, Fishing & Hunting | 6 (50.0%) | 6 (50.0%) |
| Mining, Quarrying, & Extraction | 0 (0.0%) | 0 (0.0%) |
| Construction | 9 (64.3%) | 5 (35.7%) |
| Manufacturing | 3 (60.0%) | 2 (40.0%) |
| Wholesale Trade | 0 (0.0%) | 0 (0.0%) |
| Retail Trade | 14 (82.4%) | 3 (17.6%) |
| Transportation & Warehousing | 0 (0.0%) | 0 (0.0%) |
| Utilities | 0 (0.0%) | 0 (0.0%) |
| Information | 0 (0.0%) | 0 (0.0%) |
| Finance & Insurance | 0 (0.0%) | 0 (0.0%) |
| Real Estate, Rental & Leasing | 6 (66.7%) | 3 (33.3%) |
| Professional & Scientific | 3 (60.0%) | 2 (40.0%) |
| Enterprise Management | 0 (0.0%) | 0 (0.0%) |
| Administrative & Support | 0 (0.0%) | 0 (0.0%) |
| Educational Services | 5 (100.0%) | 0 (0.0%) |
| Health Care & Social Assistance | 0 (0.0%) | 12 (100.0%) |
| Arts, Entertainment & Recreation | 0 (0.0%) | 0 (0.0%) |
| Accommodation & Food Services | 0 (0.0%) | 0 (0.0%) |
| Public Administration | 6 (100.0%) | 0 (0.0%) |
| Total | 52 (61.2%) | 33 (38.8%) |
Education in Rockford Bay
School Enrollment in Rockford Bay
The most common levels of schooling among the 68 students in Rockford Bay are middle school (47 | 69.1%), high school (10 | 14.7%), and elementary school (8 | 11.8%).
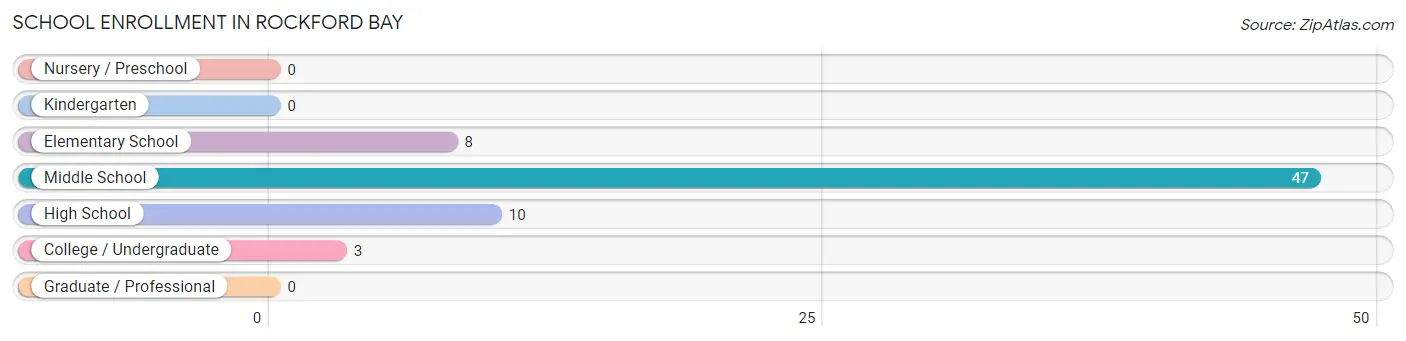
| School Level | # Students | % Students |
| Nursery / Preschool | 0 | 0.0% |
| Kindergarten | 0 | 0.0% |
| Elementary School | 8 | 11.8% |
| Middle School | 47 | 69.1% |
| High School | 10 | 14.7% |
| College / Undergraduate | 3 | 4.4% |
| Graduate / Professional | 0 | 0.0% |
| Total | 68 | 100.0% |
School Enrollment by Age by Funding Source in Rockford Bay
Out of a total of 68 students who are enrolled in schools in Rockford Bay, 1 (1.5%) attend a private institution, while the remaining 67 (98.5%) are enrolled in public schools. The age group of 5 to 9 year old has the highest likelihood of being enrolled in private schools, with 1 (12.5% in the age bracket) enrolled. Conversely, the age group of 10 to 14 year olds has the lowest likelihood of being enrolled in a private school, with 47 (100.0% in the age bracket) attending a public institution.
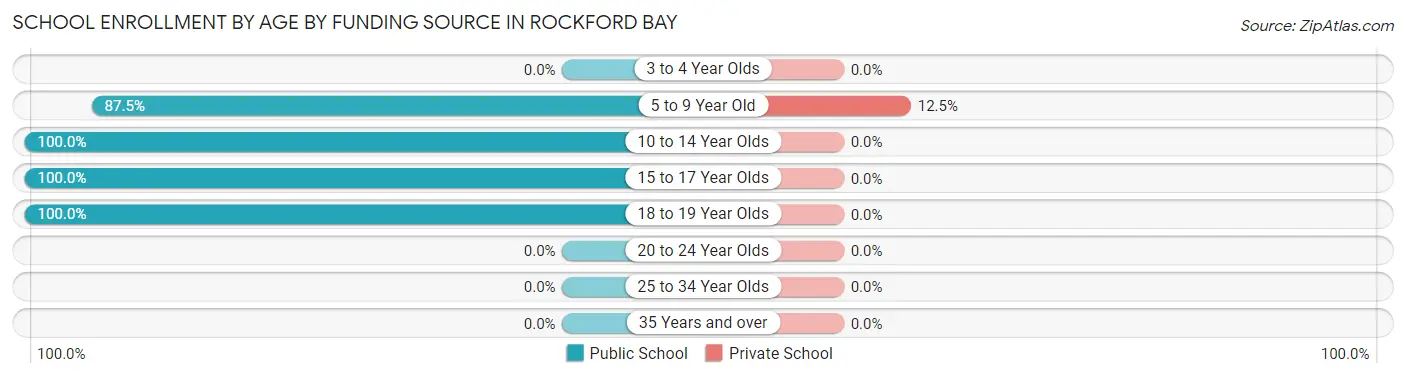
| Age Bracket | Public School | Private School |
| 3 to 4 Year Olds | 0 (0.0%) | 0 (0.0%) |
| 5 to 9 Year Old | 7 (87.5%) | 1 (12.5%) |
| 10 to 14 Year Olds | 47 (100.0%) | 0 (0.0%) |
| 15 to 17 Year Olds | 10 (100.0%) | 0 (0.0%) |
| 18 to 19 Year Olds | 3 (100.0%) | 0 (0.0%) |
| 20 to 24 Year Olds | 0 (0.0%) | 0 (0.0%) |
| 25 to 34 Year Olds | 0 (0.0%) | 0 (0.0%) |
| 35 Years and over | 0 (0.0%) | 0 (0.0%) |
| Total | 67 (98.5%) | 1 (1.5%) |
Educational Attainment by Field of Study in Rockford Bay
Social sciences (28 | 19.6%), business (21 | 14.7%), arts & humanities (21 | 14.7%), bio, nature & agricultural (15 | 10.5%), and physical & health sciences (12 | 8.4%) are the most common fields of study among 143 individuals in Rockford Bay who have obtained a bachelor's degree or higher.
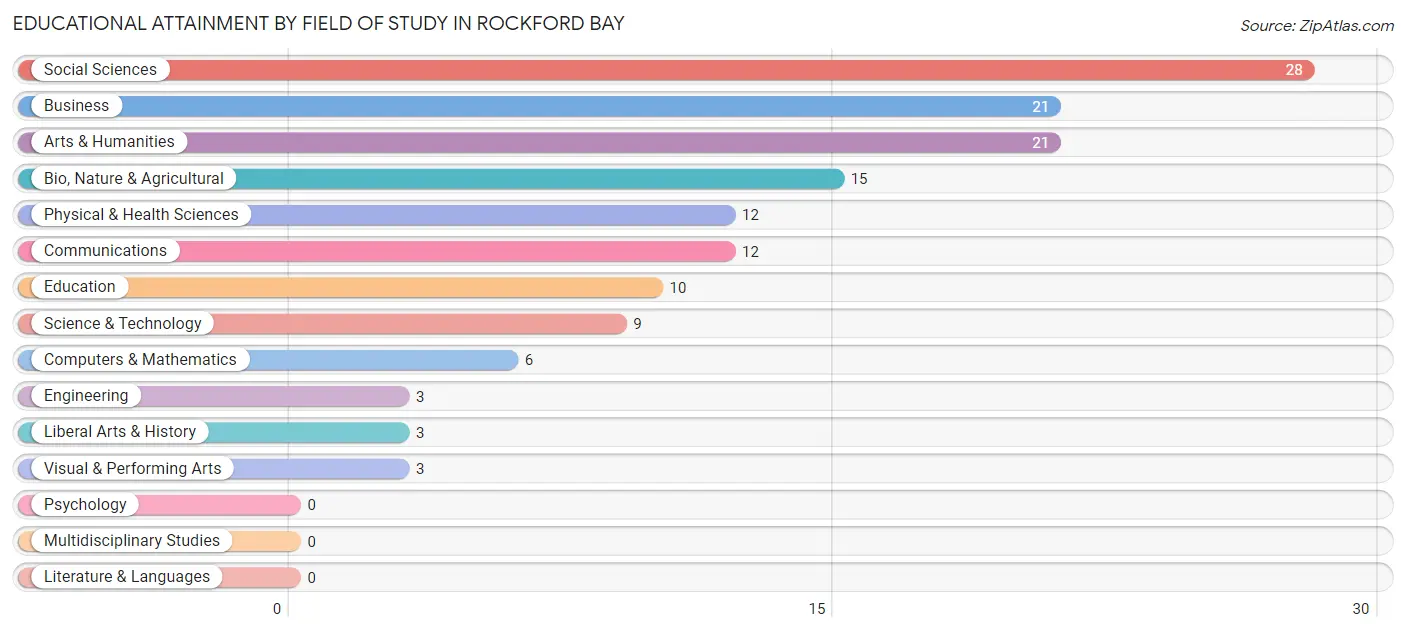
| Field of Study | # Graduates | % Graduates |
| Computers & Mathematics | 6 | 4.2% |
| Bio, Nature & Agricultural | 15 | 10.5% |
| Physical & Health Sciences | 12 | 8.4% |
| Psychology | 0 | 0.0% |
| Social Sciences | 28 | 19.6% |
| Engineering | 3 | 2.1% |
| Multidisciplinary Studies | 0 | 0.0% |
| Science & Technology | 9 | 6.3% |
| Business | 21 | 14.7% |
| Education | 10 | 7.0% |
| Literature & Languages | 0 | 0.0% |
| Liberal Arts & History | 3 | 2.1% |
| Visual & Performing Arts | 3 | 2.1% |
| Communications | 12 | 8.4% |
| Arts & Humanities | 21 | 14.7% |
| Total | 143 | 100.0% |
Transportation & Commute in Rockford Bay
Vehicle Availability by Sex in Rockford Bay
The most prevalent vehicle ownership categories in Rockford Bay are males with 2 vehicles (27, accounting for 55.1%) and females with 2 vehicles (13, making up 81.8%).
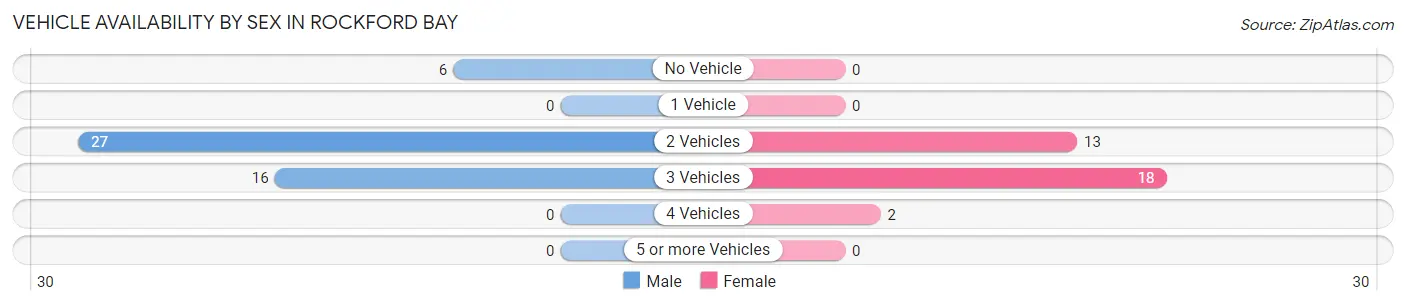
| Vehicles Available | Male | Female |
| No Vehicle | 6 (12.2%) | 0 (0.0%) |
| 1 Vehicle | 0 (0.0%) | 0 (0.0%) |
| 2 Vehicles | 27 (55.1%) | 13 (39.4%) |
| 3 Vehicles | 16 (32.7%) | 18 (54.5%) |
| 4 Vehicles | 0 (0.0%) | 2 (6.1%) |
| 5 or more Vehicles | 0 (0.0%) | 0 (0.0%) |
| Total | 49 (100.0%) | 33 (100.0%) |
Commute Time in Rockford Bay
The most frequently occuring commute durations in Rockford Bay are 10 to 14 minutes (15 commuters, 27.8%), 20 to 24 minutes (7 commuters, 13.0%), and 25 to 29 minutes (6 commuters, 11.1%).
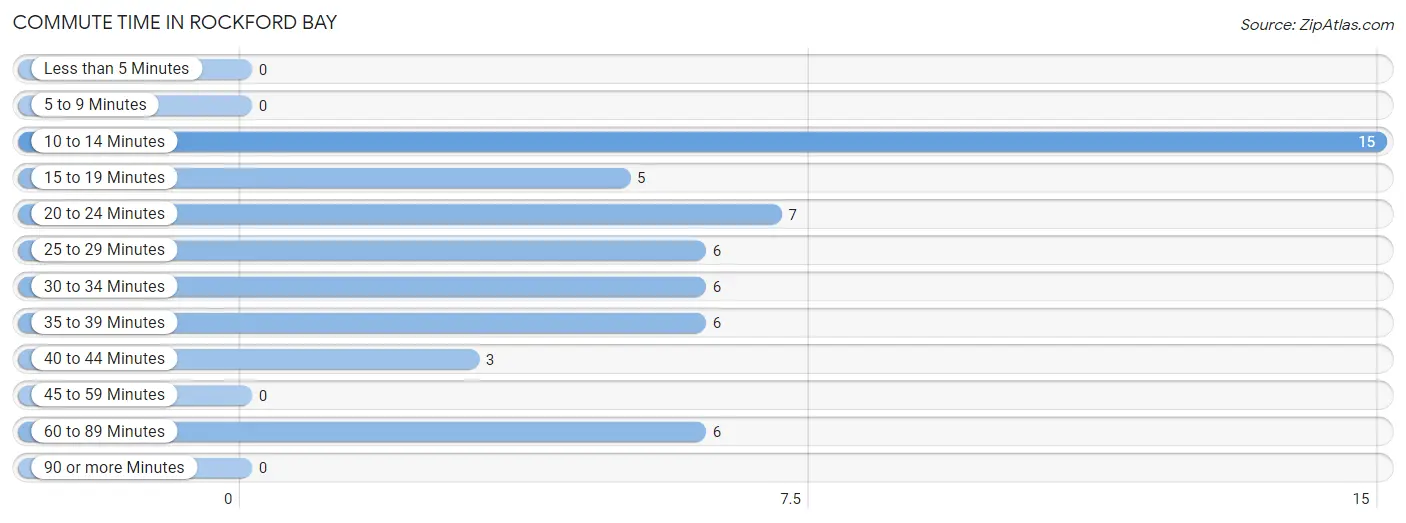
| Commute Time | # Commuters | % Commuters |
| Less than 5 Minutes | 0 | 0.0% |
| 5 to 9 Minutes | 0 | 0.0% |
| 10 to 14 Minutes | 15 | 27.8% |
| 15 to 19 Minutes | 5 | 9.3% |
| 20 to 24 Minutes | 7 | 13.0% |
| 25 to 29 Minutes | 6 | 11.1% |
| 30 to 34 Minutes | 6 | 11.1% |
| 35 to 39 Minutes | 6 | 11.1% |
| 40 to 44 Minutes | 3 | 5.6% |
| 45 to 59 Minutes | 0 | 0.0% |
| 60 to 89 Minutes | 6 | 11.1% |
| 90 or more Minutes | 0 | 0.0% |
Commute Time by Sex in Rockford Bay
The most common commute times in Rockford Bay are 10 to 14 minutes (15 commuters, 39.5%) for males and 35 to 39 minutes (6 commuters, 37.5%) for females.
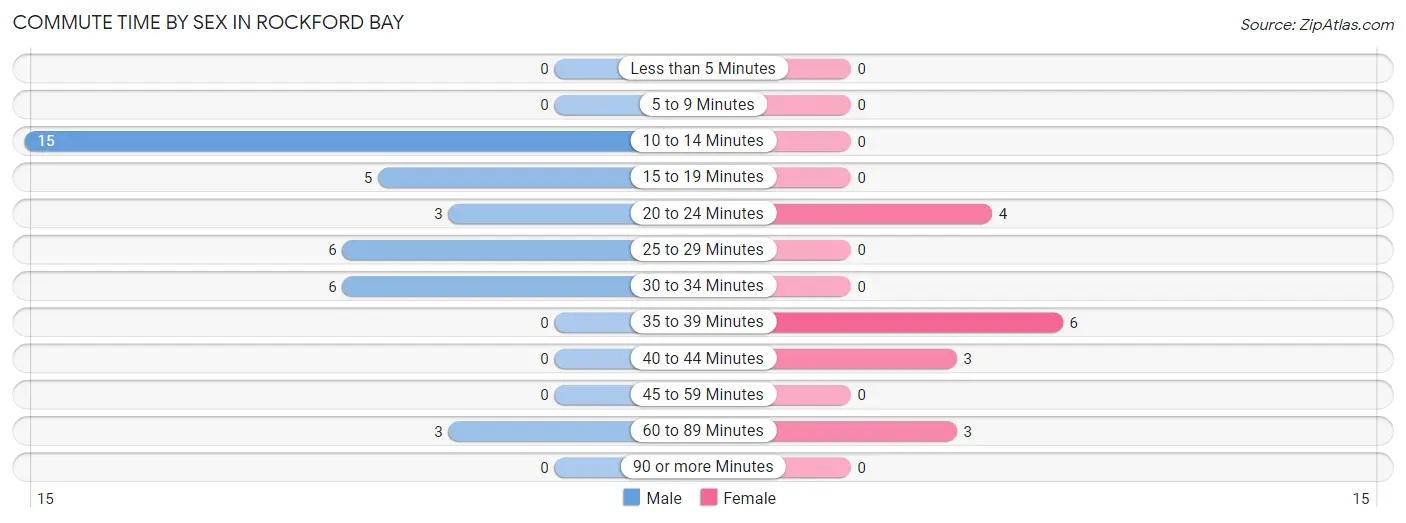
| Commute Time | Male | Female |
| Less than 5 Minutes | 0 (0.0%) | 0 (0.0%) |
| 5 to 9 Minutes | 0 (0.0%) | 0 (0.0%) |
| 10 to 14 Minutes | 15 (39.5%) | 0 (0.0%) |
| 15 to 19 Minutes | 5 (13.2%) | 0 (0.0%) |
| 20 to 24 Minutes | 3 (7.9%) | 4 (25.0%) |
| 25 to 29 Minutes | 6 (15.8%) | 0 (0.0%) |
| 30 to 34 Minutes | 6 (15.8%) | 0 (0.0%) |
| 35 to 39 Minutes | 0 (0.0%) | 6 (37.5%) |
| 40 to 44 Minutes | 0 (0.0%) | 3 (18.8%) |
| 45 to 59 Minutes | 0 (0.0%) | 0 (0.0%) |
| 60 to 89 Minutes | 3 (7.9%) | 3 (18.8%) |
| 90 or more Minutes | 0 (0.0%) | 0 (0.0%) |
Time of Departure to Work by Sex in Rockford Bay
The most frequent times of departure to work in Rockford Bay are 6:00 AM to 6:29 AM (12, 31.6%) for males and 6:30 AM to 6:59 AM (9, 56.2%) for females.
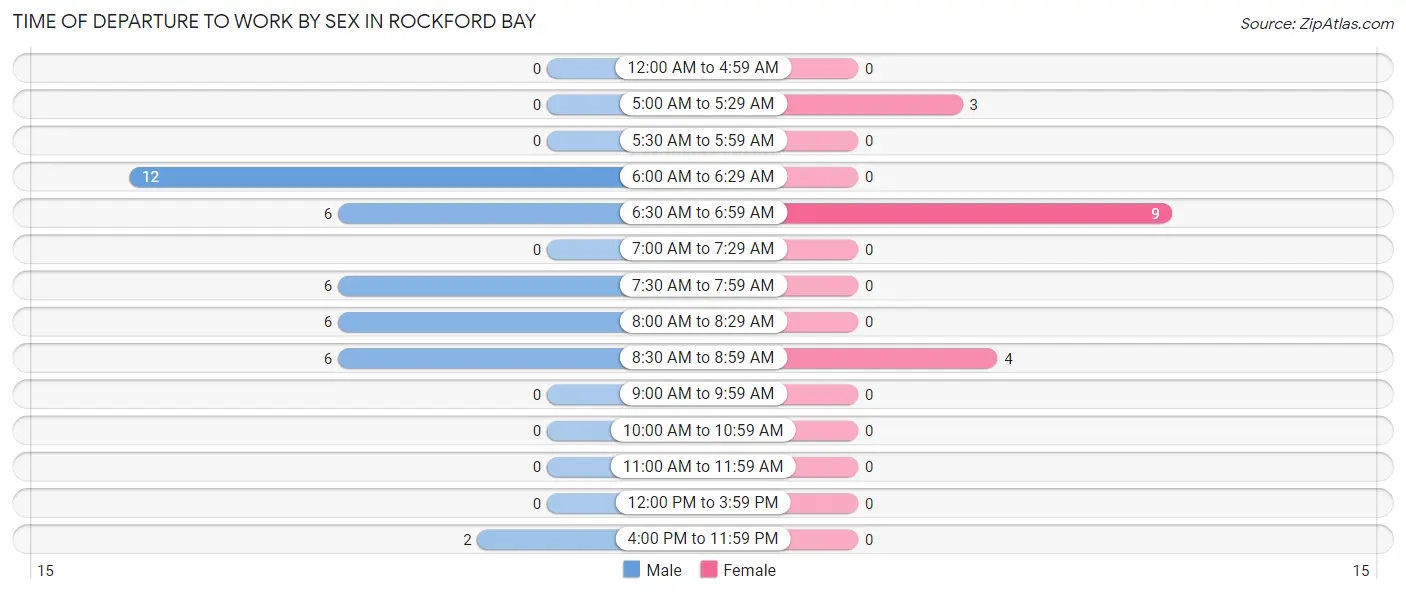
| Time of Departure | Male | Female |
| 12:00 AM to 4:59 AM | 0 (0.0%) | 0 (0.0%) |
| 5:00 AM to 5:29 AM | 0 (0.0%) | 3 (18.8%) |
| 5:30 AM to 5:59 AM | 0 (0.0%) | 0 (0.0%) |
| 6:00 AM to 6:29 AM | 12 (31.6%) | 0 (0.0%) |
| 6:30 AM to 6:59 AM | 6 (15.8%) | 9 (56.2%) |
| 7:00 AM to 7:29 AM | 0 (0.0%) | 0 (0.0%) |
| 7:30 AM to 7:59 AM | 6 (15.8%) | 0 (0.0%) |
| 8:00 AM to 8:29 AM | 6 (15.8%) | 0 (0.0%) |
| 8:30 AM to 8:59 AM | 6 (15.8%) | 4 (25.0%) |
| 9:00 AM to 9:59 AM | 0 (0.0%) | 0 (0.0%) |
| 10:00 AM to 10:59 AM | 0 (0.0%) | 0 (0.0%) |
| 11:00 AM to 11:59 AM | 0 (0.0%) | 0 (0.0%) |
| 12:00 PM to 3:59 PM | 0 (0.0%) | 0 (0.0%) |
| 4:00 PM to 11:59 PM | 2 (5.3%) | 0 (0.0%) |
| Total | 38 (100.0%) | 16 (100.0%) |
Housing Occupancy in Rockford Bay
Occupancy by Ownership in Rockford Bay
Of the total 127 dwellings in Rockford Bay, owner-occupied units account for 120 (94.5%), while renter-occupied units make up 7 (5.5%).
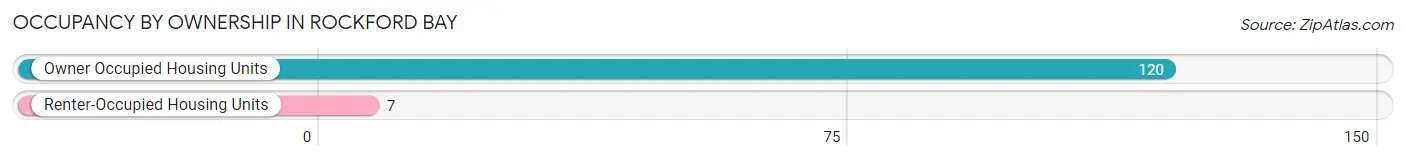
| Occupancy | # Housing Units | % Housing Units |
| Owner Occupied Housing Units | 120 | 94.5% |
| Renter-Occupied Housing Units | 7 | 5.5% |
| Total Occupied Housing Units | 127 | 100.0% |
Occupancy by Household Size in Rockford Bay
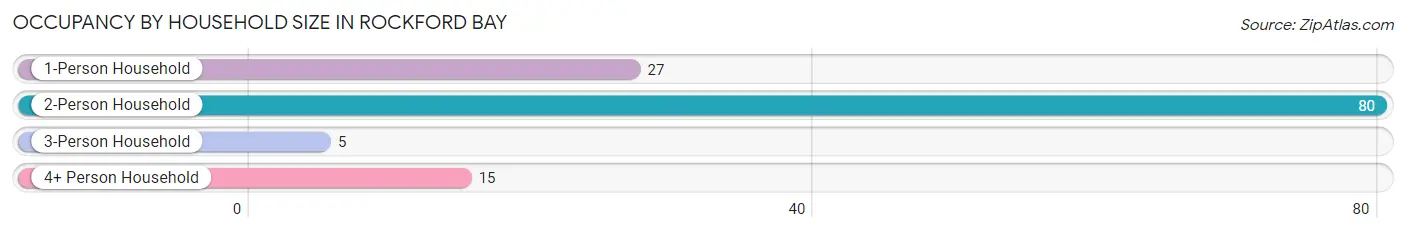
| Household Size | # Housing Units | % Housing Units |
| 1-Person Household | 27 | 21.3% |
| 2-Person Household | 80 | 63.0% |
| 3-Person Household | 5 | 3.9% |
| 4+ Person Household | 15 | 11.8% |
| Total Housing Units | 127 | 100.0% |
Occupancy by Ownership by Household Size in Rockford Bay
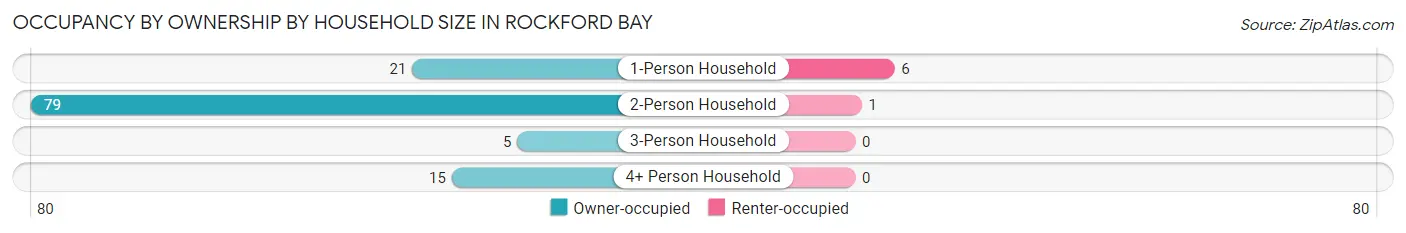
| Household Size | Owner-occupied | Renter-occupied |
| 1-Person Household | 21 (77.8%) | 6 (22.2%) |
| 2-Person Household | 79 (98.8%) | 1 (1.3%) |
| 3-Person Household | 5 (100.0%) | 0 (0.0%) |
| 4+ Person Household | 15 (100.0%) | 0 (0.0%) |
| Total Housing Units | 120 (94.5%) | 7 (5.5%) |
Occupancy by Educational Attainment in Rockford Bay
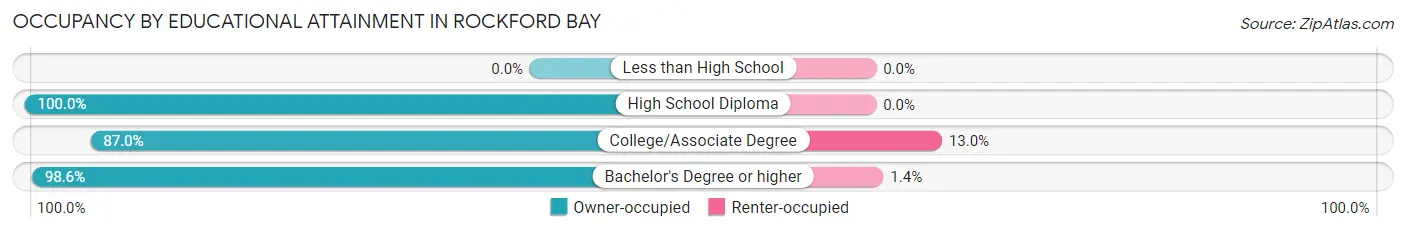
| Household Size | Owner-occupied | Renter-occupied |
| Less than High School | 0 (0.0%) | 0 (0.0%) |
| High School Diploma | 11 (100.0%) | 0 (0.0%) |
| College/Associate Degree | 40 (87.0%) | 6 (13.0%) |
| Bachelor's Degree or higher | 69 (98.6%) | 1 (1.4%) |
Occupancy by Age of Householder in Rockford Bay
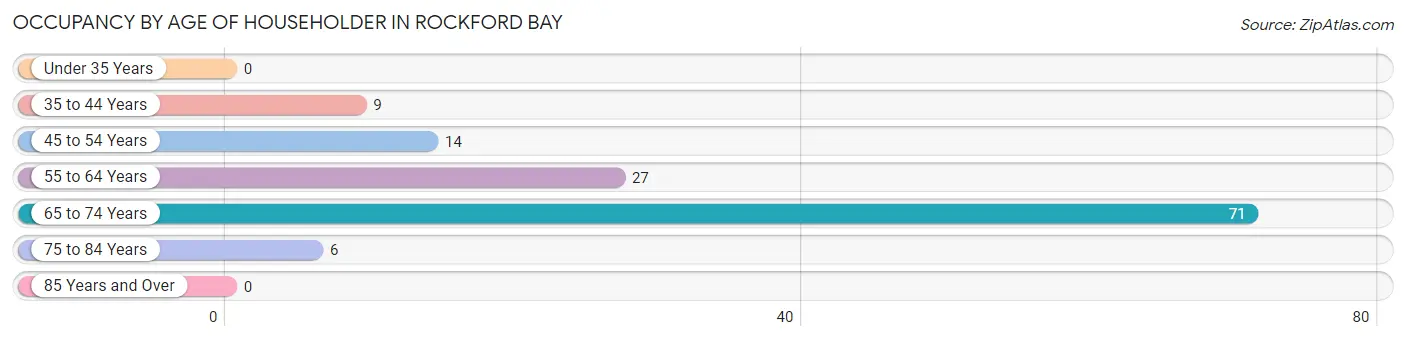
| Age Bracket | # Households | % Households |
| Under 35 Years | 0 | 0.0% |
| 35 to 44 Years | 9 | 7.1% |
| 45 to 54 Years | 14 | 11.0% |
| 55 to 64 Years | 27 | 21.3% |
| 65 to 74 Years | 71 | 55.9% |
| 75 to 84 Years | 6 | 4.7% |
| 85 Years and Over | 0 | 0.0% |
| Total | 127 | 100.0% |
Housing Finances in Rockford Bay
Median Income by Occupancy in Rockford Bay
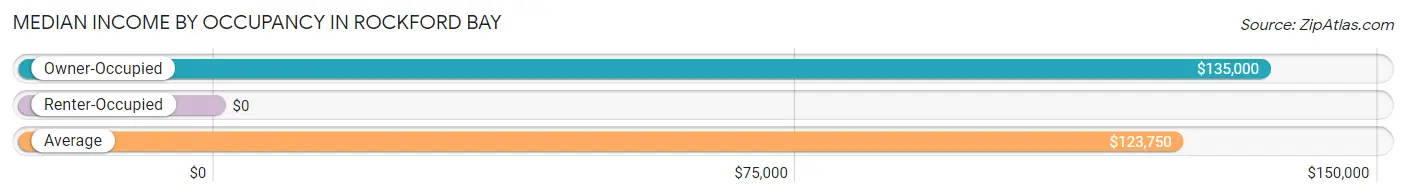
| Occupancy Type | # Households | Median Income |
| Owner-Occupied | 120 (94.5%) | $135,000 |
| Renter-Occupied | 7 (5.5%) | $0 |
| Average | 127 (100.0%) | $123,750 |
Occupancy by Householder Income Bracket in Rockford Bay
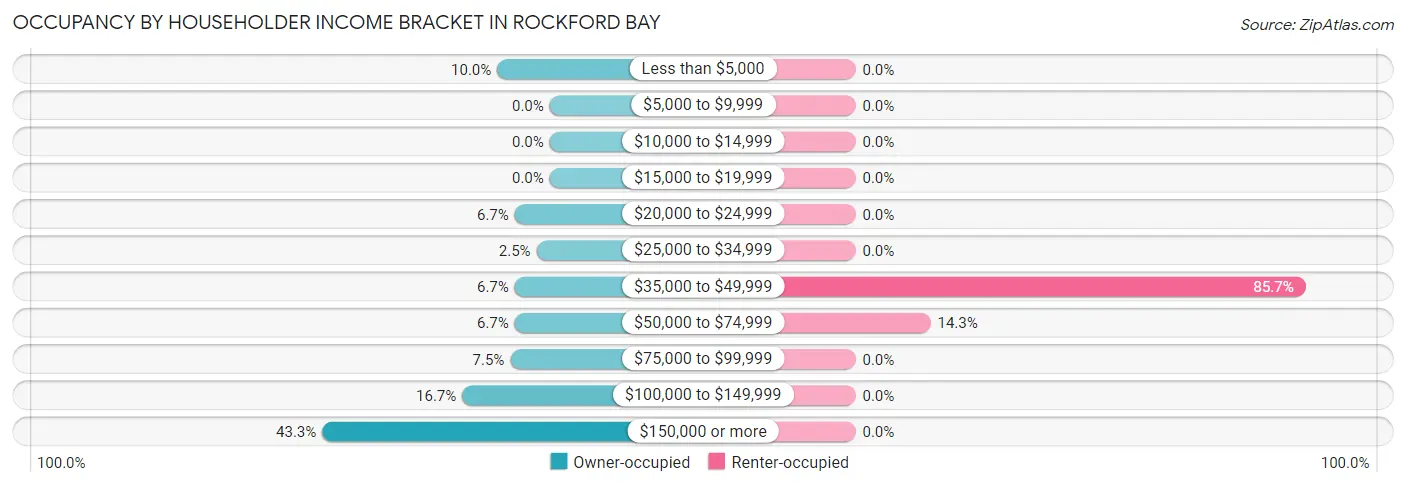
| Income Bracket | Owner-occupied | Renter-occupied |
| Less than $5,000 | 12 (10.0%) | 0 (0.0%) |
| $5,000 to $9,999 | 0 (0.0%) | 0 (0.0%) |
| $10,000 to $14,999 | 0 (0.0%) | 0 (0.0%) |
| $15,000 to $19,999 | 0 (0.0%) | 0 (0.0%) |
| $20,000 to $24,999 | 8 (6.7%) | 0 (0.0%) |
| $25,000 to $34,999 | 3 (2.5%) | 0 (0.0%) |
| $35,000 to $49,999 | 8 (6.7%) | 6 (85.7%) |
| $50,000 to $74,999 | 8 (6.7%) | 1 (14.3%) |
| $75,000 to $99,999 | 9 (7.5%) | 0 (0.0%) |
| $100,000 to $149,999 | 20 (16.7%) | 0 (0.0%) |
| $150,000 or more | 52 (43.3%) | 0 (0.0%) |
| Total | 120 (100.0%) | 7 (100.0%) |
Monthly Housing Cost Tiers in Rockford Bay
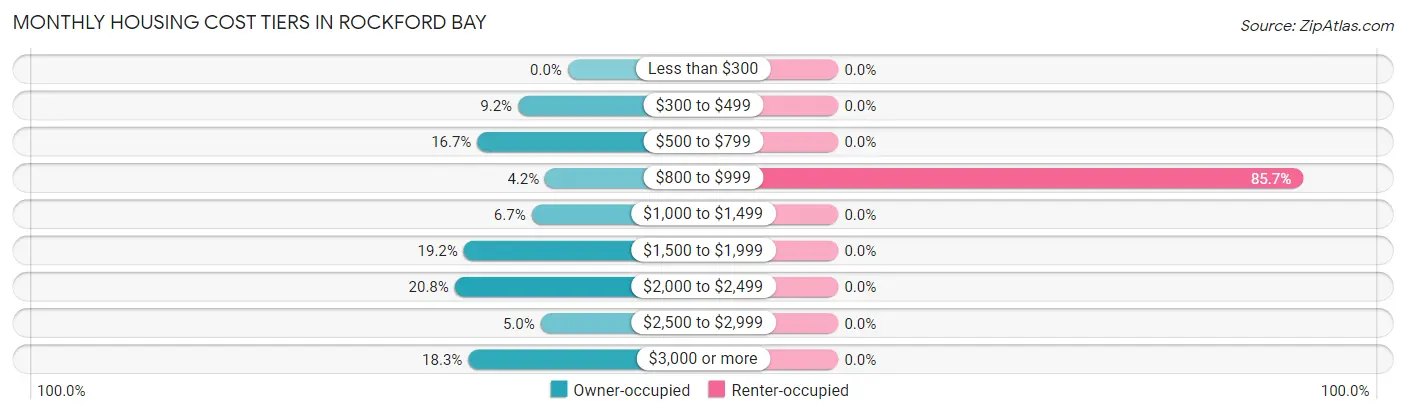
| Monthly Cost | Owner-occupied | Renter-occupied |
| Less than $300 | 0 (0.0%) | 0 (0.0%) |
| $300 to $499 | 11 (9.2%) | 0 (0.0%) |
| $500 to $799 | 20 (16.7%) | 0 (0.0%) |
| $800 to $999 | 5 (4.2%) | 6 (85.7%) |
| $1,000 to $1,499 | 8 (6.7%) | 0 (0.0%) |
| $1,500 to $1,999 | 23 (19.2%) | 0 (0.0%) |
| $2,000 to $2,499 | 25 (20.8%) | 0 (0.0%) |
| $2,500 to $2,999 | 6 (5.0%) | 0 (0.0%) |
| $3,000 or more | 22 (18.3%) | 0 (0.0%) |
| Total | 120 (100.0%) | 7 (100.0%) |
Physical Housing Characteristics in Rockford Bay
Housing Structures in Rockford Bay
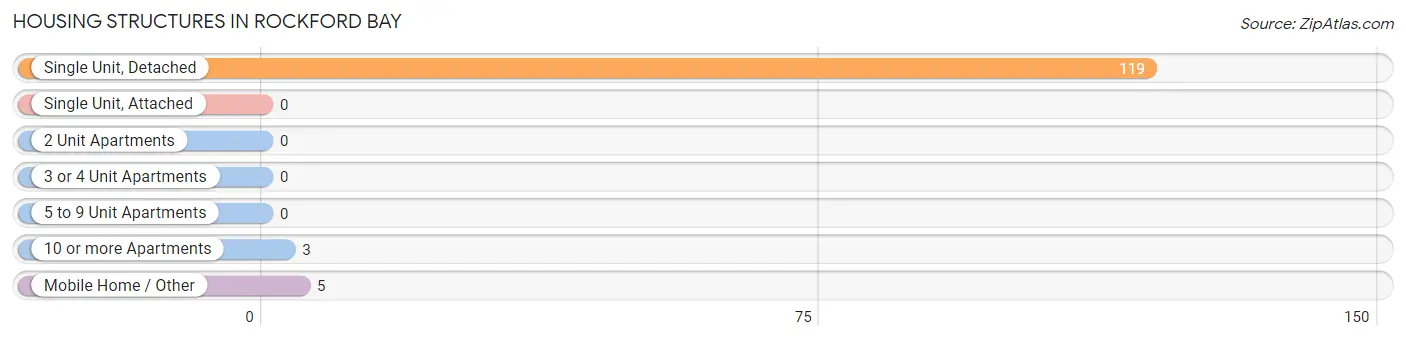
| Structure Type | # Housing Units | % Housing Units |
| Single Unit, Detached | 119 | 93.7% |
| Single Unit, Attached | 0 | 0.0% |
| 2 Unit Apartments | 0 | 0.0% |
| 3 or 4 Unit Apartments | 0 | 0.0% |
| 5 to 9 Unit Apartments | 0 | 0.0% |
| 10 or more Apartments | 3 | 2.4% |
| Mobile Home / Other | 5 | 3.9% |
| Total | 127 | 100.0% |
Housing Structures by Occupancy in Rockford Bay
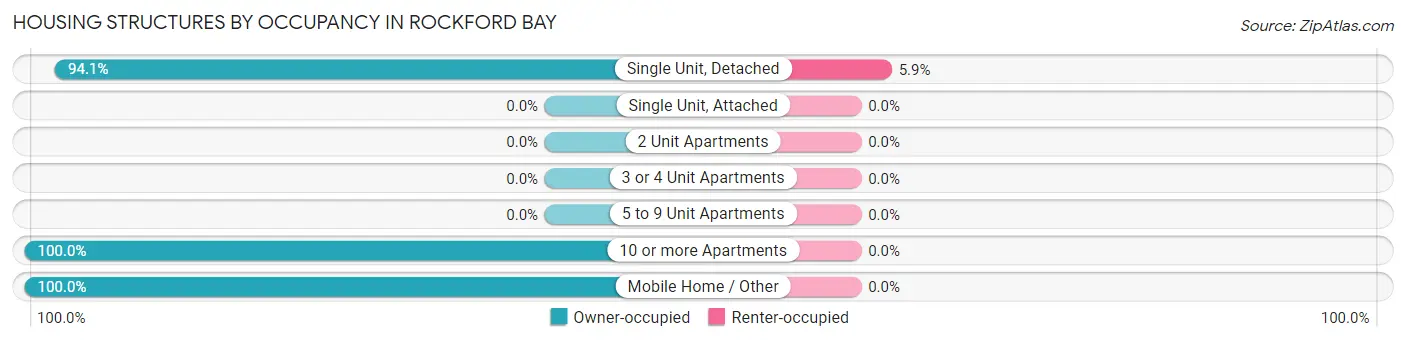
| Structure Type | Owner-occupied | Renter-occupied |
| Single Unit, Detached | 112 (94.1%) | 7 (5.9%) |
| Single Unit, Attached | 0 (0.0%) | 0 (0.0%) |
| 2 Unit Apartments | 0 (0.0%) | 0 (0.0%) |
| 3 or 4 Unit Apartments | 0 (0.0%) | 0 (0.0%) |
| 5 to 9 Unit Apartments | 0 (0.0%) | 0 (0.0%) |
| 10 or more Apartments | 3 (100.0%) | 0 (0.0%) |
| Mobile Home / Other | 5 (100.0%) | 0 (0.0%) |
| Total | 120 (94.5%) | 7 (5.5%) |
Housing Structures by Number of Rooms in Rockford Bay
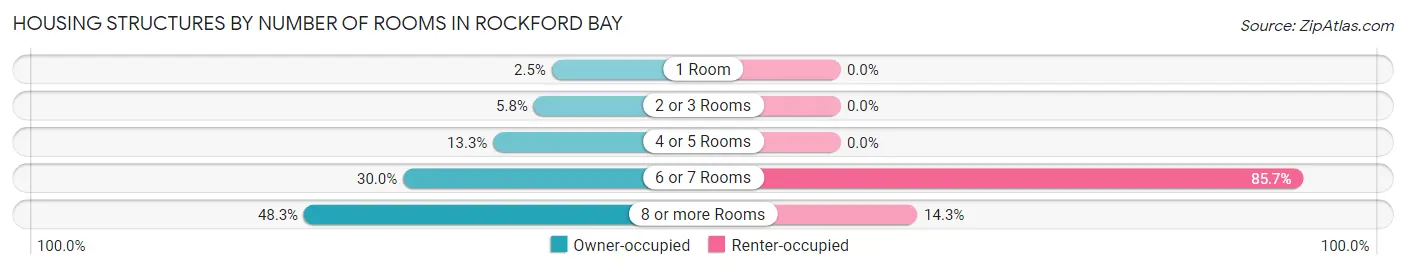
| Number of Rooms | Owner-occupied | Renter-occupied |
| 1 Room | 3 (2.5%) | 0 (0.0%) |
| 2 or 3 Rooms | 7 (5.8%) | 0 (0.0%) |
| 4 or 5 Rooms | 16 (13.3%) | 0 (0.0%) |
| 6 or 7 Rooms | 36 (30.0%) | 6 (85.7%) |
| 8 or more Rooms | 58 (48.3%) | 1 (14.3%) |
| Total | 120 (100.0%) | 7 (100.0%) |
Housing Structure by Heating Type in Rockford Bay
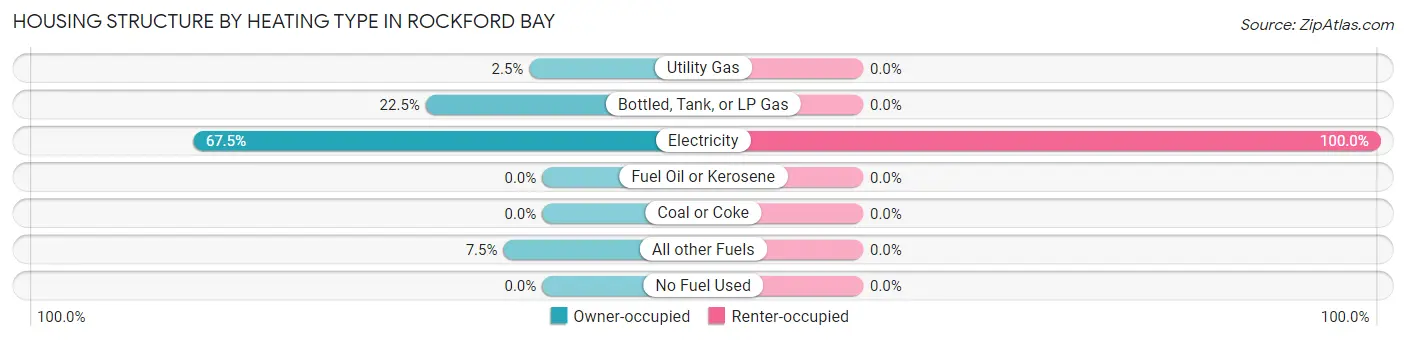
| Heating Type | Owner-occupied | Renter-occupied |
| Utility Gas | 3 (2.5%) | 0 (0.0%) |
| Bottled, Tank, or LP Gas | 27 (22.5%) | 0 (0.0%) |
| Electricity | 81 (67.5%) | 7 (100.0%) |
| Fuel Oil or Kerosene | 0 (0.0%) | 0 (0.0%) |
| Coal or Coke | 0 (0.0%) | 0 (0.0%) |
| All other Fuels | 9 (7.5%) | 0 (0.0%) |
| No Fuel Used | 0 (0.0%) | 0 (0.0%) |
| Total | 120 (100.0%) | 7 (100.0%) |
Household Vehicle Usage in Rockford Bay
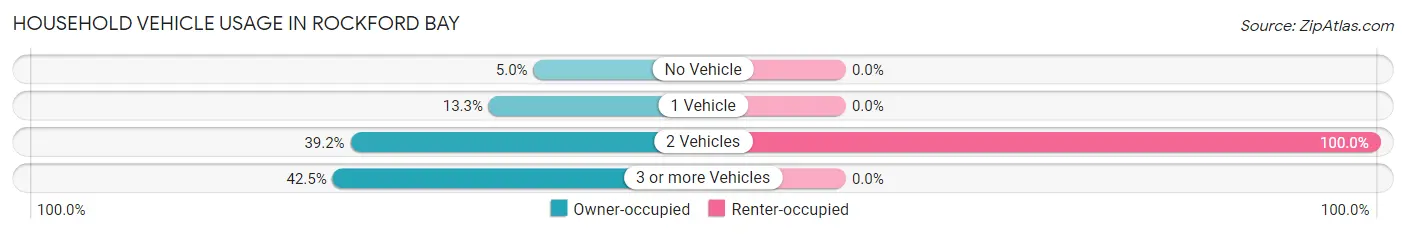
| Vehicles per Household | Owner-occupied | Renter-occupied |
| No Vehicle | 6 (5.0%) | 0 (0.0%) |
| 1 Vehicle | 16 (13.3%) | 0 (0.0%) |
| 2 Vehicles | 47 (39.2%) | 7 (100.0%) |
| 3 or more Vehicles | 51 (42.5%) | 0 (0.0%) |
| Total | 120 (100.0%) | 7 (100.0%) |
Real Estate & Mortgages in Rockford Bay
Real Estate and Mortgage Overview in Rockford Bay
| Characteristic | Without Mortgage | With Mortgage |
| Housing Units | 60 | 60 |
| Median Property Value | $1,000,000 | $800,000 |
| Median Household Income | $96,667 | $26 |
| Monthly Housing Costs | $1,050 | $22 |
| Real Estate Taxes | $5,395 | $0 |
Property Value by Mortgage Status in Rockford Bay
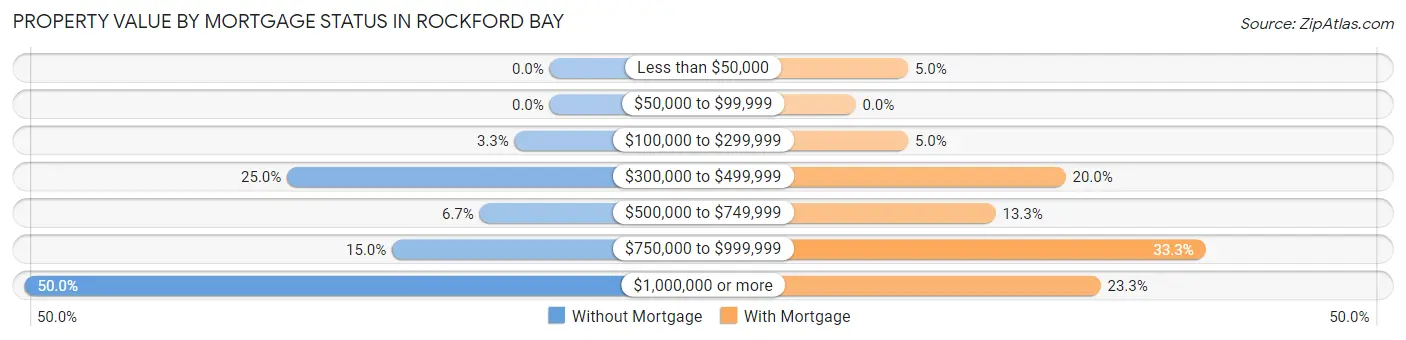
| Property Value | Without Mortgage | With Mortgage |
| Less than $50,000 | 0 (0.0%) | 3 (5.0%) |
| $50,000 to $99,999 | 0 (0.0%) | 0 (0.0%) |
| $100,000 to $299,999 | 2 (3.3%) | 3 (5.0%) |
| $300,000 to $499,999 | 15 (25.0%) | 12 (20.0%) |
| $500,000 to $749,999 | 4 (6.7%) | 8 (13.3%) |
| $750,000 to $999,999 | 9 (15.0%) | 20 (33.3%) |
| $1,000,000 or more | 30 (50.0%) | 14 (23.3%) |
| Total | 60 (100.0%) | 60 (100.0%) |
Household Income by Mortgage Status in Rockford Bay
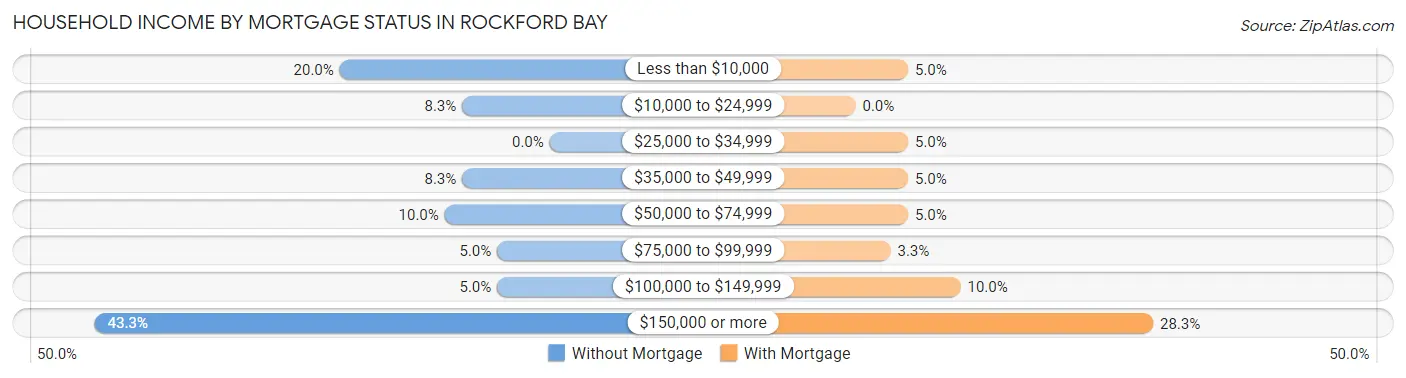
| Household Income | Without Mortgage | With Mortgage |
| Less than $10,000 | 12 (20.0%) | 3 (5.0%) |
| $10,000 to $24,999 | 5 (8.3%) | 0 (0.0%) |
| $25,000 to $34,999 | 0 (0.0%) | 3 (5.0%) |
| $35,000 to $49,999 | 5 (8.3%) | 3 (5.0%) |
| $50,000 to $74,999 | 6 (10.0%) | 3 (5.0%) |
| $75,000 to $99,999 | 3 (5.0%) | 2 (3.3%) |
| $100,000 to $149,999 | 3 (5.0%) | 6 (10.0%) |
| $150,000 or more | 26 (43.3%) | 17 (28.3%) |
| Total | 60 (100.0%) | 60 (100.0%) |
Property Value to Household Income Ratio in Rockford Bay
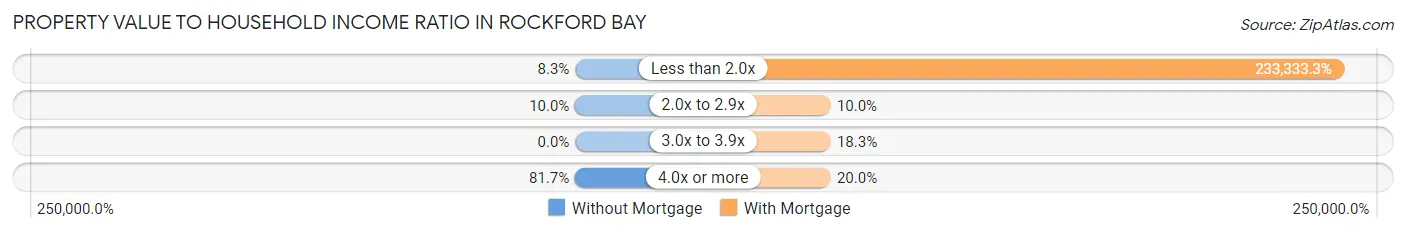
| Value-to-Income Ratio | Without Mortgage | With Mortgage |
| Less than 2.0x | 5 (8.3%) | 140,000 (233,333.3%) |
| 2.0x to 2.9x | 6 (10.0%) | 6 (10.0%) |
| 3.0x to 3.9x | 0 (0.0%) | 11 (18.3%) |
| 4.0x or more | 49 (81.7%) | 12 (20.0%) |
| Total | 60 (100.0%) | 60 (100.0%) |
Real Estate Taxes by Mortgage Status in Rockford Bay
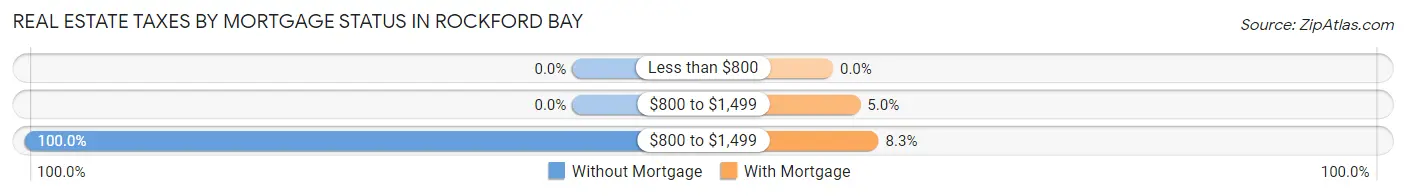
| Property Taxes | Without Mortgage | With Mortgage |
| Less than $800 | 0 (0.0%) | 0 (0.0%) |
| $800 to $1,499 | 0 (0.0%) | 3 (5.0%) |
| $800 to $1,499 | 60 (100.0%) | 5 (8.3%) |
| Total | 60 (100.0%) | 60 (100.0%) |
Health & Disability in Rockford Bay
Health Insurance Coverage by Age in Rockford Bay
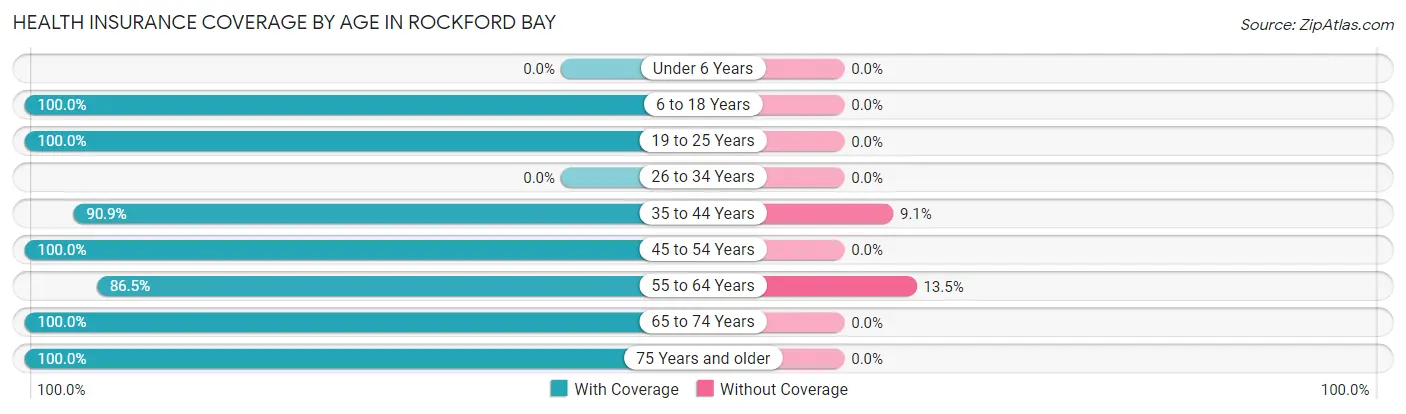
| Age Bracket | With Coverage | Without Coverage |
| Under 6 Years | 0 (0.0%) | 0 (0.0%) |
| 6 to 18 Years | 65 (100.0%) | 0 (0.0%) |
| 19 to 25 Years | 3 (100.0%) | 0 (0.0%) |
| 26 to 34 Years | 0 (0.0%) | 0 (0.0%) |
| 35 to 44 Years | 30 (90.9%) | 3 (9.1%) |
| 45 to 54 Years | 29 (100.0%) | 0 (0.0%) |
| 55 to 64 Years | 45 (86.5%) | 7 (13.5%) |
| 65 to 74 Years | 111 (100.0%) | 0 (0.0%) |
| 75 Years and older | 13 (100.0%) | 0 (0.0%) |
| Total | 296 (96.7%) | 10 (3.3%) |
Health Insurance Coverage by Citizenship Status in Rockford Bay
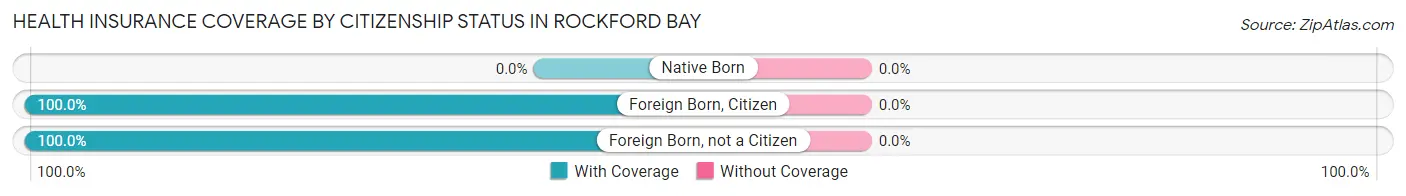
| Citizenship Status | With Coverage | Without Coverage |
| Native Born | 0 (0.0%) | 0 (0.0%) |
| Foreign Born, Citizen | 65 (100.0%) | 0 (0.0%) |
| Foreign Born, not a Citizen | 3 (100.0%) | 0 (0.0%) |
Health Insurance Coverage by Household Income in Rockford Bay
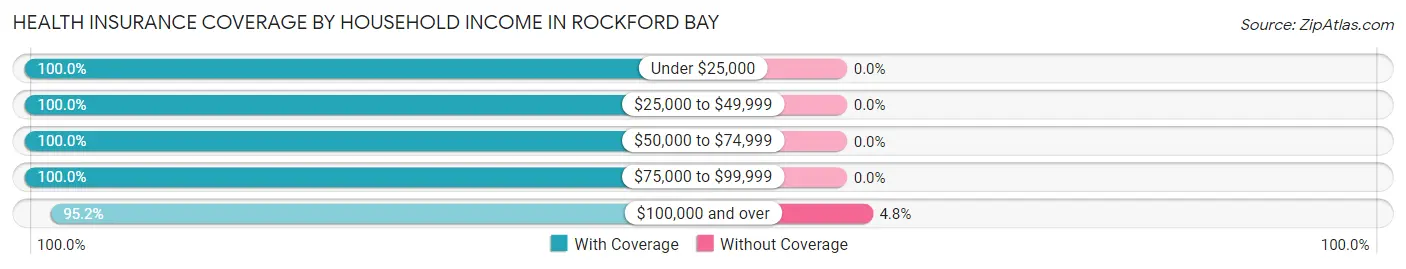
| Household Income | With Coverage | Without Coverage |
| Under $25,000 | 35 (100.0%) | 0 (0.0%) |
| $25,000 to $49,999 | 20 (100.0%) | 0 (0.0%) |
| $50,000 to $74,999 | 19 (100.0%) | 0 (0.0%) |
| $75,000 to $99,999 | 24 (100.0%) | 0 (0.0%) |
| $100,000 and over | 198 (95.2%) | 10 (4.8%) |
Public vs Private Health Insurance Coverage by Age in Rockford Bay
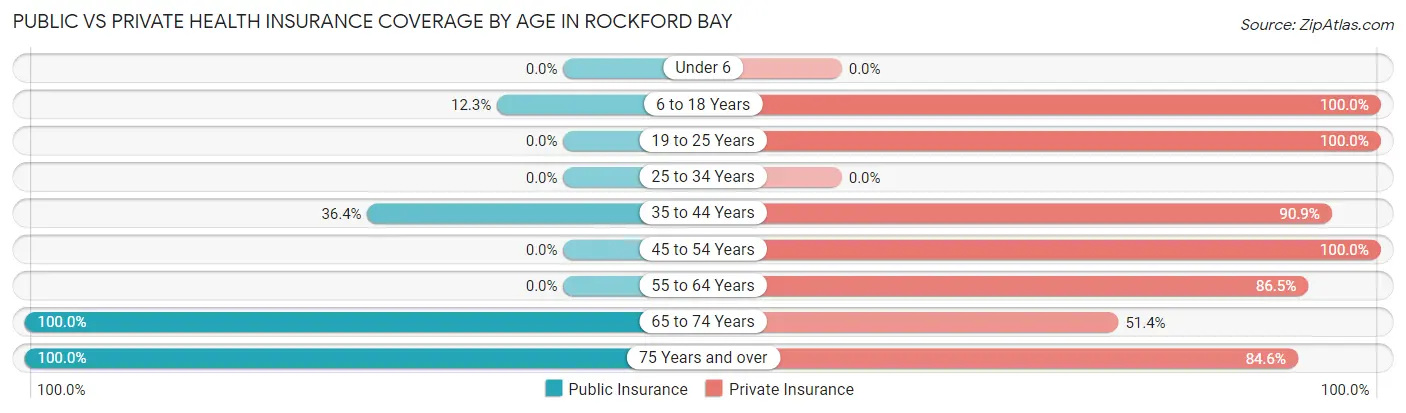
| Age Bracket | Public Insurance | Private Insurance |
| Under 6 | 0 (0.0%) | 0 (0.0%) |
| 6 to 18 Years | 8 (12.3%) | 65 (100.0%) |
| 19 to 25 Years | 0 (0.0%) | 3 (100.0%) |
| 25 to 34 Years | 0 (0.0%) | 0 (0.0%) |
| 35 to 44 Years | 12 (36.4%) | 30 (90.9%) |
| 45 to 54 Years | 0 (0.0%) | 29 (100.0%) |
| 55 to 64 Years | 0 (0.0%) | 45 (86.5%) |
| 65 to 74 Years | 111 (100.0%) | 57 (51.3%) |
| 75 Years and over | 13 (100.0%) | 11 (84.6%) |
| Total | 144 (47.1%) | 240 (78.4%) |
Disability Status by Sex by Age in Rockford Bay
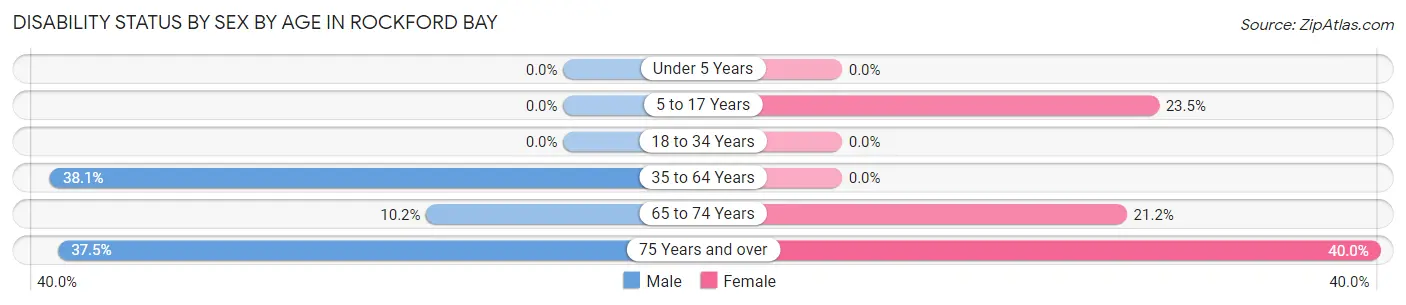
| Age Bracket | Male | Female |
| Under 5 Years | 0 (0.0%) | 0 (0.0%) |
| 5 to 17 Years | 0 (0.0%) | 8 (23.5%) |
| 18 to 34 Years | 0 (0.0%) | 0 (0.0%) |
| 35 to 64 Years | 24 (38.1%) | 0 (0.0%) |
| 65 to 74 Years | 6 (10.2%) | 11 (21.1%) |
| 75 Years and over | 3 (37.5%) | 2 (40.0%) |
Disability Class by Sex by Age in Rockford Bay
Disability Class: Hearing Difficulty
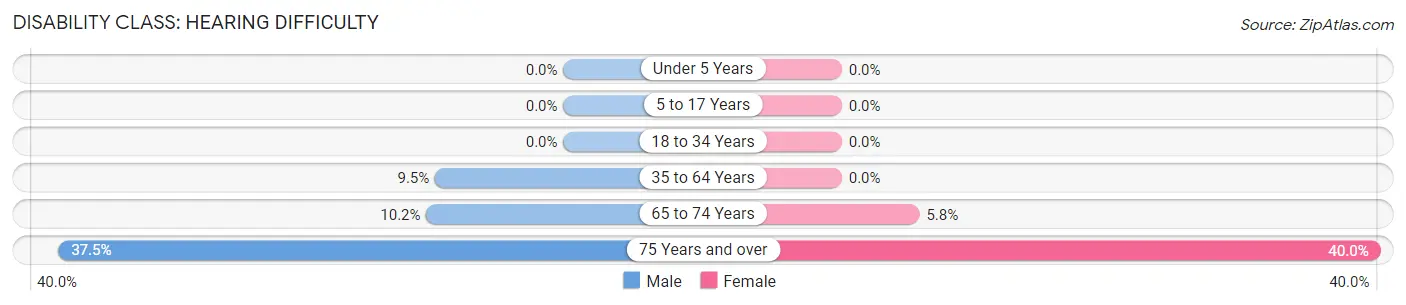
| Age Bracket | Male | Female |
| Under 5 Years | 0 (0.0%) | 0 (0.0%) |
| 5 to 17 Years | 0 (0.0%) | 0 (0.0%) |
| 18 to 34 Years | 0 (0.0%) | 0 (0.0%) |
| 35 to 64 Years | 6 (9.5%) | 0 (0.0%) |
| 65 to 74 Years | 6 (10.2%) | 3 (5.8%) |
| 75 Years and over | 3 (37.5%) | 2 (40.0%) |
Disability Class: Vision Difficulty
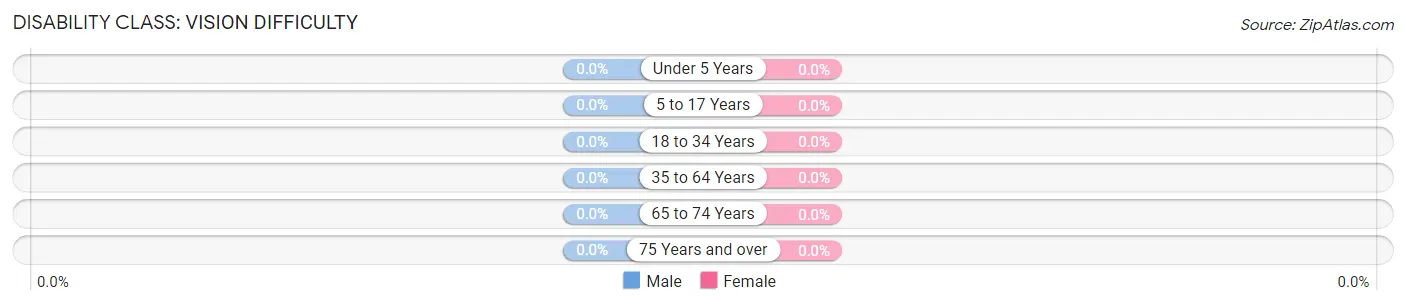
| Age Bracket | Male | Female |
| Under 5 Years | 0 (0.0%) | 0 (0.0%) |
| 5 to 17 Years | 0 (0.0%) | 0 (0.0%) |
| 18 to 34 Years | 0 (0.0%) | 0 (0.0%) |
| 35 to 64 Years | 0 (0.0%) | 0 (0.0%) |
| 65 to 74 Years | 0 (0.0%) | 0 (0.0%) |
| 75 Years and over | 0 (0.0%) | 0 (0.0%) |
Disability Class: Cognitive Difficulty
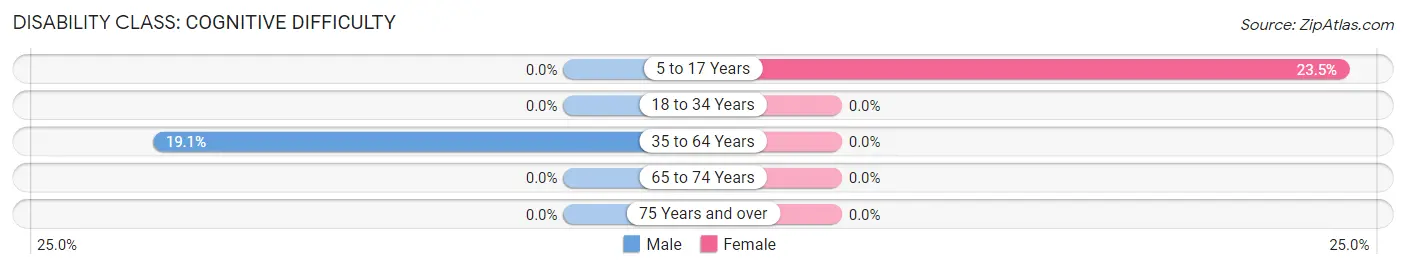
| Age Bracket | Male | Female |
| 5 to 17 Years | 0 (0.0%) | 8 (23.5%) |
| 18 to 34 Years | 0 (0.0%) | 0 (0.0%) |
| 35 to 64 Years | 12 (19.1%) | 0 (0.0%) |
| 65 to 74 Years | 0 (0.0%) | 0 (0.0%) |
| 75 Years and over | 0 (0.0%) | 0 (0.0%) |
Disability Class: Ambulatory Difficulty
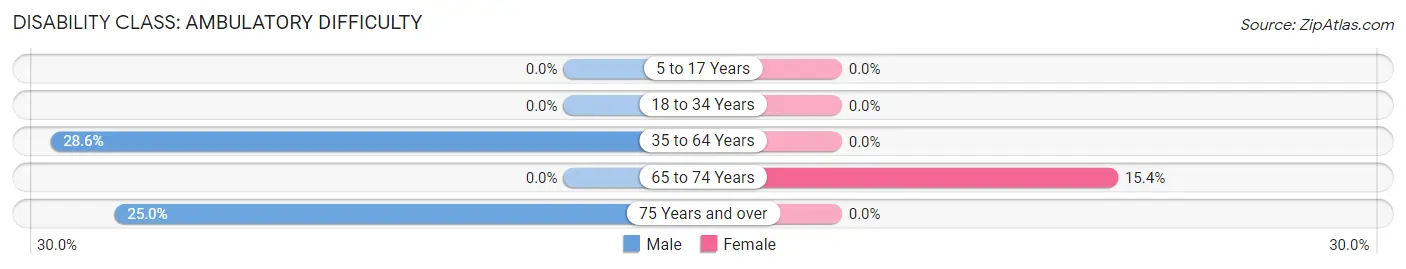
| Age Bracket | Male | Female |
| 5 to 17 Years | 0 (0.0%) | 0 (0.0%) |
| 18 to 34 Years | 0 (0.0%) | 0 (0.0%) |
| 35 to 64 Years | 18 (28.6%) | 0 (0.0%) |
| 65 to 74 Years | 0 (0.0%) | 8 (15.4%) |
| 75 Years and over | 2 (25.0%) | 0 (0.0%) |
Disability Class: Self-Care Difficulty
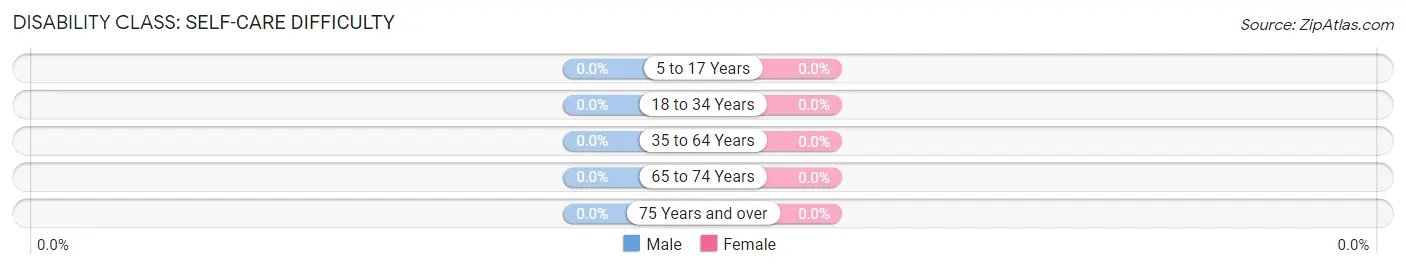
| Age Bracket | Male | Female |
| 5 to 17 Years | 0 (0.0%) | 0 (0.0%) |
| 18 to 34 Years | 0 (0.0%) | 0 (0.0%) |
| 35 to 64 Years | 0 (0.0%) | 0 (0.0%) |
| 65 to 74 Years | 0 (0.0%) | 0 (0.0%) |
| 75 Years and over | 0 (0.0%) | 0 (0.0%) |
Technology Access in Rockford Bay
Computing Device Access in Rockford Bay
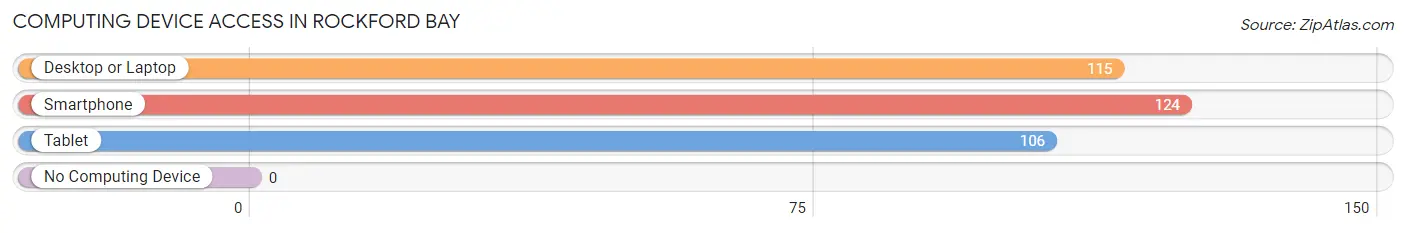
| Device Type | # Households | % Households |
| Desktop or Laptop | 115 | 90.5% |
| Smartphone | 124 | 97.6% |
| Tablet | 106 | 83.5% |
| No Computing Device | 0 | 0.0% |
| Total | 127 | 100.0% |
Internet Access in Rockford Bay
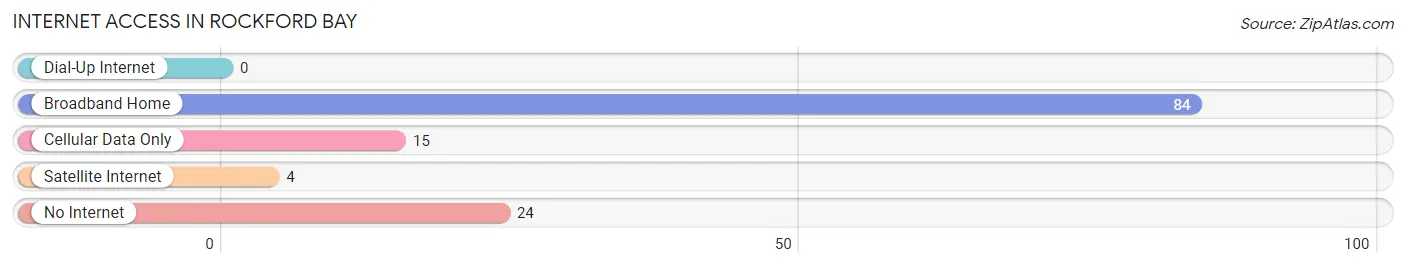
| Internet Type | # Households | % Households |
| Dial-Up Internet | 0 | 0.0% |
| Broadband Home | 84 | 66.1% |
| Cellular Data Only | 15 | 11.8% |
| Satellite Internet | 4 | 3.2% |
| No Internet | 24 | 18.9% |
| Total | 127 | 100.0% |
Rockford Bay Summary
Rockford Bay is a small unincorporated community located in Kootenai County, Idaho. It is situated on the north shore of Lake Coeur d'Alene, approximately 10 miles east of Coeur d'Alene. The area is known for its beautiful scenery, recreational activities, and its close proximity to the city of Coeur d'Alene.
History
Rockford Bay was first settled in the late 1800s by homesteaders who were attracted to the area by its natural beauty and abundant resources. The area was originally known as "Rockford Point" and was named after the nearby Rockford Creek. The first post office in the area was established in 1891 and the community was officially incorporated in 1909.
The area was primarily used for logging and farming until the 1950s when the area began to be developed for recreational use. The area was popular for its fishing, boating, and swimming. In the 1960s, the area began to be developed for residential use and the population began to grow.
Geography
Rockford Bay is located in Kootenai County, Idaho. It is situated on the north shore of Lake Coeur d'Alene, approximately 10 miles east of Coeur d'Alene. The area is known for its beautiful scenery, recreational activities, and its close proximity to the city of Coeur d'Alene.
The area is surrounded by mountains and forests, providing a picturesque backdrop for the community. The area is also home to several small lakes, including Rockford Lake, which is located just south of the community.
Economy
The economy of Rockford Bay is primarily driven by tourism and recreation. The area is known for its beautiful scenery and recreational activities, which attract visitors from all over the region. The area is also home to several small businesses, including restaurants, shops, and marinas.
The area is also home to several large employers, including the Coeur d'Alene Casino and Resort, which is located just south of the community. The casino and resort employ over 1,000 people and generate millions of dollars in revenue for the local economy.
Demographics
As of the 2010 census, the population of Rockford Bay was 1,845. The population is primarily white (94.3%) and the median age is 44. The median household income is $50,000 and the median home value is $250,000.
The area is also home to a large number of retirees, with over 25% of the population over the age of 65. The area is also home to a large number of seasonal residents, with over 20% of the population living in the area for less than six months out of the year.
Conclusion
Rockford Bay is a small unincorporated community located in Kootenai County, Idaho. It is situated on the north shore of Lake Coeur d'Alene, approximately 10 miles east of Coeur d'Alene. The area is known for its beautiful scenery, recreational activities, and its close proximity to the city of Coeur d'Alene. The economy of Rockford Bay is primarily driven by tourism and recreation, and the area is home to several large employers, including the Coeur d'Alene Casino and Resort. The population of Rockford Bay is primarily white and the median age is 44. The area is also home to a large number of retirees and seasonal residents.
Common Questions
What is the Total Population of Rockford Bay?
Total Population of Rockford Bay is 306.
What is the Total Male Population of Rockford Bay?
Total Male Population of Rockford Bay is 164.
What is the Total Female Population of Rockford Bay?
Total Female Population of Rockford Bay is 142.
What is the Ratio of Males per 100 Females in Rockford Bay?
There are 115.49 Males per 100 Females in Rockford Bay.
What is the Ratio of Females per 100 Males in Rockford Bay?
There are 86.59 Females per 100 Males in Rockford Bay.
What is the Median Population Age in Rockford Bay?
Median Population Age in Rockford Bay is 57.6 Years.
What is the Average Family Size in Rockford Bay
Average Family Size in Rockford Bay is 2.8 People.
What is the Average Household Size in Rockford Bay
Average Household Size in Rockford Bay is 2.4 People.
What is Per Capita Income in Rockford Bay?
Per Capita income in Rockford Bay is $83,691.
What is the Median Family Income in Rockford Bay?
Median Family Income in Rockford Bay is $127,500.
What is the Median Household income in Rockford Bay?
Median Household Income in Rockford Bay is $123,750.
What is Income or Wage Gap in Rockford Bay?
Income or Wage Gap in Rockford Bay is 48.1%.
Women in Rockford Bay earn 51.9 cents for every dollar earned by a man.
What is Inequality or Gini Index in Rockford Bay?
Inequality or Gini Index in Rockford Bay is 0.57.
How Large is the Labor Force in Rockford Bay?
There are 96 People in the Labor Forcein in Rockford Bay.
What is the Percentage of People in the Labor Force in Rockford Bay?
38.2% of People are in the Labor Force in Rockford Bay.
What is the Unemployment Rate in Rockford Bay?
Unemployment Rate in Rockford Bay is 11.5%.