Roberts, ID
Roberts Map
Roberts Overview
461
TOTAL POPULATION
212
MALE POPULATION
249
FEMALE POPULATION
85.14
MALES / 100 FEMALES
117.45
FEMALES / 100 MALES
32.8
MEDIAN AGE
3.0
AVG FAMILY SIZE
2.8
AVG HOUSEHOLD SIZE
$20,464
PER CAPITA INCOME
$63,000
AVG FAMILY INCOME
$45,156
AVG HOUSEHOLD INCOME
68.8%
WAGE / INCOME GAP [ % ]
31.2¢/ $1
WAGE / INCOME GAP [ $ ]
0.39
INEQUALITY / GINI INDEX
226
LABOR FORCE [ PEOPLE ]
66.1%
PERCENT IN LABOR FORCE
9.7%
UNEMPLOYMENT RATE
Roberts Zip Codes
Roberts Area Codes
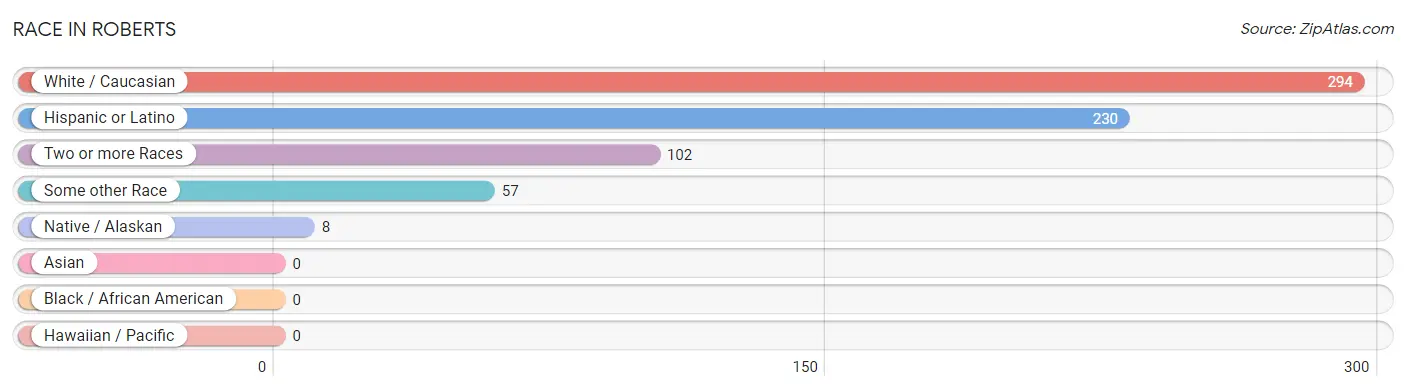
Race in Roberts
The most populous races in Roberts are White / Caucasian (294 | 63.8%), Hispanic or Latino (230 | 49.9%), and Two or more Races (102 | 22.1%).
| Race | # Population | % Population |
| Asian | 0 | 0.0% |
| Black / African American | 0 | 0.0% |
| Hawaiian / Pacific | 0 | 0.0% |
| Hispanic or Latino | 230 | 49.9% |
| Native / Alaskan | 8 | 1.7% |
| White / Caucasian | 294 | 63.8% |
| Two or more Races | 102 | 22.1% |
| Some other Race | 57 | 12.4% |
| Total | 461 | 100.0% |
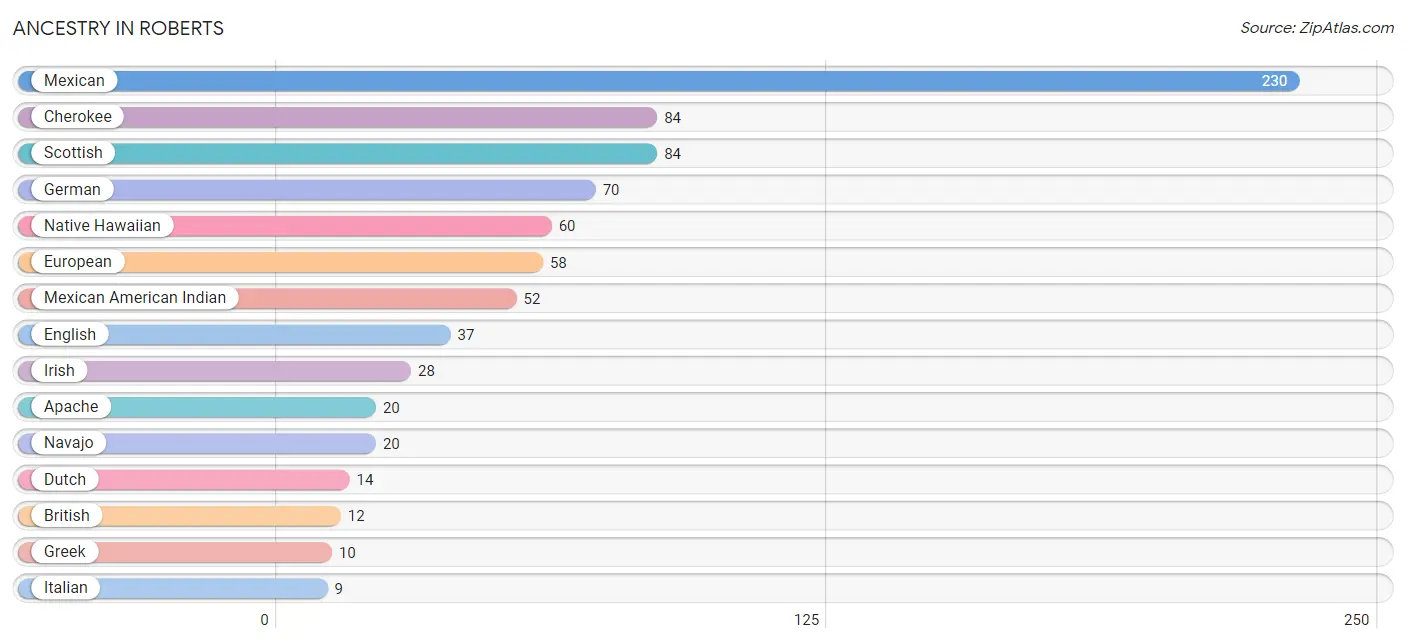
Ancestry in Roberts
The most populous ancestries reported in Roberts are Mexican (230 | 49.9%), Cherokee (84 | 18.2%), Scottish (84 | 18.2%), German (70 | 15.2%), and Native Hawaiian (60 | 13.0%), together accounting for 114.5% of all Roberts residents.
| Ancestry | # Population | % Population |
| Apache | 20 | 4.3% |
| British | 12 | 2.6% |
| Cherokee | 84 | 18.2% |
| Dutch | 14 | 3.0% |
| English | 37 | 8.0% |
| European | 58 | 12.6% |
| French American Indian | 2 | 0.4% |
| German | 70 | 15.2% |
| Greek | 10 | 2.2% |
| Irish | 28 | 6.1% |
| Italian | 9 | 1.9% |
| Mexican | 230 | 49.9% |
| Mexican American Indian | 52 | 11.3% |
| Native Hawaiian | 60 | 13.0% |
| Navajo | 20 | 4.3% |
| Norwegian | 2 | 0.4% |
| Polish | 3 | 0.6% |
| Scottish | 84 | 18.2% |
| Swedish | 5 | 1.1% |
| Swiss | 9 | 1.9% | View All 20 Rows |
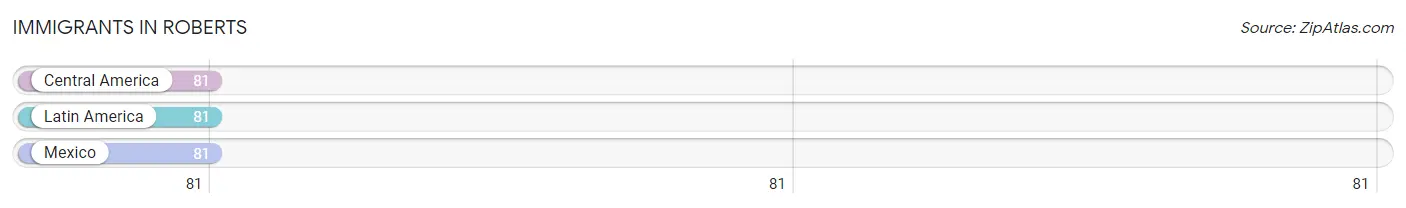
Immigrants in Roberts
The most numerous immigrant groups reported in Roberts came from Central America (81 | 17.6%), Latin America (81 | 17.6%), and Mexico (81 | 17.6%), together accounting for 52.7% of all Roberts residents.
| Immigration Origin | # Population | % Population |
| Central America | 81 | 17.6% |
| Latin America | 81 | 17.6% |
| Mexico | 81 | 17.6% | View All 3 Rows |
Sex and Age in Roberts
Sex and Age in Roberts
The most populous age groups in Roberts are 10 to 14 Years (45 | 21.2%) for men and 15 to 19 Years (46 | 18.5%) for women.
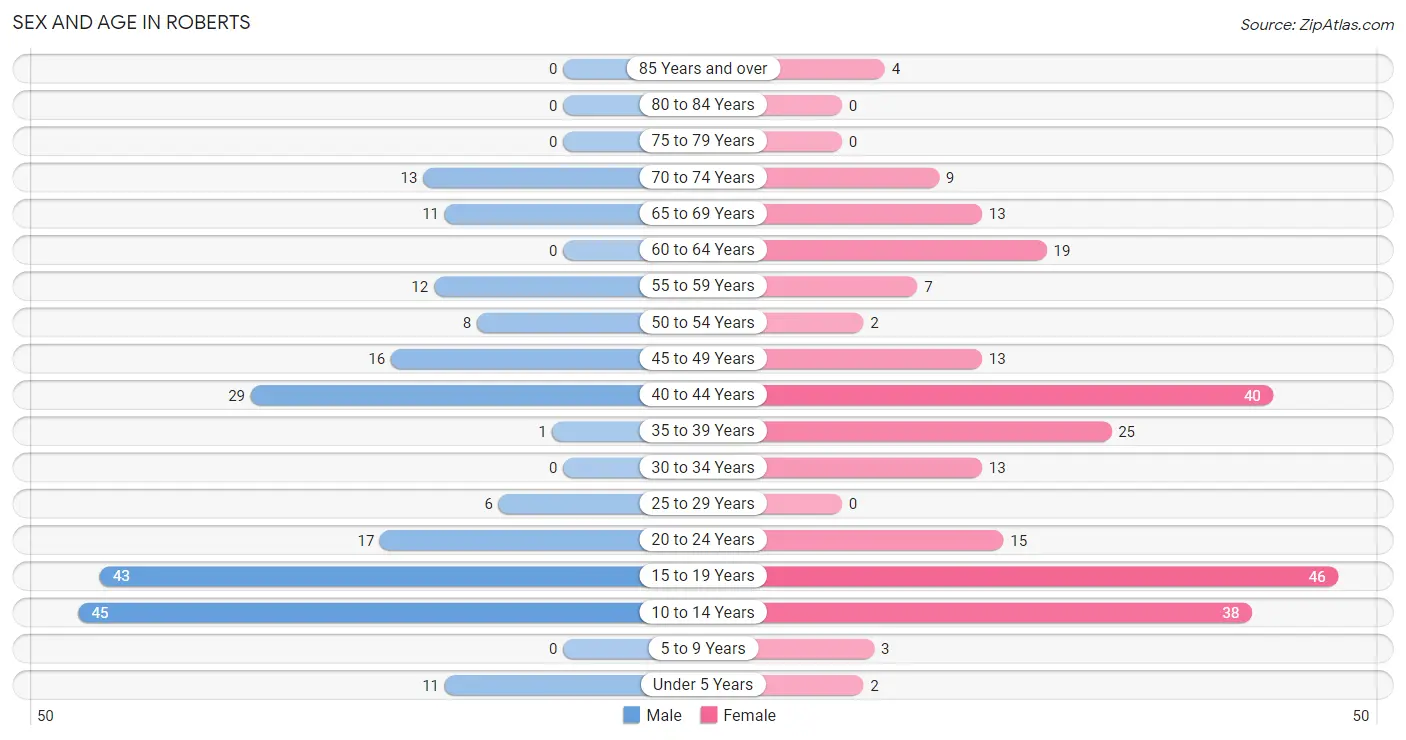
| Age Bracket | Male | Female |
| Under 5 Years | 11 (5.2%) | 2 (0.8%) |
| 5 to 9 Years | 0 (0.0%) | 3 (1.2%) |
| 10 to 14 Years | 45 (21.2%) | 38 (15.3%) |
| 15 to 19 Years | 43 (20.3%) | 46 (18.5%) |
| 20 to 24 Years | 17 (8.0%) | 15 (6.0%) |
| 25 to 29 Years | 6 (2.8%) | 0 (0.0%) |
| 30 to 34 Years | 0 (0.0%) | 13 (5.2%) |
| 35 to 39 Years | 1 (0.5%) | 25 (10.0%) |
| 40 to 44 Years | 29 (13.7%) | 40 (16.1%) |
| 45 to 49 Years | 16 (7.5%) | 13 (5.2%) |
| 50 to 54 Years | 8 (3.8%) | 2 (0.8%) |
| 55 to 59 Years | 12 (5.7%) | 7 (2.8%) |
| 60 to 64 Years | 0 (0.0%) | 19 (7.6%) |
| 65 to 69 Years | 11 (5.2%) | 13 (5.2%) |
| 70 to 74 Years | 13 (6.1%) | 9 (3.6%) |
| 75 to 79 Years | 0 (0.0%) | 0 (0.0%) |
| 80 to 84 Years | 0 (0.0%) | 0 (0.0%) |
| 85 Years and over | 0 (0.0%) | 4 (1.6%) |
| Total | 212 (100.0%) | 249 (100.0%) |
Families and Households in Roberts
Median Family Size in Roberts
The median family size in Roberts is 3.01 persons per family, with single female/mother families (67 | 45.9%) accounting for the largest median family size of 3.15 persons per family. On the other hand, married-couple families (71 | 48.6%) represent the smallest median family size with 2.89 persons per family.
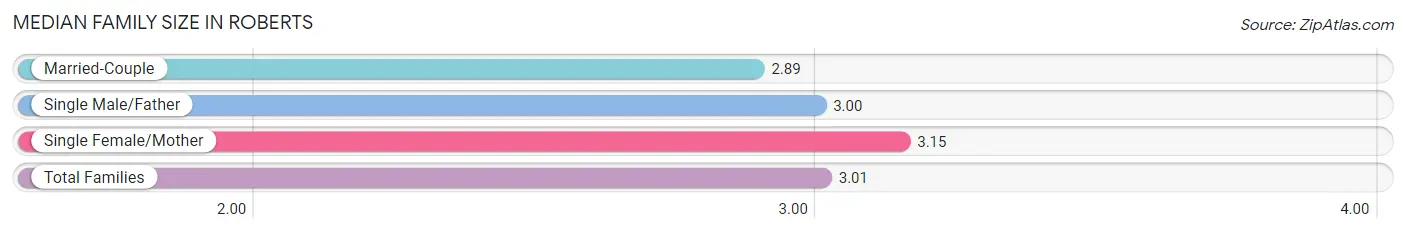
| Family Type | # Families | Family Size |
| Married-Couple | 71 (48.6%) | 2.89 |
| Single Male/Father | 8 (5.5%) | 3.00 |
| Single Female/Mother | 67 (45.9%) | 3.15 |
| Total Families | 146 (100.0%) | 3.01 |
Median Household Size in Roberts
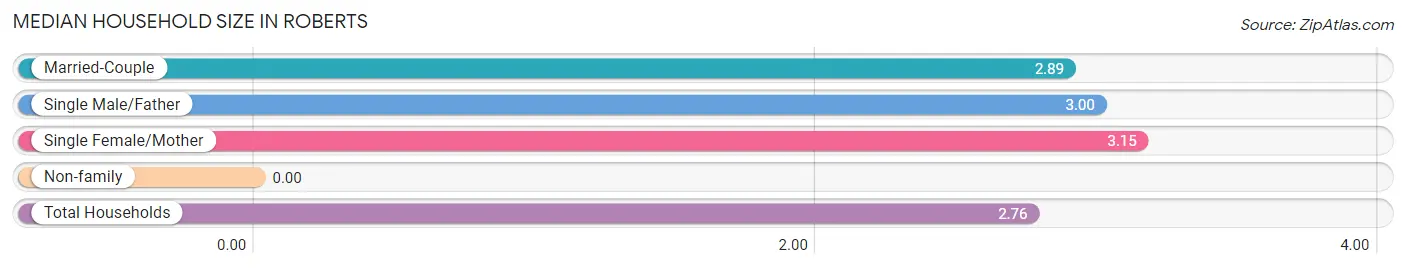
| Household Type | # Households | Household Size |
| Married-Couple | 71 (42.5%) | 2.89 |
| Single Male/Father | 8 (4.8%) | 3.00 |
| Single Female/Mother | 67 (40.1%) | 3.15 |
| Non-family | 21 (12.6%) | - |
| Total Households | 167 (100.0%) | 2.76 |
Household Size by Marriage Status in Roberts
Out of a total of 167 households in Roberts, 146 (87.4%) are family households, while 21 (12.6%) are nonfamily households. The most numerous type of family households are 2-person households, comprising 64, and the most common type of nonfamily households are 1-person households, comprising 21.
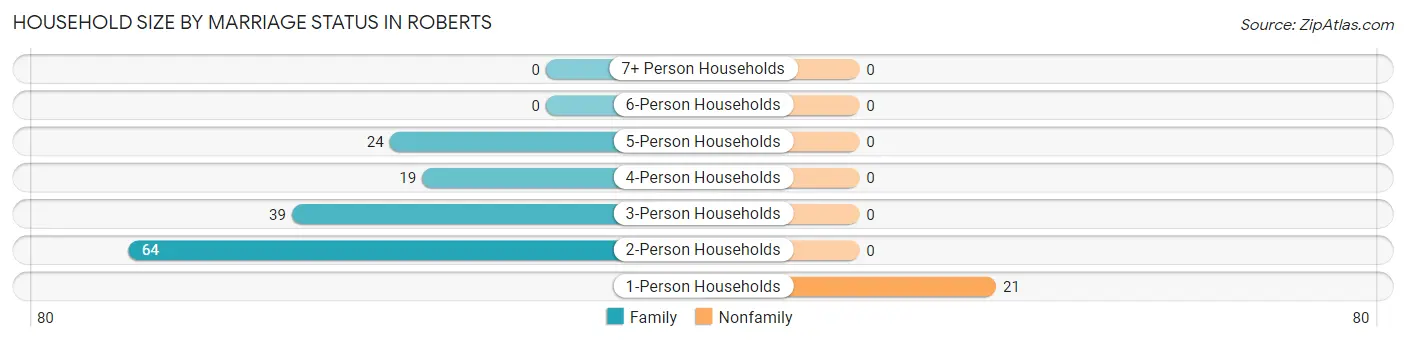
| Household Size | Family Households | Nonfamily Households |
| 1-Person Households | - | 21 (12.6%) |
| 2-Person Households | 64 (38.3%) | 0 (0.0%) |
| 3-Person Households | 39 (23.4%) | 0 (0.0%) |
| 4-Person Households | 19 (11.4%) | 0 (0.0%) |
| 5-Person Households | 24 (14.4%) | 0 (0.0%) |
| 6-Person Households | 0 (0.0%) | 0 (0.0%) |
| 7+ Person Households | 0 (0.0%) | 0 (0.0%) |
| Total | 146 (87.4%) | 21 (12.6%) |
Female Fertility in Roberts
Fertility by Age in Roberts
| Age Bracket | Women with Births | Births / 1,000 Women |
| 15 to 19 years | 0 (0.0%) | 0.0 |
| 20 to 34 years | 0 (0.0%) | 0.0 |
| 35 to 50 years | 0 (0.0%) | 0.0 |
| Total | 0 (0.0%) | 0.0 |
Fertility by Age by Marriage Status in Roberts
| Age Bracket | Married | Unmarried |
| 15 to 19 years | 0 (0.0%) | 0 (0.0%) |
| 20 to 34 years | 0 (0.0%) | 0 (0.0%) |
| 35 to 50 years | 0 (0.0%) | 0 (0.0%) |
| Total | 0 (0.0%) | 0 (0.0%) |
Fertility by Education in Roberts
| Educational Attainment | Women with Births | Births / 1,000 Women |
| Less than High School | 0 (0.0%) | 0.0 |
| High School Diploma | 0 (0.0%) | 0.0 |
| College or Associate's Degree | 0 (0.0%) | 0.0 |
| Bachelor's Degree | 0 (0.0%) | 0.0 |
| Graduate Degree | 0 (0.0%) | 0.0 |
| Total | 0 (0.0%) | 0.0 |
Fertility by Education by Marriage Status in Roberts
| Educational Attainment | Married | Unmarried |
| Less than High School | 0 (0.0%) | 0 (0.0%) |
| High School Diploma | 0 (0.0%) | 0 (0.0%) |
| College or Associate's Degree | 0 (0.0%) | 0 (0.0%) |
| Bachelor's Degree | 0 (0.0%) | 0 (0.0%) |
| Graduate Degree | 0 (0.0%) | 0 (0.0%) |
| Total | 0 (0.0%) | 0 (0.0%) |
Income in Roberts
Income Overview in Roberts
Per Capita Income in Roberts is $20,464, while median incomes of families and households are $63,000 and $45,156 respectively.
| Characteristic | Number | Measure |
| Per Capita Income | 461 | $20,464 |
| Median Family Income | 146 | $63,000 |
| Mean Family Income | 146 | $59,476 |
| Median Household Income | 167 | $45,156 |
| Mean Household Income | 167 | $54,557 |
| Income Deficit | 146 | $0 |
| Wage / Income Gap (%) | 461 | 68.83% |
| Wage / Income Gap ($) | 461 | 31.17¢ per $1 |
| Gini / Inequality Index | 461 | 0.39 |
Earnings by Sex in Roberts
Average Earnings in Roberts are $27,014, $39,485 for men and $12,308 for women, a difference of 68.8%.
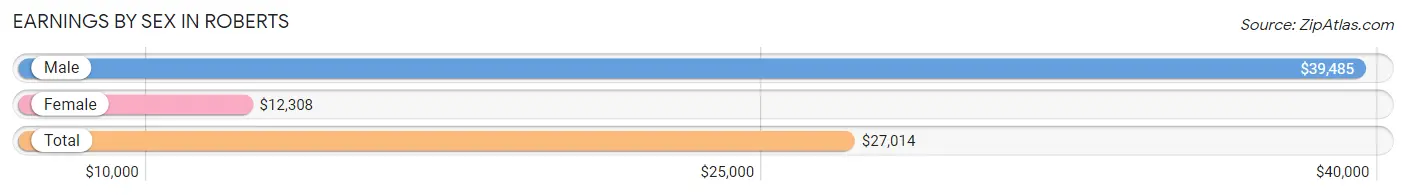
| Sex | Number | Average Earnings |
| Male | 115 (47.3%) | $39,485 |
| Female | 128 (52.7%) | $12,308 |
| Total | 243 (100.0%) | $27,014 |
Earnings by Sex by Income Bracket in Roberts
The most common earnings brackets in Roberts are $75,000 to $99,999 for men (21 | 18.3%) and $5,000 to $7,499 for women (24 | 18.8%).
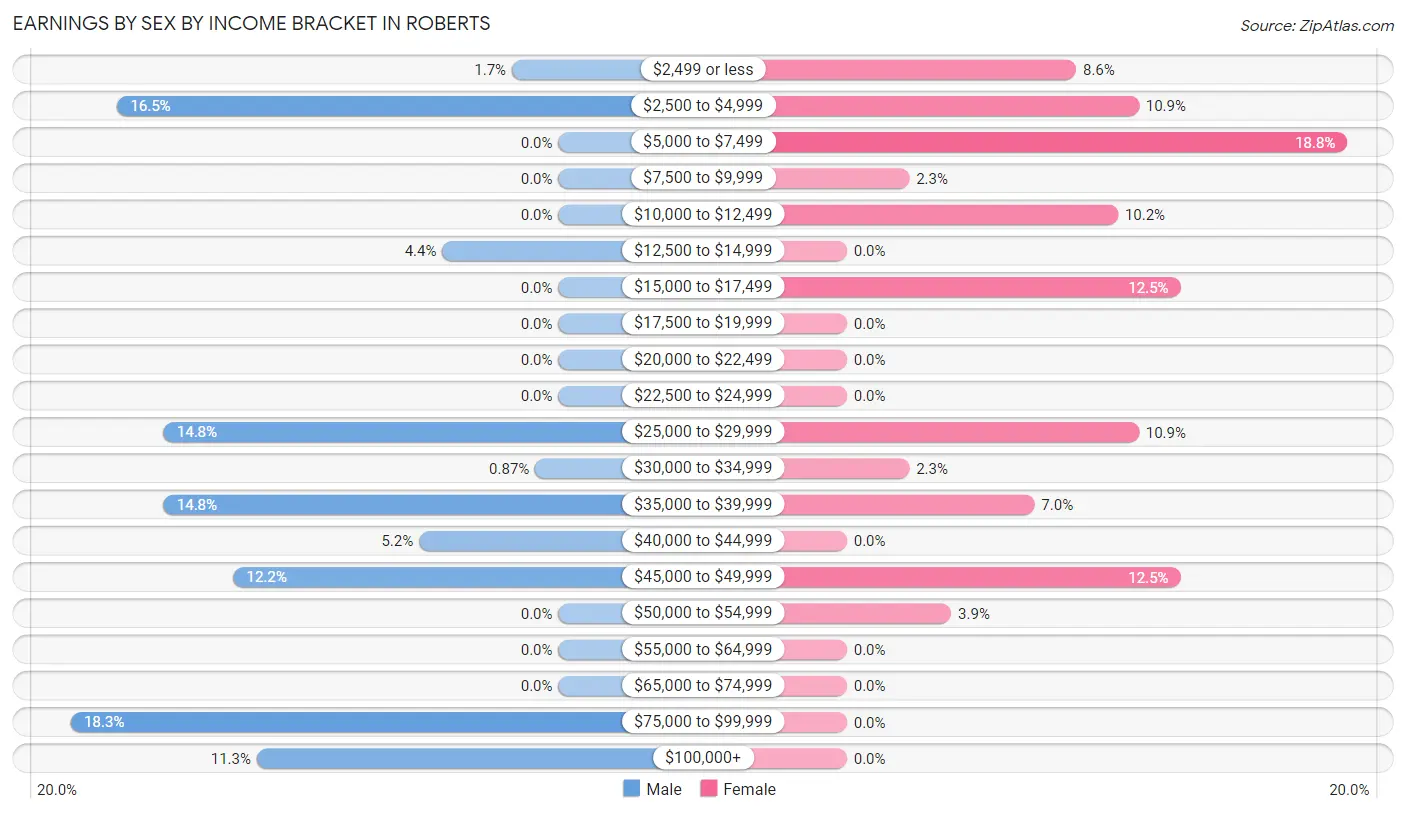
| Income | Male | Female |
| $2,499 or less | 2 (1.7%) | 11 (8.6%) |
| $2,500 to $4,999 | 19 (16.5%) | 14 (10.9%) |
| $5,000 to $7,499 | 0 (0.0%) | 24 (18.8%) |
| $7,500 to $9,999 | 0 (0.0%) | 3 (2.3%) |
| $10,000 to $12,499 | 0 (0.0%) | 13 (10.2%) |
| $12,500 to $14,999 | 5 (4.3%) | 0 (0.0%) |
| $15,000 to $17,499 | 0 (0.0%) | 16 (12.5%) |
| $17,500 to $19,999 | 0 (0.0%) | 0 (0.0%) |
| $20,000 to $22,499 | 0 (0.0%) | 0 (0.0%) |
| $22,500 to $24,999 | 0 (0.0%) | 0 (0.0%) |
| $25,000 to $29,999 | 17 (14.8%) | 14 (10.9%) |
| $30,000 to $34,999 | 1 (0.9%) | 3 (2.3%) |
| $35,000 to $39,999 | 17 (14.8%) | 9 (7.0%) |
| $40,000 to $44,999 | 6 (5.2%) | 0 (0.0%) |
| $45,000 to $49,999 | 14 (12.2%) | 16 (12.5%) |
| $50,000 to $54,999 | 0 (0.0%) | 5 (3.9%) |
| $55,000 to $64,999 | 0 (0.0%) | 0 (0.0%) |
| $65,000 to $74,999 | 0 (0.0%) | 0 (0.0%) |
| $75,000 to $99,999 | 21 (18.3%) | 0 (0.0%) |
| $100,000+ | 13 (11.3%) | 0 (0.0%) |
| Total | 115 (100.0%) | 128 (100.0%) |
Earnings by Sex by Educational Attainment in Roberts
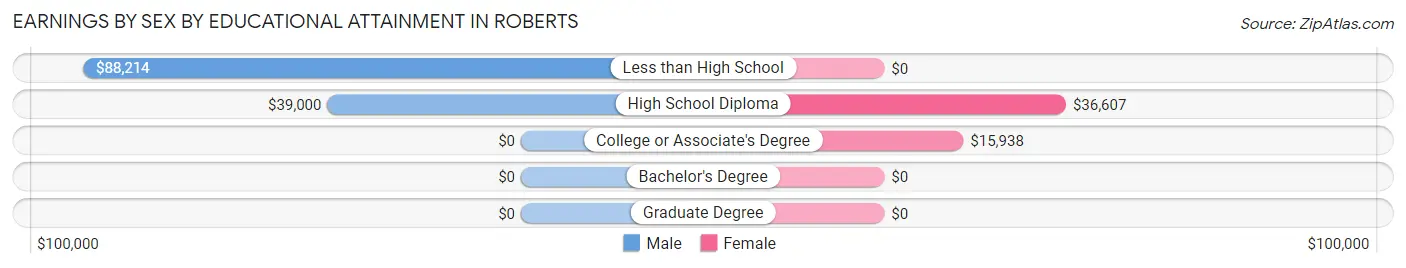
| Educational Attainment | Male Income | Female Income |
| Less than High School | $88,214 | $0 |
| High School Diploma | $39,000 | $36,607 |
| College or Associate's Degree | - | - |
| Bachelor's Degree | - | - |
| Graduate Degree | - | - |
| Total | $47,813 | $0 |
Family Income in Roberts
Family Income Brackets in Roberts
According to the Roberts family income data, there are 29 families falling into the $100,000 to $149,999 income range, which is the most common income bracket and makes up 19.9% of all families.
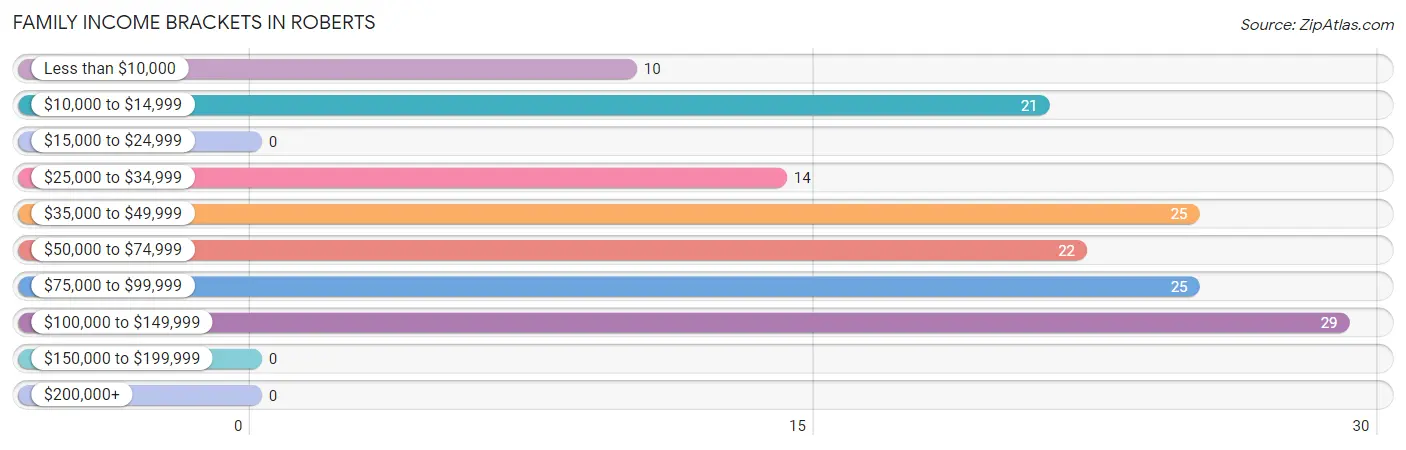
| Income Bracket | # Families | % Families |
| Less than $10,000 | 10 | 6.8% |
| $10,000 to $14,999 | 21 | 14.4% |
| $15,000 to $24,999 | 0 | 0.0% |
| $25,000 to $34,999 | 14 | 9.6% |
| $35,000 to $49,999 | 25 | 17.1% |
| $50,000 to $74,999 | 22 | 15.1% |
| $75,000 to $99,999 | 25 | 17.1% |
| $100,000 to $149,999 | 29 | 19.9% |
| $150,000 to $199,999 | 0 | 0.0% |
| $200,000+ | 0 | 0.0% |
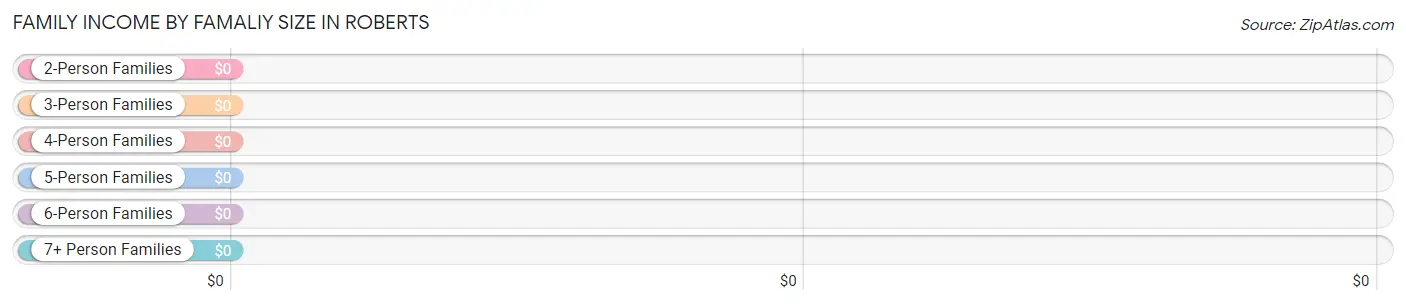
Family Income by Famaliy Size in Roberts
| Income Bracket | # Families | Median Income |
| 2-Person Families | 64 (43.8%) | $0 |
| 3-Person Families | 39 (26.7%) | $0 |
| 4-Person Families | 19 (13.0%) | $0 |
| 5-Person Families | 24 (16.4%) | $0 |
| 6-Person Families | 0 (0.0%) | $0 |
| 7+ Person Families | 0 (0.0%) | $0 |
| Total | 146 (100.0%) | $63,000 |
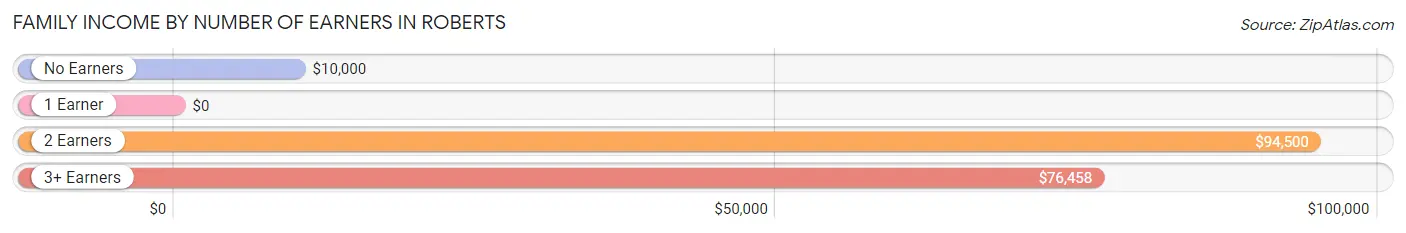
Family Income by Number of Earners in Roberts
| Number of Earners | # Families | Median Income |
| No Earners | 16 (11.0%) | $10,000 |
| 1 Earner | 53 (36.3%) | $0 |
| 2 Earners | 40 (27.4%) | $94,500 |
| 3+ Earners | 37 (25.3%) | $76,458 |
| Total | 146 (100.0%) | $63,000 |
Household Income in Roberts
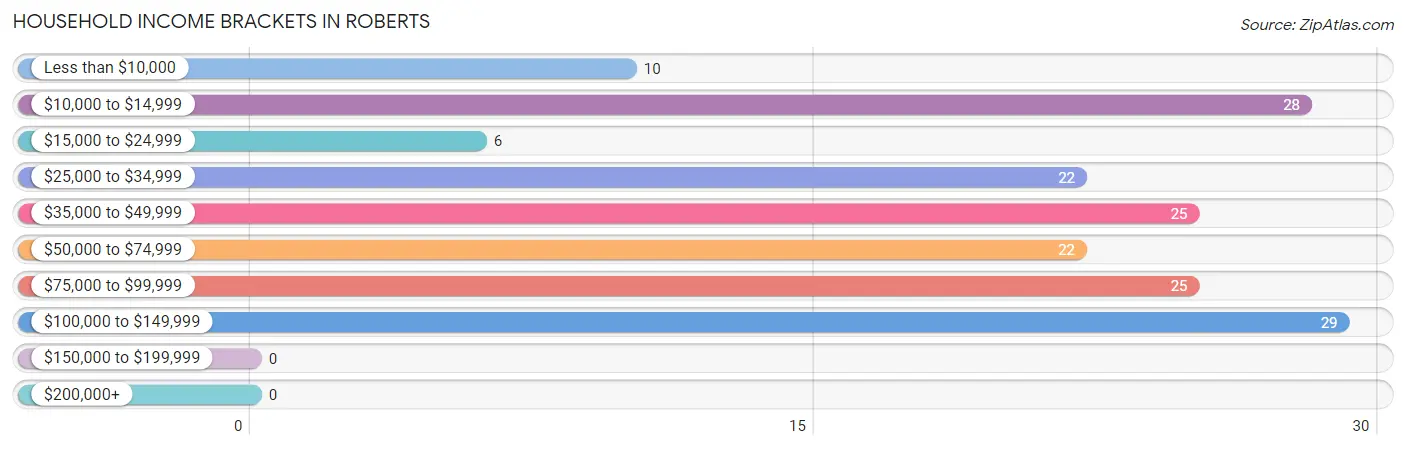
Household Income Brackets in Roberts
With 29 households falling in the category, the $100,000 to $149,999 income range is the most frequent in Roberts, accounting for 17.4% of all households.
| Income Bracket | # Households | % Households |
| Less than $10,000 | 10 | 6.0% |
| $10,000 to $14,999 | 28 | 16.8% |
| $15,000 to $24,999 | 6 | 3.6% |
| $25,000 to $34,999 | 22 | 13.2% |
| $35,000 to $49,999 | 25 | 15.0% |
| $50,000 to $74,999 | 22 | 13.2% |
| $75,000 to $99,999 | 25 | 15.0% |
| $100,000 to $149,999 | 29 | 17.4% |
| $150,000 to $199,999 | 0 | 0.0% |
| $200,000+ | 0 | 0.0% |
Household Income by Householder Age in Roberts
The median household income in Roberts is $45,156, with the highest median household income of $55,000 found in the 45 to 64 years age bracket for the primary householder. A total of 46 households (27.5%) fall into this category. Meanwhile, the 15 to 24 years age bracket for the primary householder has the lowest median household income of $0, with 10 households (6.0%) in this group.
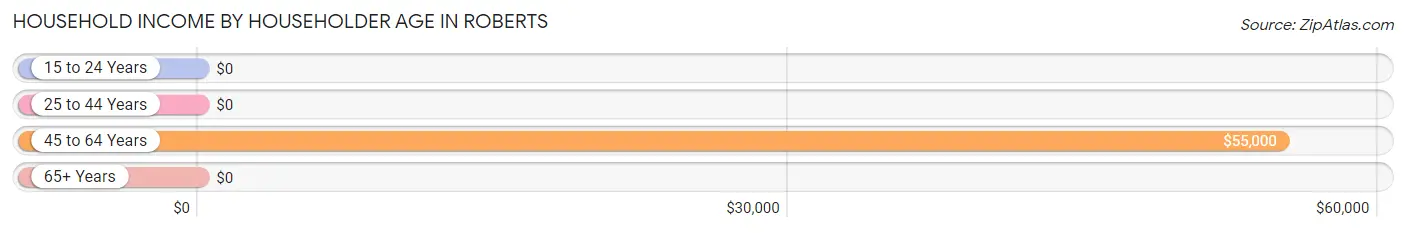
| Income Bracket | # Households | Median Income |
| 15 to 24 Years | 10 (6.0%) | $0 |
| 25 to 44 Years | 72 (43.1%) | $0 |
| 45 to 64 Years | 46 (27.5%) | $55,000 |
| 65+ Years | 39 (23.4%) | $0 |
| Total | 167 (100.0%) | $45,156 |
Poverty in Roberts
Income Below Poverty by Sex and Age in Roberts
With 10.4% poverty level for males and 27.3% for females among the residents of Roberts, 16 and 17 year old males and under 5 year old females are the most vulnerable to poverty, with 11 males (31.4%) and 2 females (100.0%) in their respective age groups living below the poverty level.
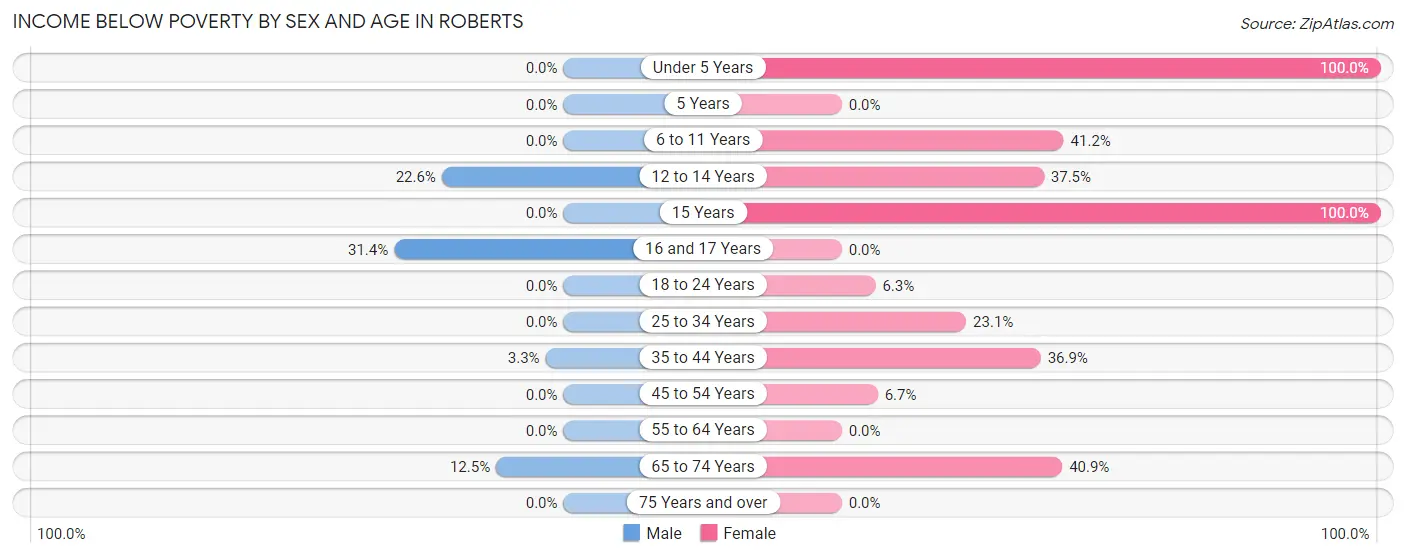
| Age Bracket | Male | Female |
| Under 5 Years | 0 (0.0%) | 2 (100.0%) |
| 5 Years | 0 (0.0%) | 0 (0.0%) |
| 6 to 11 Years | 0 (0.0%) | 7 (41.2%) |
| 12 to 14 Years | 7 (22.6%) | 9 (37.5%) |
| 15 Years | 0 (0.0%) | 12 (100.0%) |
| 16 and 17 Years | 11 (31.4%) | 0 (0.0%) |
| 18 to 24 Years | 0 (0.0%) | 1 (6.2%) |
| 25 to 34 Years | 0 (0.0%) | 3 (23.1%) |
| 35 to 44 Years | 1 (3.3%) | 24 (36.9%) |
| 45 to 54 Years | 0 (0.0%) | 1 (6.7%) |
| 55 to 64 Years | 0 (0.0%) | 0 (0.0%) |
| 65 to 74 Years | 3 (12.5%) | 9 (40.9%) |
| 75 Years and over | 0 (0.0%) | 0 (0.0%) |
| Total | 22 (10.4%) | 68 (27.3%) |
Income Above Poverty by Sex and Age in Roberts
According to the poverty statistics in Roberts, males aged under 5 years and females aged 16 and 17 years are the age groups that are most secure financially, with 100.0% of males and 100.0% of females in these age groups living above the poverty line.
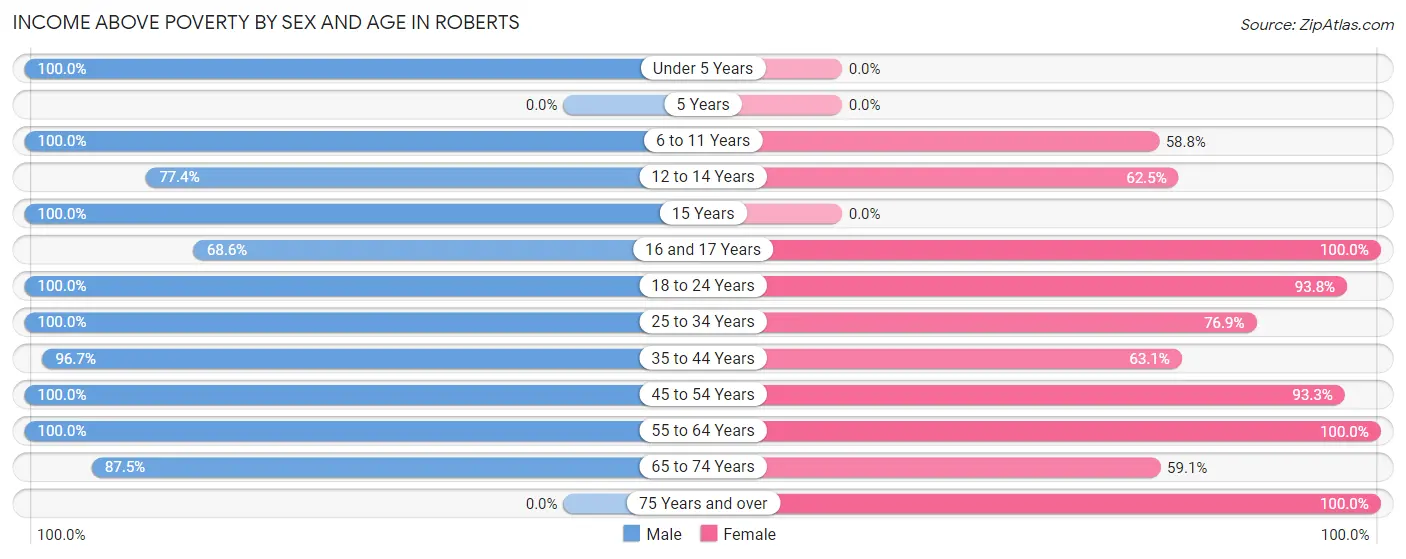
| Age Bracket | Male | Female |
| Under 5 Years | 11 (100.0%) | 0 (0.0%) |
| 5 Years | 0 (0.0%) | 0 (0.0%) |
| 6 to 11 Years | 14 (100.0%) | 10 (58.8%) |
| 12 to 14 Years | 24 (77.4%) | 15 (62.5%) |
| 15 Years | 8 (100.0%) | 0 (0.0%) |
| 16 and 17 Years | 24 (68.6%) | 33 (100.0%) |
| 18 to 24 Years | 17 (100.0%) | 15 (93.8%) |
| 25 to 34 Years | 6 (100.0%) | 10 (76.9%) |
| 35 to 44 Years | 29 (96.7%) | 41 (63.1%) |
| 45 to 54 Years | 24 (100.0%) | 14 (93.3%) |
| 55 to 64 Years | 12 (100.0%) | 26 (100.0%) |
| 65 to 74 Years | 21 (87.5%) | 13 (59.1%) |
| 75 Years and over | 0 (0.0%) | 4 (100.0%) |
| Total | 190 (89.6%) | 181 (72.7%) |
Income Below Poverty Among Married-Couple Families in Roberts
The poverty statistics for married-couple families in Roberts show that 4.2% or 3 of the total 71 families live below the poverty line. Families with no children have the highest poverty rate of 8.1%, comprising of 3 families. On the other hand, families with 1 or 2 children have the lowest poverty rate of 0.0%, which includes 0 families.
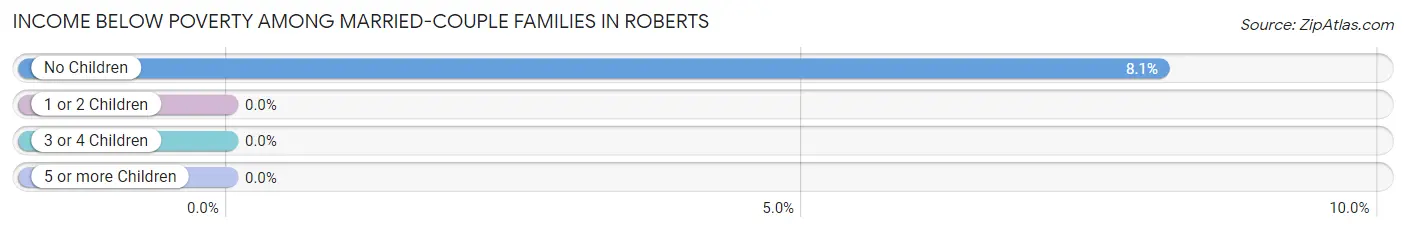
| Children | Above Poverty | Below Poverty |
| No Children | 34 (91.9%) | 3 (8.1%) |
| 1 or 2 Children | 18 (100.0%) | 0 (0.0%) |
| 3 or 4 Children | 16 (100.0%) | 0 (0.0%) |
| 5 or more Children | 0 (0.0%) | 0 (0.0%) |
| Total | 68 (95.8%) | 3 (4.2%) |
Income Below Poverty Among Single-Parent Households in Roberts
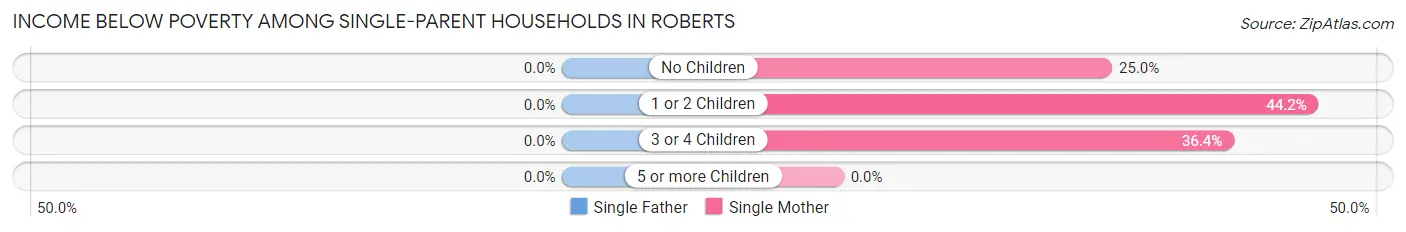
| Children | Single Father | Single Mother |
| No Children | 0 (0.0%) | 1 (25.0%) |
| 1 or 2 Children | 0 (0.0%) | 23 (44.2%) |
| 3 or 4 Children | 0 (0.0%) | 4 (36.4%) |
| 5 or more Children | 0 (0.0%) | 0 (0.0%) |
| Total | 0 (0.0%) | 28 (41.8%) |
Income Below Poverty Among Married-Couple vs Single-Parent Households in Roberts
The poverty data for Roberts shows that 3 of the married-couple family households (4.2%) and 28 of the single-parent households (37.3%) are living below the poverty level. Within the married-couple family households, those with no children have the highest poverty rate, with 3 households (8.1%) falling below the poverty line. Among the single-parent households, those with 1 or 2 children have the highest poverty rate, with 23 household (38.3%) living below poverty.
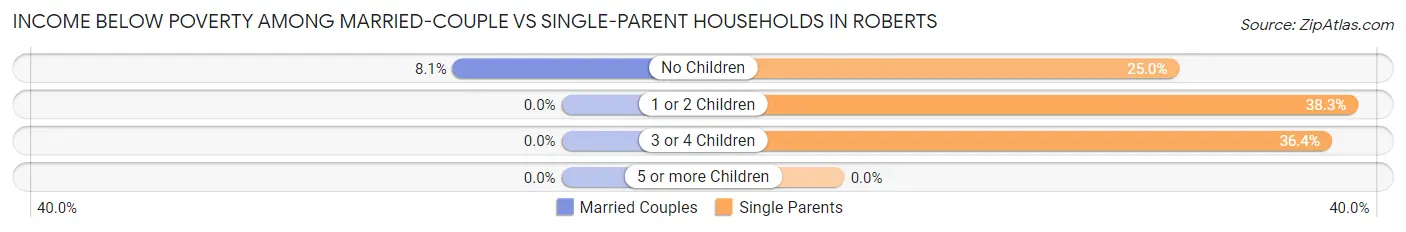
| Children | Married-Couple Families | Single-Parent Households |
| No Children | 3 (8.1%) | 1 (25.0%) |
| 1 or 2 Children | 0 (0.0%) | 23 (38.3%) |
| 3 or 4 Children | 0 (0.0%) | 4 (36.4%) |
| 5 or more Children | 0 (0.0%) | 0 (0.0%) |
| Total | 3 (4.2%) | 28 (37.3%) |
Employment Characteristics in Roberts
Employment by Class of Employer in Roberts
Among the 204 employed individuals in Roberts, private company employees (195 | 95.6%), self-employed (not incorporated) (5 | 2.5%), and local government employees (2 | 1.0%) make up the most common classes of employment.
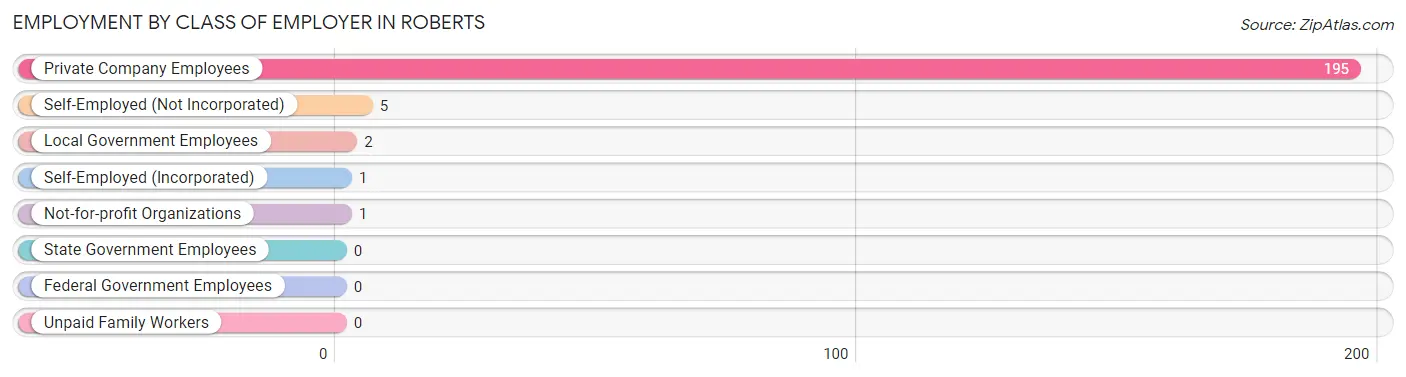
| Employer Class | # Employees | % Employees |
| Private Company Employees | 195 | 95.6% |
| Self-Employed (Incorporated) | 1 | 0.5% |
| Self-Employed (Not Incorporated) | 5 | 2.5% |
| Not-for-profit Organizations | 1 | 0.5% |
| Local Government Employees | 2 | 1.0% |
| State Government Employees | 0 | 0.0% |
| Federal Government Employees | 0 | 0.0% |
| Unpaid Family Workers | 0 | 0.0% |
| Total | 204 | 100.0% |
Employment Status by Age in Roberts
According to the labor force statistics for Roberts, out of the total population over 16 years of age (342), 66.1% or 226 individuals are in the labor force, with 9.7% or 22 of them unemployed. The age group with the highest labor force participation rate is 25 to 29 years, with 100.0% or 6 individuals in the labor force. Within the labor force, the 16 to 19 years age range has the highest percentage of unemployed individuals, with 25.8% or 8 of them being unemployed.
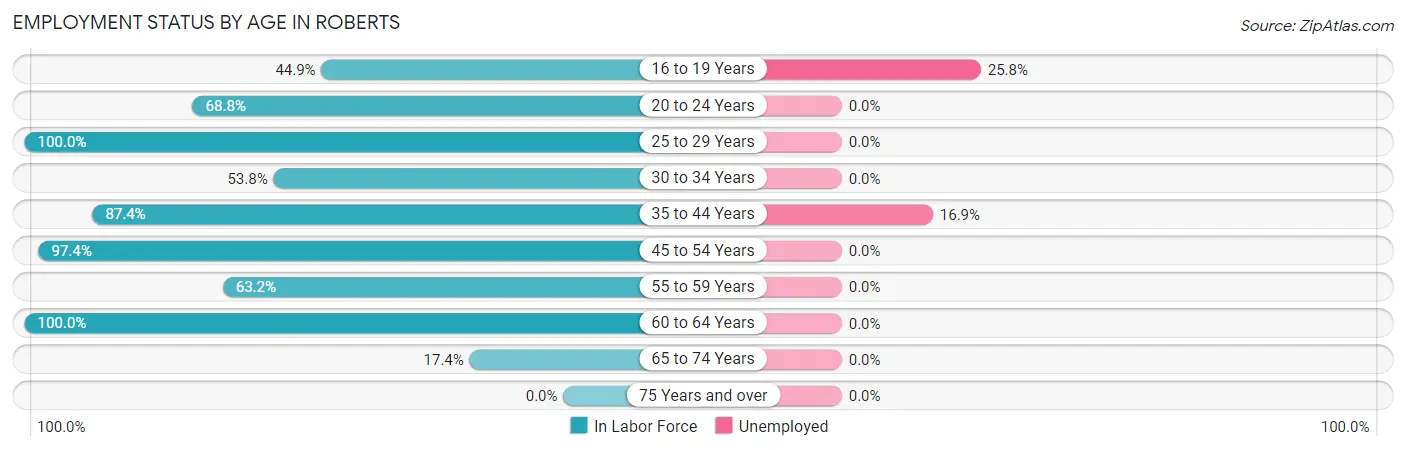
| Age Bracket | In Labor Force | Unemployed |
| 16 to 19 Years | 31 (44.9%) | 8 (25.8%) |
| 20 to 24 Years | 22 (68.8%) | 0 (0.0%) |
| 25 to 29 Years | 6 (100.0%) | 0 (0.0%) |
| 30 to 34 Years | 7 (53.8%) | 0 (0.0%) |
| 35 to 44 Years | 83 (87.4%) | 14 (16.9%) |
| 45 to 54 Years | 38 (97.4%) | 0 (0.0%) |
| 55 to 59 Years | 12 (63.2%) | 0 (0.0%) |
| 60 to 64 Years | 19 (100.0%) | 0 (0.0%) |
| 65 to 74 Years | 8 (17.4%) | 0 (0.0%) |
| 75 Years and over | 0 (0.0%) | 0 (0.0%) |
| Total | 226 (66.1%) | 22 (9.7%) |
Employment Status by Educational Attainment in Roberts
According to labor force statistics for Roberts, 86.4% of individuals (165) out of the total population between 25 and 64 years of age (191) are in the labor force, with 8.5% or 14 of them being unemployed. The group with the highest labor force participation rate are those with the educational attainment of less than high school, with 96.7% or 88 individuals in the labor force. Within the labor force, individuals with less than high school education have the highest percentage of unemployment, with 15.9% or 14 of them being unemployed.
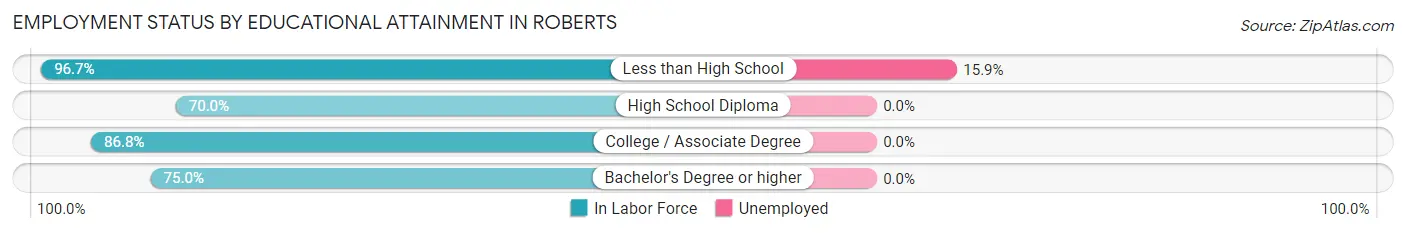
| Educational Attainment | In Labor Force | Unemployed |
| Less than High School | 88 (96.7%) | 14 (15.9%) |
| High School Diploma | 35 (70.0%) | 0 (0.0%) |
| College / Associate Degree | 33 (86.8%) | 0 (0.0%) |
| Bachelor's Degree or higher | 9 (75.0%) | 0 (0.0%) |
| Total | 165 (86.4%) | 16 (8.5%) |
Employment Occupations by Sex in Roberts
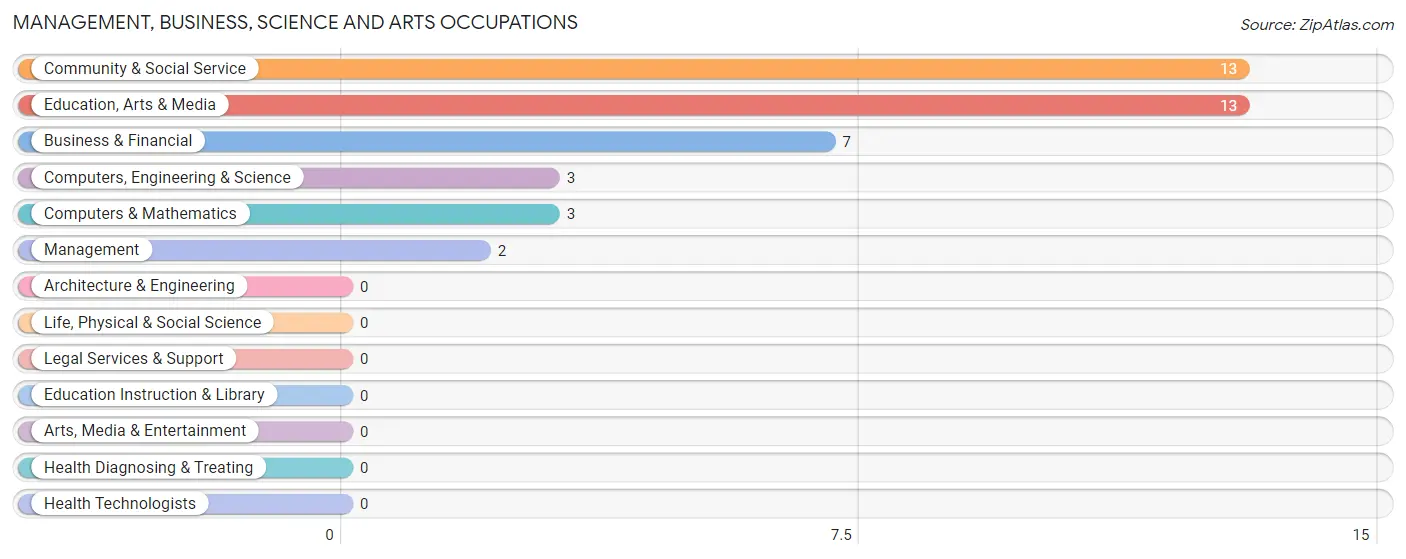
Management, Business, Science and Arts Occupations
The most common Management, Business, Science and Arts occupations in Roberts are Community & Social Service (13 | 6.4%), Education, Arts & Media (13 | 6.4%), Business & Financial (7 | 3.4%), Computers, Engineering & Science (3 | 1.5%), and Computers & Mathematics (3 | 1.5%).
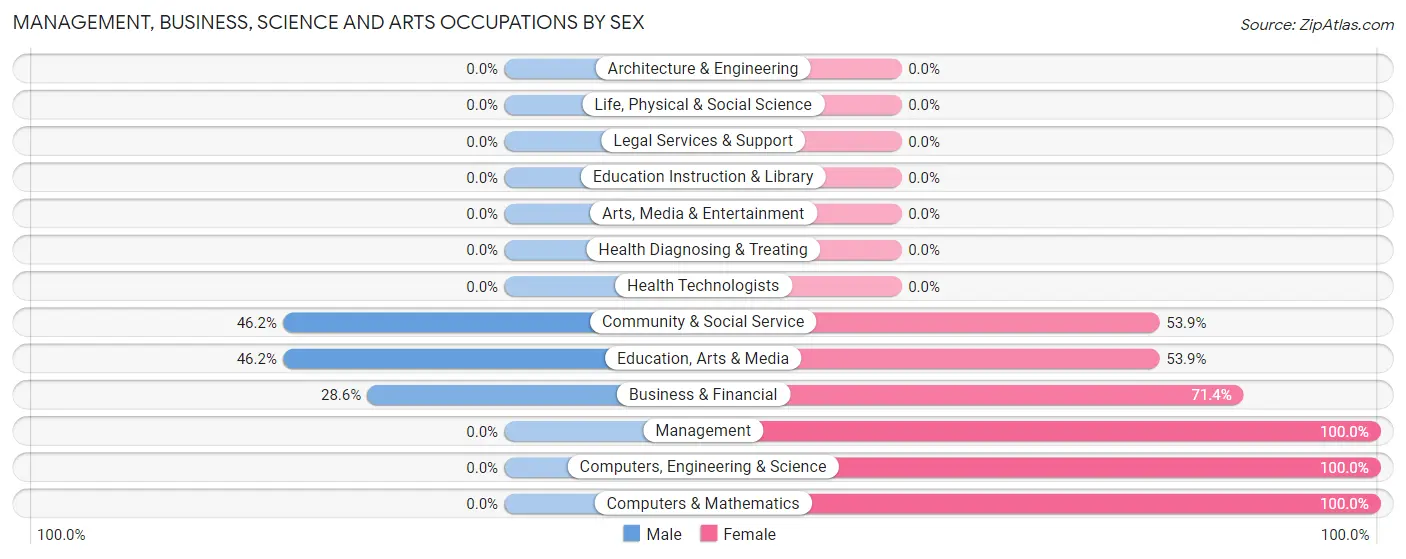
Management, Business, Science and Arts Occupations by Sex
Within the Management, Business, Science and Arts occupations in Roberts, the most male-oriented occupations are Community & Social Service (46.2%), Education, Arts & Media (46.2%), and Business & Financial (28.6%), while the most female-oriented occupations are Management (100.0%), Computers, Engineering & Science (100.0%), and Computers & Mathematics (100.0%).
| Occupation | Male | Female |
| Management | 0 (0.0%) | 2 (100.0%) |
| Business & Financial | 2 (28.6%) | 5 (71.4%) |
| Computers, Engineering & Science | 0 (0.0%) | 3 (100.0%) |
| Computers & Mathematics | 0 (0.0%) | 3 (100.0%) |
| Architecture & Engineering | 0 (0.0%) | 0 (0.0%) |
| Life, Physical & Social Science | 0 (0.0%) | 0 (0.0%) |
| Community & Social Service | 6 (46.2%) | 7 (53.8%) |
| Education, Arts & Media | 6 (46.2%) | 7 (53.8%) |
| Legal Services & Support | 0 (0.0%) | 0 (0.0%) |
| Education Instruction & Library | 0 (0.0%) | 0 (0.0%) |
| Arts, Media & Entertainment | 0 (0.0%) | 0 (0.0%) |
| Health Diagnosing & Treating | 0 (0.0%) | 0 (0.0%) |
| Health Technologists | 0 (0.0%) | 0 (0.0%) |
| Total (Category) | 8 (32.0%) | 17 (68.0%) |
| Total (Overall) | 110 (53.9%) | 94 (46.1%) |
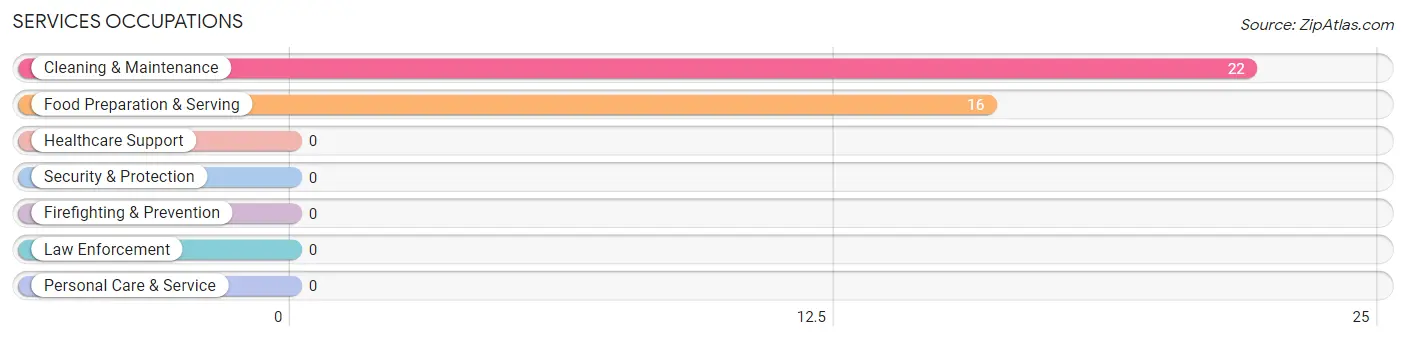
Services Occupations
The most common Services occupations in Roberts are Cleaning & Maintenance (22 | 10.8%), and Food Preparation & Serving (16 | 7.8%).
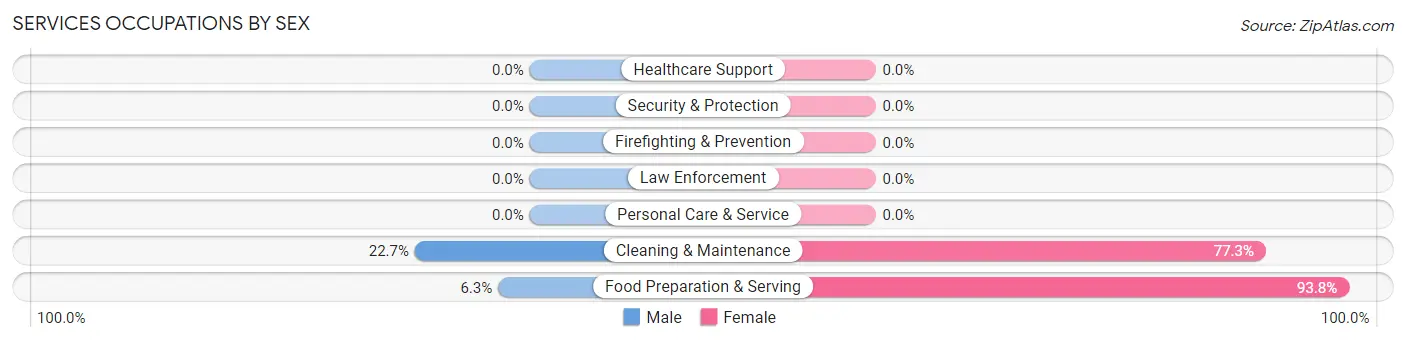
Services Occupations by Sex
Within the Services occupations in Roberts, the most male-oriented occupations are Cleaning & Maintenance (22.7%), and Food Preparation & Serving (6.2%), while the most female-oriented occupations are Food Preparation & Serving (93.8%), and Cleaning & Maintenance (77.3%).
| Occupation | Male | Female |
| Healthcare Support | 0 (0.0%) | 0 (0.0%) |
| Security & Protection | 0 (0.0%) | 0 (0.0%) |
| Firefighting & Prevention | 0 (0.0%) | 0 (0.0%) |
| Law Enforcement | 0 (0.0%) | 0 (0.0%) |
| Food Preparation & Serving | 1 (6.2%) | 15 (93.8%) |
| Cleaning & Maintenance | 5 (22.7%) | 17 (77.3%) |
| Personal Care & Service | 0 (0.0%) | 0 (0.0%) |
| Total (Category) | 6 (15.8%) | 32 (84.2%) |
| Total (Overall) | 110 (53.9%) | 94 (46.1%) |
Sales and Office Occupations
The most common Sales and Office occupations in Roberts are Office & Administration (17 | 8.3%), and Sales & Related (15 | 7.3%).
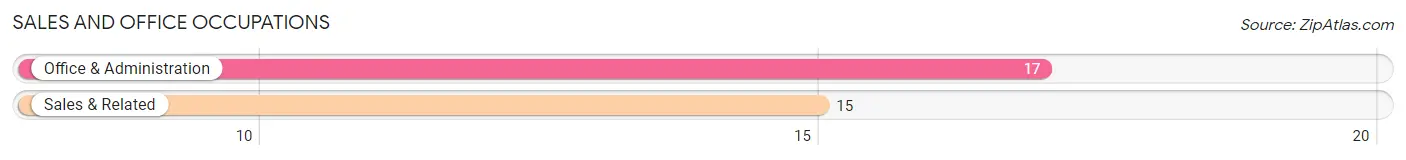
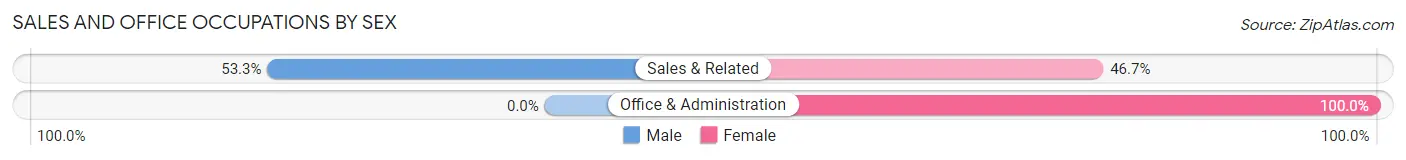
Sales and Office Occupations by Sex
| Occupation | Male | Female |
| Sales & Related | 8 (53.3%) | 7 (46.7%) |
| Office & Administration | 0 (0.0%) | 17 (100.0%) |
| Total (Category) | 8 (25.0%) | 24 (75.0%) |
| Total (Overall) | 110 (53.9%) | 94 (46.1%) |
Natural Resources, Construction and Maintenance Occupations
The most common Natural Resources, Construction and Maintenance occupations in Roberts are Construction & Extraction (26 | 12.8%), and Farming, Fishing & Forestry (11 | 5.4%).
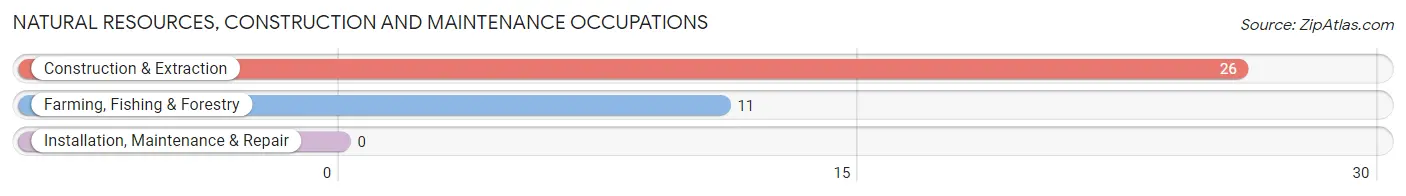
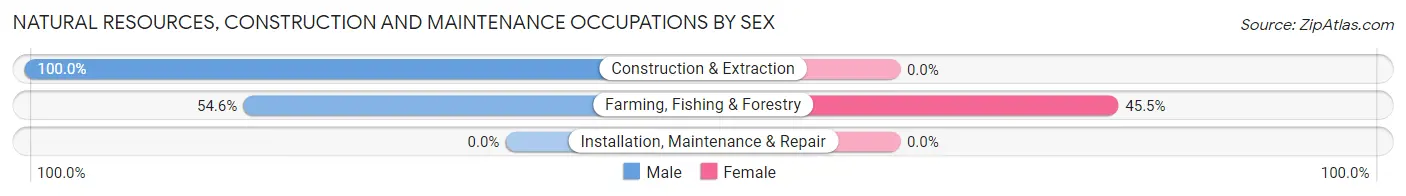
Natural Resources, Construction and Maintenance Occupations by Sex
| Occupation | Male | Female |
| Farming, Fishing & Forestry | 6 (54.5%) | 5 (45.5%) |
| Construction & Extraction | 26 (100.0%) | 0 (0.0%) |
| Installation, Maintenance & Repair | 0 (0.0%) | 0 (0.0%) |
| Total (Category) | 32 (86.5%) | 5 (13.5%) |
| Total (Overall) | 110 (53.9%) | 94 (46.1%) |
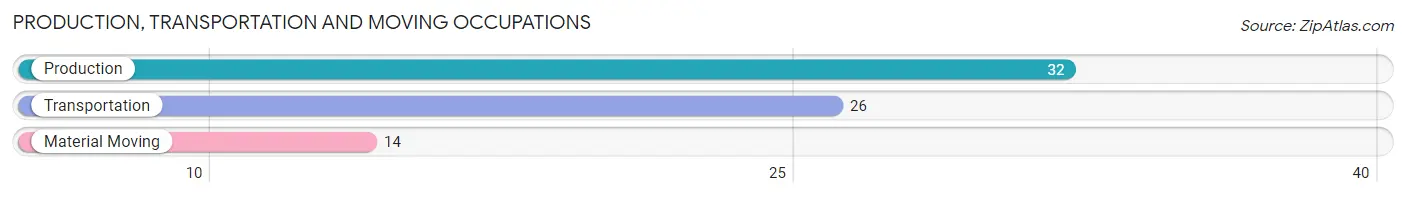
Production, Transportation and Moving Occupations
The most common Production, Transportation and Moving occupations in Roberts are Production (32 | 15.7%), Transportation (26 | 12.8%), and Material Moving (14 | 6.9%).
Production, Transportation and Moving Occupations by Sex
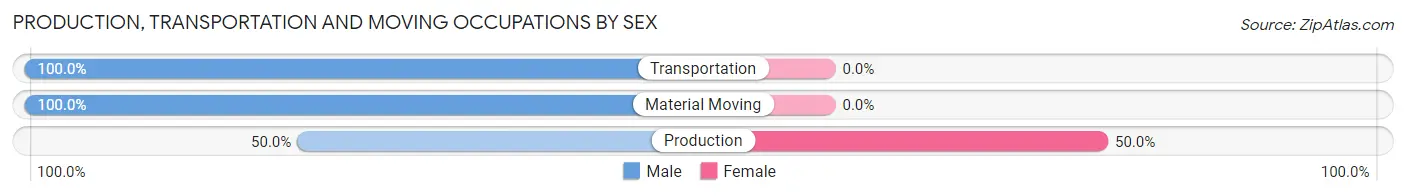
| Occupation | Male | Female |
| Production | 16 (50.0%) | 16 (50.0%) |
| Transportation | 26 (100.0%) | 0 (0.0%) |
| Material Moving | 14 (100.0%) | 0 (0.0%) |
| Total (Category) | 56 (77.8%) | 16 (22.2%) |
| Total (Overall) | 110 (53.9%) | 94 (46.1%) |
Employment Industries by Sex in Roberts
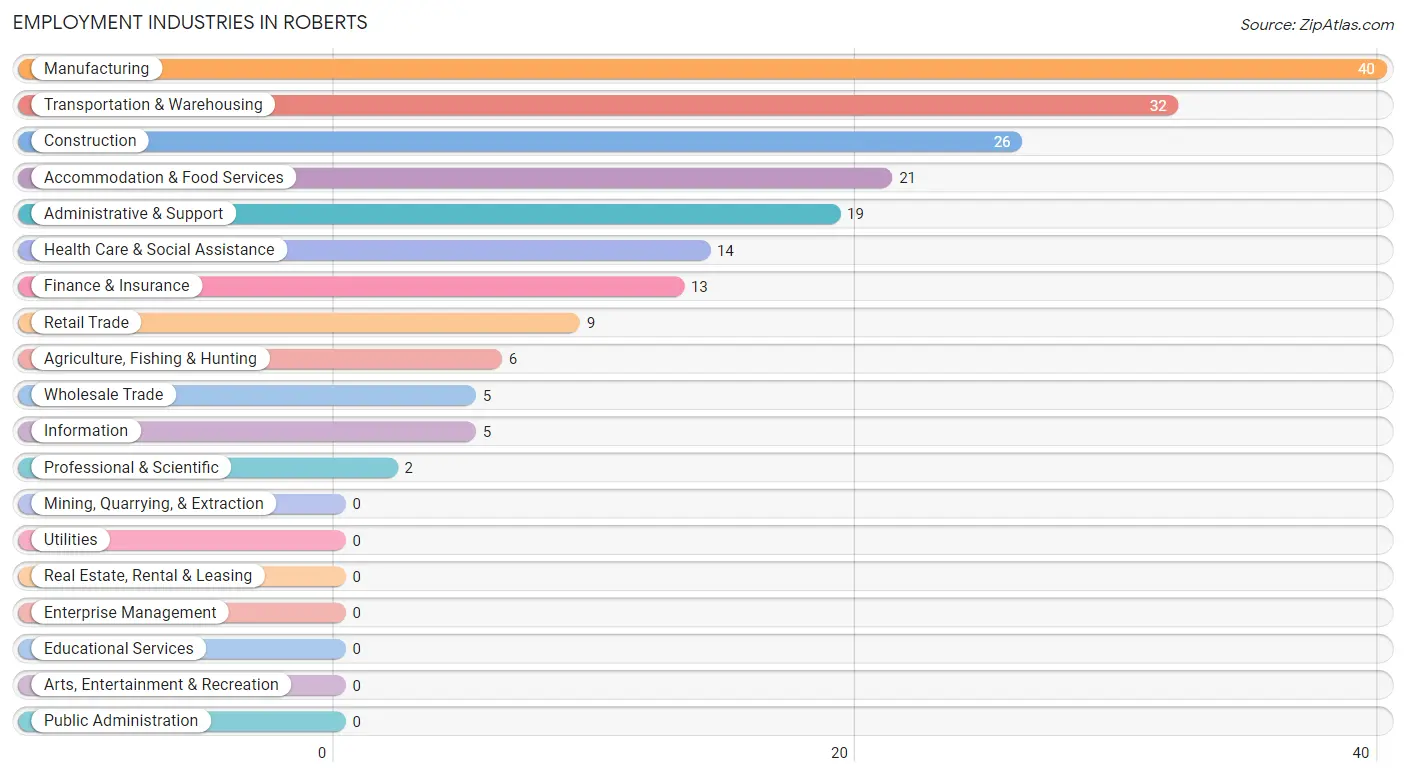
Employment Industries in Roberts
The major employment industries in Roberts include Manufacturing (40 | 19.6%), Transportation & Warehousing (32 | 15.7%), Construction (26 | 12.8%), Accommodation & Food Services (21 | 10.3%), and Administrative & Support (19 | 9.3%).
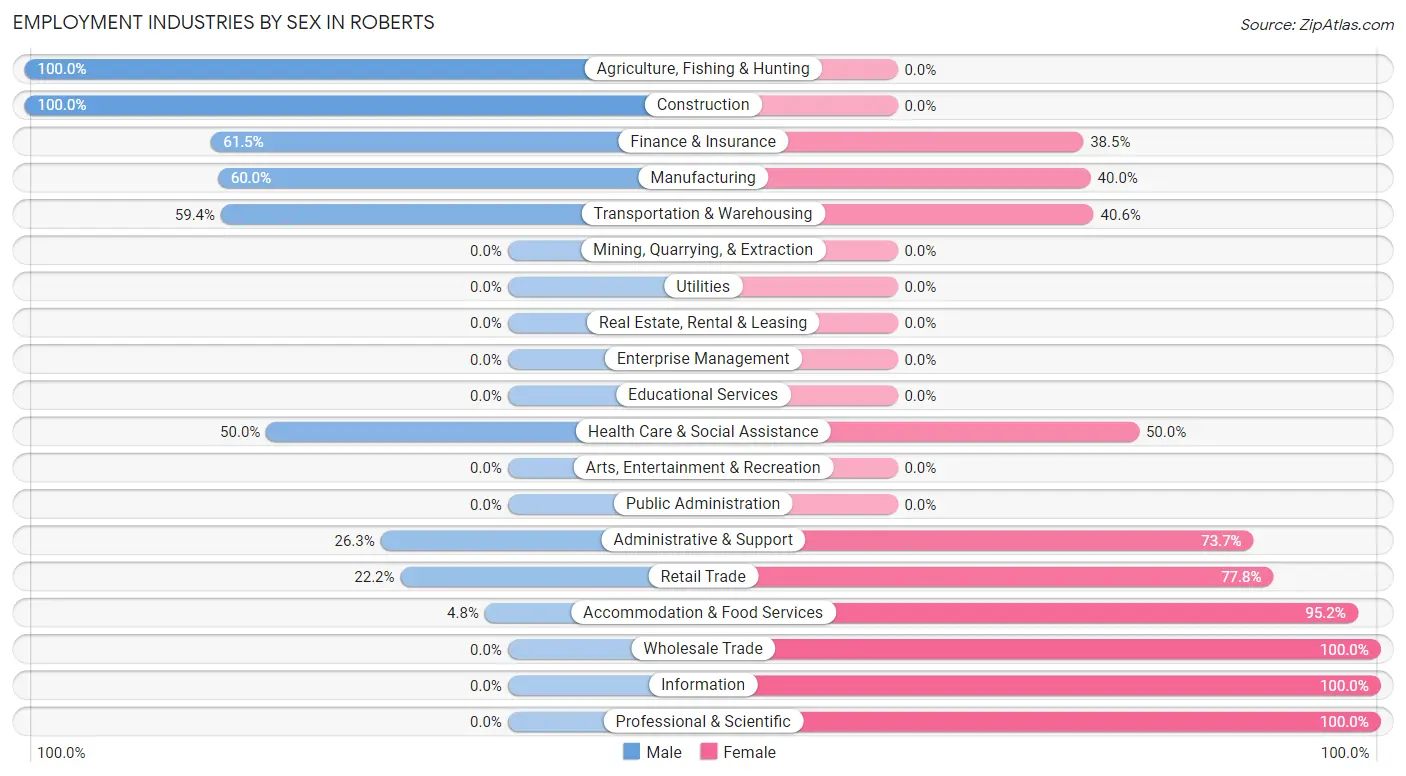
Employment Industries by Sex in Roberts
The Roberts industries that see more men than women are Agriculture, Fishing & Hunting (100.0%), Construction (100.0%), and Finance & Insurance (61.5%), whereas the industries that tend to have a higher number of women are Wholesale Trade (100.0%), Information (100.0%), and Professional & Scientific (100.0%).
| Industry | Male | Female |
| Agriculture, Fishing & Hunting | 6 (100.0%) | 0 (0.0%) |
| Mining, Quarrying, & Extraction | 0 (0.0%) | 0 (0.0%) |
| Construction | 26 (100.0%) | 0 (0.0%) |
| Manufacturing | 24 (60.0%) | 16 (40.0%) |
| Wholesale Trade | 0 (0.0%) | 5 (100.0%) |
| Retail Trade | 2 (22.2%) | 7 (77.8%) |
| Transportation & Warehousing | 19 (59.4%) | 13 (40.6%) |
| Utilities | 0 (0.0%) | 0 (0.0%) |
| Information | 0 (0.0%) | 5 (100.0%) |
| Finance & Insurance | 8 (61.5%) | 5 (38.5%) |
| Real Estate, Rental & Leasing | 0 (0.0%) | 0 (0.0%) |
| Professional & Scientific | 0 (0.0%) | 2 (100.0%) |
| Enterprise Management | 0 (0.0%) | 0 (0.0%) |
| Administrative & Support | 5 (26.3%) | 14 (73.7%) |
| Educational Services | 0 (0.0%) | 0 (0.0%) |
| Health Care & Social Assistance | 7 (50.0%) | 7 (50.0%) |
| Arts, Entertainment & Recreation | 0 (0.0%) | 0 (0.0%) |
| Accommodation & Food Services | 1 (4.8%) | 20 (95.2%) |
| Public Administration | 0 (0.0%) | 0 (0.0%) |
| Total | 110 (53.9%) | 94 (46.1%) |
Education in Roberts
School Enrollment in Roberts
The most common levels of schooling among the 176 students in Roberts are high school (95 | 54.0%), middle school (49 | 27.8%), and elementary school (17 | 9.7%).
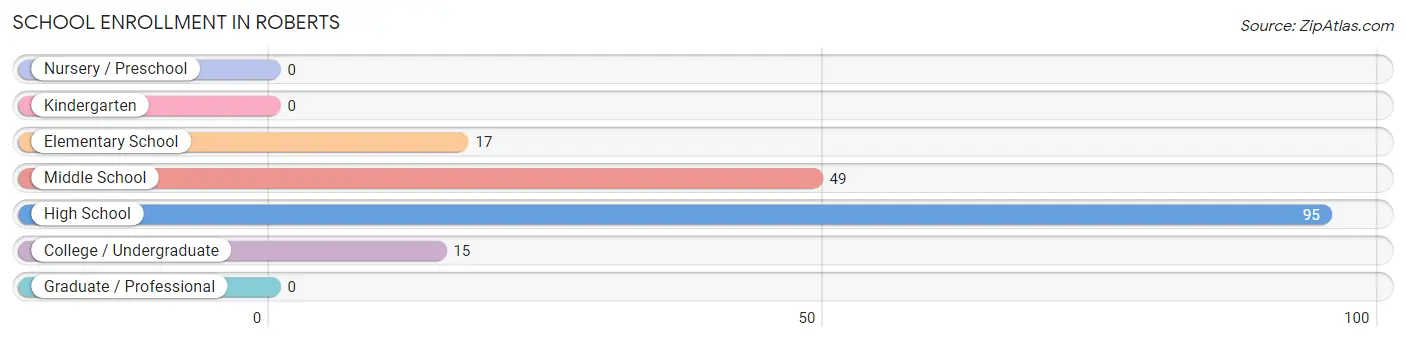
| School Level | # Students | % Students |
| Nursery / Preschool | 0 | 0.0% |
| Kindergarten | 0 | 0.0% |
| Elementary School | 17 | 9.7% |
| Middle School | 49 | 27.8% |
| High School | 95 | 54.0% |
| College / Undergraduate | 15 | 8.5% |
| Graduate / Professional | 0 | 0.0% |
| Total | 176 | 100.0% |
School Enrollment by Age by Funding Source in Roberts
Out of a total of 176 students who are enrolled in schools in Roberts, 3 (1.7%) attend a private institution, while the remaining 173 (98.3%) are enrolled in public schools. The age group of 10 to 14 year olds has the highest likelihood of being enrolled in private schools, with 3 (3.8% in the age bracket) enrolled. Conversely, the age group of 5 to 9 year old has the lowest likelihood of being enrolled in a private school, with 3 (100.0% in the age bracket) attending a public institution.
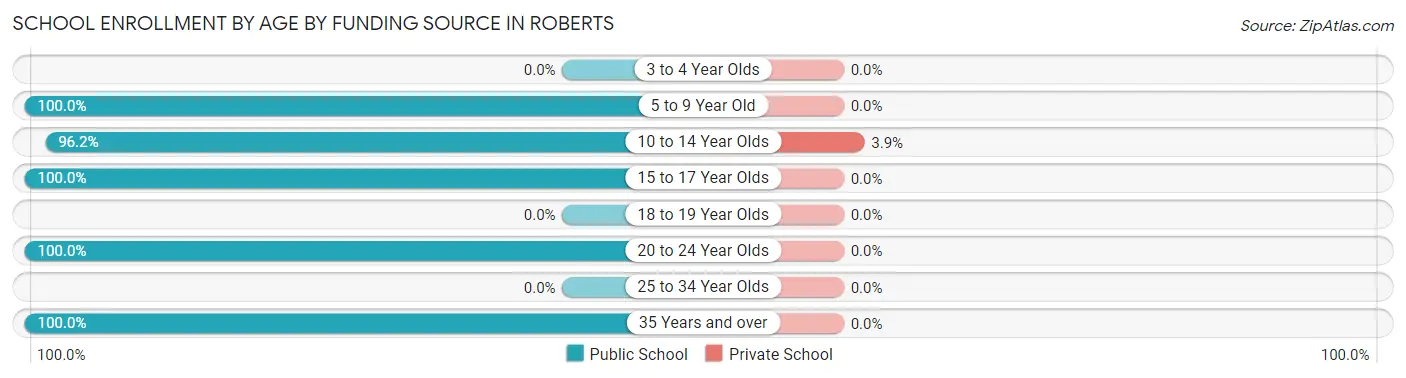
| Age Bracket | Public School | Private School |
| 3 to 4 Year Olds | 0 (0.0%) | 0 (0.0%) |
| 5 to 9 Year Old | 3 (100.0%) | 0 (0.0%) |
| 10 to 14 Year Olds | 75 (96.2%) | 3 (3.8%) |
| 15 to 17 Year Olds | 80 (100.0%) | 0 (0.0%) |
| 18 to 19 Year Olds | 0 (0.0%) | 0 (0.0%) |
| 20 to 24 Year Olds | 12 (100.0%) | 0 (0.0%) |
| 25 to 34 Year Olds | 0 (0.0%) | 0 (0.0%) |
| 35 Years and over | 3 (100.0%) | 0 (0.0%) |
| Total | 173 (98.3%) | 3 (1.7%) |
Educational Attainment by Field of Study in Roberts
Engineering (8 | 30.8%), psychology (7 | 26.9%), arts & humanities (6 | 23.1%), and bio, nature & agricultural (5 | 19.2%) are the most common fields of study among 26 individuals in Roberts who have obtained a bachelor's degree or higher.
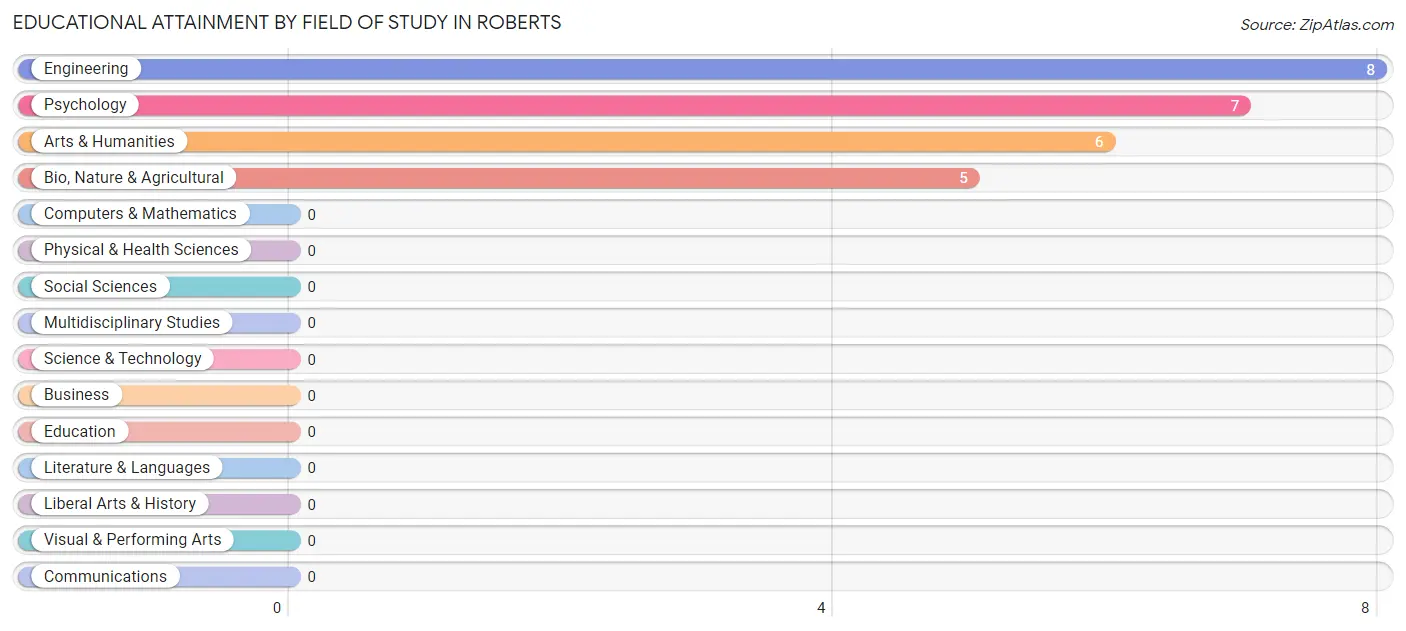
| Field of Study | # Graduates | % Graduates |
| Computers & Mathematics | 0 | 0.0% |
| Bio, Nature & Agricultural | 5 | 19.2% |
| Physical & Health Sciences | 0 | 0.0% |
| Psychology | 7 | 26.9% |
| Social Sciences | 0 | 0.0% |
| Engineering | 8 | 30.8% |
| Multidisciplinary Studies | 0 | 0.0% |
| Science & Technology | 0 | 0.0% |
| Business | 0 | 0.0% |
| Education | 0 | 0.0% |
| Literature & Languages | 0 | 0.0% |
| Liberal Arts & History | 0 | 0.0% |
| Visual & Performing Arts | 0 | 0.0% |
| Communications | 0 | 0.0% |
| Arts & Humanities | 6 | 23.1% |
| Total | 26 | 100.0% |
Transportation & Commute in Roberts
Vehicle Availability by Sex in Roberts
The most prevalent vehicle ownership categories in Roberts are males with 5 or more vehicles (30, accounting for 27.3%) and females with 5 or more vehicles (26, making up 31.9%).
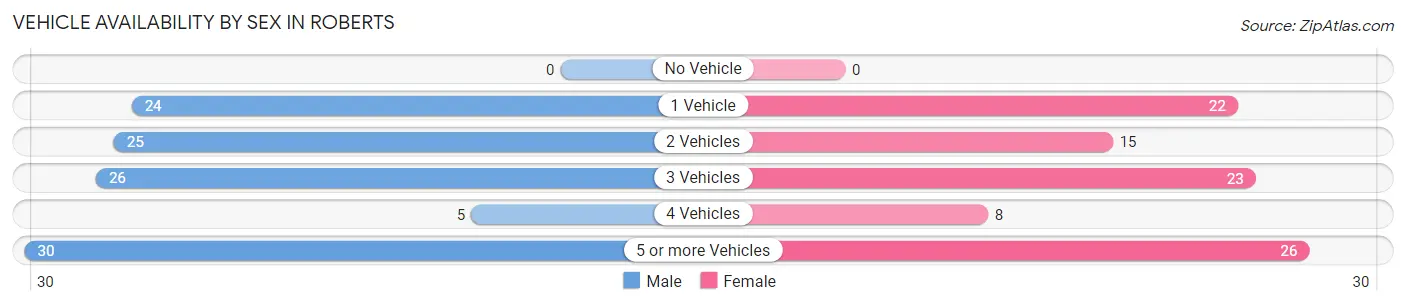
| Vehicles Available | Male | Female |
| No Vehicle | 0 (0.0%) | 0 (0.0%) |
| 1 Vehicle | 24 (21.8%) | 22 (23.4%) |
| 2 Vehicles | 25 (22.7%) | 15 (16.0%) |
| 3 Vehicles | 26 (23.6%) | 23 (24.5%) |
| 4 Vehicles | 5 (4.5%) | 8 (8.5%) |
| 5 or more Vehicles | 30 (27.3%) | 26 (27.7%) |
| Total | 110 (100.0%) | 94 (100.0%) |
Commute Time in Roberts
The most frequently occuring commute durations in Roberts are 30 to 34 minutes (59 commuters, 30.9%), 20 to 24 minutes (43 commuters, 22.5%), and 10 to 14 minutes (31 commuters, 16.2%).
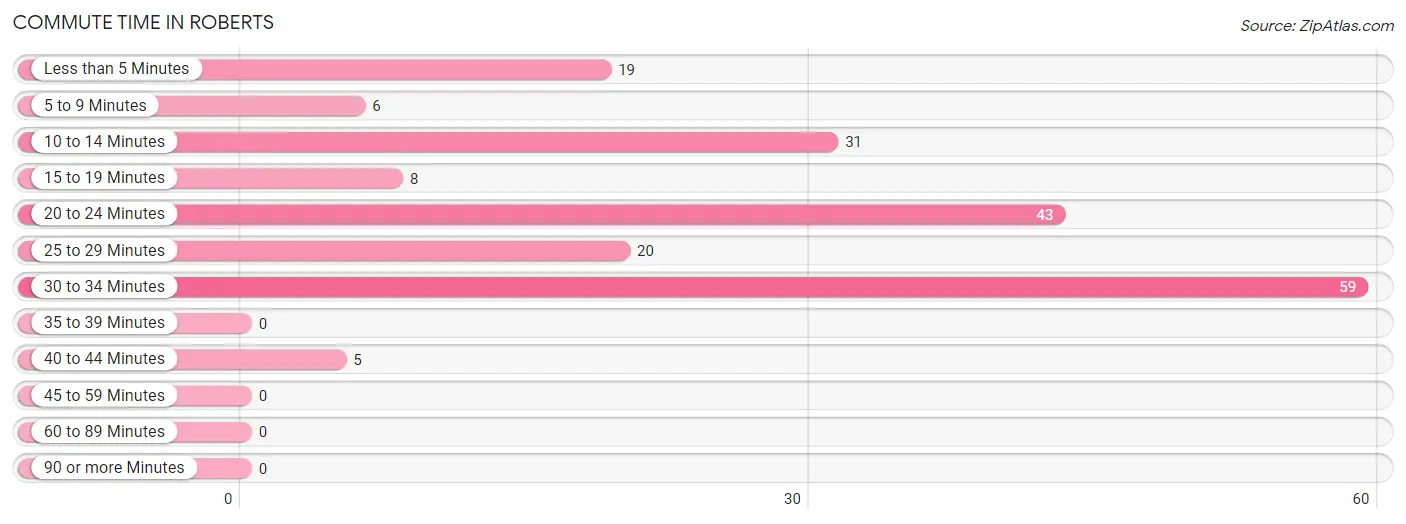
| Commute Time | # Commuters | % Commuters |
| Less than 5 Minutes | 19 | 10.0% |
| 5 to 9 Minutes | 6 | 3.1% |
| 10 to 14 Minutes | 31 | 16.2% |
| 15 to 19 Minutes | 8 | 4.2% |
| 20 to 24 Minutes | 43 | 22.5% |
| 25 to 29 Minutes | 20 | 10.5% |
| 30 to 34 Minutes | 59 | 30.9% |
| 35 to 39 Minutes | 0 | 0.0% |
| 40 to 44 Minutes | 5 | 2.6% |
| 45 to 59 Minutes | 0 | 0.0% |
| 60 to 89 Minutes | 0 | 0.0% |
| 90 or more Minutes | 0 | 0.0% |
Commute Time by Sex in Roberts
The most common commute times in Roberts are 30 to 34 minutes (37 commuters, 33.6%) for males and 20 to 24 minutes (23 commuters, 28.4%) for females.
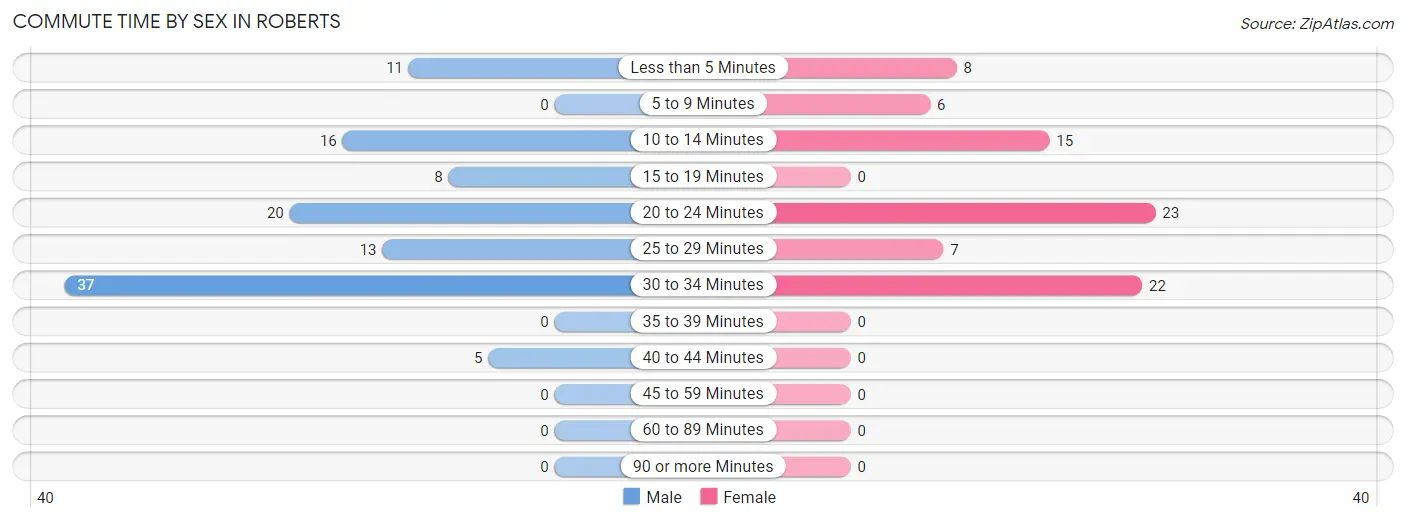
| Commute Time | Male | Female |
| Less than 5 Minutes | 11 (10.0%) | 8 (9.9%) |
| 5 to 9 Minutes | 0 (0.0%) | 6 (7.4%) |
| 10 to 14 Minutes | 16 (14.5%) | 15 (18.5%) |
| 15 to 19 Minutes | 8 (7.3%) | 0 (0.0%) |
| 20 to 24 Minutes | 20 (18.2%) | 23 (28.4%) |
| 25 to 29 Minutes | 13 (11.8%) | 7 (8.6%) |
| 30 to 34 Minutes | 37 (33.6%) | 22 (27.2%) |
| 35 to 39 Minutes | 0 (0.0%) | 0 (0.0%) |
| 40 to 44 Minutes | 5 (4.5%) | 0 (0.0%) |
| 45 to 59 Minutes | 0 (0.0%) | 0 (0.0%) |
| 60 to 89 Minutes | 0 (0.0%) | 0 (0.0%) |
| 90 or more Minutes | 0 (0.0%) | 0 (0.0%) |
Time of Departure to Work by Sex in Roberts
The most frequent times of departure to work in Roberts are 6:30 AM to 6:59 AM (32, 29.1%) for males and 4:00 PM to 11:59 PM (24, 29.6%) for females.
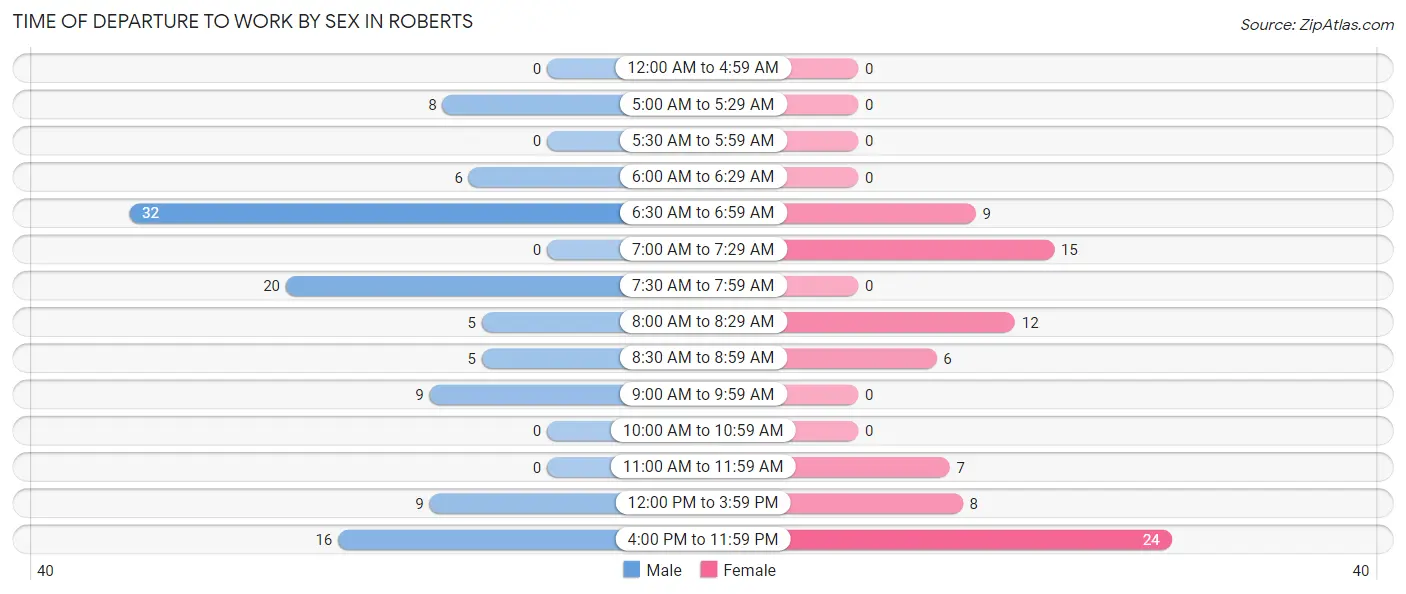
| Time of Departure | Male | Female |
| 12:00 AM to 4:59 AM | 0 (0.0%) | 0 (0.0%) |
| 5:00 AM to 5:29 AM | 8 (7.3%) | 0 (0.0%) |
| 5:30 AM to 5:59 AM | 0 (0.0%) | 0 (0.0%) |
| 6:00 AM to 6:29 AM | 6 (5.4%) | 0 (0.0%) |
| 6:30 AM to 6:59 AM | 32 (29.1%) | 9 (11.1%) |
| 7:00 AM to 7:29 AM | 0 (0.0%) | 15 (18.5%) |
| 7:30 AM to 7:59 AM | 20 (18.2%) | 0 (0.0%) |
| 8:00 AM to 8:29 AM | 5 (4.5%) | 12 (14.8%) |
| 8:30 AM to 8:59 AM | 5 (4.5%) | 6 (7.4%) |
| 9:00 AM to 9:59 AM | 9 (8.2%) | 0 (0.0%) |
| 10:00 AM to 10:59 AM | 0 (0.0%) | 0 (0.0%) |
| 11:00 AM to 11:59 AM | 0 (0.0%) | 7 (8.6%) |
| 12:00 PM to 3:59 PM | 9 (8.2%) | 8 (9.9%) |
| 4:00 PM to 11:59 PM | 16 (14.5%) | 24 (29.6%) |
| Total | 110 (100.0%) | 81 (100.0%) |
Housing Occupancy in Roberts
Occupancy by Ownership in Roberts
Of the total 167 dwellings in Roberts, owner-occupied units account for 98 (58.7%), while renter-occupied units make up 69 (41.3%).
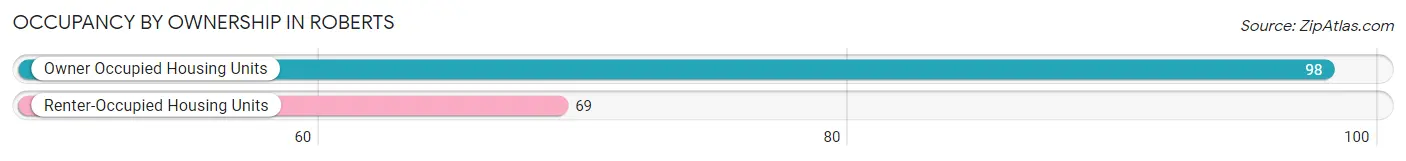
| Occupancy | # Housing Units | % Housing Units |
| Owner Occupied Housing Units | 98 | 58.7% |
| Renter-Occupied Housing Units | 69 | 41.3% |
| Total Occupied Housing Units | 167 | 100.0% |
Occupancy by Household Size in Roberts
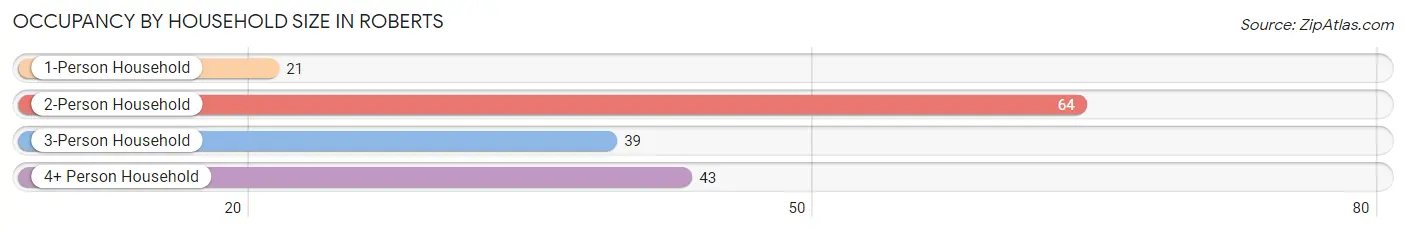
| Household Size | # Housing Units | % Housing Units |
| 1-Person Household | 21 | 12.6% |
| 2-Person Household | 64 | 38.3% |
| 3-Person Household | 39 | 23.4% |
| 4+ Person Household | 43 | 25.8% |
| Total Housing Units | 167 | 100.0% |
Occupancy by Ownership by Household Size in Roberts
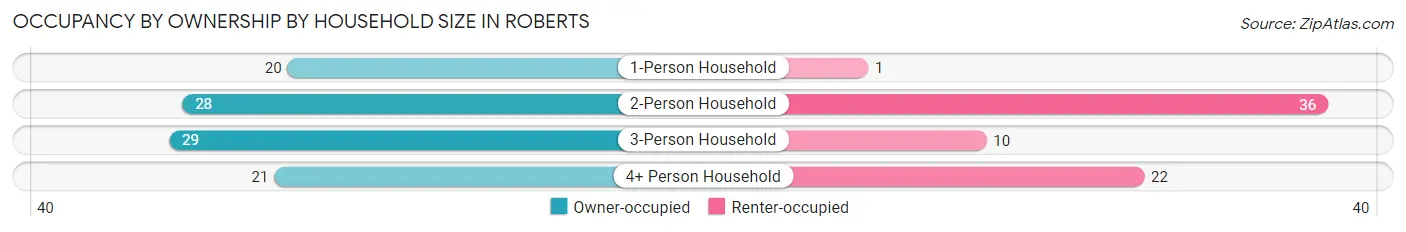
| Household Size | Owner-occupied | Renter-occupied |
| 1-Person Household | 20 (95.2%) | 1 (4.8%) |
| 2-Person Household | 28 (43.8%) | 36 (56.2%) |
| 3-Person Household | 29 (74.4%) | 10 (25.6%) |
| 4+ Person Household | 21 (48.8%) | 22 (51.2%) |
| Total Housing Units | 98 (58.7%) | 69 (41.3%) |
Occupancy by Educational Attainment in Roberts
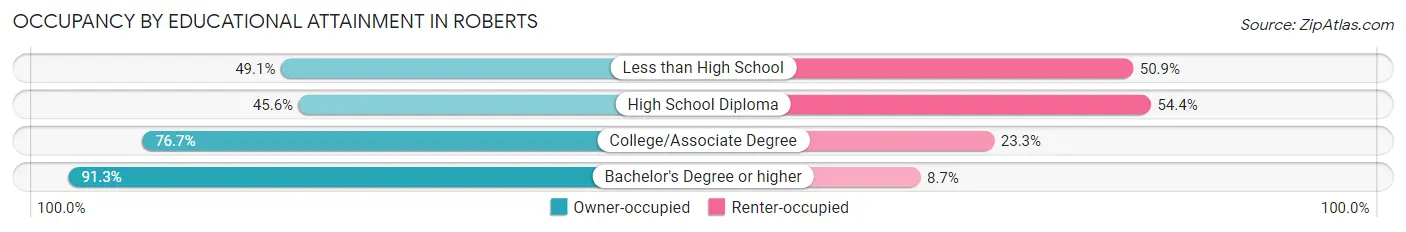
| Household Size | Owner-occupied | Renter-occupied |
| Less than High School | 28 (49.1%) | 29 (50.9%) |
| High School Diploma | 26 (45.6%) | 31 (54.4%) |
| College/Associate Degree | 23 (76.7%) | 7 (23.3%) |
| Bachelor's Degree or higher | 21 (91.3%) | 2 (8.7%) |
Occupancy by Age of Householder in Roberts
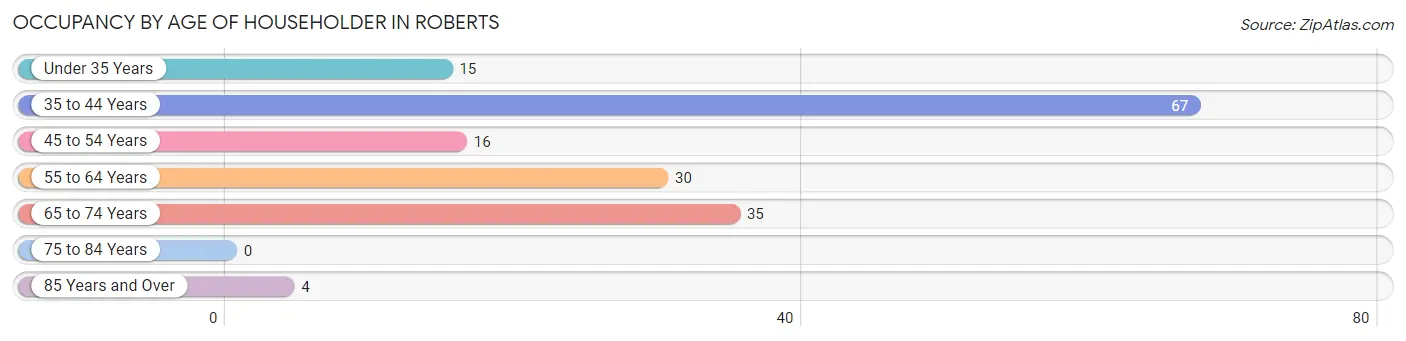
| Age Bracket | # Households | % Households |
| Under 35 Years | 15 | 9.0% |
| 35 to 44 Years | 67 | 40.1% |
| 45 to 54 Years | 16 | 9.6% |
| 55 to 64 Years | 30 | 18.0% |
| 65 to 74 Years | 35 | 21.0% |
| 75 to 84 Years | 0 | 0.0% |
| 85 Years and Over | 4 | 2.4% |
| Total | 167 | 100.0% |
Housing Finances in Roberts
Median Income by Occupancy in Roberts
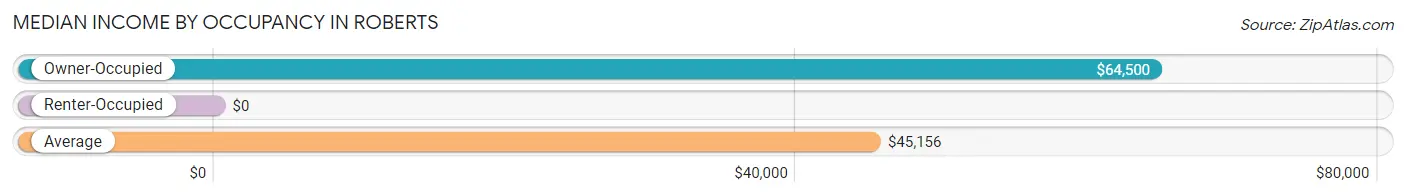
| Occupancy Type | # Households | Median Income |
| Owner-Occupied | 98 (58.7%) | $64,500 |
| Renter-Occupied | 69 (41.3%) | $0 |
| Average | 167 (100.0%) | $45,156 |
Occupancy by Householder Income Bracket in Roberts
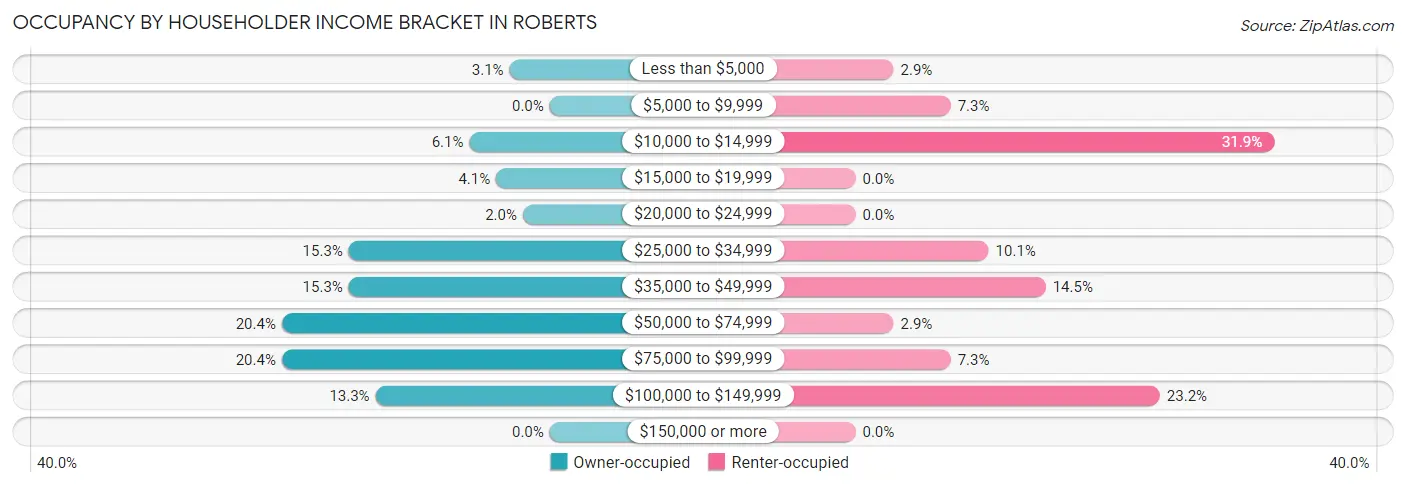
| Income Bracket | Owner-occupied | Renter-occupied |
| Less than $5,000 | 3 (3.1%) | 2 (2.9%) |
| $5,000 to $9,999 | 0 (0.0%) | 5 (7.2%) |
| $10,000 to $14,999 | 6 (6.1%) | 22 (31.9%) |
| $15,000 to $19,999 | 4 (4.1%) | 0 (0.0%) |
| $20,000 to $24,999 | 2 (2.0%) | 0 (0.0%) |
| $25,000 to $34,999 | 15 (15.3%) | 7 (10.1%) |
| $35,000 to $49,999 | 15 (15.3%) | 10 (14.5%) |
| $50,000 to $74,999 | 20 (20.4%) | 2 (2.9%) |
| $75,000 to $99,999 | 20 (20.4%) | 5 (7.2%) |
| $100,000 to $149,999 | 13 (13.3%) | 16 (23.2%) |
| $150,000 or more | 0 (0.0%) | 0 (0.0%) |
| Total | 98 (100.0%) | 69 (100.0%) |
Monthly Housing Cost Tiers in Roberts
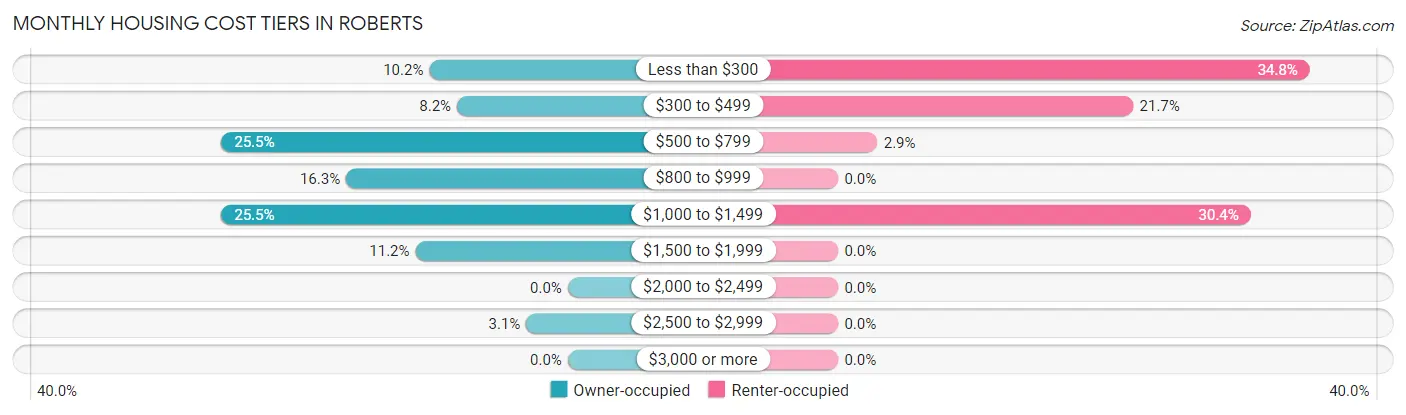
| Monthly Cost | Owner-occupied | Renter-occupied |
| Less than $300 | 10 (10.2%) | 24 (34.8%) |
| $300 to $499 | 8 (8.2%) | 15 (21.7%) |
| $500 to $799 | 25 (25.5%) | 2 (2.9%) |
| $800 to $999 | 16 (16.3%) | 0 (0.0%) |
| $1,000 to $1,499 | 25 (25.5%) | 21 (30.4%) |
| $1,500 to $1,999 | 11 (11.2%) | 0 (0.0%) |
| $2,000 to $2,499 | 0 (0.0%) | 0 (0.0%) |
| $2,500 to $2,999 | 3 (3.1%) | 0 (0.0%) |
| $3,000 or more | 0 (0.0%) | 0 (0.0%) |
| Total | 98 (100.0%) | 69 (100.0%) |
Physical Housing Characteristics in Roberts
Housing Structures in Roberts
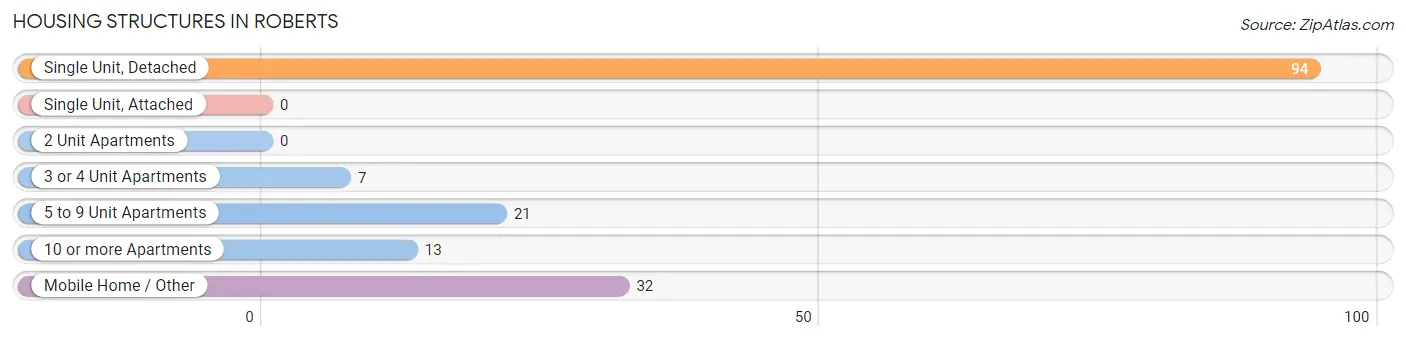
| Structure Type | # Housing Units | % Housing Units |
| Single Unit, Detached | 94 | 56.3% |
| Single Unit, Attached | 0 | 0.0% |
| 2 Unit Apartments | 0 | 0.0% |
| 3 or 4 Unit Apartments | 7 | 4.2% |
| 5 to 9 Unit Apartments | 21 | 12.6% |
| 10 or more Apartments | 13 | 7.8% |
| Mobile Home / Other | 32 | 19.2% |
| Total | 167 | 100.0% |
Housing Structures by Occupancy in Roberts
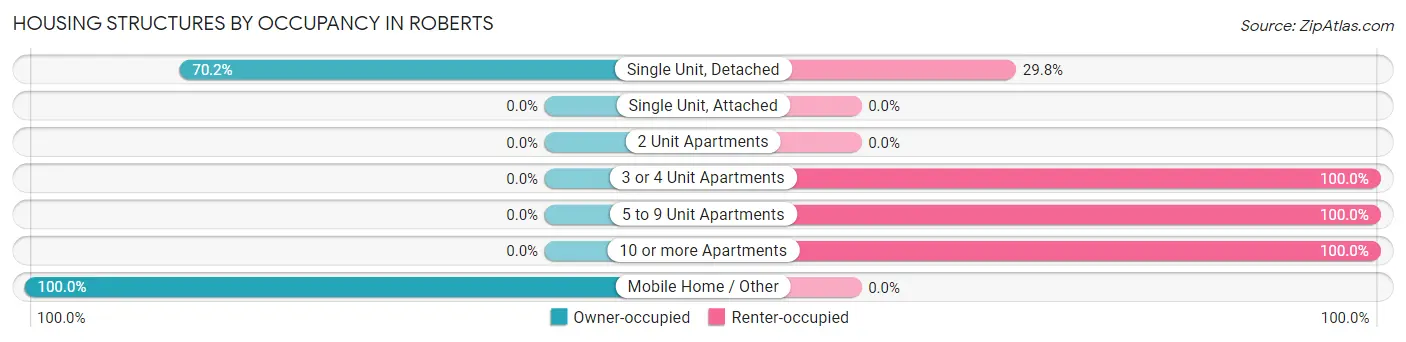
| Structure Type | Owner-occupied | Renter-occupied |
| Single Unit, Detached | 66 (70.2%) | 28 (29.8%) |
| Single Unit, Attached | 0 (0.0%) | 0 (0.0%) |
| 2 Unit Apartments | 0 (0.0%) | 0 (0.0%) |
| 3 or 4 Unit Apartments | 0 (0.0%) | 7 (100.0%) |
| 5 to 9 Unit Apartments | 0 (0.0%) | 21 (100.0%) |
| 10 or more Apartments | 0 (0.0%) | 13 (100.0%) |
| Mobile Home / Other | 32 (100.0%) | 0 (0.0%) |
| Total | 98 (58.7%) | 69 (41.3%) |
Housing Structures by Number of Rooms in Roberts
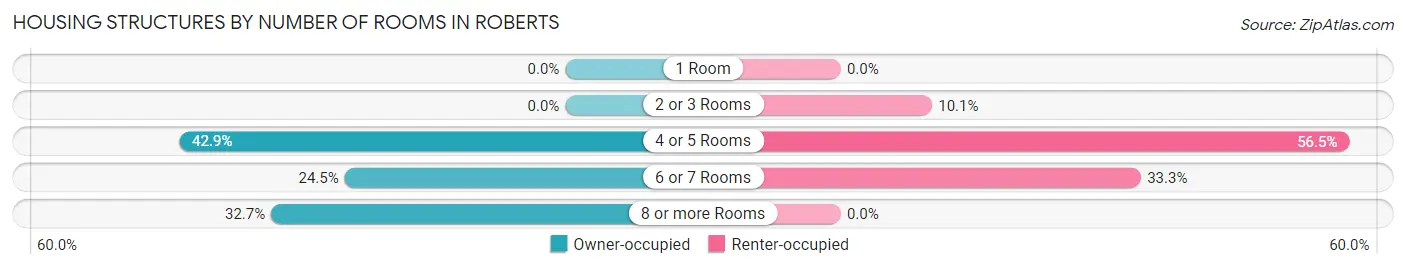
| Number of Rooms | Owner-occupied | Renter-occupied |
| 1 Room | 0 (0.0%) | 0 (0.0%) |
| 2 or 3 Rooms | 0 (0.0%) | 7 (10.1%) |
| 4 or 5 Rooms | 42 (42.9%) | 39 (56.5%) |
| 6 or 7 Rooms | 24 (24.5%) | 23 (33.3%) |
| 8 or more Rooms | 32 (32.7%) | 0 (0.0%) |
| Total | 98 (100.0%) | 69 (100.0%) |
Housing Structure by Heating Type in Roberts
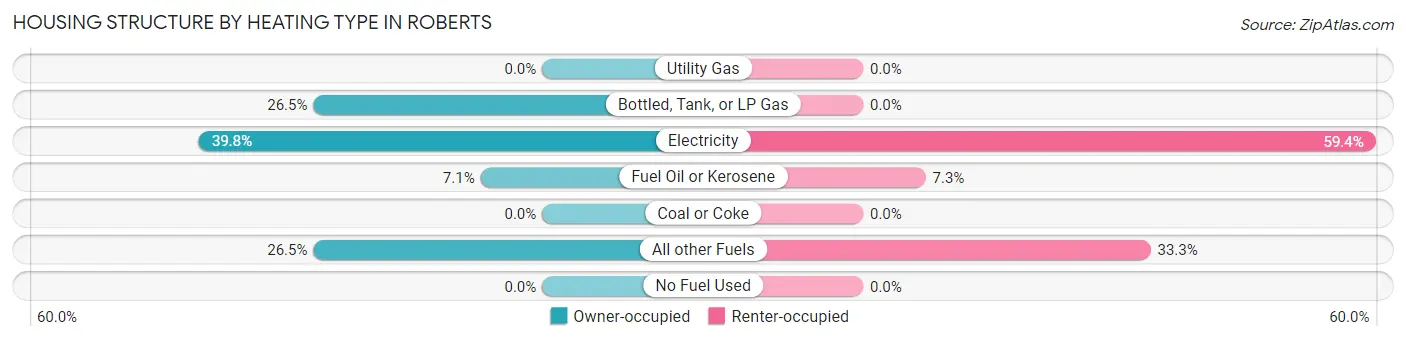
| Heating Type | Owner-occupied | Renter-occupied |
| Utility Gas | 0 (0.0%) | 0 (0.0%) |
| Bottled, Tank, or LP Gas | 26 (26.5%) | 0 (0.0%) |
| Electricity | 39 (39.8%) | 41 (59.4%) |
| Fuel Oil or Kerosene | 7 (7.1%) | 5 (7.2%) |
| Coal or Coke | 0 (0.0%) | 0 (0.0%) |
| All other Fuels | 26 (26.5%) | 23 (33.3%) |
| No Fuel Used | 0 (0.0%) | 0 (0.0%) |
| Total | 98 (100.0%) | 69 (100.0%) |
Household Vehicle Usage in Roberts
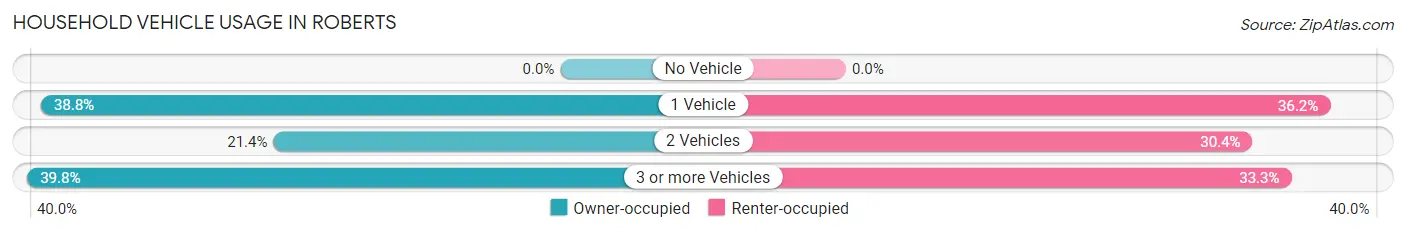
| Vehicles per Household | Owner-occupied | Renter-occupied |
| No Vehicle | 0 (0.0%) | 0 (0.0%) |
| 1 Vehicle | 38 (38.8%) | 25 (36.2%) |
| 2 Vehicles | 21 (21.4%) | 21 (30.4%) |
| 3 or more Vehicles | 39 (39.8%) | 23 (33.3%) |
| Total | 98 (100.0%) | 69 (100.0%) |
Real Estate & Mortgages in Roberts
Real Estate and Mortgage Overview in Roberts
| Characteristic | Without Mortgage | With Mortgage |
| Housing Units | 44 | 54 |
| Median Property Value | - | - |
| Median Household Income | $68,929 | $0 |
| Monthly Housing Costs | $525 | $0 |
| Real Estate Taxes | $776 | $2 |
Property Value by Mortgage Status in Roberts
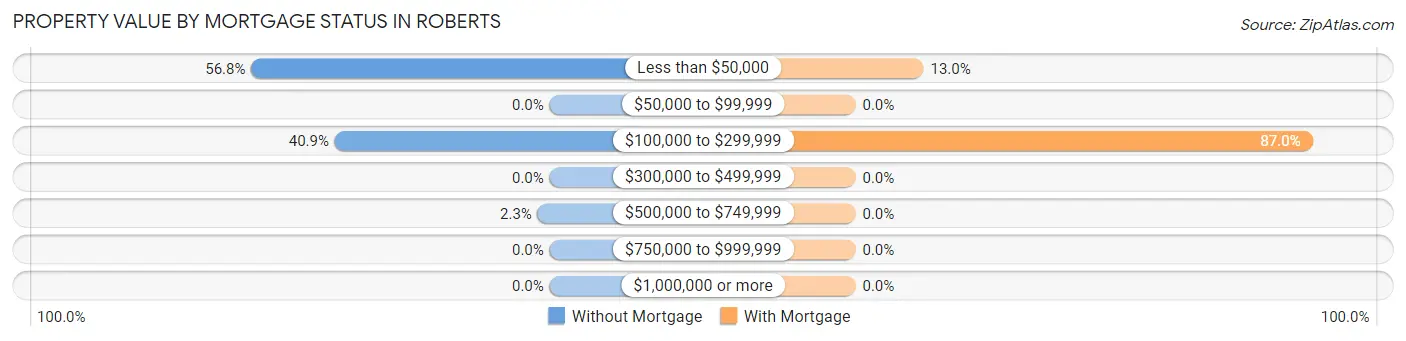
| Property Value | Without Mortgage | With Mortgage |
| Less than $50,000 | 25 (56.8%) | 7 (13.0%) |
| $50,000 to $99,999 | 0 (0.0%) | 0 (0.0%) |
| $100,000 to $299,999 | 18 (40.9%) | 47 (87.0%) |
| $300,000 to $499,999 | 0 (0.0%) | 0 (0.0%) |
| $500,000 to $749,999 | 1 (2.3%) | 0 (0.0%) |
| $750,000 to $999,999 | 0 (0.0%) | 0 (0.0%) |
| $1,000,000 or more | 0 (0.0%) | 0 (0.0%) |
| Total | 44 (100.0%) | 54 (100.0%) |
Household Income by Mortgage Status in Roberts
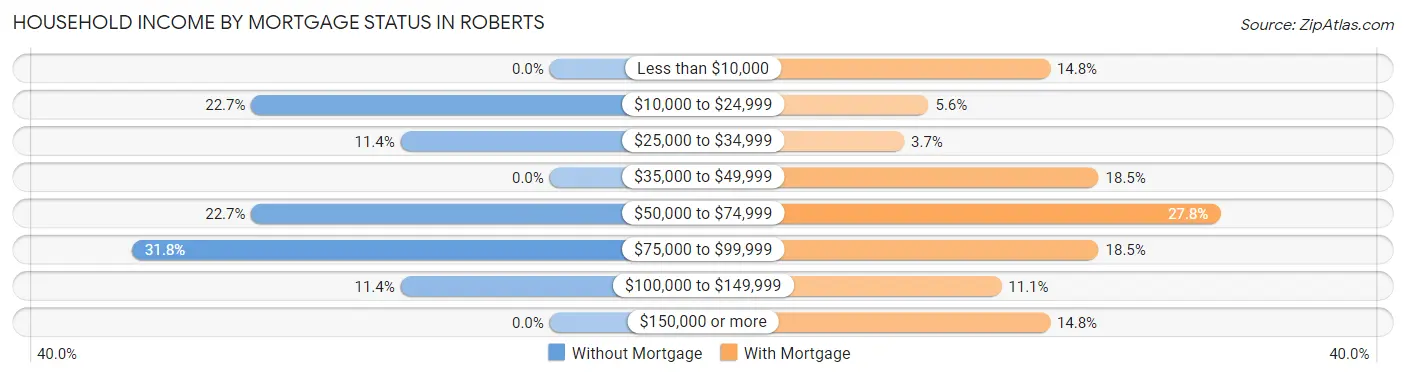
| Household Income | Without Mortgage | With Mortgage |
| Less than $10,000 | 0 (0.0%) | 8 (14.8%) |
| $10,000 to $24,999 | 10 (22.7%) | 3 (5.6%) |
| $25,000 to $34,999 | 5 (11.4%) | 2 (3.7%) |
| $35,000 to $49,999 | 0 (0.0%) | 10 (18.5%) |
| $50,000 to $74,999 | 10 (22.7%) | 15 (27.8%) |
| $75,000 to $99,999 | 14 (31.8%) | 10 (18.5%) |
| $100,000 to $149,999 | 5 (11.4%) | 6 (11.1%) |
| $150,000 or more | 0 (0.0%) | 8 (14.8%) |
| Total | 44 (100.0%) | 54 (100.0%) |
Property Value to Household Income Ratio in Roberts
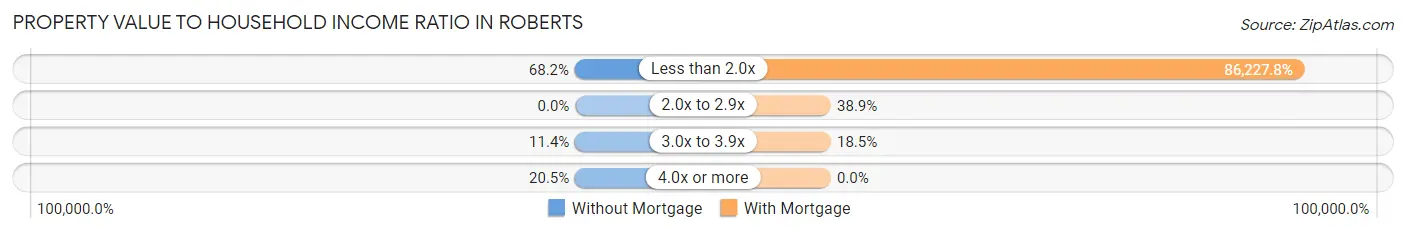
| Value-to-Income Ratio | Without Mortgage | With Mortgage |
| Less than 2.0x | 30 (68.2%) | 46,563 (86,227.8%) |
| 2.0x to 2.9x | 0 (0.0%) | 21 (38.9%) |
| 3.0x to 3.9x | 5 (11.4%) | 10 (18.5%) |
| 4.0x or more | 9 (20.4%) | 0 (0.0%) |
| Total | 44 (100.0%) | 54 (100.0%) |
Real Estate Taxes by Mortgage Status in Roberts
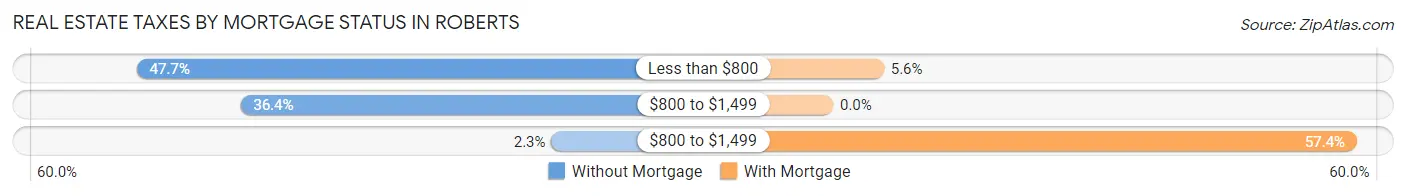
| Property Taxes | Without Mortgage | With Mortgage |
| Less than $800 | 21 (47.7%) | 3 (5.6%) |
| $800 to $1,499 | 16 (36.4%) | 0 (0.0%) |
| $800 to $1,499 | 1 (2.3%) | 31 (57.4%) |
| Total | 44 (100.0%) | 54 (100.0%) |
Health & Disability in Roberts
Health Insurance Coverage by Age in Roberts
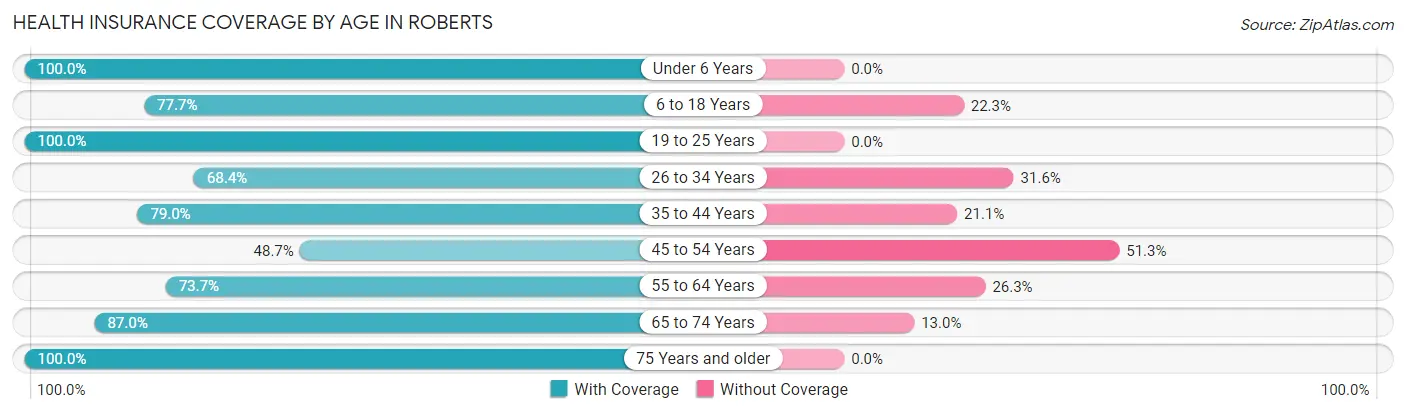
| Age Bracket | With Coverage | Without Coverage |
| Under 6 Years | 13 (100.0%) | 0 (0.0%) |
| 6 to 18 Years | 136 (77.7%) | 39 (22.3%) |
| 19 to 25 Years | 32 (100.0%) | 0 (0.0%) |
| 26 to 34 Years | 13 (68.4%) | 6 (31.6%) |
| 35 to 44 Years | 75 (78.9%) | 20 (21.0%) |
| 45 to 54 Years | 19 (48.7%) | 20 (51.3%) |
| 55 to 64 Years | 28 (73.7%) | 10 (26.3%) |
| 65 to 74 Years | 40 (87.0%) | 6 (13.0%) |
| 75 Years and older | 4 (100.0%) | 0 (0.0%) |
| Total | 360 (78.1%) | 101 (21.9%) |
Health Insurance Coverage by Citizenship Status in Roberts
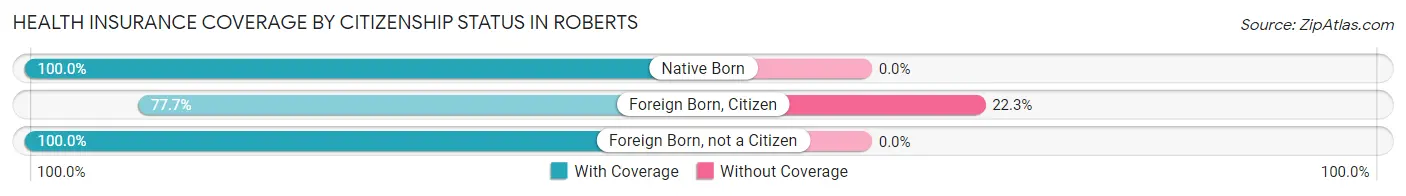
| Citizenship Status | With Coverage | Without Coverage |
| Native Born | 13 (100.0%) | 0 (0.0%) |
| Foreign Born, Citizen | 136 (77.7%) | 39 (22.3%) |
| Foreign Born, not a Citizen | 32 (100.0%) | 0 (0.0%) |
Health Insurance Coverage by Household Income in Roberts
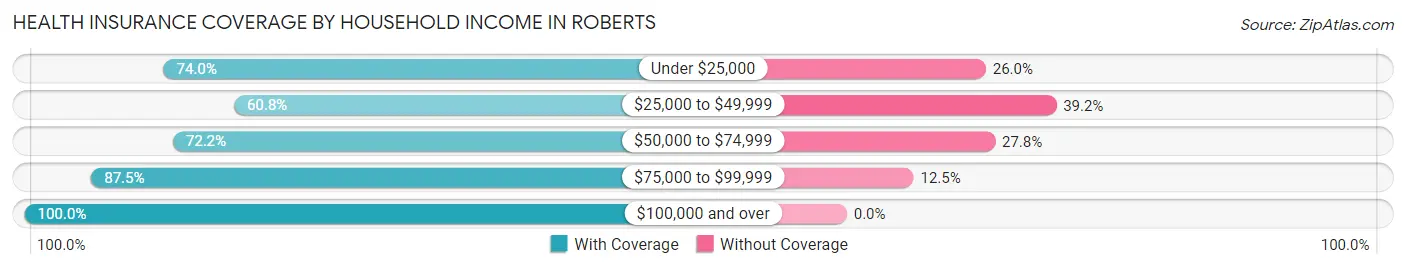
| Household Income | With Coverage | Without Coverage |
| Under $25,000 | 71 (74.0%) | 25 (26.0%) |
| $25,000 to $49,999 | 79 (60.8%) | 51 (39.2%) |
| $50,000 to $74,999 | 39 (72.2%) | 15 (27.8%) |
| $75,000 to $99,999 | 70 (87.5%) | 10 (12.5%) |
| $100,000 and over | 101 (100.0%) | 0 (0.0%) |
Public vs Private Health Insurance Coverage by Age in Roberts
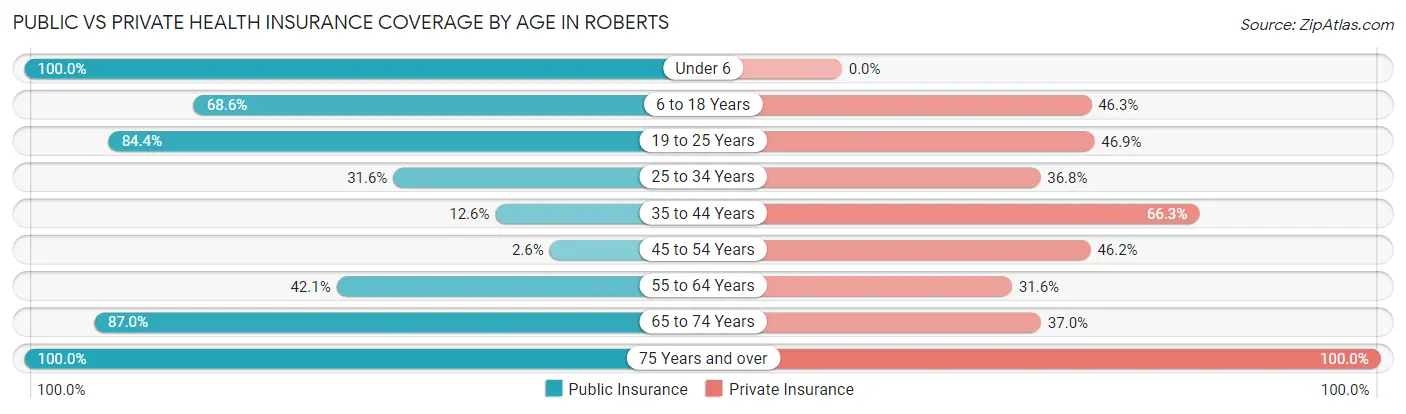
| Age Bracket | Public Insurance | Private Insurance |
| Under 6 | 13 (100.0%) | 0 (0.0%) |
| 6 to 18 Years | 120 (68.6%) | 81 (46.3%) |
| 19 to 25 Years | 27 (84.4%) | 15 (46.9%) |
| 25 to 34 Years | 6 (31.6%) | 7 (36.8%) |
| 35 to 44 Years | 12 (12.6%) | 63 (66.3%) |
| 45 to 54 Years | 1 (2.6%) | 18 (46.2%) |
| 55 to 64 Years | 16 (42.1%) | 12 (31.6%) |
| 65 to 74 Years | 40 (87.0%) | 17 (37.0%) |
| 75 Years and over | 4 (100.0%) | 4 (100.0%) |
| Total | 239 (51.8%) | 217 (47.1%) |
Disability Status by Sex by Age in Roberts
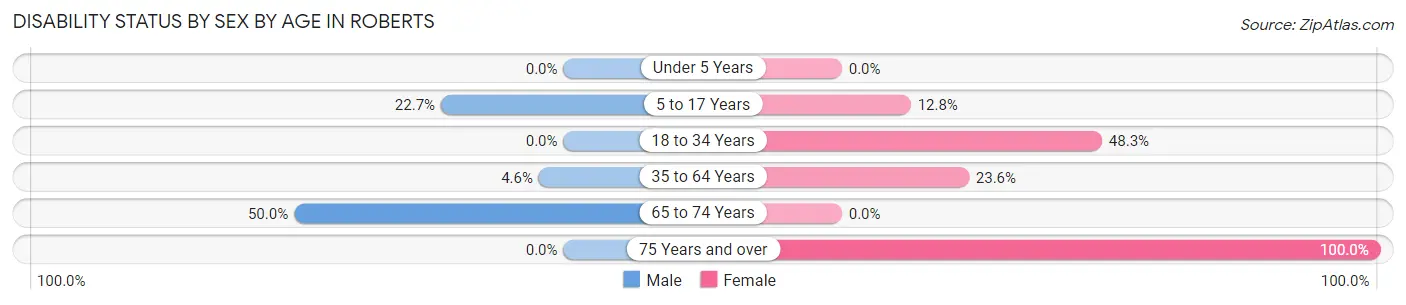
| Age Bracket | Male | Female |
| Under 5 Years | 0 (0.0%) | 0 (0.0%) |
| 5 to 17 Years | 20 (22.7%) | 11 (12.8%) |
| 18 to 34 Years | 0 (0.0%) | 14 (48.3%) |
| 35 to 64 Years | 3 (4.5%) | 25 (23.6%) |
| 65 to 74 Years | 12 (50.0%) | 0 (0.0%) |
| 75 Years and over | 0 (0.0%) | 4 (100.0%) |
Disability Class by Sex by Age in Roberts
Disability Class: Hearing Difficulty
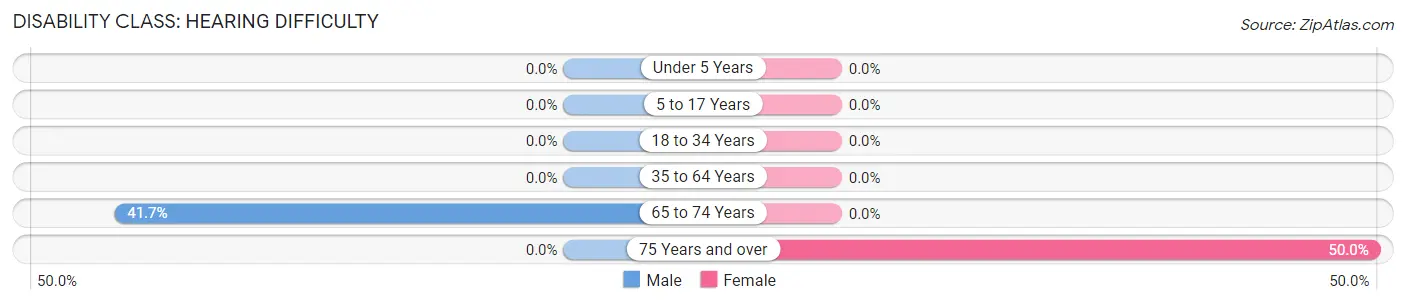
| Age Bracket | Male | Female |
| Under 5 Years | 0 (0.0%) | 0 (0.0%) |
| 5 to 17 Years | 0 (0.0%) | 0 (0.0%) |
| 18 to 34 Years | 0 (0.0%) | 0 (0.0%) |
| 35 to 64 Years | 0 (0.0%) | 0 (0.0%) |
| 65 to 74 Years | 10 (41.7%) | 0 (0.0%) |
| 75 Years and over | 0 (0.0%) | 2 (50.0%) |
Disability Class: Vision Difficulty
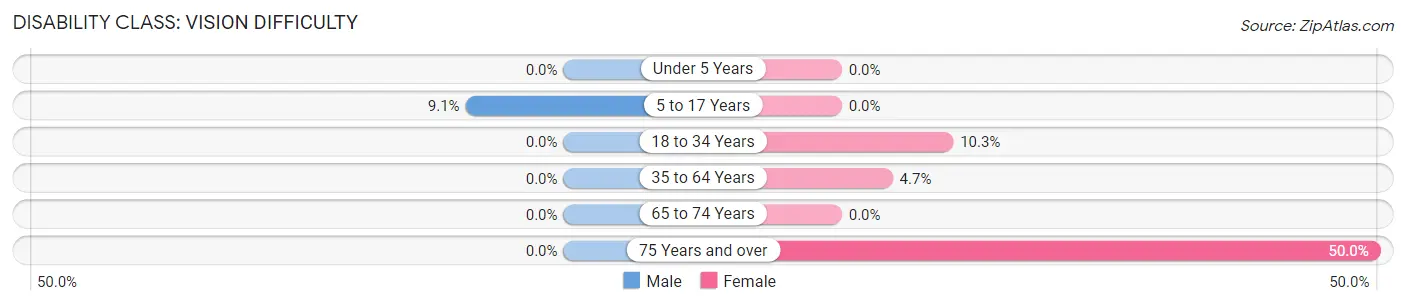
| Age Bracket | Male | Female |
| Under 5 Years | 0 (0.0%) | 0 (0.0%) |
| 5 to 17 Years | 8 (9.1%) | 0 (0.0%) |
| 18 to 34 Years | 0 (0.0%) | 3 (10.3%) |
| 35 to 64 Years | 0 (0.0%) | 5 (4.7%) |
| 65 to 74 Years | 0 (0.0%) | 0 (0.0%) |
| 75 Years and over | 0 (0.0%) | 2 (50.0%) |
Disability Class: Cognitive Difficulty
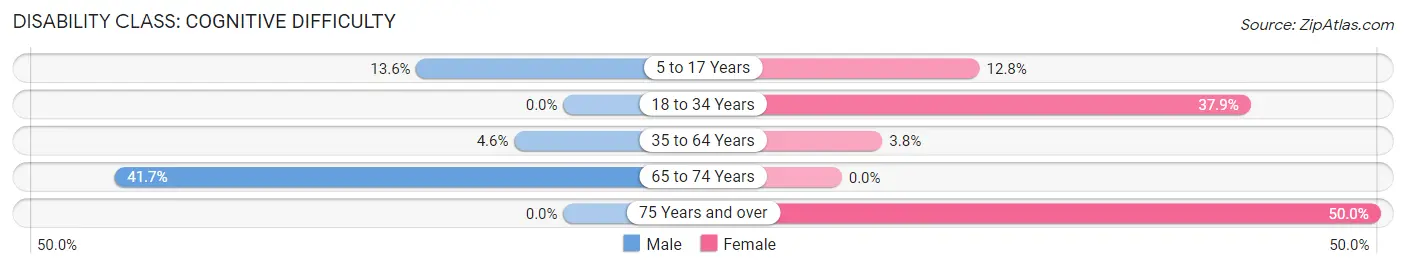
| Age Bracket | Male | Female |
| 5 to 17 Years | 12 (13.6%) | 11 (12.8%) |
| 18 to 34 Years | 0 (0.0%) | 11 (37.9%) |
| 35 to 64 Years | 3 (4.5%) | 4 (3.8%) |
| 65 to 74 Years | 10 (41.7%) | 0 (0.0%) |
| 75 Years and over | 0 (0.0%) | 2 (50.0%) |
Disability Class: Ambulatory Difficulty
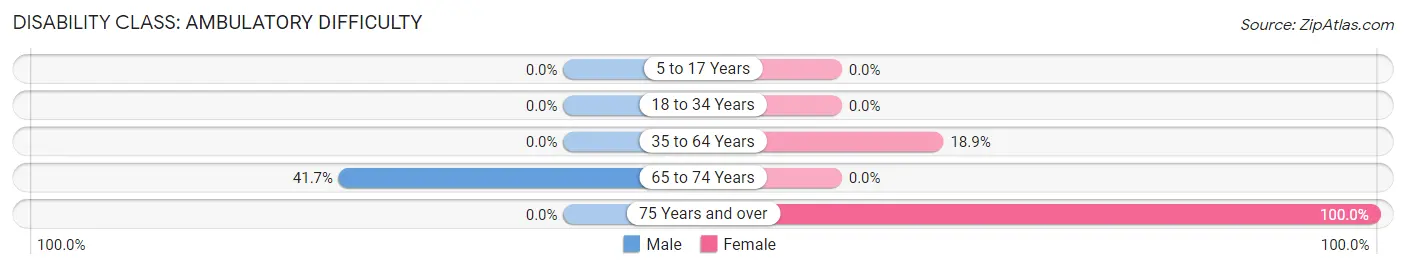
| Age Bracket | Male | Female |
| 5 to 17 Years | 0 (0.0%) | 0 (0.0%) |
| 18 to 34 Years | 0 (0.0%) | 0 (0.0%) |
| 35 to 64 Years | 0 (0.0%) | 20 (18.9%) |
| 65 to 74 Years | 10 (41.7%) | 0 (0.0%) |
| 75 Years and over | 0 (0.0%) | 4 (100.0%) |
Disability Class: Self-Care Difficulty
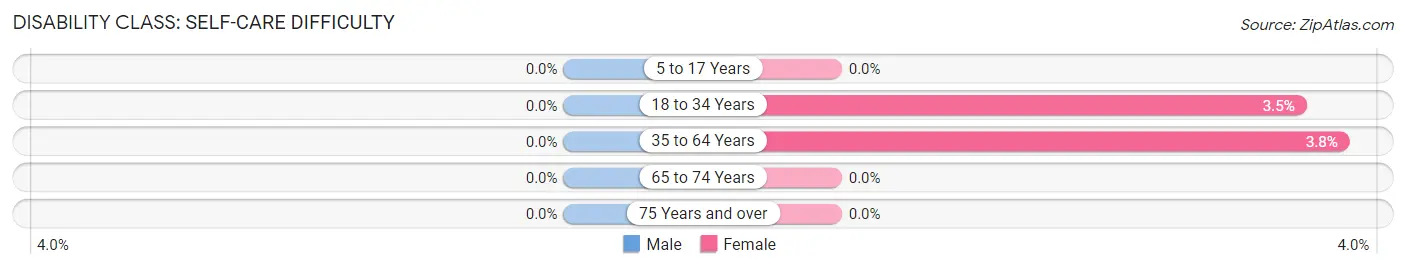
| Age Bracket | Male | Female |
| 5 to 17 Years | 0 (0.0%) | 0 (0.0%) |
| 18 to 34 Years | 0 (0.0%) | 1 (3.5%) |
| 35 to 64 Years | 0 (0.0%) | 4 (3.8%) |
| 65 to 74 Years | 0 (0.0%) | 0 (0.0%) |
| 75 Years and over | 0 (0.0%) | 0 (0.0%) |
Technology Access in Roberts
Computing Device Access in Roberts
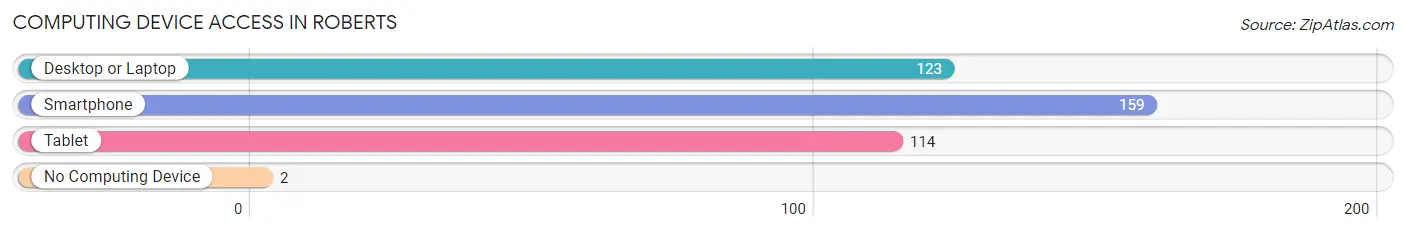
| Device Type | # Households | % Households |
| Desktop or Laptop | 123 | 73.7% |
| Smartphone | 159 | 95.2% |
| Tablet | 114 | 68.3% |
| No Computing Device | 2 | 1.2% |
| Total | 167 | 100.0% |
Internet Access in Roberts
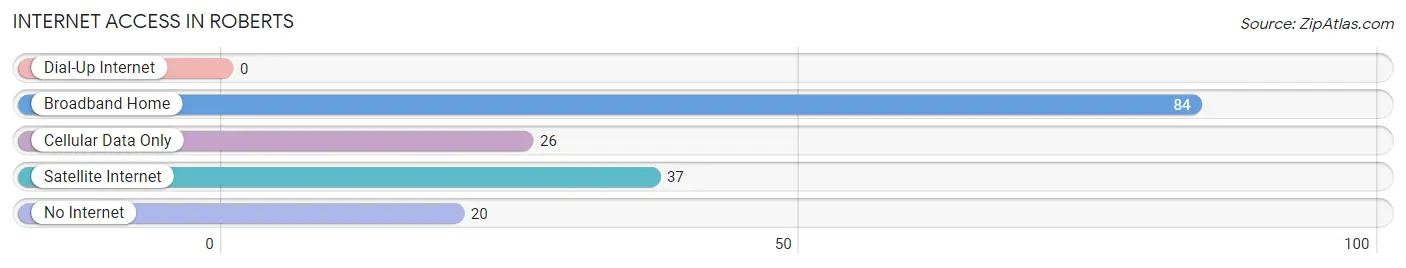
| Internet Type | # Households | % Households |
| Dial-Up Internet | 0 | 0.0% |
| Broadband Home | 84 | 50.3% |
| Cellular Data Only | 26 | 15.6% |
| Satellite Internet | 37 | 22.2% |
| No Internet | 20 | 12.0% |
| Total | 167 | 100.0% |
Roberts Summary
Idaho is a state located in the northwestern region of the United States. It is bordered by Montana to the east, Wyoming to the east, Nevada and Utah to the south, and Washington and Oregon to the west. Idaho is the 14th largest state in the United States, with an area of 83,574 square miles, and the 11th most populous, with a population of 1.7 million as of 2019. Idaho is known for its rugged terrain, diverse wildlife, and abundant natural resources.
History
The area that is now Idaho has been inhabited by Native American tribes for thousands of years. The first Europeans to explore the area were members of the Lewis and Clark Expedition, who arrived in 1805. The area was part of the Oregon Territory until 1863, when it became part of the Idaho Territory. Idaho became the 43rd state in the Union on July 3, 1890.
Geography
Idaho is located in the northwestern region of the United States. It is bordered by Montana to the east, Wyoming to the east, Nevada and Utah to the south, and Washington and Oregon to the west. Idaho is the 14th largest state in the United States, with an area of 83,574 square miles.
The state is divided into two distinct regions: the Rocky Mountains in the north and the Great Plains in the south. The Rocky Mountains are home to some of the highest peaks in the United States, including Mount Borah, which is the highest point in the state at 12,662 feet. The Great Plains are characterized by rolling hills and wide open spaces.
Economy
Idaho’s economy is largely based on agriculture, forestry, and mining. The state is the largest producer of potatoes in the United States, and is also a major producer of wheat, barley, and other grains. Idaho is also home to a large timber industry, and is the second-largest producer of lumber in the United States. Mining is also an important part of the state’s economy, with silver, gold, and phosphate being the most important minerals.
The state’s economy is also bolstered by its tourism industry. Idaho is home to numerous national parks and monuments, including Yellowstone National Park, Grand Teton National Park, and Craters of the Moon National Monument.
Demographics
As of 2019, Idaho had a population of 1.7 million. The state is predominantly white, with 87.3% of the population identifying as white. The largest minority group is Hispanic or Latino, which makes up 8.7% of the population. Other minority groups include Native American (1.7%), Asian (1.3%), and African American (0.7%).
The median household income in Idaho is $53,817, and the median home value is $219,400. The state’s unemployment rate is 3.2%, which is lower than the national average of 3.7%.
Conclusion
Idaho is a state located in the northwestern region of the United States. It is bordered by Montana to the east, Wyoming to the east, Nevada and Utah to the south, and Washington and Oregon to the west. Idaho is the 14th largest state in the United States, with an area of 83,574 square miles, and the 11th most populous, with a population of 1.7 million as of 2019. Idaho is known for its rugged terrain, diverse wildlife, and abundant natural resources. The state’s economy is largely based on agriculture, forestry, and mining, and is also bolstered by its tourism industry. The population of Idaho is predominantly white, with 87.3% of the population identifying as white. The median household income in Idaho is $53,817, and the median home value is $219,400.
Common Questions
What is the Total Population of Roberts?
Total Population of Roberts is 461.
What is the Total Male Population of Roberts?
Total Male Population of Roberts is 212.
What is the Total Female Population of Roberts?
Total Female Population of Roberts is 249.
What is the Ratio of Males per 100 Females in Roberts?
There are 85.14 Males per 100 Females in Roberts.
What is the Ratio of Females per 100 Males in Roberts?
There are 117.45 Females per 100 Males in Roberts.
What is the Median Population Age in Roberts?
Median Population Age in Roberts is 32.8 Years.
What is the Average Family Size in Roberts
Average Family Size in Roberts is 3.0 People.
What is the Average Household Size in Roberts
Average Household Size in Roberts is 2.8 People.
What is Per Capita Income in Roberts?
Per Capita income in Roberts is $20,464.
What is the Median Family Income in Roberts?
Median Family Income in Roberts is $63,000.
What is the Median Household income in Roberts?
Median Household Income in Roberts is $45,156.
What is Income or Wage Gap in Roberts?
Income or Wage Gap in Roberts is 68.8%.
Women in Roberts earn 31.2 cents for every dollar earned by a man.
What is Inequality or Gini Index in Roberts?
Inequality or Gini Index in Roberts is 0.39.
How Large is the Labor Force in Roberts?
There are 226 People in the Labor Forcein in Roberts.
What is the Percentage of People in the Labor Force in Roberts?
66.1% of People are in the Labor Force in Roberts.
What is the Unemployment Rate in Roberts?
Unemployment Rate in Roberts is 9.7%.