Pierce, ID
Pierce Map
Pierce Overview
388
TOTAL POPULATION
232
MALE POPULATION
156
FEMALE POPULATION
148.72
MALES / 100 FEMALES
67.24
FEMALES / 100 MALES
60.6
MEDIAN AGE
2.8
AVG FAMILY SIZE
2.1
AVG HOUSEHOLD SIZE
$37,483
PER CAPITA INCOME
$69,500
AVG FAMILY INCOME
$44,643
AVG HOUSEHOLD INCOME
7.6%
WAGE / INCOME GAP [ % ]
92.4¢/ $1
WAGE / INCOME GAP [ $ ]
0.51
INEQUALITY / GINI INDEX
155
LABOR FORCE [ PEOPLE ]
45.7%
PERCENT IN LABOR FORCE
2.6%
UNEMPLOYMENT RATE
Pierce Zip Codes
Pierce Area Codes
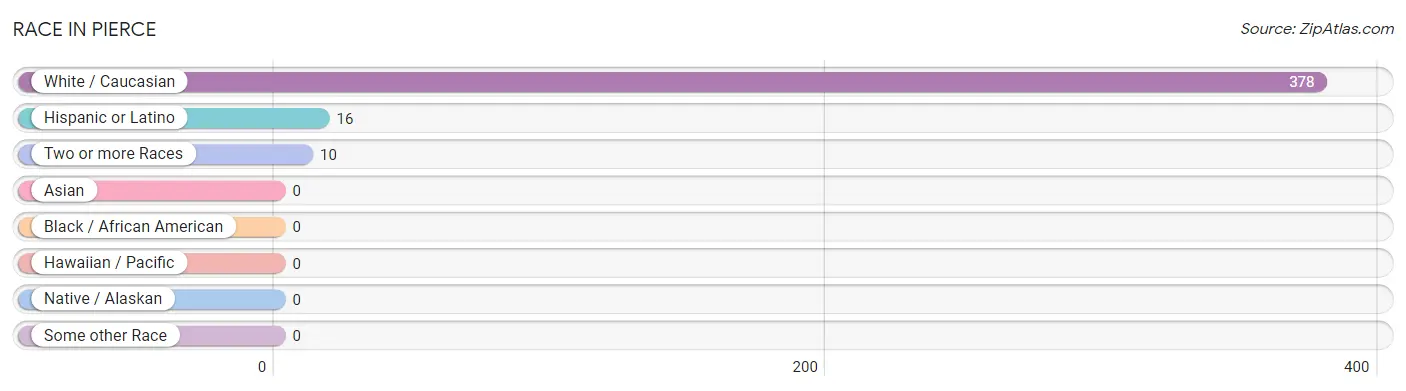
Race in Pierce
The most populous races in Pierce are White / Caucasian (378 | 97.4%), Hispanic or Latino (16 | 4.1%), and Two or more Races (10 | 2.6%).
| Race | # Population | % Population |
| Asian | 0 | 0.0% |
| Black / African American | 0 | 0.0% |
| Hawaiian / Pacific | 0 | 0.0% |
| Hispanic or Latino | 16 | 4.1% |
| Native / Alaskan | 0 | 0.0% |
| White / Caucasian | 378 | 97.4% |
| Two or more Races | 10 | 2.6% |
| Some other Race | 0 | 0.0% |
| Total | 388 | 100.0% |
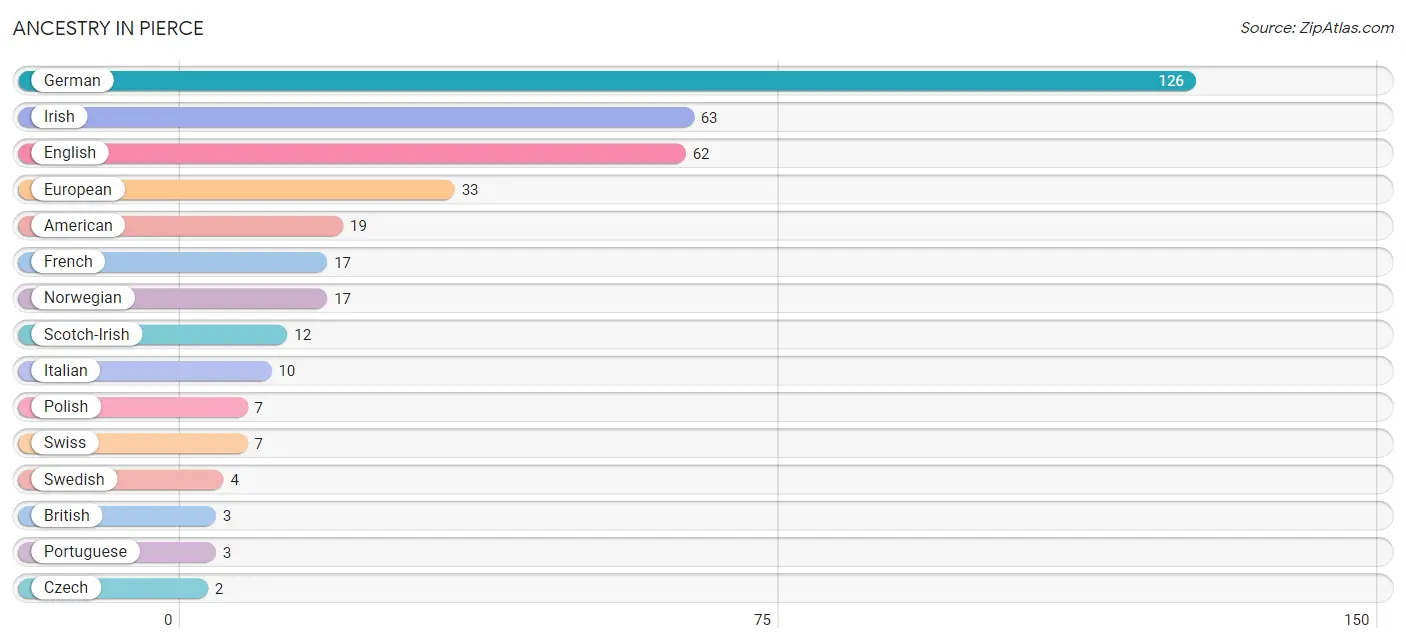
Ancestry in Pierce
The most populous ancestries reported in Pierce are German (126 | 32.5%), Irish (63 | 16.2%), English (62 | 16.0%), European (33 | 8.5%), and American (19 | 4.9%), together accounting for 78.1% of all Pierce residents.
| Ancestry | # Population | % Population |
| American | 19 | 4.9% |
| British | 3 | 0.8% |
| Cherokee | 1 | 0.3% |
| Czech | 2 | 0.5% |
| English | 62 | 16.0% |
| European | 33 | 8.5% |
| French | 17 | 4.4% |
| German | 126 | 32.5% |
| Irish | 63 | 16.2% |
| Italian | 10 | 2.6% |
| Norwegian | 17 | 4.4% |
| Polish | 7 | 1.8% |
| Portuguese | 3 | 0.8% |
| Scotch-Irish | 12 | 3.1% |
| Spanish | 2 | 0.5% |
| Swedish | 4 | 1.0% |
| Swiss | 7 | 1.8% | View All 17 Rows |
Immigrants in Pierce

| Immigration Origin | # Population | % Population | View All 0 Rows |
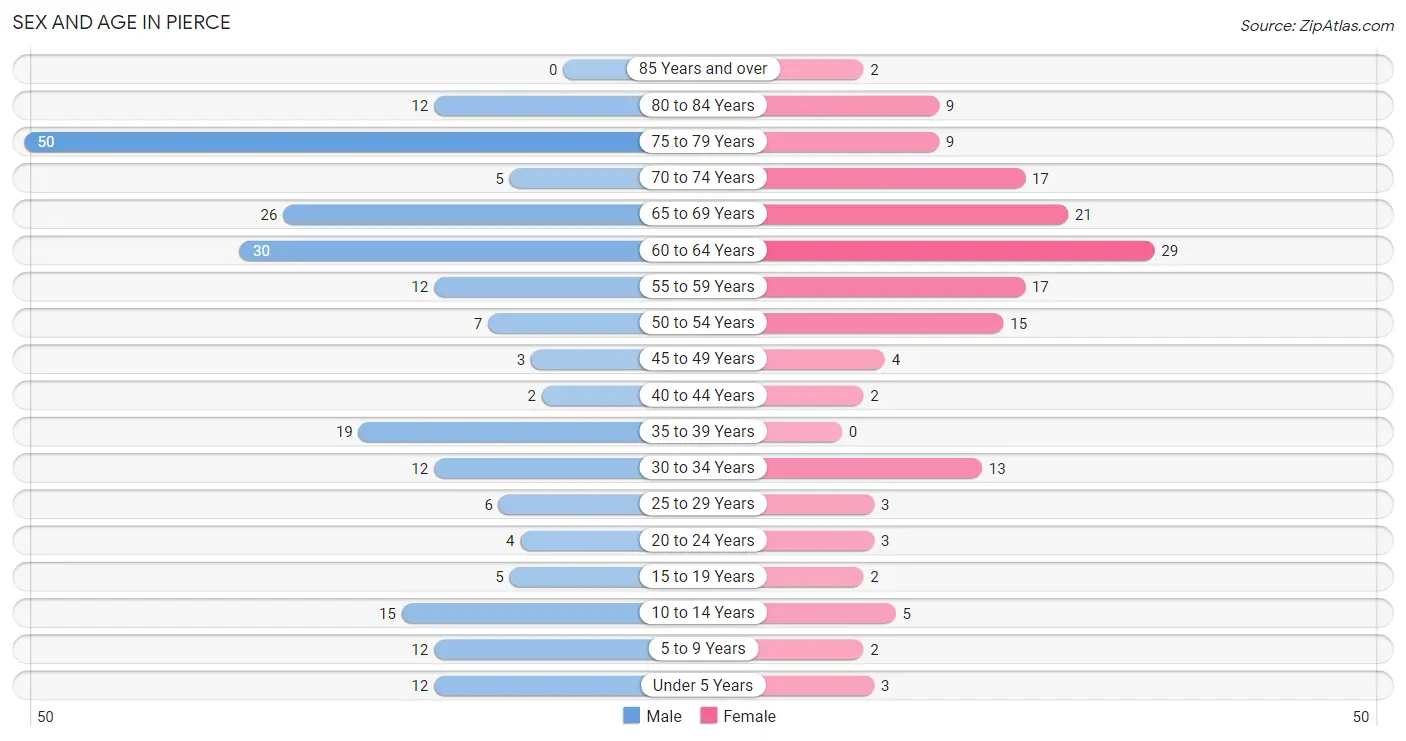
Sex and Age in Pierce
Sex and Age in Pierce
The most populous age groups in Pierce are 75 to 79 Years (50 | 21.5%) for men and 60 to 64 Years (29 | 18.6%) for women.
| Age Bracket | Male | Female |
| Under 5 Years | 12 (5.2%) | 3 (1.9%) |
| 5 to 9 Years | 12 (5.2%) | 2 (1.3%) |
| 10 to 14 Years | 15 (6.5%) | 5 (3.2%) |
| 15 to 19 Years | 5 (2.2%) | 2 (1.3%) |
| 20 to 24 Years | 4 (1.7%) | 3 (1.9%) |
| 25 to 29 Years | 6 (2.6%) | 3 (1.9%) |
| 30 to 34 Years | 12 (5.2%) | 13 (8.3%) |
| 35 to 39 Years | 19 (8.2%) | 0 (0.0%) |
| 40 to 44 Years | 2 (0.9%) | 2 (1.3%) |
| 45 to 49 Years | 3 (1.3%) | 4 (2.6%) |
| 50 to 54 Years | 7 (3.0%) | 15 (9.6%) |
| 55 to 59 Years | 12 (5.2%) | 17 (10.9%) |
| 60 to 64 Years | 30 (12.9%) | 29 (18.6%) |
| 65 to 69 Years | 26 (11.2%) | 21 (13.5%) |
| 70 to 74 Years | 5 (2.2%) | 17 (10.9%) |
| 75 to 79 Years | 50 (21.5%) | 9 (5.8%) |
| 80 to 84 Years | 12 (5.2%) | 9 (5.8%) |
| 85 Years and over | 0 (0.0%) | 2 (1.3%) |
| Total | 232 (100.0%) | 156 (100.0%) |
Families and Households in Pierce
Median Family Size in Pierce
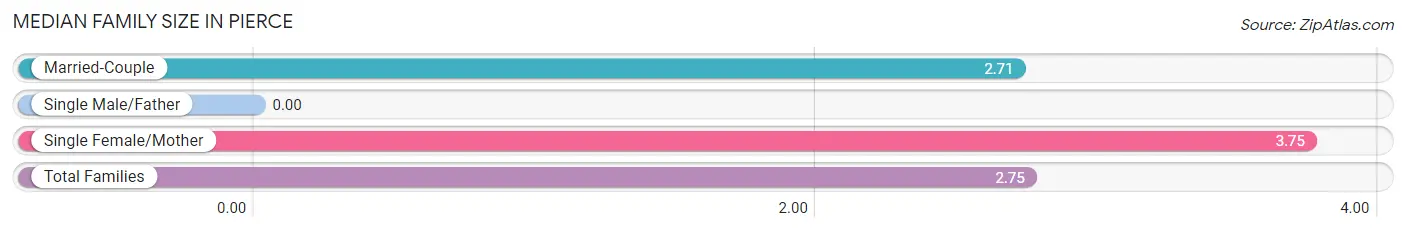
| Family Type | # Families | Family Size |
| Married-Couple | 98 (96.1%) | 2.71 |
| Single Male/Father | 0 (0.0%) | - |
| Single Female/Mother | 4 (3.9%) | 3.75 |
| Total Families | 102 (100.0%) | 2.75 |
Median Household Size in Pierce
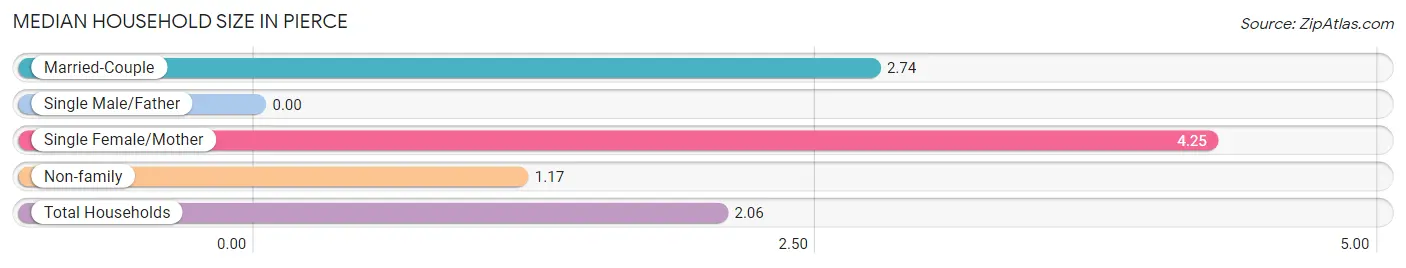
| Household Type | # Households | Household Size |
| Married-Couple | 98 (52.1%) | 2.74 |
| Single Male/Father | 0 (0.0%) | - |
| Single Female/Mother | 4 (2.1%) | 4.25 |
| Non-family | 86 (45.7%) | 1.17 |
| Total Households | 188 (100.0%) | 2.06 |
Household Size by Marriage Status in Pierce
Out of a total of 188 households in Pierce, 102 (54.3%) are family households, while 86 (45.7%) are nonfamily households. The most numerous type of family households are 2-person households, comprising 77, and the most common type of nonfamily households are 1-person households, comprising 70.
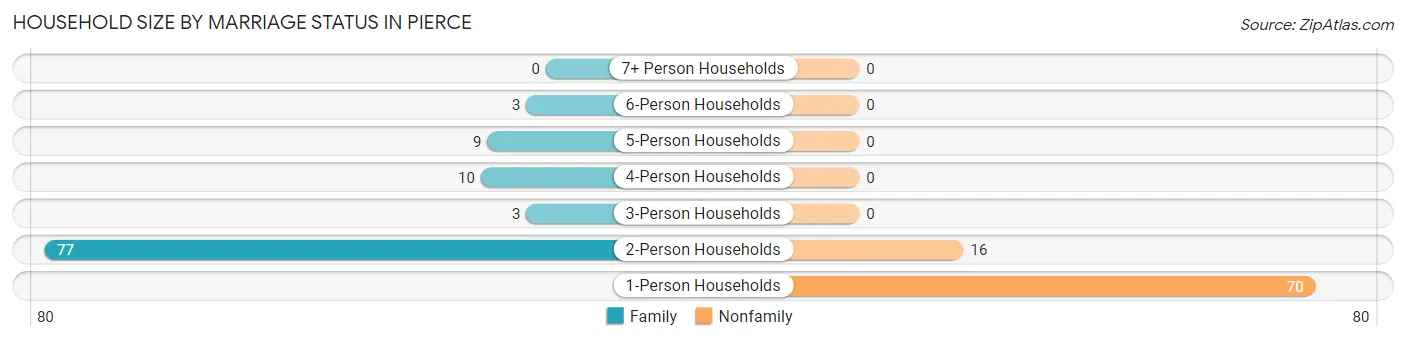
| Household Size | Family Households | Nonfamily Households |
| 1-Person Households | - | 70 (37.2%) |
| 2-Person Households | 77 (41.0%) | 16 (8.5%) |
| 3-Person Households | 3 (1.6%) | 0 (0.0%) |
| 4-Person Households | 10 (5.3%) | 0 (0.0%) |
| 5-Person Households | 9 (4.8%) | 0 (0.0%) |
| 6-Person Households | 3 (1.6%) | 0 (0.0%) |
| 7+ Person Households | 0 (0.0%) | 0 (0.0%) |
| Total | 102 (54.3%) | 86 (45.7%) |
Female Fertility in Pierce
Fertility by Age in Pierce
Average fertility rate in Pierce is 103.0 births per 1,000 women. Women in the age bracket of 20 to 34 years have the highest fertility rate with 158.0 births per 1,000 women. Women in the age bracket of 20 to 34 years acount for 100.0% of all women with births.
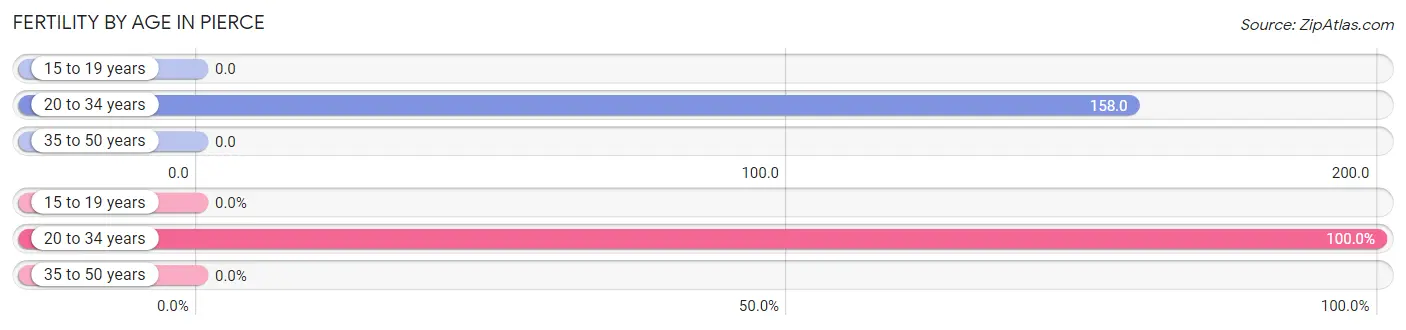
| Age Bracket | Women with Births | Births / 1,000 Women |
| 15 to 19 years | 0 (0.0%) | 0.0 |
| 20 to 34 years | 3 (100.0%) | 158.0 |
| 35 to 50 years | 0 (0.0%) | 0.0 |
| Total | 3 (100.0%) | 103.0 |
Fertility by Age by Marriage Status in Pierce
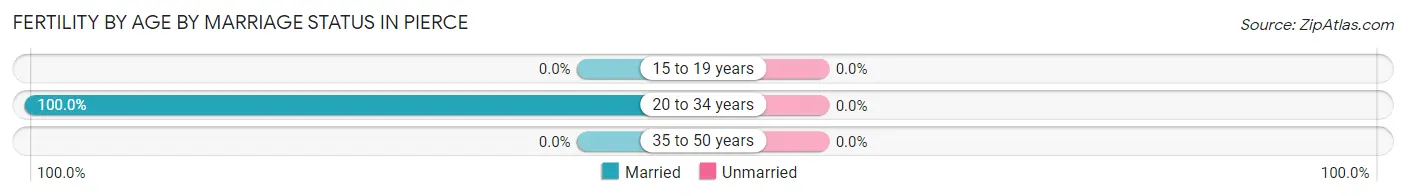
| Age Bracket | Married | Unmarried |
| 15 to 19 years | 0 (0.0%) | 0 (0.0%) |
| 20 to 34 years | 3 (100.0%) | 0 (0.0%) |
| 35 to 50 years | 0 (0.0%) | 0 (0.0%) |
| Total | 3 (100.0%) | 0 (0.0%) |
Fertility by Education in Pierce
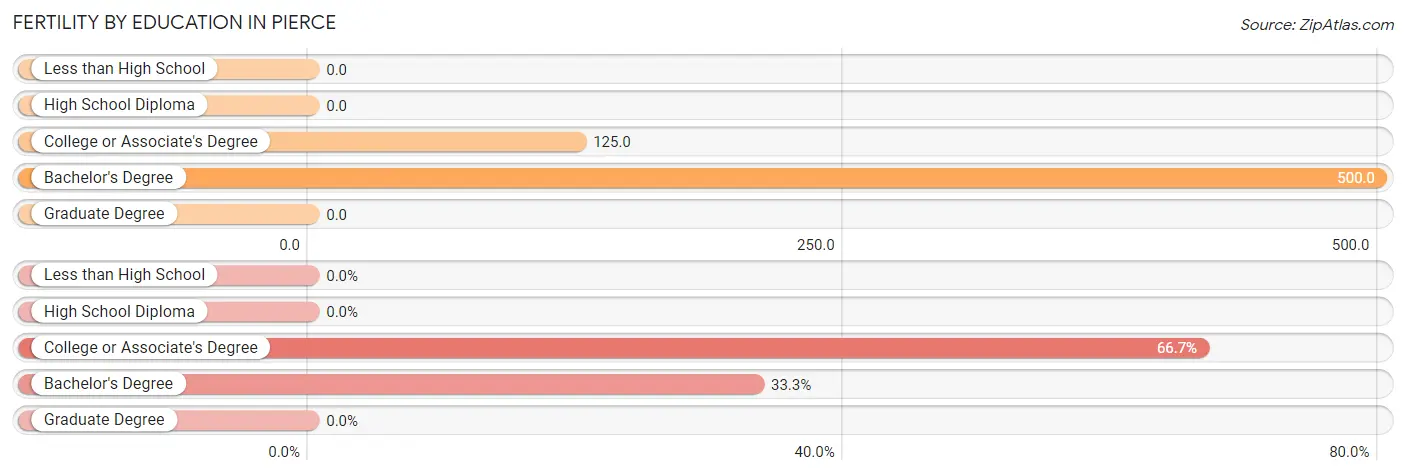
| Educational Attainment | Women with Births | Births / 1,000 Women |
| Less than High School | 0 (0.0%) | 0.0 |
| High School Diploma | 0 (0.0%) | 0.0 |
| College or Associate's Degree | 2 (66.7%) | 125.0 |
| Bachelor's Degree | 1 (33.3%) | 500.0 |
| Graduate Degree | 0 (0.0%) | 0.0 |
| Total | 3 (100.0%) | 103.0 |
Fertility by Education by Marriage Status in Pierce
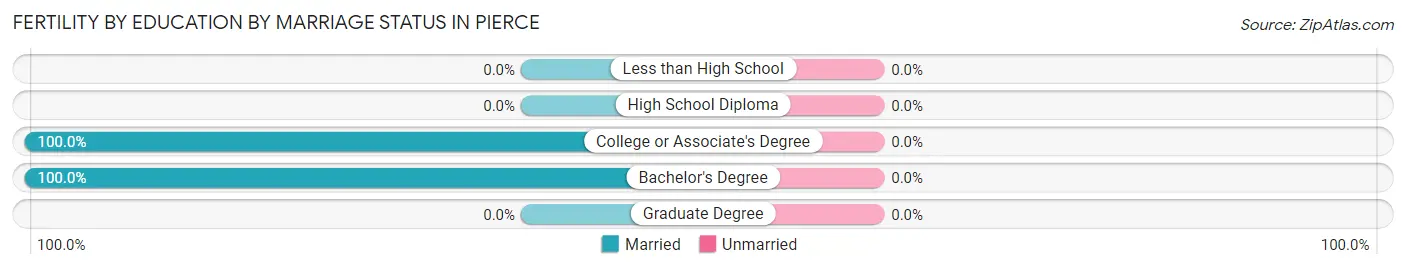
| Educational Attainment | Married | Unmarried |
| Less than High School | 0 (0.0%) | 0 (0.0%) |
| High School Diploma | 0 (0.0%) | 0 (0.0%) |
| College or Associate's Degree | 2 (100.0%) | 0 (0.0%) |
| Bachelor's Degree | 1 (100.0%) | 0 (0.0%) |
| Graduate Degree | 0 (0.0%) | 0 (0.0%) |
| Total | 3 (100.0%) | 0 (0.0%) |
Income in Pierce
Income Overview in Pierce
Per Capita Income in Pierce is $37,483, while median incomes of families and households are $69,500 and $44,643 respectively.
| Characteristic | Number | Measure |
| Per Capita Income | 388 | $37,483 |
| Median Family Income | 102 | $69,500 |
| Mean Family Income | 102 | $103,325 |
| Median Household Income | 188 | $44,643 |
| Mean Household Income | 188 | $73,914 |
| Income Deficit | 102 | $0 |
| Wage / Income Gap (%) | 388 | 7.58% |
| Wage / Income Gap ($) | 388 | 92.42¢ per $1 |
| Gini / Inequality Index | 388 | 0.51 |
Earnings by Sex in Pierce
Average Earnings in Pierce are $34,271, $33,214 for men and $35,938 for women, a difference of 7.6%.
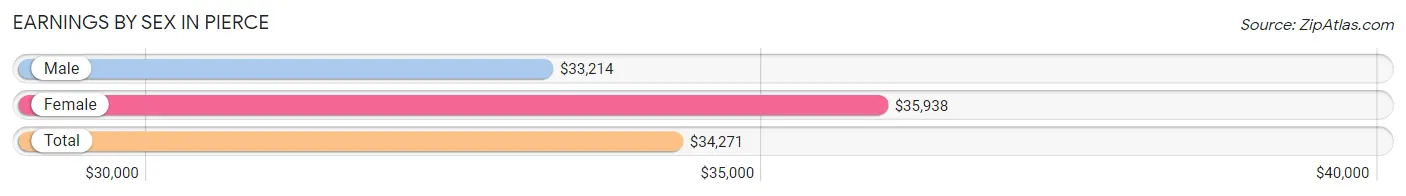
| Sex | Number | Average Earnings |
| Male | 100 (62.9%) | $33,214 |
| Female | 59 (37.1%) | $35,938 |
| Total | 159 (100.0%) | $34,271 |
Earnings by Sex by Income Bracket in Pierce
The most common earnings brackets in Pierce are $75,000 to $99,999 for men (20 | 20.0%) and $50,000 to $54,999 for women (9 | 15.2%).
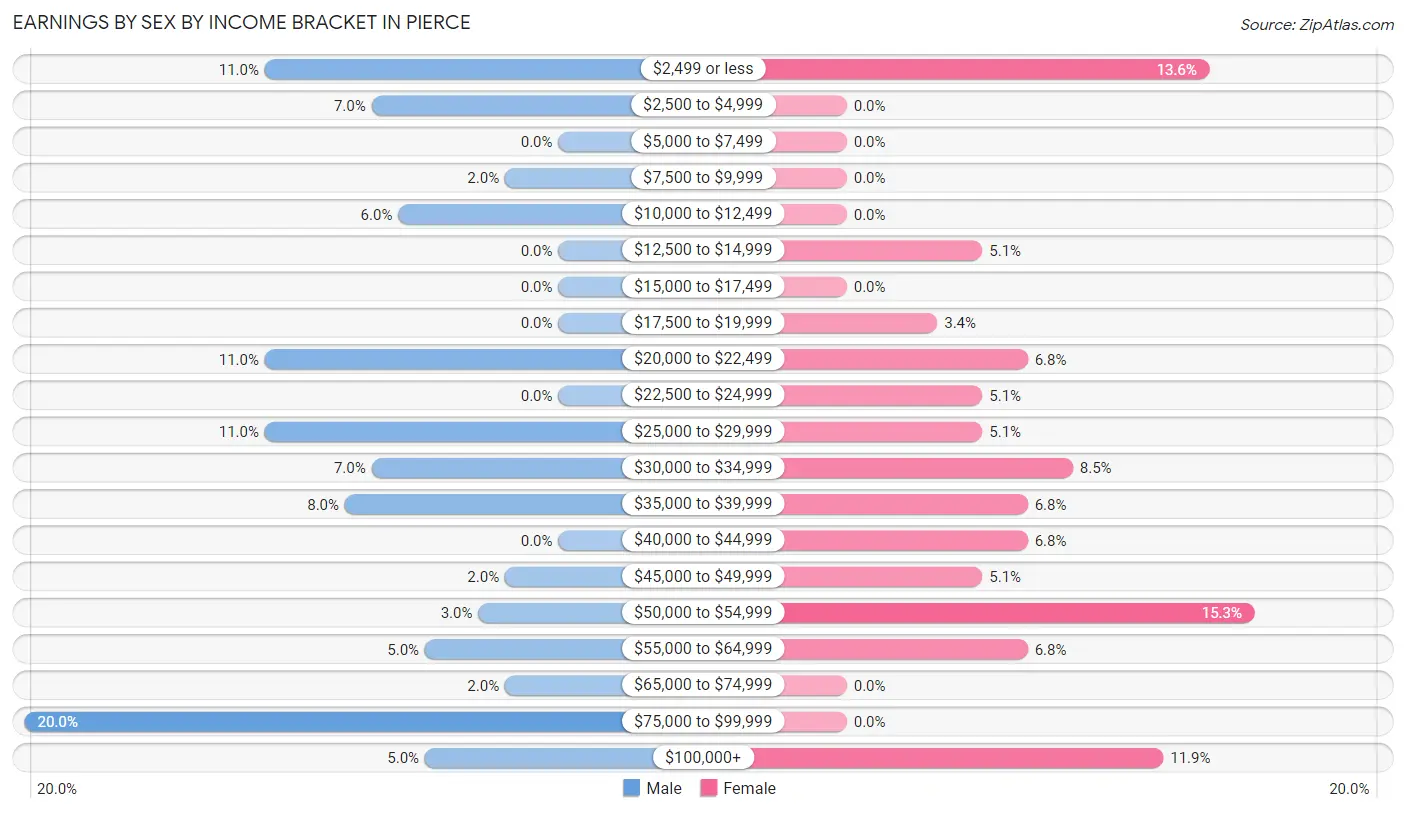
| Income | Male | Female |
| $2,499 or less | 11 (11.0%) | 8 (13.6%) |
| $2,500 to $4,999 | 7 (7.0%) | 0 (0.0%) |
| $5,000 to $7,499 | 0 (0.0%) | 0 (0.0%) |
| $7,500 to $9,999 | 2 (2.0%) | 0 (0.0%) |
| $10,000 to $12,499 | 6 (6.0%) | 0 (0.0%) |
| $12,500 to $14,999 | 0 (0.0%) | 3 (5.1%) |
| $15,000 to $17,499 | 0 (0.0%) | 0 (0.0%) |
| $17,500 to $19,999 | 0 (0.0%) | 2 (3.4%) |
| $20,000 to $22,499 | 11 (11.0%) | 4 (6.8%) |
| $22,500 to $24,999 | 0 (0.0%) | 3 (5.1%) |
| $25,000 to $29,999 | 11 (11.0%) | 3 (5.1%) |
| $30,000 to $34,999 | 7 (7.0%) | 5 (8.5%) |
| $35,000 to $39,999 | 8 (8.0%) | 4 (6.8%) |
| $40,000 to $44,999 | 0 (0.0%) | 4 (6.8%) |
| $45,000 to $49,999 | 2 (2.0%) | 3 (5.1%) |
| $50,000 to $54,999 | 3 (3.0%) | 9 (15.2%) |
| $55,000 to $64,999 | 5 (5.0%) | 4 (6.8%) |
| $65,000 to $74,999 | 2 (2.0%) | 0 (0.0%) |
| $75,000 to $99,999 | 20 (20.0%) | 0 (0.0%) |
| $100,000+ | 5 (5.0%) | 7 (11.9%) |
| Total | 100 (100.0%) | 59 (100.0%) |
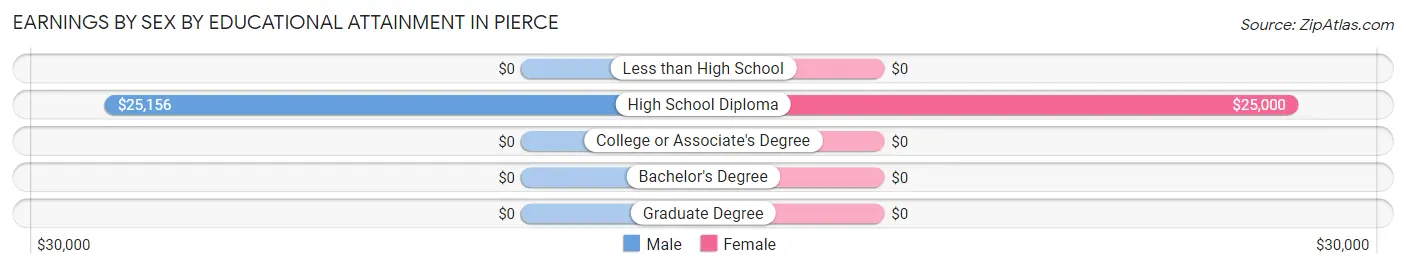
Earnings by Sex by Educational Attainment in Pierce
Average earnings in Pierce are $33,438 for men and $36,563 for women, a difference of 8.6%. Men with an educational attainment of high school diploma enjoy the highest average annual earnings of $25,156, while those with high school diploma education earn the least with $25,156. Women with an educational attainment of high school diploma earn the most with the average annual earnings of $25,000, while those with high school diploma education have the smallest earnings of $25,000.
| Educational Attainment | Male Income | Female Income |
| Less than High School | - | - |
| High School Diploma | $25,156 | $25,000 |
| College or Associate's Degree | - | - |
| Bachelor's Degree | - | - |
| Graduate Degree | - | - |
| Total | $33,438 | $36,563 |
Family Income in Pierce
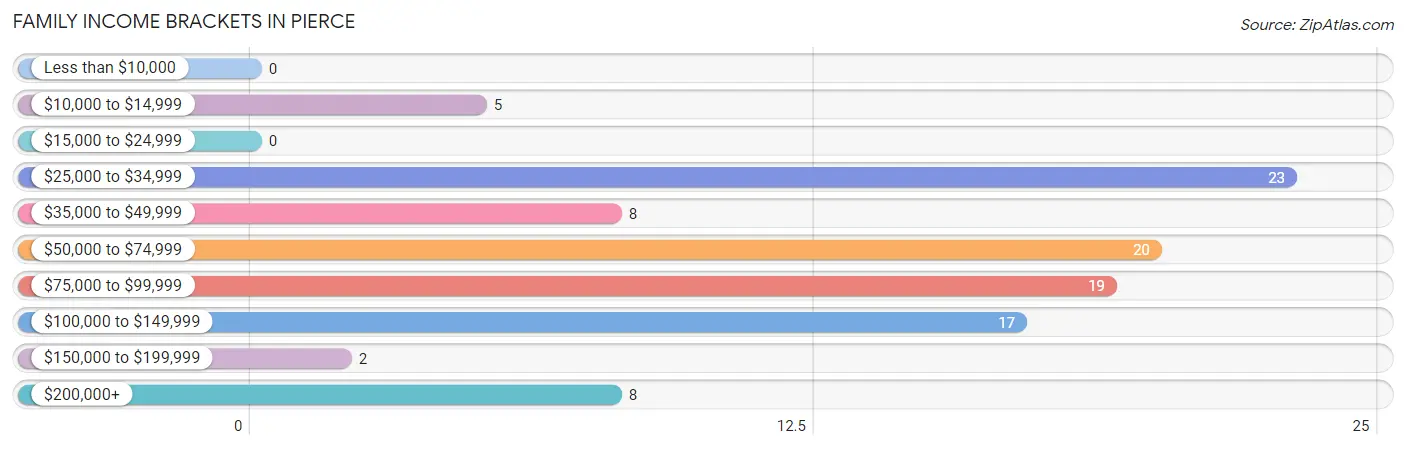
Family Income Brackets in Pierce
According to the Pierce family income data, there are 23 families falling into the $25,000 to $34,999 income range, which is the most common income bracket and makes up 22.6% of all families.
| Income Bracket | # Families | % Families |
| Less than $10,000 | 0 | 0.0% |
| $10,000 to $14,999 | 5 | 4.9% |
| $15,000 to $24,999 | 0 | 0.0% |
| $25,000 to $34,999 | 23 | 22.5% |
| $35,000 to $49,999 | 8 | 7.8% |
| $50,000 to $74,999 | 20 | 19.6% |
| $75,000 to $99,999 | 19 | 18.6% |
| $100,000 to $149,999 | 17 | 16.7% |
| $150,000 to $199,999 | 2 | 2.0% |
| $200,000+ | 8 | 7.8% |
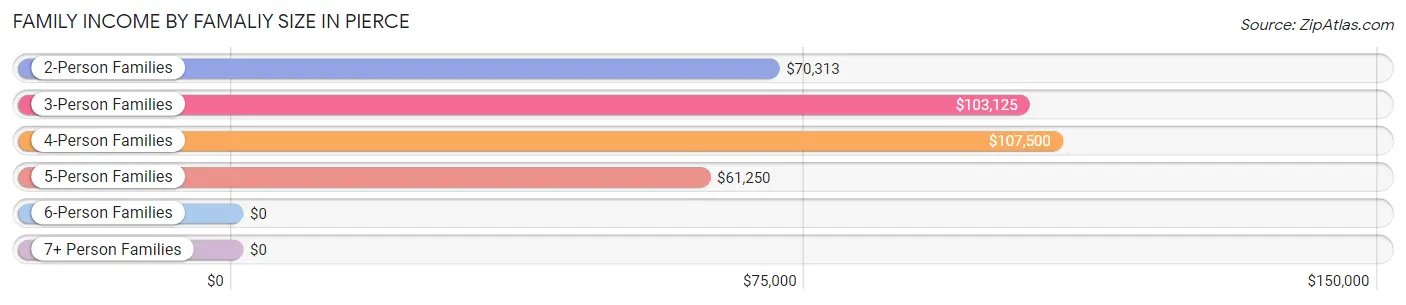
Family Income by Famaliy Size in Pierce
4-person families (8 | 7.8%) account for the highest median family income in Pierce with $107,500 per family, while 2-person families (77 | 75.5%) have the highest median income of $35,156 per family member.
| Income Bracket | # Families | Median Income |
| 2-Person Families | 77 (75.5%) | $70,313 |
| 3-Person Families | 5 (4.9%) | $103,125 |
| 4-Person Families | 8 (7.8%) | $107,500 |
| 5-Person Families | 12 (11.8%) | $61,250 |
| 6-Person Families | 0 (0.0%) | $0 |
| 7+ Person Families | 0 (0.0%) | $0 |
| Total | 102 (100.0%) | $69,500 |
Family Income by Number of Earners in Pierce
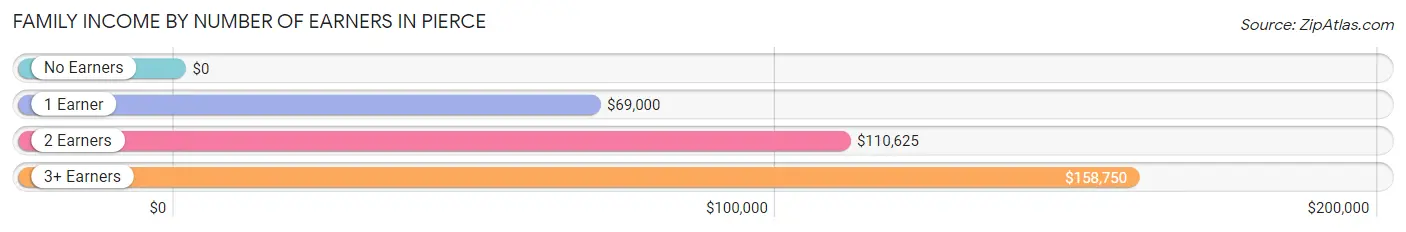
| Number of Earners | # Families | Median Income |
| No Earners | 38 (37.2%) | $0 |
| 1 Earner | 30 (29.4%) | $69,000 |
| 2 Earners | 30 (29.4%) | $110,625 |
| 3+ Earners | 4 (3.9%) | $158,750 |
| Total | 102 (100.0%) | $69,500 |
Household Income in Pierce
Household Income Brackets in Pierce
With 36 households falling in the category, the $25,000 to $34,999 income range is the most frequent in Pierce, accounting for 19.2% of all households. In contrast, only 4 households (2.1%) fall into the $150,000 to $199,999 income bracket, making it the least populous group.
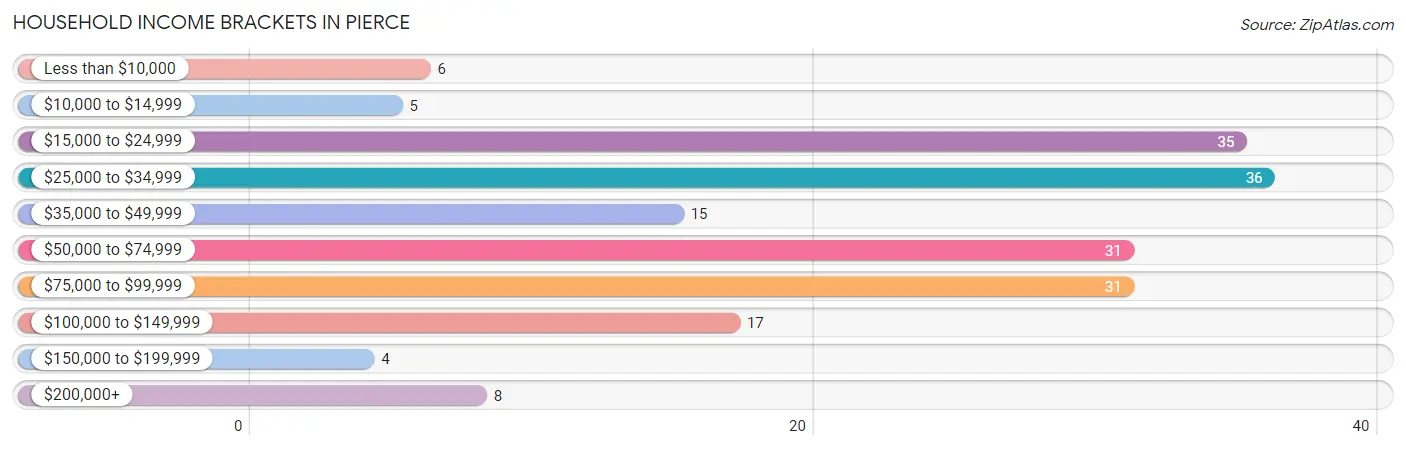
| Income Bracket | # Households | % Households |
| Less than $10,000 | 6 | 3.2% |
| $10,000 to $14,999 | 5 | 2.7% |
| $15,000 to $24,999 | 35 | 18.6% |
| $25,000 to $34,999 | 36 | 19.1% |
| $35,000 to $49,999 | 15 | 8.0% |
| $50,000 to $74,999 | 31 | 16.5% |
| $75,000 to $99,999 | 31 | 16.5% |
| $100,000 to $149,999 | 17 | 9.0% |
| $150,000 to $199,999 | 4 | 2.1% |
| $200,000+ | 8 | 4.3% |
Household Income by Householder Age in Pierce
The median household income in Pierce is $44,643, with the highest median household income of $69,583 found in the 25 to 44 years age bracket for the primary householder. A total of 17 households (9.0%) fall into this category. Meanwhile, the 15 to 24 years age bracket for the primary householder has the lowest median household income of $0, with 3 households (1.6%) in this group.
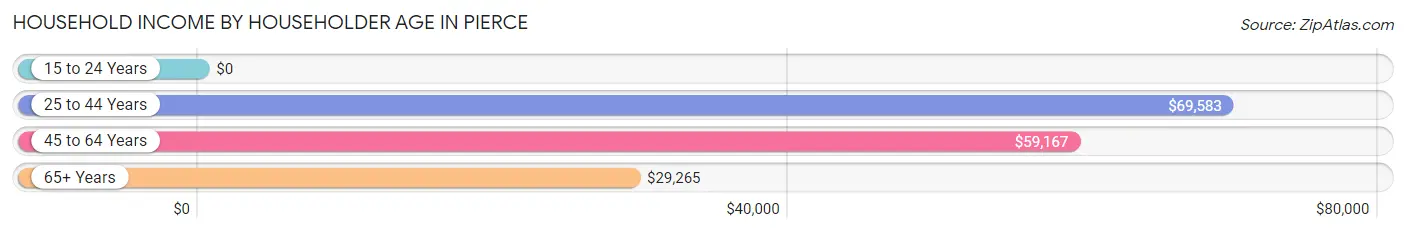
| Income Bracket | # Households | Median Income |
| 15 to 24 Years | 3 (1.6%) | $0 |
| 25 to 44 Years | 17 (9.0%) | $69,583 |
| 45 to 64 Years | 54 (28.7%) | $59,167 |
| 65+ Years | 114 (60.6%) | $29,265 |
| Total | 188 (100.0%) | $44,643 |
Poverty in Pierce
Income Below Poverty by Sex and Age in Pierce
With 7.4% poverty level for males and 3.8% for females among the residents of Pierce, 18 to 24 year old males and 65 to 74 year old females are the most vulnerable to poverty, with 3 males (42.9%) and 5 females (13.2%) in their respective age groups living below the poverty level.
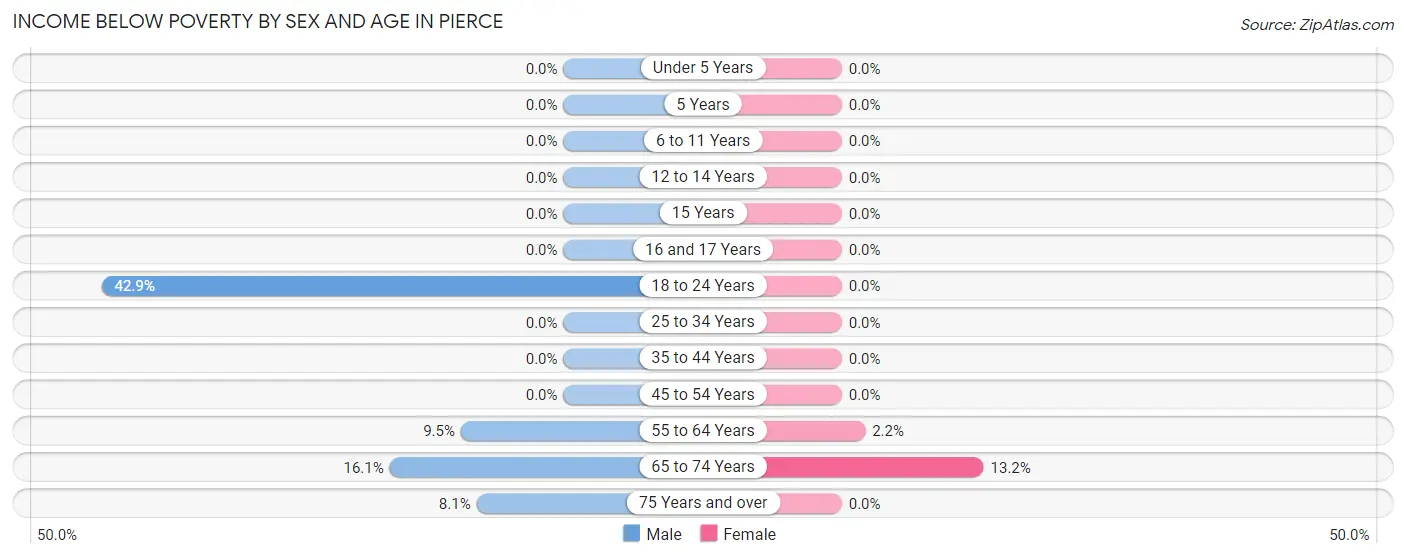
| Age Bracket | Male | Female |
| Under 5 Years | 0 (0.0%) | 0 (0.0%) |
| 5 Years | 0 (0.0%) | 0 (0.0%) |
| 6 to 11 Years | 0 (0.0%) | 0 (0.0%) |
| 12 to 14 Years | 0 (0.0%) | 0 (0.0%) |
| 15 Years | 0 (0.0%) | 0 (0.0%) |
| 16 and 17 Years | 0 (0.0%) | 0 (0.0%) |
| 18 to 24 Years | 3 (42.9%) | 0 (0.0%) |
| 25 to 34 Years | 0 (0.0%) | 0 (0.0%) |
| 35 to 44 Years | 0 (0.0%) | 0 (0.0%) |
| 45 to 54 Years | 0 (0.0%) | 0 (0.0%) |
| 55 to 64 Years | 4 (9.5%) | 1 (2.2%) |
| 65 to 74 Years | 5 (16.1%) | 5 (13.2%) |
| 75 Years and over | 5 (8.1%) | 0 (0.0%) |
| Total | 17 (7.4%) | 6 (3.8%) |
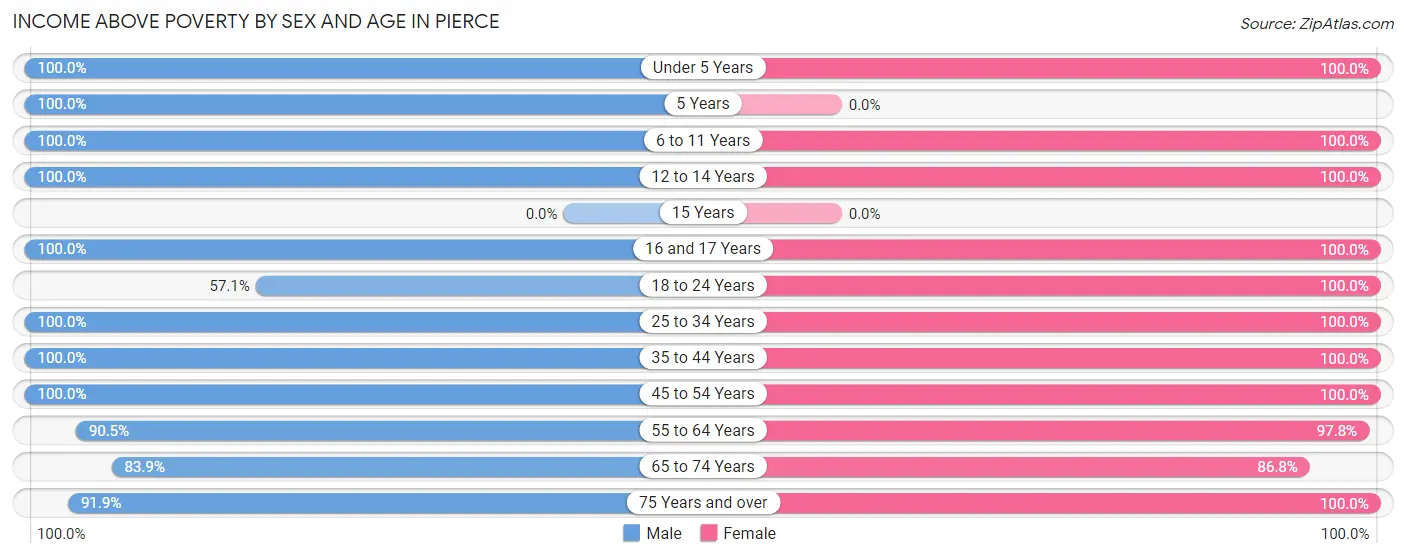
Income Above Poverty by Sex and Age in Pierce
According to the poverty statistics in Pierce, males aged under 5 years and females aged under 5 years are the age groups that are most secure financially, with 100.0% of males and 100.0% of females in these age groups living above the poverty line.
| Age Bracket | Male | Female |
| Under 5 Years | 12 (100.0%) | 3 (100.0%) |
| 5 Years | 3 (100.0%) | 0 (0.0%) |
| 6 to 11 Years | 18 (100.0%) | 6 (100.0%) |
| 12 to 14 Years | 6 (100.0%) | 1 (100.0%) |
| 15 Years | 0 (0.0%) | 0 (0.0%) |
| 16 and 17 Years | 1 (100.0%) | 2 (100.0%) |
| 18 to 24 Years | 4 (57.1%) | 3 (100.0%) |
| 25 to 34 Years | 18 (100.0%) | 16 (100.0%) |
| 35 to 44 Years | 21 (100.0%) | 2 (100.0%) |
| 45 to 54 Years | 10 (100.0%) | 19 (100.0%) |
| 55 to 64 Years | 38 (90.5%) | 45 (97.8%) |
| 65 to 74 Years | 26 (83.9%) | 33 (86.8%) |
| 75 Years and over | 57 (91.9%) | 20 (100.0%) |
| Total | 214 (92.6%) | 150 (96.2%) |
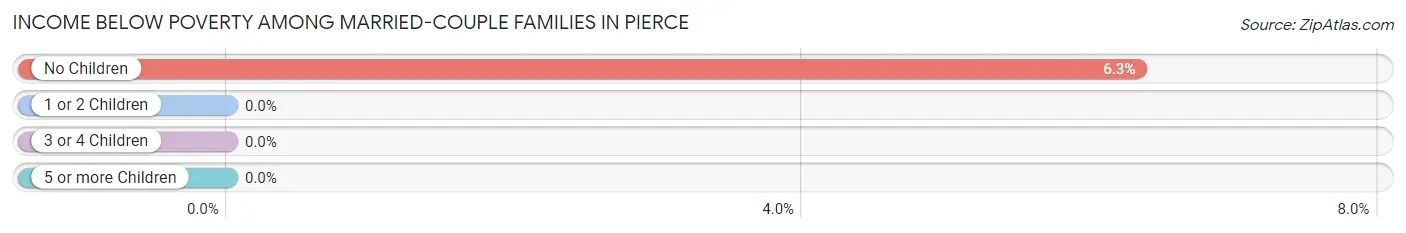
Income Below Poverty Among Married-Couple Families in Pierce
The poverty statistics for married-couple families in Pierce show that 5.1% or 5 of the total 98 families live below the poverty line. Families with no children have the highest poverty rate of 6.3%, comprising of 5 families. On the other hand, families with 1 or 2 children have the lowest poverty rate of 0.0%, which includes 0 families.
| Children | Above Poverty | Below Poverty |
| No Children | 74 (93.7%) | 5 (6.3%) |
| 1 or 2 Children | 7 (100.0%) | 0 (0.0%) |
| 3 or 4 Children | 12 (100.0%) | 0 (0.0%) |
| 5 or more Children | 0 (0.0%) | 0 (0.0%) |
| Total | 93 (94.9%) | 5 (5.1%) |
Income Below Poverty Among Single-Parent Households in Pierce
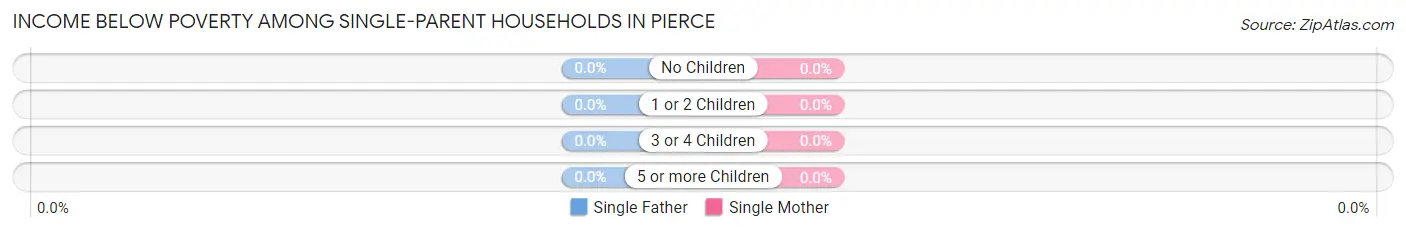
| Children | Single Father | Single Mother |
| No Children | 0 (0.0%) | 0 (0.0%) |
| 1 or 2 Children | 0 (0.0%) | 0 (0.0%) |
| 3 or 4 Children | 0 (0.0%) | 0 (0.0%) |
| 5 or more Children | 0 (0.0%) | 0 (0.0%) |
| Total | 0 (0.0%) | 0 (0.0%) |
Income Below Poverty Among Married-Couple vs Single-Parent Households in Pierce
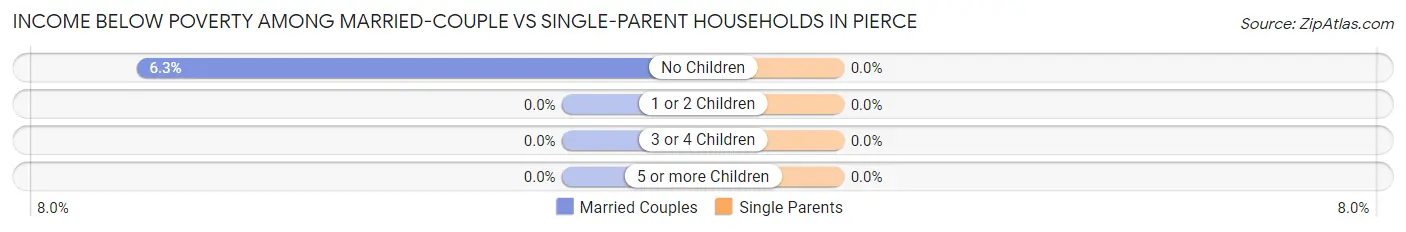
| Children | Married-Couple Families | Single-Parent Households |
| No Children | 5 (6.3%) | 0 (0.0%) |
| 1 or 2 Children | 0 (0.0%) | 0 (0.0%) |
| 3 or 4 Children | 0 (0.0%) | 0 (0.0%) |
| 5 or more Children | 0 (0.0%) | 0 (0.0%) |
| Total | 5 (5.1%) | 0 (0.0%) |
Employment Characteristics in Pierce
Employment by Class of Employer in Pierce
Among the 149 employed individuals in Pierce, private company employees (65 | 43.6%), state government employees (46 | 30.9%), and not-for-profit organizations (16 | 10.7%) make up the most common classes of employment.
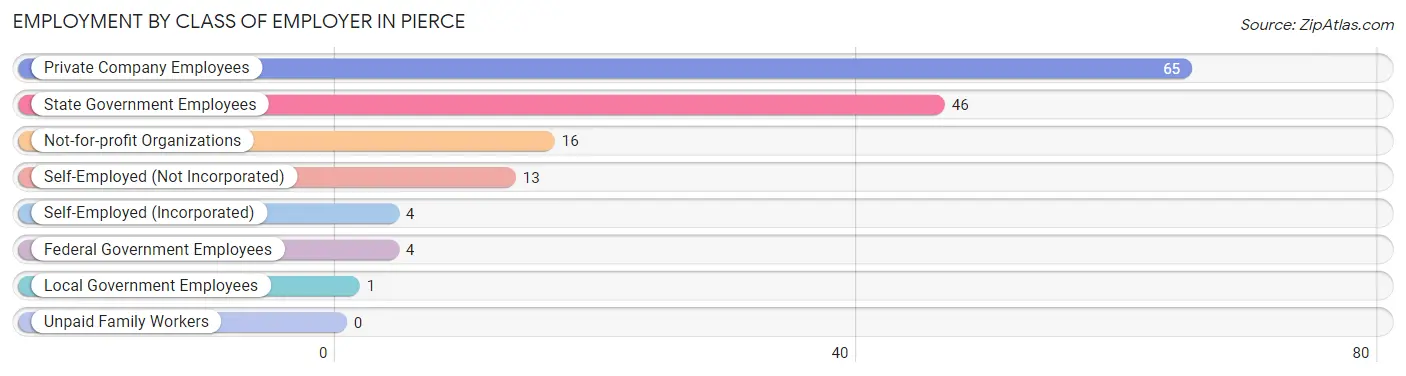
| Employer Class | # Employees | % Employees |
| Private Company Employees | 65 | 43.6% |
| Self-Employed (Incorporated) | 4 | 2.7% |
| Self-Employed (Not Incorporated) | 13 | 8.7% |
| Not-for-profit Organizations | 16 | 10.7% |
| Local Government Employees | 1 | 0.7% |
| State Government Employees | 46 | 30.9% |
| Federal Government Employees | 4 | 2.7% |
| Unpaid Family Workers | 0 | 0.0% |
| Total | 149 | 100.0% |
Employment Status by Age in Pierce
According to the labor force statistics for Pierce, out of the total population over 16 years of age (339), 45.7% or 155 individuals are in the labor force, with 2.6% or 4 of them unemployed. The age group with the highest labor force participation rate is 25 to 29 years, with 100.0% or 9 individuals in the labor force. Within the labor force, the 16 to 19 years age range has the highest percentage of unemployed individuals, with 100.0% or 3 of them being unemployed.
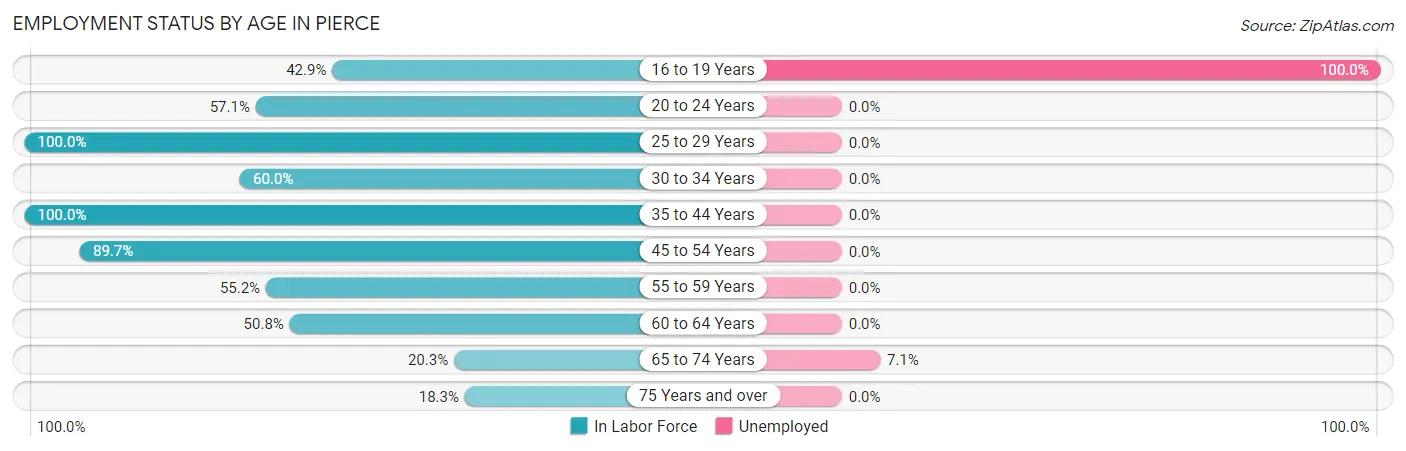
| Age Bracket | In Labor Force | Unemployed |
| 16 to 19 Years | 3 (42.9%) | 3 (100.0%) |
| 20 to 24 Years | 4 (57.1%) | 0 (0.0%) |
| 25 to 29 Years | 9 (100.0%) | 0 (0.0%) |
| 30 to 34 Years | 15 (60.0%) | 0 (0.0%) |
| 35 to 44 Years | 23 (100.0%) | 0 (0.0%) |
| 45 to 54 Years | 26 (89.7%) | 0 (0.0%) |
| 55 to 59 Years | 16 (55.2%) | 0 (0.0%) |
| 60 to 64 Years | 30 (50.8%) | 0 (0.0%) |
| 65 to 74 Years | 14 (20.3%) | 1 (7.1%) |
| 75 Years and over | 15 (18.3%) | 0 (0.0%) |
| Total | 155 (45.7%) | 4 (2.6%) |
Employment Status by Educational Attainment in Pierce
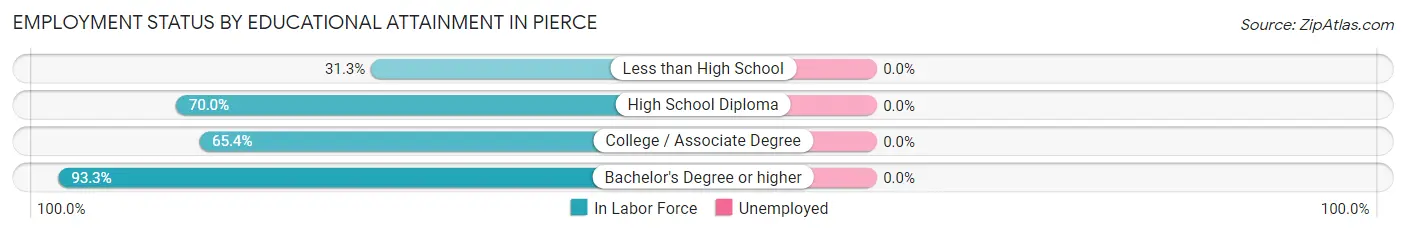
| Educational Attainment | In Labor Force | Unemployed |
| Less than High School | 5 (31.3%) | 0 (0.0%) |
| High School Diploma | 35 (70.0%) | 0 (0.0%) |
| College / Associate Degree | 51 (65.4%) | 0 (0.0%) |
| Bachelor's Degree or higher | 28 (93.3%) | 0 (0.0%) |
| Total | 119 (68.4%) | 0 (0.0%) |
Employment Occupations by Sex in Pierce
Management, Business, Science and Arts Occupations
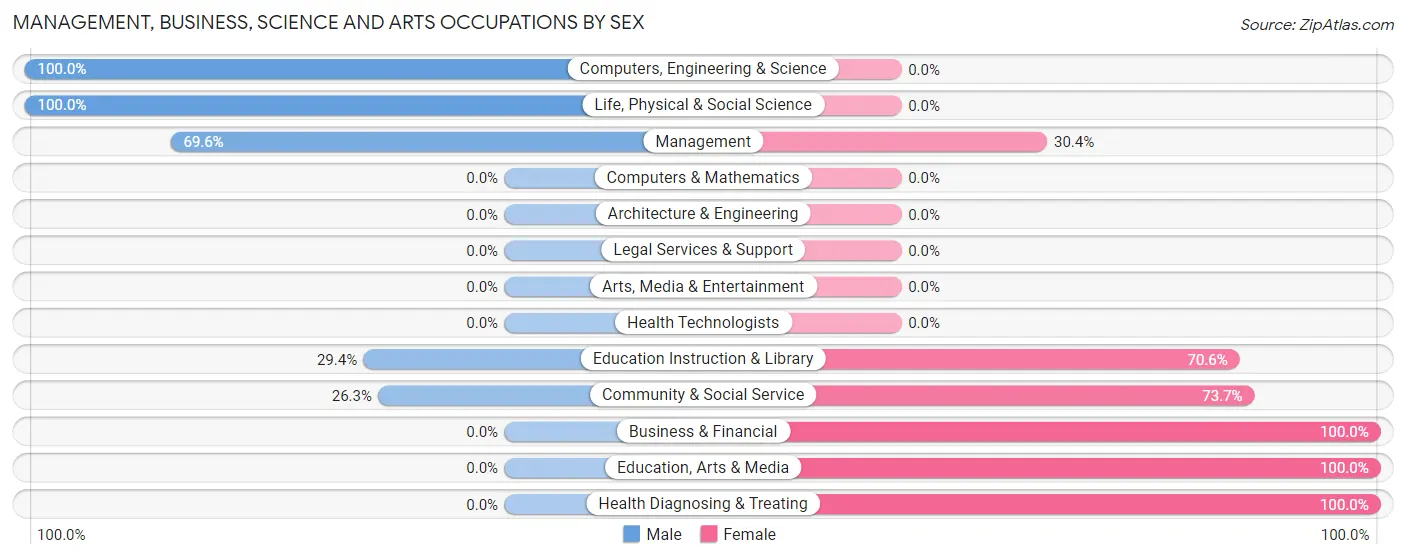
The most common Management, Business, Science and Arts occupations in Pierce are Management (23 | 15.2%), Community & Social Service (19 | 12.6%), Education Instruction & Library (17 | 11.3%), Health Diagnosing & Treating (8 | 5.3%), and Business & Financial (5 | 3.3%).
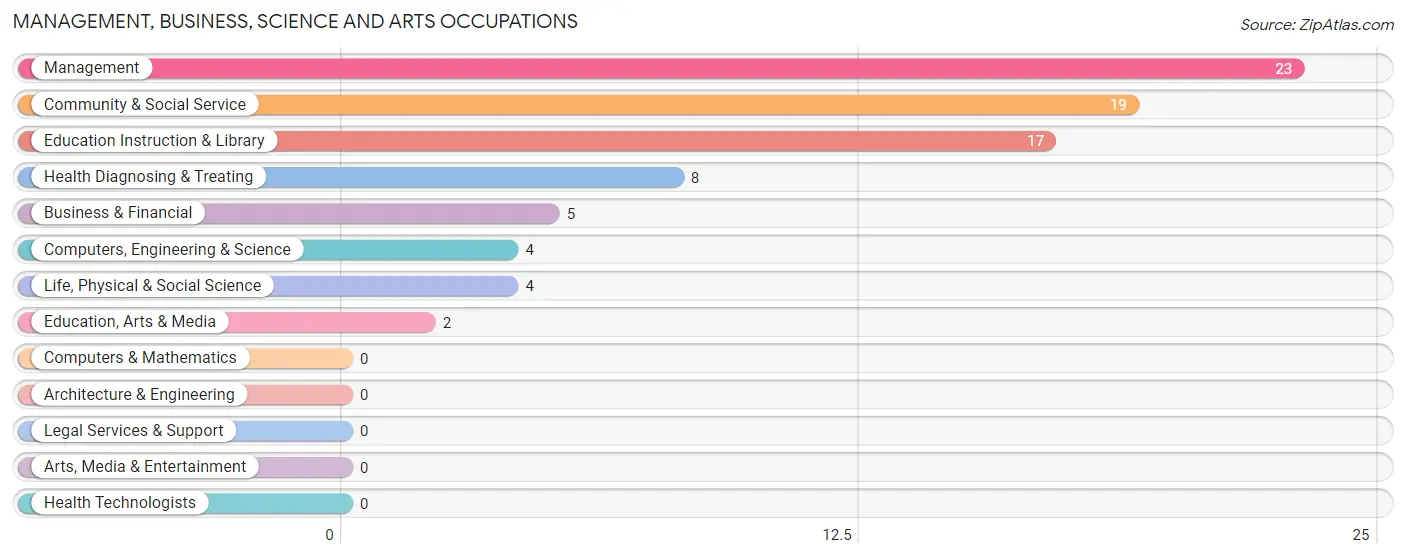
Management, Business, Science and Arts Occupations by Sex
Within the Management, Business, Science and Arts occupations in Pierce, the most male-oriented occupations are Computers, Engineering & Science (100.0%), Life, Physical & Social Science (100.0%), and Management (69.6%), while the most female-oriented occupations are Business & Financial (100.0%), Education, Arts & Media (100.0%), and Health Diagnosing & Treating (100.0%).
| Occupation | Male | Female |
| Management | 16 (69.6%) | 7 (30.4%) |
| Business & Financial | 0 (0.0%) | 5 (100.0%) |
| Computers, Engineering & Science | 4 (100.0%) | 0 (0.0%) |
| Computers & Mathematics | 0 (0.0%) | 0 (0.0%) |
| Architecture & Engineering | 0 (0.0%) | 0 (0.0%) |
| Life, Physical & Social Science | 4 (100.0%) | 0 (0.0%) |
| Community & Social Service | 5 (26.3%) | 14 (73.7%) |
| Education, Arts & Media | 0 (0.0%) | 2 (100.0%) |
| Legal Services & Support | 0 (0.0%) | 0 (0.0%) |
| Education Instruction & Library | 5 (29.4%) | 12 (70.6%) |
| Arts, Media & Entertainment | 0 (0.0%) | 0 (0.0%) |
| Health Diagnosing & Treating | 0 (0.0%) | 8 (100.0%) |
| Health Technologists | 0 (0.0%) | 0 (0.0%) |
| Total (Category) | 25 (42.4%) | 34 (57.6%) |
| Total (Overall) | 94 (62.3%) | 57 (37.8%) |
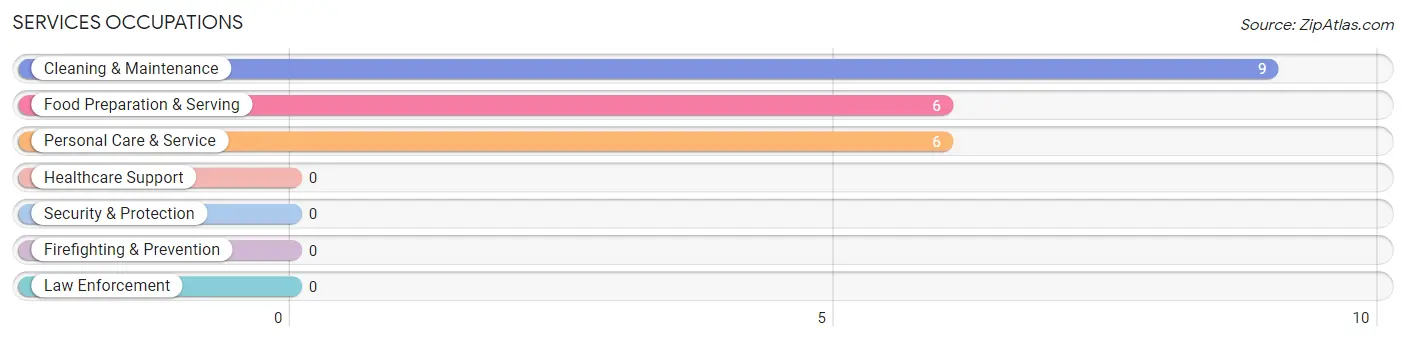
Services Occupations
The most common Services occupations in Pierce are Cleaning & Maintenance (9 | 6.0%), Food Preparation & Serving (6 | 4.0%), and Personal Care & Service (6 | 4.0%).
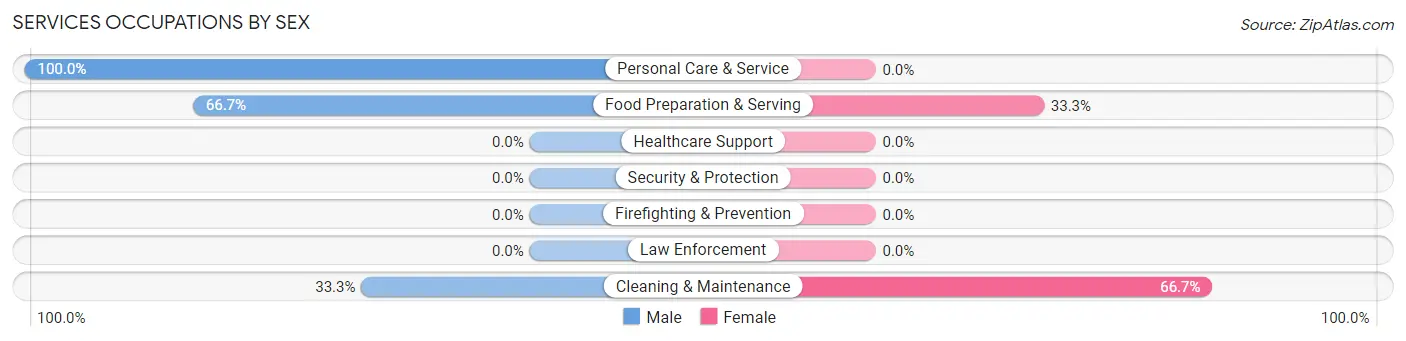
Services Occupations by Sex
Within the Services occupations in Pierce, the most male-oriented occupations are Personal Care & Service (100.0%), Food Preparation & Serving (66.7%), and Cleaning & Maintenance (33.3%), while the most female-oriented occupations are Cleaning & Maintenance (66.7%), and Food Preparation & Serving (33.3%).
| Occupation | Male | Female |
| Healthcare Support | 0 (0.0%) | 0 (0.0%) |
| Security & Protection | 0 (0.0%) | 0 (0.0%) |
| Firefighting & Prevention | 0 (0.0%) | 0 (0.0%) |
| Law Enforcement | 0 (0.0%) | 0 (0.0%) |
| Food Preparation & Serving | 4 (66.7%) | 2 (33.3%) |
| Cleaning & Maintenance | 3 (33.3%) | 6 (66.7%) |
| Personal Care & Service | 6 (100.0%) | 0 (0.0%) |
| Total (Category) | 13 (61.9%) | 8 (38.1%) |
| Total (Overall) | 94 (62.3%) | 57 (37.8%) |
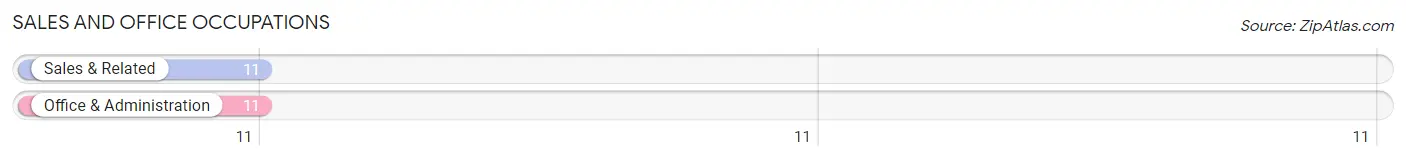
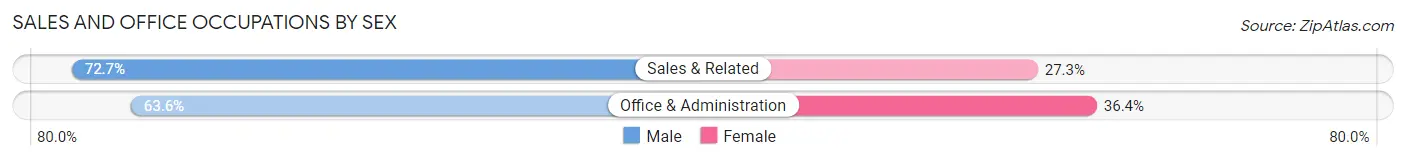
Sales and Office Occupations
The most common Sales and Office occupations in Pierce are Sales & Related (11 | 7.3%), and Office & Administration (11 | 7.3%).
Sales and Office Occupations by Sex
| Occupation | Male | Female |
| Sales & Related | 8 (72.7%) | 3 (27.3%) |
| Office & Administration | 7 (63.6%) | 4 (36.4%) |
| Total (Category) | 15 (68.2%) | 7 (31.8%) |
| Total (Overall) | 94 (62.3%) | 57 (37.8%) |
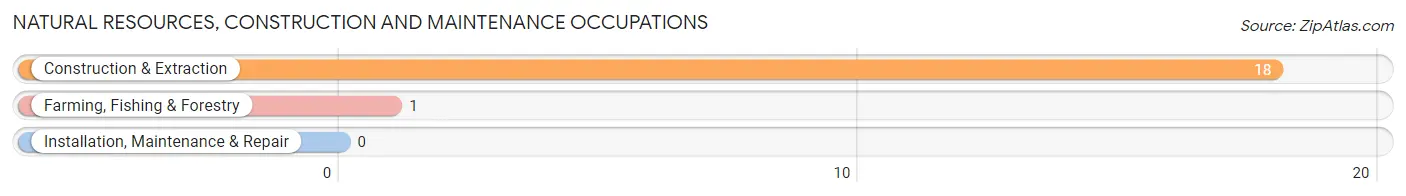
Natural Resources, Construction and Maintenance Occupations
The most common Natural Resources, Construction and Maintenance occupations in Pierce are Construction & Extraction (18 | 11.9%), and Farming, Fishing & Forestry (1 | 0.7%).
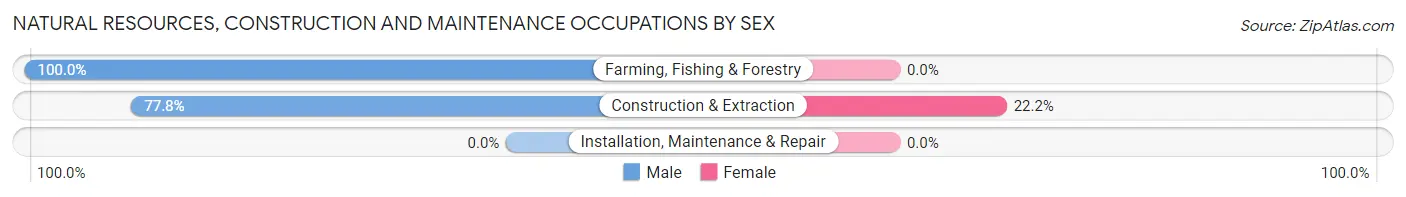
Natural Resources, Construction and Maintenance Occupations by Sex
| Occupation | Male | Female |
| Farming, Fishing & Forestry | 1 (100.0%) | 0 (0.0%) |
| Construction & Extraction | 14 (77.8%) | 4 (22.2%) |
| Installation, Maintenance & Repair | 0 (0.0%) | 0 (0.0%) |
| Total (Category) | 15 (78.9%) | 4 (21.0%) |
| Total (Overall) | 94 (62.3%) | 57 (37.8%) |
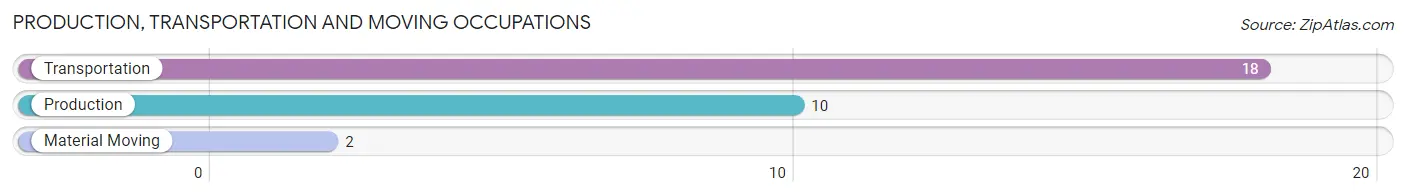
Production, Transportation and Moving Occupations
The most common Production, Transportation and Moving occupations in Pierce are Transportation (18 | 11.9%), Production (10 | 6.6%), and Material Moving (2 | 1.3%).
Production, Transportation and Moving Occupations by Sex
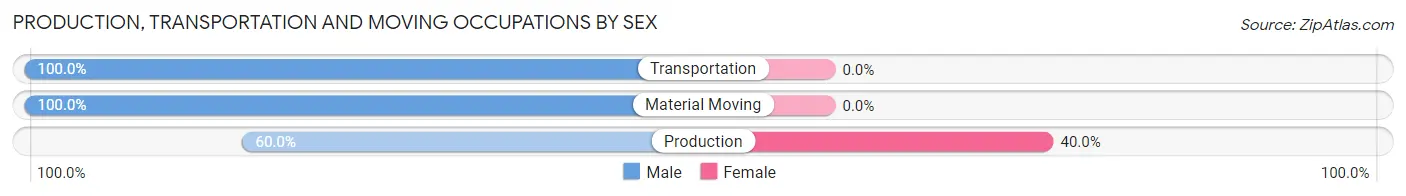
| Occupation | Male | Female |
| Production | 6 (60.0%) | 4 (40.0%) |
| Transportation | 18 (100.0%) | 0 (0.0%) |
| Material Moving | 2 (100.0%) | 0 (0.0%) |
| Total (Category) | 26 (86.7%) | 4 (13.3%) |
| Total (Overall) | 94 (62.3%) | 57 (37.8%) |
Employment Industries by Sex in Pierce
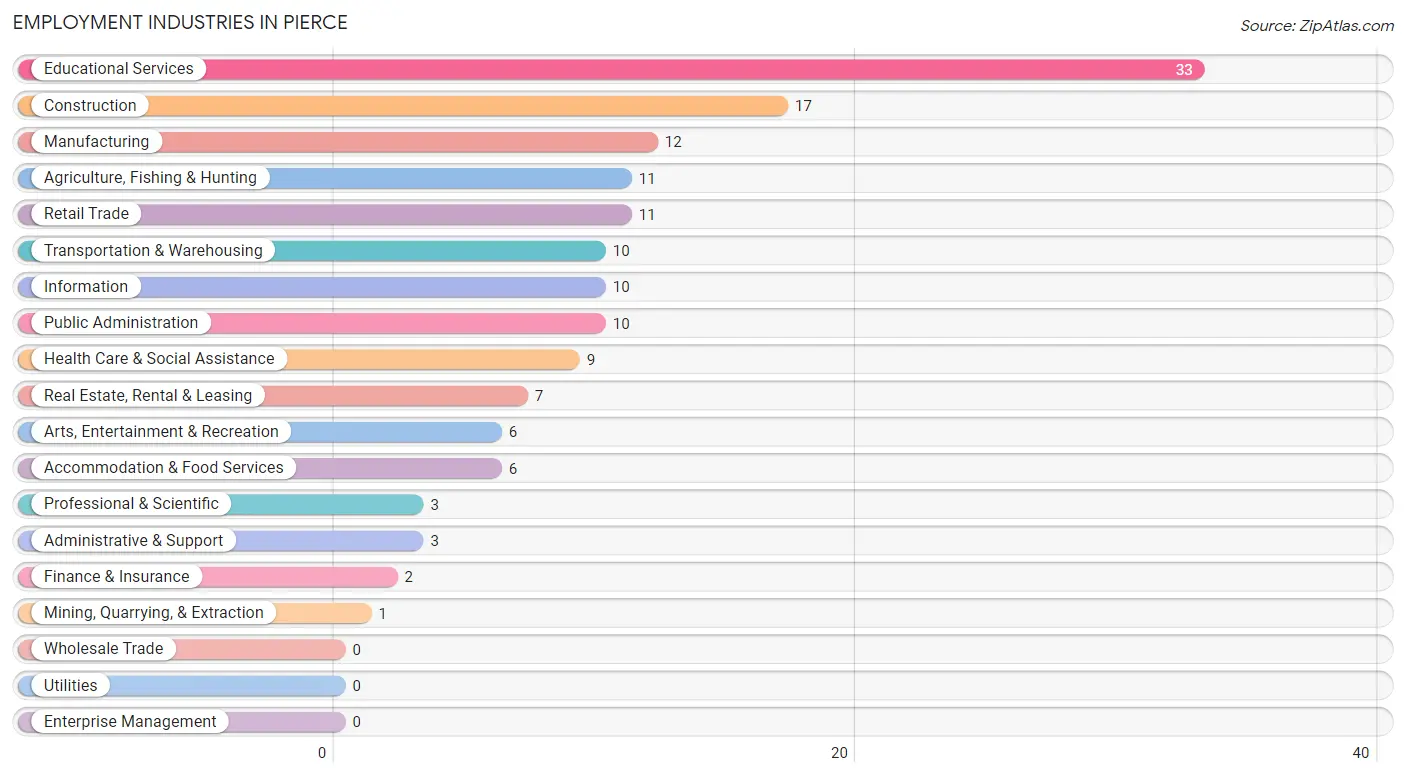
Employment Industries in Pierce
The major employment industries in Pierce include Educational Services (33 | 21.8%), Construction (17 | 11.3%), Manufacturing (12 | 8.0%), Agriculture, Fishing & Hunting (11 | 7.3%), and Retail Trade (11 | 7.3%).
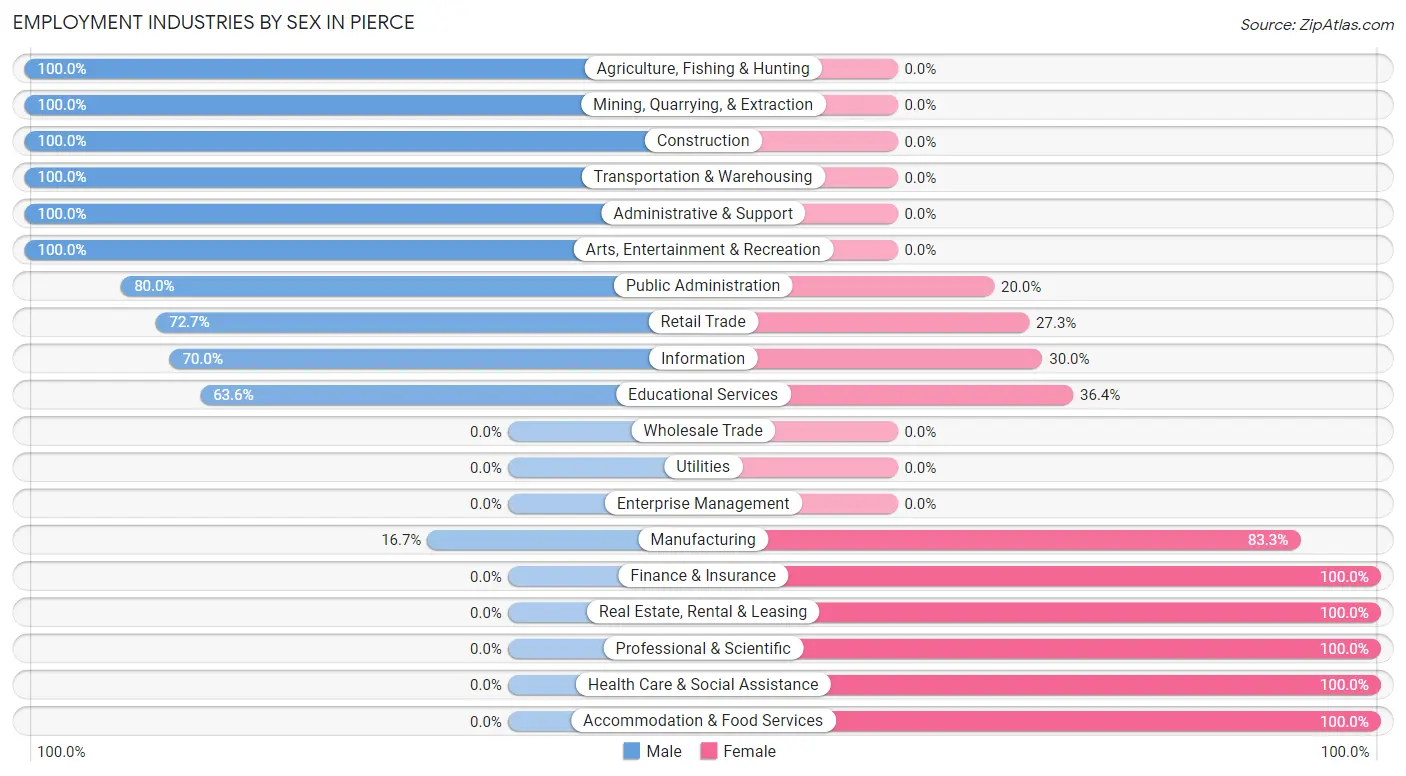
Employment Industries by Sex in Pierce
The Pierce industries that see more men than women are Agriculture, Fishing & Hunting (100.0%), Mining, Quarrying, & Extraction (100.0%), and Construction (100.0%), whereas the industries that tend to have a higher number of women are Finance & Insurance (100.0%), Real Estate, Rental & Leasing (100.0%), and Professional & Scientific (100.0%).
| Industry | Male | Female |
| Agriculture, Fishing & Hunting | 11 (100.0%) | 0 (0.0%) |
| Mining, Quarrying, & Extraction | 1 (100.0%) | 0 (0.0%) |
| Construction | 17 (100.0%) | 0 (0.0%) |
| Manufacturing | 2 (16.7%) | 10 (83.3%) |
| Wholesale Trade | 0 (0.0%) | 0 (0.0%) |
| Retail Trade | 8 (72.7%) | 3 (27.3%) |
| Transportation & Warehousing | 10 (100.0%) | 0 (0.0%) |
| Utilities | 0 (0.0%) | 0 (0.0%) |
| Information | 7 (70.0%) | 3 (30.0%) |
| Finance & Insurance | 0 (0.0%) | 2 (100.0%) |
| Real Estate, Rental & Leasing | 0 (0.0%) | 7 (100.0%) |
| Professional & Scientific | 0 (0.0%) | 3 (100.0%) |
| Enterprise Management | 0 (0.0%) | 0 (0.0%) |
| Administrative & Support | 3 (100.0%) | 0 (0.0%) |
| Educational Services | 21 (63.6%) | 12 (36.4%) |
| Health Care & Social Assistance | 0 (0.0%) | 9 (100.0%) |
| Arts, Entertainment & Recreation | 6 (100.0%) | 0 (0.0%) |
| Accommodation & Food Services | 0 (0.0%) | 6 (100.0%) |
| Public Administration | 8 (80.0%) | 2 (20.0%) |
| Total | 94 (62.3%) | 57 (37.8%) |
Education in Pierce
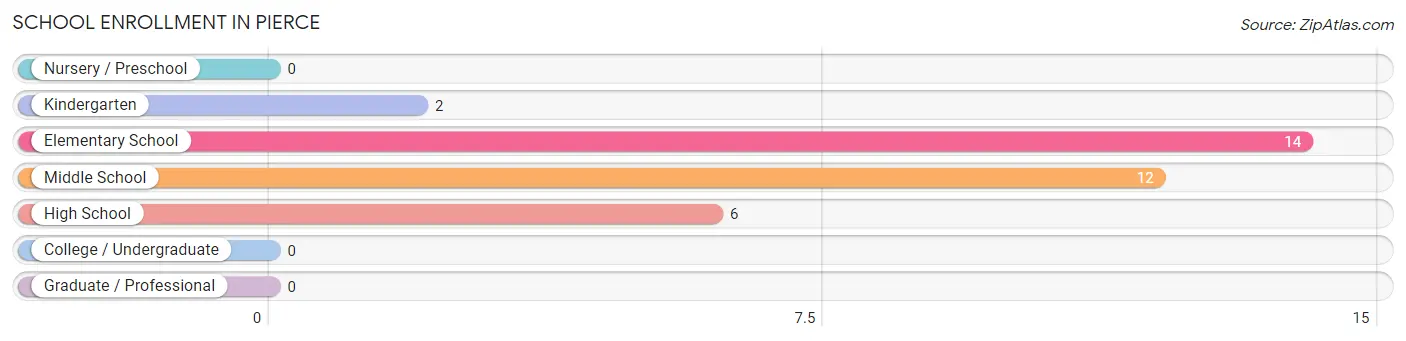
School Enrollment in Pierce
The most common levels of schooling among the 34 students in Pierce are elementary school (14 | 41.2%), middle school (12 | 35.3%), and high school (6 | 17.6%).
| School Level | # Students | % Students |
| Nursery / Preschool | 0 | 0.0% |
| Kindergarten | 2 | 5.9% |
| Elementary School | 14 | 41.2% |
| Middle School | 12 | 35.3% |
| High School | 6 | 17.6% |
| College / Undergraduate | 0 | 0.0% |
| Graduate / Professional | 0 | 0.0% |
| Total | 34 | 100.0% |
School Enrollment by Age by Funding Source in Pierce
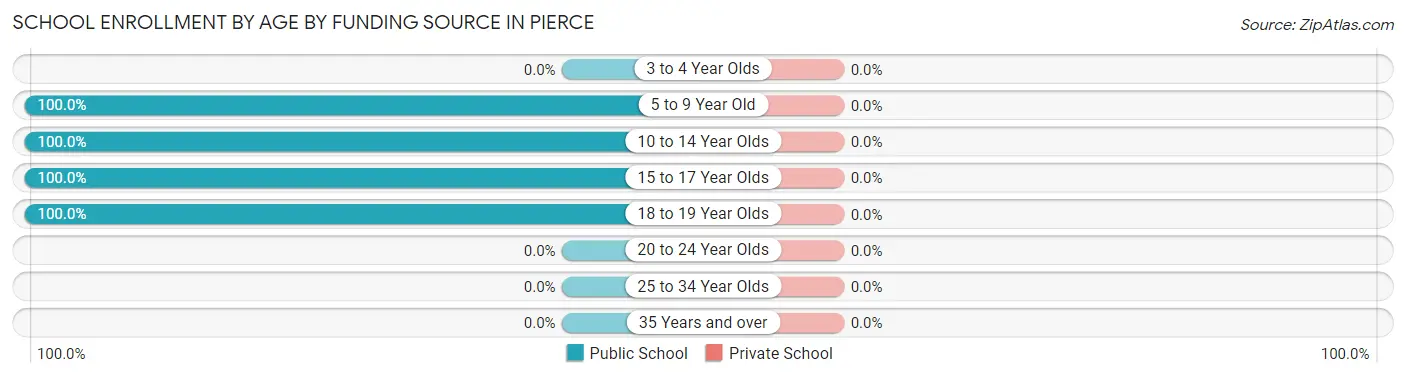
| Age Bracket | Public School | Private School |
| 3 to 4 Year Olds | 0 (0.0%) | 0 (0.0%) |
| 5 to 9 Year Old | 11 (100.0%) | 0 (0.0%) |
| 10 to 14 Year Olds | 17 (100.0%) | 0 (0.0%) |
| 15 to 17 Year Olds | 3 (100.0%) | 0 (0.0%) |
| 18 to 19 Year Olds | 3 (100.0%) | 0 (0.0%) |
| 20 to 24 Year Olds | 0 (0.0%) | 0 (0.0%) |
| 25 to 34 Year Olds | 0 (0.0%) | 0 (0.0%) |
| 35 Years and over | 0 (0.0%) | 0 (0.0%) |
| Total | 34 (100.0%) | 0 (0.0%) |
Educational Attainment by Field of Study in Pierce
Education (18 | 34.6%), engineering (9 | 17.3%), business (7 | 13.5%), arts & humanities (7 | 13.5%), and bio, nature & agricultural (5 | 9.6%) are the most common fields of study among 52 individuals in Pierce who have obtained a bachelor's degree or higher.
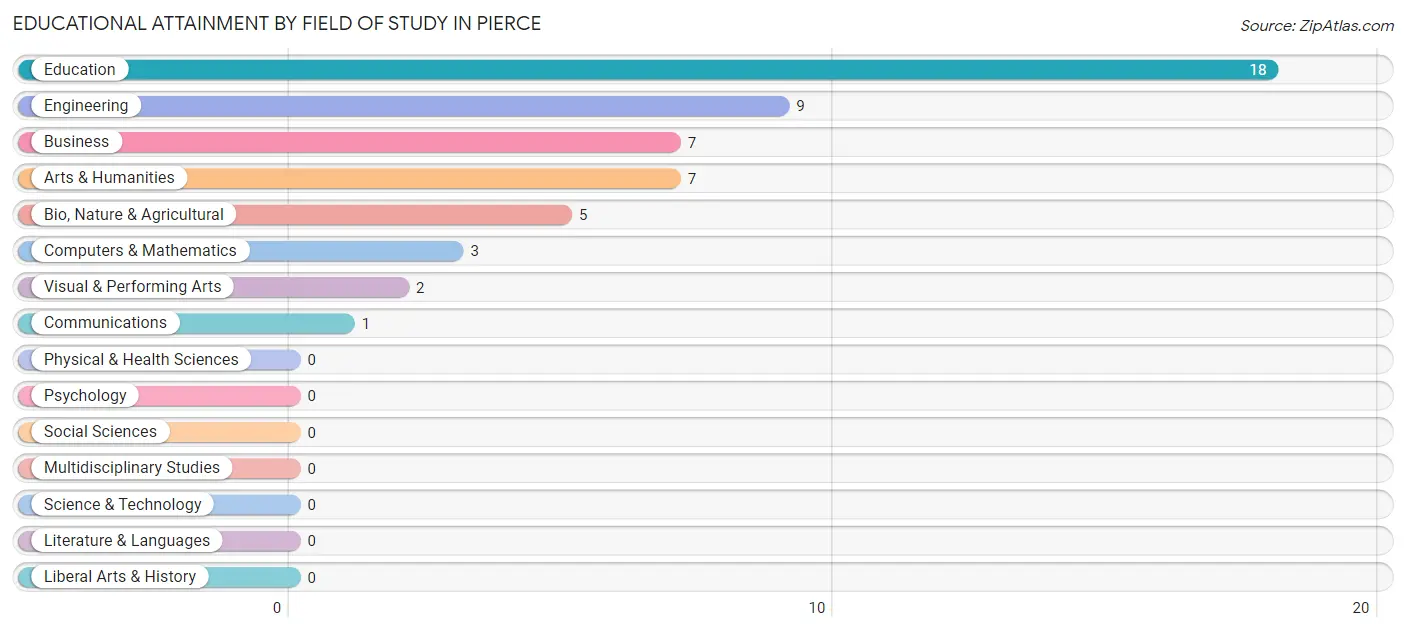
| Field of Study | # Graduates | % Graduates |
| Computers & Mathematics | 3 | 5.8% |
| Bio, Nature & Agricultural | 5 | 9.6% |
| Physical & Health Sciences | 0 | 0.0% |
| Psychology | 0 | 0.0% |
| Social Sciences | 0 | 0.0% |
| Engineering | 9 | 17.3% |
| Multidisciplinary Studies | 0 | 0.0% |
| Science & Technology | 0 | 0.0% |
| Business | 7 | 13.5% |
| Education | 18 | 34.6% |
| Literature & Languages | 0 | 0.0% |
| Liberal Arts & History | 0 | 0.0% |
| Visual & Performing Arts | 2 | 3.8% |
| Communications | 1 | 1.9% |
| Arts & Humanities | 7 | 13.5% |
| Total | 52 | 100.0% |
Transportation & Commute in Pierce
Vehicle Availability by Sex in Pierce
The most prevalent vehicle ownership categories in Pierce are males with 2 vehicles (53, accounting for 57.6%) and females with 2 vehicles (29, making up 93.0%).
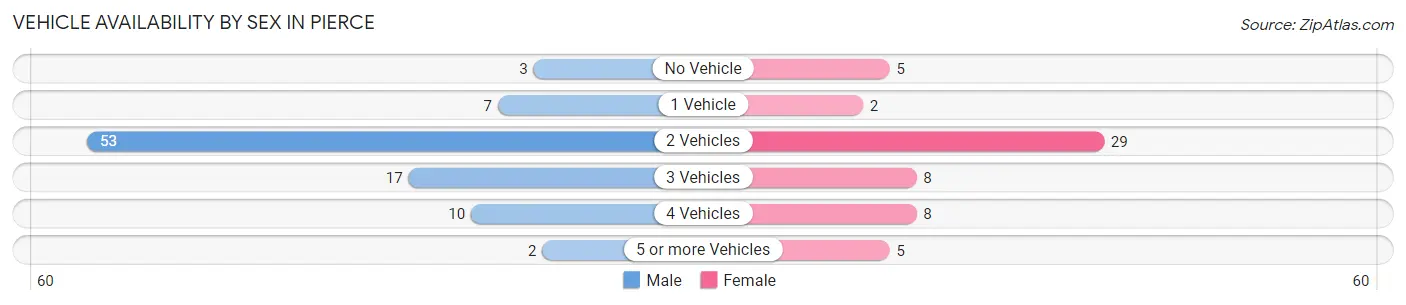
| Vehicles Available | Male | Female |
| No Vehicle | 3 (3.3%) | 5 (8.8%) |
| 1 Vehicle | 7 (7.6%) | 2 (3.5%) |
| 2 Vehicles | 53 (57.6%) | 29 (50.9%) |
| 3 Vehicles | 17 (18.5%) | 8 (14.0%) |
| 4 Vehicles | 10 (10.9%) | 8 (14.0%) |
| 5 or more Vehicles | 2 (2.2%) | 5 (8.8%) |
| Total | 92 (100.0%) | 57 (100.0%) |
Commute Time in Pierce
The most frequently occuring commute durations in Pierce are 5 to 9 minutes (42 commuters, 30.0%), 45 to 59 minutes (40 commuters, 28.6%), and less than 5 minutes (18 commuters, 12.9%).
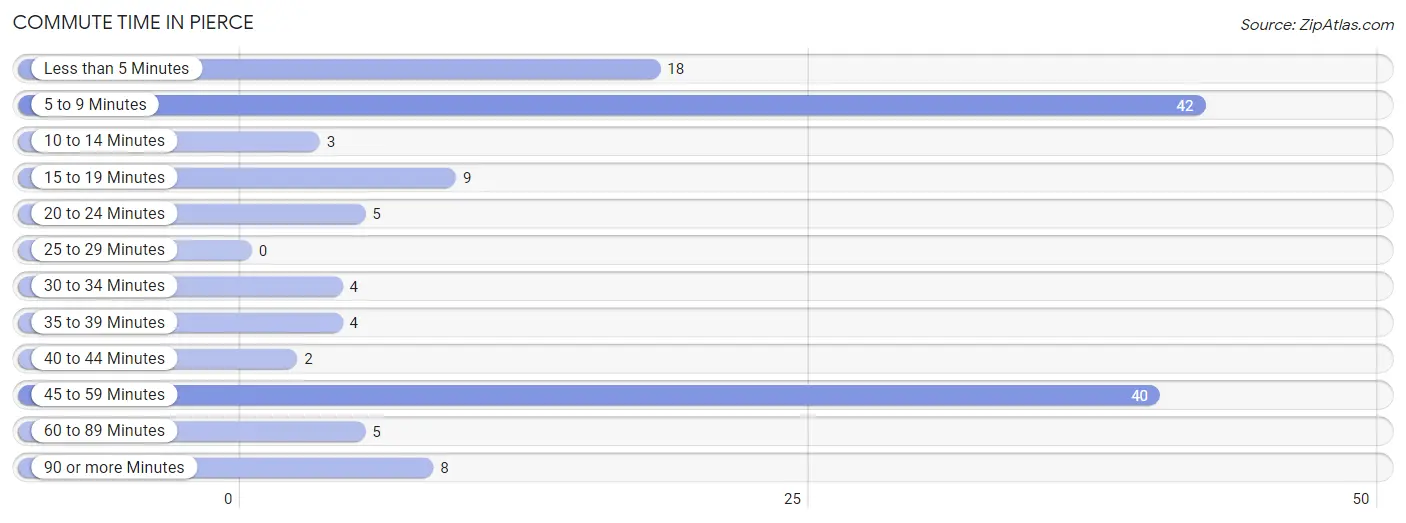
| Commute Time | # Commuters | % Commuters |
| Less than 5 Minutes | 18 | 12.9% |
| 5 to 9 Minutes | 42 | 30.0% |
| 10 to 14 Minutes | 3 | 2.1% |
| 15 to 19 Minutes | 9 | 6.4% |
| 20 to 24 Minutes | 5 | 3.6% |
| 25 to 29 Minutes | 0 | 0.0% |
| 30 to 34 Minutes | 4 | 2.9% |
| 35 to 39 Minutes | 4 | 2.9% |
| 40 to 44 Minutes | 2 | 1.4% |
| 45 to 59 Minutes | 40 | 28.6% |
| 60 to 89 Minutes | 5 | 3.6% |
| 90 or more Minutes | 8 | 5.7% |
Commute Time by Sex in Pierce
The most common commute times in Pierce are 5 to 9 minutes (33 commuters, 38.4%) for males and less than 5 minutes (15 commuters, 27.8%) for females.
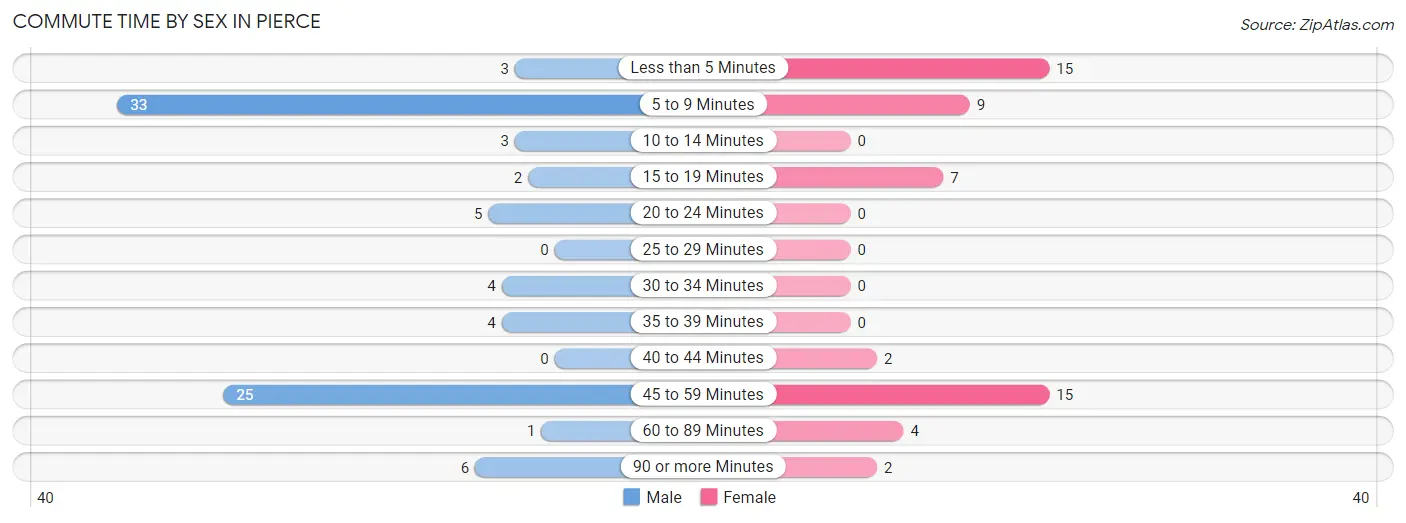
| Commute Time | Male | Female |
| Less than 5 Minutes | 3 (3.5%) | 15 (27.8%) |
| 5 to 9 Minutes | 33 (38.4%) | 9 (16.7%) |
| 10 to 14 Minutes | 3 (3.5%) | 0 (0.0%) |
| 15 to 19 Minutes | 2 (2.3%) | 7 (13.0%) |
| 20 to 24 Minutes | 5 (5.8%) | 0 (0.0%) |
| 25 to 29 Minutes | 0 (0.0%) | 0 (0.0%) |
| 30 to 34 Minutes | 4 (4.6%) | 0 (0.0%) |
| 35 to 39 Minutes | 4 (4.6%) | 0 (0.0%) |
| 40 to 44 Minutes | 0 (0.0%) | 2 (3.7%) |
| 45 to 59 Minutes | 25 (29.1%) | 15 (27.8%) |
| 60 to 89 Minutes | 1 (1.2%) | 4 (7.4%) |
| 90 or more Minutes | 6 (7.0%) | 2 (3.7%) |
Time of Departure to Work by Sex in Pierce
The most frequent times of departure to work in Pierce are 12:00 AM to 4:59 AM (39, 45.4%) for males and 12:00 PM to 3:59 PM (12, 22.2%) for females.
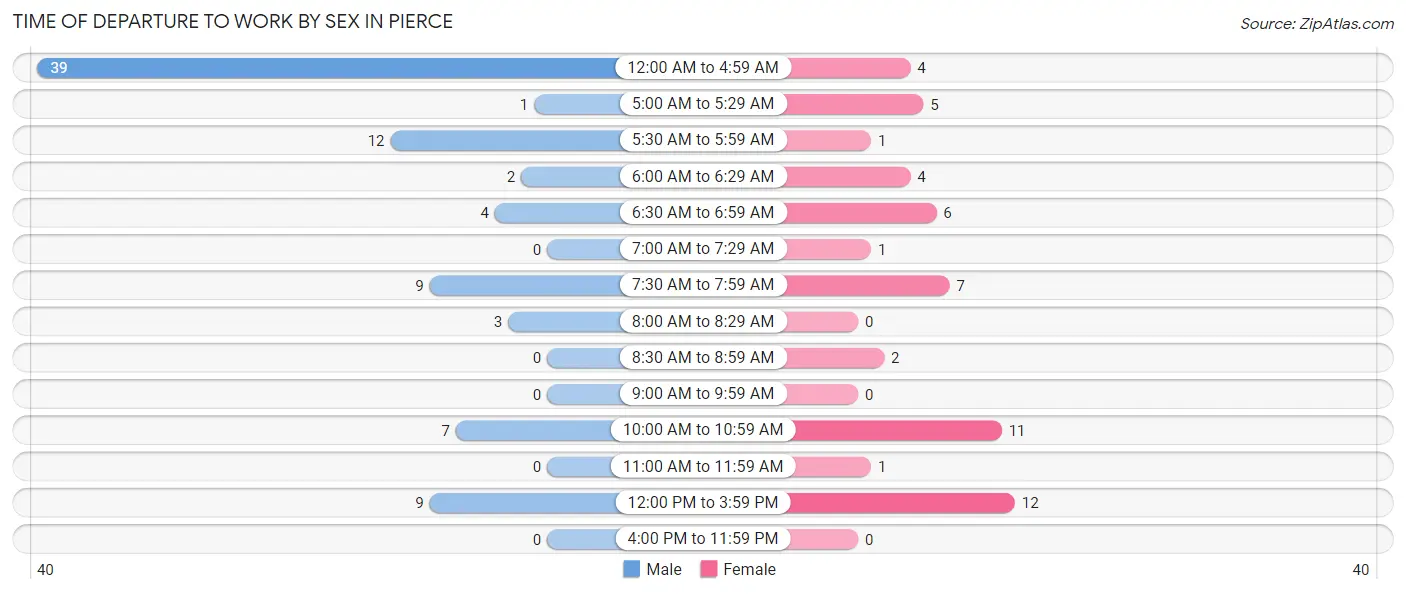
| Time of Departure | Male | Female |
| 12:00 AM to 4:59 AM | 39 (45.4%) | 4 (7.4%) |
| 5:00 AM to 5:29 AM | 1 (1.2%) | 5 (9.3%) |
| 5:30 AM to 5:59 AM | 12 (14.0%) | 1 (1.8%) |
| 6:00 AM to 6:29 AM | 2 (2.3%) | 4 (7.4%) |
| 6:30 AM to 6:59 AM | 4 (4.6%) | 6 (11.1%) |
| 7:00 AM to 7:29 AM | 0 (0.0%) | 1 (1.8%) |
| 7:30 AM to 7:59 AM | 9 (10.5%) | 7 (13.0%) |
| 8:00 AM to 8:29 AM | 3 (3.5%) | 0 (0.0%) |
| 8:30 AM to 8:59 AM | 0 (0.0%) | 2 (3.7%) |
| 9:00 AM to 9:59 AM | 0 (0.0%) | 0 (0.0%) |
| 10:00 AM to 10:59 AM | 7 (8.1%) | 11 (20.4%) |
| 11:00 AM to 11:59 AM | 0 (0.0%) | 1 (1.8%) |
| 12:00 PM to 3:59 PM | 9 (10.5%) | 12 (22.2%) |
| 4:00 PM to 11:59 PM | 0 (0.0%) | 0 (0.0%) |
| Total | 86 (100.0%) | 54 (100.0%) |
Housing Occupancy in Pierce
Occupancy by Ownership in Pierce
Of the total 188 dwellings in Pierce, owner-occupied units account for 168 (89.4%), while renter-occupied units make up 20 (10.6%).
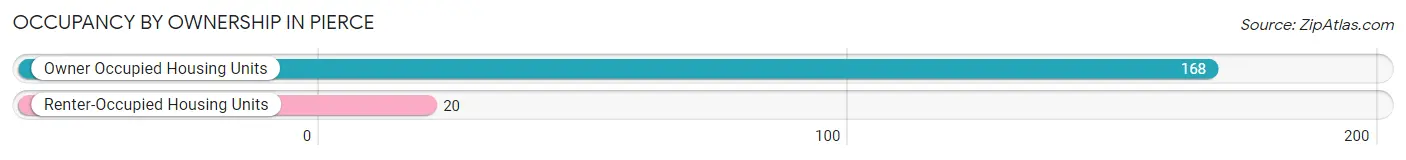
| Occupancy | # Housing Units | % Housing Units |
| Owner Occupied Housing Units | 168 | 89.4% |
| Renter-Occupied Housing Units | 20 | 10.6% |
| Total Occupied Housing Units | 188 | 100.0% |
Occupancy by Household Size in Pierce
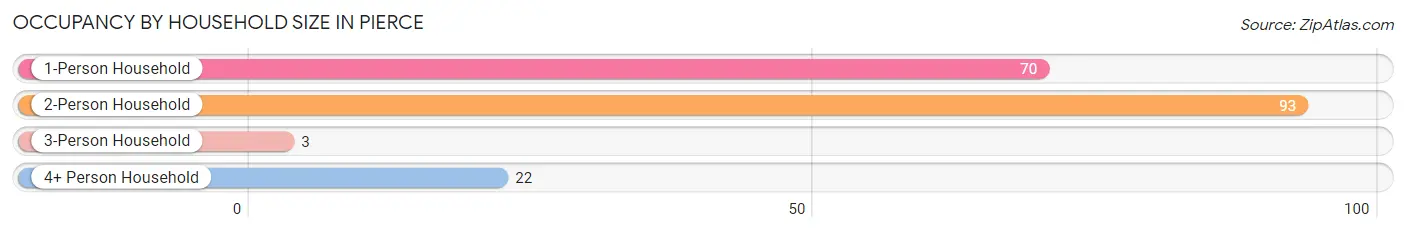
| Household Size | # Housing Units | % Housing Units |
| 1-Person Household | 70 | 37.2% |
| 2-Person Household | 93 | 49.5% |
| 3-Person Household | 3 | 1.6% |
| 4+ Person Household | 22 | 11.7% |
| Total Housing Units | 188 | 100.0% |
Occupancy by Ownership by Household Size in Pierce
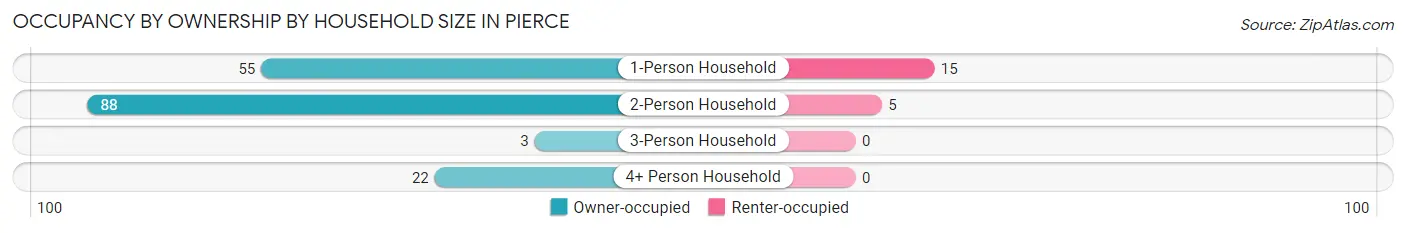
| Household Size | Owner-occupied | Renter-occupied |
| 1-Person Household | 55 (78.6%) | 15 (21.4%) |
| 2-Person Household | 88 (94.6%) | 5 (5.4%) |
| 3-Person Household | 3 (100.0%) | 0 (0.0%) |
| 4+ Person Household | 22 (100.0%) | 0 (0.0%) |
| Total Housing Units | 168 (89.4%) | 20 (10.6%) |
Occupancy by Educational Attainment in Pierce
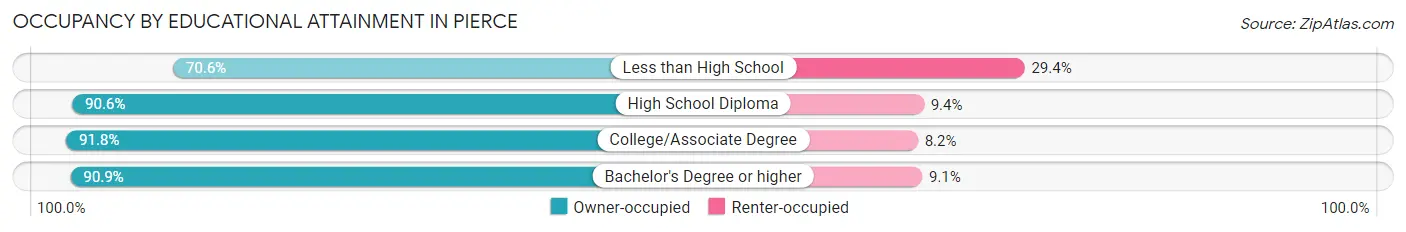
| Household Size | Owner-occupied | Renter-occupied |
| Less than High School | 12 (70.6%) | 5 (29.4%) |
| High School Diploma | 48 (90.6%) | 5 (9.4%) |
| College/Associate Degree | 78 (91.8%) | 7 (8.2%) |
| Bachelor's Degree or higher | 30 (90.9%) | 3 (9.1%) |
Occupancy by Age of Householder in Pierce
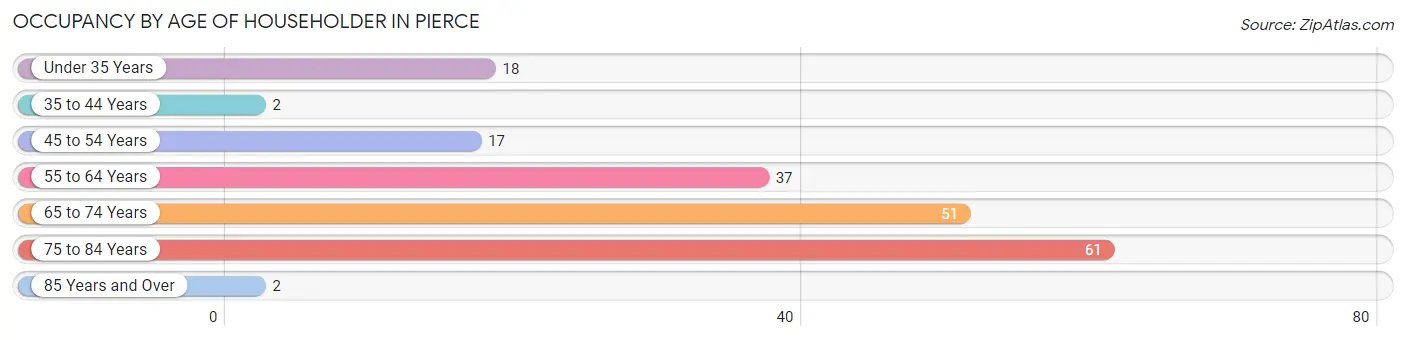
| Age Bracket | # Households | % Households |
| Under 35 Years | 18 | 9.6% |
| 35 to 44 Years | 2 | 1.1% |
| 45 to 54 Years | 17 | 9.0% |
| 55 to 64 Years | 37 | 19.7% |
| 65 to 74 Years | 51 | 27.1% |
| 75 to 84 Years | 61 | 32.5% |
| 85 Years and Over | 2 | 1.1% |
| Total | 188 | 100.0% |
Housing Finances in Pierce
Median Income by Occupancy in Pierce
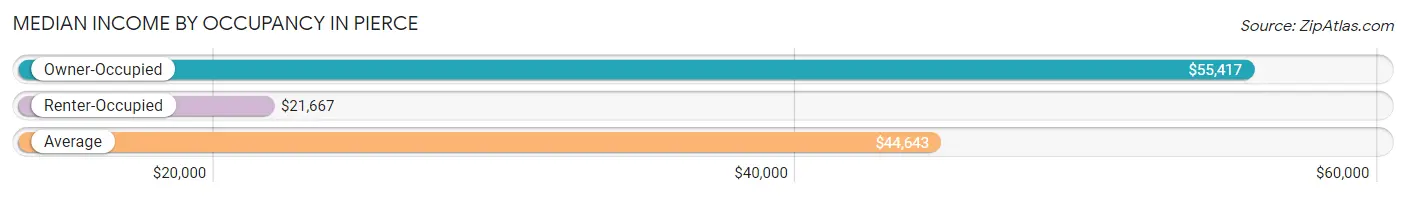
| Occupancy Type | # Households | Median Income |
| Owner-Occupied | 168 (89.4%) | $55,417 |
| Renter-Occupied | 20 (10.6%) | $21,667 |
| Average | 188 (100.0%) | $44,643 |
Occupancy by Householder Income Bracket in Pierce
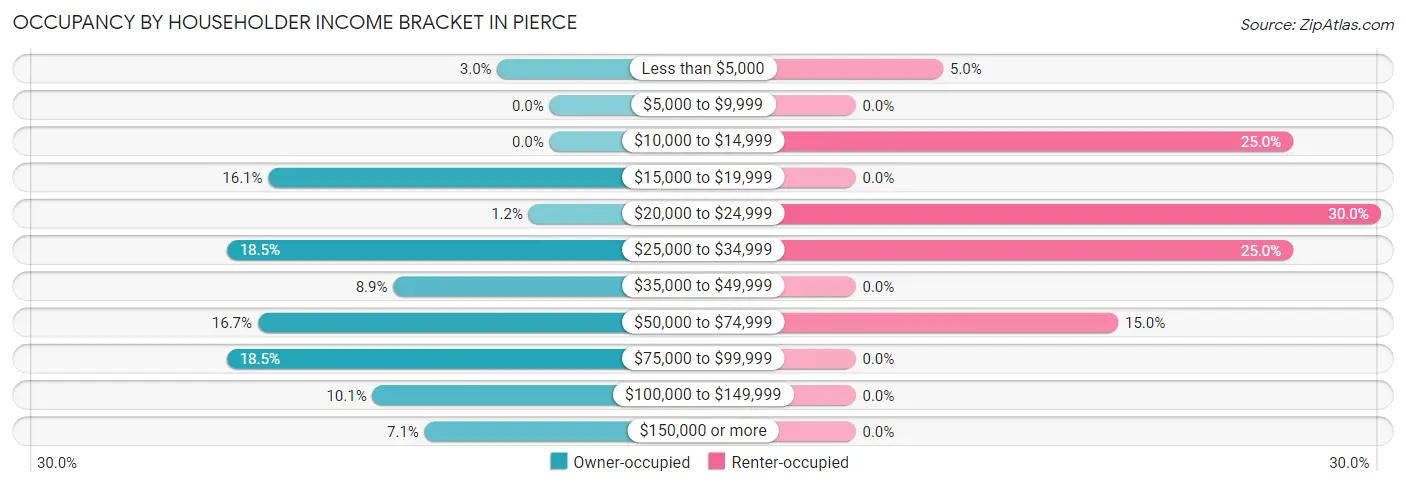
| Income Bracket | Owner-occupied | Renter-occupied |
| Less than $5,000 | 5 (3.0%) | 1 (5.0%) |
| $5,000 to $9,999 | 0 (0.0%) | 0 (0.0%) |
| $10,000 to $14,999 | 0 (0.0%) | 5 (25.0%) |
| $15,000 to $19,999 | 27 (16.1%) | 0 (0.0%) |
| $20,000 to $24,999 | 2 (1.2%) | 6 (30.0%) |
| $25,000 to $34,999 | 31 (18.4%) | 5 (25.0%) |
| $35,000 to $49,999 | 15 (8.9%) | 0 (0.0%) |
| $50,000 to $74,999 | 28 (16.7%) | 3 (15.0%) |
| $75,000 to $99,999 | 31 (18.4%) | 0 (0.0%) |
| $100,000 to $149,999 | 17 (10.1%) | 0 (0.0%) |
| $150,000 or more | 12 (7.1%) | 0 (0.0%) |
| Total | 168 (100.0%) | 20 (100.0%) |
Monthly Housing Cost Tiers in Pierce
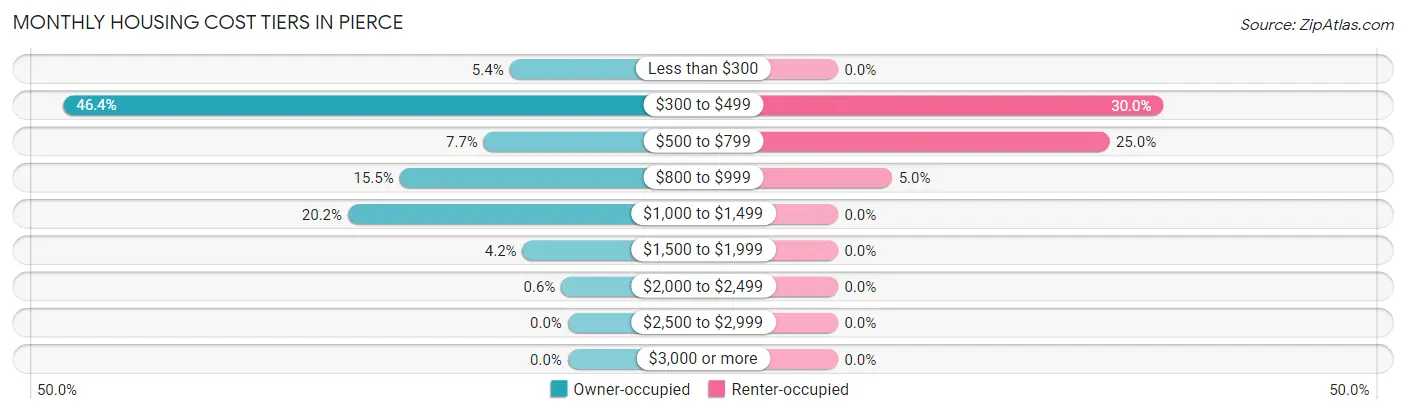
| Monthly Cost | Owner-occupied | Renter-occupied |
| Less than $300 | 9 (5.4%) | 0 (0.0%) |
| $300 to $499 | 78 (46.4%) | 6 (30.0%) |
| $500 to $799 | 13 (7.7%) | 5 (25.0%) |
| $800 to $999 | 26 (15.5%) | 1 (5.0%) |
| $1,000 to $1,499 | 34 (20.2%) | 0 (0.0%) |
| $1,500 to $1,999 | 7 (4.2%) | 0 (0.0%) |
| $2,000 to $2,499 | 1 (0.6%) | 0 (0.0%) |
| $2,500 to $2,999 | 0 (0.0%) | 0 (0.0%) |
| $3,000 or more | 0 (0.0%) | 0 (0.0%) |
| Total | 168 (100.0%) | 20 (100.0%) |
Physical Housing Characteristics in Pierce
Housing Structures in Pierce
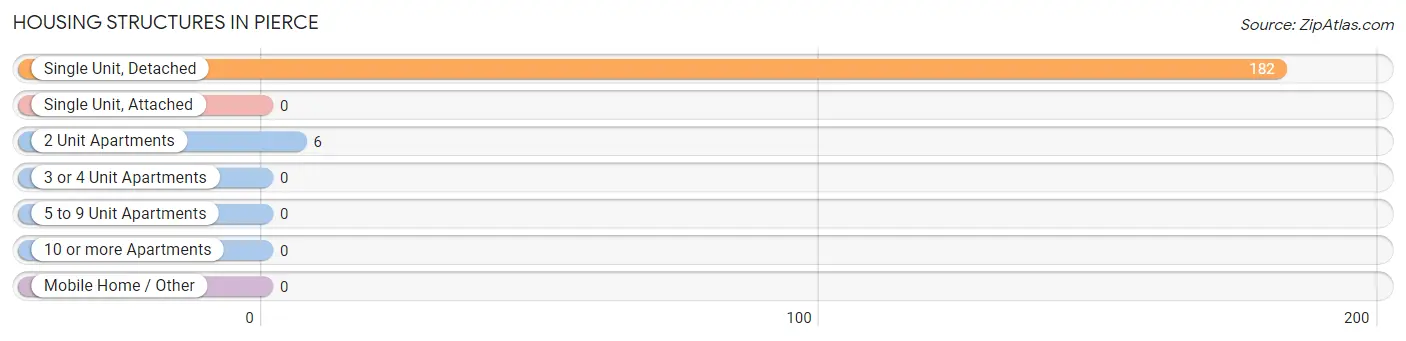
| Structure Type | # Housing Units | % Housing Units |
| Single Unit, Detached | 182 | 96.8% |
| Single Unit, Attached | 0 | 0.0% |
| 2 Unit Apartments | 6 | 3.2% |
| 3 or 4 Unit Apartments | 0 | 0.0% |
| 5 to 9 Unit Apartments | 0 | 0.0% |
| 10 or more Apartments | 0 | 0.0% |
| Mobile Home / Other | 0 | 0.0% |
| Total | 188 | 100.0% |
Housing Structures by Occupancy in Pierce
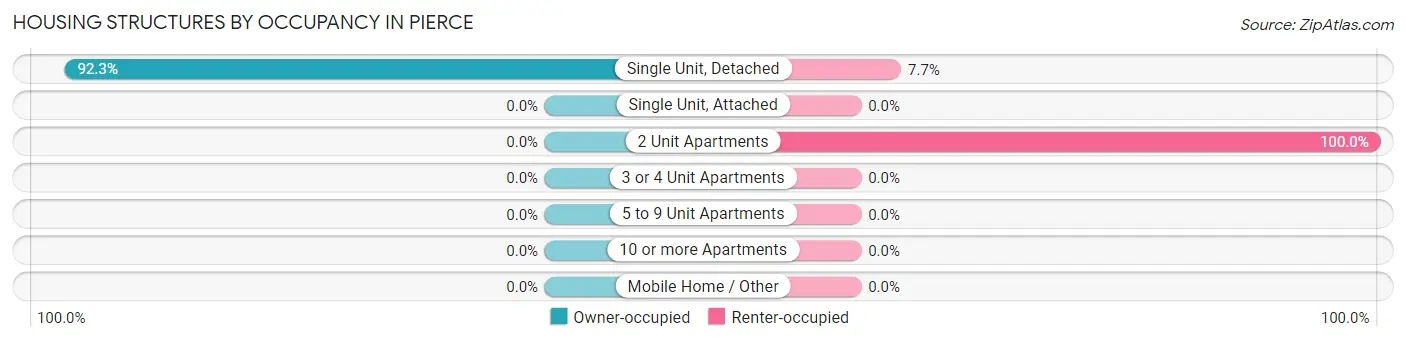
| Structure Type | Owner-occupied | Renter-occupied |
| Single Unit, Detached | 168 (92.3%) | 14 (7.7%) |
| Single Unit, Attached | 0 (0.0%) | 0 (0.0%) |
| 2 Unit Apartments | 0 (0.0%) | 6 (100.0%) |
| 3 or 4 Unit Apartments | 0 (0.0%) | 0 (0.0%) |
| 5 to 9 Unit Apartments | 0 (0.0%) | 0 (0.0%) |
| 10 or more Apartments | 0 (0.0%) | 0 (0.0%) |
| Mobile Home / Other | 0 (0.0%) | 0 (0.0%) |
| Total | 168 (89.4%) | 20 (10.6%) |
Housing Structures by Number of Rooms in Pierce
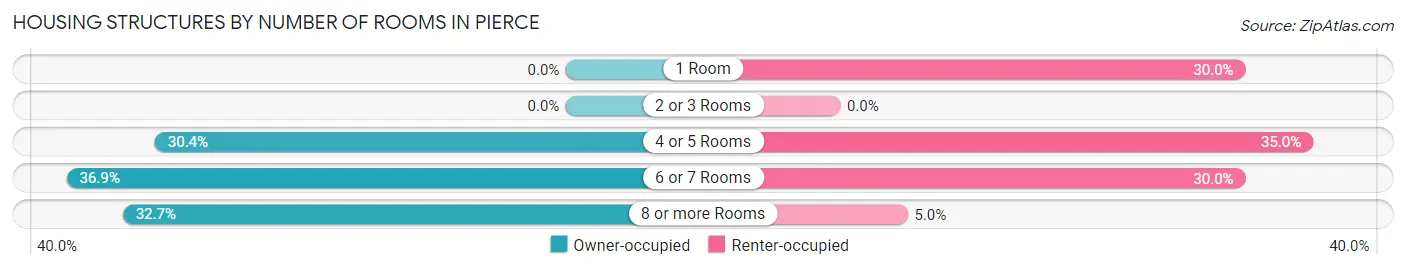
| Number of Rooms | Owner-occupied | Renter-occupied |
| 1 Room | 0 (0.0%) | 6 (30.0%) |
| 2 or 3 Rooms | 0 (0.0%) | 0 (0.0%) |
| 4 or 5 Rooms | 51 (30.4%) | 7 (35.0%) |
| 6 or 7 Rooms | 62 (36.9%) | 6 (30.0%) |
| 8 or more Rooms | 55 (32.7%) | 1 (5.0%) |
| Total | 168 (100.0%) | 20 (100.0%) |
Housing Structure by Heating Type in Pierce
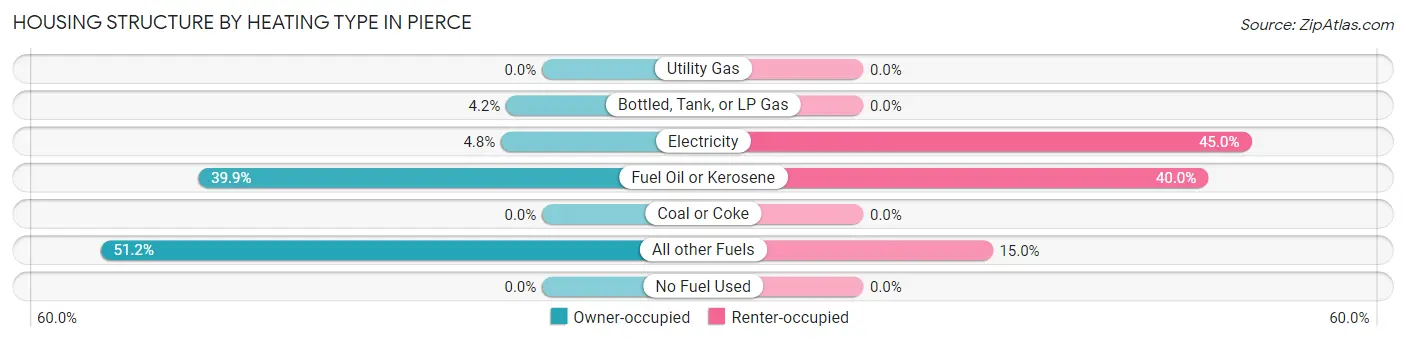
| Heating Type | Owner-occupied | Renter-occupied |
| Utility Gas | 0 (0.0%) | 0 (0.0%) |
| Bottled, Tank, or LP Gas | 7 (4.2%) | 0 (0.0%) |
| Electricity | 8 (4.8%) | 9 (45.0%) |
| Fuel Oil or Kerosene | 67 (39.9%) | 8 (40.0%) |
| Coal or Coke | 0 (0.0%) | 0 (0.0%) |
| All other Fuels | 86 (51.2%) | 3 (15.0%) |
| No Fuel Used | 0 (0.0%) | 0 (0.0%) |
| Total | 168 (100.0%) | 20 (100.0%) |
Household Vehicle Usage in Pierce
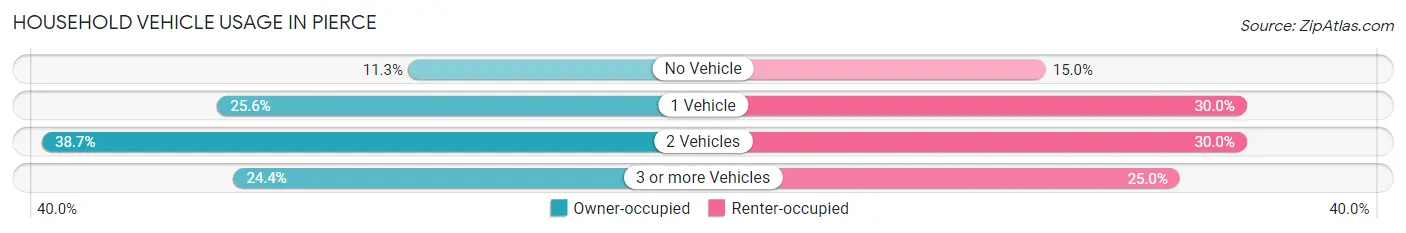
| Vehicles per Household | Owner-occupied | Renter-occupied |
| No Vehicle | 19 (11.3%) | 3 (15.0%) |
| 1 Vehicle | 43 (25.6%) | 6 (30.0%) |
| 2 Vehicles | 65 (38.7%) | 6 (30.0%) |
| 3 or more Vehicles | 41 (24.4%) | 5 (25.0%) |
| Total | 168 (100.0%) | 20 (100.0%) |
Real Estate & Mortgages in Pierce
Real Estate and Mortgage Overview in Pierce
| Characteristic | Without Mortgage | With Mortgage |
| Housing Units | 101 | 67 |
| Median Property Value | $152,000 | $143,800 |
| Median Household Income | $29,926 | $10 |
| Monthly Housing Costs | $439 | $0 |
| Real Estate Taxes | $1,061 | $0 |
Property Value by Mortgage Status in Pierce
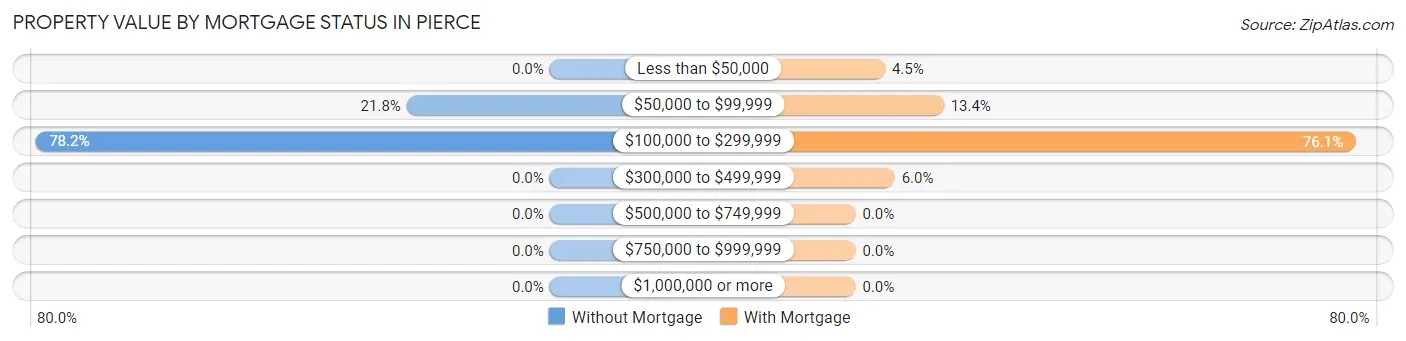
| Property Value | Without Mortgage | With Mortgage |
| Less than $50,000 | 0 (0.0%) | 3 (4.5%) |
| $50,000 to $99,999 | 22 (21.8%) | 9 (13.4%) |
| $100,000 to $299,999 | 79 (78.2%) | 51 (76.1%) |
| $300,000 to $499,999 | 0 (0.0%) | 4 (6.0%) |
| $500,000 to $749,999 | 0 (0.0%) | 0 (0.0%) |
| $750,000 to $999,999 | 0 (0.0%) | 0 (0.0%) |
| $1,000,000 or more | 0 (0.0%) | 0 (0.0%) |
| Total | 101 (100.0%) | 67 (100.0%) |
Household Income by Mortgage Status in Pierce
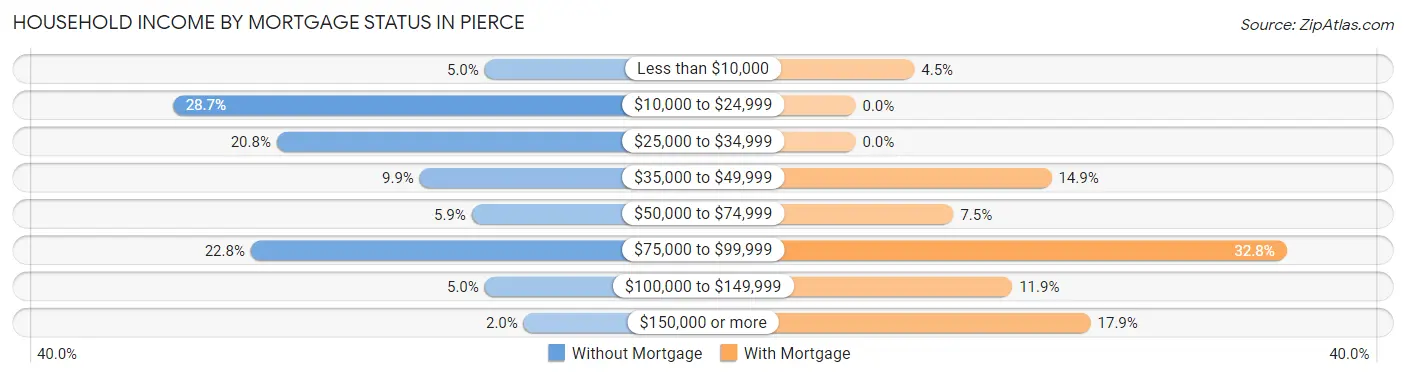
| Household Income | Without Mortgage | With Mortgage |
| Less than $10,000 | 5 (5.0%) | 3 (4.5%) |
| $10,000 to $24,999 | 29 (28.7%) | 0 (0.0%) |
| $25,000 to $34,999 | 21 (20.8%) | 0 (0.0%) |
| $35,000 to $49,999 | 10 (9.9%) | 10 (14.9%) |
| $50,000 to $74,999 | 6 (5.9%) | 5 (7.5%) |
| $75,000 to $99,999 | 23 (22.8%) | 22 (32.8%) |
| $100,000 to $149,999 | 5 (5.0%) | 8 (11.9%) |
| $150,000 or more | 2 (2.0%) | 12 (17.9%) |
| Total | 101 (100.0%) | 67 (100.0%) |
Property Value to Household Income Ratio in Pierce
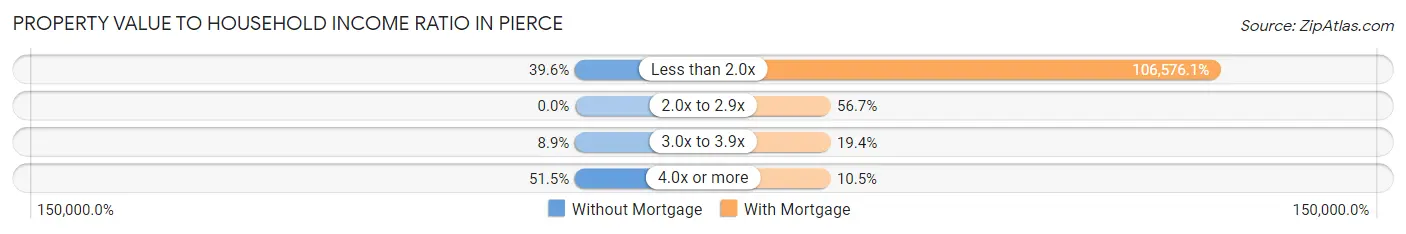
| Value-to-Income Ratio | Without Mortgage | With Mortgage |
| Less than 2.0x | 40 (39.6%) | 71,406 (106,576.1%) |
| 2.0x to 2.9x | 0 (0.0%) | 38 (56.7%) |
| 3.0x to 3.9x | 9 (8.9%) | 13 (19.4%) |
| 4.0x or more | 52 (51.5%) | 7 (10.4%) |
| Total | 101 (100.0%) | 67 (100.0%) |
Real Estate Taxes by Mortgage Status in Pierce
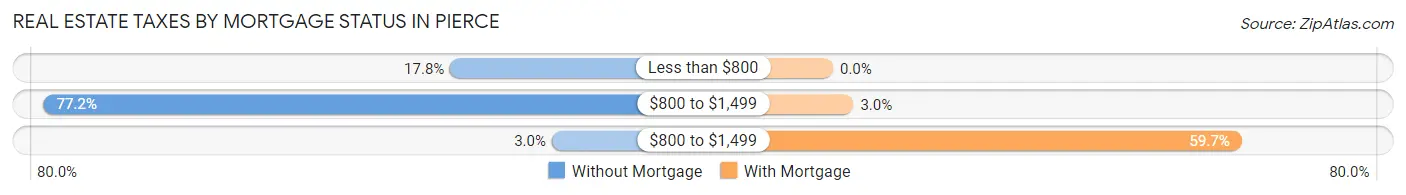
| Property Taxes | Without Mortgage | With Mortgage |
| Less than $800 | 18 (17.8%) | 0 (0.0%) |
| $800 to $1,499 | 78 (77.2%) | 2 (3.0%) |
| $800 to $1,499 | 3 (3.0%) | 40 (59.7%) |
| Total | 101 (100.0%) | 67 (100.0%) |
Health & Disability in Pierce
Health Insurance Coverage by Age in Pierce
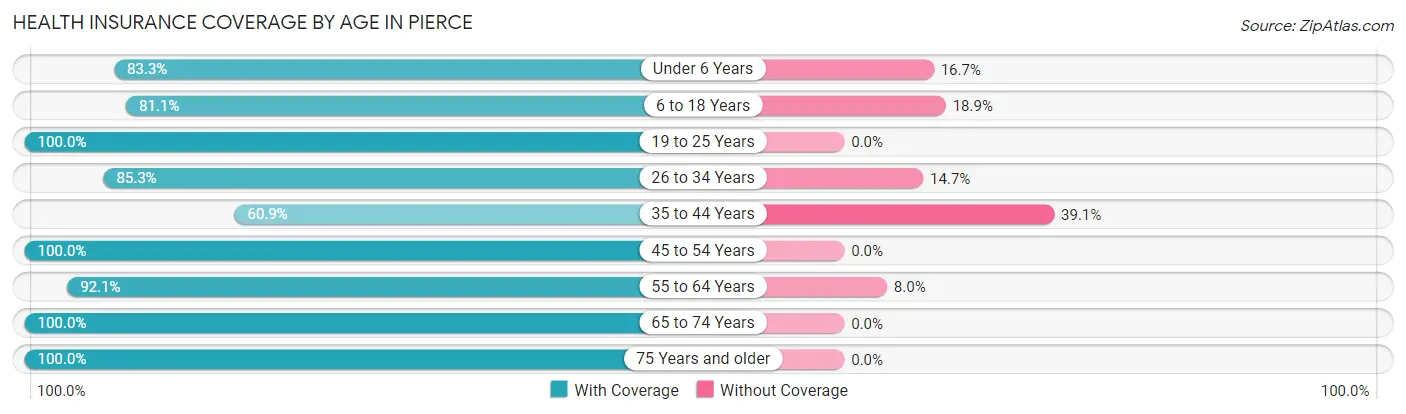
| Age Bracket | With Coverage | Without Coverage |
| Under 6 Years | 15 (83.3%) | 3 (16.7%) |
| 6 to 18 Years | 30 (81.1%) | 7 (18.9%) |
| 19 to 25 Years | 7 (100.0%) | 0 (0.0%) |
| 26 to 34 Years | 29 (85.3%) | 5 (14.7%) |
| 35 to 44 Years | 14 (60.9%) | 9 (39.1%) |
| 45 to 54 Years | 29 (100.0%) | 0 (0.0%) |
| 55 to 64 Years | 81 (92.0%) | 7 (8.0%) |
| 65 to 74 Years | 69 (100.0%) | 0 (0.0%) |
| 75 Years and older | 82 (100.0%) | 0 (0.0%) |
| Total | 356 (92.0%) | 31 (8.0%) |
Health Insurance Coverage by Citizenship Status in Pierce
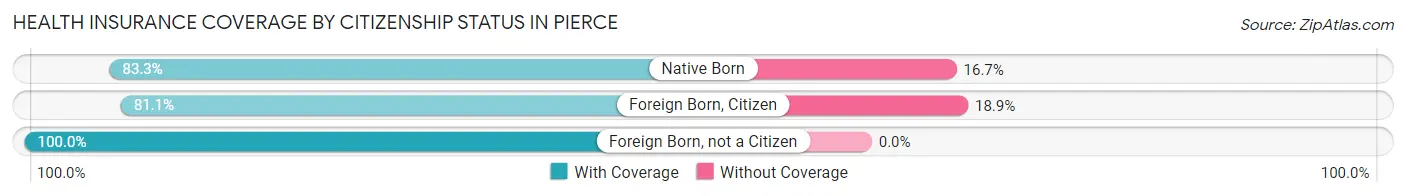
| Citizenship Status | With Coverage | Without Coverage |
| Native Born | 15 (83.3%) | 3 (16.7%) |
| Foreign Born, Citizen | 30 (81.1%) | 7 (18.9%) |
| Foreign Born, not a Citizen | 7 (100.0%) | 0 (0.0%) |
Health Insurance Coverage by Household Income in Pierce
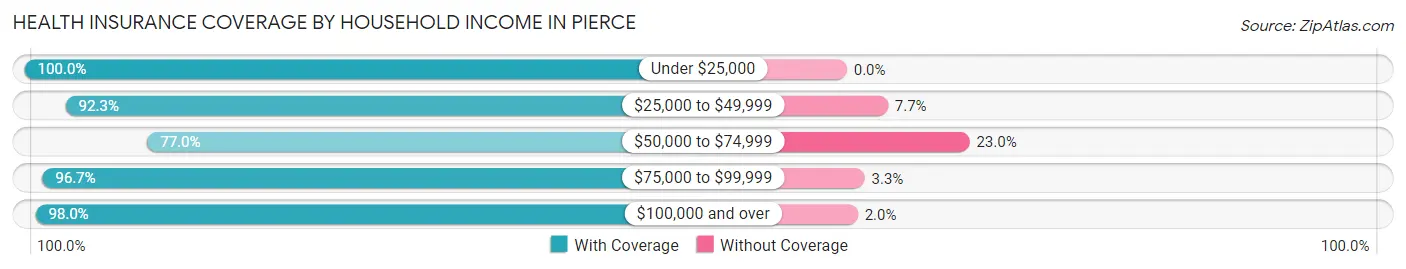
| Household Income | With Coverage | Without Coverage |
| Under $25,000 | 51 (100.0%) | 0 (0.0%) |
| $25,000 to $49,999 | 84 (92.3%) | 7 (7.7%) |
| $50,000 to $74,999 | 67 (77.0%) | 20 (23.0%) |
| $75,000 to $99,999 | 58 (96.7%) | 2 (3.3%) |
| $100,000 and over | 96 (98.0%) | 2 (2.0%) |
Public vs Private Health Insurance Coverage by Age in Pierce
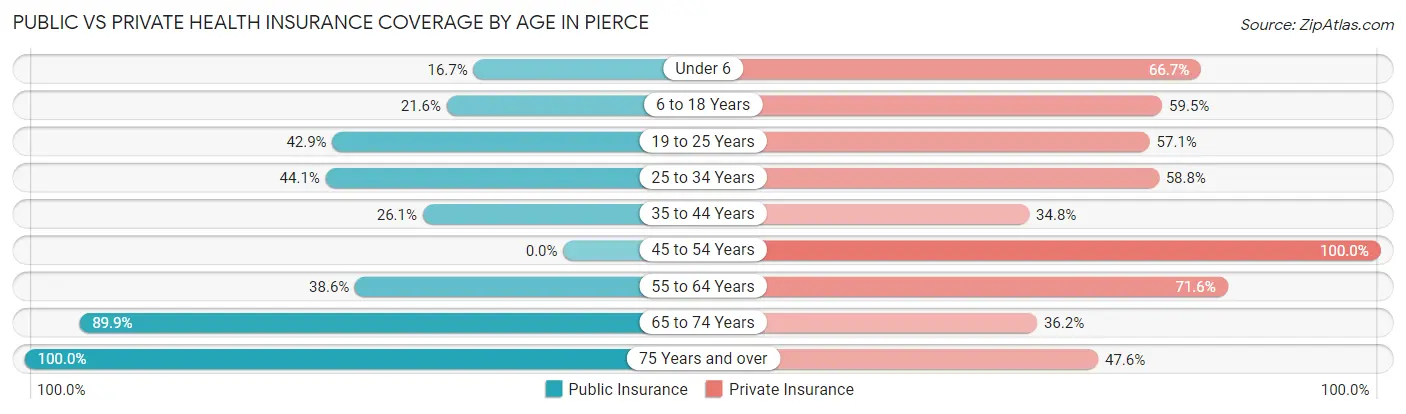
| Age Bracket | Public Insurance | Private Insurance |
| Under 6 | 3 (16.7%) | 12 (66.7%) |
| 6 to 18 Years | 8 (21.6%) | 22 (59.5%) |
| 19 to 25 Years | 3 (42.9%) | 4 (57.1%) |
| 25 to 34 Years | 15 (44.1%) | 20 (58.8%) |
| 35 to 44 Years | 6 (26.1%) | 8 (34.8%) |
| 45 to 54 Years | 0 (0.0%) | 29 (100.0%) |
| 55 to 64 Years | 34 (38.6%) | 63 (71.6%) |
| 65 to 74 Years | 62 (89.9%) | 25 (36.2%) |
| 75 Years and over | 82 (100.0%) | 39 (47.6%) |
| Total | 213 (55.0%) | 222 (57.4%) |
Disability Status by Sex by Age in Pierce
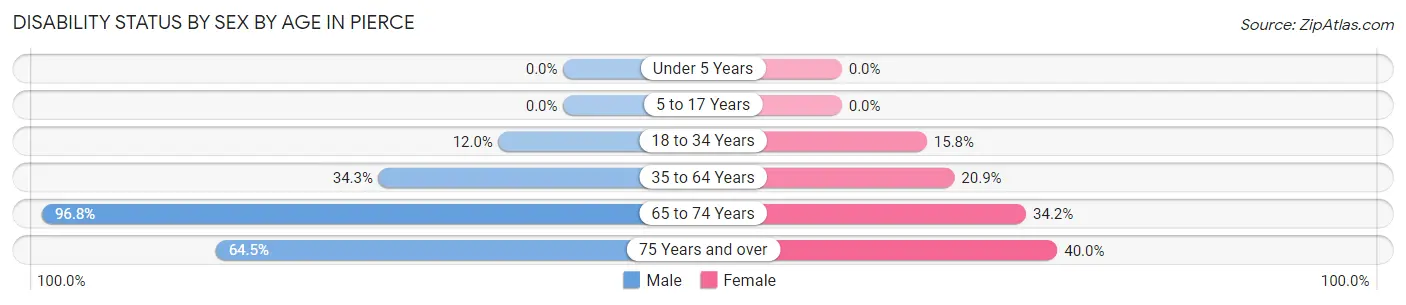
| Age Bracket | Male | Female |
| Under 5 Years | 0 (0.0%) | 0 (0.0%) |
| 5 to 17 Years | 0 (0.0%) | 0 (0.0%) |
| 18 to 34 Years | 3 (12.0%) | 3 (15.8%) |
| 35 to 64 Years | 25 (34.3%) | 14 (20.9%) |
| 65 to 74 Years | 30 (96.8%) | 13 (34.2%) |
| 75 Years and over | 40 (64.5%) | 8 (40.0%) |
Disability Class by Sex by Age in Pierce
Disability Class: Hearing Difficulty
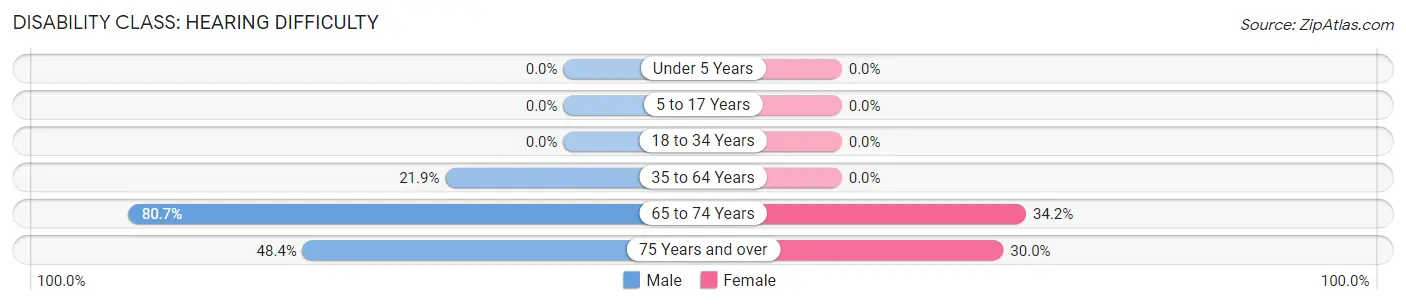
| Age Bracket | Male | Female |
| Under 5 Years | 0 (0.0%) | 0 (0.0%) |
| 5 to 17 Years | 0 (0.0%) | 0 (0.0%) |
| 18 to 34 Years | 0 (0.0%) | 0 (0.0%) |
| 35 to 64 Years | 16 (21.9%) | 0 (0.0%) |
| 65 to 74 Years | 25 (80.6%) | 13 (34.2%) |
| 75 Years and over | 30 (48.4%) | 6 (30.0%) |
Disability Class: Vision Difficulty
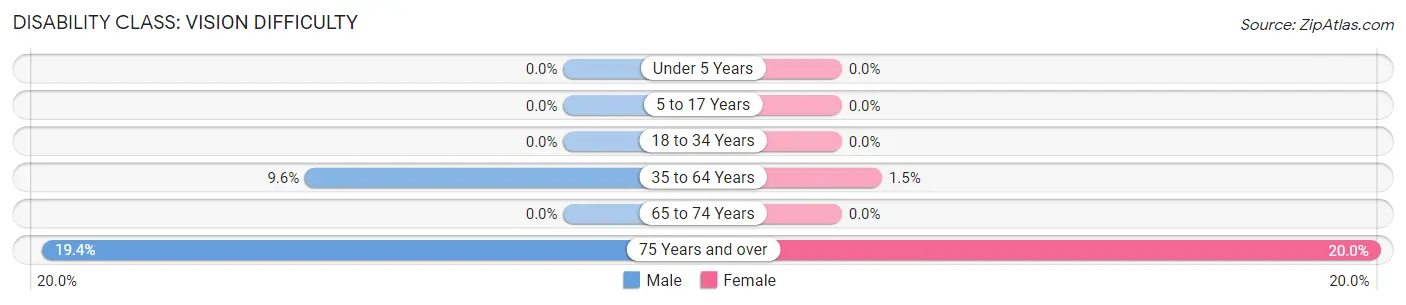
| Age Bracket | Male | Female |
| Under 5 Years | 0 (0.0%) | 0 (0.0%) |
| 5 to 17 Years | 0 (0.0%) | 0 (0.0%) |
| 18 to 34 Years | 0 (0.0%) | 0 (0.0%) |
| 35 to 64 Years | 7 (9.6%) | 1 (1.5%) |
| 65 to 74 Years | 0 (0.0%) | 0 (0.0%) |
| 75 Years and over | 12 (19.4%) | 4 (20.0%) |
Disability Class: Cognitive Difficulty
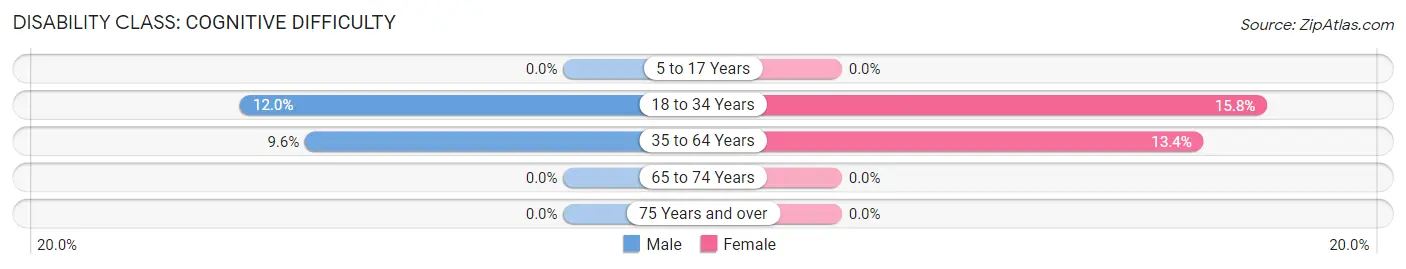
| Age Bracket | Male | Female |
| 5 to 17 Years | 0 (0.0%) | 0 (0.0%) |
| 18 to 34 Years | 3 (12.0%) | 3 (15.8%) |
| 35 to 64 Years | 7 (9.6%) | 9 (13.4%) |
| 65 to 74 Years | 0 (0.0%) | 0 (0.0%) |
| 75 Years and over | 0 (0.0%) | 0 (0.0%) |
Disability Class: Ambulatory Difficulty
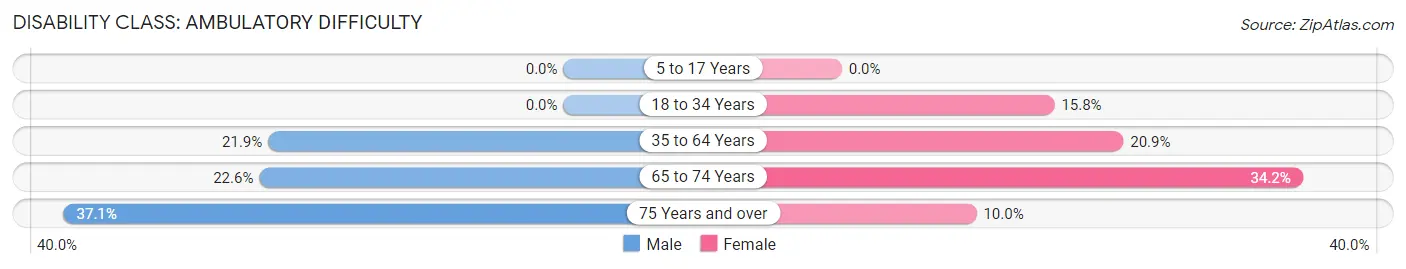
| Age Bracket | Male | Female |
| 5 to 17 Years | 0 (0.0%) | 0 (0.0%) |
| 18 to 34 Years | 0 (0.0%) | 3 (15.8%) |
| 35 to 64 Years | 16 (21.9%) | 14 (20.9%) |
| 65 to 74 Years | 7 (22.6%) | 13 (34.2%) |
| 75 Years and over | 23 (37.1%) | 2 (10.0%) |
Disability Class: Self-Care Difficulty
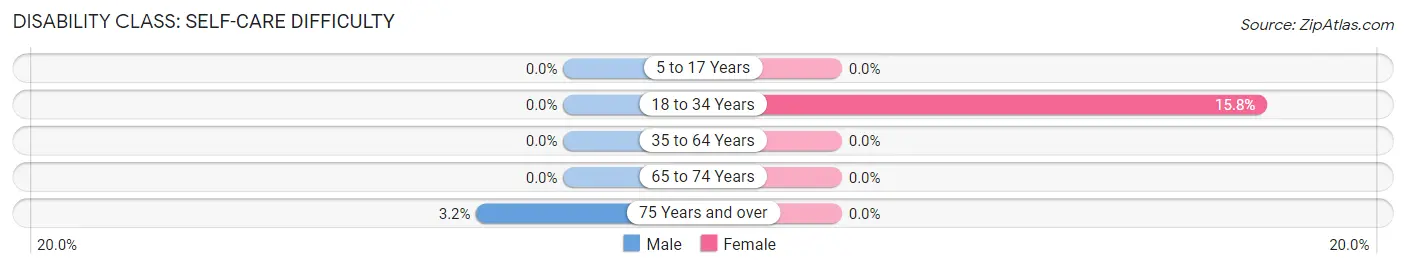
| Age Bracket | Male | Female |
| 5 to 17 Years | 0 (0.0%) | 0 (0.0%) |
| 18 to 34 Years | 0 (0.0%) | 3 (15.8%) |
| 35 to 64 Years | 0 (0.0%) | 0 (0.0%) |
| 65 to 74 Years | 0 (0.0%) | 0 (0.0%) |
| 75 Years and over | 2 (3.2%) | 0 (0.0%) |
Technology Access in Pierce
Computing Device Access in Pierce
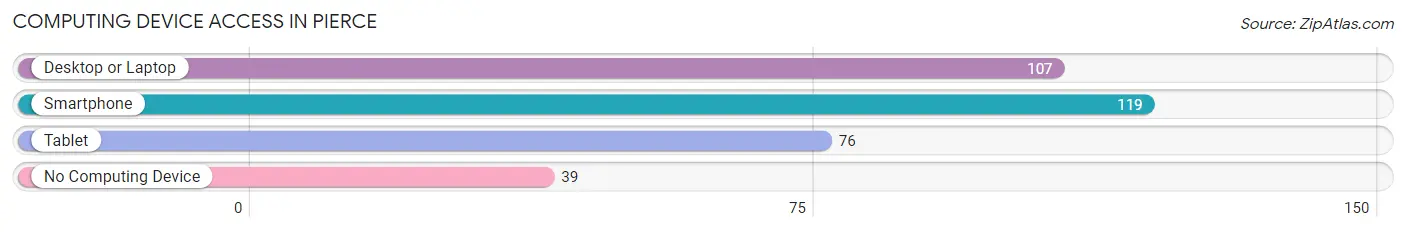
| Device Type | # Households | % Households |
| Desktop or Laptop | 107 | 56.9% |
| Smartphone | 119 | 63.3% |
| Tablet | 76 | 40.4% |
| No Computing Device | 39 | 20.7% |
| Total | 188 | 100.0% |
Internet Access in Pierce
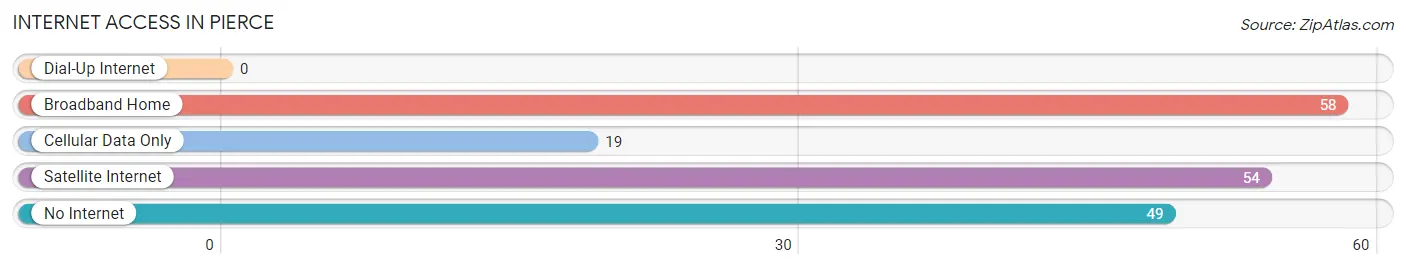
| Internet Type | # Households | % Households |
| Dial-Up Internet | 0 | 0.0% |
| Broadband Home | 58 | 30.8% |
| Cellular Data Only | 19 | 10.1% |
| Satellite Internet | 54 | 28.7% |
| No Internet | 49 | 26.1% |
| Total | 188 | 100.0% |
Pierce Summary
Pierce, Idaho is a small town located in Clearwater County, in the northern part of the state. It is situated on the banks of the Clearwater River, and is surrounded by the Nez Perce National Forest. The town has a population of just over 500 people, and is a popular destination for outdoor recreation.
History
Pierce was founded in 1883 by a group of settlers from the nearby town of Orofino. The settlers were looking for a place to settle and farm, and Pierce was the perfect spot. The town was named after the first settler, William Pierce, who was a Civil War veteran. The town quickly grew, and by the early 1900s, it had become a bustling community with a population of over 500 people.
The town was an important stop on the Northern Pacific Railroad, and it was also the site of a large sawmill. The sawmill provided jobs for many of the town’s residents, and it was a major source of income for the town.
Geography
Pierce is located in the northern part of Clearwater County, in the Clearwater River Valley. The town is situated on the banks of the Clearwater River, and is surrounded by the Nez Perce National Forest. The town is located at an elevation of 2,400 feet, and has a total area of 0.7 square miles.
The climate in Pierce is generally mild, with warm summers and cold winters. The average annual temperature is around 45 degrees Fahrenheit, and the average annual precipitation is around 20 inches.
Economy
The economy of Pierce is largely based on tourism and outdoor recreation. The town is a popular destination for fishing, hunting, camping, and other outdoor activities. The town also has a few small businesses, including a grocery store, a hardware store, and a few restaurants.
The town is also home to a few small manufacturing companies, including a sawmill and a woodworking shop. The sawmill is the largest employer in the town, and it provides jobs for many of the town’s residents.
Demographics
As of the 2010 census, the population of Pierce was 514 people. The racial makeup of the town was 95.3% White, 0.6% Native American, 0.2% Asian, 0.2% from other races, and 3.7% from two or more races. The median household income was $31,250, and the median family income was $37,500.
The town is home to a few churches, including the First Baptist Church, the Church of Jesus Christ of Latter-day Saints, and the United Methodist Church. The town also has a public library, a post office, and a few small businesses.
Pierce is a small town with a rich history and a vibrant economy. The town is a popular destination for outdoor recreation, and it is home to a few small businesses. The town has a population of just over 500 people, and it is a great place to live and work.
Common Questions
What is the Total Population of Pierce?
Total Population of Pierce is 388.
What is the Total Male Population of Pierce?
Total Male Population of Pierce is 232.
What is the Total Female Population of Pierce?
Total Female Population of Pierce is 156.
What is the Ratio of Males per 100 Females in Pierce?
There are 148.72 Males per 100 Females in Pierce.
What is the Ratio of Females per 100 Males in Pierce?
There are 67.24 Females per 100 Males in Pierce.
What is the Median Population Age in Pierce?
Median Population Age in Pierce is 60.6 Years.
What is the Average Family Size in Pierce
Average Family Size in Pierce is 2.8 People.
What is the Average Household Size in Pierce
Average Household Size in Pierce is 2.1 People.
What is Per Capita Income in Pierce?
Per Capita income in Pierce is $37,483.
What is the Median Family Income in Pierce?
Median Family Income in Pierce is $69,500.
What is the Median Household income in Pierce?
Median Household Income in Pierce is $44,643.
What is Income or Wage Gap in Pierce?
Income or Wage Gap in Pierce is 7.6%.
Women in Pierce earn 92.4 cents for every dollar earned by a man.
What is Inequality or Gini Index in Pierce?
Inequality or Gini Index in Pierce is 0.51.
How Large is the Labor Force in Pierce?
There are 155 People in the Labor Forcein in Pierce.
What is the Percentage of People in the Labor Force in Pierce?
45.7% of People are in the Labor Force in Pierce.
What is the Unemployment Rate in Pierce?
Unemployment Rate in Pierce is 2.6%.