Mud Lake, ID
Mud Lake Map
Mud Lake Overview
468
TOTAL POPULATION
220
MALE POPULATION
248
FEMALE POPULATION
88.71
MALES / 100 FEMALES
112.73
FEMALES / 100 MALES
29.1
MEDIAN AGE
3.5
AVG FAMILY SIZE
3.2
AVG HOUSEHOLD SIZE
$20,001
PER CAPITA INCOME
$52,096
AVG FAMILY INCOME
$52,206
AVG HOUSEHOLD INCOME
56.0%
WAGE / INCOME GAP [ % ]
44.0¢/ $1
WAGE / INCOME GAP [ $ ]
0.31
INEQUALITY / GINI INDEX
201
LABOR FORCE [ PEOPLE ]
62.2%
PERCENT IN LABOR FORCE
5.0%
UNEMPLOYMENT RATE
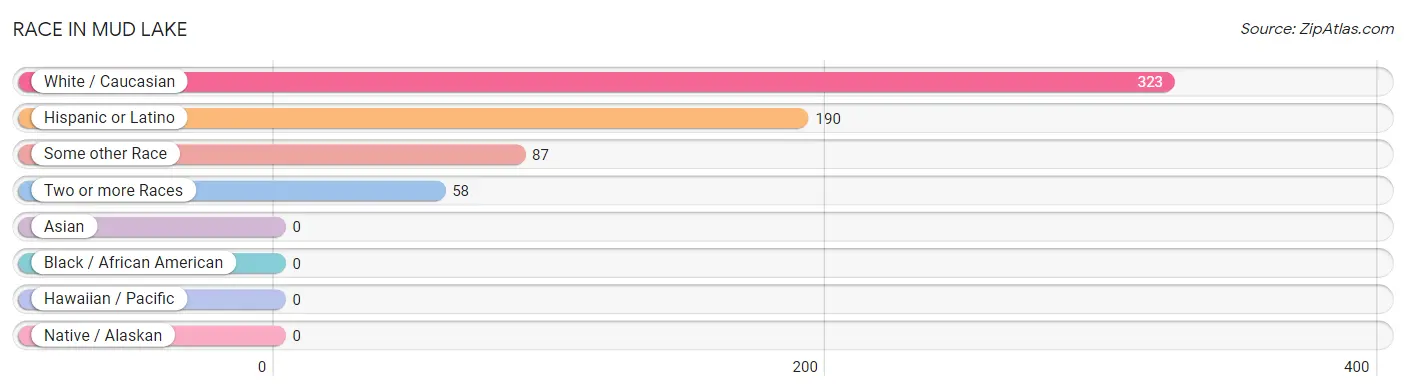
Race in Mud Lake
The most populous races in Mud Lake are White / Caucasian (323 | 69.0%), Hispanic or Latino (190 | 40.6%), and Some other Race (87 | 18.6%).
| Race | # Population | % Population |
| Asian | 0 | 0.0% |
| Black / African American | 0 | 0.0% |
| Hawaiian / Pacific | 0 | 0.0% |
| Hispanic or Latino | 190 | 40.6% |
| Native / Alaskan | 0 | 0.0% |
| White / Caucasian | 323 | 69.0% |
| Two or more Races | 58 | 12.4% |
| Some other Race | 87 | 18.6% |
| Total | 468 | 100.0% |
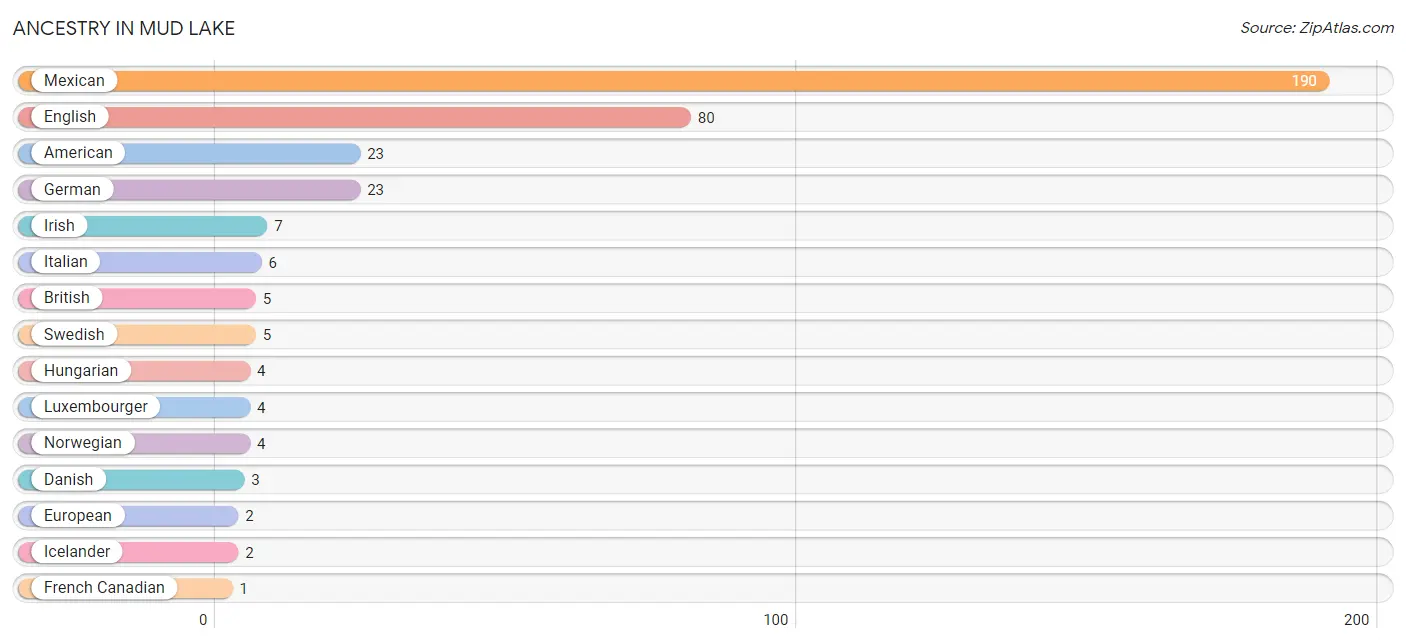
Ancestry in Mud Lake
The most populous ancestries reported in Mud Lake are Mexican (190 | 40.6%), English (80 | 17.1%), American (23 | 4.9%), German (23 | 4.9%), and Irish (7 | 1.5%), together accounting for 69.0% of all Mud Lake residents.
| Ancestry | # Population | % Population |
| American | 23 | 4.9% |
| British | 5 | 1.1% |
| Danish | 3 | 0.6% |
| English | 80 | 17.1% |
| European | 2 | 0.4% |
| French Canadian | 1 | 0.2% |
| German | 23 | 4.9% |
| Hungarian | 4 | 0.9% |
| Icelander | 2 | 0.4% |
| Irish | 7 | 1.5% |
| Italian | 6 | 1.3% |
| Luxembourger | 4 | 0.9% |
| Mexican | 190 | 40.6% |
| Norwegian | 4 | 0.9% |
| Scandinavian | 1 | 0.2% |
| Swedish | 5 | 1.1% | View All 16 Rows |
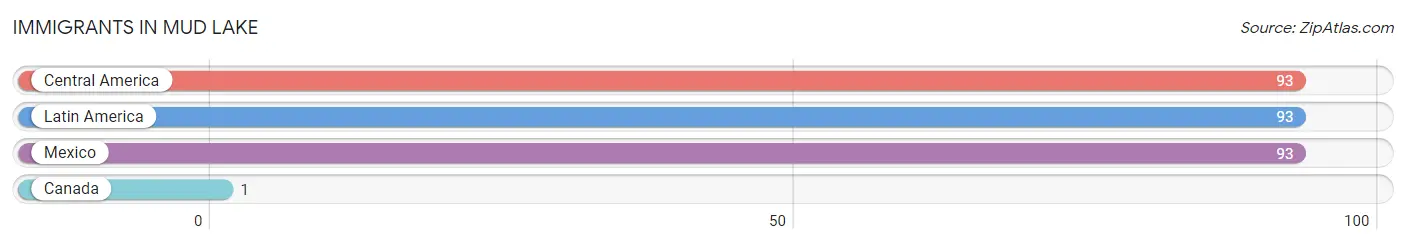
Immigrants in Mud Lake
The most numerous immigrant groups reported in Mud Lake came from Central America (93 | 19.9%), Latin America (93 | 19.9%), Mexico (93 | 19.9%), and Canada (1 | 0.2%), together accounting for 59.8% of all Mud Lake residents.
| Immigration Origin | # Population | % Population |
| Canada | 1 | 0.2% |
| Central America | 93 | 19.9% |
| Latin America | 93 | 19.9% |
| Mexico | 93 | 19.9% | View All 4 Rows |
Sex and Age in Mud Lake
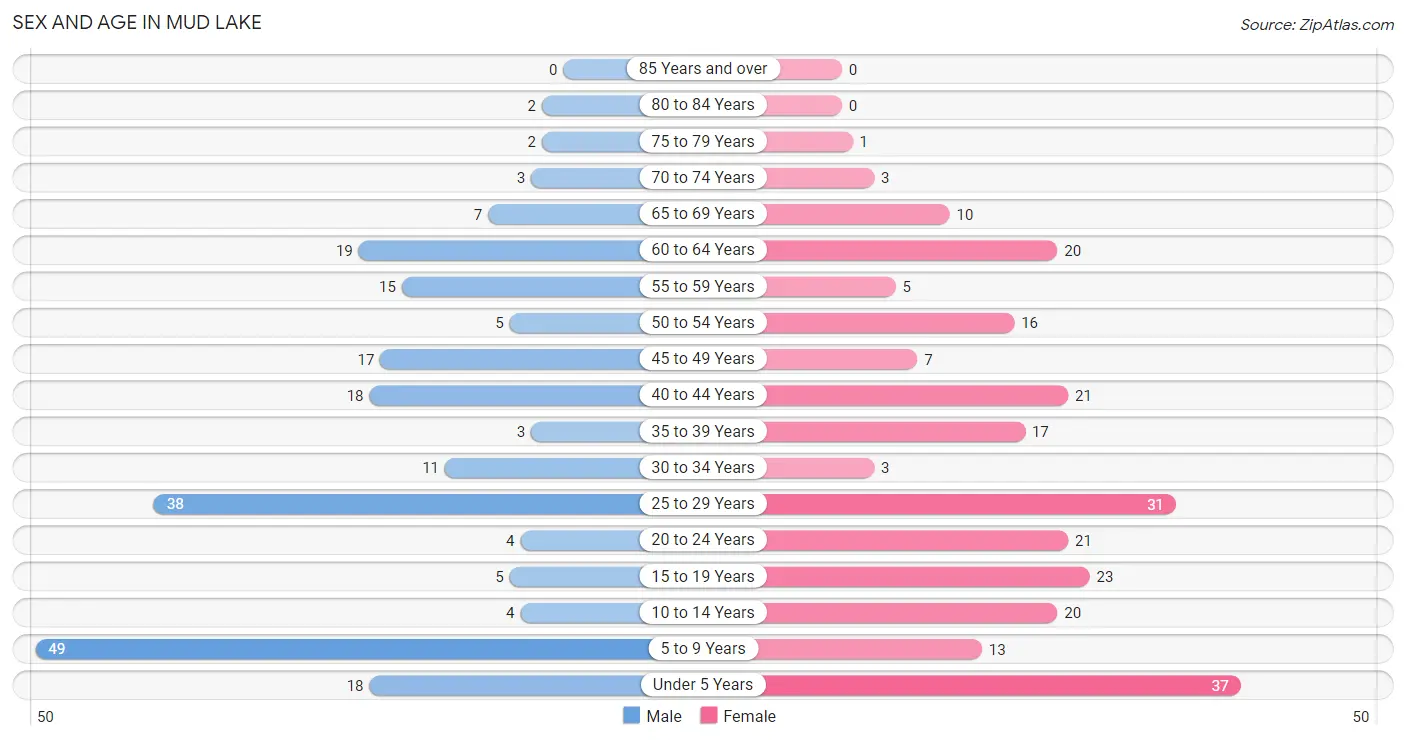
Sex and Age in Mud Lake
The most populous age groups in Mud Lake are 5 to 9 Years (49 | 22.3%) for men and Under 5 Years (37 | 14.9%) for women.
| Age Bracket | Male | Female |
| Under 5 Years | 18 (8.2%) | 37 (14.9%) |
| 5 to 9 Years | 49 (22.3%) | 13 (5.2%) |
| 10 to 14 Years | 4 (1.8%) | 20 (8.1%) |
| 15 to 19 Years | 5 (2.3%) | 23 (9.3%) |
| 20 to 24 Years | 4 (1.8%) | 21 (8.5%) |
| 25 to 29 Years | 38 (17.3%) | 31 (12.5%) |
| 30 to 34 Years | 11 (5.0%) | 3 (1.2%) |
| 35 to 39 Years | 3 (1.4%) | 17 (6.9%) |
| 40 to 44 Years | 18 (8.2%) | 21 (8.5%) |
| 45 to 49 Years | 17 (7.7%) | 7 (2.8%) |
| 50 to 54 Years | 5 (2.3%) | 16 (6.5%) |
| 55 to 59 Years | 15 (6.8%) | 5 (2.0%) |
| 60 to 64 Years | 19 (8.6%) | 20 (8.1%) |
| 65 to 69 Years | 7 (3.2%) | 10 (4.0%) |
| 70 to 74 Years | 3 (1.4%) | 3 (1.2%) |
| 75 to 79 Years | 2 (0.9%) | 1 (0.4%) |
| 80 to 84 Years | 2 (0.9%) | 0 (0.0%) |
| 85 Years and over | 0 (0.0%) | 0 (0.0%) |
| Total | 220 (100.0%) | 248 (100.0%) |
Families and Households in Mud Lake
Median Family Size in Mud Lake
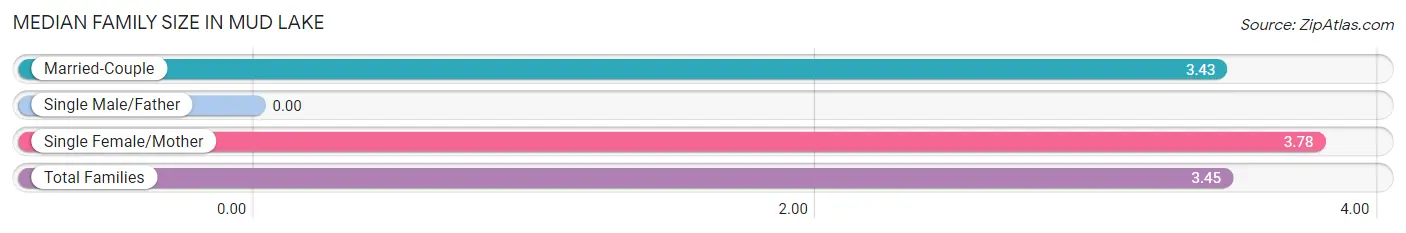
| Family Type | # Families | Family Size |
| Married-Couple | 120 (93.0%) | 3.43 |
| Single Male/Father | 0 (0.0%) | - |
| Single Female/Mother | 9 (7.0%) | 3.78 |
| Total Families | 129 (100.0%) | 3.45 |
Median Household Size in Mud Lake
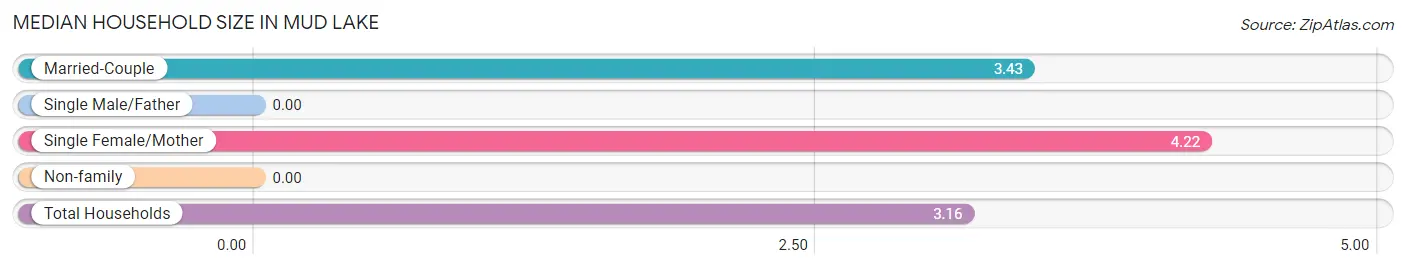
| Household Type | # Households | Household Size |
| Married-Couple | 120 (81.1%) | 3.43 |
| Single Male/Father | 0 (0.0%) | - |
| Single Female/Mother | 9 (6.1%) | 4.22 |
| Non-family | 19 (12.8%) | - |
| Total Households | 148 (100.0%) | 3.16 |
Household Size by Marriage Status in Mud Lake
Out of a total of 148 households in Mud Lake, 129 (87.2%) are family households, while 19 (12.8%) are nonfamily households. The most numerous type of family households are 4-person households, comprising 43, and the most common type of nonfamily households are 1-person households, comprising 19.
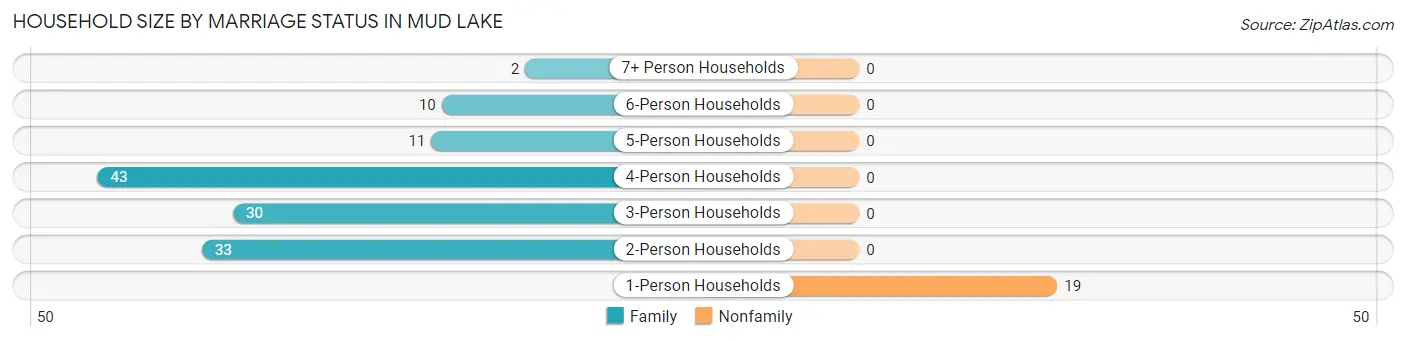
| Household Size | Family Households | Nonfamily Households |
| 1-Person Households | - | 19 (12.8%) |
| 2-Person Households | 33 (22.3%) | 0 (0.0%) |
| 3-Person Households | 30 (20.3%) | 0 (0.0%) |
| 4-Person Households | 43 (29.0%) | 0 (0.0%) |
| 5-Person Households | 11 (7.4%) | 0 (0.0%) |
| 6-Person Households | 10 (6.8%) | 0 (0.0%) |
| 7+ Person Households | 2 (1.3%) | 0 (0.0%) |
| Total | 129 (87.2%) | 19 (12.8%) |
Female Fertility in Mud Lake
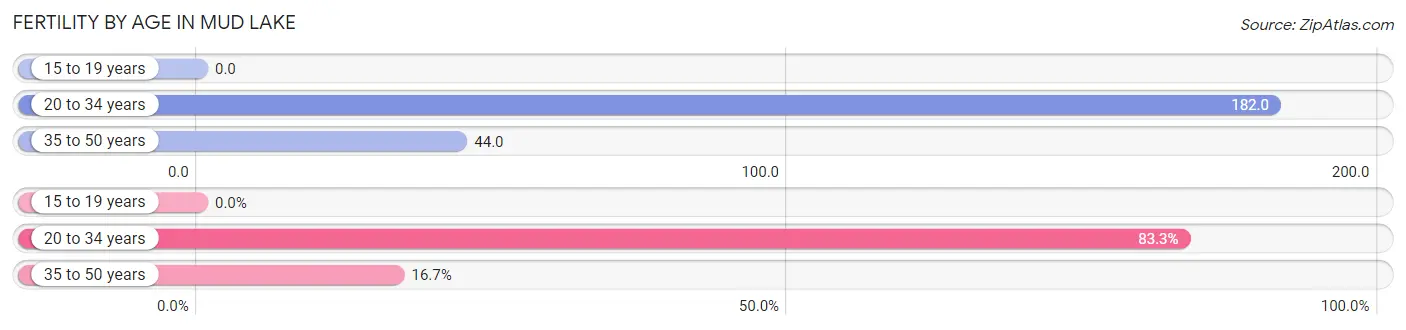
Fertility by Age in Mud Lake
Average fertility rate in Mud Lake is 98.0 births per 1,000 women. Women in the age bracket of 20 to 34 years have the highest fertility rate with 182.0 births per 1,000 women. Women in the age bracket of 20 to 34 years acount for 83.3% of all women with births.
| Age Bracket | Women with Births | Births / 1,000 Women |
| 15 to 19 years | 0 (0.0%) | 0.0 |
| 20 to 34 years | 10 (83.3%) | 182.0 |
| 35 to 50 years | 2 (16.7%) | 44.0 |
| Total | 12 (100.0%) | 98.0 |
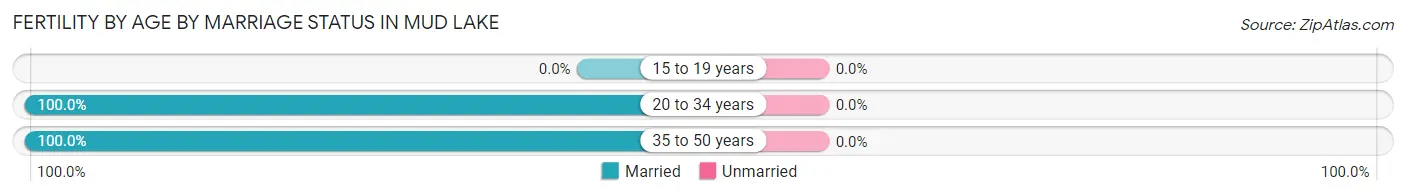
Fertility by Age by Marriage Status in Mud Lake
| Age Bracket | Married | Unmarried |
| 15 to 19 years | 0 (0.0%) | 0 (0.0%) |
| 20 to 34 years | 10 (100.0%) | 0 (0.0%) |
| 35 to 50 years | 2 (100.0%) | 0 (0.0%) |
| Total | 12 (100.0%) | 0 (0.0%) |
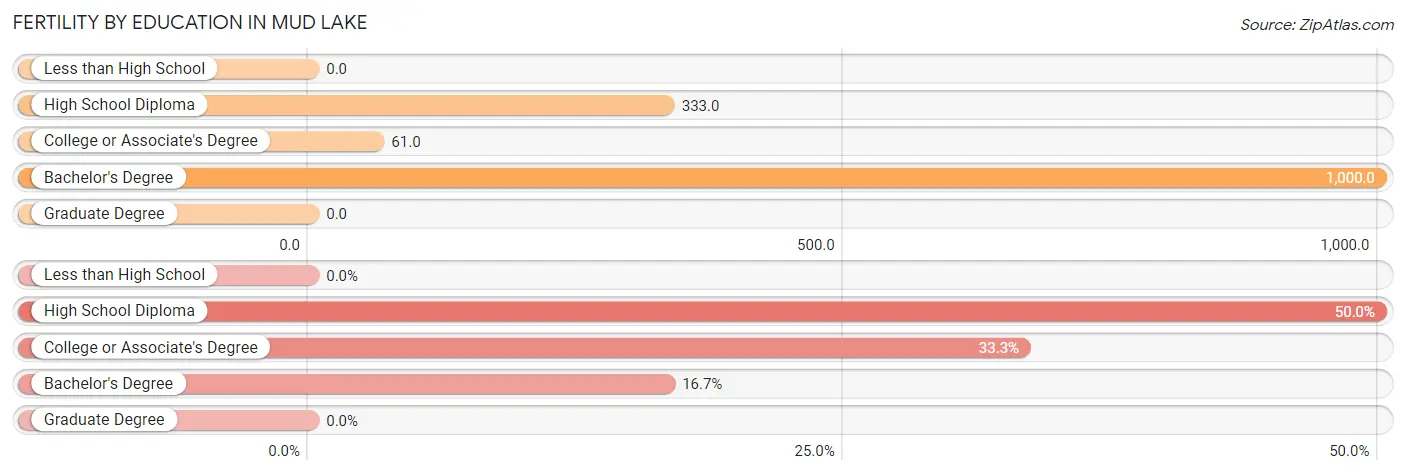
Fertility by Education in Mud Lake
| Educational Attainment | Women with Births | Births / 1,000 Women |
| Less than High School | 0 (0.0%) | 0.0 |
| High School Diploma | 6 (50.0%) | 333.0 |
| College or Associate's Degree | 4 (33.3%) | 61.0 |
| Bachelor's Degree | 2 (16.7%) | 1,000.0 |
| Graduate Degree | 0 (0.0%) | 0.0 |
| Total | 12 (100.0%) | 98.0 |
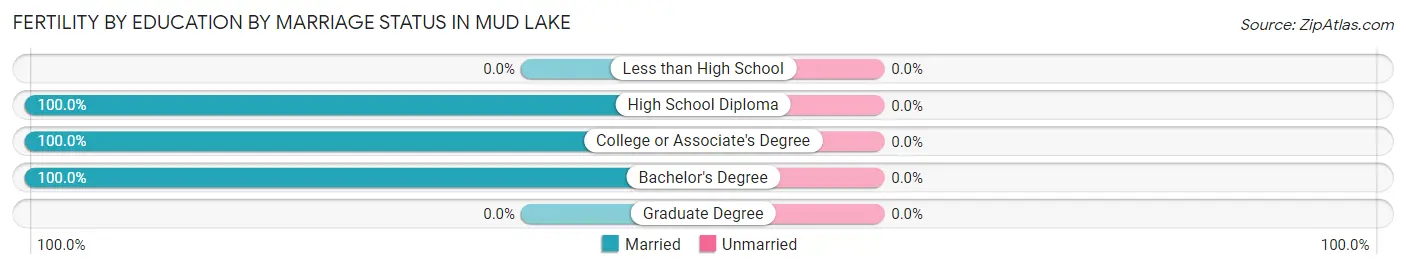
Fertility by Education by Marriage Status in Mud Lake
| Educational Attainment | Married | Unmarried |
| Less than High School | 0 (0.0%) | 0 (0.0%) |
| High School Diploma | 6 (100.0%) | 0 (0.0%) |
| College or Associate's Degree | 4 (100.0%) | 0 (0.0%) |
| Bachelor's Degree | 2 (100.0%) | 0 (0.0%) |
| Graduate Degree | 0 (0.0%) | 0 (0.0%) |
| Total | 12 (100.0%) | 0 (0.0%) |
Income in Mud Lake
Income Overview in Mud Lake
Per Capita Income in Mud Lake is $20,001, while median incomes of families and households are $52,096 and $52,206 respectively.
| Characteristic | Number | Measure |
| Per Capita Income | 468 | $20,001 |
| Median Family Income | 129 | $52,096 |
| Mean Family Income | 129 | $64,103 |
| Median Household Income | 148 | $52,206 |
| Mean Household Income | 148 | $63,101 |
| Income Deficit | 129 | $0 |
| Wage / Income Gap (%) | 468 | 56.00% |
| Wage / Income Gap ($) | 468 | 44.00¢ per $1 |
| Gini / Inequality Index | 468 | 0.31 |
Earnings by Sex in Mud Lake
Average Earnings in Mud Lake are $33,750, $46,020 for men and $20,250 for women, a difference of 56.0%.
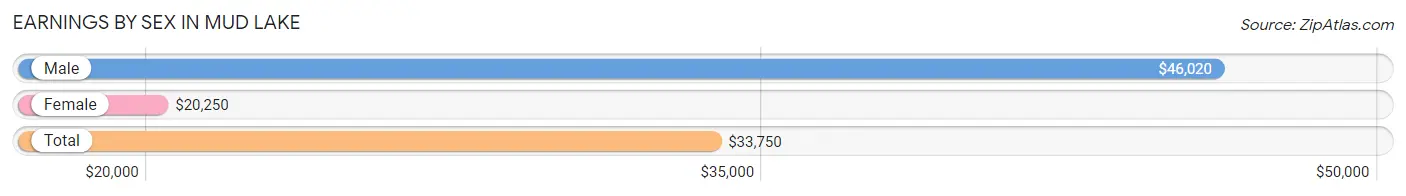
| Sex | Number | Average Earnings |
| Male | 125 (59.0%) | $46,020 |
| Female | 87 (41.0%) | $20,250 |
| Total | 212 (100.0%) | $33,750 |
Earnings by Sex by Income Bracket in Mud Lake
The most common earnings brackets in Mud Lake are $45,000 to $49,999 for men (38 | 30.4%) and $7,500 to $9,999 for women (16 | 18.4%).
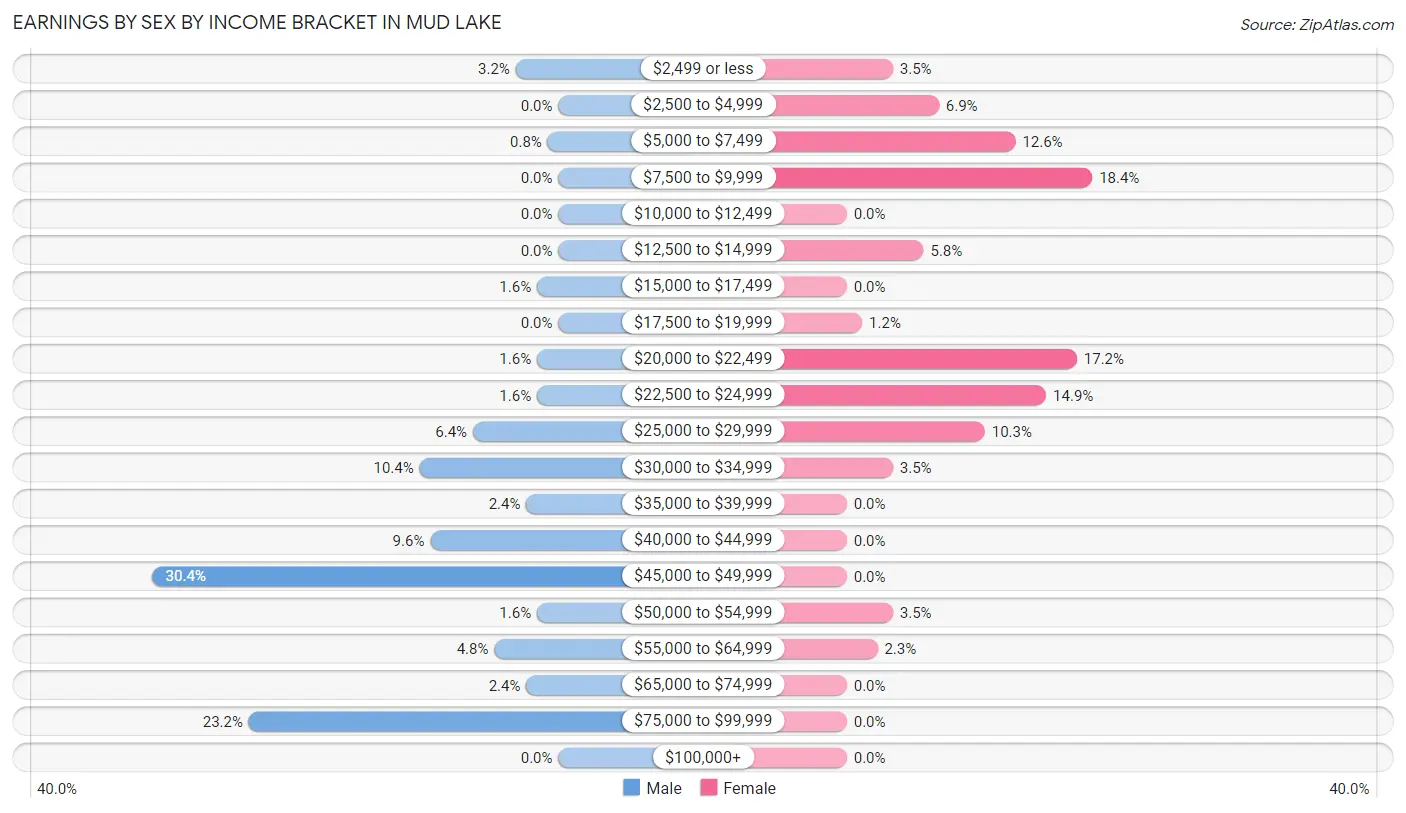
| Income | Male | Female |
| $2,499 or less | 4 (3.2%) | 3 (3.5%) |
| $2,500 to $4,999 | 0 (0.0%) | 6 (6.9%) |
| $5,000 to $7,499 | 1 (0.8%) | 11 (12.6%) |
| $7,500 to $9,999 | 0 (0.0%) | 16 (18.4%) |
| $10,000 to $12,499 | 0 (0.0%) | 0 (0.0%) |
| $12,500 to $14,999 | 0 (0.0%) | 5 (5.8%) |
| $15,000 to $17,499 | 2 (1.6%) | 0 (0.0%) |
| $17,500 to $19,999 | 0 (0.0%) | 1 (1.1%) |
| $20,000 to $22,499 | 2 (1.6%) | 15 (17.2%) |
| $22,500 to $24,999 | 2 (1.6%) | 13 (14.9%) |
| $25,000 to $29,999 | 8 (6.4%) | 9 (10.3%) |
| $30,000 to $34,999 | 13 (10.4%) | 3 (3.5%) |
| $35,000 to $39,999 | 3 (2.4%) | 0 (0.0%) |
| $40,000 to $44,999 | 12 (9.6%) | 0 (0.0%) |
| $45,000 to $49,999 | 38 (30.4%) | 0 (0.0%) |
| $50,000 to $54,999 | 2 (1.6%) | 3 (3.5%) |
| $55,000 to $64,999 | 6 (4.8%) | 2 (2.3%) |
| $65,000 to $74,999 | 3 (2.4%) | 0 (0.0%) |
| $75,000 to $99,999 | 29 (23.2%) | 0 (0.0%) |
| $100,000+ | 0 (0.0%) | 0 (0.0%) |
| Total | 125 (100.0%) | 87 (100.0%) |
Earnings by Sex by Educational Attainment in Mud Lake
Average earnings in Mud Lake are $46,316 for men and $20,250 for women, a difference of 56.3%. Men with an educational attainment of college or associate's degree enjoy the highest average annual earnings of $46,029, while those with college or associate's degree education earn the least with $46,029. Women with an educational attainment of bachelor's degree earn the most with the average annual earnings of $52,500, while those with bachelor's degree education have the smallest earnings of $52,500.
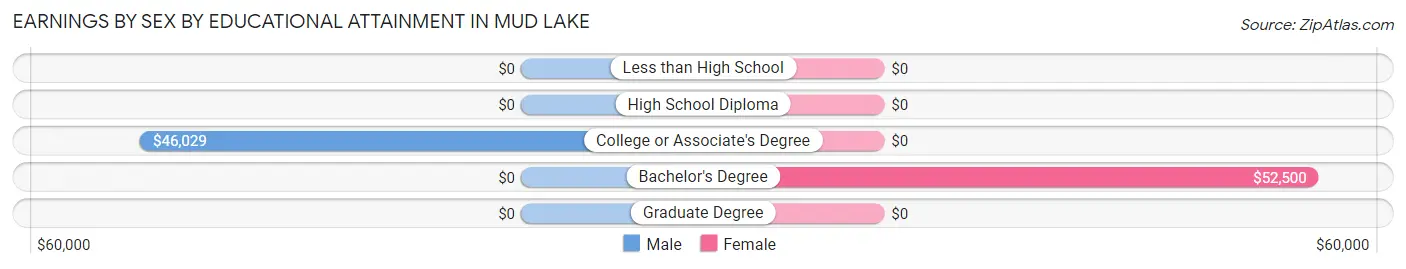
| Educational Attainment | Male Income | Female Income |
| Less than High School | - | - |
| High School Diploma | - | - |
| College or Associate's Degree | $46,029 | $0 |
| Bachelor's Degree | - | - |
| Graduate Degree | - | - |
| Total | $46,316 | $20,250 |
Family Income in Mud Lake
Family Income Brackets in Mud Lake
According to the Mud Lake family income data, there are 49 families falling into the $50,000 to $74,999 income range, which is the most common income bracket and makes up 38.0% of all families.
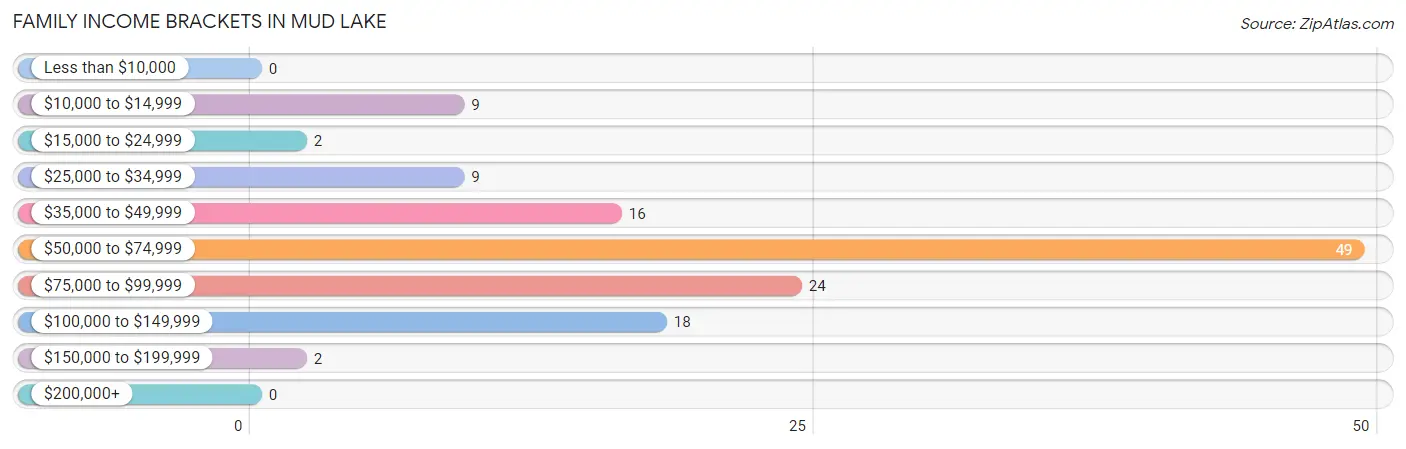
| Income Bracket | # Families | % Families |
| Less than $10,000 | 0 | 0.0% |
| $10,000 to $14,999 | 9 | 7.0% |
| $15,000 to $24,999 | 2 | 1.6% |
| $25,000 to $34,999 | 9 | 7.0% |
| $35,000 to $49,999 | 16 | 12.4% |
| $50,000 to $74,999 | 49 | 38.0% |
| $75,000 to $99,999 | 24 | 18.6% |
| $100,000 to $149,999 | 18 | 14.0% |
| $150,000 to $199,999 | 2 | 1.6% |
| $200,000+ | 0 | 0.0% |
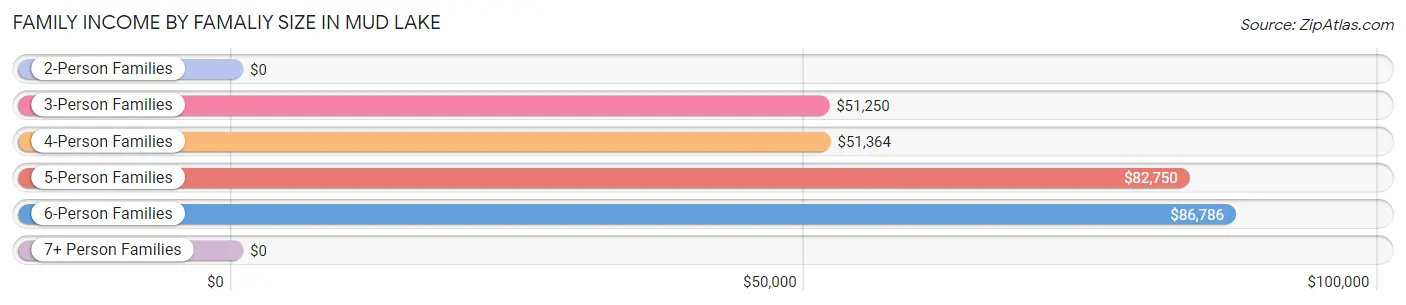
Family Income by Famaliy Size in Mud Lake
6-person families (10 | 7.7%) account for the highest median family income in Mud Lake with $86,786 per family, while 3-person families (33 | 25.6%) have the highest median income of $17,083 per family member.
| Income Bracket | # Families | Median Income |
| 2-Person Families | 33 (25.6%) | $0 |
| 3-Person Families | 33 (25.6%) | $51,250 |
| 4-Person Families | 40 (31.0%) | $51,364 |
| 5-Person Families | 11 (8.5%) | $82,750 |
| 6-Person Families | 10 (7.7%) | $86,786 |
| 7+ Person Families | 2 (1.5%) | $0 |
| Total | 129 (100.0%) | $52,096 |
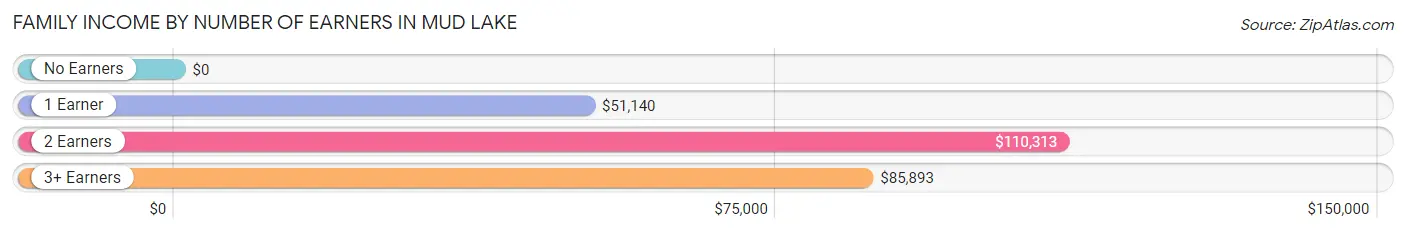
Family Income by Number of Earners in Mud Lake
| Number of Earners | # Families | Median Income |
| No Earners | 15 (11.6%) | $0 |
| 1 Earner | 65 (50.4%) | $51,140 |
| 2 Earners | 28 (21.7%) | $110,313 |
| 3+ Earners | 21 (16.3%) | $85,893 |
| Total | 129 (100.0%) | $52,096 |
Household Income in Mud Lake
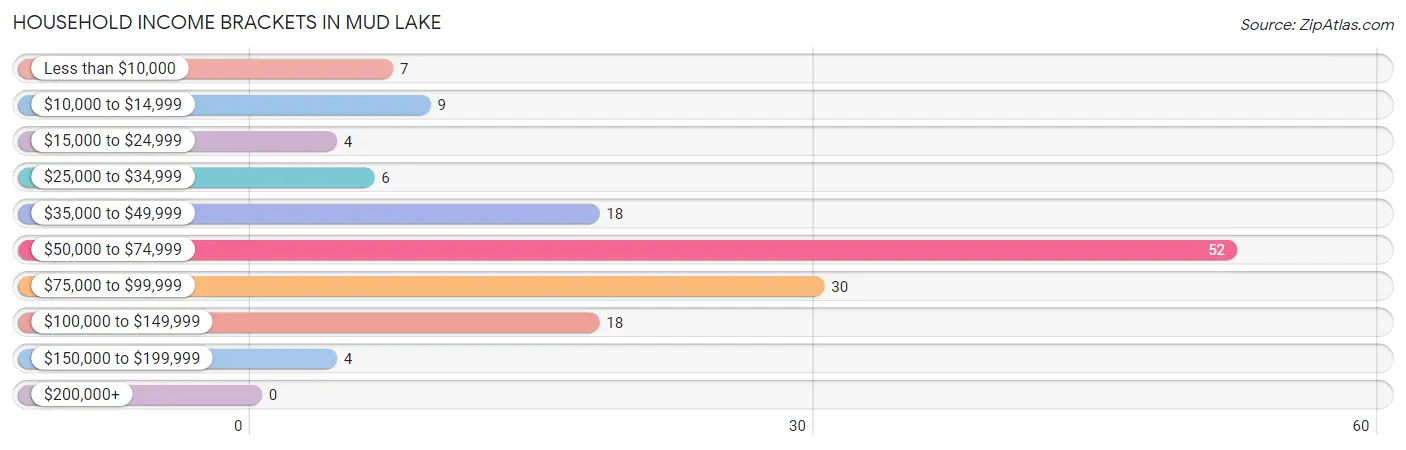
Household Income Brackets in Mud Lake
With 52 households falling in the category, the $50,000 to $74,999 income range is the most frequent in Mud Lake, accounting for 35.1% of all households.
| Income Bracket | # Households | % Households |
| Less than $10,000 | 7 | 4.7% |
| $10,000 to $14,999 | 9 | 6.1% |
| $15,000 to $24,999 | 4 | 2.7% |
| $25,000 to $34,999 | 6 | 4.1% |
| $35,000 to $49,999 | 18 | 12.2% |
| $50,000 to $74,999 | 52 | 35.1% |
| $75,000 to $99,999 | 30 | 20.3% |
| $100,000 to $149,999 | 18 | 12.2% |
| $150,000 to $199,999 | 4 | 2.7% |
| $200,000+ | 0 | 0.0% |
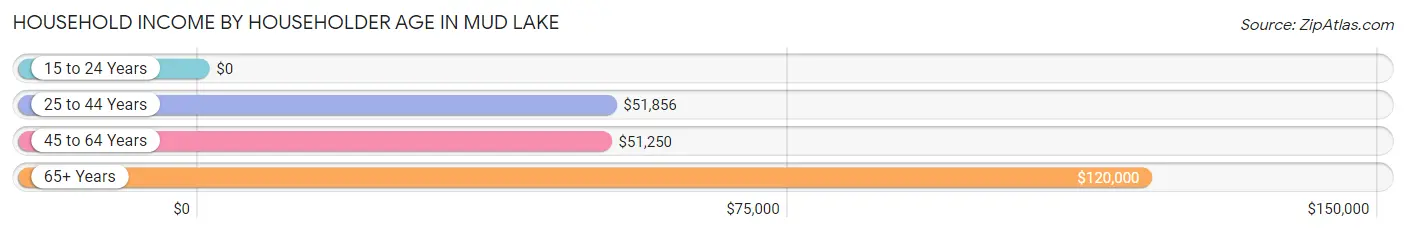
Household Income by Householder Age in Mud Lake
The median household income in Mud Lake is $52,206, with the highest median household income of $120,000 found in the 65+ years age bracket for the primary householder. A total of 16 households (10.8%) fall into this category. Meanwhile, the 15 to 24 years age bracket for the primary householder has the lowest median household income of $0, with 4 households (2.7%) in this group.
| Income Bracket | # Households | Median Income |
| 15 to 24 Years | 4 (2.7%) | $0 |
| 25 to 44 Years | 73 (49.3%) | $51,856 |
| 45 to 64 Years | 55 (37.2%) | $51,250 |
| 65+ Years | 16 (10.8%) | $120,000 |
| Total | 148 (100.0%) | $52,206 |
Poverty in Mud Lake
Income Below Poverty by Sex and Age in Mud Lake
With 6.4% poverty level for males and 6.5% for females among the residents of Mud Lake, 18 to 24 year old males and 55 to 64 year old females are the most vulnerable to poverty, with 2 males (50.0%) and 9 females (36.0%) in their respective age groups living below the poverty level.
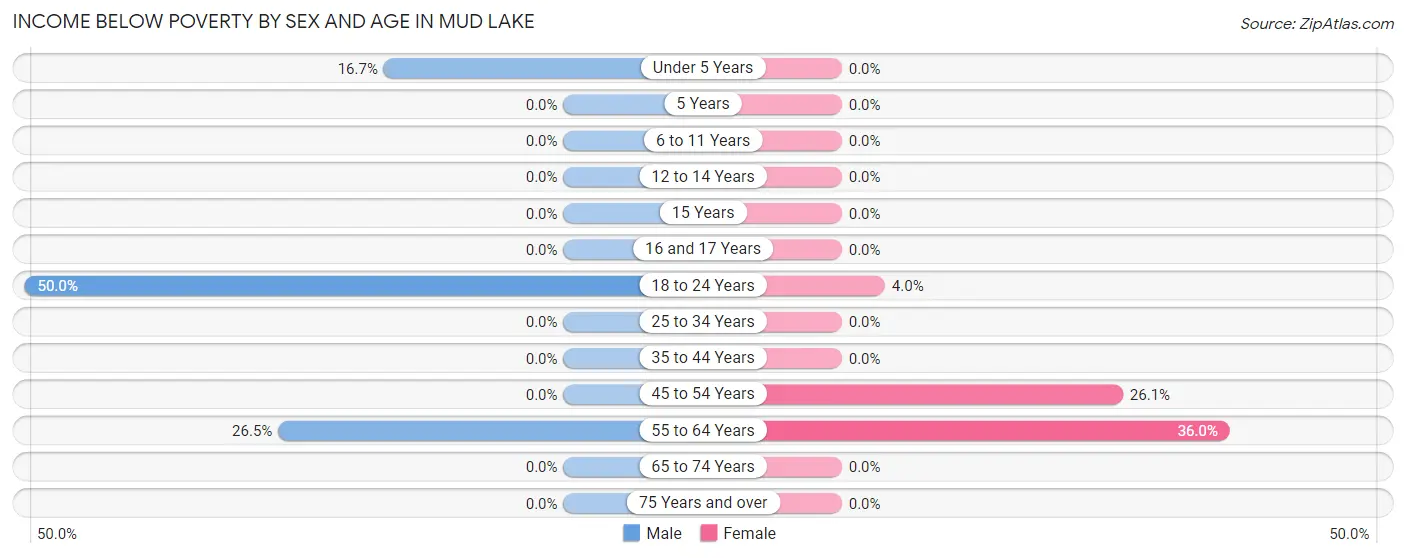
| Age Bracket | Male | Female |
| Under 5 Years | 3 (16.7%) | 0 (0.0%) |
| 5 Years | 0 (0.0%) | 0 (0.0%) |
| 6 to 11 Years | 0 (0.0%) | 0 (0.0%) |
| 12 to 14 Years | 0 (0.0%) | 0 (0.0%) |
| 15 Years | 0 (0.0%) | 0 (0.0%) |
| 16 and 17 Years | 0 (0.0%) | 0 (0.0%) |
| 18 to 24 Years | 2 (50.0%) | 1 (4.0%) |
| 25 to 34 Years | 0 (0.0%) | 0 (0.0%) |
| 35 to 44 Years | 0 (0.0%) | 0 (0.0%) |
| 45 to 54 Years | 0 (0.0%) | 6 (26.1%) |
| 55 to 64 Years | 9 (26.5%) | 9 (36.0%) |
| 65 to 74 Years | 0 (0.0%) | 0 (0.0%) |
| 75 Years and over | 0 (0.0%) | 0 (0.0%) |
| Total | 14 (6.4%) | 16 (6.5%) |
Income Above Poverty by Sex and Age in Mud Lake
According to the poverty statistics in Mud Lake, males aged 5 years and females aged under 5 years are the age groups that are most secure financially, with 100.0% of males and 100.0% of females in these age groups living above the poverty line.
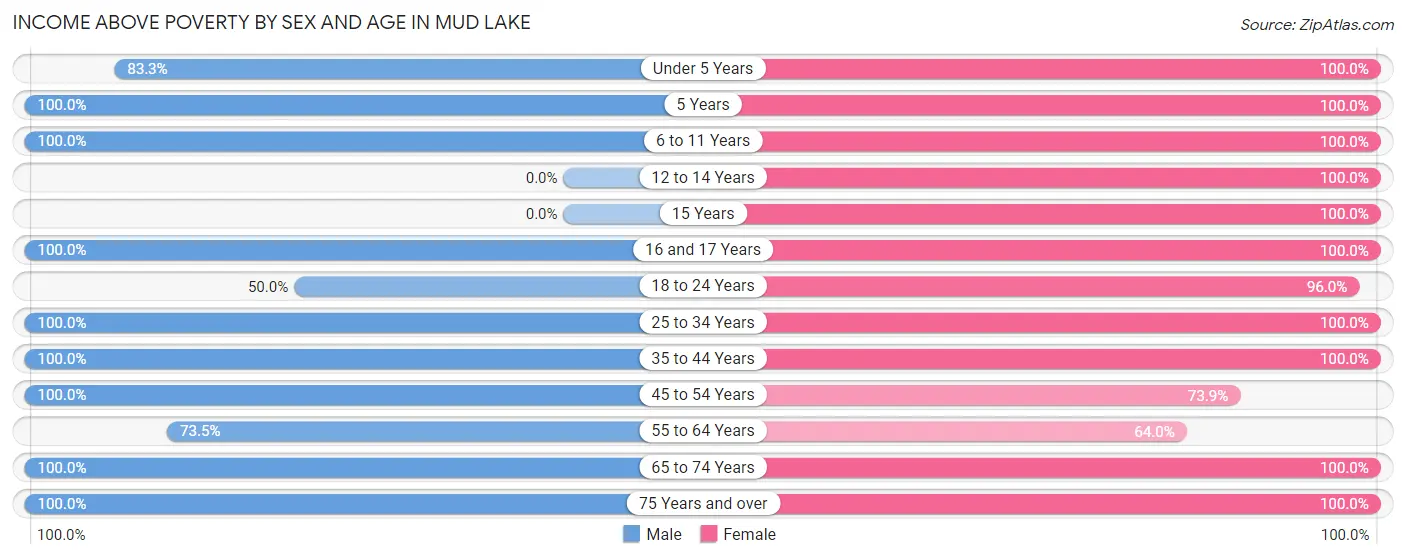
| Age Bracket | Male | Female |
| Under 5 Years | 15 (83.3%) | 37 (100.0%) |
| 5 Years | 36 (100.0%) | 4 (100.0%) |
| 6 to 11 Years | 17 (100.0%) | 11 (100.0%) |
| 12 to 14 Years | 0 (0.0%) | 18 (100.0%) |
| 15 Years | 0 (0.0%) | 4 (100.0%) |
| 16 and 17 Years | 5 (100.0%) | 15 (100.0%) |
| 18 to 24 Years | 2 (50.0%) | 24 (96.0%) |
| 25 to 34 Years | 49 (100.0%) | 34 (100.0%) |
| 35 to 44 Years | 21 (100.0%) | 38 (100.0%) |
| 45 to 54 Years | 22 (100.0%) | 17 (73.9%) |
| 55 to 64 Years | 25 (73.5%) | 16 (64.0%) |
| 65 to 74 Years | 10 (100.0%) | 13 (100.0%) |
| 75 Years and over | 4 (100.0%) | 1 (100.0%) |
| Total | 206 (93.6%) | 232 (93.5%) |
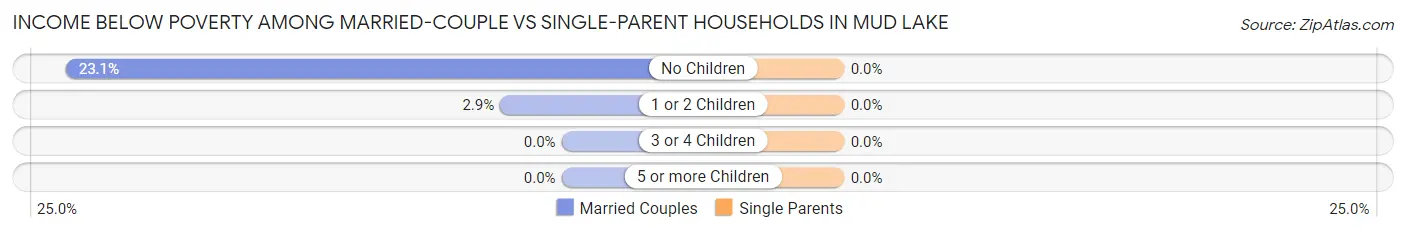
Income Below Poverty Among Married-Couple Families in Mud Lake
The poverty statistics for married-couple families in Mud Lake show that 9.2% or 11 of the total 120 families live below the poverty line. Families with no children have the highest poverty rate of 23.1%, comprising of 9 families. On the other hand, families with 3 or 4 children have the lowest poverty rate of 0.0%, which includes 0 families.
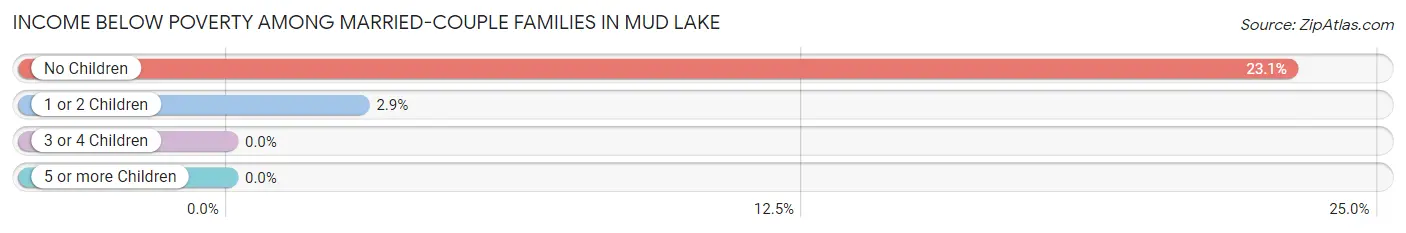
| Children | Above Poverty | Below Poverty |
| No Children | 30 (76.9%) | 9 (23.1%) |
| 1 or 2 Children | 68 (97.1%) | 2 (2.9%) |
| 3 or 4 Children | 9 (100.0%) | 0 (0.0%) |
| 5 or more Children | 2 (100.0%) | 0 (0.0%) |
| Total | 109 (90.8%) | 11 (9.2%) |
Income Below Poverty Among Single-Parent Households in Mud Lake
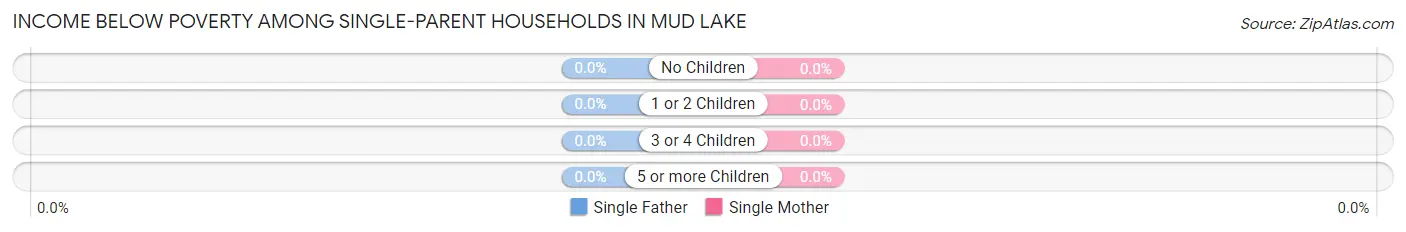
| Children | Single Father | Single Mother |
| No Children | 0 (0.0%) | 0 (0.0%) |
| 1 or 2 Children | 0 (0.0%) | 0 (0.0%) |
| 3 or 4 Children | 0 (0.0%) | 0 (0.0%) |
| 5 or more Children | 0 (0.0%) | 0 (0.0%) |
| Total | 0 (0.0%) | 0 (0.0%) |
Income Below Poverty Among Married-Couple vs Single-Parent Households in Mud Lake
| Children | Married-Couple Families | Single-Parent Households |
| No Children | 9 (23.1%) | 0 (0.0%) |
| 1 or 2 Children | 2 (2.9%) | 0 (0.0%) |
| 3 or 4 Children | 0 (0.0%) | 0 (0.0%) |
| 5 or more Children | 0 (0.0%) | 0 (0.0%) |
| Total | 11 (9.2%) | 0 (0.0%) |
Employment Characteristics in Mud Lake
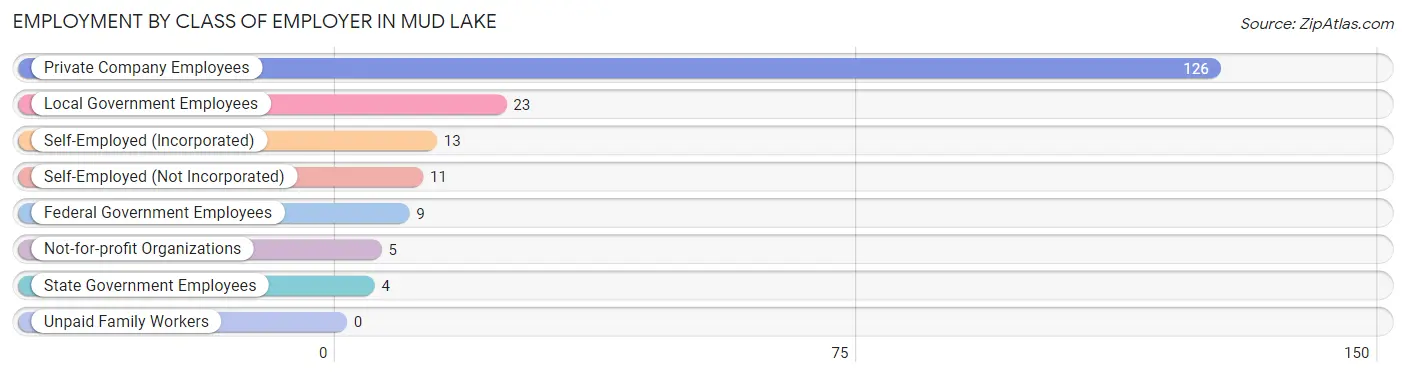
Employment by Class of Employer in Mud Lake
Among the 191 employed individuals in Mud Lake, private company employees (126 | 66.0%), local government employees (23 | 12.0%), and self-employed (incorporated) (13 | 6.8%) make up the most common classes of employment.
| Employer Class | # Employees | % Employees |
| Private Company Employees | 126 | 66.0% |
| Self-Employed (Incorporated) | 13 | 6.8% |
| Self-Employed (Not Incorporated) | 11 | 5.8% |
| Not-for-profit Organizations | 5 | 2.6% |
| Local Government Employees | 23 | 12.0% |
| State Government Employees | 4 | 2.1% |
| Federal Government Employees | 9 | 4.7% |
| Unpaid Family Workers | 0 | 0.0% |
| Total | 191 | 100.0% |
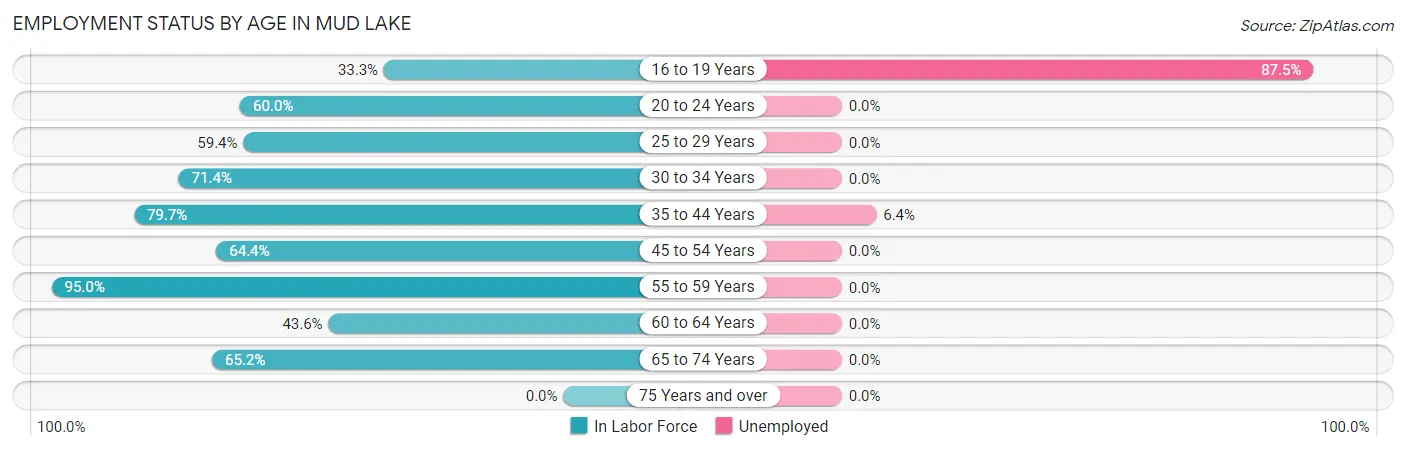
Employment Status by Age in Mud Lake
According to the labor force statistics for Mud Lake, out of the total population over 16 years of age (323), 62.2% or 201 individuals are in the labor force, with 5.0% or 10 of them unemployed. The age group with the highest labor force participation rate is 55 to 59 years, with 95.0% or 19 individuals in the labor force. Within the labor force, the 16 to 19 years age range has the highest percentage of unemployed individuals, with 87.5% or 7 of them being unemployed.
| Age Bracket | In Labor Force | Unemployed |
| 16 to 19 Years | 8 (33.3%) | 7 (87.5%) |
| 20 to 24 Years | 15 (60.0%) | 0 (0.0%) |
| 25 to 29 Years | 41 (59.4%) | 0 (0.0%) |
| 30 to 34 Years | 10 (71.4%) | 0 (0.0%) |
| 35 to 44 Years | 47 (79.7%) | 3 (6.4%) |
| 45 to 54 Years | 29 (64.4%) | 0 (0.0%) |
| 55 to 59 Years | 19 (95.0%) | 0 (0.0%) |
| 60 to 64 Years | 17 (43.6%) | 0 (0.0%) |
| 65 to 74 Years | 15 (65.2%) | 0 (0.0%) |
| 75 Years and over | 0 (0.0%) | 0 (0.0%) |
| Total | 201 (62.2%) | 10 (5.0%) |
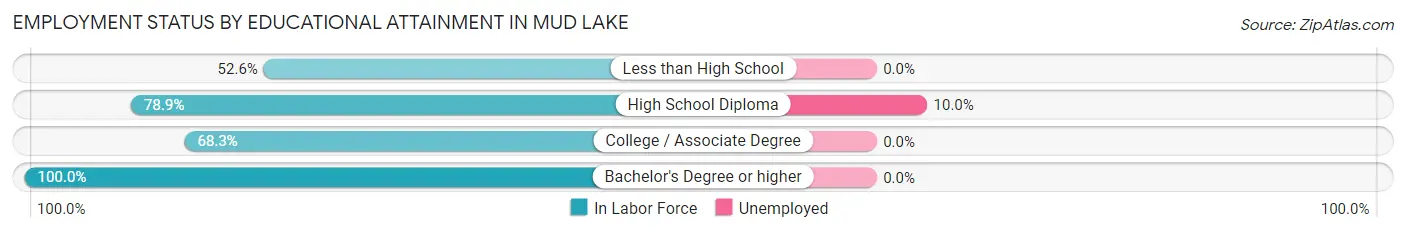
Employment Status by Educational Attainment in Mud Lake
According to labor force statistics for Mud Lake, 66.3% of individuals (163) out of the total population between 25 and 64 years of age (246) are in the labor force, with 1.8% or 3 of them being unemployed. The group with the highest labor force participation rate are those with the educational attainment of bachelor's degree or higher, with 100.0% or 9 individuals in the labor force. Within the labor force, individuals with high school diploma education have the highest percentage of unemployment, with 10.0% or 3 of them being unemployed.
| Educational Attainment | In Labor Force | Unemployed |
| Less than High School | 40 (52.6%) | 0 (0.0%) |
| High School Diploma | 30 (78.9%) | 4 (10.0%) |
| College / Associate Degree | 84 (68.3%) | 0 (0.0%) |
| Bachelor's Degree or higher | 9 (100.0%) | 0 (0.0%) |
| Total | 163 (66.3%) | 4 (1.8%) |
Employment Occupations by Sex in Mud Lake
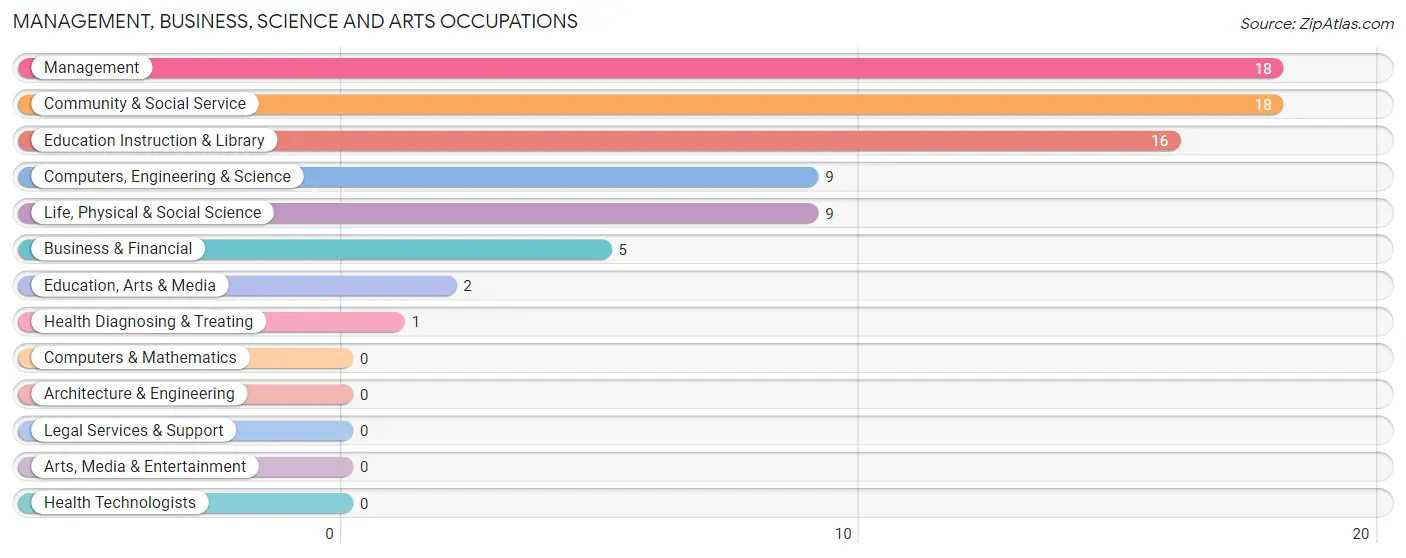
Management, Business, Science and Arts Occupations
The most common Management, Business, Science and Arts occupations in Mud Lake are Management (18 | 9.4%), Community & Social Service (18 | 9.4%), Education Instruction & Library (16 | 8.4%), Computers, Engineering & Science (9 | 4.7%), and Life, Physical & Social Science (9 | 4.7%).
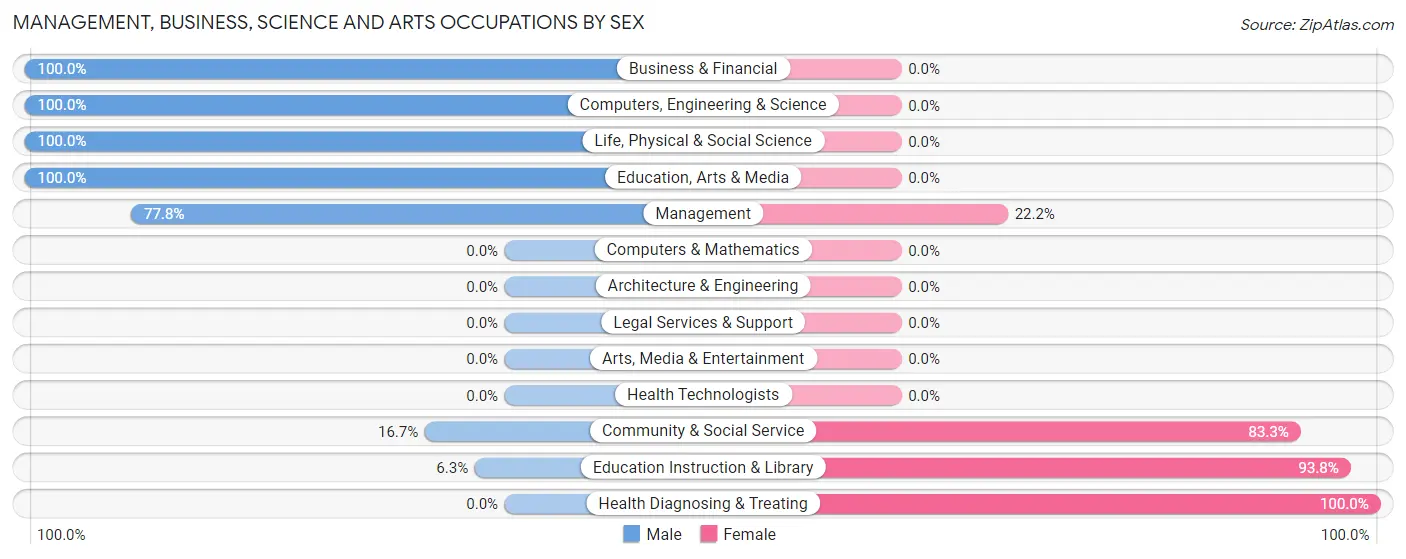
Management, Business, Science and Arts Occupations by Sex
Within the Management, Business, Science and Arts occupations in Mud Lake, the most male-oriented occupations are Business & Financial (100.0%), Computers, Engineering & Science (100.0%), and Life, Physical & Social Science (100.0%), while the most female-oriented occupations are Health Diagnosing & Treating (100.0%), Education Instruction & Library (93.8%), and Community & Social Service (83.3%).
| Occupation | Male | Female |
| Management | 14 (77.8%) | 4 (22.2%) |
| Business & Financial | 5 (100.0%) | 0 (0.0%) |
| Computers, Engineering & Science | 9 (100.0%) | 0 (0.0%) |
| Computers & Mathematics | 0 (0.0%) | 0 (0.0%) |
| Architecture & Engineering | 0 (0.0%) | 0 (0.0%) |
| Life, Physical & Social Science | 9 (100.0%) | 0 (0.0%) |
| Community & Social Service | 3 (16.7%) | 15 (83.3%) |
| Education, Arts & Media | 2 (100.0%) | 0 (0.0%) |
| Legal Services & Support | 0 (0.0%) | 0 (0.0%) |
| Education Instruction & Library | 1 (6.2%) | 15 (93.8%) |
| Arts, Media & Entertainment | 0 (0.0%) | 0 (0.0%) |
| Health Diagnosing & Treating | 0 (0.0%) | 1 (100.0%) |
| Health Technologists | 0 (0.0%) | 0 (0.0%) |
| Total (Category) | 31 (60.8%) | 20 (39.2%) |
| Total (Overall) | 121 (63.3%) | 70 (36.6%) |
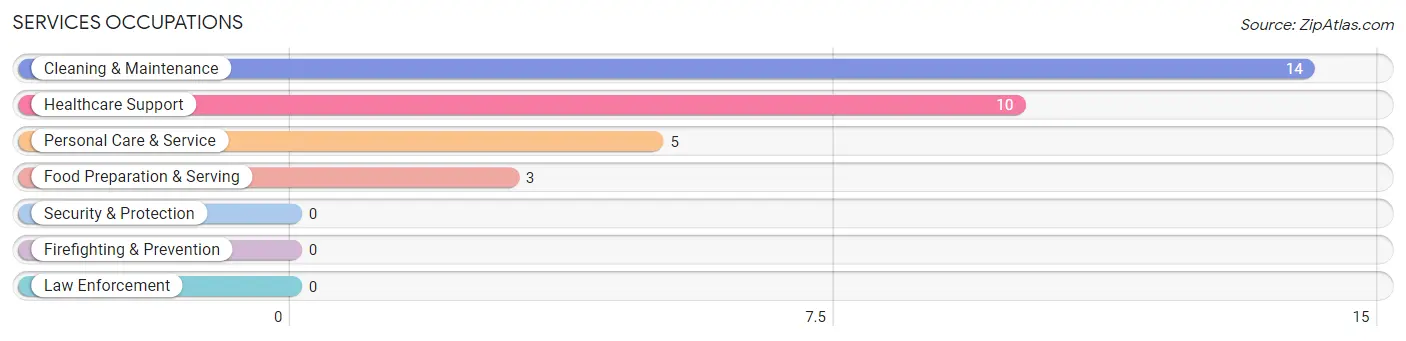
Services Occupations
The most common Services occupations in Mud Lake are Cleaning & Maintenance (14 | 7.3%), Healthcare Support (10 | 5.2%), Personal Care & Service (5 | 2.6%), and Food Preparation & Serving (3 | 1.6%).
Services Occupations by Sex
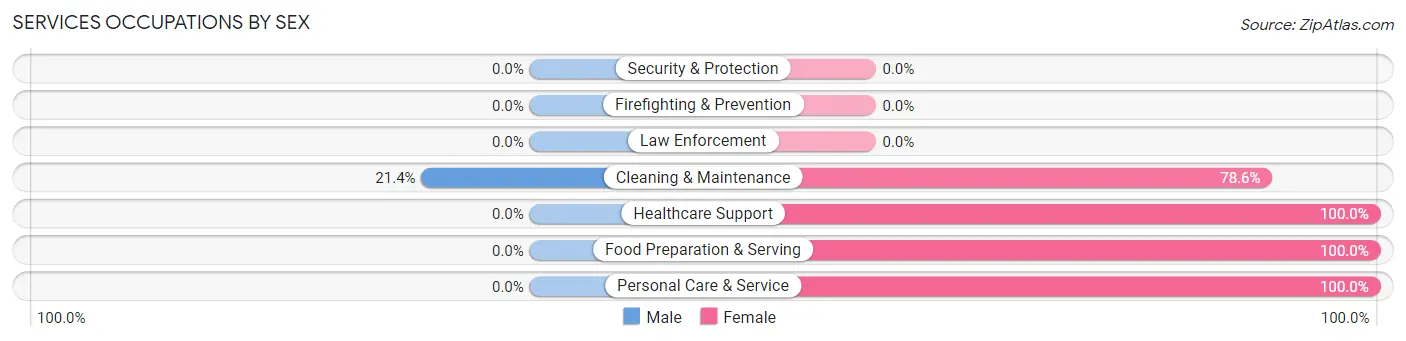
| Occupation | Male | Female |
| Healthcare Support | 0 (0.0%) | 10 (100.0%) |
| Security & Protection | 0 (0.0%) | 0 (0.0%) |
| Firefighting & Prevention | 0 (0.0%) | 0 (0.0%) |
| Law Enforcement | 0 (0.0%) | 0 (0.0%) |
| Food Preparation & Serving | 0 (0.0%) | 3 (100.0%) |
| Cleaning & Maintenance | 3 (21.4%) | 11 (78.6%) |
| Personal Care & Service | 0 (0.0%) | 5 (100.0%) |
| Total (Category) | 3 (9.4%) | 29 (90.6%) |
| Total (Overall) | 121 (63.3%) | 70 (36.6%) |
Sales and Office Occupations
The most common Sales and Office occupations in Mud Lake are Office & Administration (20 | 10.5%), and Sales & Related (5 | 2.6%).
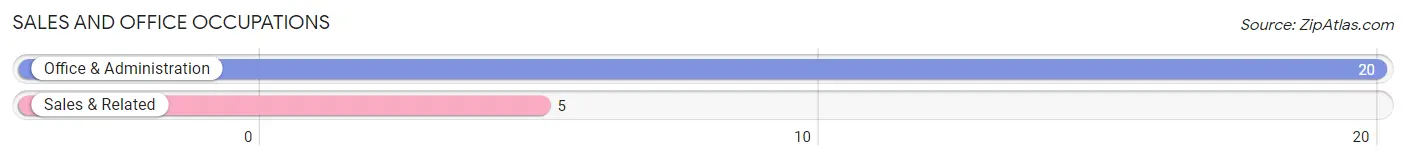
Sales and Office Occupations by Sex
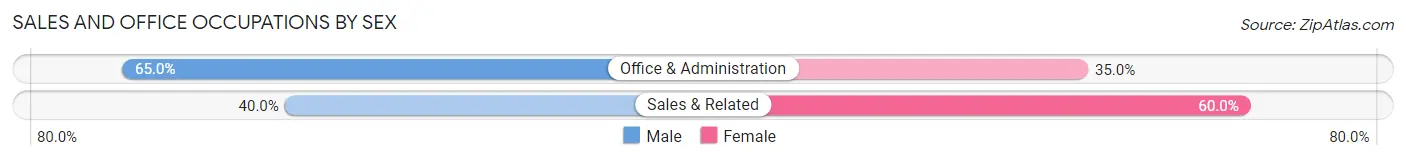
| Occupation | Male | Female |
| Sales & Related | 2 (40.0%) | 3 (60.0%) |
| Office & Administration | 13 (65.0%) | 7 (35.0%) |
| Total (Category) | 15 (60.0%) | 10 (40.0%) |
| Total (Overall) | 121 (63.3%) | 70 (36.6%) |
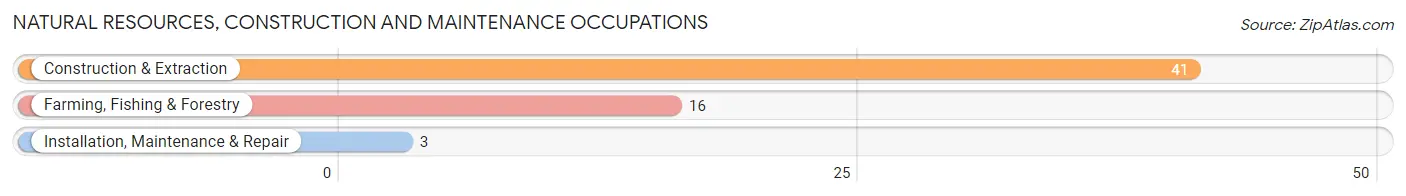
Natural Resources, Construction and Maintenance Occupations
The most common Natural Resources, Construction and Maintenance occupations in Mud Lake are Construction & Extraction (41 | 21.5%), Farming, Fishing & Forestry (16 | 8.4%), and Installation, Maintenance & Repair (3 | 1.6%).
Natural Resources, Construction and Maintenance Occupations by Sex
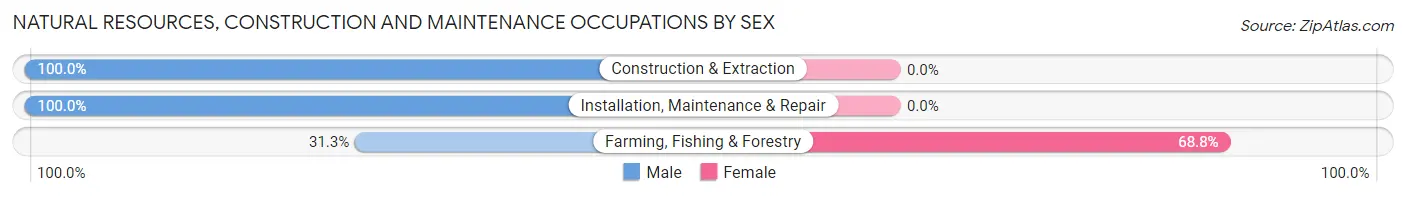
| Occupation | Male | Female |
| Farming, Fishing & Forestry | 5 (31.2%) | 11 (68.8%) |
| Construction & Extraction | 41 (100.0%) | 0 (0.0%) |
| Installation, Maintenance & Repair | 3 (100.0%) | 0 (0.0%) |
| Total (Category) | 49 (81.7%) | 11 (18.3%) |
| Total (Overall) | 121 (63.3%) | 70 (36.6%) |
Production, Transportation and Moving Occupations
The most common Production, Transportation and Moving occupations in Mud Lake are Transportation (8 | 4.2%), Material Moving (8 | 4.2%), and Production (7 | 3.7%).
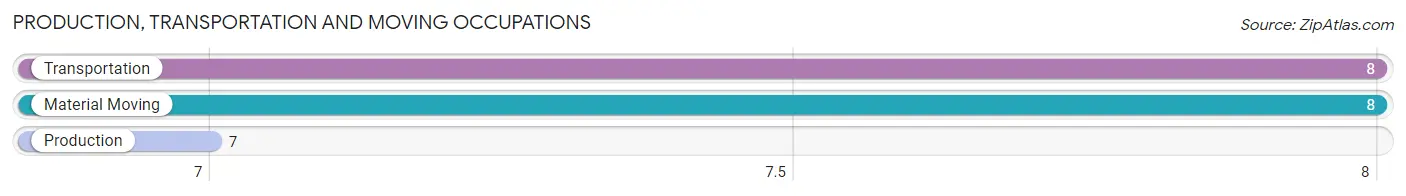
Production, Transportation and Moving Occupations by Sex
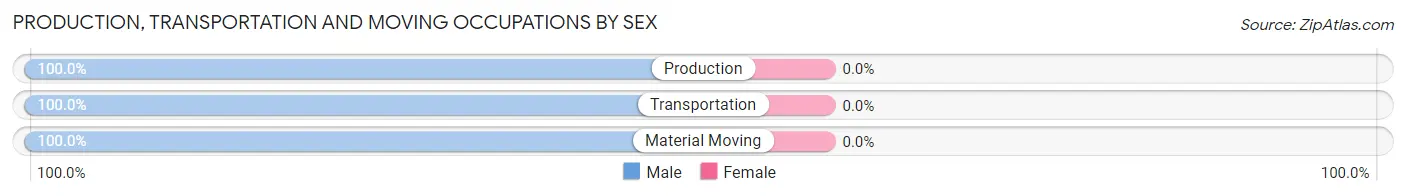
| Occupation | Male | Female |
| Production | 7 (100.0%) | 0 (0.0%) |
| Transportation | 8 (100.0%) | 0 (0.0%) |
| Material Moving | 8 (100.0%) | 0 (0.0%) |
| Total (Category) | 23 (100.0%) | 0 (0.0%) |
| Total (Overall) | 121 (63.3%) | 70 (36.6%) |
Employment Industries by Sex in Mud Lake
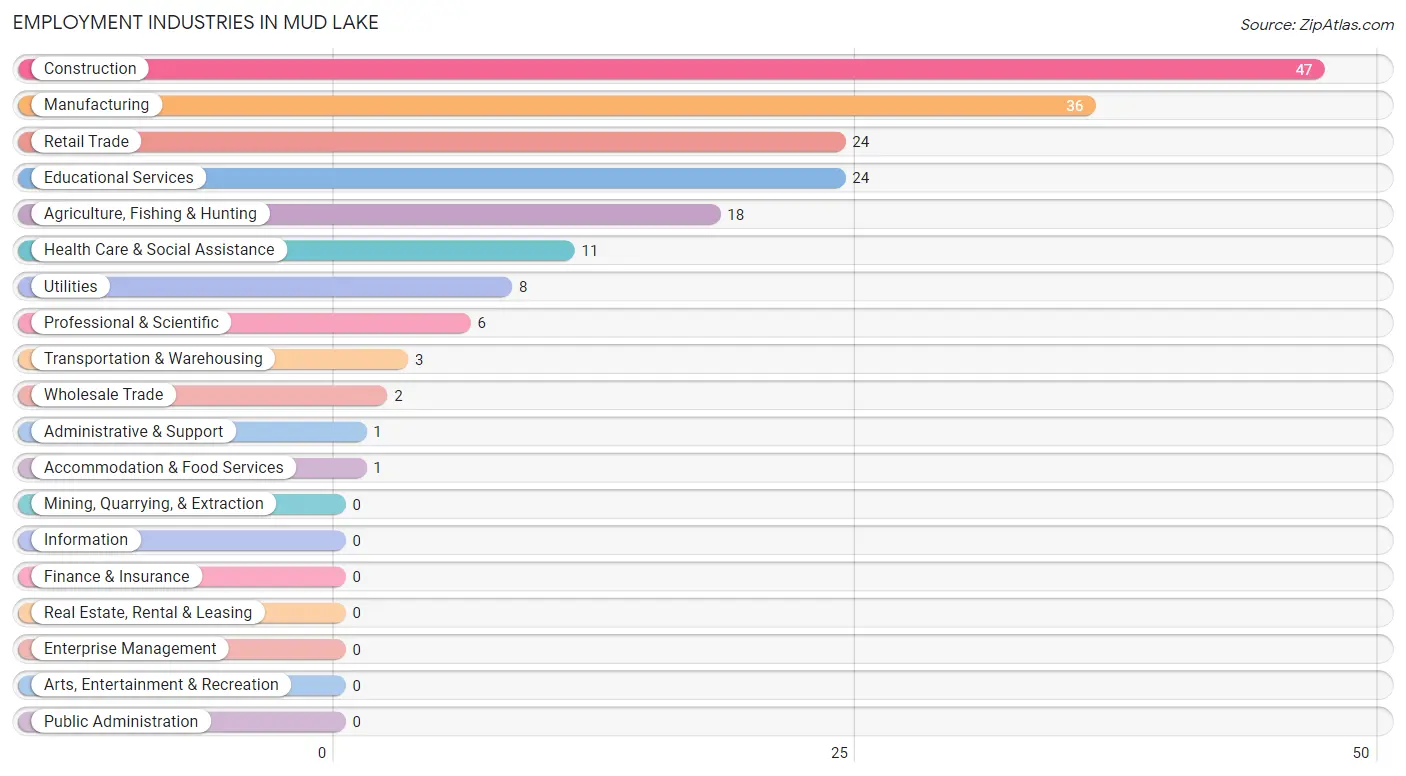
Employment Industries in Mud Lake
The major employment industries in Mud Lake include Construction (47 | 24.6%), Manufacturing (36 | 18.9%), Retail Trade (24 | 12.6%), Educational Services (24 | 12.6%), and Agriculture, Fishing & Hunting (18 | 9.4%).
Employment Industries by Sex in Mud Lake
The Mud Lake industries that see more men than women are Construction (100.0%), Wholesale Trade (100.0%), and Transportation & Warehousing (100.0%), whereas the industries that tend to have a higher number of women are Health Care & Social Assistance (100.0%), Accommodation & Food Services (100.0%), and Educational Services (87.5%).
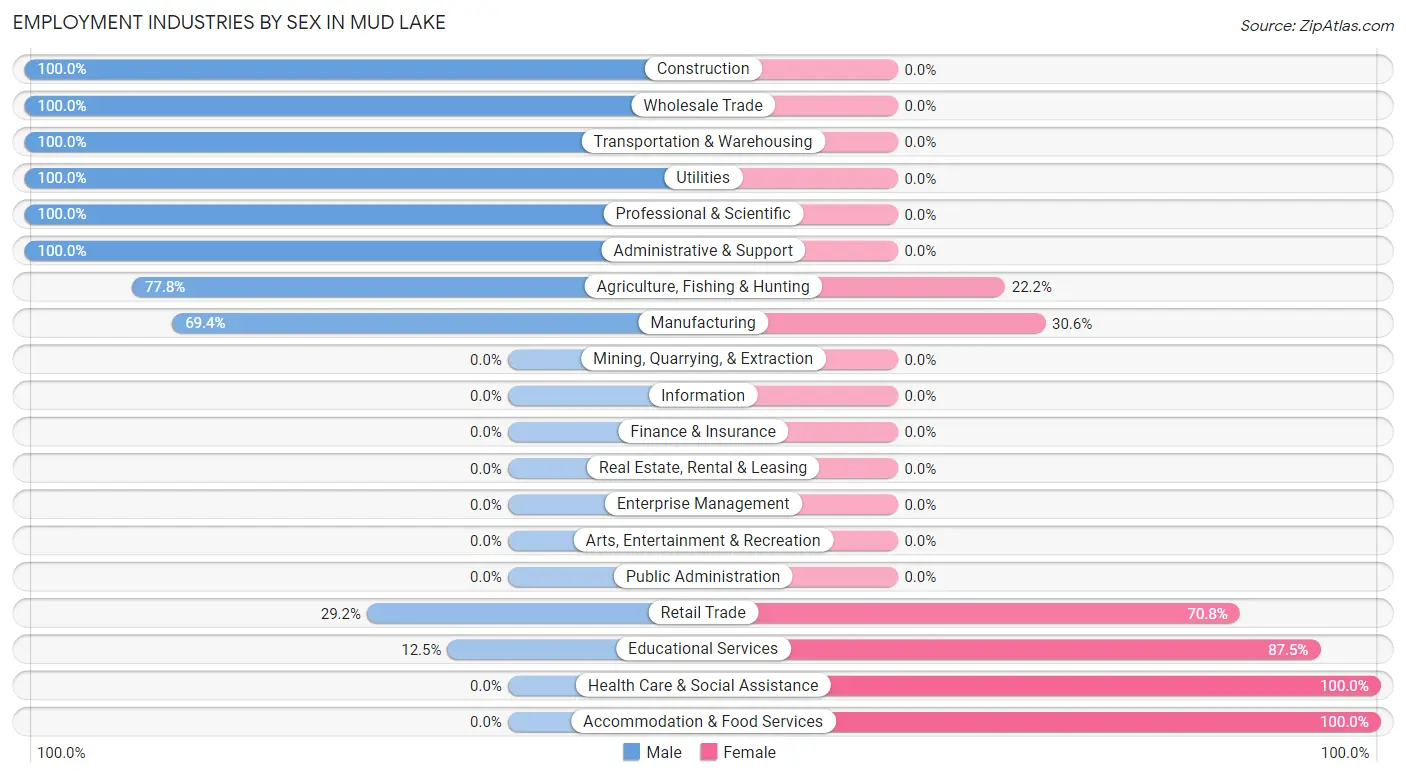
| Industry | Male | Female |
| Agriculture, Fishing & Hunting | 14 (77.8%) | 4 (22.2%) |
| Mining, Quarrying, & Extraction | 0 (0.0%) | 0 (0.0%) |
| Construction | 47 (100.0%) | 0 (0.0%) |
| Manufacturing | 25 (69.4%) | 11 (30.6%) |
| Wholesale Trade | 2 (100.0%) | 0 (0.0%) |
| Retail Trade | 7 (29.2%) | 17 (70.8%) |
| Transportation & Warehousing | 3 (100.0%) | 0 (0.0%) |
| Utilities | 8 (100.0%) | 0 (0.0%) |
| Information | 0 (0.0%) | 0 (0.0%) |
| Finance & Insurance | 0 (0.0%) | 0 (0.0%) |
| Real Estate, Rental & Leasing | 0 (0.0%) | 0 (0.0%) |
| Professional & Scientific | 6 (100.0%) | 0 (0.0%) |
| Enterprise Management | 0 (0.0%) | 0 (0.0%) |
| Administrative & Support | 1 (100.0%) | 0 (0.0%) |
| Educational Services | 3 (12.5%) | 21 (87.5%) |
| Health Care & Social Assistance | 0 (0.0%) | 11 (100.0%) |
| Arts, Entertainment & Recreation | 0 (0.0%) | 0 (0.0%) |
| Accommodation & Food Services | 0 (0.0%) | 1 (100.0%) |
| Public Administration | 0 (0.0%) | 0 (0.0%) |
| Total | 121 (63.3%) | 70 (36.6%) |
Education in Mud Lake
School Enrollment in Mud Lake
The most common levels of schooling among the 118 students in Mud Lake are kindergarten (40 | 33.9%), high school (24 | 20.3%), and middle school (21 | 17.8%).
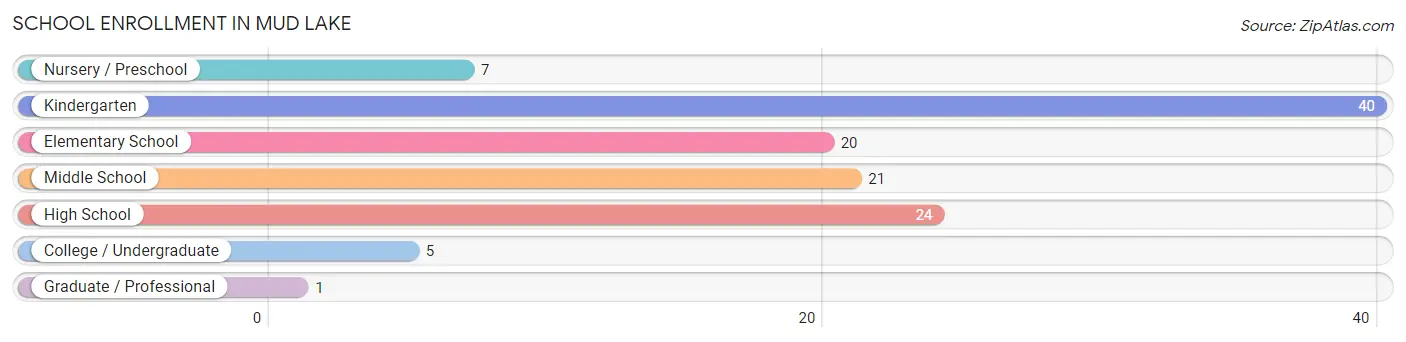
| School Level | # Students | % Students |
| Nursery / Preschool | 7 | 5.9% |
| Kindergarten | 40 | 33.9% |
| Elementary School | 20 | 17.0% |
| Middle School | 21 | 17.8% |
| High School | 24 | 20.3% |
| College / Undergraduate | 5 | 4.2% |
| Graduate / Professional | 1 | 0.9% |
| Total | 118 | 100.0% |
School Enrollment by Age by Funding Source in Mud Lake
Out of a total of 118 students who are enrolled in schools in Mud Lake, 2 (1.7%) attend a private institution, while the remaining 116 (98.3%) are enrolled in public schools. The age group of 18 to 19 year olds has the highest likelihood of being enrolled in private schools, with 2 (50.0% in the age bracket) enrolled. Conversely, the age group of 3 to 4 year olds has the lowest likelihood of being enrolled in a private school, with 3 (100.0% in the age bracket) attending a public institution.
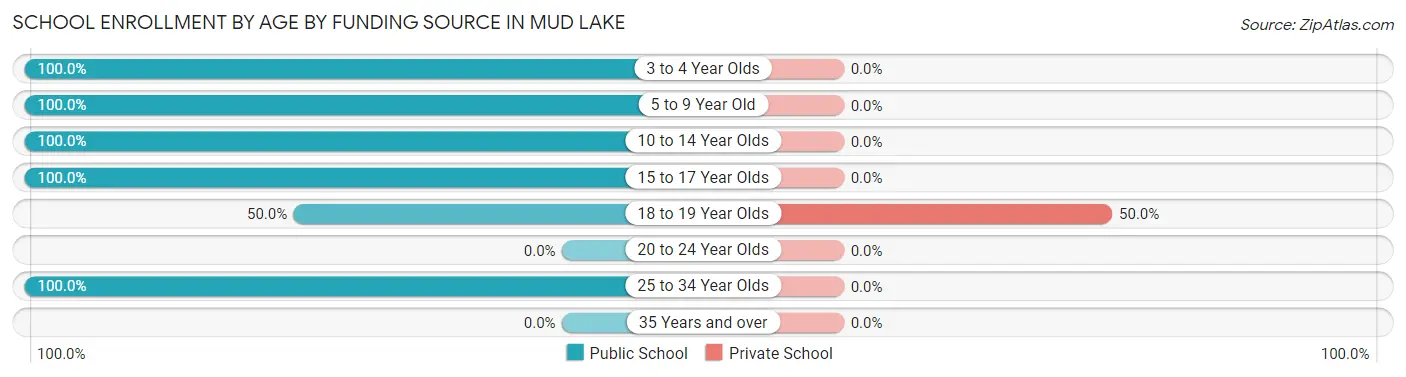
| Age Bracket | Public School | Private School |
| 3 to 4 Year Olds | 3 (100.0%) | 0 (0.0%) |
| 5 to 9 Year Old | 62 (100.0%) | 0 (0.0%) |
| 10 to 14 Year Olds | 23 (100.0%) | 0 (0.0%) |
| 15 to 17 Year Olds | 24 (100.0%) | 0 (0.0%) |
| 18 to 19 Year Olds | 2 (50.0%) | 2 (50.0%) |
| 20 to 24 Year Olds | 0 (0.0%) | 0 (0.0%) |
| 25 to 34 Year Olds | 2 (100.0%) | 0 (0.0%) |
| 35 Years and over | 0 (0.0%) | 0 (0.0%) |
| Total | 116 (98.3%) | 2 (1.7%) |
Educational Attainment by Field of Study in Mud Lake
Education (11 | 57.9%), and physical & health sciences (8 | 42.1%) are the most common fields of study among 19 individuals in Mud Lake who have obtained a bachelor's degree or higher.
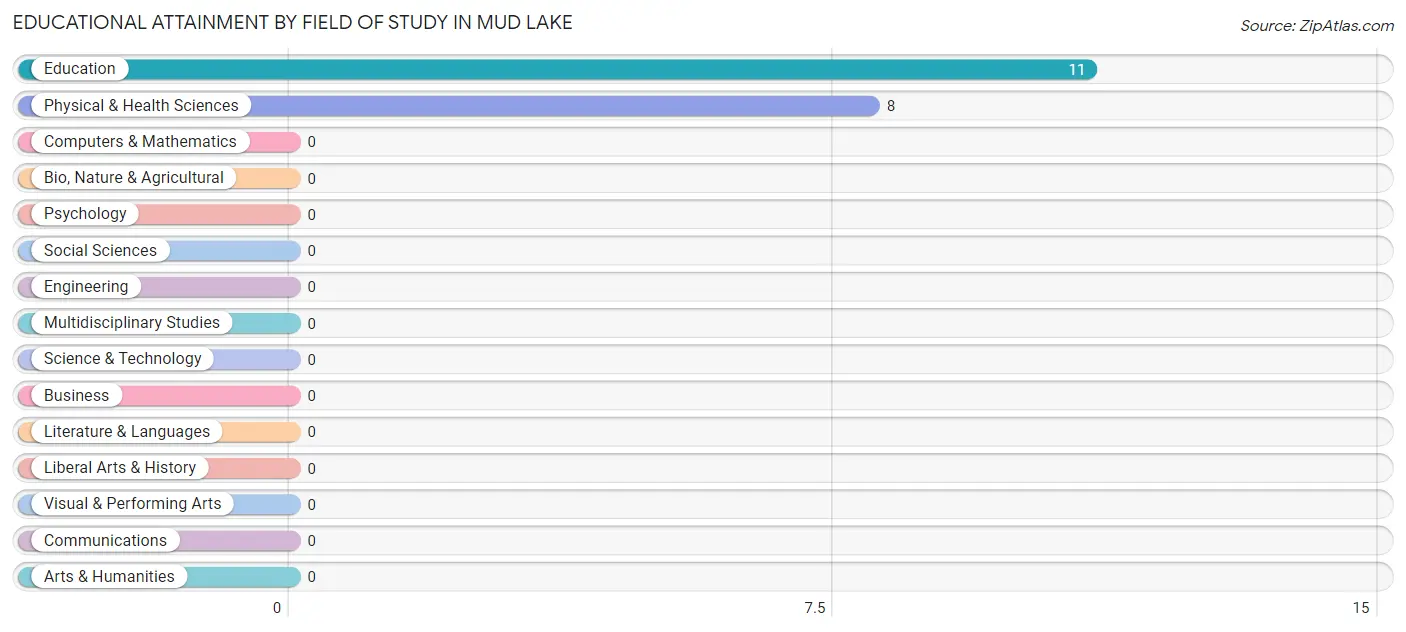
| Field of Study | # Graduates | % Graduates |
| Computers & Mathematics | 0 | 0.0% |
| Bio, Nature & Agricultural | 0 | 0.0% |
| Physical & Health Sciences | 8 | 42.1% |
| Psychology | 0 | 0.0% |
| Social Sciences | 0 | 0.0% |
| Engineering | 0 | 0.0% |
| Multidisciplinary Studies | 0 | 0.0% |
| Science & Technology | 0 | 0.0% |
| Business | 0 | 0.0% |
| Education | 11 | 57.9% |
| Literature & Languages | 0 | 0.0% |
| Liberal Arts & History | 0 | 0.0% |
| Visual & Performing Arts | 0 | 0.0% |
| Communications | 0 | 0.0% |
| Arts & Humanities | 0 | 0.0% |
| Total | 19 | 100.0% |
Transportation & Commute in Mud Lake
Vehicle Availability by Sex in Mud Lake
The most prevalent vehicle ownership categories in Mud Lake are males with 2 vehicles (60, accounting for 49.6%) and females with 2 vehicles (23, making up 85.7%).
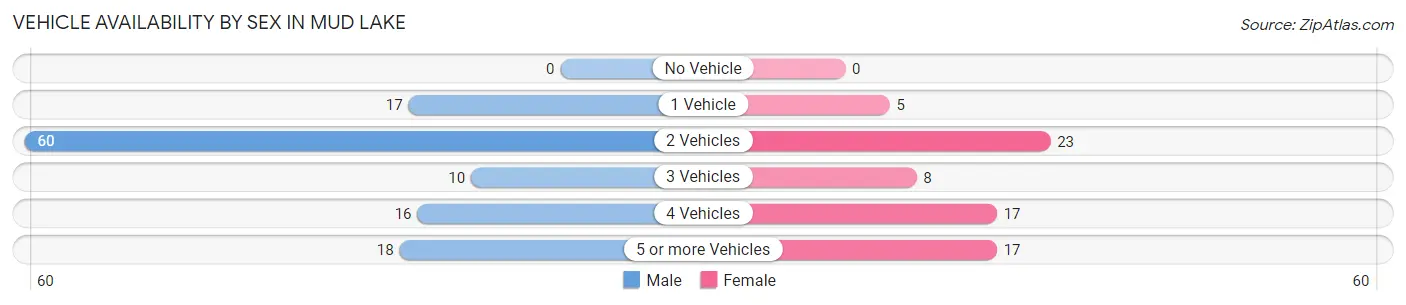
| Vehicles Available | Male | Female |
| No Vehicle | 0 (0.0%) | 0 (0.0%) |
| 1 Vehicle | 17 (14.1%) | 5 (7.1%) |
| 2 Vehicles | 60 (49.6%) | 23 (32.9%) |
| 3 Vehicles | 10 (8.3%) | 8 (11.4%) |
| 4 Vehicles | 16 (13.2%) | 17 (24.3%) |
| 5 or more Vehicles | 18 (14.9%) | 17 (24.3%) |
| Total | 121 (100.0%) | 70 (100.0%) |
Commute Time in Mud Lake
The most frequently occuring commute durations in Mud Lake are 30 to 34 minutes (60 commuters, 31.4%), less than 5 minutes (36 commuters, 18.9%), and 45 to 59 minutes (25 commuters, 13.1%).
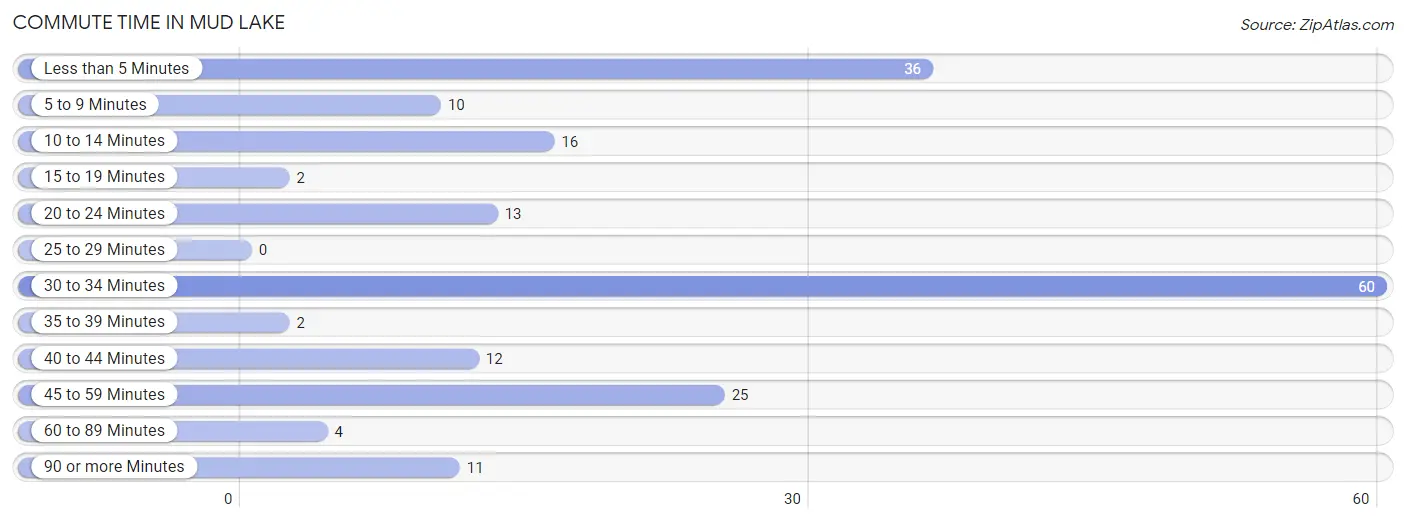
| Commute Time | # Commuters | % Commuters |
| Less than 5 Minutes | 36 | 18.9% |
| 5 to 9 Minutes | 10 | 5.2% |
| 10 to 14 Minutes | 16 | 8.4% |
| 15 to 19 Minutes | 2 | 1.1% |
| 20 to 24 Minutes | 13 | 6.8% |
| 25 to 29 Minutes | 0 | 0.0% |
| 30 to 34 Minutes | 60 | 31.4% |
| 35 to 39 Minutes | 2 | 1.1% |
| 40 to 44 Minutes | 12 | 6.3% |
| 45 to 59 Minutes | 25 | 13.1% |
| 60 to 89 Minutes | 4 | 2.1% |
| 90 or more Minutes | 11 | 5.8% |
Commute Time by Sex in Mud Lake
The most common commute times in Mud Lake are 30 to 34 minutes (57 commuters, 47.1%) for males and less than 5 minutes (18 commuters, 25.7%) for females.
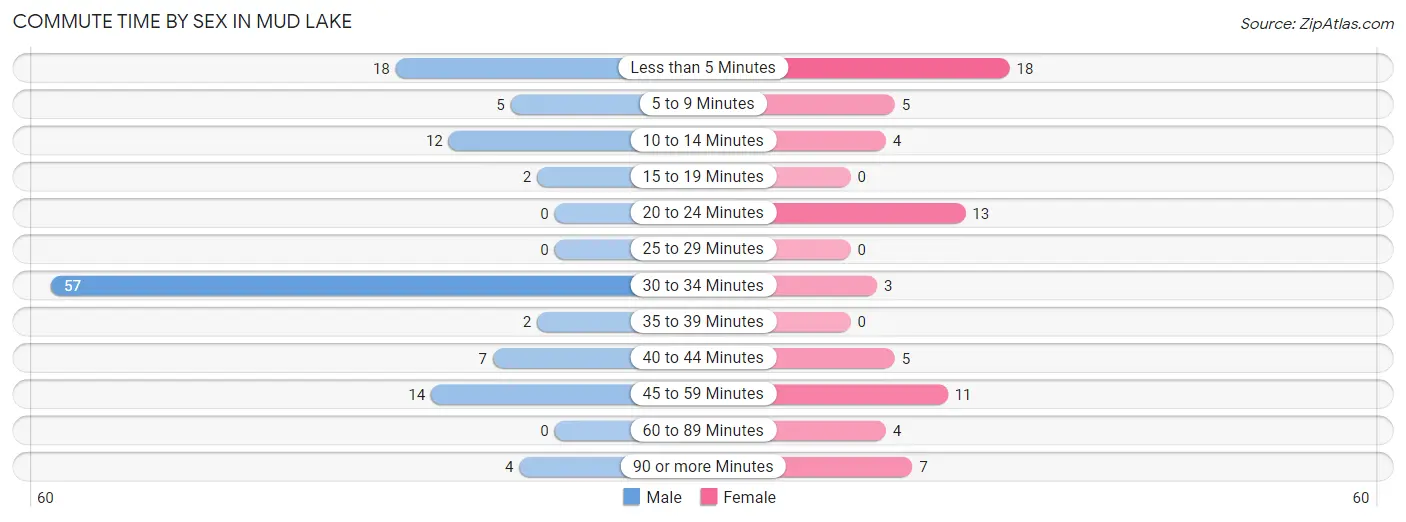
| Commute Time | Male | Female |
| Less than 5 Minutes | 18 (14.9%) | 18 (25.7%) |
| 5 to 9 Minutes | 5 (4.1%) | 5 (7.1%) |
| 10 to 14 Minutes | 12 (9.9%) | 4 (5.7%) |
| 15 to 19 Minutes | 2 (1.7%) | 0 (0.0%) |
| 20 to 24 Minutes | 0 (0.0%) | 13 (18.6%) |
| 25 to 29 Minutes | 0 (0.0%) | 0 (0.0%) |
| 30 to 34 Minutes | 57 (47.1%) | 3 (4.3%) |
| 35 to 39 Minutes | 2 (1.7%) | 0 (0.0%) |
| 40 to 44 Minutes | 7 (5.8%) | 5 (7.1%) |
| 45 to 59 Minutes | 14 (11.6%) | 11 (15.7%) |
| 60 to 89 Minutes | 0 (0.0%) | 4 (5.7%) |
| 90 or more Minutes | 4 (3.3%) | 7 (10.0%) |
Time of Departure to Work by Sex in Mud Lake
The most frequent times of departure to work in Mud Lake are 6:00 AM to 6:29 AM (49, 40.5%) for males and 7:30 AM to 7:59 AM (22, 31.4%) for females.
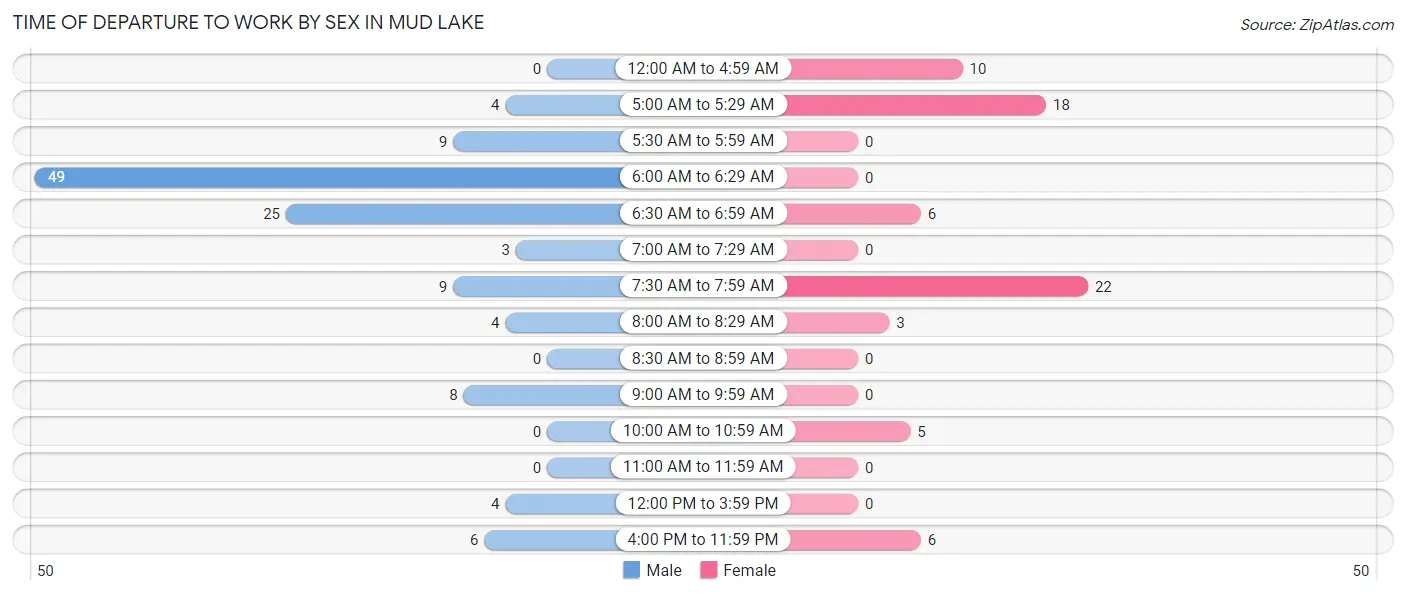
| Time of Departure | Male | Female |
| 12:00 AM to 4:59 AM | 0 (0.0%) | 10 (14.3%) |
| 5:00 AM to 5:29 AM | 4 (3.3%) | 18 (25.7%) |
| 5:30 AM to 5:59 AM | 9 (7.4%) | 0 (0.0%) |
| 6:00 AM to 6:29 AM | 49 (40.5%) | 0 (0.0%) |
| 6:30 AM to 6:59 AM | 25 (20.7%) | 6 (8.6%) |
| 7:00 AM to 7:29 AM | 3 (2.5%) | 0 (0.0%) |
| 7:30 AM to 7:59 AM | 9 (7.4%) | 22 (31.4%) |
| 8:00 AM to 8:29 AM | 4 (3.3%) | 3 (4.3%) |
| 8:30 AM to 8:59 AM | 0 (0.0%) | 0 (0.0%) |
| 9:00 AM to 9:59 AM | 8 (6.6%) | 0 (0.0%) |
| 10:00 AM to 10:59 AM | 0 (0.0%) | 5 (7.1%) |
| 11:00 AM to 11:59 AM | 0 (0.0%) | 0 (0.0%) |
| 12:00 PM to 3:59 PM | 4 (3.3%) | 0 (0.0%) |
| 4:00 PM to 11:59 PM | 6 (5.0%) | 6 (8.6%) |
| Total | 121 (100.0%) | 70 (100.0%) |
Housing Occupancy in Mud Lake
Occupancy by Ownership in Mud Lake
Of the total 148 dwellings in Mud Lake, owner-occupied units account for 75 (50.7%), while renter-occupied units make up 73 (49.3%).
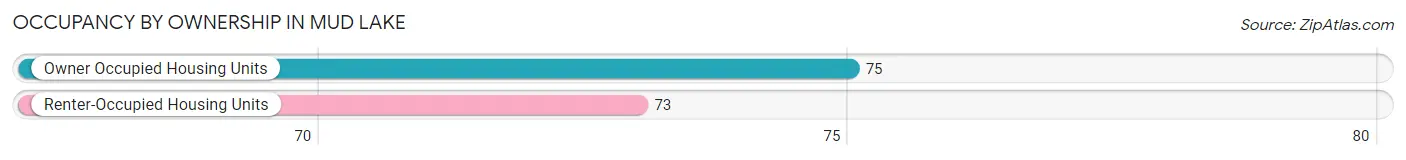
| Occupancy | # Housing Units | % Housing Units |
| Owner Occupied Housing Units | 75 | 50.7% |
| Renter-Occupied Housing Units | 73 | 49.3% |
| Total Occupied Housing Units | 148 | 100.0% |
Occupancy by Household Size in Mud Lake
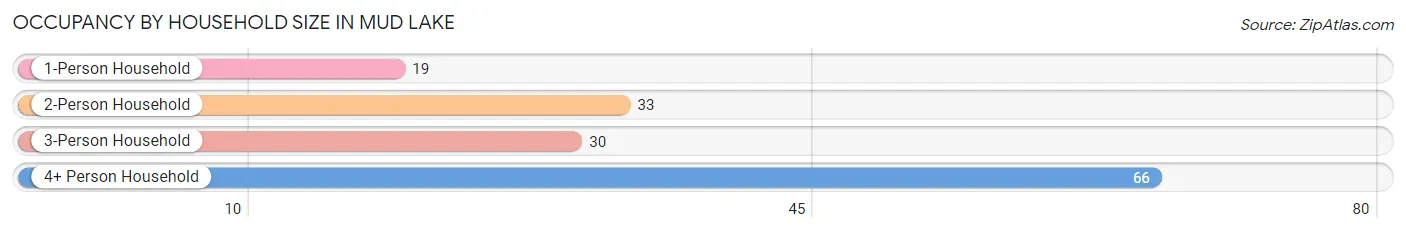
| Household Size | # Housing Units | % Housing Units |
| 1-Person Household | 19 | 12.8% |
| 2-Person Household | 33 | 22.3% |
| 3-Person Household | 30 | 20.3% |
| 4+ Person Household | 66 | 44.6% |
| Total Housing Units | 148 | 100.0% |
Occupancy by Ownership by Household Size in Mud Lake
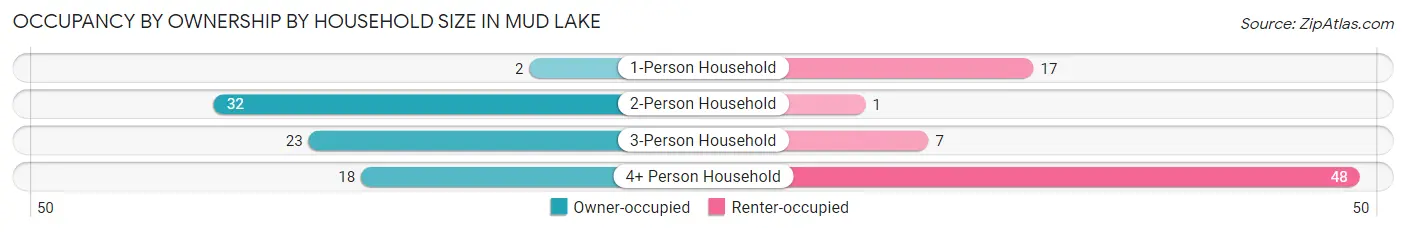
| Household Size | Owner-occupied | Renter-occupied |
| 1-Person Household | 2 (10.5%) | 17 (89.5%) |
| 2-Person Household | 32 (97.0%) | 1 (3.0%) |
| 3-Person Household | 23 (76.7%) | 7 (23.3%) |
| 4+ Person Household | 18 (27.3%) | 48 (72.7%) |
| Total Housing Units | 75 (50.7%) | 73 (49.3%) |
Occupancy by Educational Attainment in Mud Lake
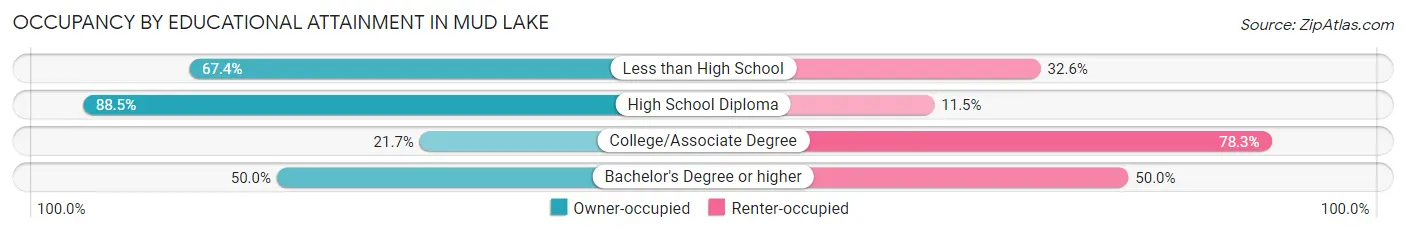
| Household Size | Owner-occupied | Renter-occupied |
| Less than High School | 31 (67.4%) | 15 (32.6%) |
| High School Diploma | 23 (88.5%) | 3 (11.5%) |
| College/Associate Degree | 13 (21.7%) | 47 (78.3%) |
| Bachelor's Degree or higher | 8 (50.0%) | 8 (50.0%) |
Occupancy by Age of Householder in Mud Lake
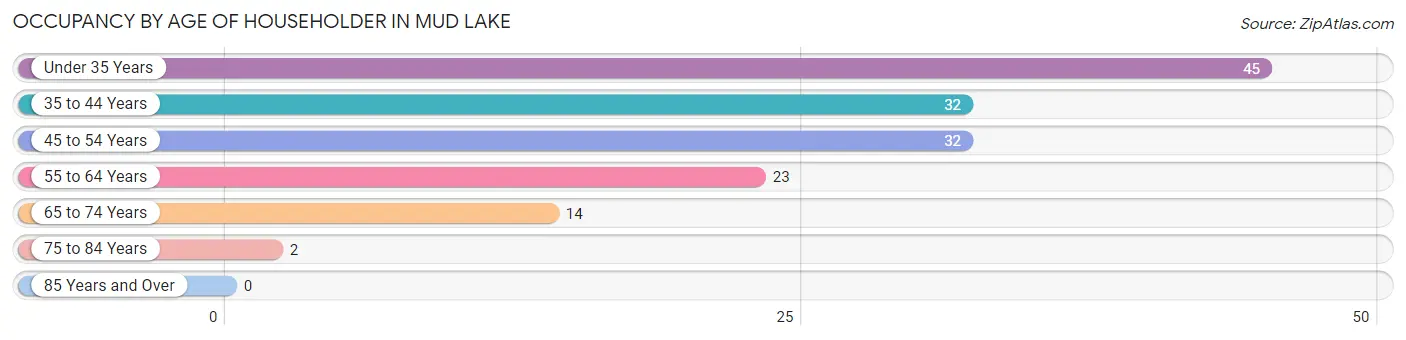
| Age Bracket | # Households | % Households |
| Under 35 Years | 45 | 30.4% |
| 35 to 44 Years | 32 | 21.6% |
| 45 to 54 Years | 32 | 21.6% |
| 55 to 64 Years | 23 | 15.5% |
| 65 to 74 Years | 14 | 9.5% |
| 75 to 84 Years | 2 | 1.3% |
| 85 Years and Over | 0 | 0.0% |
| Total | 148 | 100.0% |
Housing Finances in Mud Lake
Median Income by Occupancy in Mud Lake
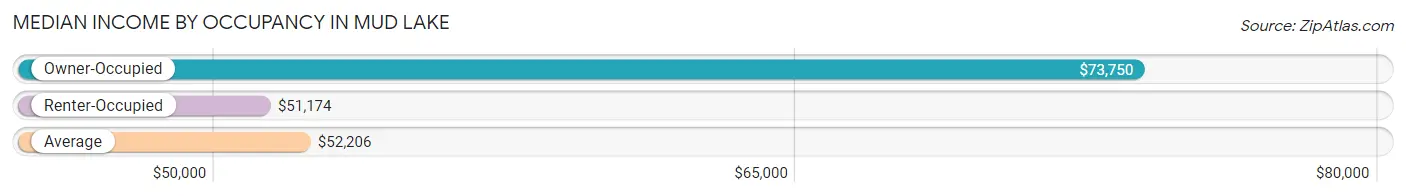
| Occupancy Type | # Households | Median Income |
| Owner-Occupied | 75 (50.7%) | $73,750 |
| Renter-Occupied | 73 (49.3%) | $51,174 |
| Average | 148 (100.0%) | $52,206 |
Occupancy by Householder Income Bracket in Mud Lake
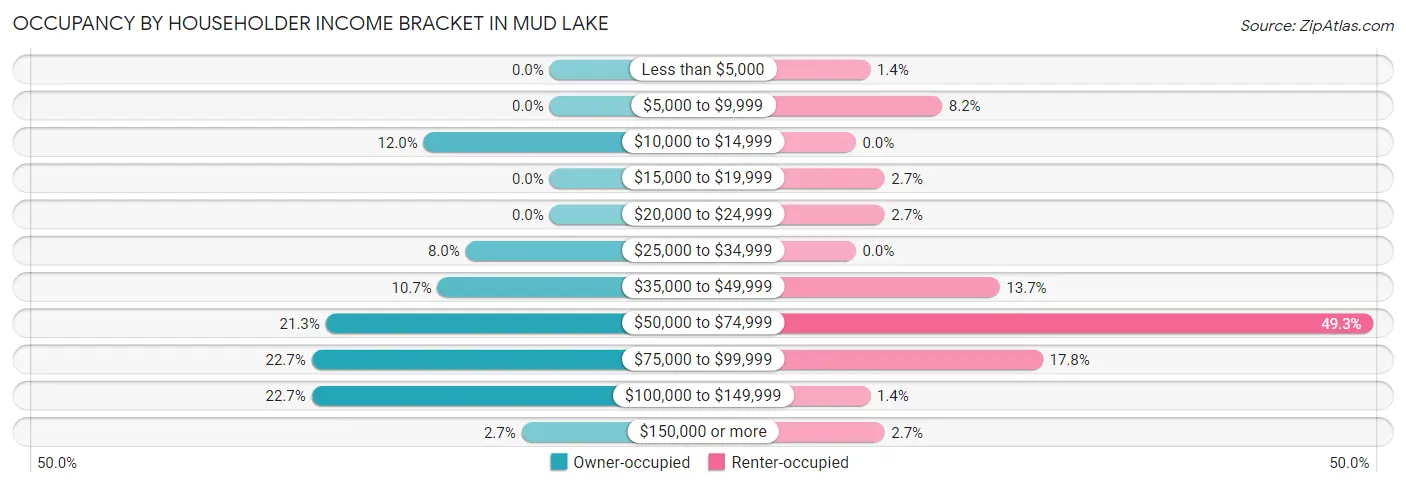
| Income Bracket | Owner-occupied | Renter-occupied |
| Less than $5,000 | 0 (0.0%) | 1 (1.4%) |
| $5,000 to $9,999 | 0 (0.0%) | 6 (8.2%) |
| $10,000 to $14,999 | 9 (12.0%) | 0 (0.0%) |
| $15,000 to $19,999 | 0 (0.0%) | 2 (2.7%) |
| $20,000 to $24,999 | 0 (0.0%) | 2 (2.7%) |
| $25,000 to $34,999 | 6 (8.0%) | 0 (0.0%) |
| $35,000 to $49,999 | 8 (10.7%) | 10 (13.7%) |
| $50,000 to $74,999 | 16 (21.3%) | 36 (49.3%) |
| $75,000 to $99,999 | 17 (22.7%) | 13 (17.8%) |
| $100,000 to $149,999 | 17 (22.7%) | 1 (1.4%) |
| $150,000 or more | 2 (2.7%) | 2 (2.7%) |
| Total | 75 (100.0%) | 73 (100.0%) |
Monthly Housing Cost Tiers in Mud Lake
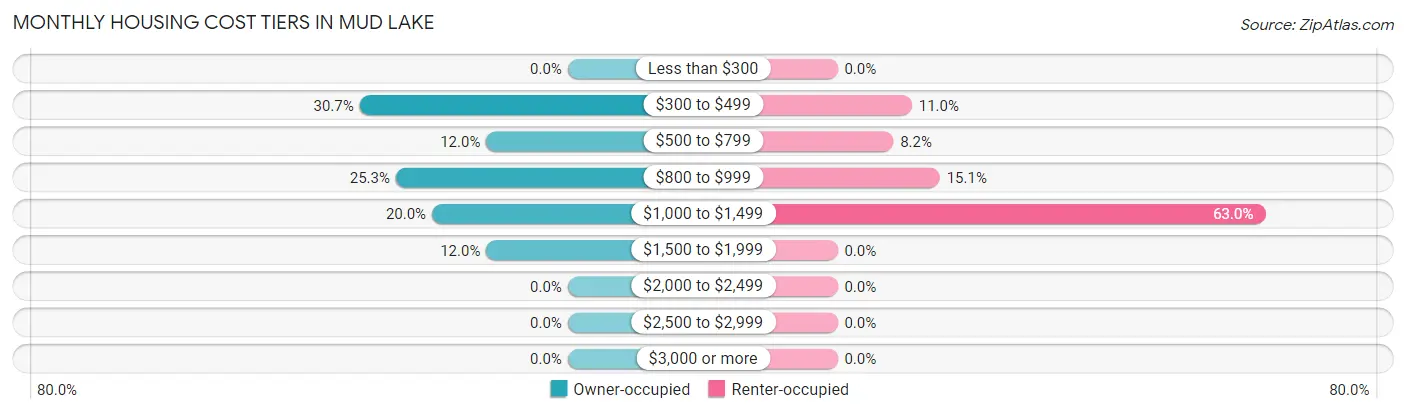
| Monthly Cost | Owner-occupied | Renter-occupied |
| Less than $300 | 0 (0.0%) | 0 (0.0%) |
| $300 to $499 | 23 (30.7%) | 8 (11.0%) |
| $500 to $799 | 9 (12.0%) | 6 (8.2%) |
| $800 to $999 | 19 (25.3%) | 11 (15.1%) |
| $1,000 to $1,499 | 15 (20.0%) | 46 (63.0%) |
| $1,500 to $1,999 | 9 (12.0%) | 0 (0.0%) |
| $2,000 to $2,499 | 0 (0.0%) | 0 (0.0%) |
| $2,500 to $2,999 | 0 (0.0%) | 0 (0.0%) |
| $3,000 or more | 0 (0.0%) | 0 (0.0%) |
| Total | 75 (100.0%) | 73 (100.0%) |
Physical Housing Characteristics in Mud Lake
Housing Structures in Mud Lake
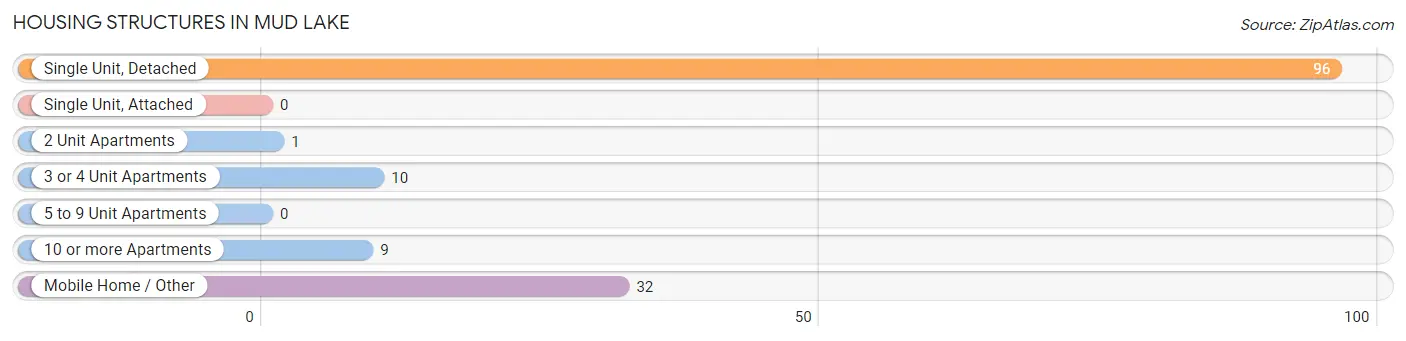
| Structure Type | # Housing Units | % Housing Units |
| Single Unit, Detached | 96 | 64.9% |
| Single Unit, Attached | 0 | 0.0% |
| 2 Unit Apartments | 1 | 0.7% |
| 3 or 4 Unit Apartments | 10 | 6.8% |
| 5 to 9 Unit Apartments | 0 | 0.0% |
| 10 or more Apartments | 9 | 6.1% |
| Mobile Home / Other | 32 | 21.6% |
| Total | 148 | 100.0% |
Housing Structures by Occupancy in Mud Lake
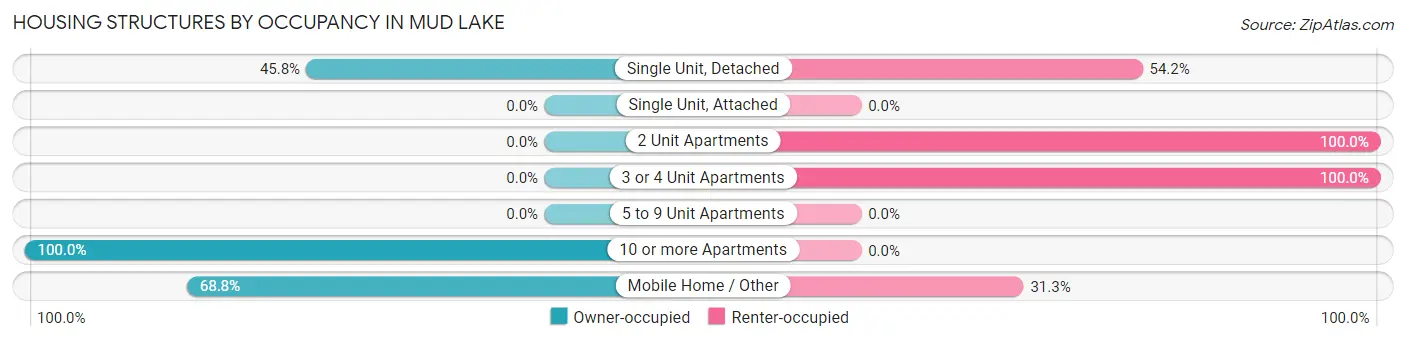
| Structure Type | Owner-occupied | Renter-occupied |
| Single Unit, Detached | 44 (45.8%) | 52 (54.2%) |
| Single Unit, Attached | 0 (0.0%) | 0 (0.0%) |
| 2 Unit Apartments | 0 (0.0%) | 1 (100.0%) |
| 3 or 4 Unit Apartments | 0 (0.0%) | 10 (100.0%) |
| 5 to 9 Unit Apartments | 0 (0.0%) | 0 (0.0%) |
| 10 or more Apartments | 9 (100.0%) | 0 (0.0%) |
| Mobile Home / Other | 22 (68.8%) | 10 (31.2%) |
| Total | 75 (50.7%) | 73 (49.3%) |
Housing Structures by Number of Rooms in Mud Lake
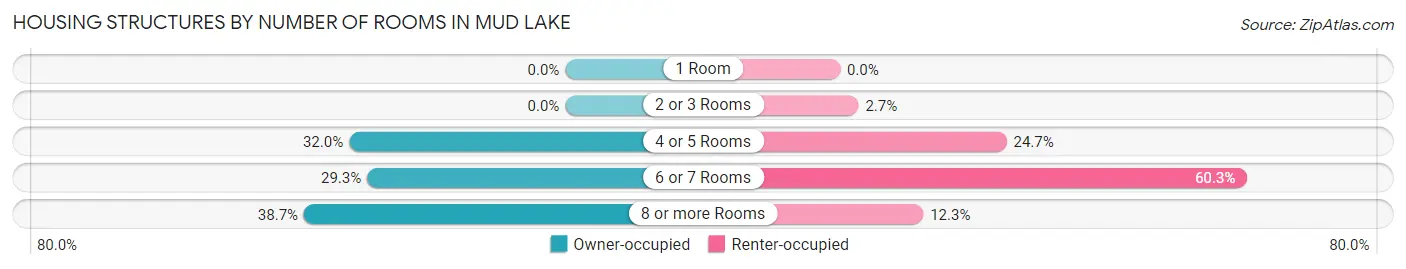
| Number of Rooms | Owner-occupied | Renter-occupied |
| 1 Room | 0 (0.0%) | 0 (0.0%) |
| 2 or 3 Rooms | 0 (0.0%) | 2 (2.7%) |
| 4 or 5 Rooms | 24 (32.0%) | 18 (24.7%) |
| 6 or 7 Rooms | 22 (29.3%) | 44 (60.3%) |
| 8 or more Rooms | 29 (38.7%) | 9 (12.3%) |
| Total | 75 (100.0%) | 73 (100.0%) |
Housing Structure by Heating Type in Mud Lake
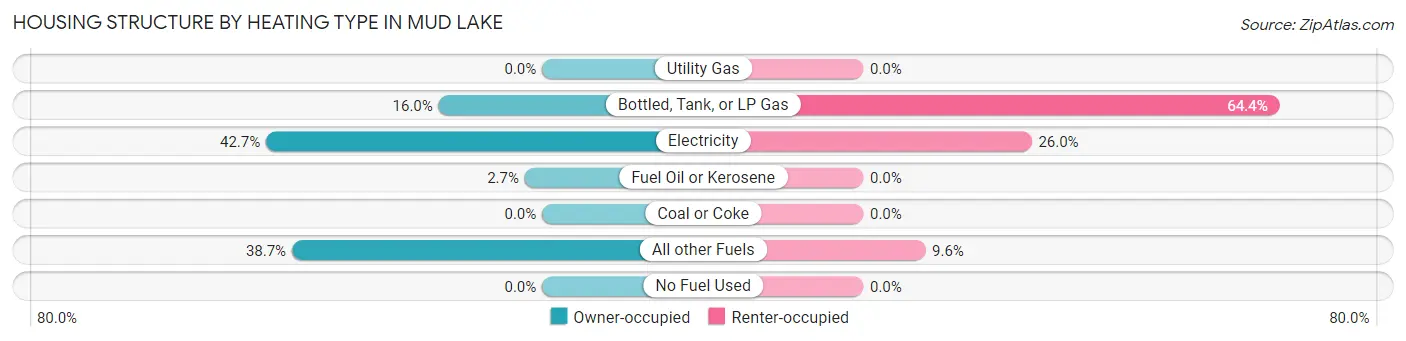
| Heating Type | Owner-occupied | Renter-occupied |
| Utility Gas | 0 (0.0%) | 0 (0.0%) |
| Bottled, Tank, or LP Gas | 12 (16.0%) | 47 (64.4%) |
| Electricity | 32 (42.7%) | 19 (26.0%) |
| Fuel Oil or Kerosene | 2 (2.7%) | 0 (0.0%) |
| Coal or Coke | 0 (0.0%) | 0 (0.0%) |
| All other Fuels | 29 (38.7%) | 7 (9.6%) |
| No Fuel Used | 0 (0.0%) | 0 (0.0%) |
| Total | 75 (100.0%) | 73 (100.0%) |
Household Vehicle Usage in Mud Lake
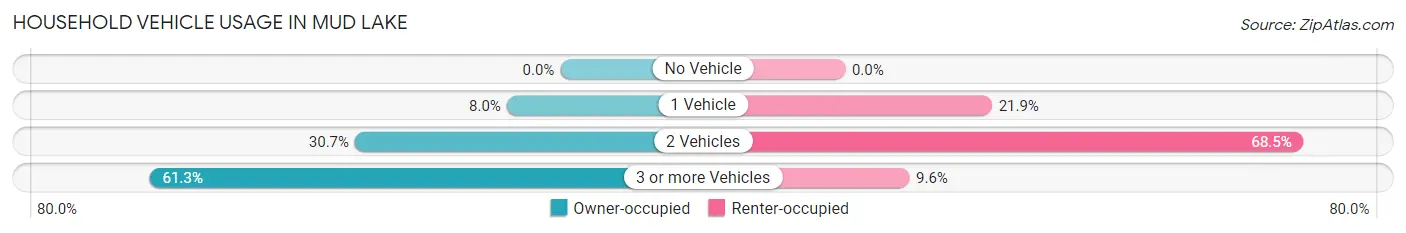
| Vehicles per Household | Owner-occupied | Renter-occupied |
| No Vehicle | 0 (0.0%) | 0 (0.0%) |
| 1 Vehicle | 6 (8.0%) | 16 (21.9%) |
| 2 Vehicles | 23 (30.7%) | 50 (68.5%) |
| 3 or more Vehicles | 46 (61.3%) | 7 (9.6%) |
| Total | 75 (100.0%) | 73 (100.0%) |
Real Estate & Mortgages in Mud Lake
Real Estate and Mortgage Overview in Mud Lake
| Characteristic | Without Mortgage | With Mortgage |
| Housing Units | 36 | 39 |
| Median Property Value | $106,300 | $154,200 |
| Median Household Income | $77,500 | $2 |
| Monthly Housing Costs | $464 | $0 |
| Real Estate Taxes | $950 | $11 |
Property Value by Mortgage Status in Mud Lake
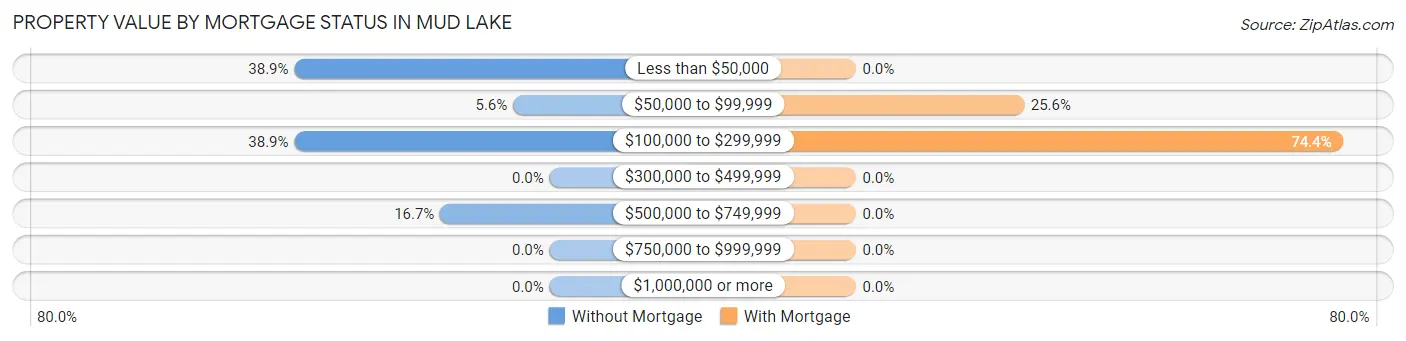
| Property Value | Without Mortgage | With Mortgage |
| Less than $50,000 | 14 (38.9%) | 0 (0.0%) |
| $50,000 to $99,999 | 2 (5.6%) | 10 (25.6%) |
| $100,000 to $299,999 | 14 (38.9%) | 29 (74.4%) |
| $300,000 to $499,999 | 0 (0.0%) | 0 (0.0%) |
| $500,000 to $749,999 | 6 (16.7%) | 0 (0.0%) |
| $750,000 to $999,999 | 0 (0.0%) | 0 (0.0%) |
| $1,000,000 or more | 0 (0.0%) | 0 (0.0%) |
| Total | 36 (100.0%) | 39 (100.0%) |
Household Income by Mortgage Status in Mud Lake
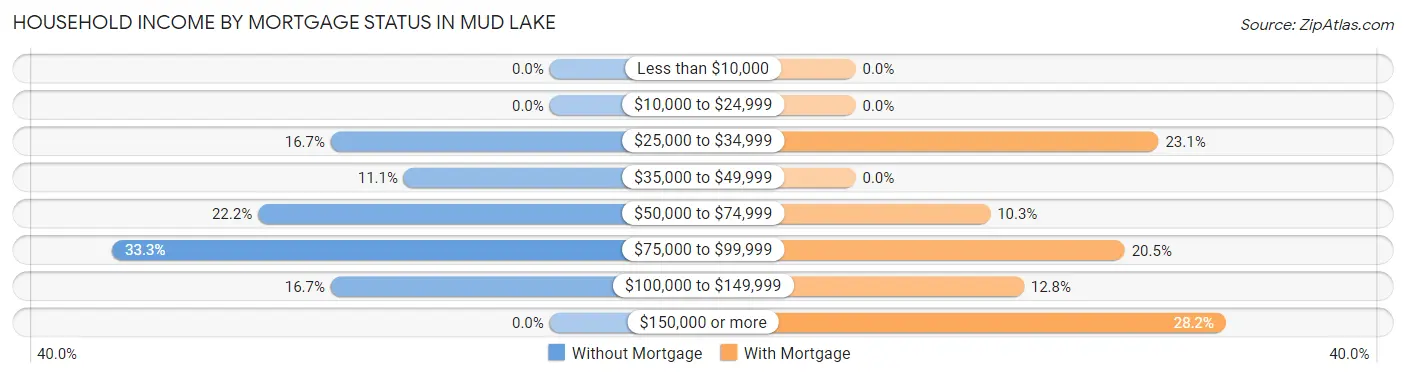
| Household Income | Without Mortgage | With Mortgage |
| Less than $10,000 | 0 (0.0%) | 0 (0.0%) |
| $10,000 to $24,999 | 0 (0.0%) | 0 (0.0%) |
| $25,000 to $34,999 | 6 (16.7%) | 9 (23.1%) |
| $35,000 to $49,999 | 4 (11.1%) | 0 (0.0%) |
| $50,000 to $74,999 | 8 (22.2%) | 4 (10.3%) |
| $75,000 to $99,999 | 12 (33.3%) | 8 (20.5%) |
| $100,000 to $149,999 | 6 (16.7%) | 5 (12.8%) |
| $150,000 or more | 0 (0.0%) | 11 (28.2%) |
| Total | 36 (100.0%) | 39 (100.0%) |
Property Value to Household Income Ratio in Mud Lake
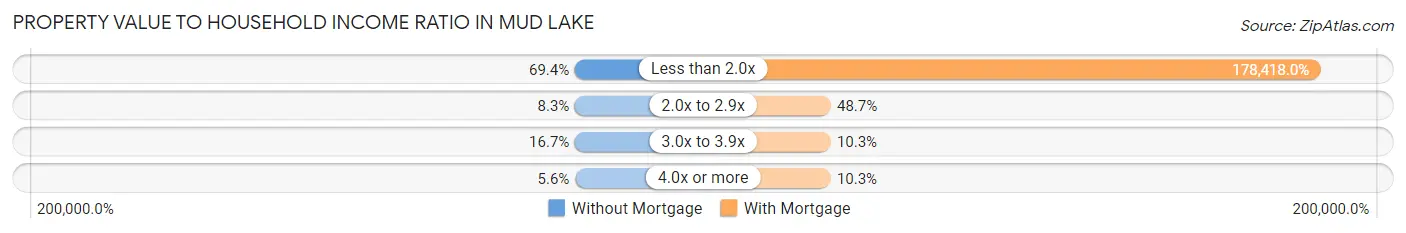
| Value-to-Income Ratio | Without Mortgage | With Mortgage |
| Less than 2.0x | 25 (69.4%) | 69,583 (178,417.9%) |
| 2.0x to 2.9x | 3 (8.3%) | 19 (48.7%) |
| 3.0x to 3.9x | 6 (16.7%) | 4 (10.3%) |
| 4.0x or more | 2 (5.6%) | 4 (10.3%) |
| Total | 36 (100.0%) | 39 (100.0%) |
Real Estate Taxes by Mortgage Status in Mud Lake
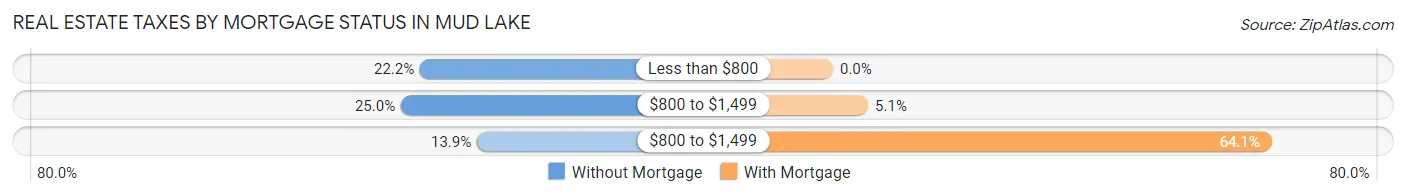
| Property Taxes | Without Mortgage | With Mortgage |
| Less than $800 | 8 (22.2%) | 0 (0.0%) |
| $800 to $1,499 | 9 (25.0%) | 2 (5.1%) |
| $800 to $1,499 | 5 (13.9%) | 25 (64.1%) |
| Total | 36 (100.0%) | 39 (100.0%) |
Health & Disability in Mud Lake
Health Insurance Coverage by Age in Mud Lake
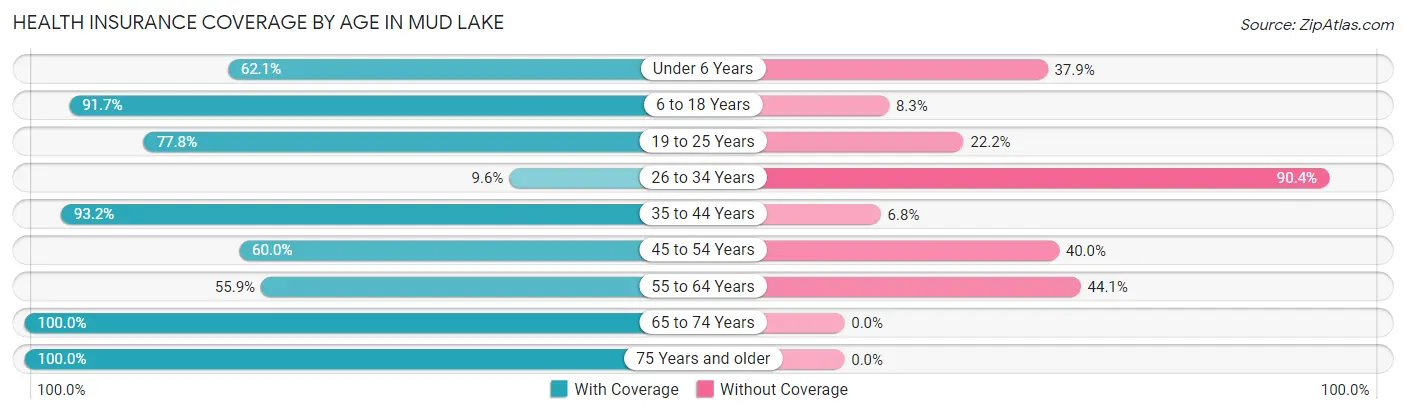
| Age Bracket | With Coverage | Without Coverage |
| Under 6 Years | 59 (62.1%) | 36 (37.9%) |
| 6 to 18 Years | 66 (91.7%) | 6 (8.3%) |
| 19 to 25 Years | 21 (77.8%) | 6 (22.2%) |
| 26 to 34 Years | 8 (9.6%) | 75 (90.4%) |
| 35 to 44 Years | 55 (93.2%) | 4 (6.8%) |
| 45 to 54 Years | 27 (60.0%) | 18 (40.0%) |
| 55 to 64 Years | 33 (55.9%) | 26 (44.1%) |
| 65 to 74 Years | 23 (100.0%) | 0 (0.0%) |
| 75 Years and older | 5 (100.0%) | 0 (0.0%) |
| Total | 297 (63.5%) | 171 (36.5%) |
Health Insurance Coverage by Citizenship Status in Mud Lake
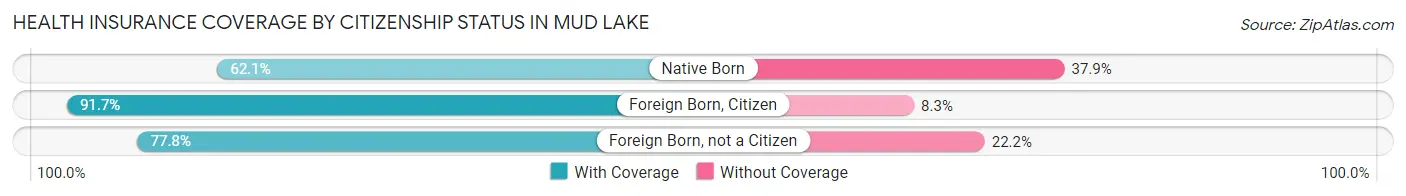
| Citizenship Status | With Coverage | Without Coverage |
| Native Born | 59 (62.1%) | 36 (37.9%) |
| Foreign Born, Citizen | 66 (91.7%) | 6 (8.3%) |
| Foreign Born, not a Citizen | 21 (77.8%) | 6 (22.2%) |
Health Insurance Coverage by Household Income in Mud Lake
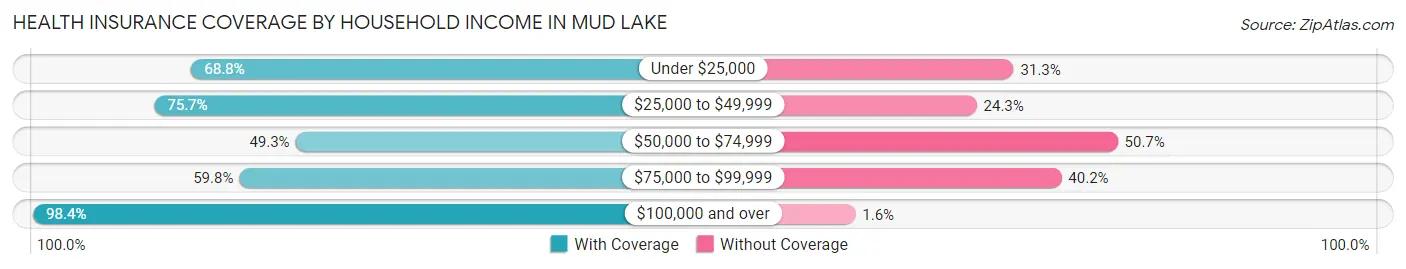
| Household Income | With Coverage | Without Coverage |
| Under $25,000 | 22 (68.8%) | 10 (31.2%) |
| $25,000 to $49,999 | 56 (75.7%) | 18 (24.3%) |
| $50,000 to $74,999 | 100 (49.3%) | 103 (50.7%) |
| $75,000 to $99,999 | 58 (59.8%) | 39 (40.2%) |
| $100,000 and over | 61 (98.4%) | 1 (1.6%) |
Public vs Private Health Insurance Coverage by Age in Mud Lake
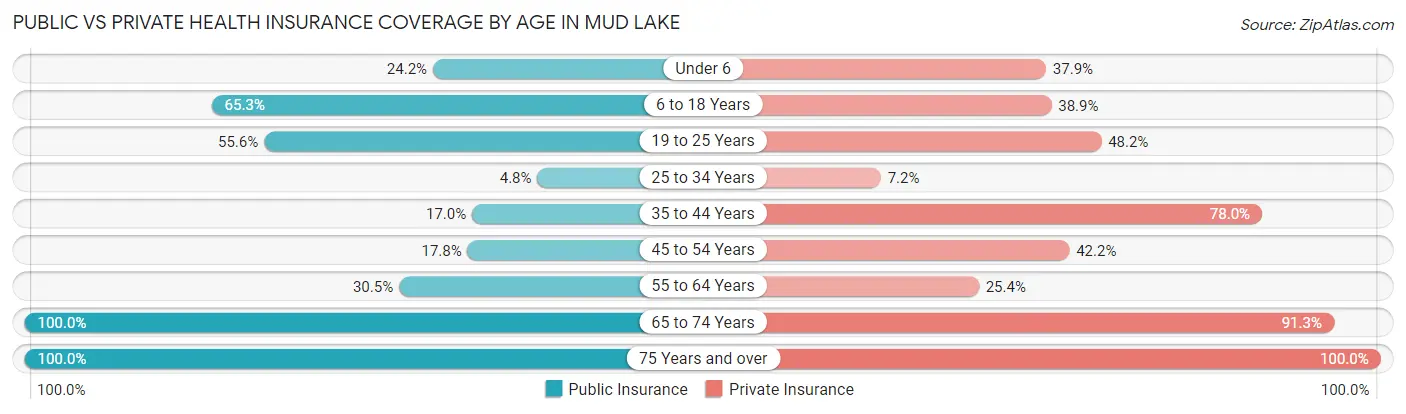
| Age Bracket | Public Insurance | Private Insurance |
| Under 6 | 23 (24.2%) | 36 (37.9%) |
| 6 to 18 Years | 47 (65.3%) | 28 (38.9%) |
| 19 to 25 Years | 15 (55.6%) | 13 (48.1%) |
| 25 to 34 Years | 4 (4.8%) | 6 (7.2%) |
| 35 to 44 Years | 10 (17.0%) | 46 (78.0%) |
| 45 to 54 Years | 8 (17.8%) | 19 (42.2%) |
| 55 to 64 Years | 18 (30.5%) | 15 (25.4%) |
| 65 to 74 Years | 23 (100.0%) | 21 (91.3%) |
| 75 Years and over | 5 (100.0%) | 5 (100.0%) |
| Total | 153 (32.7%) | 189 (40.4%) |
Disability Status by Sex by Age in Mud Lake
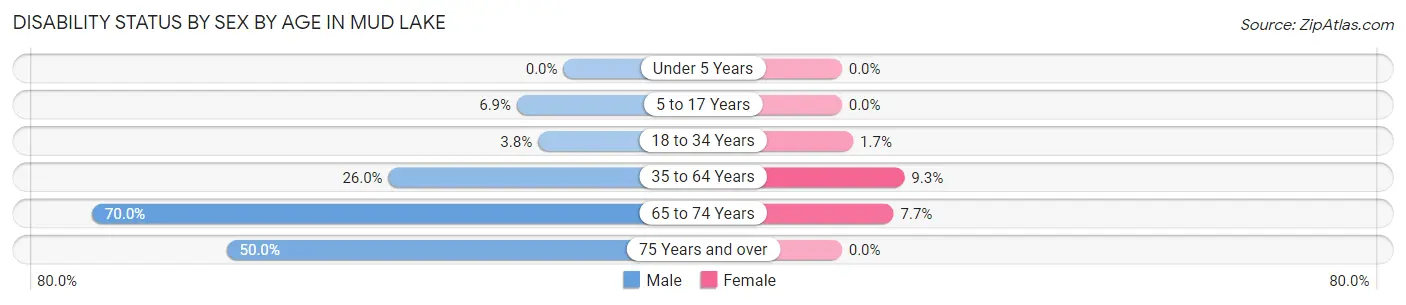
| Age Bracket | Male | Female |
| Under 5 Years | 0 (0.0%) | 0 (0.0%) |
| 5 to 17 Years | 4 (6.9%) | 0 (0.0%) |
| 18 to 34 Years | 2 (3.8%) | 1 (1.7%) |
| 35 to 64 Years | 20 (26.0%) | 8 (9.3%) |
| 65 to 74 Years | 7 (70.0%) | 1 (7.7%) |
| 75 Years and over | 2 (50.0%) | 0 (0.0%) |
Disability Class by Sex by Age in Mud Lake
Disability Class: Hearing Difficulty
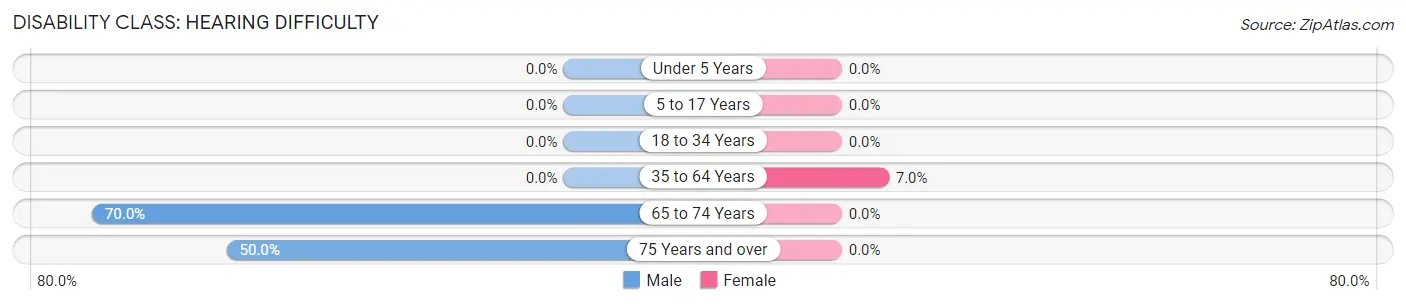
| Age Bracket | Male | Female |
| Under 5 Years | 0 (0.0%) | 0 (0.0%) |
| 5 to 17 Years | 0 (0.0%) | 0 (0.0%) |
| 18 to 34 Years | 0 (0.0%) | 0 (0.0%) |
| 35 to 64 Years | 0 (0.0%) | 6 (7.0%) |
| 65 to 74 Years | 7 (70.0%) | 0 (0.0%) |
| 75 Years and over | 2 (50.0%) | 0 (0.0%) |
Disability Class: Vision Difficulty
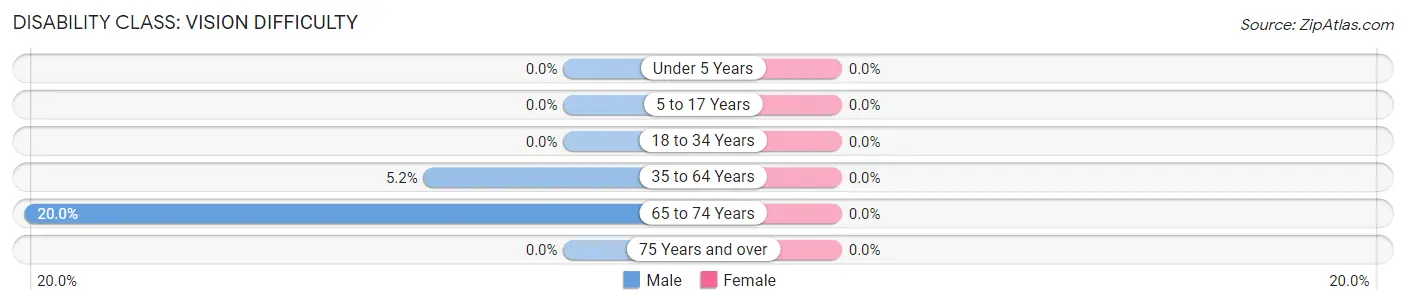
| Age Bracket | Male | Female |
| Under 5 Years | 0 (0.0%) | 0 (0.0%) |
| 5 to 17 Years | 0 (0.0%) | 0 (0.0%) |
| 18 to 34 Years | 0 (0.0%) | 0 (0.0%) |
| 35 to 64 Years | 4 (5.2%) | 0 (0.0%) |
| 65 to 74 Years | 2 (20.0%) | 0 (0.0%) |
| 75 Years and over | 0 (0.0%) | 0 (0.0%) |
Disability Class: Cognitive Difficulty
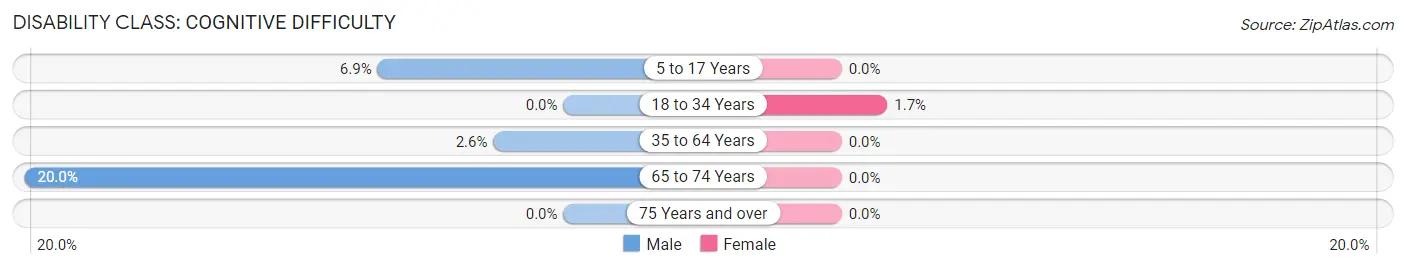
| Age Bracket | Male | Female |
| 5 to 17 Years | 4 (6.9%) | 0 (0.0%) |
| 18 to 34 Years | 0 (0.0%) | 1 (1.7%) |
| 35 to 64 Years | 2 (2.6%) | 0 (0.0%) |
| 65 to 74 Years | 2 (20.0%) | 0 (0.0%) |
| 75 Years and over | 0 (0.0%) | 0 (0.0%) |
Disability Class: Ambulatory Difficulty
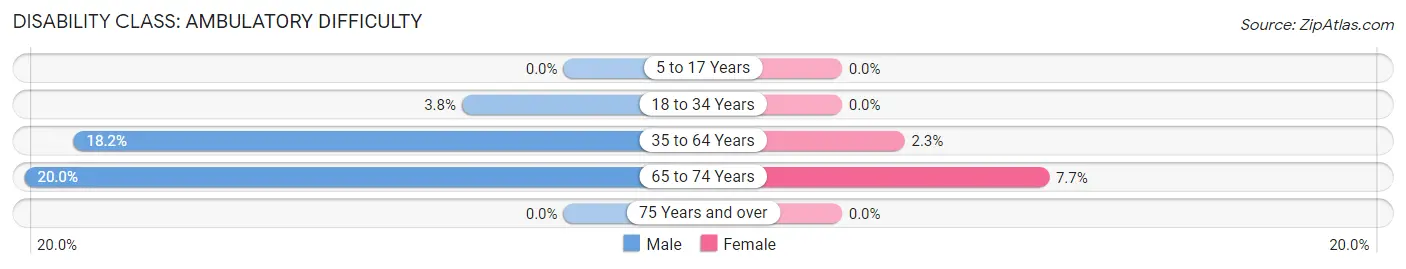
| Age Bracket | Male | Female |
| 5 to 17 Years | 0 (0.0%) | 0 (0.0%) |
| 18 to 34 Years | 2 (3.8%) | 0 (0.0%) |
| 35 to 64 Years | 14 (18.2%) | 2 (2.3%) |
| 65 to 74 Years | 2 (20.0%) | 1 (7.7%) |
| 75 Years and over | 0 (0.0%) | 0 (0.0%) |
Disability Class: Self-Care Difficulty
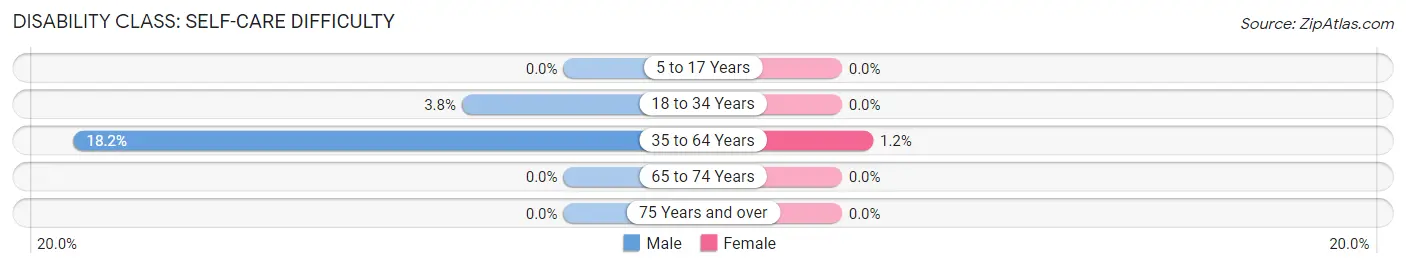
| Age Bracket | Male | Female |
| 5 to 17 Years | 0 (0.0%) | 0 (0.0%) |
| 18 to 34 Years | 2 (3.8%) | 0 (0.0%) |
| 35 to 64 Years | 14 (18.2%) | 1 (1.2%) |
| 65 to 74 Years | 0 (0.0%) | 0 (0.0%) |
| 75 Years and over | 0 (0.0%) | 0 (0.0%) |
Technology Access in Mud Lake
Computing Device Access in Mud Lake
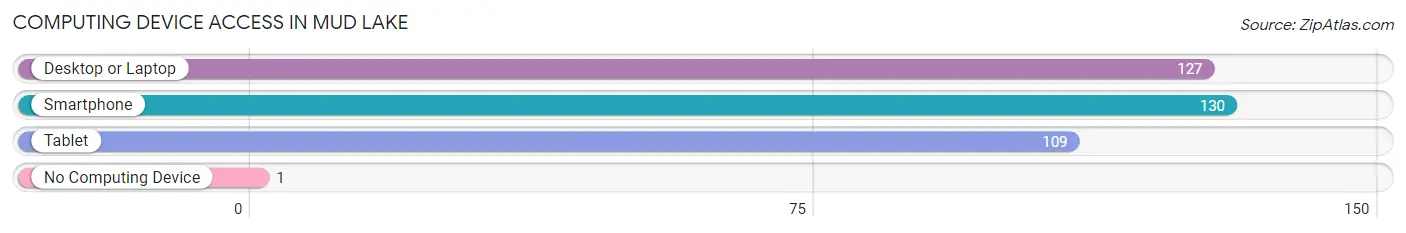
| Device Type | # Households | % Households |
| Desktop or Laptop | 127 | 85.8% |
| Smartphone | 130 | 87.8% |
| Tablet | 109 | 73.7% |
| No Computing Device | 1 | 0.7% |
| Total | 148 | 100.0% |
Internet Access in Mud Lake
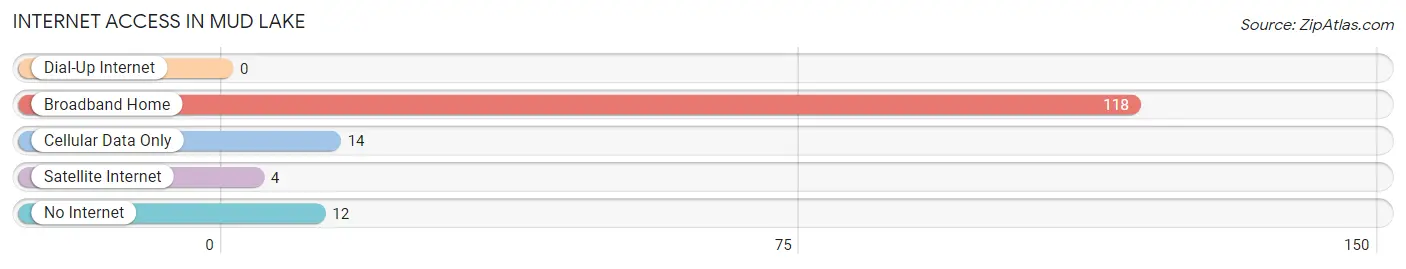
| Internet Type | # Households | % Households |
| Dial-Up Internet | 0 | 0.0% |
| Broadband Home | 118 | 79.7% |
| Cellular Data Only | 14 | 9.5% |
| Satellite Internet | 4 | 2.7% |
| No Internet | 12 | 8.1% |
| Total | 148 | 100.0% |
Mud Lake Summary
Mud Lake is a small town located in the southeastern corner of Idaho, in Bonneville County. It is situated on the banks of the Snake River, near the Idaho-Wyoming border. The town was founded in 1883 and has a population of approximately 500 people.
History
Mud Lake was founded in 1883 by a group of settlers from the nearby town of Idaho Falls. The settlers were looking for a place to settle and farm, and they chose the area around Mud Lake because of its fertile soil and abundant water supply. The town was originally called "Mud Lake City," but the name was changed to Mud Lake in 1885.
The town grew slowly but steadily over the years, and by the early 1900s it had become a thriving agricultural community. The town was home to several businesses, including a general store, a blacksmith shop, a hotel, and a post office.
In the 1920s, the town began to experience a decline in population as many of its residents moved away to larger cities. This trend continued until the 1950s, when the town began to experience a resurgence in population. This was due in part to the construction of the nearby Jackson Dam, which provided irrigation water to the area.
Geography
Mud Lake is located in the southeastern corner of Idaho, in Bonneville County. It is situated on the banks of the Snake River, near the Idaho-Wyoming border. The town is surrounded by rolling hills and farmland, and is located approximately 20 miles north of Idaho Falls.
The climate in Mud Lake is semi-arid, with hot summers and cold winters. The average annual temperature is around 50 degrees Fahrenheit, and the average annual precipitation is around 12 inches.
Economy
Mud Lake's economy is largely based on agriculture. The town is home to several farms, which produce a variety of crops, including potatoes, corn, wheat, and hay. The town is also home to several small businesses, including a general store, a hardware store, and a restaurant.
Demographics
As of the 2010 census, the population of Mud Lake was 498. The racial makeup of the town was 95.2% White, 0.2% African American, 0.4% Native American, 0.4% Asian, 0.2% Pacific Islander, and 3.6% from other races. The median household income was $37,500, and the median family income was $41,250.
Conclusion
Mud Lake is a small town located in the southeastern corner of Idaho, in Bonneville County. It was founded in 1883 and has a population of approximately 500 people. The town's economy is largely based on agriculture, and it is home to several small businesses. The town has a semi-arid climate, with hot summers and cold winters. The population of Mud Lake is predominantly White, with a small percentage of other races.
Common Questions
What is the Total Population of Mud Lake?
Total Population of Mud Lake is 468.
What is the Total Male Population of Mud Lake?
Total Male Population of Mud Lake is 220.
What is the Total Female Population of Mud Lake?
Total Female Population of Mud Lake is 248.
What is the Ratio of Males per 100 Females in Mud Lake?
There are 88.71 Males per 100 Females in Mud Lake.
What is the Ratio of Females per 100 Males in Mud Lake?
There are 112.73 Females per 100 Males in Mud Lake.
What is the Median Population Age in Mud Lake?
Median Population Age in Mud Lake is 29.1 Years.
What is the Average Family Size in Mud Lake
Average Family Size in Mud Lake is 3.5 People.
What is the Average Household Size in Mud Lake
Average Household Size in Mud Lake is 3.2 People.
What is Per Capita Income in Mud Lake?
Per Capita income in Mud Lake is $20,001.
What is the Median Family Income in Mud Lake?
Median Family Income in Mud Lake is $52,096.
What is the Median Household income in Mud Lake?
Median Household Income in Mud Lake is $52,206.
What is Income or Wage Gap in Mud Lake?
Income or Wage Gap in Mud Lake is 56.0%.
Women in Mud Lake earn 44.0 cents for every dollar earned by a man.
What is Inequality or Gini Index in Mud Lake?
Inequality or Gini Index in Mud Lake is 0.31.
How Large is the Labor Force in Mud Lake?
There are 201 People in the Labor Forcein in Mud Lake.
What is the Percentage of People in the Labor Force in Mud Lake?
62.2% of People are in the Labor Force in Mud Lake.
What is the Unemployment Rate in Mud Lake?
Unemployment Rate in Mud Lake is 5.0%.