Zip Codes with the Highest Percentage of Population Employed in Architecture & Engineering in Moscow, ID
RELATED REPORTS & OPTIONS
Architecture & Engineering
Moscow
Compare Zip Codes
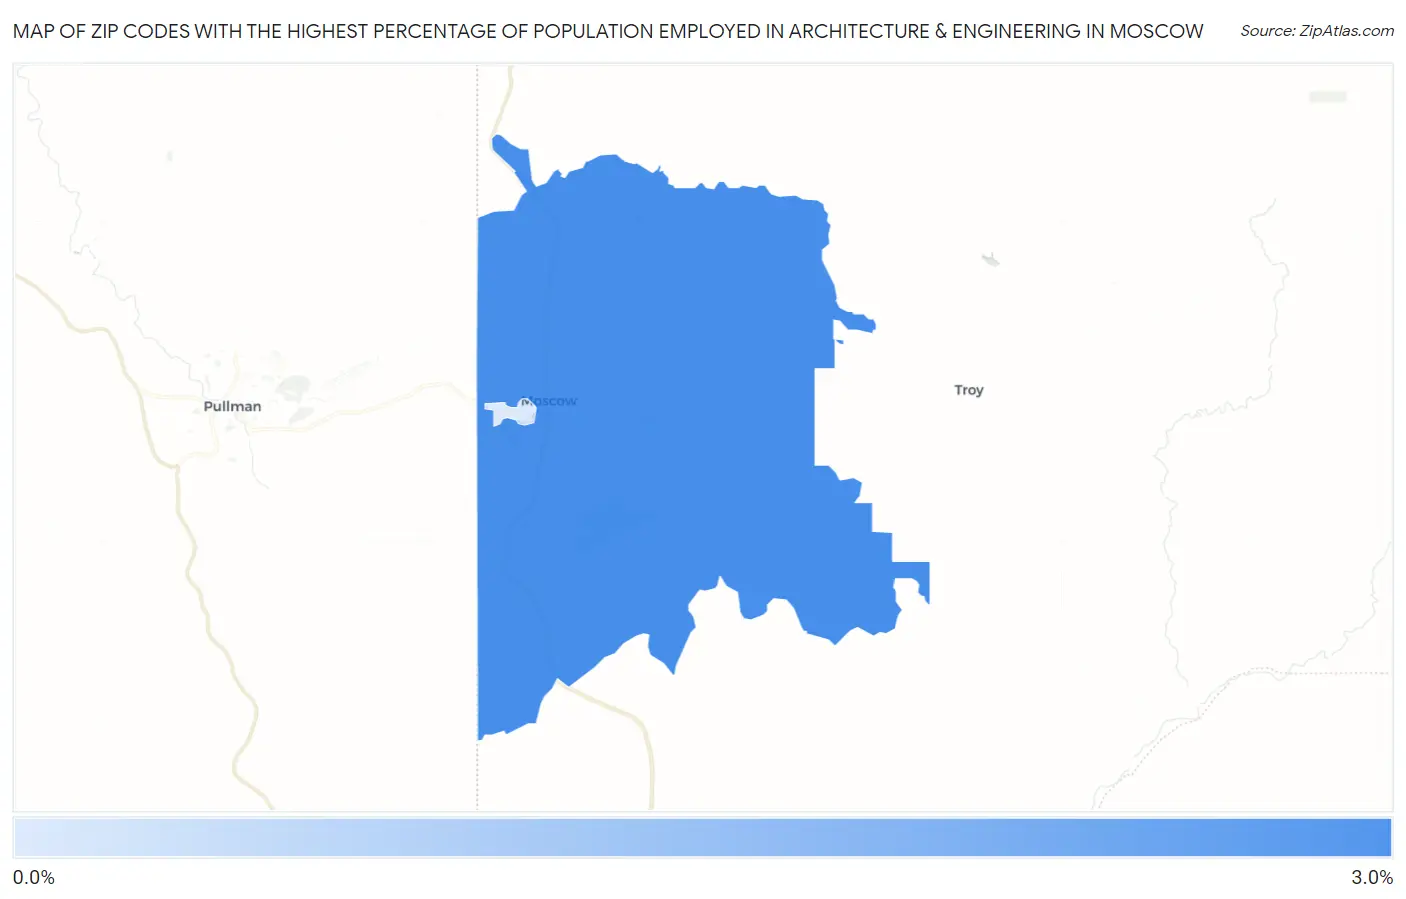
Map of Zip Codes with the Highest Percentage of Population Employed in Architecture & Engineering in Moscow
0.0%
3.0%
Zip Codes with the Highest Percentage of Population Employed in Architecture & Engineering in Moscow, ID
| Zip Code | % Employed | vs State | vs National | |
| 1. | 83843 | 2.5% | 2.2%(+0.366)#47 | 2.1%(+0.395)#6,818 |
| 2. | 83844 | 0.99% | 2.2%(-1.19)#119 | 2.1%(-1.16)#16,697 |
1
Common Questions
What are the Top Zip Codes with the Highest Percentage of Population Employed in Architecture & Engineering in Moscow, ID?
Top Zip Codes with the Highest Percentage of Population Employed in Architecture & Engineering in Moscow, ID are:
What zip code has the Highest Percentage of Population Employed in Architecture & Engineering in Moscow, ID?
83843 has the Highest Percentage of Population Employed in Architecture & Engineering in Moscow, ID with 2.5%.
What is the Percentage of Population Employed in Architecture & Engineering in Moscow, ID?
Percentage of Population Employed in Architecture & Engineering in Moscow is 2.2%.
What is the Percentage of Population Employed in Architecture & Engineering in Idaho?
Percentage of Population Employed in Architecture & Engineering in Idaho is 2.2%.
What is the Percentage of Population Employed in Architecture & Engineering in the United States?
Percentage of Population Employed in Architecture & Engineering in the United States is 2.1%.