Lava Hot Springs, ID
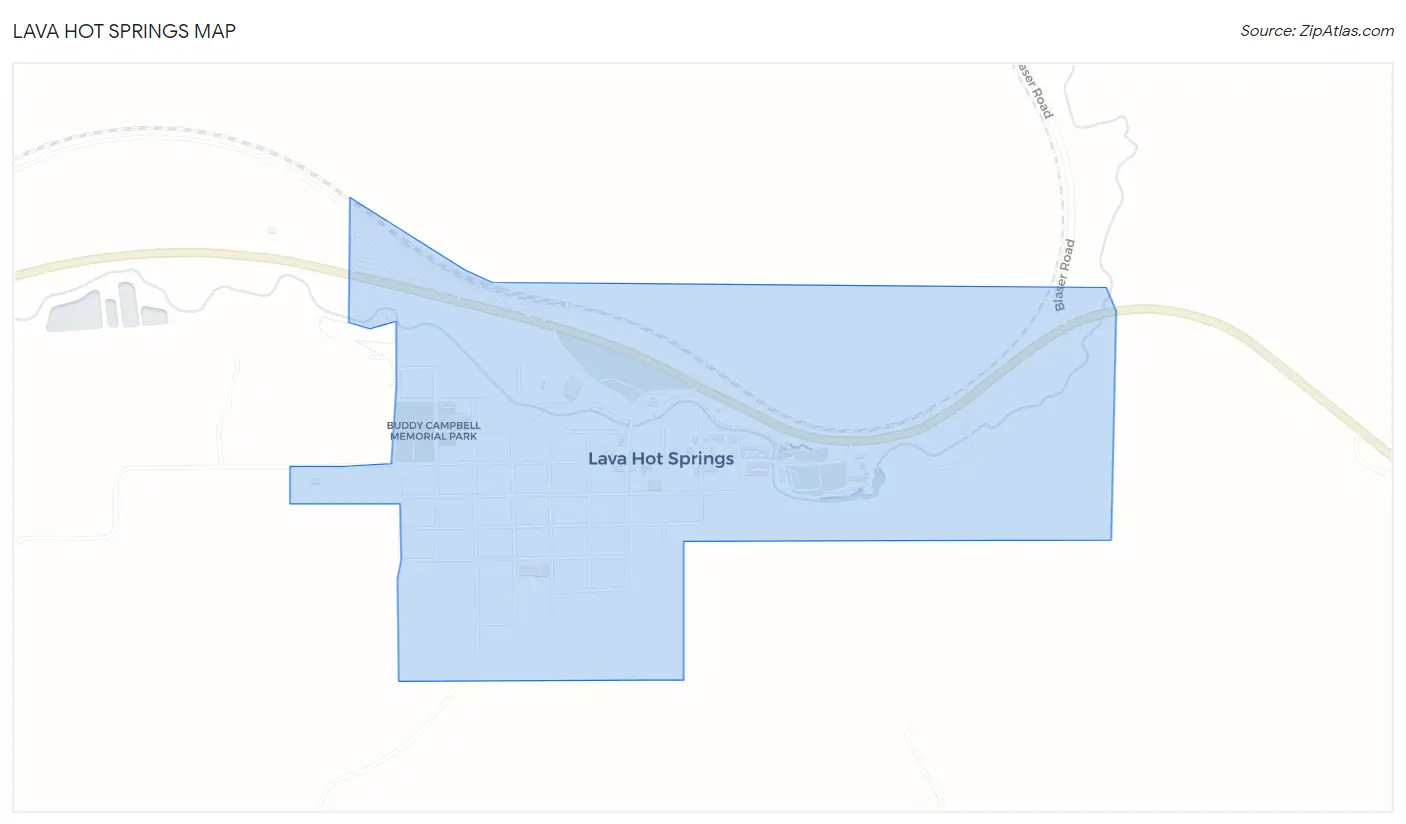
Lava Hot Springs Map
Lava Hot Springs Overview
293
TOTAL POPULATION
157
MALE POPULATION
136
FEMALE POPULATION
115.44
MALES / 100 FEMALES
86.62
FEMALES / 100 MALES
50.1
MEDIAN AGE
2.9
AVG FAMILY SIZE
2.1
AVG HOUSEHOLD SIZE
$30,726
PER CAPITA INCOME
$62,708
AVG FAMILY INCOME
$45,000
AVG HOUSEHOLD INCOME
0.41
INEQUALITY / GINI INDEX
173
LABOR FORCE [ PEOPLE ]
67.6%
PERCENT IN LABOR FORCE
6.9%
UNEMPLOYMENT RATE
Lava Hot Springs Zip Codes
Lava Hot Springs Area Codes
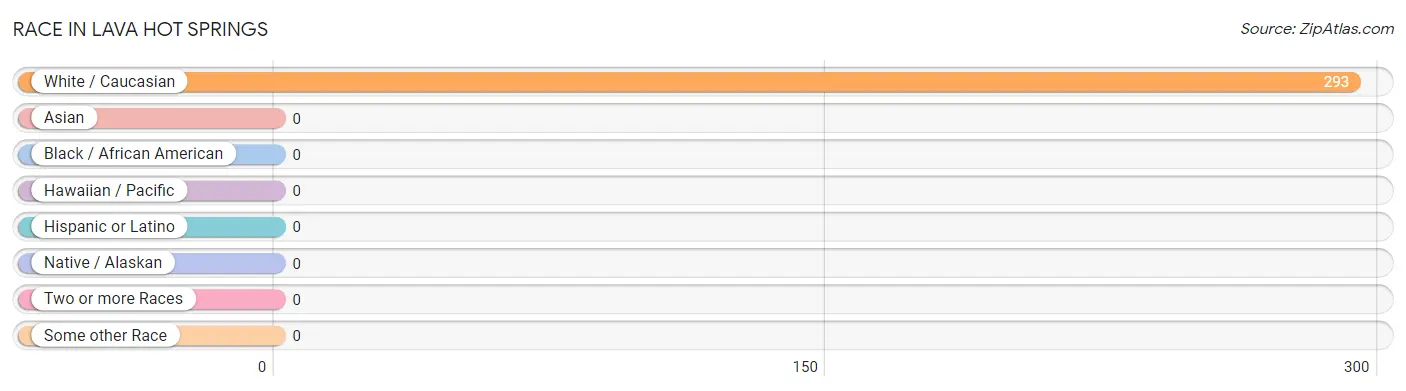
Race in Lava Hot Springs
The most populous races in Lava Hot Springs are , and White / Caucasian (293 | 100.0%).
| Race | # Population | % Population |
| Asian | 0 | 0.0% |
| Black / African American | 0 | 0.0% |
| Hawaiian / Pacific | 0 | 0.0% |
| Hispanic or Latino | 0 | 0.0% |
| Native / Alaskan | 0 | 0.0% |
| White / Caucasian | 293 | 100.0% |
| Two or more Races | 0 | 0.0% |
| Some other Race | 0 | 0.0% |
| Total | 293 | 100.0% |
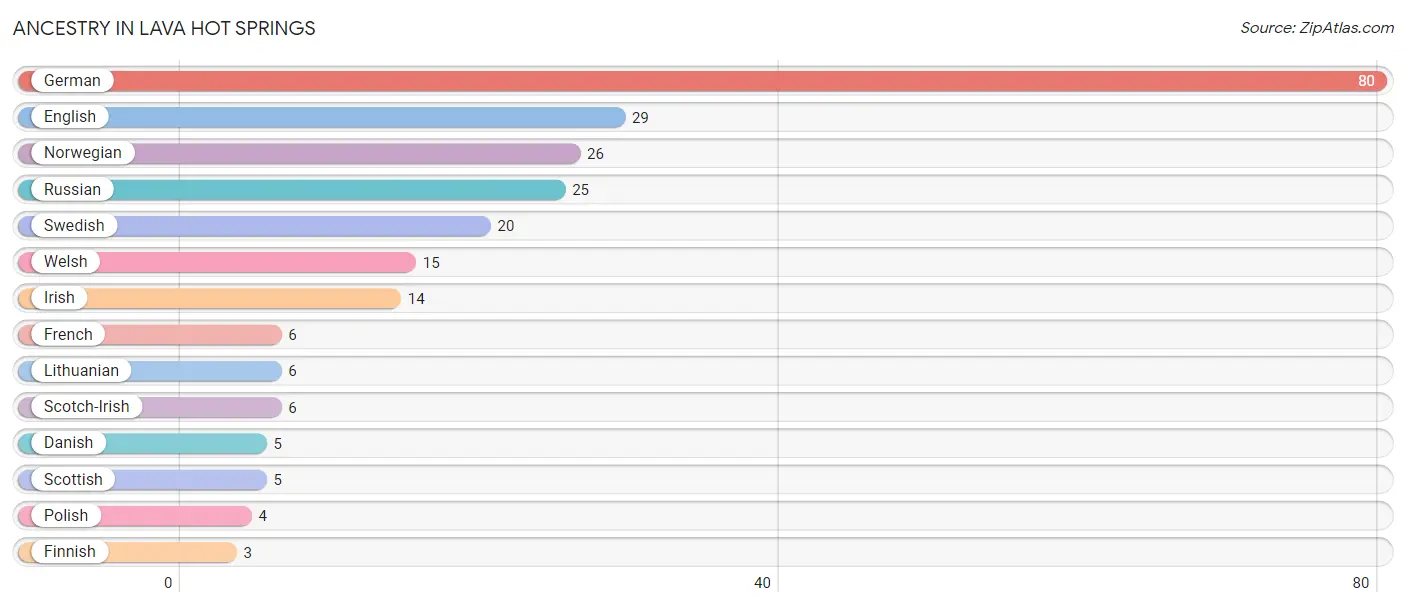
Ancestry in Lava Hot Springs
The most populous ancestries reported in Lava Hot Springs are German (80 | 27.3%), English (29 | 9.9%), Norwegian (26 | 8.9%), Russian (25 | 8.5%), and Swedish (20 | 6.8%), together accounting for 61.4% of all Lava Hot Springs residents.
| Ancestry | # Population | % Population |
| Danish | 5 | 1.7% |
| English | 29 | 9.9% |
| Finnish | 3 | 1.0% |
| French | 6 | 2.1% |
| German | 80 | 27.3% |
| Irish | 14 | 4.8% |
| Lithuanian | 6 | 2.1% |
| Norwegian | 26 | 8.9% |
| Polish | 4 | 1.4% |
| Russian | 25 | 8.5% |
| Scotch-Irish | 6 | 2.1% |
| Scottish | 5 | 1.7% |
| Swedish | 20 | 6.8% |
| Welsh | 15 | 5.1% | View All 14 Rows |
Immigrants in Lava Hot Springs

| Immigration Origin | # Population | % Population | View All 0 Rows |
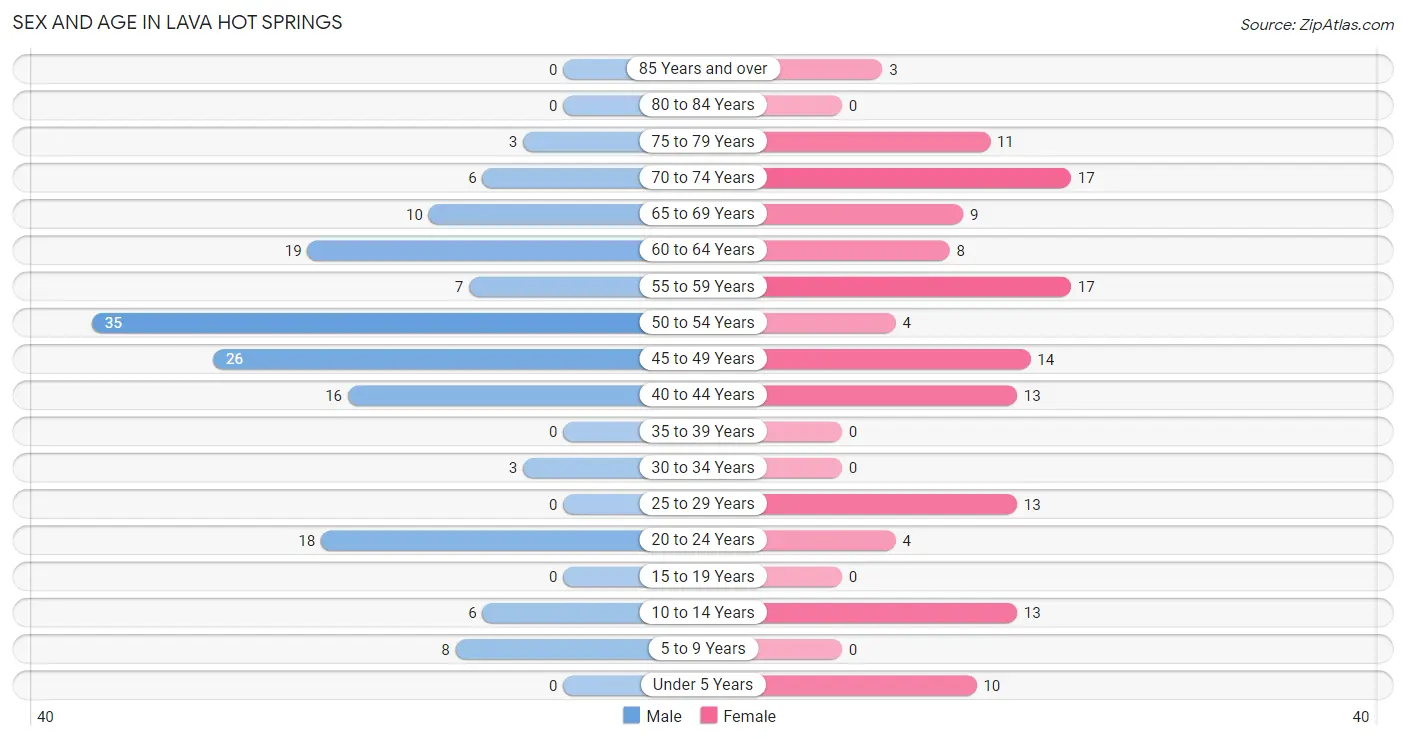
Sex and Age in Lava Hot Springs
Sex and Age in Lava Hot Springs
The most populous age groups in Lava Hot Springs are 50 to 54 Years (35 | 22.3%) for men and 55 to 59 Years (17 | 12.5%) for women.
| Age Bracket | Male | Female |
| Under 5 Years | 0 (0.0%) | 10 (7.3%) |
| 5 to 9 Years | 8 (5.1%) | 0 (0.0%) |
| 10 to 14 Years | 6 (3.8%) | 13 (9.6%) |
| 15 to 19 Years | 0 (0.0%) | 0 (0.0%) |
| 20 to 24 Years | 18 (11.5%) | 4 (2.9%) |
| 25 to 29 Years | 0 (0.0%) | 13 (9.6%) |
| 30 to 34 Years | 3 (1.9%) | 0 (0.0%) |
| 35 to 39 Years | 0 (0.0%) | 0 (0.0%) |
| 40 to 44 Years | 16 (10.2%) | 13 (9.6%) |
| 45 to 49 Years | 26 (16.6%) | 14 (10.3%) |
| 50 to 54 Years | 35 (22.3%) | 4 (2.9%) |
| 55 to 59 Years | 7 (4.5%) | 17 (12.5%) |
| 60 to 64 Years | 19 (12.1%) | 8 (5.9%) |
| 65 to 69 Years | 10 (6.4%) | 9 (6.6%) |
| 70 to 74 Years | 6 (3.8%) | 17 (12.5%) |
| 75 to 79 Years | 3 (1.9%) | 11 (8.1%) |
| 80 to 84 Years | 0 (0.0%) | 0 (0.0%) |
| 85 Years and over | 0 (0.0%) | 3 (2.2%) |
| Total | 157 (100.0%) | 136 (100.0%) |
Families and Households in Lava Hot Springs
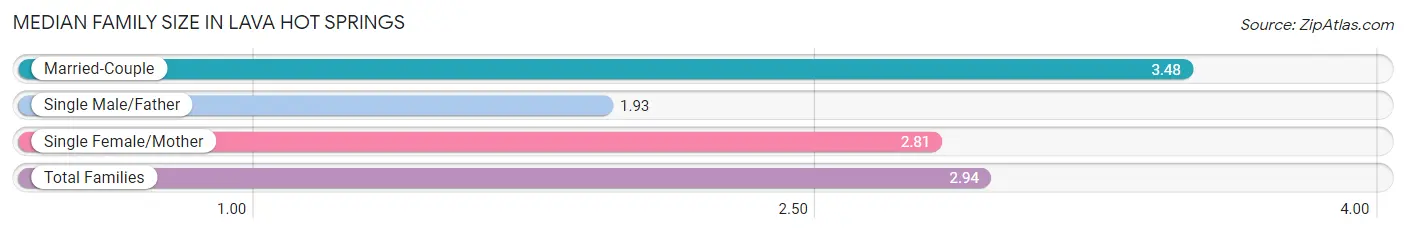
Median Family Size in Lava Hot Springs
The median family size in Lava Hot Springs is 2.94 persons per family, with married-couple families (33 | 47.8%) accounting for the largest median family size of 3.48 persons per family. On the other hand, single male/father families (15 | 21.7%) represent the smallest median family size with 1.93 persons per family.
| Family Type | # Families | Family Size |
| Married-Couple | 33 (47.8%) | 3.48 |
| Single Male/Father | 15 (21.7%) | 1.93 |
| Single Female/Mother | 21 (30.4%) | 2.81 |
| Total Families | 69 (100.0%) | 2.94 |
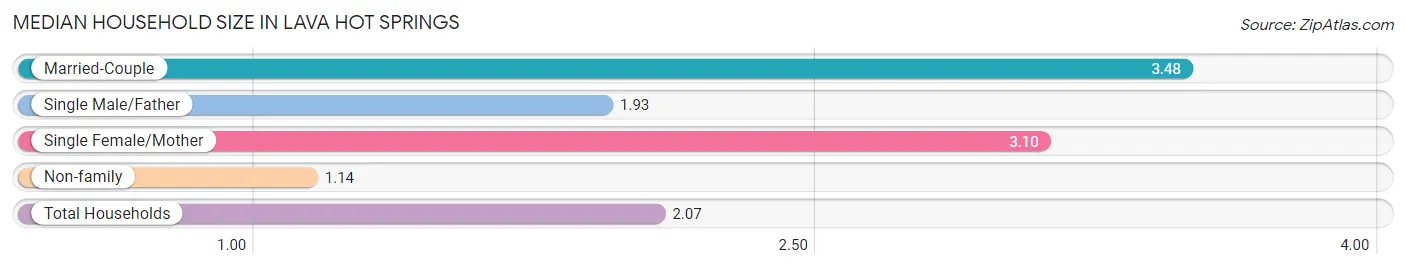
Median Household Size in Lava Hot Springs
The median household size in Lava Hot Springs is 2.07 persons per household, with married-couple households (33 | 23.6%) accounting for the largest median household size of 3.48 persons per household. non-family households (71 | 50.7%) represent the smallest median household size with 1.14 persons per household.
| Household Type | # Households | Household Size |
| Married-Couple | 33 (23.6%) | 3.48 |
| Single Male/Father | 15 (10.7%) | 1.93 |
| Single Female/Mother | 21 (15.0%) | 3.10 |
| Non-family | 71 (50.7%) | 1.14 |
| Total Households | 140 (100.0%) | 2.07 |
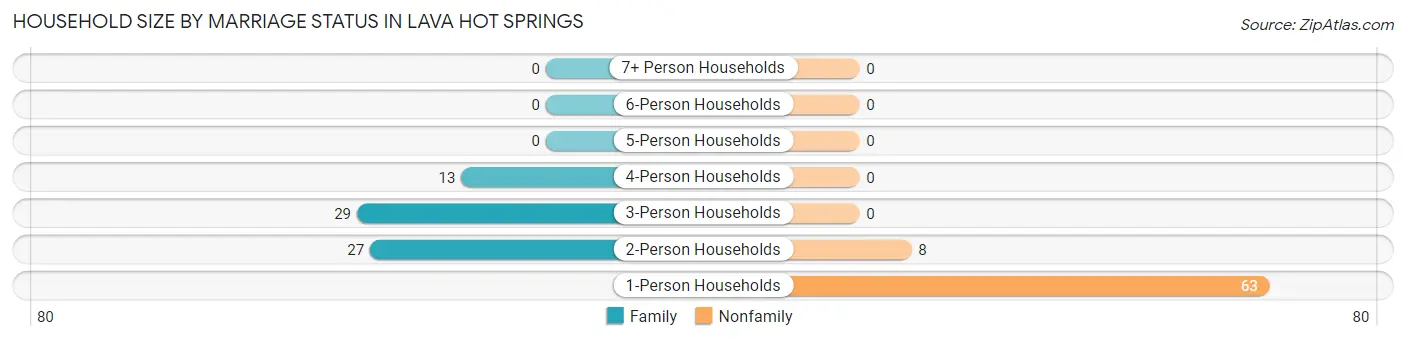
Household Size by Marriage Status in Lava Hot Springs
Out of a total of 140 households in Lava Hot Springs, 69 (49.3%) are family households, while 71 (50.7%) are nonfamily households. The most numerous type of family households are 3-person households, comprising 29, and the most common type of nonfamily households are 1-person households, comprising 63.
| Household Size | Family Households | Nonfamily Households |
| 1-Person Households | - | 63 (45.0%) |
| 2-Person Households | 27 (19.3%) | 8 (5.7%) |
| 3-Person Households | 29 (20.7%) | 0 (0.0%) |
| 4-Person Households | 13 (9.3%) | 0 (0.0%) |
| 5-Person Households | 0 (0.0%) | 0 (0.0%) |
| 6-Person Households | 0 (0.0%) | 0 (0.0%) |
| 7+ Person Households | 0 (0.0%) | 0 (0.0%) |
| Total | 69 (49.3%) | 71 (50.7%) |
Female Fertility in Lava Hot Springs
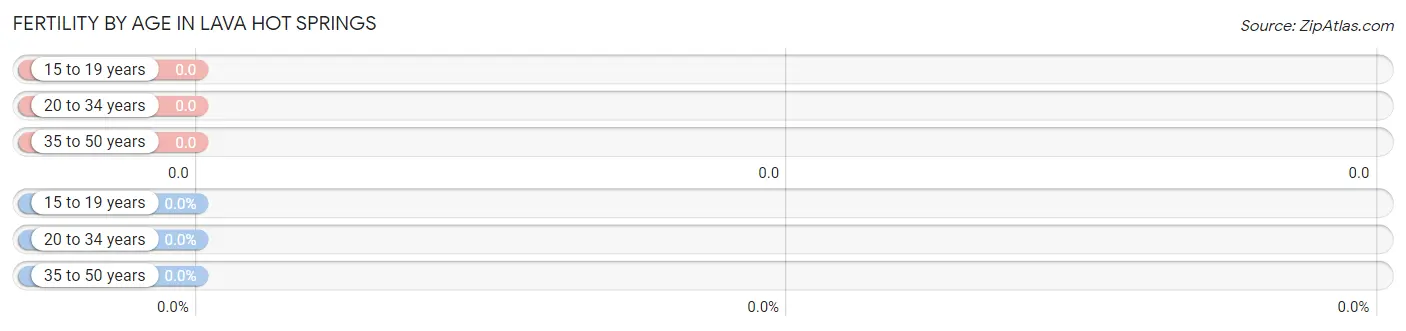
Fertility by Age in Lava Hot Springs
| Age Bracket | Women with Births | Births / 1,000 Women |
| 15 to 19 years | 0 (0.0%) | 0.0 |
| 20 to 34 years | 0 (0.0%) | 0.0 |
| 35 to 50 years | 0 (0.0%) | 0.0 |
| Total | 0 (0.0%) | 0.0 |
Fertility by Age by Marriage Status in Lava Hot Springs
| Age Bracket | Married | Unmarried |
| 15 to 19 years | 0 (0.0%) | 0 (0.0%) |
| 20 to 34 years | 0 (0.0%) | 0 (0.0%) |
| 35 to 50 years | 0 (0.0%) | 0 (0.0%) |
| Total | 0 (0.0%) | 0 (0.0%) |
Fertility by Education in Lava Hot Springs
| Educational Attainment | Women with Births | Births / 1,000 Women |
| Less than High School | 0 (0.0%) | 0.0 |
| High School Diploma | 0 (0.0%) | 0.0 |
| College or Associate's Degree | 0 (0.0%) | 0.0 |
| Bachelor's Degree | 0 (0.0%) | 0.0 |
| Graduate Degree | 0 (0.0%) | 0.0 |
| Total | 0 (0.0%) | 0.0 |
Fertility by Education by Marriage Status in Lava Hot Springs
| Educational Attainment | Married | Unmarried |
| Less than High School | 0 (0.0%) | 0 (0.0%) |
| High School Diploma | 0 (0.0%) | 0 (0.0%) |
| College or Associate's Degree | 0 (0.0%) | 0 (0.0%) |
| Bachelor's Degree | 0 (0.0%) | 0 (0.0%) |
| Graduate Degree | 0 (0.0%) | 0 (0.0%) |
| Total | 0 (0.0%) | 0 (0.0%) |
Income in Lava Hot Springs
Income Overview in Lava Hot Springs
Per Capita Income in Lava Hot Springs is $30,726, while median incomes of families and households are $62,708 and $45,000 respectively.
| Characteristic | Number | Measure |
| Per Capita Income | 293 | $30,726 |
| Median Family Income | 69 | $62,708 |
| Mean Family Income | 69 | $75,384 |
| Median Household Income | 140 | $45,000 |
| Mean Household Income | 140 | $57,074 |
| Income Deficit | 69 | $0 |
| Wage / Income Gap (%) | 293 | 0.00% |
| Wage / Income Gap ($) | 293 | 100.00¢ per $1 |
| Gini / Inequality Index | 293 | 0.41 |
Earnings by Sex in Lava Hot Springs
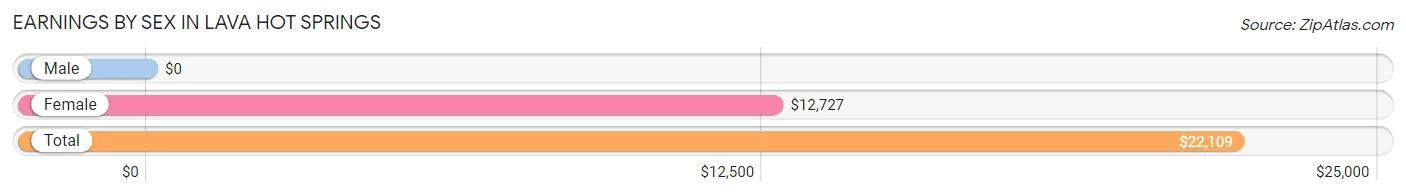
| Sex | Number | Average Earnings |
| Male | 105 (58.7%) | $0 |
| Female | 74 (41.3%) | $12,727 |
| Total | 179 (100.0%) | $22,109 |
Earnings by Sex by Income Bracket in Lava Hot Springs
The most common earnings brackets in Lava Hot Springs are $75,000 to $99,999 for men (20 | 19.1%) and $2,499 or less for women (13 | 17.6%).
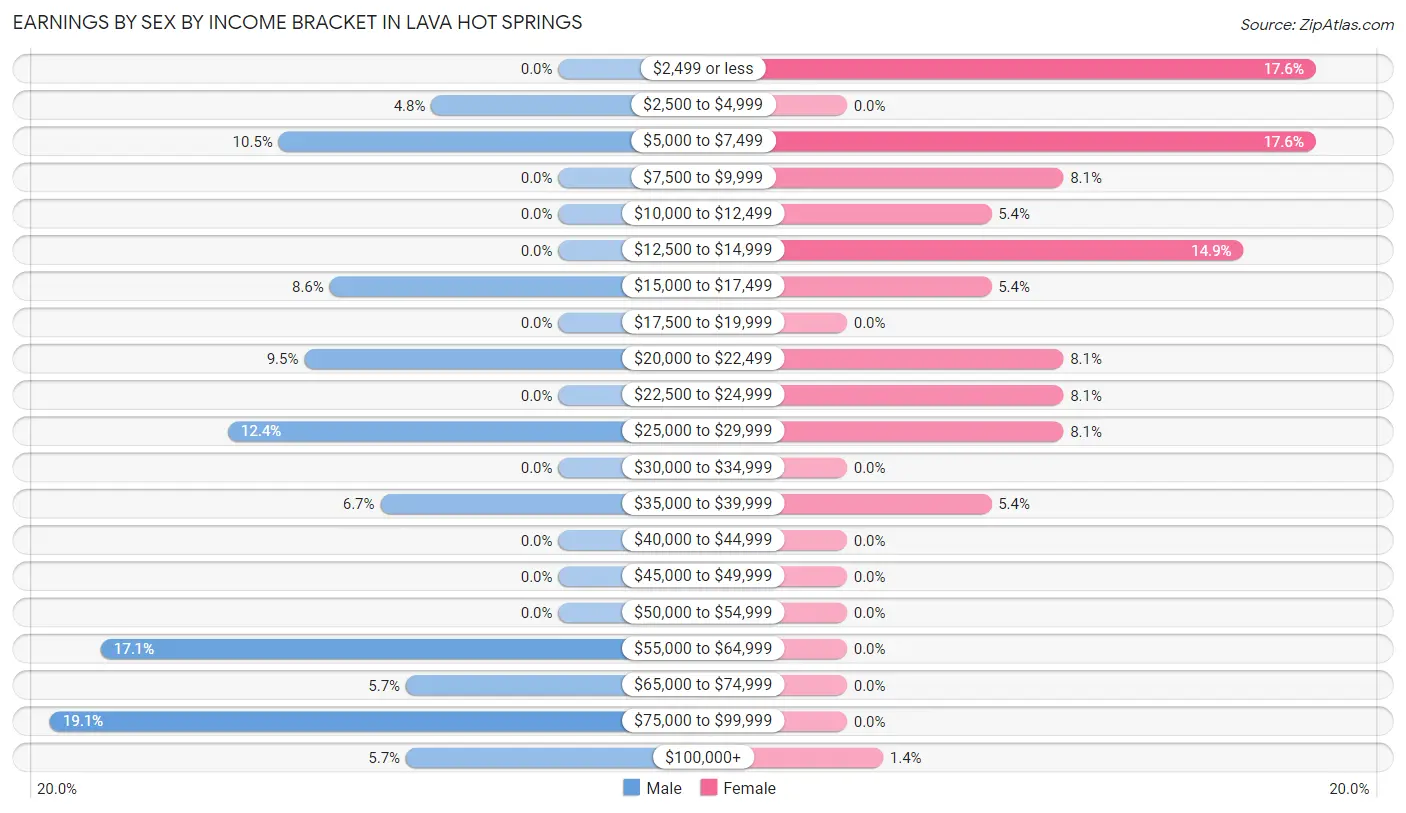
| Income | Male | Female |
| $2,499 or less | 0 (0.0%) | 13 (17.6%) |
| $2,500 to $4,999 | 5 (4.8%) | 0 (0.0%) |
| $5,000 to $7,499 | 11 (10.5%) | 13 (17.6%) |
| $7,500 to $9,999 | 0 (0.0%) | 6 (8.1%) |
| $10,000 to $12,499 | 0 (0.0%) | 4 (5.4%) |
| $12,500 to $14,999 | 0 (0.0%) | 11 (14.9%) |
| $15,000 to $17,499 | 9 (8.6%) | 4 (5.4%) |
| $17,500 to $19,999 | 0 (0.0%) | 0 (0.0%) |
| $20,000 to $22,499 | 10 (9.5%) | 6 (8.1%) |
| $22,500 to $24,999 | 0 (0.0%) | 6 (8.1%) |
| $25,000 to $29,999 | 13 (12.4%) | 6 (8.1%) |
| $30,000 to $34,999 | 0 (0.0%) | 0 (0.0%) |
| $35,000 to $39,999 | 7 (6.7%) | 4 (5.4%) |
| $40,000 to $44,999 | 0 (0.0%) | 0 (0.0%) |
| $45,000 to $49,999 | 0 (0.0%) | 0 (0.0%) |
| $50,000 to $54,999 | 0 (0.0%) | 0 (0.0%) |
| $55,000 to $64,999 | 18 (17.1%) | 0 (0.0%) |
| $65,000 to $74,999 | 6 (5.7%) | 0 (0.0%) |
| $75,000 to $99,999 | 20 (19.1%) | 0 (0.0%) |
| $100,000+ | 6 (5.7%) | 1 (1.3%) |
| Total | 105 (100.0%) | 74 (100.0%) |
Earnings by Sex by Educational Attainment in Lava Hot Springs
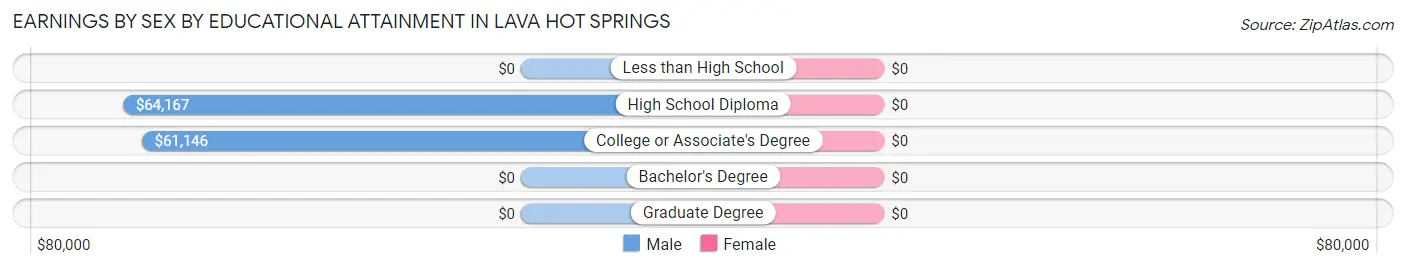
| Educational Attainment | Male Income | Female Income |
| Less than High School | - | - |
| High School Diploma | $64,167 | $0 |
| College or Associate's Degree | $61,146 | $0 |
| Bachelor's Degree | - | - |
| Graduate Degree | - | - |
| Total | $61,354 | $11,875 |
Family Income in Lava Hot Springs
Family Income Brackets in Lava Hot Springs
According to the Lava Hot Springs family income data, there are 19 families falling into the $50,000 to $74,999 income range, which is the most common income bracket and makes up 27.5% of all families.
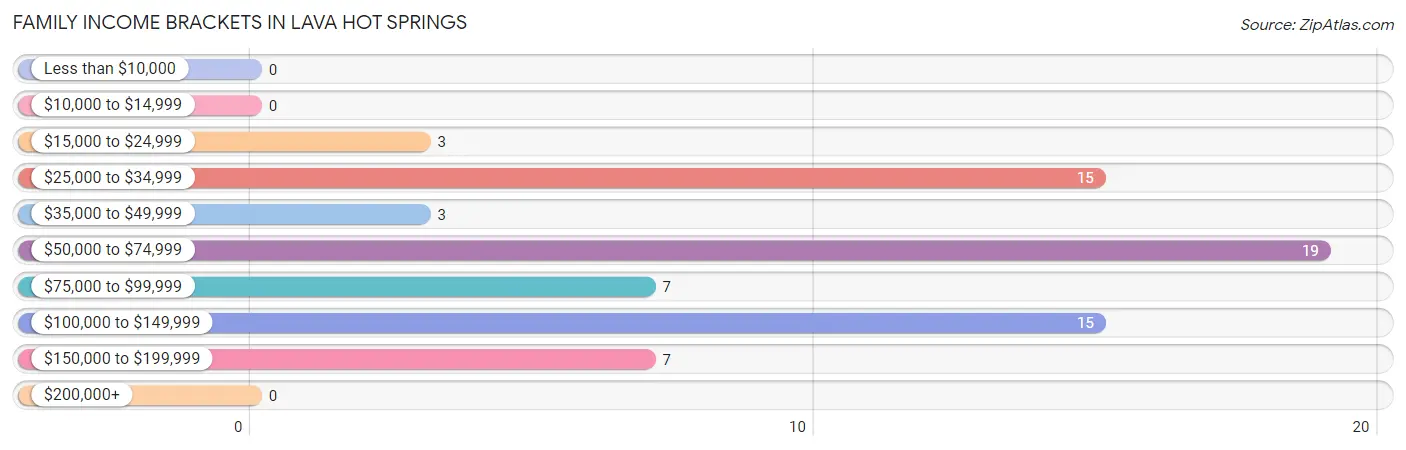
| Income Bracket | # Families | % Families |
| Less than $10,000 | 0 | 0.0% |
| $10,000 to $14,999 | 0 | 0.0% |
| $15,000 to $24,999 | 3 | 4.3% |
| $25,000 to $34,999 | 15 | 21.7% |
| $35,000 to $49,999 | 3 | 4.3% |
| $50,000 to $74,999 | 19 | 27.5% |
| $75,000 to $99,999 | 7 | 10.1% |
| $100,000 to $149,999 | 15 | 21.7% |
| $150,000 to $199,999 | 7 | 10.1% |
| $200,000+ | 0 | 0.0% |
Family Income by Famaliy Size in Lava Hot Springs
| Income Bracket | # Families | Median Income |
| 2-Person Families | 27 (39.1%) | $0 |
| 3-Person Families | 35 (50.7%) | $0 |
| 4-Person Families | 7 (10.1%) | $0 |
| 5-Person Families | 0 (0.0%) | $0 |
| 6-Person Families | 0 (0.0%) | $0 |
| 7+ Person Families | 0 (0.0%) | $0 |
| Total | 69 (100.0%) | $62,708 |
Family Income by Number of Earners in Lava Hot Springs
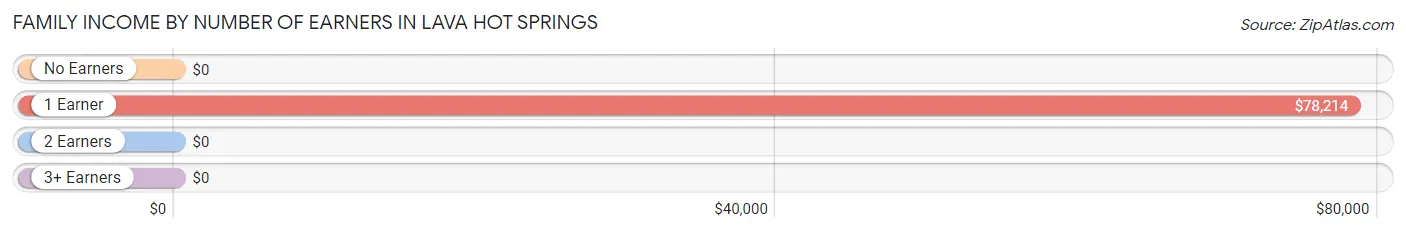
| Number of Earners | # Families | Median Income |
| No Earners | 3 (4.3%) | $0 |
| 1 Earner | 28 (40.6%) | $78,214 |
| 2 Earners | 24 (34.8%) | $0 |
| 3+ Earners | 14 (20.3%) | $0 |
| Total | 69 (100.0%) | $62,708 |
Household Income in Lava Hot Springs
Household Income Brackets in Lava Hot Springs
With 33 households falling in the category, the $15,000 to $24,999 income range is the most frequent in Lava Hot Springs, accounting for 23.6% of all households.
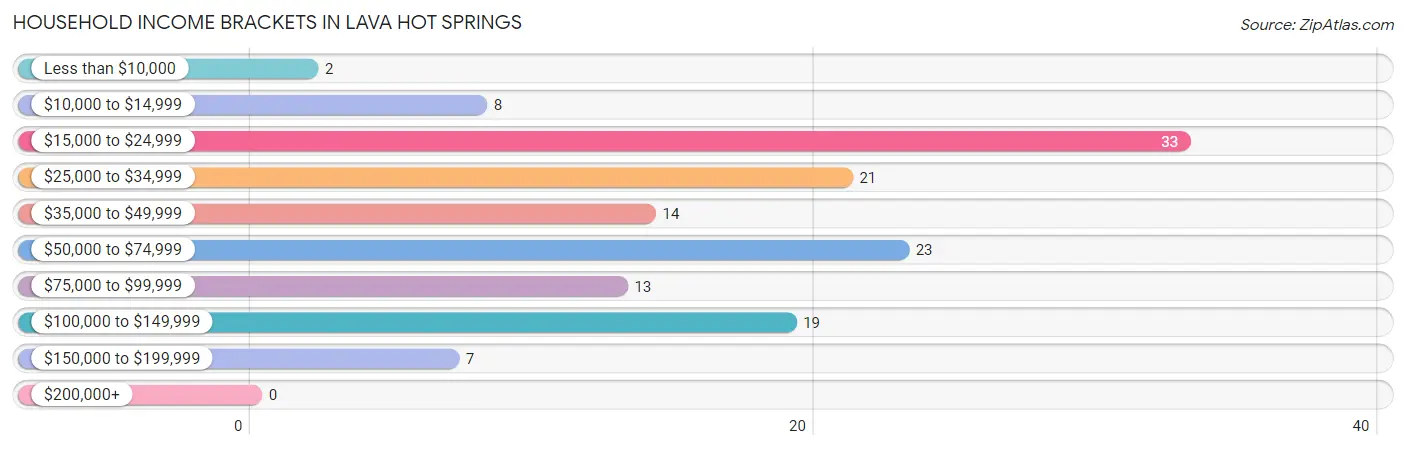
| Income Bracket | # Households | % Households |
| Less than $10,000 | 2 | 1.4% |
| $10,000 to $14,999 | 8 | 5.7% |
| $15,000 to $24,999 | 33 | 23.6% |
| $25,000 to $34,999 | 21 | 15.0% |
| $35,000 to $49,999 | 14 | 10.0% |
| $50,000 to $74,999 | 23 | 16.4% |
| $75,000 to $99,999 | 13 | 9.3% |
| $100,000 to $149,999 | 19 | 13.6% |
| $150,000 to $199,999 | 7 | 5.0% |
| $200,000+ | 0 | 0.0% |
Household Income by Householder Age in Lava Hot Springs
The median household income in Lava Hot Springs is $45,000, with the highest median household income of $53,269 found in the 45 to 64 years age bracket for the primary householder. A total of 58 households (41.4%) fall into this category. Meanwhile, the 15 to 24 years age bracket for the primary householder has the lowest median household income of $0, with 4 households (2.9%) in this group.
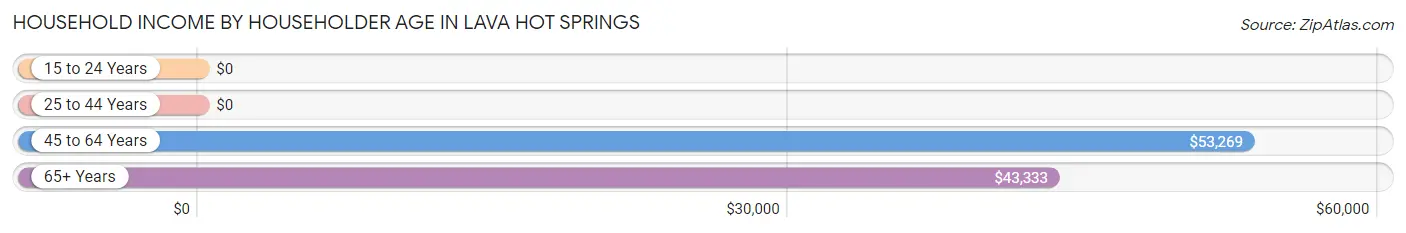
| Income Bracket | # Households | Median Income |
| 15 to 24 Years | 4 (2.9%) | $0 |
| 25 to 44 Years | 28 (20.0%) | $0 |
| 45 to 64 Years | 58 (41.4%) | $53,269 |
| 65+ Years | 50 (35.7%) | $43,333 |
| Total | 140 (100.0%) | $45,000 |
Poverty in Lava Hot Springs
Income Below Poverty by Sex and Age in Lava Hot Springs
With 10.8% poverty level for males and 4.5% for females among the residents of Lava Hot Springs, 25 to 34 year old males and 45 to 54 year old females are the most vulnerable to poverty, with 3 males (100.0%) and 4 females (22.2%) in their respective age groups living below the poverty level.
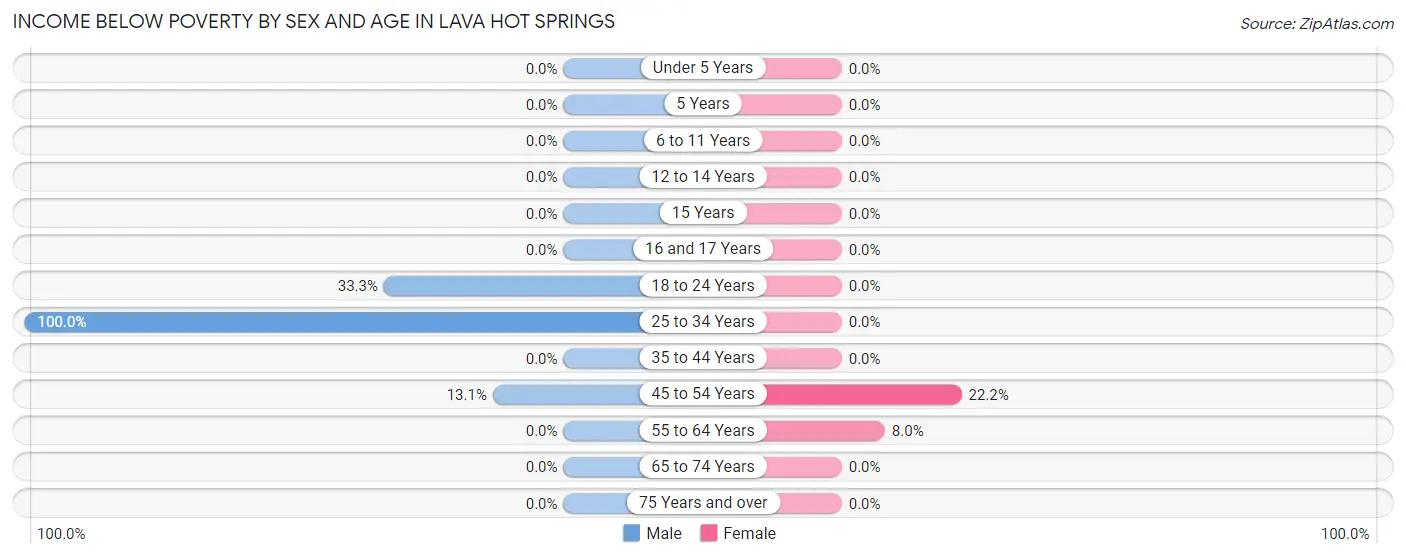
| Age Bracket | Male | Female |
| Under 5 Years | 0 (0.0%) | 0 (0.0%) |
| 5 Years | 0 (0.0%) | 0 (0.0%) |
| 6 to 11 Years | 0 (0.0%) | 0 (0.0%) |
| 12 to 14 Years | 0 (0.0%) | 0 (0.0%) |
| 15 Years | 0 (0.0%) | 0 (0.0%) |
| 16 and 17 Years | 0 (0.0%) | 0 (0.0%) |
| 18 to 24 Years | 6 (33.3%) | 0 (0.0%) |
| 25 to 34 Years | 3 (100.0%) | 0 (0.0%) |
| 35 to 44 Years | 0 (0.0%) | 0 (0.0%) |
| 45 to 54 Years | 8 (13.1%) | 4 (22.2%) |
| 55 to 64 Years | 0 (0.0%) | 2 (8.0%) |
| 65 to 74 Years | 0 (0.0%) | 0 (0.0%) |
| 75 Years and over | 0 (0.0%) | 0 (0.0%) |
| Total | 17 (10.8%) | 6 (4.5%) |
Income Above Poverty by Sex and Age in Lava Hot Springs
According to the poverty statistics in Lava Hot Springs, males aged 6 to 11 years and females aged under 5 years are the age groups that are most secure financially, with 100.0% of males and 100.0% of females in these age groups living above the poverty line.
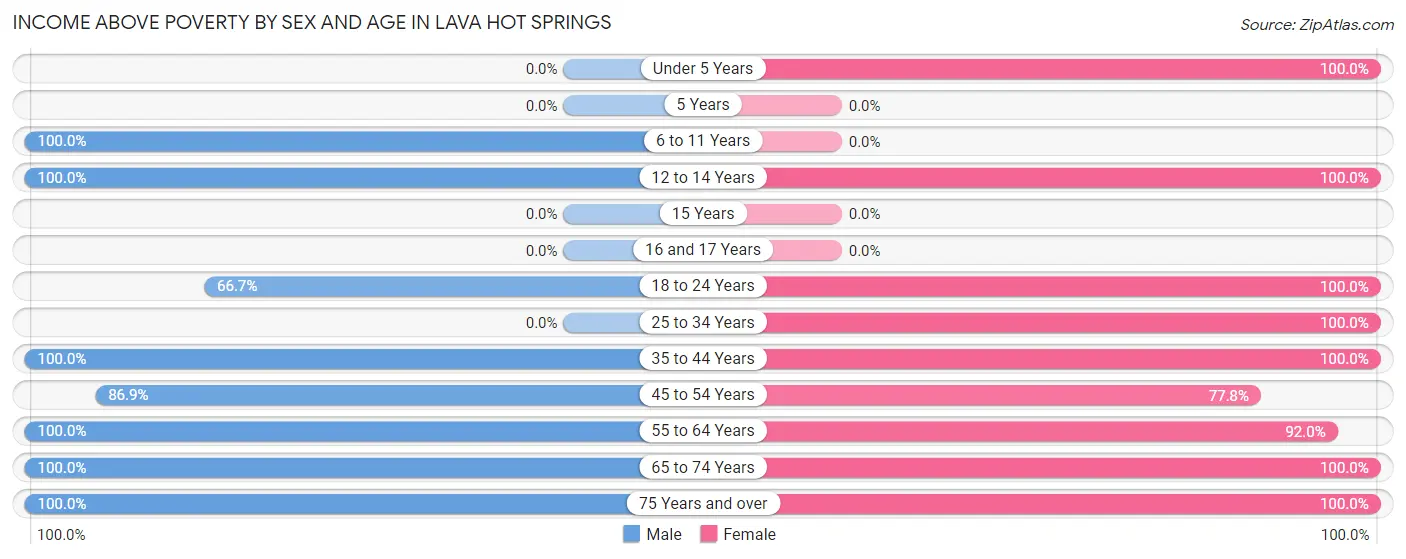
| Age Bracket | Male | Female |
| Under 5 Years | 0 (0.0%) | 10 (100.0%) |
| 5 Years | 0 (0.0%) | 0 (0.0%) |
| 6 to 11 Years | 8 (100.0%) | 0 (0.0%) |
| 12 to 14 Years | 6 (100.0%) | 13 (100.0%) |
| 15 Years | 0 (0.0%) | 0 (0.0%) |
| 16 and 17 Years | 0 (0.0%) | 0 (0.0%) |
| 18 to 24 Years | 12 (66.7%) | 4 (100.0%) |
| 25 to 34 Years | 0 (0.0%) | 13 (100.0%) |
| 35 to 44 Years | 16 (100.0%) | 13 (100.0%) |
| 45 to 54 Years | 53 (86.9%) | 14 (77.8%) |
| 55 to 64 Years | 26 (100.0%) | 23 (92.0%) |
| 65 to 74 Years | 16 (100.0%) | 26 (100.0%) |
| 75 Years and over | 3 (100.0%) | 11 (100.0%) |
| Total | 140 (89.2%) | 127 (95.5%) |
Income Below Poverty Among Married-Couple Families in Lava Hot Springs
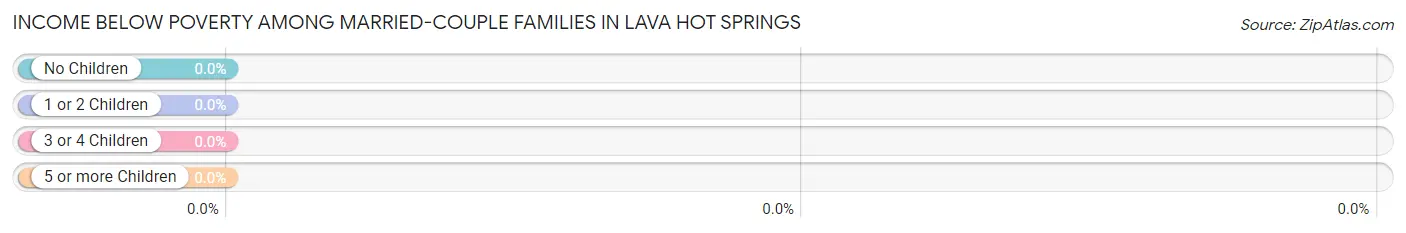
| Children | Above Poverty | Below Poverty |
| No Children | 26 (100.0%) | 0 (0.0%) |
| 1 or 2 Children | 7 (100.0%) | 0 (0.0%) |
| 3 or 4 Children | 0 (0.0%) | 0 (0.0%) |
| 5 or more Children | 0 (0.0%) | 0 (0.0%) |
| Total | 33 (100.0%) | 0 (0.0%) |
Income Below Poverty Among Single-Parent Households in Lava Hot Springs
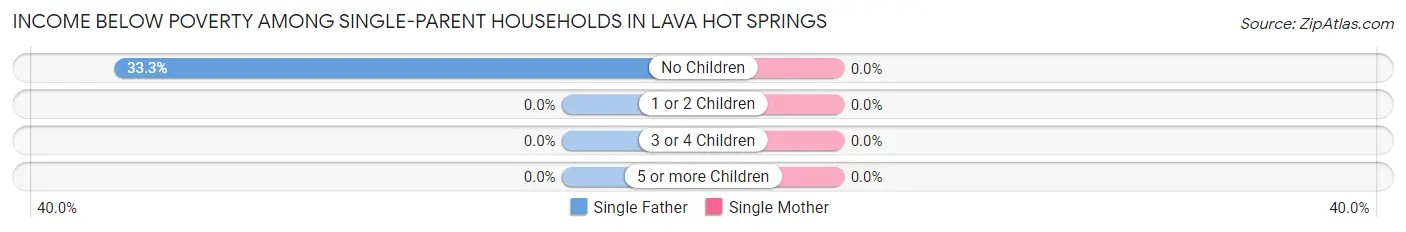
| Children | Single Father | Single Mother |
| No Children | 3 (33.3%) | 0 (0.0%) |
| 1 or 2 Children | 0 (0.0%) | 0 (0.0%) |
| 3 or 4 Children | 0 (0.0%) | 0 (0.0%) |
| 5 or more Children | 0 (0.0%) | 0 (0.0%) |
| Total | 3 (20.0%) | 0 (0.0%) |
Income Below Poverty Among Married-Couple vs Single-Parent Households in Lava Hot Springs
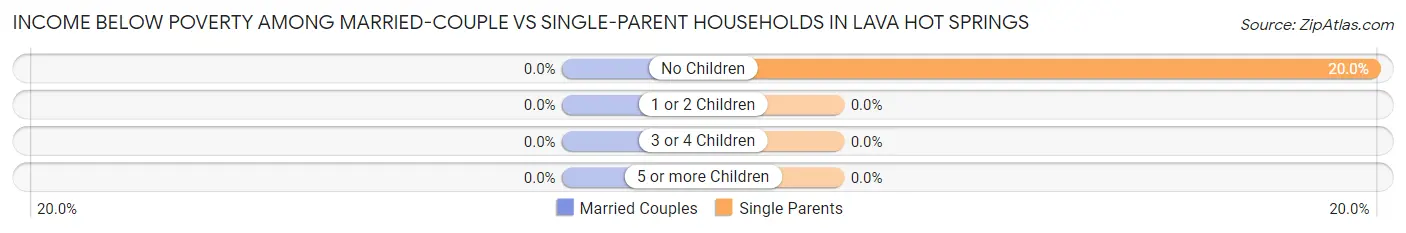
| Children | Married-Couple Families | Single-Parent Households |
| No Children | 0 (0.0%) | 3 (20.0%) |
| 1 or 2 Children | 0 (0.0%) | 0 (0.0%) |
| 3 or 4 Children | 0 (0.0%) | 0 (0.0%) |
| 5 or more Children | 0 (0.0%) | 0 (0.0%) |
| Total | 0 (0.0%) | 3 (8.3%) |
Employment Characteristics in Lava Hot Springs
Employment by Class of Employer in Lava Hot Springs
Among the 157 employed individuals in Lava Hot Springs, private company employees (100 | 63.7%), self-employed (incorporated) (27 | 17.2%), and not-for-profit organizations (13 | 8.3%) make up the most common classes of employment.
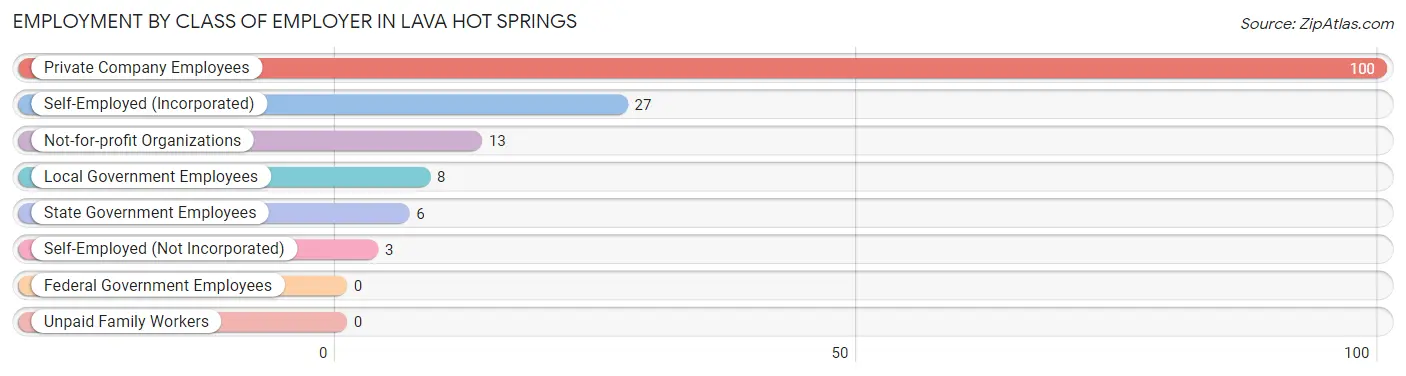
| Employer Class | # Employees | % Employees |
| Private Company Employees | 100 | 63.7% |
| Self-Employed (Incorporated) | 27 | 17.2% |
| Self-Employed (Not Incorporated) | 3 | 1.9% |
| Not-for-profit Organizations | 13 | 8.3% |
| Local Government Employees | 8 | 5.1% |
| State Government Employees | 6 | 3.8% |
| Federal Government Employees | 0 | 0.0% |
| Unpaid Family Workers | 0 | 0.0% |
| Total | 157 | 100.0% |
Employment Status by Age in Lava Hot Springs
According to the labor force statistics for Lava Hot Springs, out of the total population over 16 years of age (256), 67.6% or 173 individuals are in the labor force, with 6.9% or 12 of them unemployed. The age group with the highest labor force participation rate is 20 to 24 years, with 100.0% or 22 individuals in the labor force. Within the labor force, the 20 to 24 years age range has the highest percentage of unemployed individuals, with 27.3% or 6 of them being unemployed.
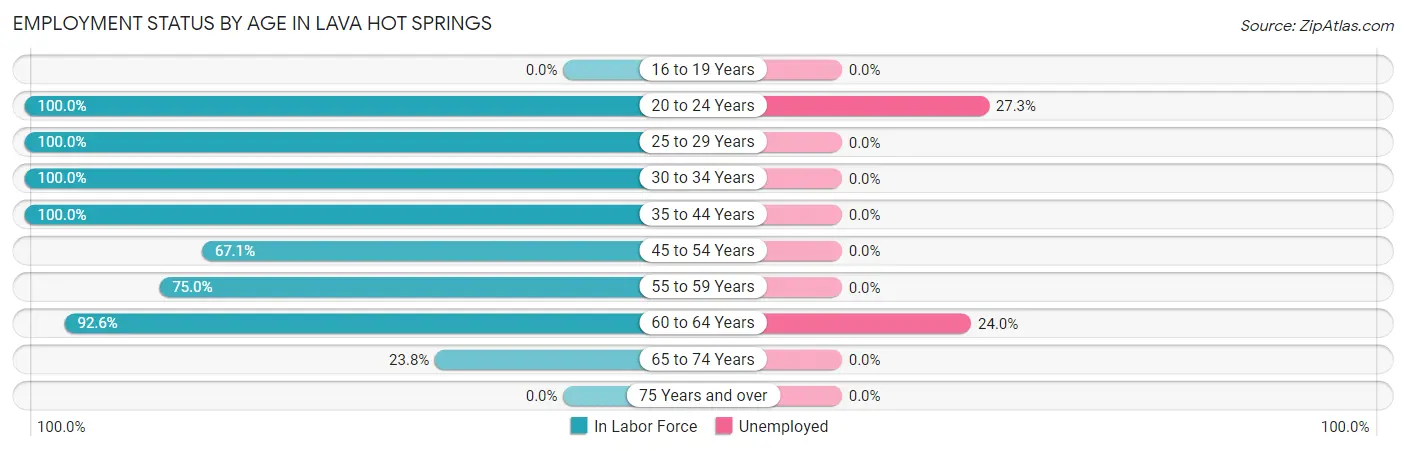
| Age Bracket | In Labor Force | Unemployed |
| 16 to 19 Years | 0 (0.0%) | 0 (0.0%) |
| 20 to 24 Years | 22 (100.0%) | 6 (27.3%) |
| 25 to 29 Years | 13 (100.0%) | 0 (0.0%) |
| 30 to 34 Years | 3 (100.0%) | 0 (0.0%) |
| 35 to 44 Years | 29 (100.0%) | 0 (0.0%) |
| 45 to 54 Years | 53 (67.1%) | 0 (0.0%) |
| 55 to 59 Years | 18 (75.0%) | 0 (0.0%) |
| 60 to 64 Years | 25 (92.6%) | 6 (24.0%) |
| 65 to 74 Years | 10 (23.8%) | 0 (0.0%) |
| 75 Years and over | 0 (0.0%) | 0 (0.0%) |
| Total | 173 (67.6%) | 12 (6.9%) |
Employment Status by Educational Attainment in Lava Hot Springs
According to labor force statistics for Lava Hot Springs, 80.6% of individuals (141) out of the total population between 25 and 64 years of age (175) are in the labor force, with 4.3% or 6 of them being unemployed. The group with the highest labor force participation rate are those with the educational attainment of bachelor's degree or higher, with 100.0% or 42 individuals in the labor force. Within the labor force, individuals with high school diploma education have the highest percentage of unemployment, with 8.8% or 6 of them being unemployed.
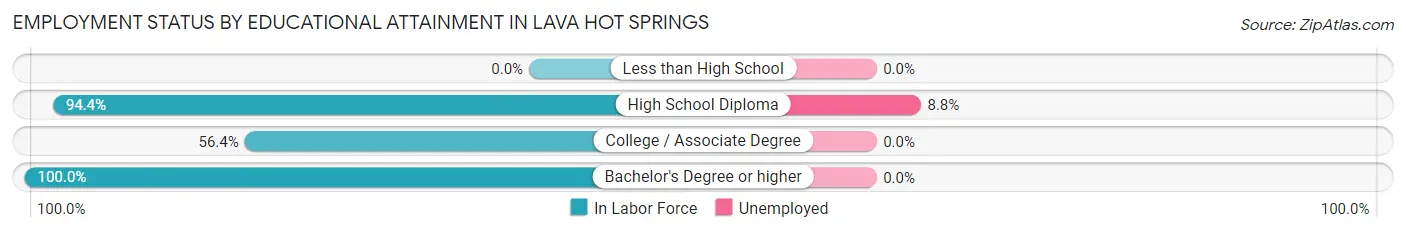
| Educational Attainment | In Labor Force | Unemployed |
| Less than High School | 0 (0.0%) | 0 (0.0%) |
| High School Diploma | 68 (94.4%) | 6 (8.8%) |
| College / Associate Degree | 31 (56.4%) | 0 (0.0%) |
| Bachelor's Degree or higher | 42 (100.0%) | 0 (0.0%) |
| Total | 141 (80.6%) | 8 (4.3%) |
Employment Occupations by Sex in Lava Hot Springs
Management, Business, Science and Arts Occupations
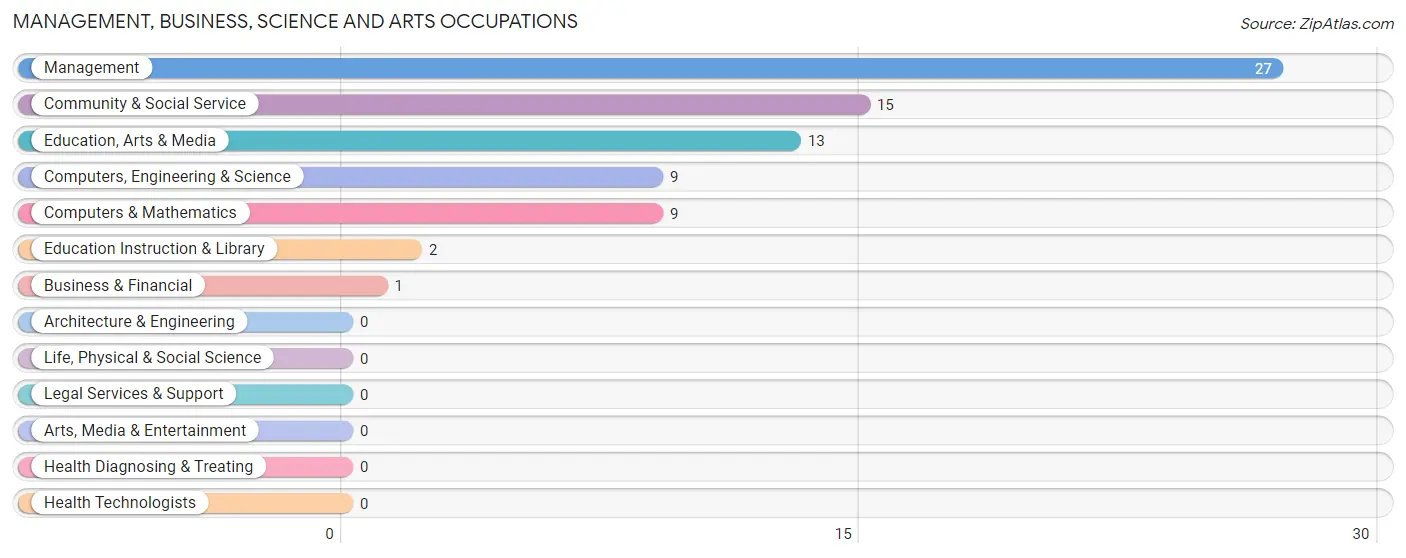
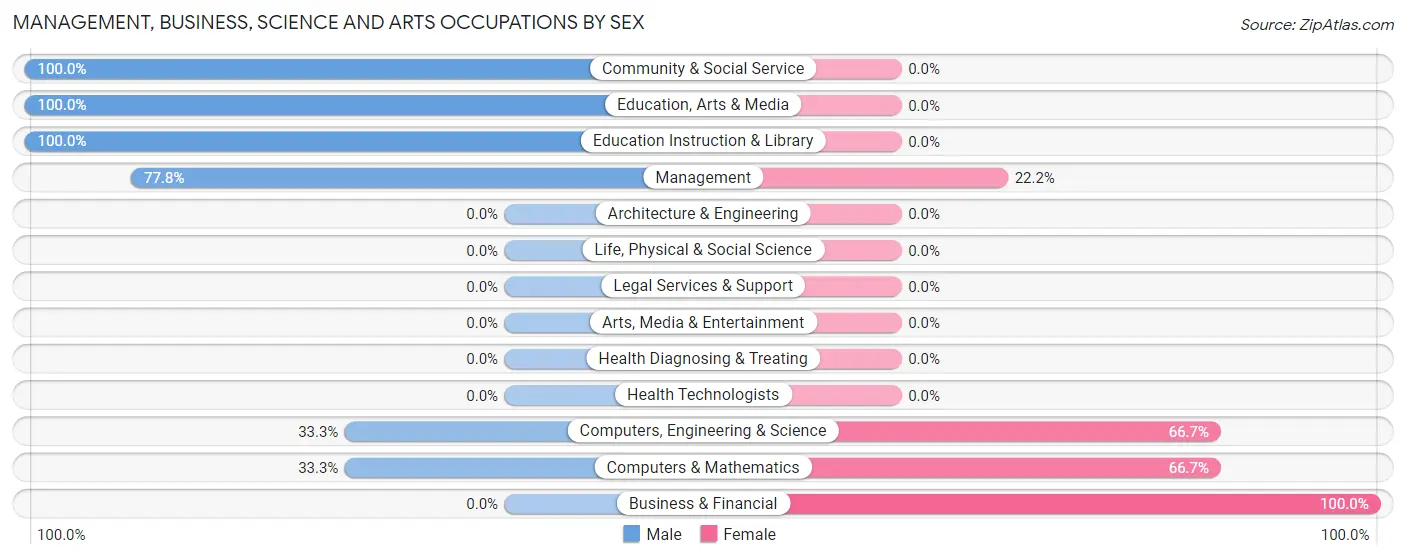
The most common Management, Business, Science and Arts occupations in Lava Hot Springs are Management (27 | 16.8%), Community & Social Service (15 | 9.3%), Education, Arts & Media (13 | 8.1%), Computers, Engineering & Science (9 | 5.6%), and Computers & Mathematics (9 | 5.6%).
Management, Business, Science and Arts Occupations by Sex
Within the Management, Business, Science and Arts occupations in Lava Hot Springs, the most male-oriented occupations are Community & Social Service (100.0%), Education, Arts & Media (100.0%), and Education Instruction & Library (100.0%), while the most female-oriented occupations are Business & Financial (100.0%), Computers, Engineering & Science (66.7%), and Computers & Mathematics (66.7%).
| Occupation | Male | Female |
| Management | 21 (77.8%) | 6 (22.2%) |
| Business & Financial | 0 (0.0%) | 1 (100.0%) |
| Computers, Engineering & Science | 3 (33.3%) | 6 (66.7%) |
| Computers & Mathematics | 3 (33.3%) | 6 (66.7%) |
| Architecture & Engineering | 0 (0.0%) | 0 (0.0%) |
| Life, Physical & Social Science | 0 (0.0%) | 0 (0.0%) |
| Community & Social Service | 15 (100.0%) | 0 (0.0%) |
| Education, Arts & Media | 13 (100.0%) | 0 (0.0%) |
| Legal Services & Support | 0 (0.0%) | 0 (0.0%) |
| Education Instruction & Library | 2 (100.0%) | 0 (0.0%) |
| Arts, Media & Entertainment | 0 (0.0%) | 0 (0.0%) |
| Health Diagnosing & Treating | 0 (0.0%) | 0 (0.0%) |
| Health Technologists | 0 (0.0%) | 0 (0.0%) |
| Total (Category) | 39 (75.0%) | 13 (25.0%) |
| Total (Overall) | 93 (57.8%) | 68 (42.2%) |
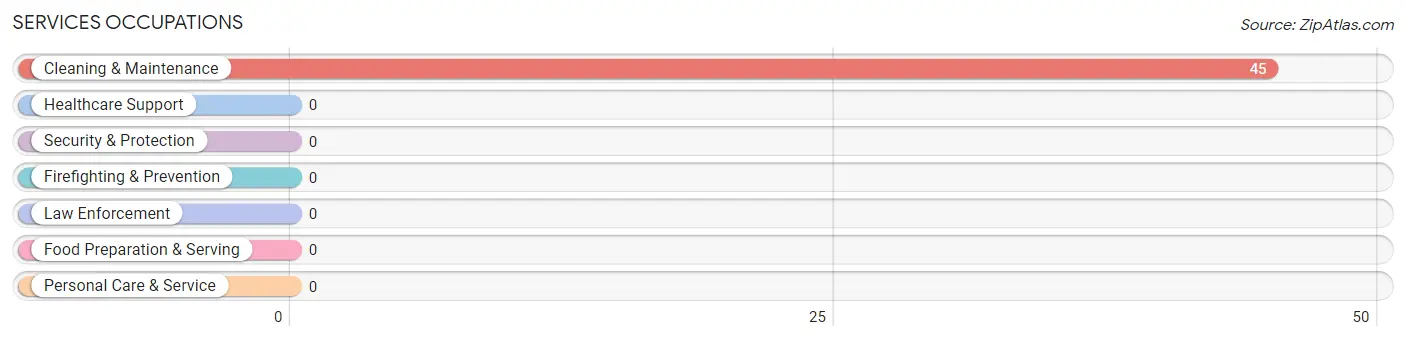
Services Occupations
The most common Services occupations in Lava Hot Springs are , and Cleaning & Maintenance (45 | 28.0%).
Services Occupations by Sex
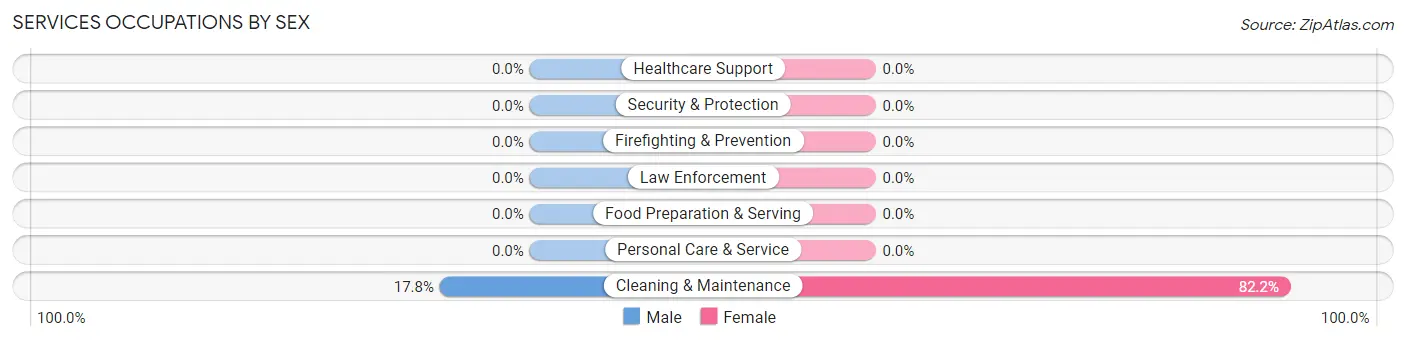
| Occupation | Male | Female |
| Healthcare Support | 0 (0.0%) | 0 (0.0%) |
| Security & Protection | 0 (0.0%) | 0 (0.0%) |
| Firefighting & Prevention | 0 (0.0%) | 0 (0.0%) |
| Law Enforcement | 0 (0.0%) | 0 (0.0%) |
| Food Preparation & Serving | 0 (0.0%) | 0 (0.0%) |
| Cleaning & Maintenance | 8 (17.8%) | 37 (82.2%) |
| Personal Care & Service | 0 (0.0%) | 0 (0.0%) |
| Total (Category) | 8 (17.8%) | 37 (82.2%) |
| Total (Overall) | 93 (57.8%) | 68 (42.2%) |
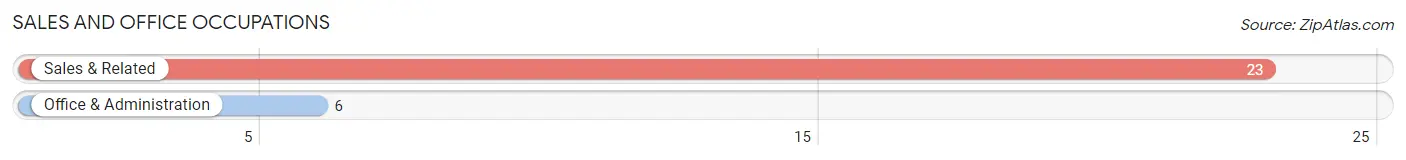
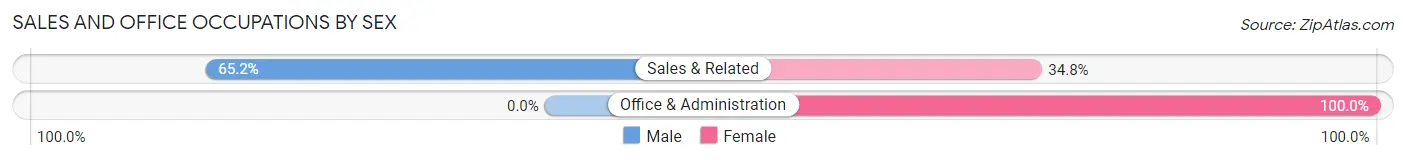
Sales and Office Occupations
The most common Sales and Office occupations in Lava Hot Springs are Sales & Related (23 | 14.3%), and Office & Administration (6 | 3.7%).
Sales and Office Occupations by Sex
| Occupation | Male | Female |
| Sales & Related | 15 (65.2%) | 8 (34.8%) |
| Office & Administration | 0 (0.0%) | 6 (100.0%) |
| Total (Category) | 15 (51.7%) | 14 (48.3%) |
| Total (Overall) | 93 (57.8%) | 68 (42.2%) |
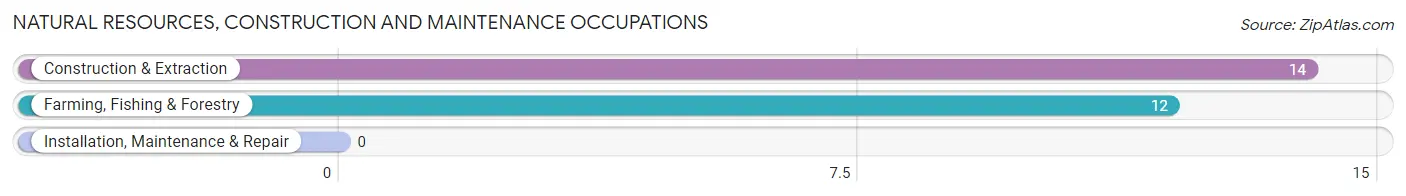
Natural Resources, Construction and Maintenance Occupations
The most common Natural Resources, Construction and Maintenance occupations in Lava Hot Springs are Construction & Extraction (14 | 8.7%), and Farming, Fishing & Forestry (12 | 7.4%).
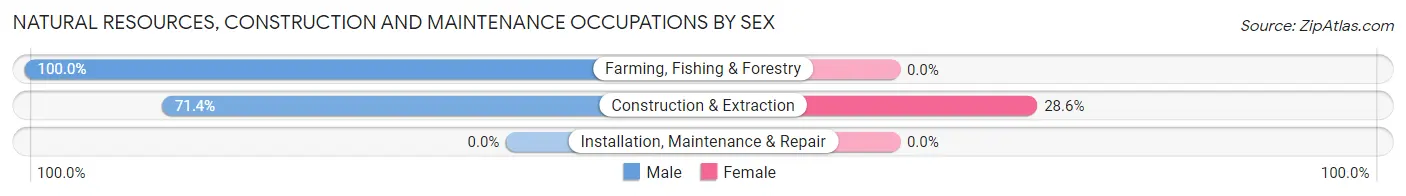
Natural Resources, Construction and Maintenance Occupations by Sex
| Occupation | Male | Female |
| Farming, Fishing & Forestry | 12 (100.0%) | 0 (0.0%) |
| Construction & Extraction | 10 (71.4%) | 4 (28.6%) |
| Installation, Maintenance & Repair | 0 (0.0%) | 0 (0.0%) |
| Total (Category) | 22 (84.6%) | 4 (15.4%) |
| Total (Overall) | 93 (57.8%) | 68 (42.2%) |
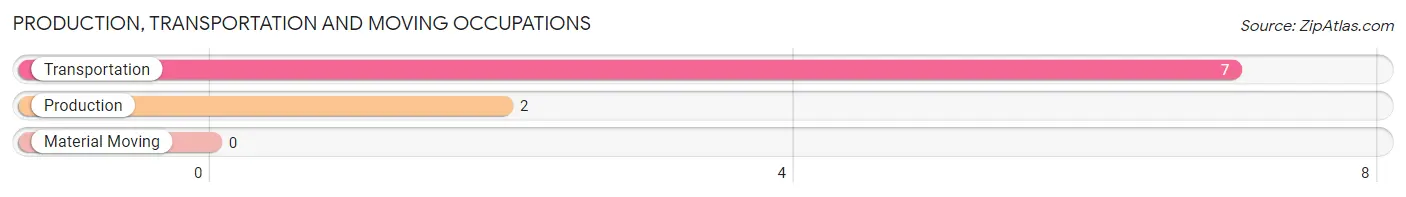
Production, Transportation and Moving Occupations
The most common Production, Transportation and Moving occupations in Lava Hot Springs are Transportation (7 | 4.3%), and Production (2 | 1.2%).
Production, Transportation and Moving Occupations by Sex
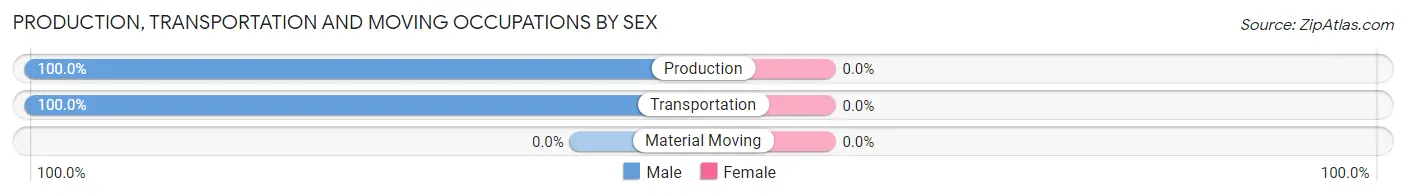
| Occupation | Male | Female |
| Production | 2 (100.0%) | 0 (0.0%) |
| Transportation | 7 (100.0%) | 0 (0.0%) |
| Material Moving | 0 (0.0%) | 0 (0.0%) |
| Total (Category) | 9 (100.0%) | 0 (0.0%) |
| Total (Overall) | 93 (57.8%) | 68 (42.2%) |
Employment Industries by Sex in Lava Hot Springs
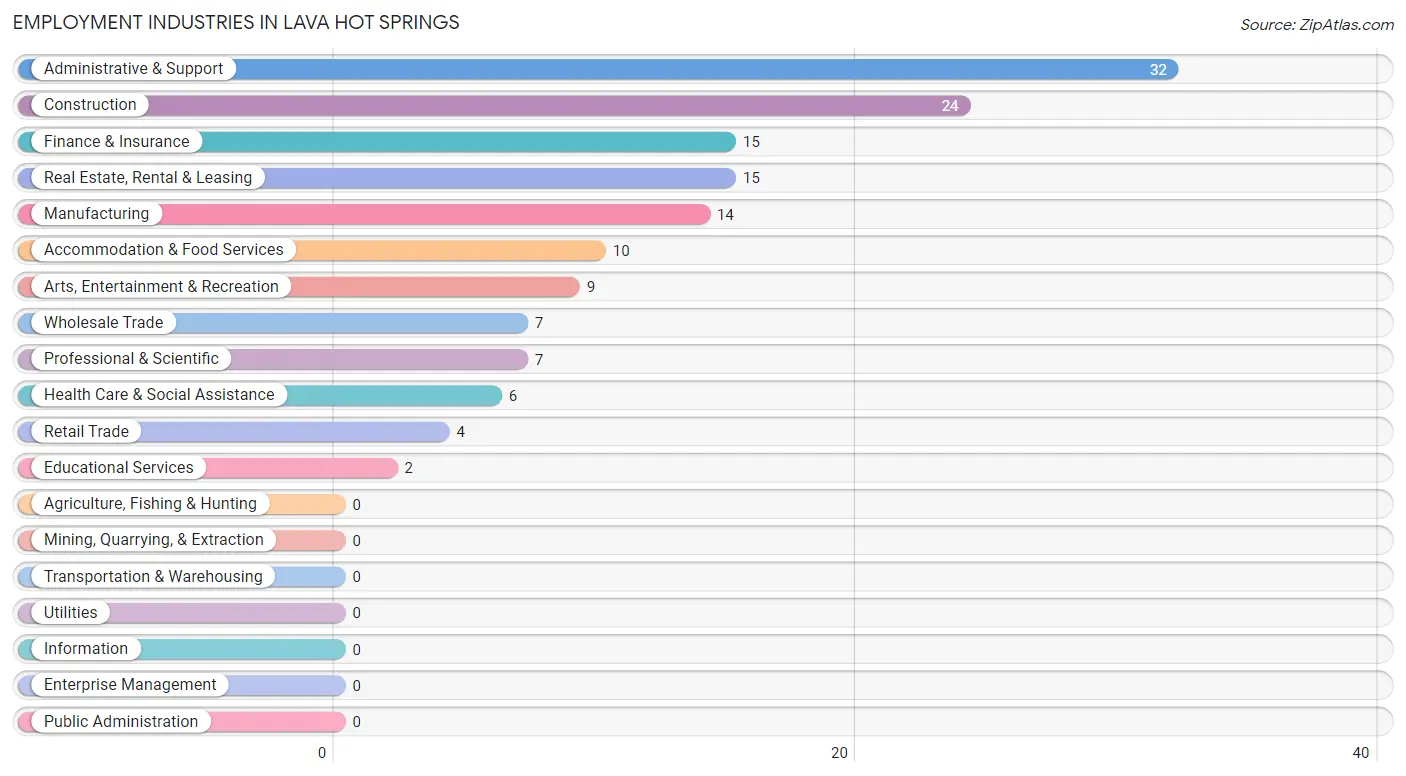
Employment Industries in Lava Hot Springs
The major employment industries in Lava Hot Springs include Administrative & Support (32 | 19.9%), Construction (24 | 14.9%), Finance & Insurance (15 | 9.3%), Real Estate, Rental & Leasing (15 | 9.3%), and Manufacturing (14 | 8.7%).
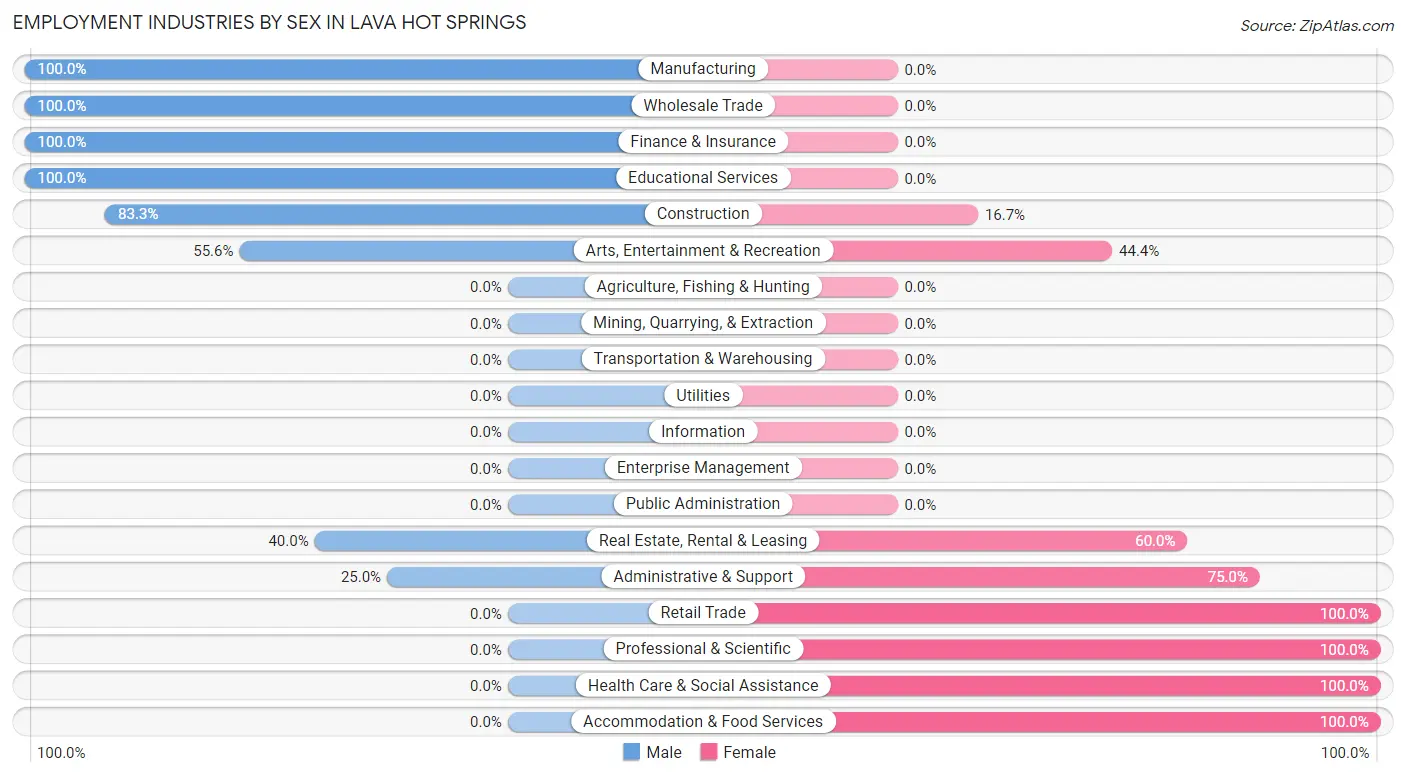
Employment Industries by Sex in Lava Hot Springs
The Lava Hot Springs industries that see more men than women are Manufacturing (100.0%), Wholesale Trade (100.0%), and Finance & Insurance (100.0%), whereas the industries that tend to have a higher number of women are Retail Trade (100.0%), Professional & Scientific (100.0%), and Health Care & Social Assistance (100.0%).
| Industry | Male | Female |
| Agriculture, Fishing & Hunting | 0 (0.0%) | 0 (0.0%) |
| Mining, Quarrying, & Extraction | 0 (0.0%) | 0 (0.0%) |
| Construction | 20 (83.3%) | 4 (16.7%) |
| Manufacturing | 14 (100.0%) | 0 (0.0%) |
| Wholesale Trade | 7 (100.0%) | 0 (0.0%) |
| Retail Trade | 0 (0.0%) | 4 (100.0%) |
| Transportation & Warehousing | 0 (0.0%) | 0 (0.0%) |
| Utilities | 0 (0.0%) | 0 (0.0%) |
| Information | 0 (0.0%) | 0 (0.0%) |
| Finance & Insurance | 15 (100.0%) | 0 (0.0%) |
| Real Estate, Rental & Leasing | 6 (40.0%) | 9 (60.0%) |
| Professional & Scientific | 0 (0.0%) | 7 (100.0%) |
| Enterprise Management | 0 (0.0%) | 0 (0.0%) |
| Administrative & Support | 8 (25.0%) | 24 (75.0%) |
| Educational Services | 2 (100.0%) | 0 (0.0%) |
| Health Care & Social Assistance | 0 (0.0%) | 6 (100.0%) |
| Arts, Entertainment & Recreation | 5 (55.6%) | 4 (44.4%) |
| Accommodation & Food Services | 0 (0.0%) | 10 (100.0%) |
| Public Administration | 0 (0.0%) | 0 (0.0%) |
| Total | 93 (57.8%) | 68 (42.2%) |
Education in Lava Hot Springs
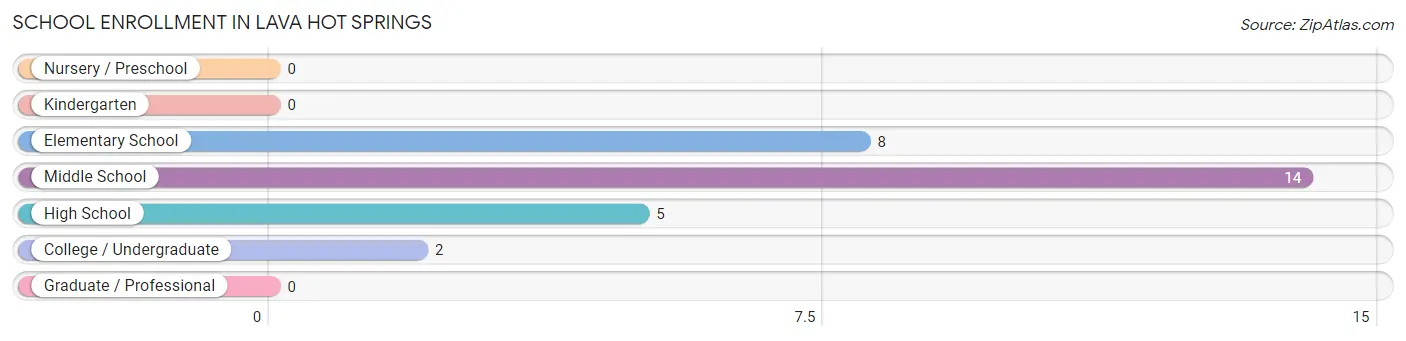
School Enrollment in Lava Hot Springs
The most common levels of schooling among the 29 students in Lava Hot Springs are middle school (14 | 48.3%), elementary school (8 | 27.6%), and high school (5 | 17.2%).
| School Level | # Students | % Students |
| Nursery / Preschool | 0 | 0.0% |
| Kindergarten | 0 | 0.0% |
| Elementary School | 8 | 27.6% |
| Middle School | 14 | 48.3% |
| High School | 5 | 17.2% |
| College / Undergraduate | 2 | 6.9% |
| Graduate / Professional | 0 | 0.0% |
| Total | 29 | 100.0% |
School Enrollment by Age by Funding Source in Lava Hot Springs
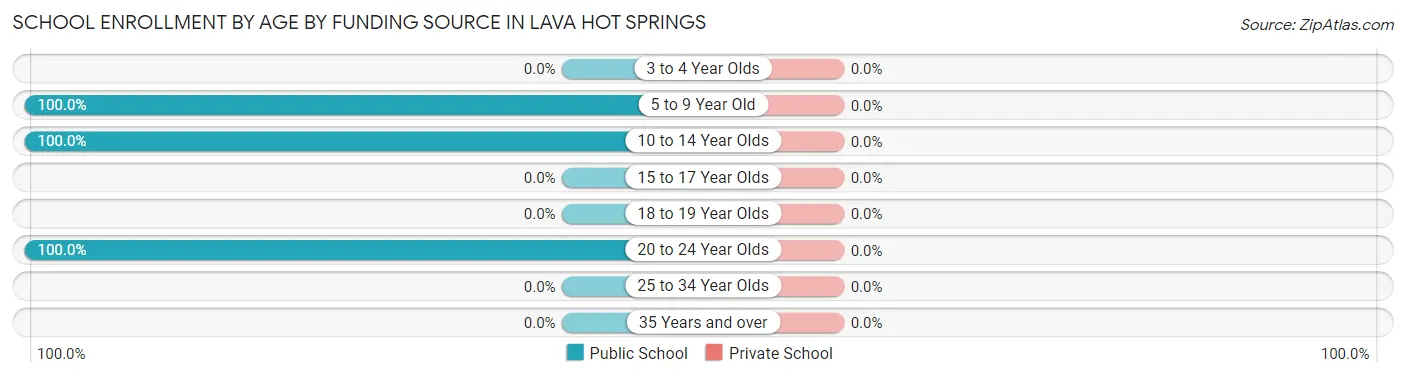
| Age Bracket | Public School | Private School |
| 3 to 4 Year Olds | 0 (0.0%) | 0 (0.0%) |
| 5 to 9 Year Old | 8 (100.0%) | 0 (0.0%) |
| 10 to 14 Year Olds | 19 (100.0%) | 0 (0.0%) |
| 15 to 17 Year Olds | 0 (0.0%) | 0 (0.0%) |
| 18 to 19 Year Olds | 0 (0.0%) | 0 (0.0%) |
| 20 to 24 Year Olds | 2 (100.0%) | 0 (0.0%) |
| 25 to 34 Year Olds | 0 (0.0%) | 0 (0.0%) |
| 35 Years and over | 0 (0.0%) | 0 (0.0%) |
| Total | 29 (100.0%) | 0 (0.0%) |
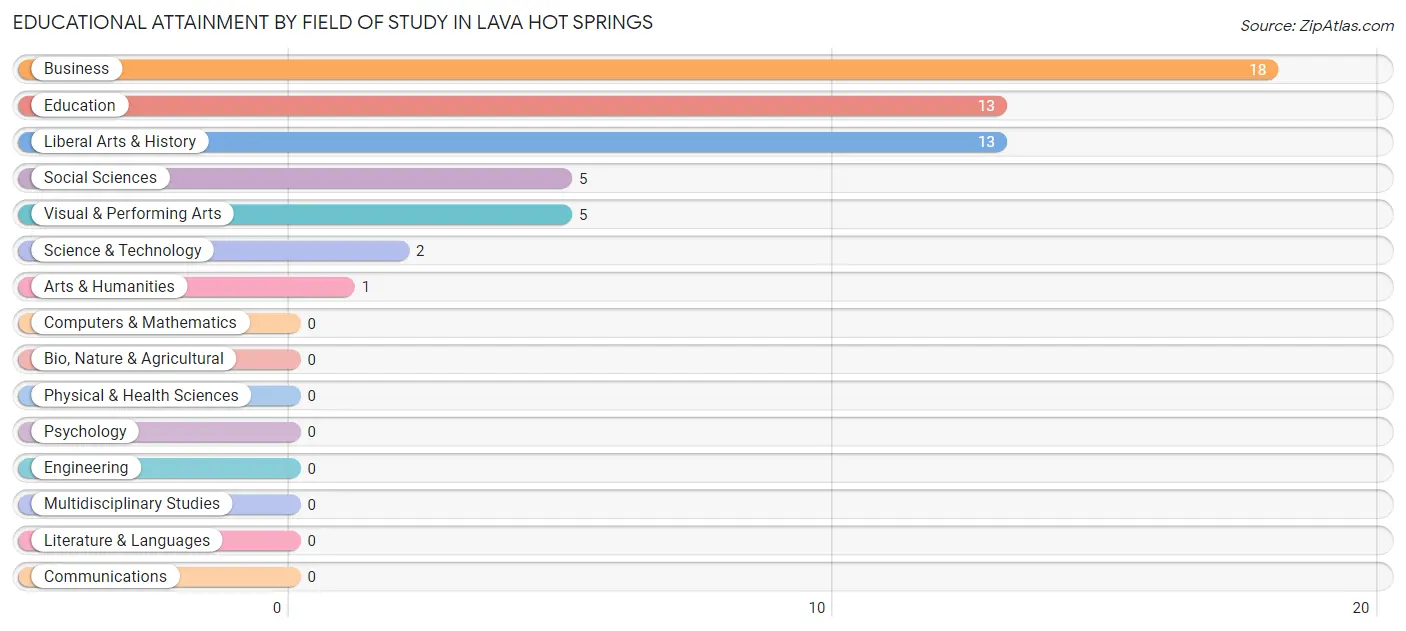
Educational Attainment by Field of Study in Lava Hot Springs
Business (18 | 31.6%), education (13 | 22.8%), liberal arts & history (13 | 22.8%), social sciences (5 | 8.8%), and visual & performing arts (5 | 8.8%) are the most common fields of study among 57 individuals in Lava Hot Springs who have obtained a bachelor's degree or higher.
| Field of Study | # Graduates | % Graduates |
| Computers & Mathematics | 0 | 0.0% |
| Bio, Nature & Agricultural | 0 | 0.0% |
| Physical & Health Sciences | 0 | 0.0% |
| Psychology | 0 | 0.0% |
| Social Sciences | 5 | 8.8% |
| Engineering | 0 | 0.0% |
| Multidisciplinary Studies | 0 | 0.0% |
| Science & Technology | 2 | 3.5% |
| Business | 18 | 31.6% |
| Education | 13 | 22.8% |
| Literature & Languages | 0 | 0.0% |
| Liberal Arts & History | 13 | 22.8% |
| Visual & Performing Arts | 5 | 8.8% |
| Communications | 0 | 0.0% |
| Arts & Humanities | 1 | 1.8% |
| Total | 57 | 100.0% |
Transportation & Commute in Lava Hot Springs
Vehicle Availability by Sex in Lava Hot Springs
The most prevalent vehicle ownership categories in Lava Hot Springs are males with 3 vehicles (42, accounting for 47.2%) and females with 3 vehicles (15, making up 61.8%).
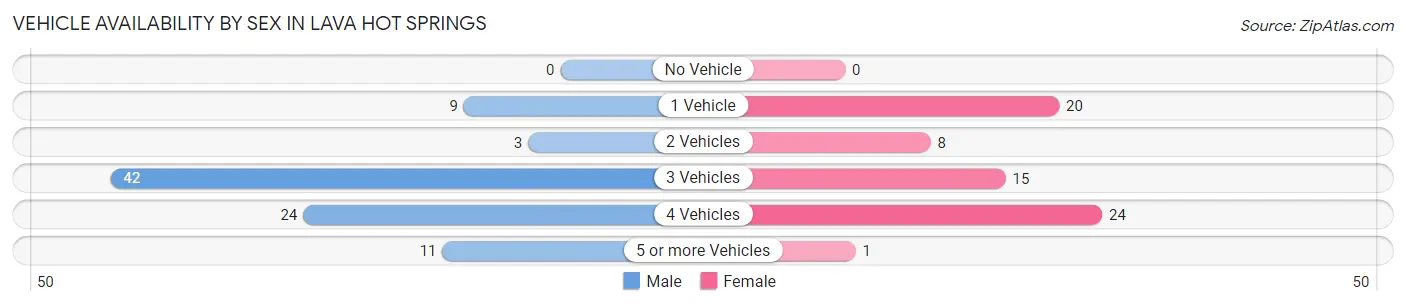
| Vehicles Available | Male | Female |
| No Vehicle | 0 (0.0%) | 0 (0.0%) |
| 1 Vehicle | 9 (10.1%) | 20 (29.4%) |
| 2 Vehicles | 3 (3.4%) | 8 (11.8%) |
| 3 Vehicles | 42 (47.2%) | 15 (22.1%) |
| 4 Vehicles | 24 (27.0%) | 24 (35.3%) |
| 5 or more Vehicles | 11 (12.4%) | 1 (1.5%) |
| Total | 89 (100.0%) | 68 (100.0%) |
Commute Time in Lava Hot Springs
The most frequently occuring commute durations in Lava Hot Springs are 5 to 9 minutes (50 commuters, 36.0%), less than 5 minutes (41 commuters, 29.5%), and 30 to 34 minutes (14 commuters, 10.1%).
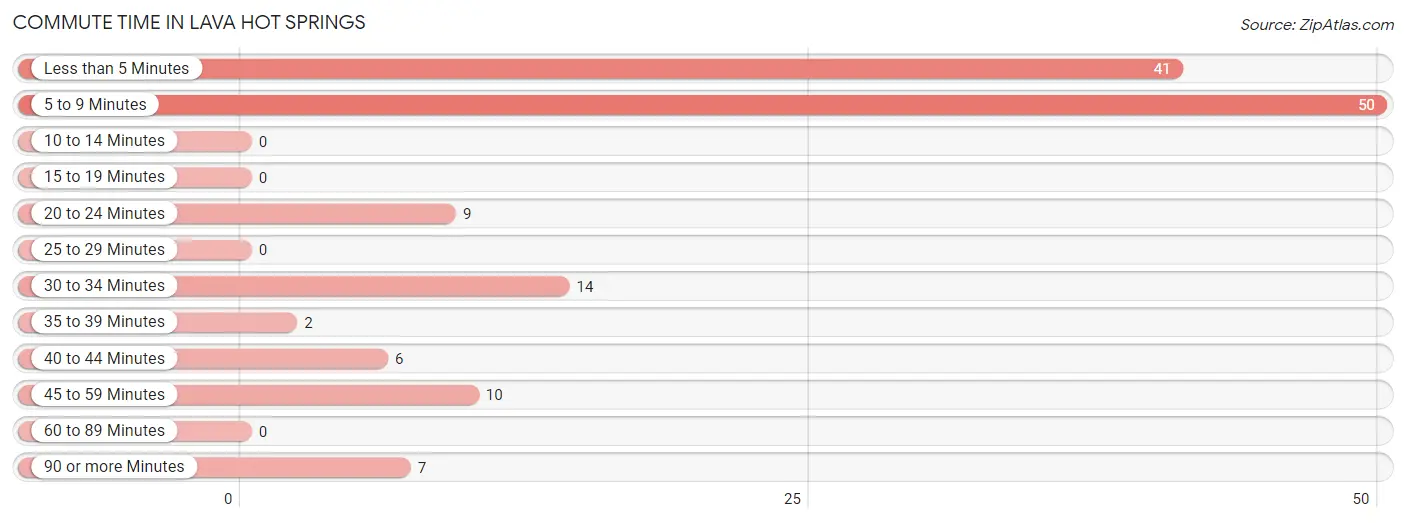
| Commute Time | # Commuters | % Commuters |
| Less than 5 Minutes | 41 | 29.5% |
| 5 to 9 Minutes | 50 | 36.0% |
| 10 to 14 Minutes | 0 | 0.0% |
| 15 to 19 Minutes | 0 | 0.0% |
| 20 to 24 Minutes | 9 | 6.5% |
| 25 to 29 Minutes | 0 | 0.0% |
| 30 to 34 Minutes | 14 | 10.1% |
| 35 to 39 Minutes | 2 | 1.4% |
| 40 to 44 Minutes | 6 | 4.3% |
| 45 to 59 Minutes | 10 | 7.2% |
| 60 to 89 Minutes | 0 | 0.0% |
| 90 or more Minutes | 7 | 5.0% |
Commute Time by Sex in Lava Hot Springs
The most common commute times in Lava Hot Springs are 5 to 9 minutes (35 commuters, 45.5%) for males and less than 5 minutes (32 commuters, 51.6%) for females.
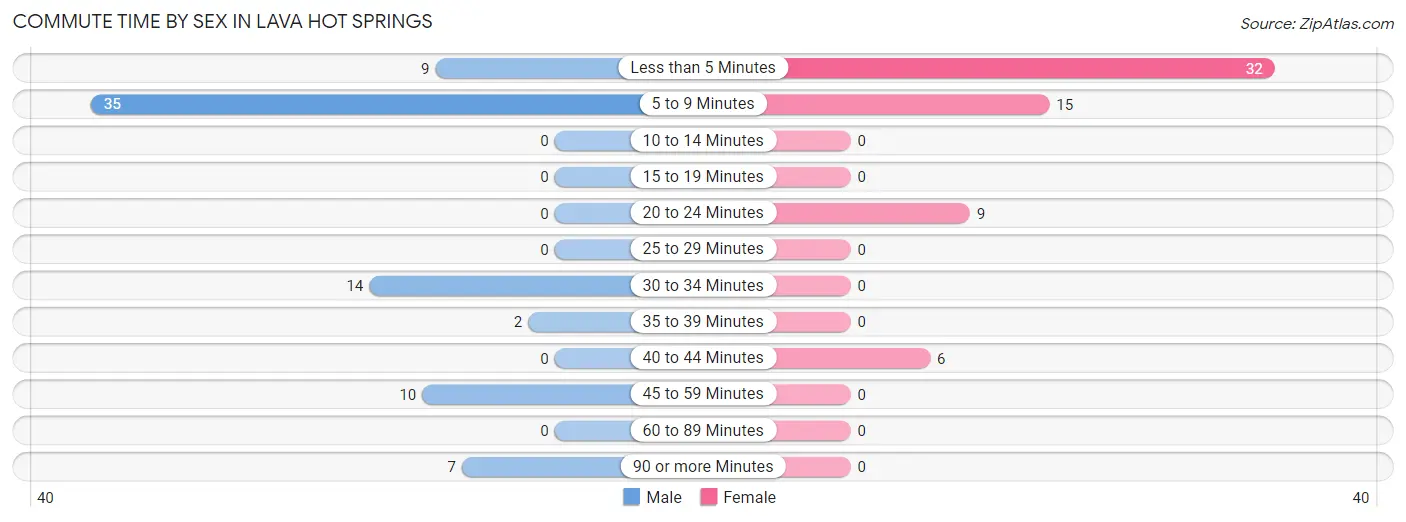
| Commute Time | Male | Female |
| Less than 5 Minutes | 9 (11.7%) | 32 (51.6%) |
| 5 to 9 Minutes | 35 (45.5%) | 15 (24.2%) |
| 10 to 14 Minutes | 0 (0.0%) | 0 (0.0%) |
| 15 to 19 Minutes | 0 (0.0%) | 0 (0.0%) |
| 20 to 24 Minutes | 0 (0.0%) | 9 (14.5%) |
| 25 to 29 Minutes | 0 (0.0%) | 0 (0.0%) |
| 30 to 34 Minutes | 14 (18.2%) | 0 (0.0%) |
| 35 to 39 Minutes | 2 (2.6%) | 0 (0.0%) |
| 40 to 44 Minutes | 0 (0.0%) | 6 (9.7%) |
| 45 to 59 Minutes | 10 (13.0%) | 0 (0.0%) |
| 60 to 89 Minutes | 0 (0.0%) | 0 (0.0%) |
| 90 or more Minutes | 7 (9.1%) | 0 (0.0%) |
Time of Departure to Work by Sex in Lava Hot Springs
The most frequent times of departure to work in Lava Hot Springs are 9:00 AM to 9:59 AM (34, 44.2%) for males and 9:00 AM to 9:59 AM (37, 59.7%) for females.
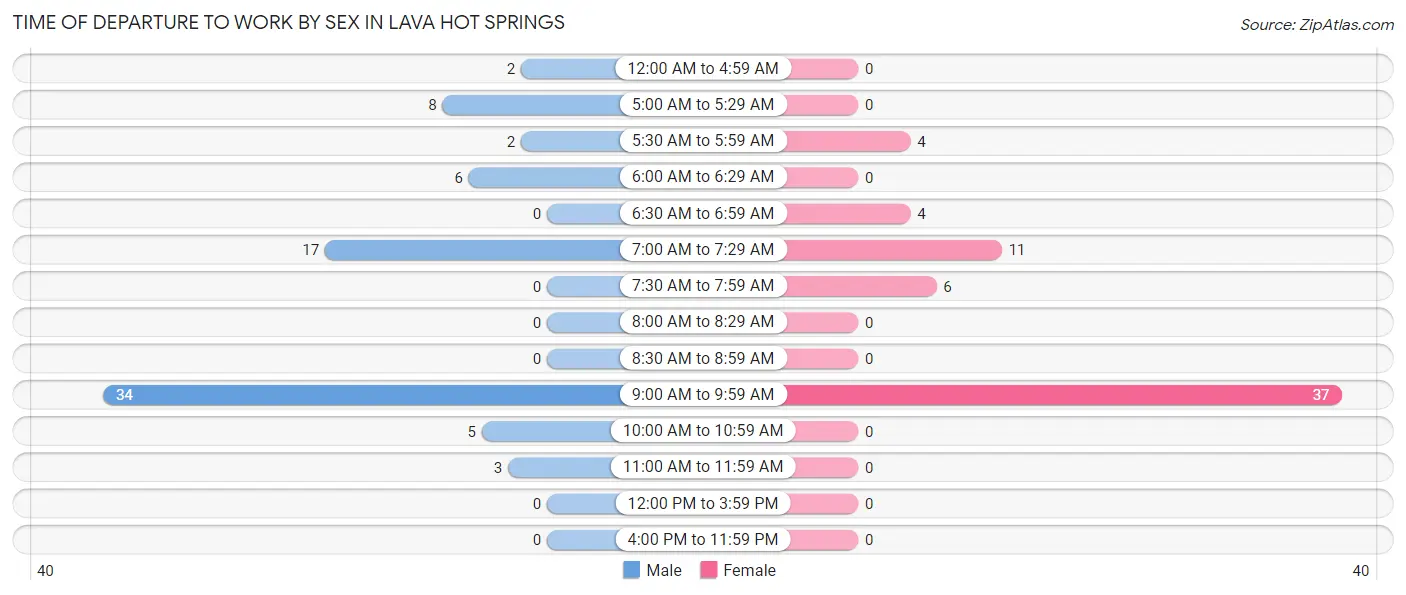
| Time of Departure | Male | Female |
| 12:00 AM to 4:59 AM | 2 (2.6%) | 0 (0.0%) |
| 5:00 AM to 5:29 AM | 8 (10.4%) | 0 (0.0%) |
| 5:30 AM to 5:59 AM | 2 (2.6%) | 4 (6.5%) |
| 6:00 AM to 6:29 AM | 6 (7.8%) | 0 (0.0%) |
| 6:30 AM to 6:59 AM | 0 (0.0%) | 4 (6.5%) |
| 7:00 AM to 7:29 AM | 17 (22.1%) | 11 (17.7%) |
| 7:30 AM to 7:59 AM | 0 (0.0%) | 6 (9.7%) |
| 8:00 AM to 8:29 AM | 0 (0.0%) | 0 (0.0%) |
| 8:30 AM to 8:59 AM | 0 (0.0%) | 0 (0.0%) |
| 9:00 AM to 9:59 AM | 34 (44.2%) | 37 (59.7%) |
| 10:00 AM to 10:59 AM | 5 (6.5%) | 0 (0.0%) |
| 11:00 AM to 11:59 AM | 3 (3.9%) | 0 (0.0%) |
| 12:00 PM to 3:59 PM | 0 (0.0%) | 0 (0.0%) |
| 4:00 PM to 11:59 PM | 0 (0.0%) | 0 (0.0%) |
| Total | 77 (100.0%) | 62 (100.0%) |
Housing Occupancy in Lava Hot Springs
Occupancy by Ownership in Lava Hot Springs
Of the total 140 dwellings in Lava Hot Springs, owner-occupied units account for 79 (56.4%), while renter-occupied units make up 61 (43.6%).
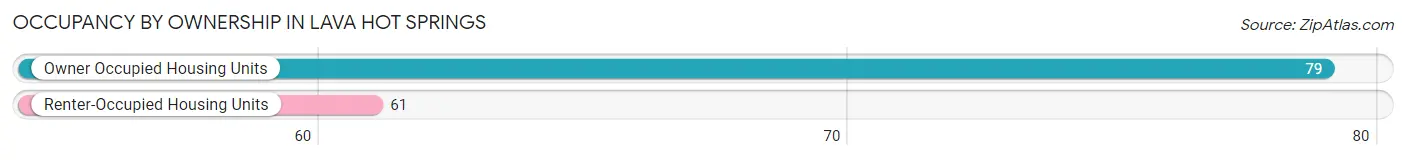
| Occupancy | # Housing Units | % Housing Units |
| Owner Occupied Housing Units | 79 | 56.4% |
| Renter-Occupied Housing Units | 61 | 43.6% |
| Total Occupied Housing Units | 140 | 100.0% |
Occupancy by Household Size in Lava Hot Springs
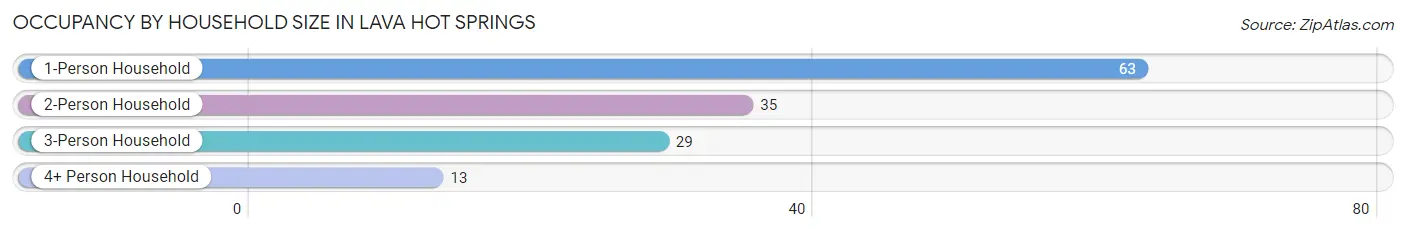
| Household Size | # Housing Units | % Housing Units |
| 1-Person Household | 63 | 45.0% |
| 2-Person Household | 35 | 25.0% |
| 3-Person Household | 29 | 20.7% |
| 4+ Person Household | 13 | 9.3% |
| Total Housing Units | 140 | 100.0% |
Occupancy by Ownership by Household Size in Lava Hot Springs
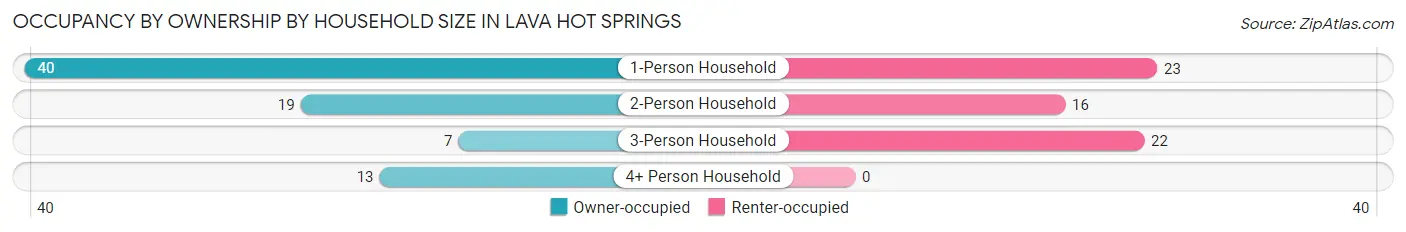
| Household Size | Owner-occupied | Renter-occupied |
| 1-Person Household | 40 (63.5%) | 23 (36.5%) |
| 2-Person Household | 19 (54.3%) | 16 (45.7%) |
| 3-Person Household | 7 (24.1%) | 22 (75.9%) |
| 4+ Person Household | 13 (100.0%) | 0 (0.0%) |
| Total Housing Units | 79 (56.4%) | 61 (43.6%) |
Occupancy by Educational Attainment in Lava Hot Springs
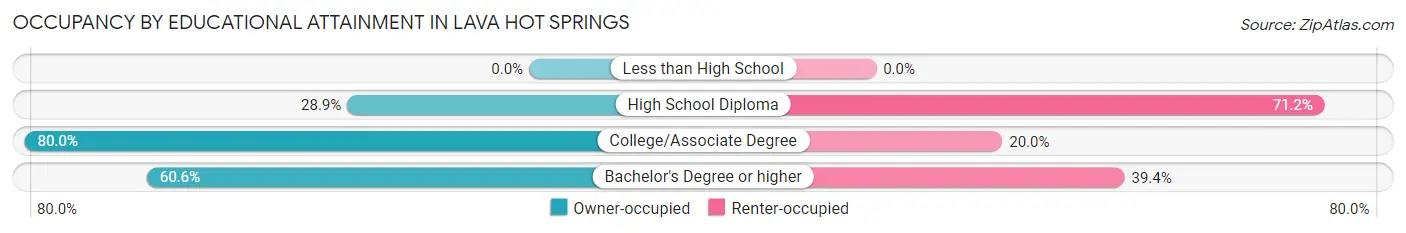
| Household Size | Owner-occupied | Renter-occupied |
| Less than High School | 0 (0.0%) | 0 (0.0%) |
| High School Diploma | 15 (28.8%) | 37 (71.2%) |
| College/Associate Degree | 44 (80.0%) | 11 (20.0%) |
| Bachelor's Degree or higher | 20 (60.6%) | 13 (39.4%) |
Occupancy by Age of Householder in Lava Hot Springs
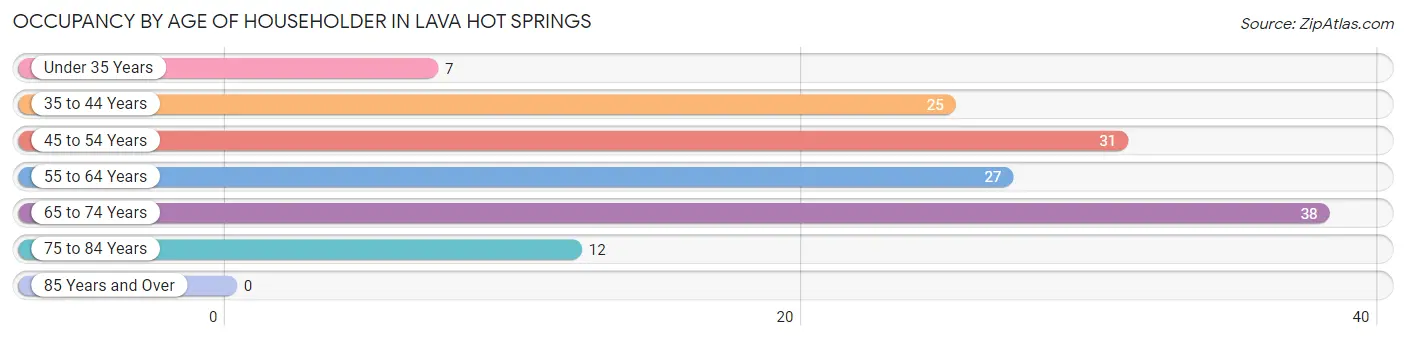
| Age Bracket | # Households | % Households |
| Under 35 Years | 7 | 5.0% |
| 35 to 44 Years | 25 | 17.9% |
| 45 to 54 Years | 31 | 22.1% |
| 55 to 64 Years | 27 | 19.3% |
| 65 to 74 Years | 38 | 27.1% |
| 75 to 84 Years | 12 | 8.6% |
| 85 Years and Over | 0 | 0.0% |
| Total | 140 | 100.0% |
Housing Finances in Lava Hot Springs
Median Income by Occupancy in Lava Hot Springs
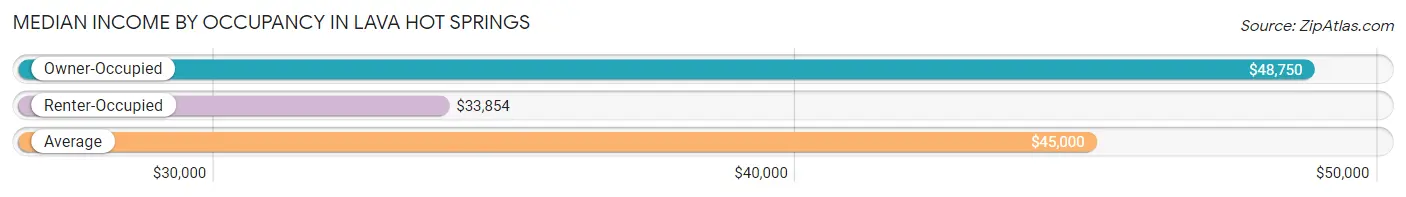
| Occupancy Type | # Households | Median Income |
| Owner-Occupied | 79 (56.4%) | $48,750 |
| Renter-Occupied | 61 (43.6%) | $33,854 |
| Average | 140 (100.0%) | $45,000 |
Occupancy by Householder Income Bracket in Lava Hot Springs
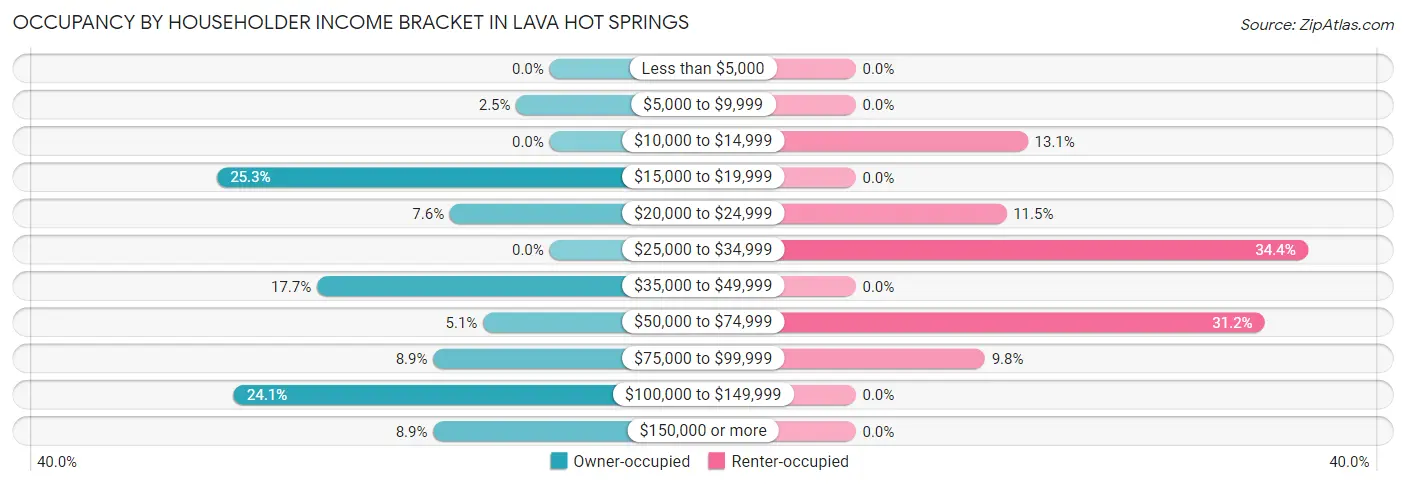
| Income Bracket | Owner-occupied | Renter-occupied |
| Less than $5,000 | 0 (0.0%) | 0 (0.0%) |
| $5,000 to $9,999 | 2 (2.5%) | 0 (0.0%) |
| $10,000 to $14,999 | 0 (0.0%) | 8 (13.1%) |
| $15,000 to $19,999 | 20 (25.3%) | 0 (0.0%) |
| $20,000 to $24,999 | 6 (7.6%) | 7 (11.5%) |
| $25,000 to $34,999 | 0 (0.0%) | 21 (34.4%) |
| $35,000 to $49,999 | 14 (17.7%) | 0 (0.0%) |
| $50,000 to $74,999 | 4 (5.1%) | 19 (31.1%) |
| $75,000 to $99,999 | 7 (8.9%) | 6 (9.8%) |
| $100,000 to $149,999 | 19 (24.0%) | 0 (0.0%) |
| $150,000 or more | 7 (8.9%) | 0 (0.0%) |
| Total | 79 (100.0%) | 61 (100.0%) |
Monthly Housing Cost Tiers in Lava Hot Springs
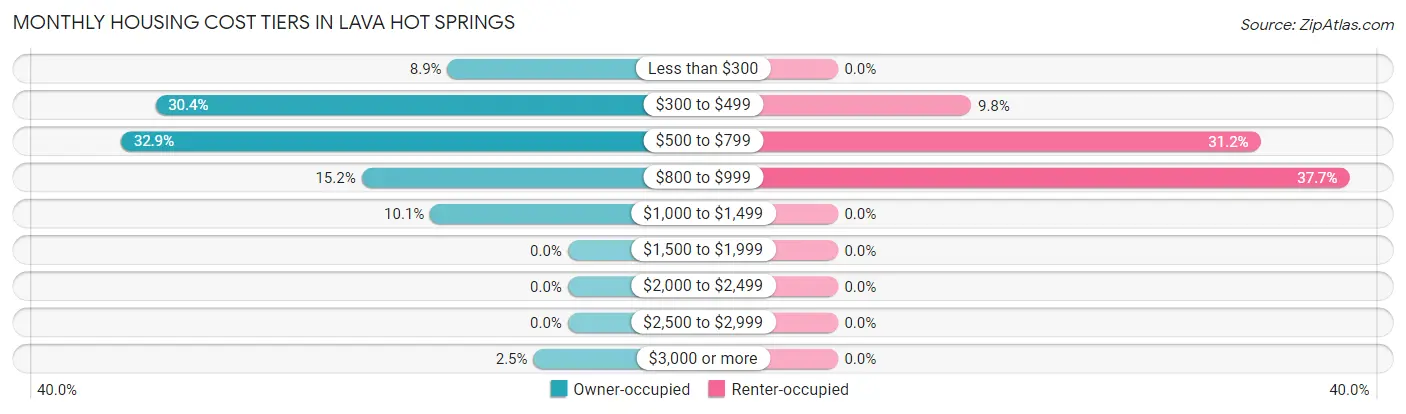
| Monthly Cost | Owner-occupied | Renter-occupied |
| Less than $300 | 7 (8.9%) | 0 (0.0%) |
| $300 to $499 | 24 (30.4%) | 6 (9.8%) |
| $500 to $799 | 26 (32.9%) | 19 (31.1%) |
| $800 to $999 | 12 (15.2%) | 23 (37.7%) |
| $1,000 to $1,499 | 8 (10.1%) | 0 (0.0%) |
| $1,500 to $1,999 | 0 (0.0%) | 0 (0.0%) |
| $2,000 to $2,499 | 0 (0.0%) | 0 (0.0%) |
| $2,500 to $2,999 | 0 (0.0%) | 0 (0.0%) |
| $3,000 or more | 2 (2.5%) | 0 (0.0%) |
| Total | 79 (100.0%) | 61 (100.0%) |
Physical Housing Characteristics in Lava Hot Springs
Housing Structures in Lava Hot Springs
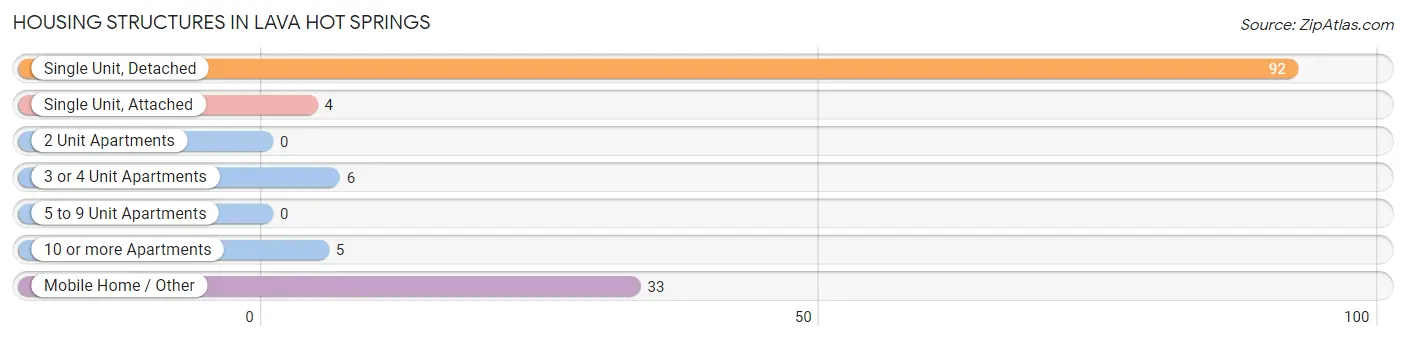
| Structure Type | # Housing Units | % Housing Units |
| Single Unit, Detached | 92 | 65.7% |
| Single Unit, Attached | 4 | 2.9% |
| 2 Unit Apartments | 0 | 0.0% |
| 3 or 4 Unit Apartments | 6 | 4.3% |
| 5 to 9 Unit Apartments | 0 | 0.0% |
| 10 or more Apartments | 5 | 3.6% |
| Mobile Home / Other | 33 | 23.6% |
| Total | 140 | 100.0% |
Housing Structures by Occupancy in Lava Hot Springs
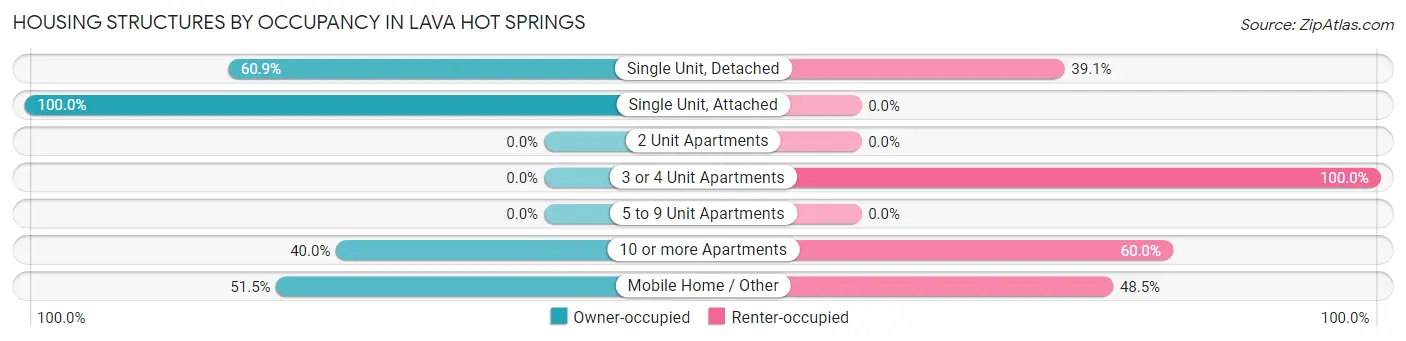
| Structure Type | Owner-occupied | Renter-occupied |
| Single Unit, Detached | 56 (60.9%) | 36 (39.1%) |
| Single Unit, Attached | 4 (100.0%) | 0 (0.0%) |
| 2 Unit Apartments | 0 (0.0%) | 0 (0.0%) |
| 3 or 4 Unit Apartments | 0 (0.0%) | 6 (100.0%) |
| 5 to 9 Unit Apartments | 0 (0.0%) | 0 (0.0%) |
| 10 or more Apartments | 2 (40.0%) | 3 (60.0%) |
| Mobile Home / Other | 17 (51.5%) | 16 (48.5%) |
| Total | 79 (56.4%) | 61 (43.6%) |
Housing Structures by Number of Rooms in Lava Hot Springs
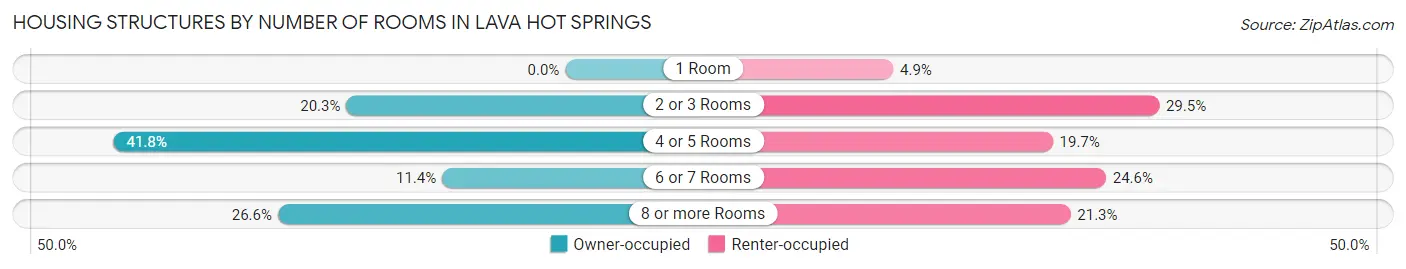
| Number of Rooms | Owner-occupied | Renter-occupied |
| 1 Room | 0 (0.0%) | 3 (4.9%) |
| 2 or 3 Rooms | 16 (20.3%) | 18 (29.5%) |
| 4 or 5 Rooms | 33 (41.8%) | 12 (19.7%) |
| 6 or 7 Rooms | 9 (11.4%) | 15 (24.6%) |
| 8 or more Rooms | 21 (26.6%) | 13 (21.3%) |
| Total | 79 (100.0%) | 61 (100.0%) |
Housing Structure by Heating Type in Lava Hot Springs
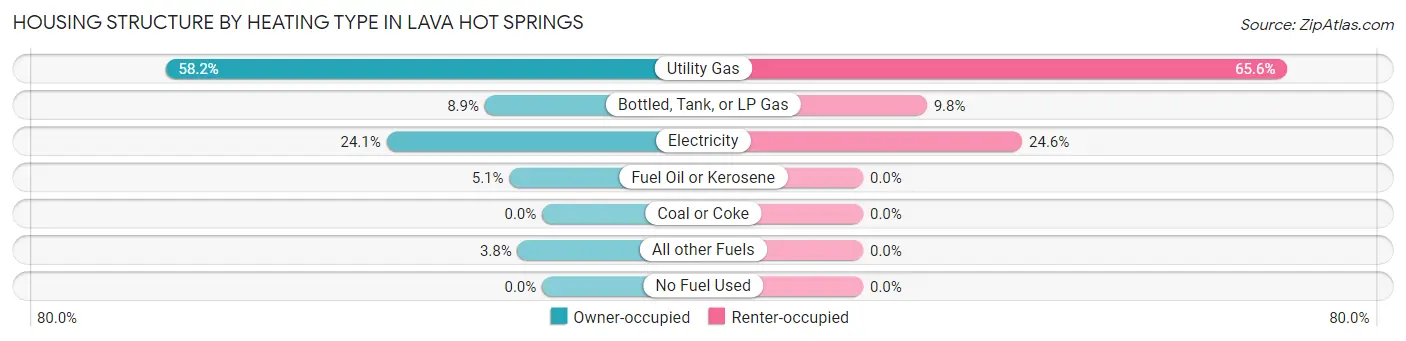
| Heating Type | Owner-occupied | Renter-occupied |
| Utility Gas | 46 (58.2%) | 40 (65.6%) |
| Bottled, Tank, or LP Gas | 7 (8.9%) | 6 (9.8%) |
| Electricity | 19 (24.0%) | 15 (24.6%) |
| Fuel Oil or Kerosene | 4 (5.1%) | 0 (0.0%) |
| Coal or Coke | 0 (0.0%) | 0 (0.0%) |
| All other Fuels | 3 (3.8%) | 0 (0.0%) |
| No Fuel Used | 0 (0.0%) | 0 (0.0%) |
| Total | 79 (100.0%) | 61 (100.0%) |
Household Vehicle Usage in Lava Hot Springs
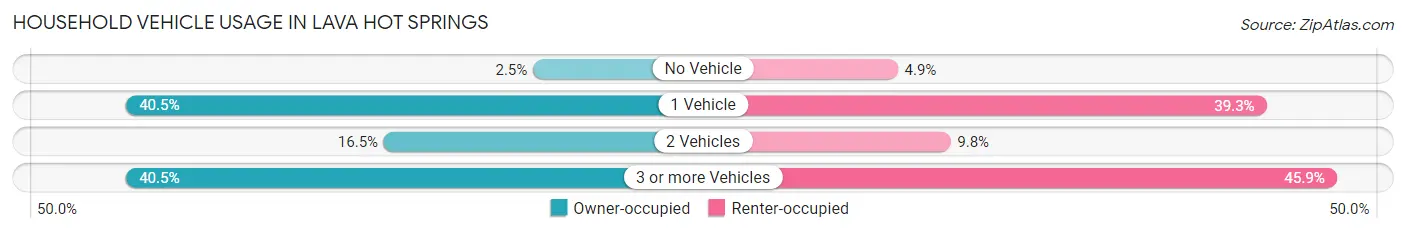
| Vehicles per Household | Owner-occupied | Renter-occupied |
| No Vehicle | 2 (2.5%) | 3 (4.9%) |
| 1 Vehicle | 32 (40.5%) | 24 (39.3%) |
| 2 Vehicles | 13 (16.5%) | 6 (9.8%) |
| 3 or more Vehicles | 32 (40.5%) | 28 (45.9%) |
| Total | 79 (100.0%) | 61 (100.0%) |
Real Estate & Mortgages in Lava Hot Springs
Real Estate and Mortgage Overview in Lava Hot Springs
| Characteristic | Without Mortgage | With Mortgage |
| Housing Units | 40 | 39 |
| Median Property Value | $216,700 | $237,500 |
| Median Household Income | - | - |
| Monthly Housing Costs | $358 | $2 |
| Real Estate Taxes | $1,250 | $4 |
Property Value by Mortgage Status in Lava Hot Springs
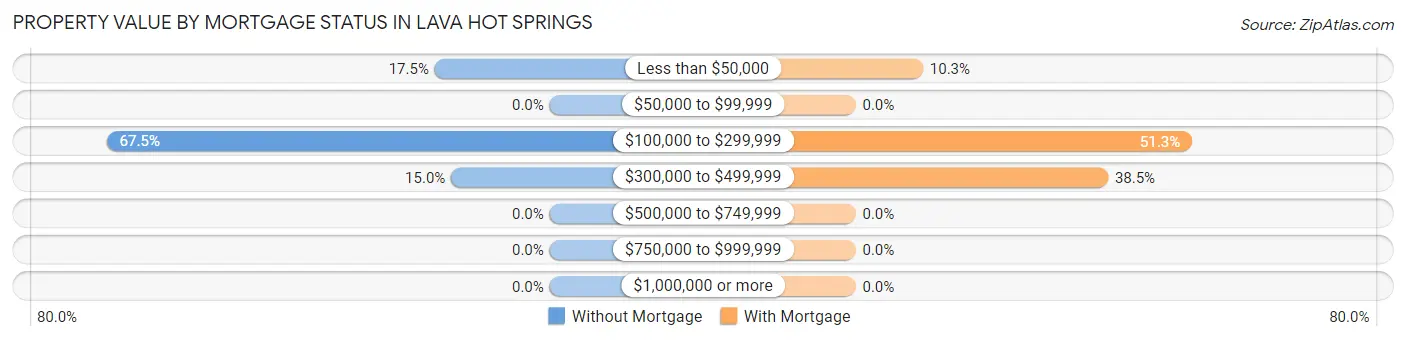
| Property Value | Without Mortgage | With Mortgage |
| Less than $50,000 | 7 (17.5%) | 4 (10.3%) |
| $50,000 to $99,999 | 0 (0.0%) | 0 (0.0%) |
| $100,000 to $299,999 | 27 (67.5%) | 20 (51.3%) |
| $300,000 to $499,999 | 6 (15.0%) | 15 (38.5%) |
| $500,000 to $749,999 | 0 (0.0%) | 0 (0.0%) |
| $750,000 to $999,999 | 0 (0.0%) | 0 (0.0%) |
| $1,000,000 or more | 0 (0.0%) | 0 (0.0%) |
| Total | 40 (100.0%) | 39 (100.0%) |
Household Income by Mortgage Status in Lava Hot Springs
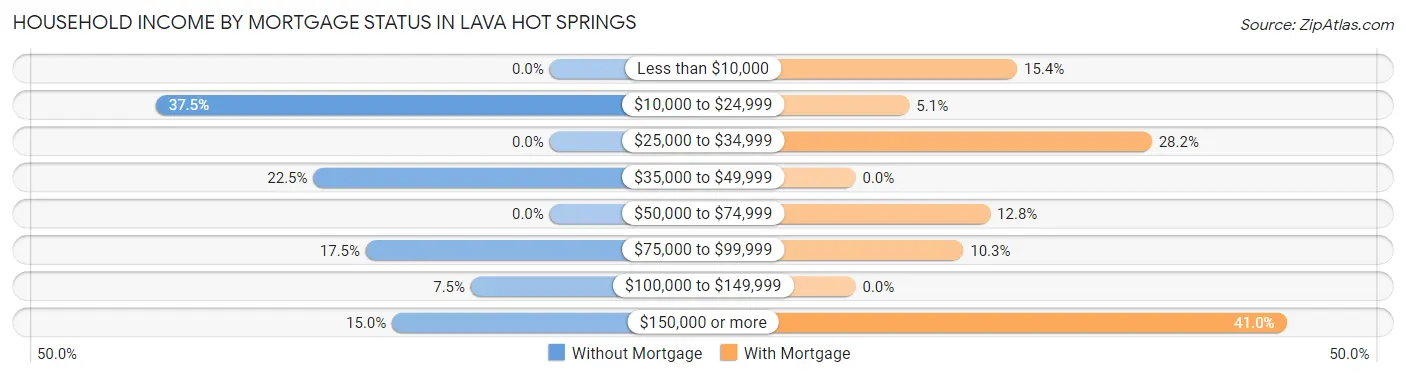
| Household Income | Without Mortgage | With Mortgage |
| Less than $10,000 | 0 (0.0%) | 6 (15.4%) |
| $10,000 to $24,999 | 15 (37.5%) | 2 (5.1%) |
| $25,000 to $34,999 | 0 (0.0%) | 11 (28.2%) |
| $35,000 to $49,999 | 9 (22.5%) | 0 (0.0%) |
| $50,000 to $74,999 | 0 (0.0%) | 5 (12.8%) |
| $75,000 to $99,999 | 7 (17.5%) | 4 (10.3%) |
| $100,000 to $149,999 | 3 (7.5%) | 0 (0.0%) |
| $150,000 or more | 6 (15.0%) | 16 (41.0%) |
| Total | 40 (100.0%) | 39 (100.0%) |
Property Value to Household Income Ratio in Lava Hot Springs
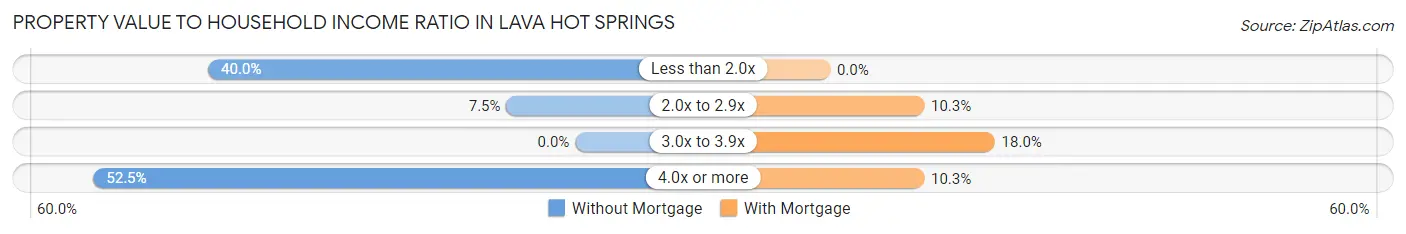
| Value-to-Income Ratio | Without Mortgage | With Mortgage |
| Less than 2.0x | 16 (40.0%) | 0 (0.0%) |
| 2.0x to 2.9x | 3 (7.5%) | 4 (10.3%) |
| 3.0x to 3.9x | 0 (0.0%) | 7 (17.9%) |
| 4.0x or more | 21 (52.5%) | 4 (10.3%) |
| Total | 40 (100.0%) | 39 (100.0%) |
Real Estate Taxes by Mortgage Status in Lava Hot Springs
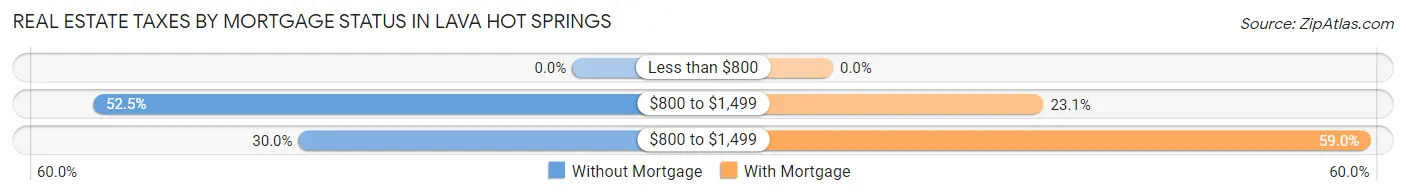
| Property Taxes | Without Mortgage | With Mortgage |
| Less than $800 | 0 (0.0%) | 0 (0.0%) |
| $800 to $1,499 | 21 (52.5%) | 9 (23.1%) |
| $800 to $1,499 | 12 (30.0%) | 23 (59.0%) |
| Total | 40 (100.0%) | 39 (100.0%) |
Health & Disability in Lava Hot Springs
Health Insurance Coverage by Age in Lava Hot Springs
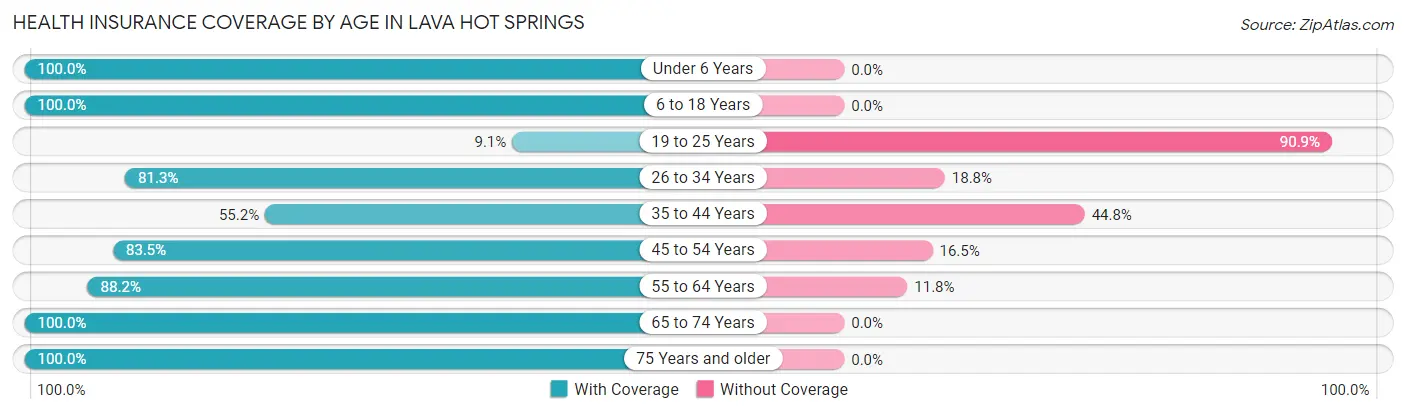
| Age Bracket | With Coverage | Without Coverage |
| Under 6 Years | 10 (100.0%) | 0 (0.0%) |
| 6 to 18 Years | 27 (100.0%) | 0 (0.0%) |
| 19 to 25 Years | 2 (9.1%) | 20 (90.9%) |
| 26 to 34 Years | 13 (81.2%) | 3 (18.8%) |
| 35 to 44 Years | 16 (55.2%) | 13 (44.8%) |
| 45 to 54 Years | 66 (83.5%) | 13 (16.5%) |
| 55 to 64 Years | 45 (88.2%) | 6 (11.8%) |
| 65 to 74 Years | 42 (100.0%) | 0 (0.0%) |
| 75 Years and older | 14 (100.0%) | 0 (0.0%) |
| Total | 235 (81.0%) | 55 (19.0%) |
Health Insurance Coverage by Citizenship Status in Lava Hot Springs
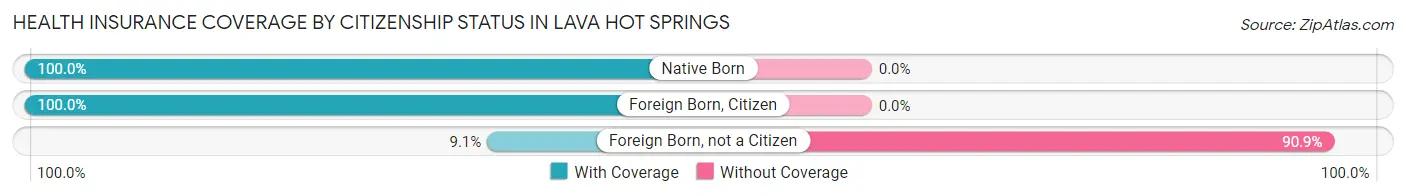
| Citizenship Status | With Coverage | Without Coverage |
| Native Born | 10 (100.0%) | 0 (0.0%) |
| Foreign Born, Citizen | 27 (100.0%) | 0 (0.0%) |
| Foreign Born, not a Citizen | 2 (9.1%) | 20 (90.9%) |
Health Insurance Coverage by Household Income in Lava Hot Springs
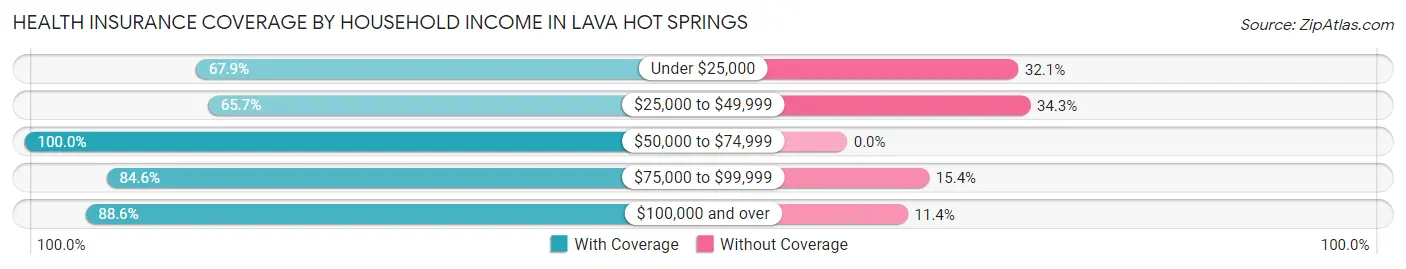
| Household Income | With Coverage | Without Coverage |
| Under $25,000 | 36 (67.9%) | 17 (32.1%) |
| $25,000 to $49,999 | 44 (65.7%) | 23 (34.3%) |
| $50,000 to $74,999 | 52 (100.0%) | 0 (0.0%) |
| $75,000 to $99,999 | 33 (84.6%) | 6 (15.4%) |
| $100,000 and over | 70 (88.6%) | 9 (11.4%) |
Public vs Private Health Insurance Coverage by Age in Lava Hot Springs
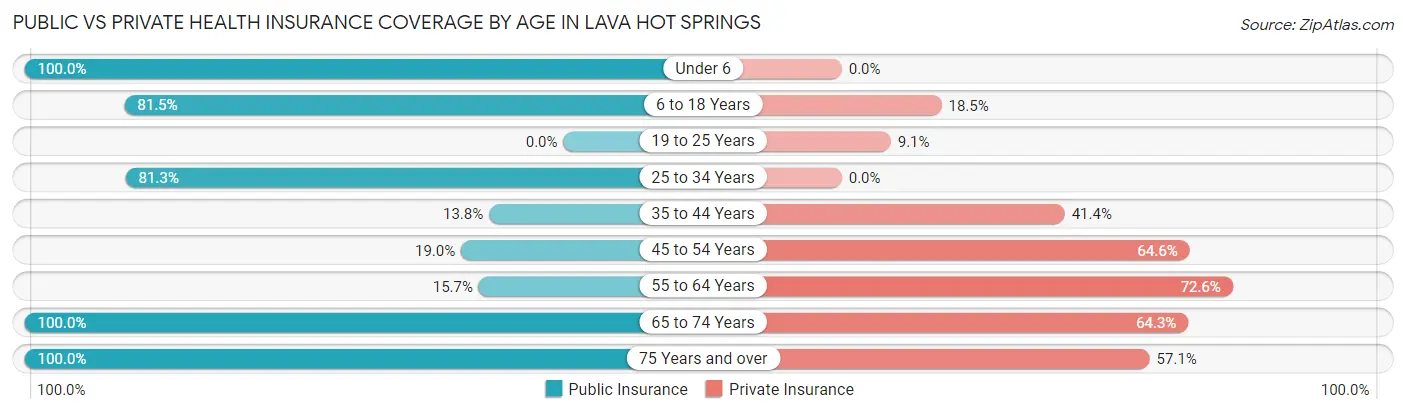
| Age Bracket | Public Insurance | Private Insurance |
| Under 6 | 10 (100.0%) | 0 (0.0%) |
| 6 to 18 Years | 22 (81.5%) | 5 (18.5%) |
| 19 to 25 Years | 0 (0.0%) | 2 (9.1%) |
| 25 to 34 Years | 13 (81.2%) | 0 (0.0%) |
| 35 to 44 Years | 4 (13.8%) | 12 (41.4%) |
| 45 to 54 Years | 15 (19.0%) | 51 (64.6%) |
| 55 to 64 Years | 8 (15.7%) | 37 (72.6%) |
| 65 to 74 Years | 42 (100.0%) | 27 (64.3%) |
| 75 Years and over | 14 (100.0%) | 8 (57.1%) |
| Total | 128 (44.1%) | 142 (49.0%) |
Disability Status by Sex by Age in Lava Hot Springs
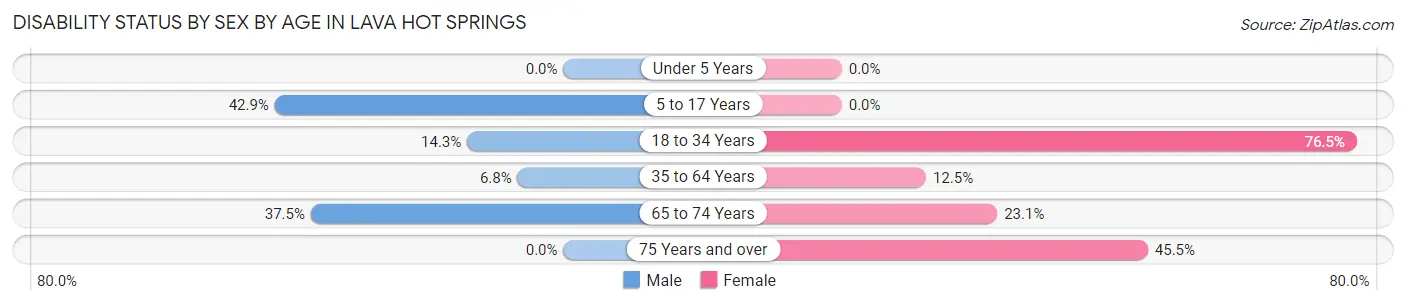
| Age Bracket | Male | Female |
| Under 5 Years | 0 (0.0%) | 0 (0.0%) |
| 5 to 17 Years | 6 (42.9%) | 0 (0.0%) |
| 18 to 34 Years | 3 (14.3%) | 13 (76.5%) |
| 35 to 64 Years | 7 (6.8%) | 7 (12.5%) |
| 65 to 74 Years | 6 (37.5%) | 6 (23.1%) |
| 75 Years and over | 0 (0.0%) | 5 (45.5%) |
Disability Class by Sex by Age in Lava Hot Springs
Disability Class: Hearing Difficulty
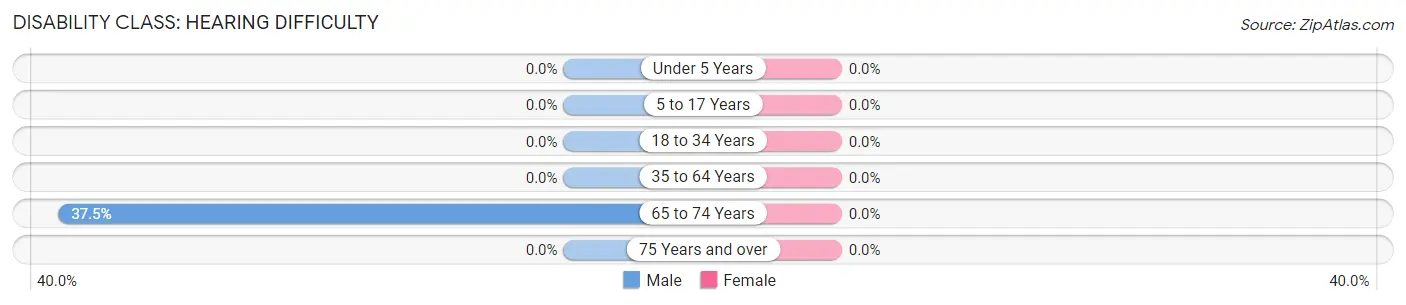
| Age Bracket | Male | Female |
| Under 5 Years | 0 (0.0%) | 0 (0.0%) |
| 5 to 17 Years | 0 (0.0%) | 0 (0.0%) |
| 18 to 34 Years | 0 (0.0%) | 0 (0.0%) |
| 35 to 64 Years | 0 (0.0%) | 0 (0.0%) |
| 65 to 74 Years | 6 (37.5%) | 0 (0.0%) |
| 75 Years and over | 0 (0.0%) | 0 (0.0%) |
Disability Class: Vision Difficulty
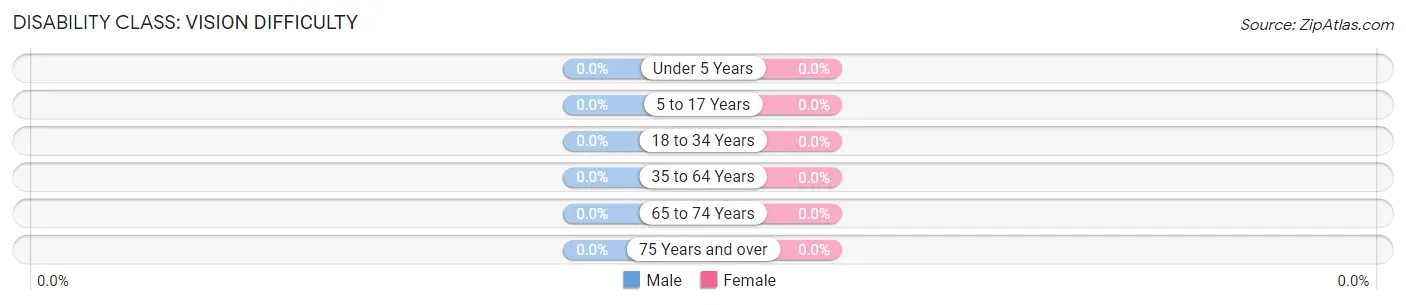
| Age Bracket | Male | Female |
| Under 5 Years | 0 (0.0%) | 0 (0.0%) |
| 5 to 17 Years | 0 (0.0%) | 0 (0.0%) |
| 18 to 34 Years | 0 (0.0%) | 0 (0.0%) |
| 35 to 64 Years | 0 (0.0%) | 0 (0.0%) |
| 65 to 74 Years | 0 (0.0%) | 0 (0.0%) |
| 75 Years and over | 0 (0.0%) | 0 (0.0%) |
Disability Class: Cognitive Difficulty
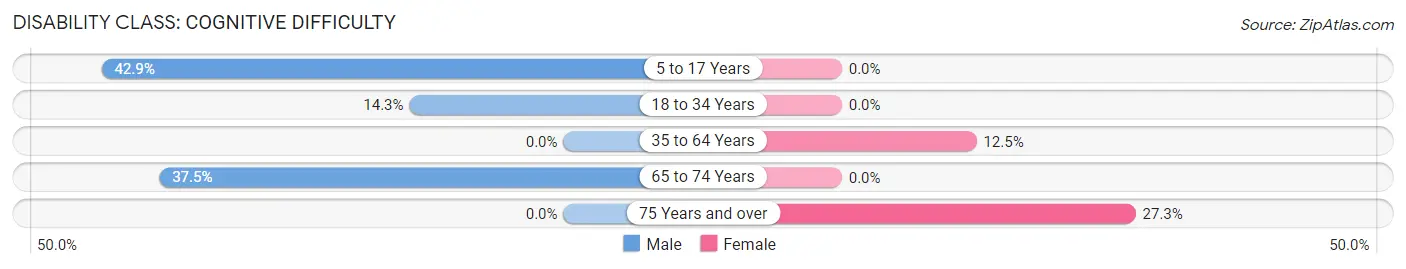
| Age Bracket | Male | Female |
| 5 to 17 Years | 6 (42.9%) | 0 (0.0%) |
| 18 to 34 Years | 3 (14.3%) | 0 (0.0%) |
| 35 to 64 Years | 0 (0.0%) | 7 (12.5%) |
| 65 to 74 Years | 6 (37.5%) | 0 (0.0%) |
| 75 Years and over | 0 (0.0%) | 3 (27.3%) |
Disability Class: Ambulatory Difficulty
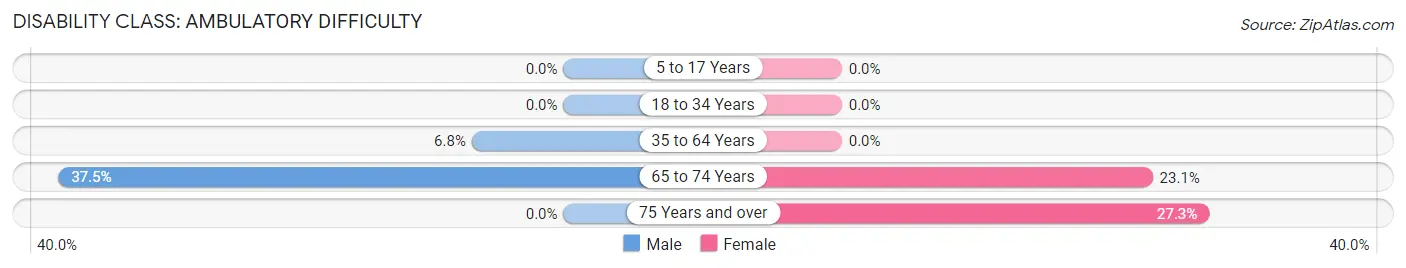
| Age Bracket | Male | Female |
| 5 to 17 Years | 0 (0.0%) | 0 (0.0%) |
| 18 to 34 Years | 0 (0.0%) | 0 (0.0%) |
| 35 to 64 Years | 7 (6.8%) | 0 (0.0%) |
| 65 to 74 Years | 6 (37.5%) | 6 (23.1%) |
| 75 Years and over | 0 (0.0%) | 3 (27.3%) |
Disability Class: Self-Care Difficulty
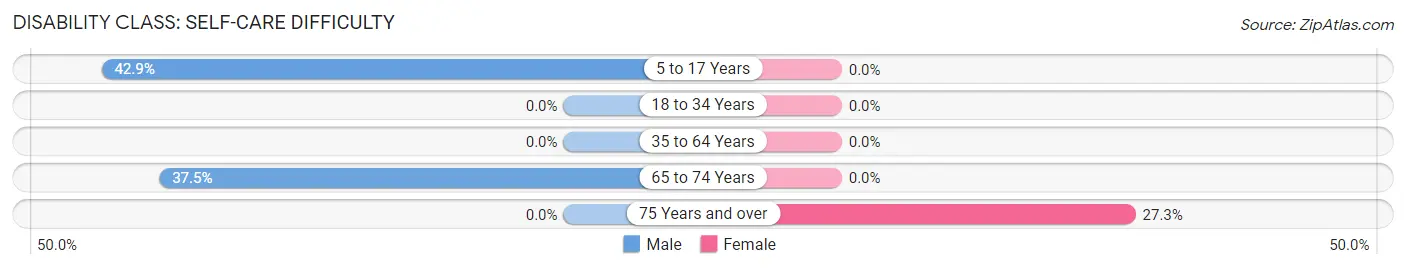
| Age Bracket | Male | Female |
| 5 to 17 Years | 6 (42.9%) | 0 (0.0%) |
| 18 to 34 Years | 0 (0.0%) | 0 (0.0%) |
| 35 to 64 Years | 0 (0.0%) | 0 (0.0%) |
| 65 to 74 Years | 6 (37.5%) | 0 (0.0%) |
| 75 Years and over | 0 (0.0%) | 3 (27.3%) |
Technology Access in Lava Hot Springs
Computing Device Access in Lava Hot Springs
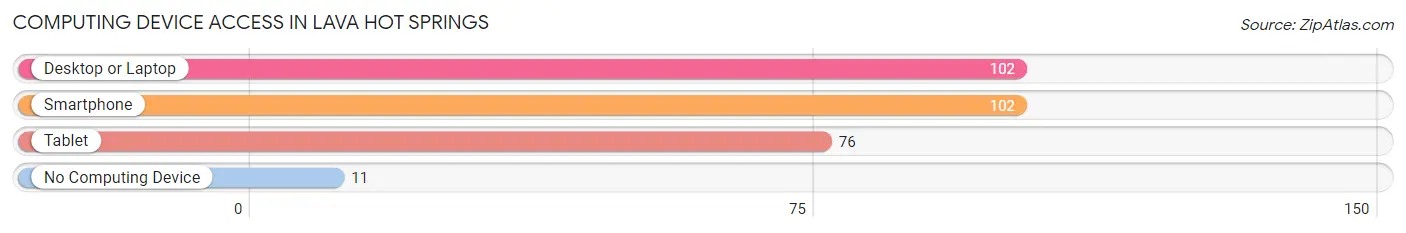
| Device Type | # Households | % Households |
| Desktop or Laptop | 102 | 72.9% |
| Smartphone | 102 | 72.9% |
| Tablet | 76 | 54.3% |
| No Computing Device | 11 | 7.9% |
| Total | 140 | 100.0% |
Internet Access in Lava Hot Springs
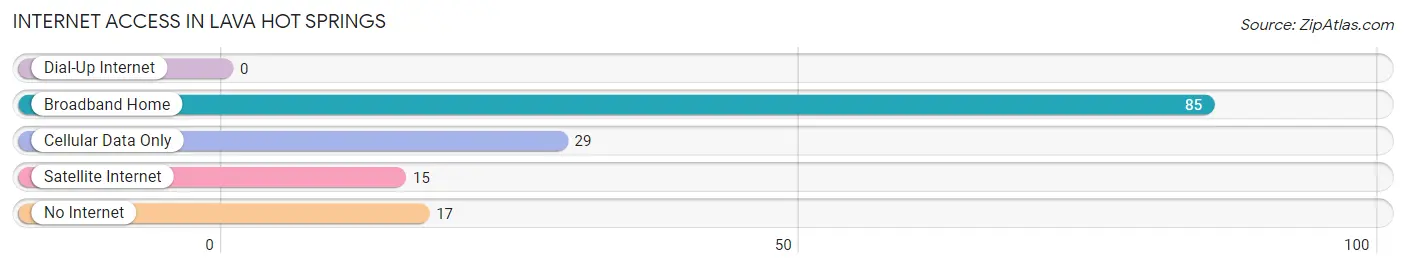
| Internet Type | # Households | % Households |
| Dial-Up Internet | 0 | 0.0% |
| Broadband Home | 85 | 60.7% |
| Cellular Data Only | 29 | 20.7% |
| Satellite Internet | 15 | 10.7% |
| No Internet | 17 | 12.1% |
| Total | 140 | 100.0% |
Lava Hot Springs Summary
Lava Hot Springs is a small city located in southeastern Idaho, in Bannock County. It is situated along the Portneuf River, approximately 30 miles southeast of Pocatello. The city is known for its hot springs, which are a popular tourist destination.
History
The area around Lava Hot Springs has been inhabited for thousands of years. The Shoshone and Bannock tribes were the first to settle in the area, and they used the hot springs for medicinal purposes. The first European settlers arrived in the area in the late 1800s, and the town of Lava Hot Springs was officially established in 1891.
The city was named after the nearby hot springs, which were discovered by a group of prospectors in the late 1800s. The hot springs were believed to have healing properties, and the area quickly became a popular destination for tourists. In the early 1900s, the city began to develop, and several hotels and resorts were built to accommodate the influx of visitors.
Geography
Lava Hot Springs is located in southeastern Idaho, in Bannock County. It is situated along the Portneuf River, approximately 30 miles southeast of Pocatello. The city is located at an elevation of 4,945 feet above sea level.
The city is surrounded by mountains, including the Portneuf Range to the east and the Bannock Range to the west. The city is also located near several natural hot springs, which are a popular tourist destination.
Economy
The economy of Lava Hot Springs is largely based on tourism. The city is home to several resorts and hotels, which cater to visitors who come to enjoy the hot springs. The city also has several restaurants, shops, and other businesses that cater to tourists.
In addition to tourism, the city is also home to several manufacturing and agricultural businesses. The city is home to several farms, which produce a variety of crops, including potatoes, wheat, and hay. The city is also home to several manufacturing businesses, which produce a variety of products, including furniture, clothing, and electronics.
Demographics
As of the 2010 census, the population of Lava Hot Springs was 1,077. The population is predominantly white, with a small percentage of Native American, Hispanic, and African American residents. The median household income is $37,917, and the median age is 37.
The city is served by the Lava Hot Springs School District, which includes an elementary school, a middle school, and a high school. The city is also home to several churches, including the Church of Jesus Christ of Latter-day Saints, the Catholic Church, and the United Methodist Church.
Conclusion
Lava Hot Springs is a small city located in southeastern Idaho, in Bannock County. It is situated along the Portneuf River, approximately 30 miles southeast of Pocatello. The city is known for its hot springs, which are a popular tourist destination. The economy of Lava Hot Springs is largely based on tourism, and the city is home to several resorts and hotels, as well as several manufacturing and agricultural businesses. The population of Lava Hot Springs is predominantly white, with a small percentage of Native American, Hispanic, and African American residents. The city is served by the Lava Hot Springs School District, and is home to several churches.
Common Questions
What is the Total Population of Lava Hot Springs?
Total Population of Lava Hot Springs is 293.
What is the Total Male Population of Lava Hot Springs?
Total Male Population of Lava Hot Springs is 157.
What is the Total Female Population of Lava Hot Springs?
Total Female Population of Lava Hot Springs is 136.
What is the Ratio of Males per 100 Females in Lava Hot Springs?
There are 115.44 Males per 100 Females in Lava Hot Springs.
What is the Ratio of Females per 100 Males in Lava Hot Springs?
There are 86.62 Females per 100 Males in Lava Hot Springs.
What is the Median Population Age in Lava Hot Springs?
Median Population Age in Lava Hot Springs is 50.1 Years.
What is the Average Family Size in Lava Hot Springs
Average Family Size in Lava Hot Springs is 2.9 People.
What is the Average Household Size in Lava Hot Springs
Average Household Size in Lava Hot Springs is 2.1 People.
What is Per Capita Income in Lava Hot Springs?
Per Capita income in Lava Hot Springs is $30,726.
What is the Median Family Income in Lava Hot Springs?
Median Family Income in Lava Hot Springs is $62,708.
What is the Median Household income in Lava Hot Springs?
Median Household Income in Lava Hot Springs is $45,000.
What is Inequality or Gini Index in Lava Hot Springs?
Inequality or Gini Index in Lava Hot Springs is 0.41.
How Large is the Labor Force in Lava Hot Springs?
There are 173 People in the Labor Forcein in Lava Hot Springs.
What is the Percentage of People in the Labor Force in Lava Hot Springs?
67.6% of People are in the Labor Force in Lava Hot Springs.
What is the Unemployment Rate in Lava Hot Springs?
Unemployment Rate in Lava Hot Springs is 6.9%.