Garden Valley, ID
Garden Valley Map
Garden Valley Overview
409
TOTAL POPULATION
198
MALE POPULATION
211
FEMALE POPULATION
93.84
MALES / 100 FEMALES
106.57
FEMALES / 100 MALES
31.5
MEDIAN AGE
3.4
AVG FAMILY SIZE
3.1
AVG HOUSEHOLD SIZE
$26,161
PER CAPITA INCOME
$100,179
AVG FAMILY INCOME
$94,583
AVG HOUSEHOLD INCOME
0.26
INEQUALITY / GINI INDEX
269
LABOR FORCE [ PEOPLE ]
78.4%
PERCENT IN LABOR FORCE
Garden Valley Zip Codes
Garden Valley Area Codes
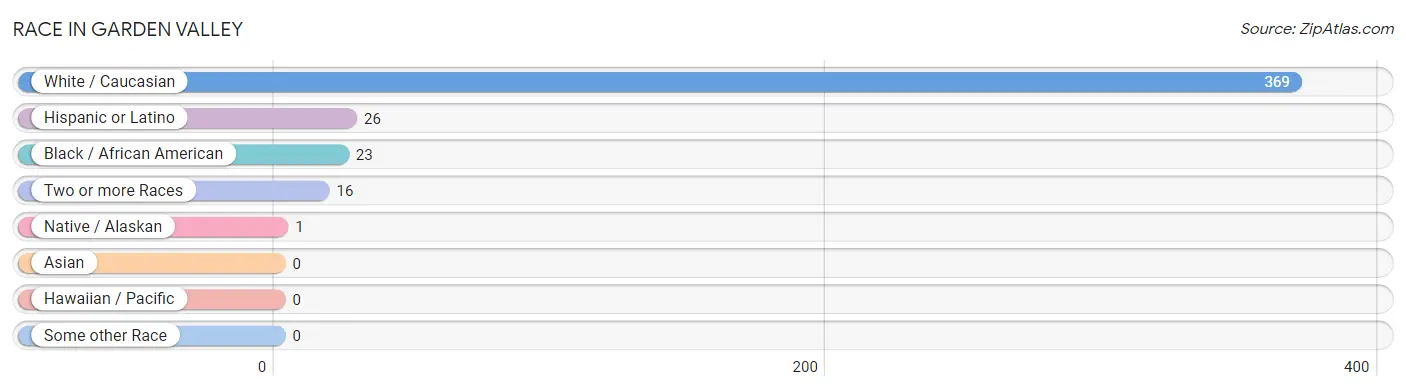
Race in Garden Valley
The most populous races in Garden Valley are White / Caucasian (369 | 90.2%), Hispanic or Latino (26 | 6.4%), and Black / African American (23 | 5.6%).
| Race | # Population | % Population |
| Asian | 0 | 0.0% |
| Black / African American | 23 | 5.6% |
| Hawaiian / Pacific | 0 | 0.0% |
| Hispanic or Latino | 26 | 6.4% |
| Native / Alaskan | 1 | 0.2% |
| White / Caucasian | 369 | 90.2% |
| Two or more Races | 16 | 3.9% |
| Some other Race | 0 | 0.0% |
| Total | 409 | 100.0% |
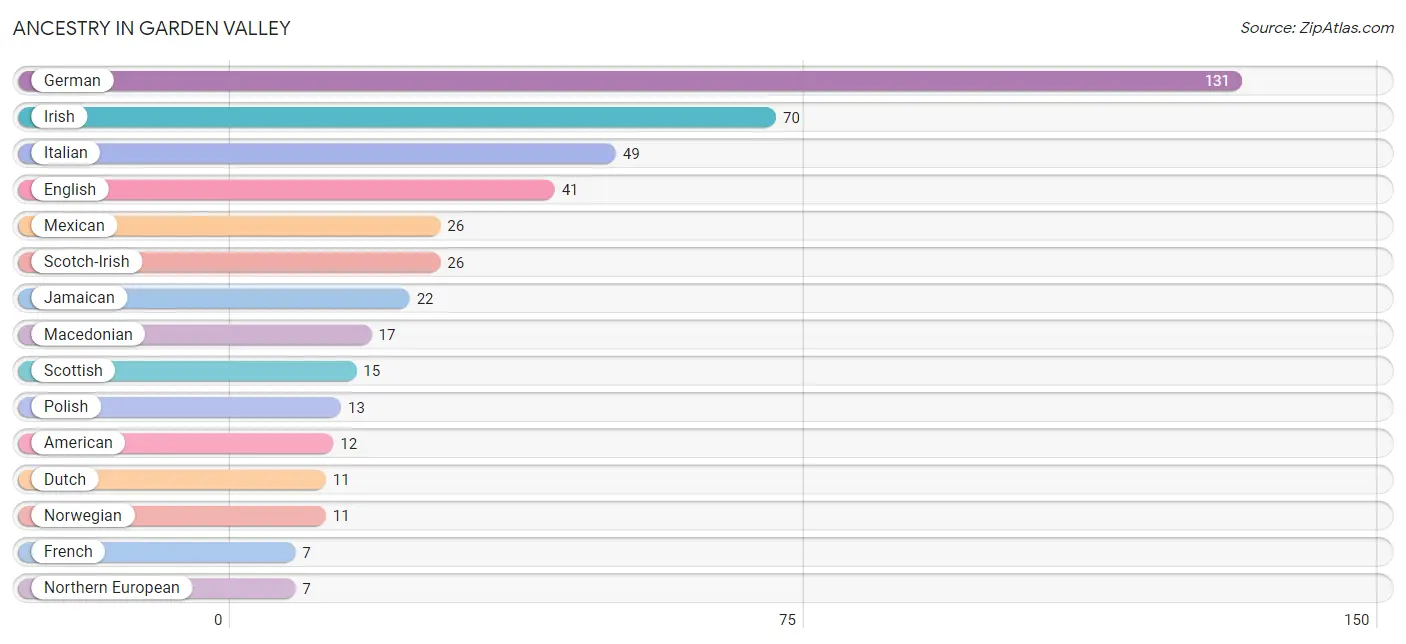
Ancestry in Garden Valley
The most populous ancestries reported in Garden Valley are German (131 | 32.0%), Irish (70 | 17.1%), Italian (49 | 12.0%), English (41 | 10.0%), and Mexican (26 | 6.4%), together accounting for 77.5% of all Garden Valley residents.
| Ancestry | # Population | % Population |
| American | 12 | 2.9% |
| Austrian | 6 | 1.5% |
| Dutch | 11 | 2.7% |
| English | 41 | 10.0% |
| French | 7 | 1.7% |
| German | 131 | 32.0% |
| Irish | 70 | 17.1% |
| Italian | 49 | 12.0% |
| Jamaican | 22 | 5.4% |
| Macedonian | 17 | 4.2% |
| Mexican | 26 | 6.4% |
| Northern European | 7 | 1.7% |
| Norwegian | 11 | 2.7% |
| Polish | 13 | 3.2% |
| Scotch-Irish | 26 | 6.4% |
| Scottish | 15 | 3.7% |
| Swedish | 7 | 1.7% | View All 17 Rows |
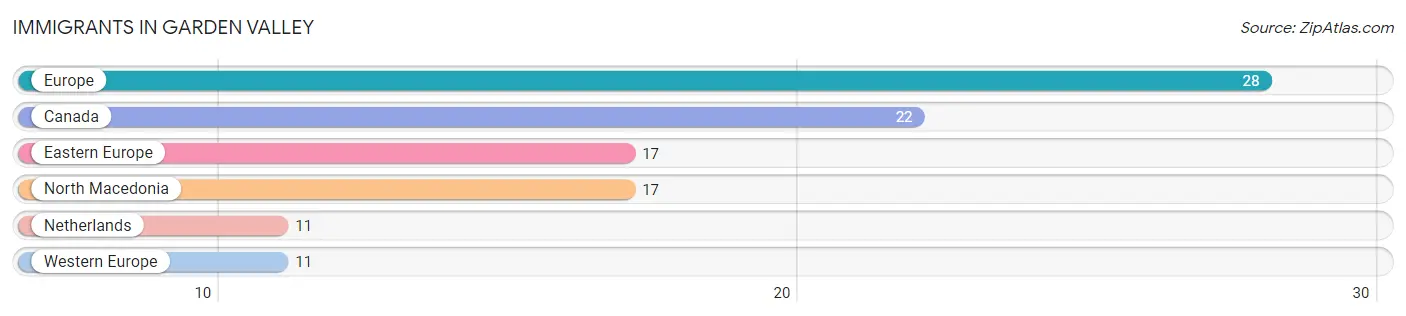
Immigrants in Garden Valley
The most numerous immigrant groups reported in Garden Valley came from Europe (28 | 6.9%), Canada (22 | 5.4%), Eastern Europe (17 | 4.2%), North Macedonia (17 | 4.2%), and Netherlands (11 | 2.7%), together accounting for 23.2% of all Garden Valley residents.
| Immigration Origin | # Population | % Population |
| Canada | 22 | 5.4% |
| Eastern Europe | 17 | 4.2% |
| Europe | 28 | 6.9% |
| Netherlands | 11 | 2.7% |
| North Macedonia | 17 | 4.2% |
| Western Europe | 11 | 2.7% | View All 6 Rows |
Sex and Age in Garden Valley
Sex and Age in Garden Valley
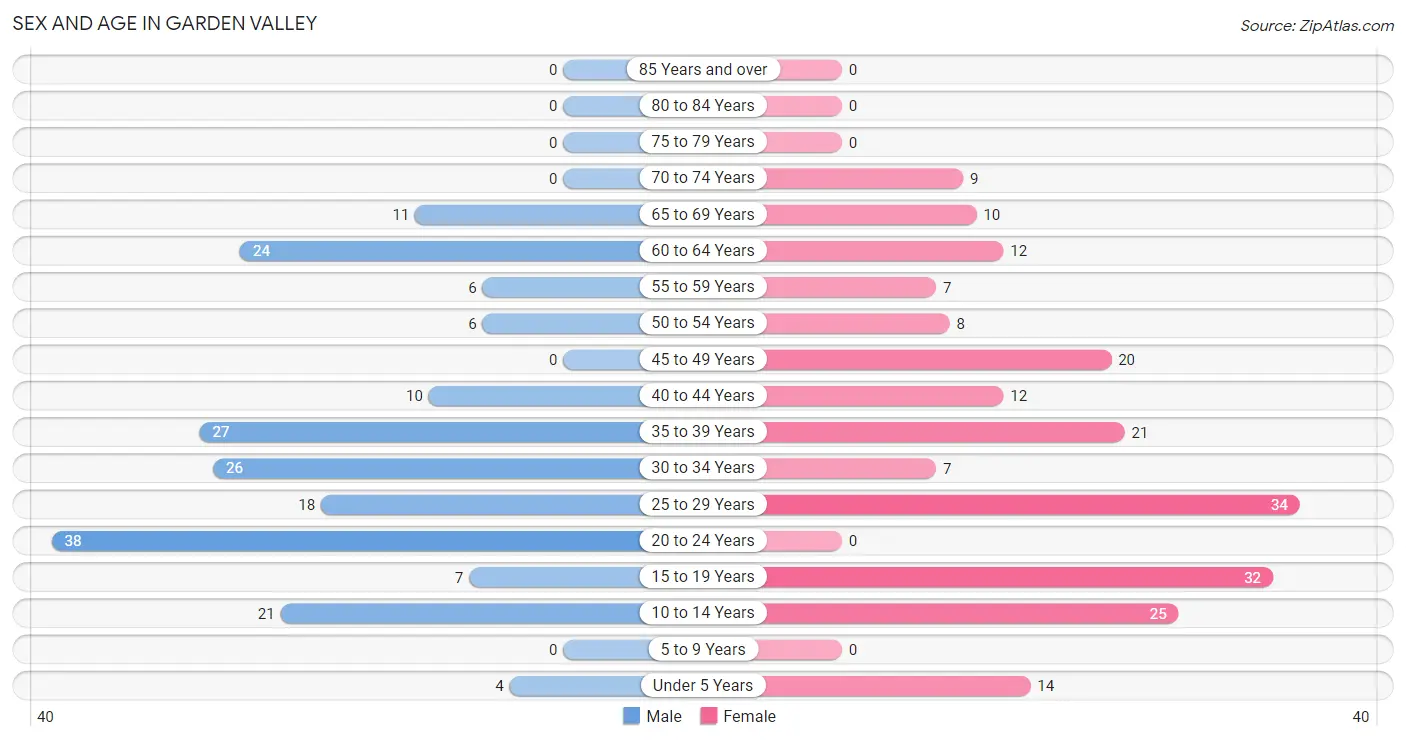
The most populous age groups in Garden Valley are 20 to 24 Years (38 | 19.2%) for men and 25 to 29 Years (34 | 16.1%) for women.
| Age Bracket | Male | Female |
| Under 5 Years | 4 (2.0%) | 14 (6.6%) |
| 5 to 9 Years | 0 (0.0%) | 0 (0.0%) |
| 10 to 14 Years | 21 (10.6%) | 25 (11.8%) |
| 15 to 19 Years | 7 (3.5%) | 32 (15.2%) |
| 20 to 24 Years | 38 (19.2%) | 0 (0.0%) |
| 25 to 29 Years | 18 (9.1%) | 34 (16.1%) |
| 30 to 34 Years | 26 (13.1%) | 7 (3.3%) |
| 35 to 39 Years | 27 (13.6%) | 21 (10.0%) |
| 40 to 44 Years | 10 (5.1%) | 12 (5.7%) |
| 45 to 49 Years | 0 (0.0%) | 20 (9.5%) |
| 50 to 54 Years | 6 (3.0%) | 8 (3.8%) |
| 55 to 59 Years | 6 (3.0%) | 7 (3.3%) |
| 60 to 64 Years | 24 (12.1%) | 12 (5.7%) |
| 65 to 69 Years | 11 (5.6%) | 10 (4.7%) |
| 70 to 74 Years | 0 (0.0%) | 9 (4.3%) |
| 75 to 79 Years | 0 (0.0%) | 0 (0.0%) |
| 80 to 84 Years | 0 (0.0%) | 0 (0.0%) |
| 85 Years and over | 0 (0.0%) | 0 (0.0%) |
| Total | 198 (100.0%) | 211 (100.0%) |
Families and Households in Garden Valley
Median Family Size in Garden Valley
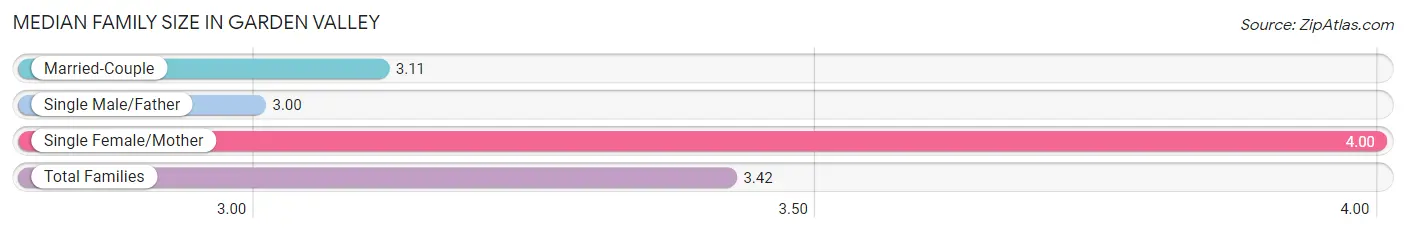
The median family size in Garden Valley is 3.42 persons per family, with single female/mother families (34 | 35.8%) accounting for the largest median family size of 4 persons per family. On the other hand, single male/father families (6 | 6.3%) represent the smallest median family size with 3.00 persons per family.
| Family Type | # Families | Family Size |
| Married-Couple | 55 (57.9%) | 3.11 |
| Single Male/Father | 6 (6.3%) | 3.00 |
| Single Female/Mother | 34 (35.8%) | 4.00 |
| Total Families | 95 (100.0%) | 3.42 |
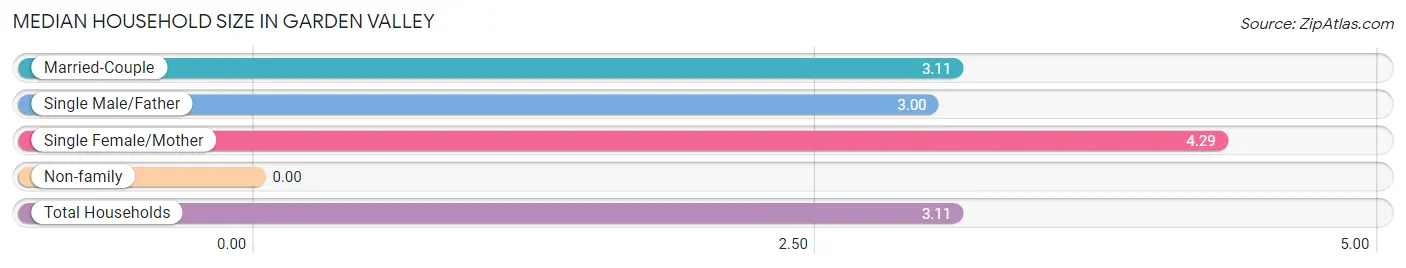
Median Household Size in Garden Valley
| Household Type | # Households | Household Size |
| Married-Couple | 55 (48.2%) | 3.11 |
| Single Male/Father | 6 (5.3%) | 3.00 |
| Single Female/Mother | 34 (29.8%) | 4.29 |
| Non-family | 19 (16.7%) | - |
| Total Households | 114 (100.0%) | 3.11 |
Household Size by Marriage Status in Garden Valley
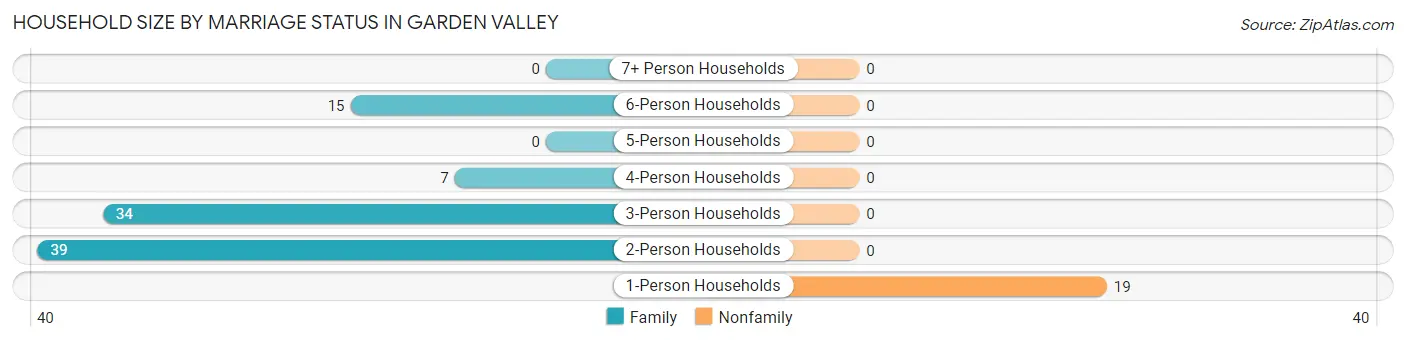
Out of a total of 114 households in Garden Valley, 95 (83.3%) are family households, while 19 (16.7%) are nonfamily households. The most numerous type of family households are 2-person households, comprising 39, and the most common type of nonfamily households are 1-person households, comprising 19.
| Household Size | Family Households | Nonfamily Households |
| 1-Person Households | - | 19 (16.7%) |
| 2-Person Households | 39 (34.2%) | 0 (0.0%) |
| 3-Person Households | 34 (29.8%) | 0 (0.0%) |
| 4-Person Households | 7 (6.1%) | 0 (0.0%) |
| 5-Person Households | 0 (0.0%) | 0 (0.0%) |
| 6-Person Households | 15 (13.2%) | 0 (0.0%) |
| 7+ Person Households | 0 (0.0%) | 0 (0.0%) |
| Total | 95 (83.3%) | 19 (16.7%) |
Female Fertility in Garden Valley
Fertility by Age in Garden Valley
Average fertility rate in Garden Valley is 167.0 births per 1,000 women. Women in the age bracket of 35 to 50 years have the highest fertility rate with 396.0 births per 1,000 women. Women in the age bracket of 35 to 50 years acount for 100.0% of all women with births.
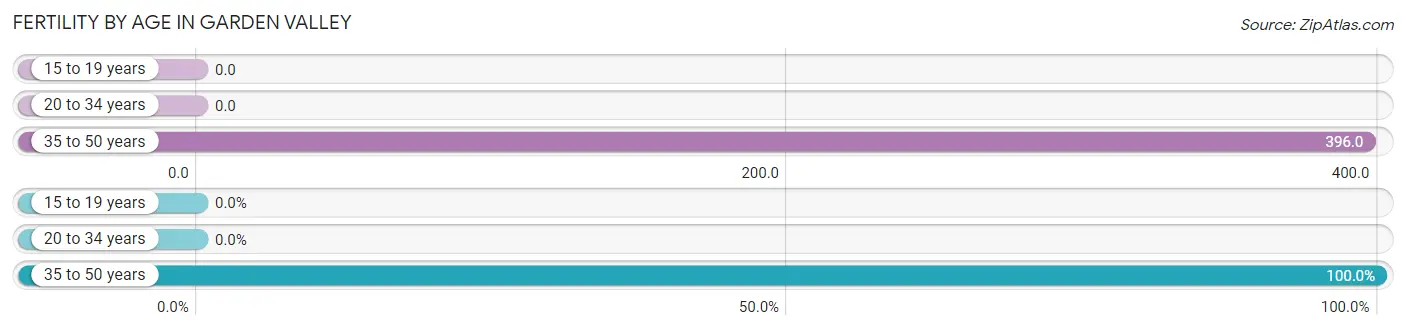
| Age Bracket | Women with Births | Births / 1,000 Women |
| 15 to 19 years | 0 (0.0%) | 0.0 |
| 20 to 34 years | 0 (0.0%) | 0.0 |
| 35 to 50 years | 21 (100.0%) | 396.0 |
| Total | 21 (100.0%) | 167.0 |
Fertility by Age by Marriage Status in Garden Valley
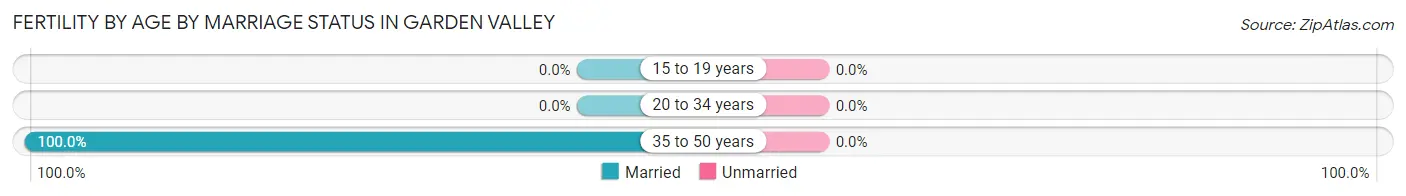
| Age Bracket | Married | Unmarried |
| 15 to 19 years | 0 (0.0%) | 0 (0.0%) |
| 20 to 34 years | 0 (0.0%) | 0 (0.0%) |
| 35 to 50 years | 21 (100.0%) | 0 (0.0%) |
| Total | 21 (100.0%) | 0 (0.0%) |
Fertility by Education in Garden Valley
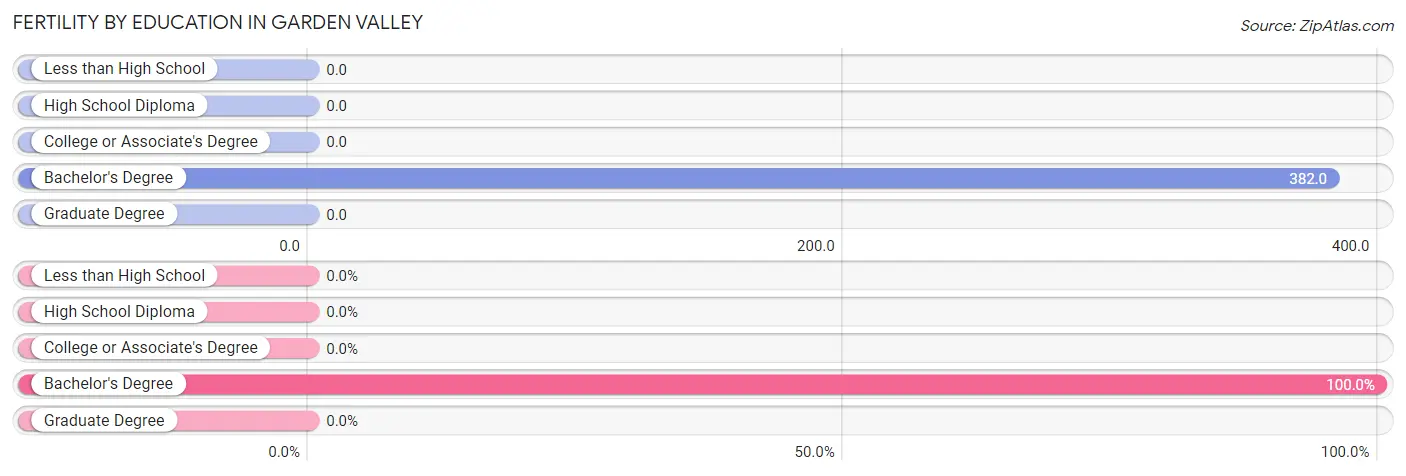
| Educational Attainment | Women with Births | Births / 1,000 Women |
| Less than High School | 0 (0.0%) | 0.0 |
| High School Diploma | 0 (0.0%) | 0.0 |
| College or Associate's Degree | 0 (0.0%) | 0.0 |
| Bachelor's Degree | 21 (100.0%) | 382.0 |
| Graduate Degree | 0 (0.0%) | 0.0 |
| Total | 21 (100.0%) | 167.0 |
Fertility by Education by Marriage Status in Garden Valley
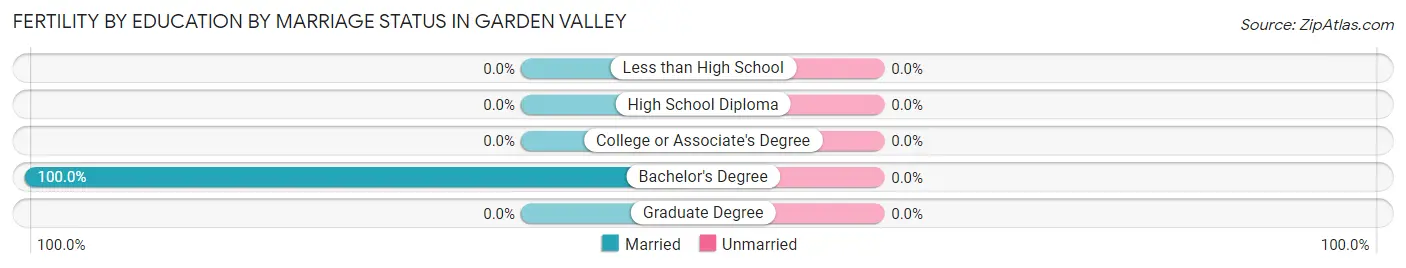
| Educational Attainment | Married | Unmarried |
| Less than High School | 0 (0.0%) | 0 (0.0%) |
| High School Diploma | 0 (0.0%) | 0 (0.0%) |
| College or Associate's Degree | 0 (0.0%) | 0 (0.0%) |
| Bachelor's Degree | 21 (100.0%) | 0 (0.0%) |
| Graduate Degree | 0 (0.0%) | 0 (0.0%) |
| Total | 21 (100.0%) | 0 (0.0%) |
Income in Garden Valley
Income Overview in Garden Valley
Per Capita Income in Garden Valley is $26,161, while median incomes of families and households are $100,179 and $94,583 respectively.
| Characteristic | Number | Measure |
| Per Capita Income | 409 | $26,161 |
| Median Family Income | 95 | $100,179 |
| Mean Family Income | 95 | $81,562 |
| Median Household Income | 114 | $94,583 |
| Mean Household Income | 114 | $77,280 |
| Income Deficit | 95 | $0 |
| Wage / Income Gap (%) | 409 | 0.00% |
| Wage / Income Gap ($) | 409 | 100.00¢ per $1 |
| Gini / Inequality Index | 409 | 0.26 |
Earnings by Sex in Garden Valley
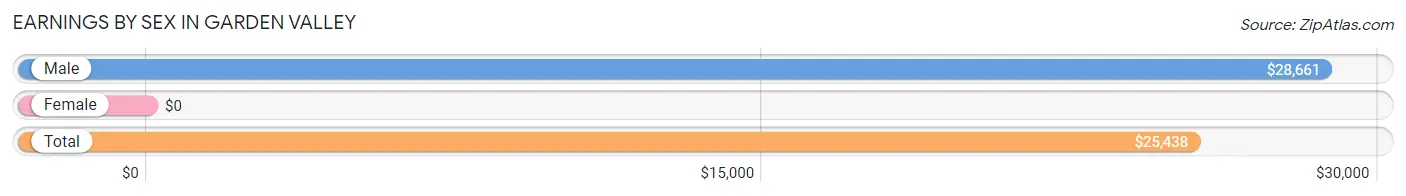
| Sex | Number | Average Earnings |
| Male | 139 (51.7%) | $28,661 |
| Female | 130 (48.3%) | $0 |
| Total | 269 (100.0%) | $25,438 |
Earnings by Sex by Income Bracket in Garden Valley
The most common earnings brackets in Garden Valley are $25,000 to $29,999 for men (34 | 24.5%) and $5,000 to $7,499 for women (36 | 27.7%).
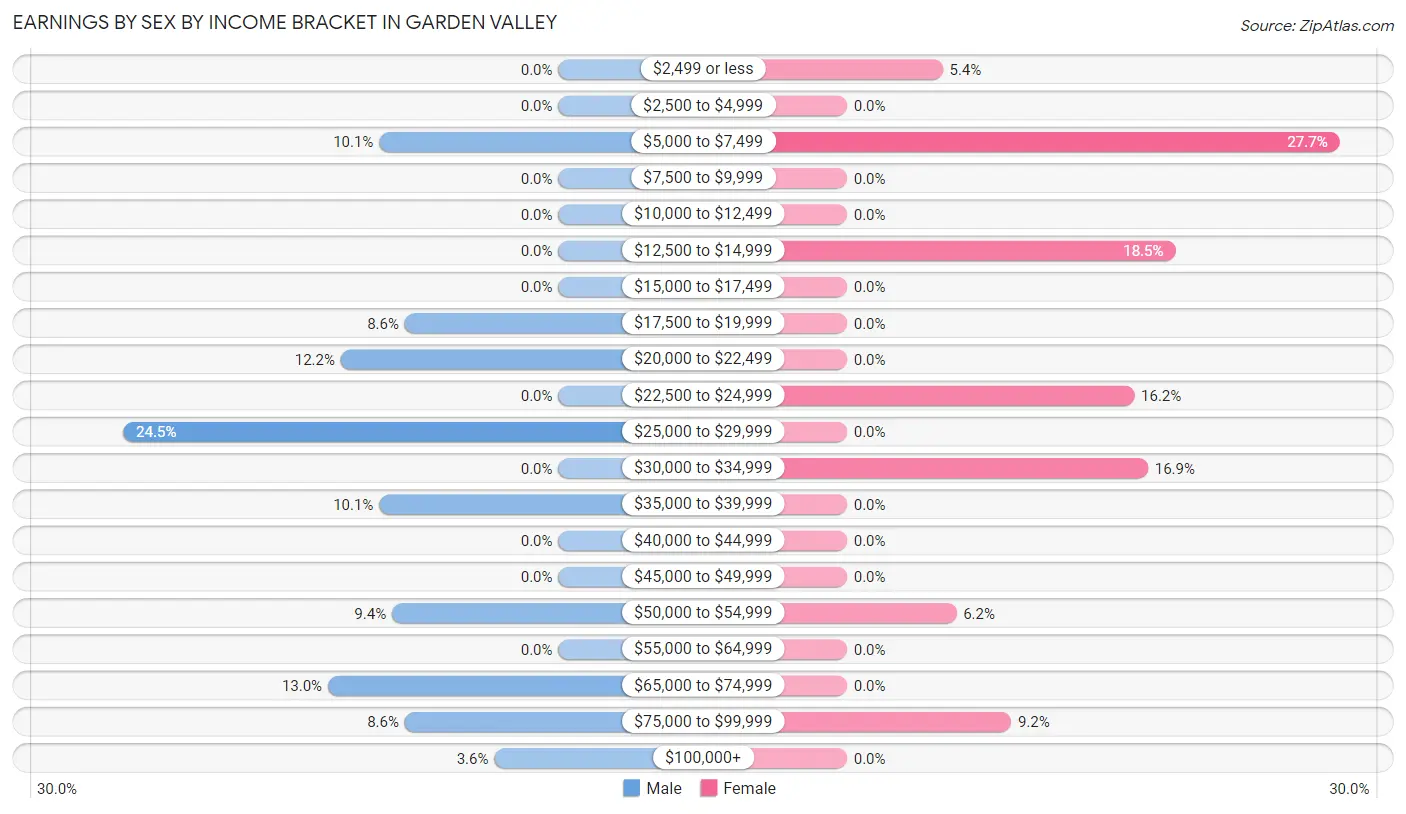
| Income | Male | Female |
| $2,499 or less | 0 (0.0%) | 7 (5.4%) |
| $2,500 to $4,999 | 0 (0.0%) | 0 (0.0%) |
| $5,000 to $7,499 | 14 (10.1%) | 36 (27.7%) |
| $7,500 to $9,999 | 0 (0.0%) | 0 (0.0%) |
| $10,000 to $12,499 | 0 (0.0%) | 0 (0.0%) |
| $12,500 to $14,999 | 0 (0.0%) | 24 (18.5%) |
| $15,000 to $17,499 | 0 (0.0%) | 0 (0.0%) |
| $17,500 to $19,999 | 12 (8.6%) | 0 (0.0%) |
| $20,000 to $22,499 | 17 (12.2%) | 0 (0.0%) |
| $22,500 to $24,999 | 0 (0.0%) | 21 (16.2%) |
| $25,000 to $29,999 | 34 (24.5%) | 0 (0.0%) |
| $30,000 to $34,999 | 0 (0.0%) | 22 (16.9%) |
| $35,000 to $39,999 | 14 (10.1%) | 0 (0.0%) |
| $40,000 to $44,999 | 0 (0.0%) | 0 (0.0%) |
| $45,000 to $49,999 | 0 (0.0%) | 0 (0.0%) |
| $50,000 to $54,999 | 13 (9.3%) | 8 (6.1%) |
| $55,000 to $64,999 | 0 (0.0%) | 0 (0.0%) |
| $65,000 to $74,999 | 18 (13.0%) | 0 (0.0%) |
| $75,000 to $99,999 | 12 (8.6%) | 12 (9.2%) |
| $100,000+ | 5 (3.6%) | 0 (0.0%) |
| Total | 139 (100.0%) | 130 (100.0%) |
Earnings by Sex by Educational Attainment in Garden Valley
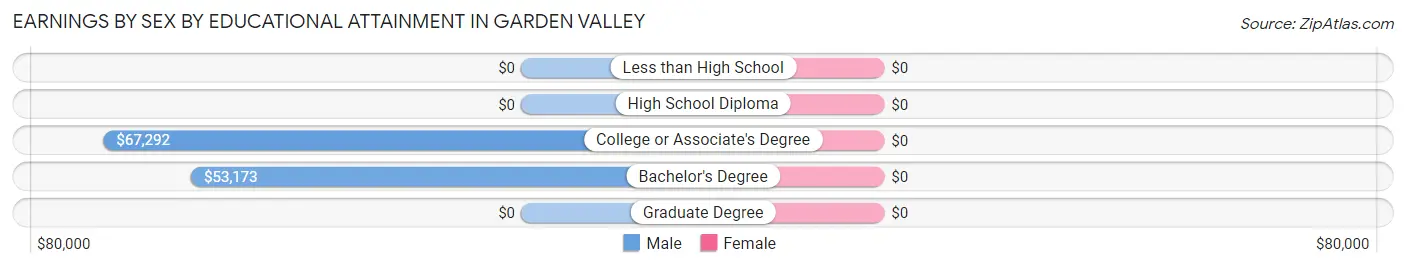
| Educational Attainment | Male Income | Female Income |
| Less than High School | - | - |
| High School Diploma | - | - |
| College or Associate's Degree | $67,292 | $0 |
| Bachelor's Degree | $53,173 | $0 |
| Graduate Degree | - | - |
| Total | $39,107 | $23,869 |
Family Income in Garden Valley
Family Income Brackets in Garden Valley
According to the Garden Valley family income data, there are 48 families falling into the $100,000 to $149,999 income range, which is the most common income bracket and makes up 50.5% of all families.
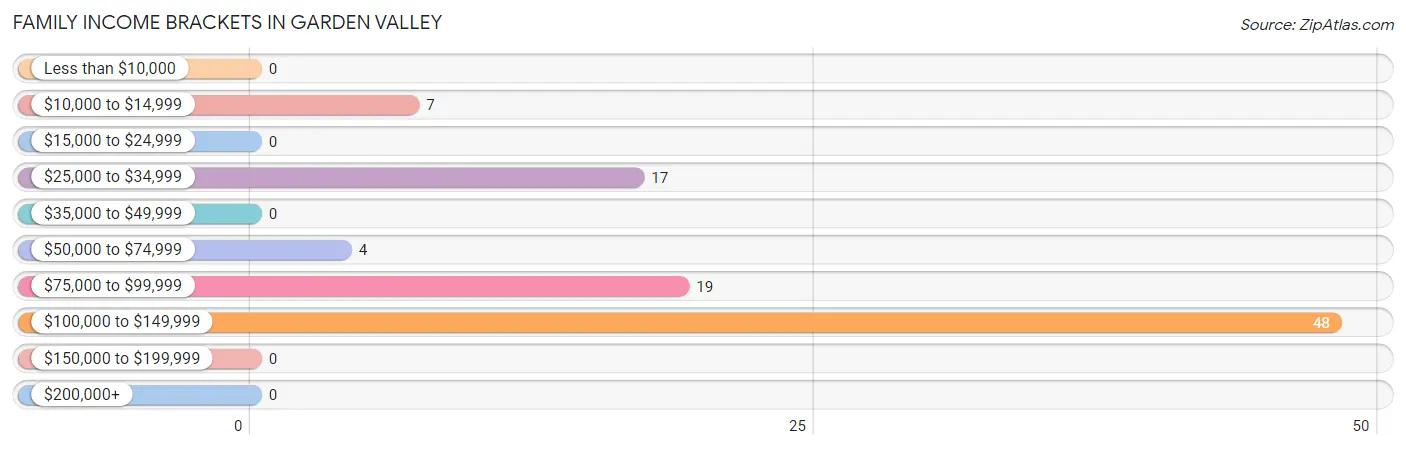
| Income Bracket | # Families | % Families |
| Less than $10,000 | 0 | 0.0% |
| $10,000 to $14,999 | 7 | 7.4% |
| $15,000 to $24,999 | 0 | 0.0% |
| $25,000 to $34,999 | 17 | 17.9% |
| $35,000 to $49,999 | 0 | 0.0% |
| $50,000 to $74,999 | 4 | 4.2% |
| $75,000 to $99,999 | 19 | 20.0% |
| $100,000 to $149,999 | 48 | 50.5% |
| $150,000 to $199,999 | 0 | 0.0% |
| $200,000+ | 0 | 0.0% |
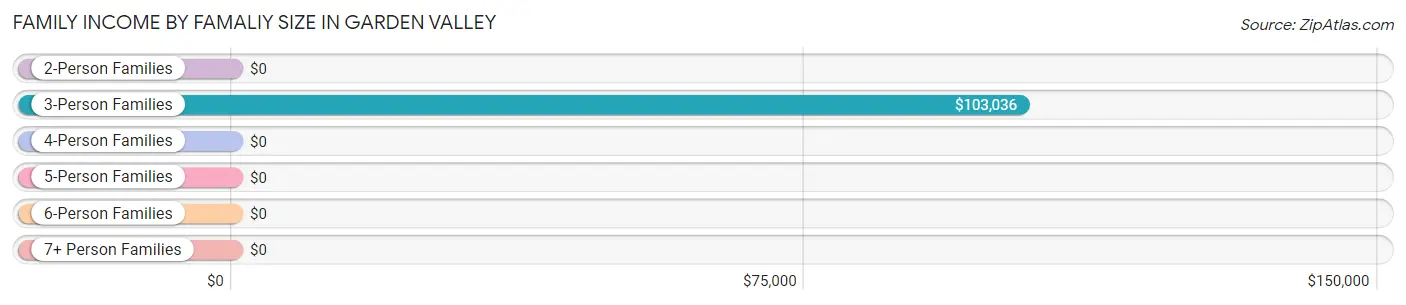
Family Income by Famaliy Size in Garden Valley
3-person families (27 | 28.4%) account for the highest median family income in Garden Valley with $103,036 per family, while 3-person families (27 | 28.4%) have the highest median income of $34,345 per family member.
| Income Bracket | # Families | Median Income |
| 2-Person Families | 46 (48.4%) | $0 |
| 3-Person Families | 27 (28.4%) | $103,036 |
| 4-Person Families | 7 (7.4%) | $0 |
| 5-Person Families | 0 (0.0%) | $0 |
| 6-Person Families | 15 (15.8%) | $0 |
| 7+ Person Families | 0 (0.0%) | $0 |
| Total | 95 (100.0%) | $100,179 |
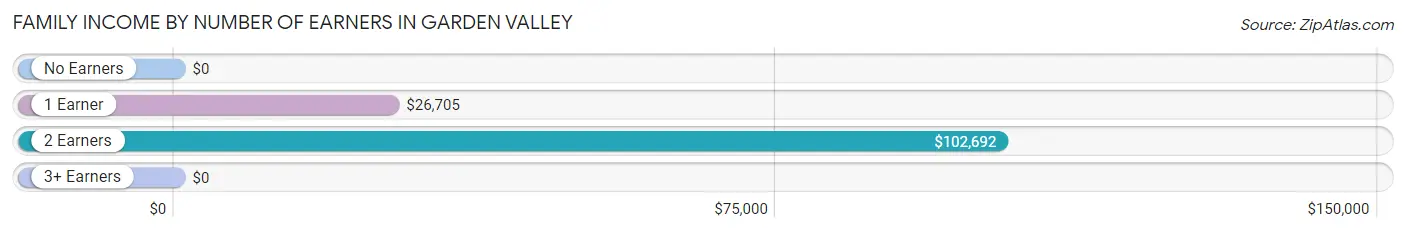
Family Income by Number of Earners in Garden Valley
| Number of Earners | # Families | Median Income |
| No Earners | 4 (4.2%) | $0 |
| 1 Earner | 29 (30.5%) | $26,705 |
| 2 Earners | 40 (42.1%) | $102,692 |
| 3+ Earners | 22 (23.2%) | $0 |
| Total | 95 (100.0%) | $100,179 |
Household Income in Garden Valley
Household Income Brackets in Garden Valley
With 48 households falling in the category, the $100,000 to $149,999 income range is the most frequent in Garden Valley, accounting for 42.1% of all households.
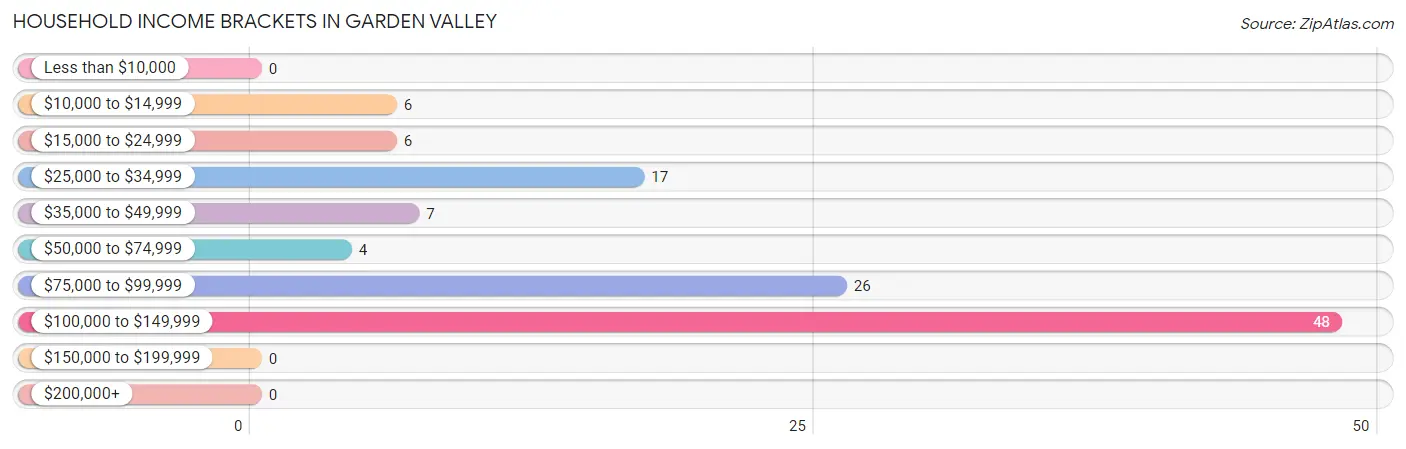
| Income Bracket | # Households | % Households |
| Less than $10,000 | 0 | 0.0% |
| $10,000 to $14,999 | 6 | 5.3% |
| $15,000 to $24,999 | 6 | 5.3% |
| $25,000 to $34,999 | 17 | 14.9% |
| $35,000 to $49,999 | 7 | 6.1% |
| $50,000 to $74,999 | 4 | 3.5% |
| $75,000 to $99,999 | 26 | 22.8% |
| $100,000 to $149,999 | 48 | 42.1% |
| $150,000 to $199,999 | 0 | 0.0% |
| $200,000+ | 0 | 0.0% |
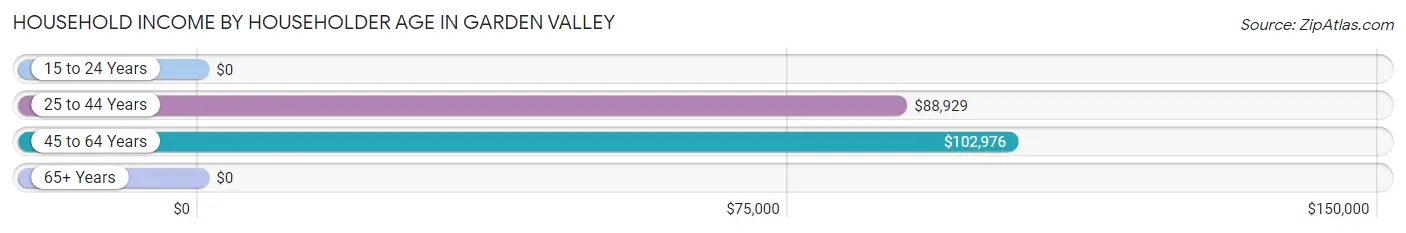
Household Income by Householder Age in Garden Valley
The median household income in Garden Valley is $94,583, with the highest median household income of $102,976 found in the 45 to 64 years age bracket for the primary householder. A total of 60 households (52.6%) fall into this category.
| Income Bracket | # Households | Median Income |
| 15 to 24 Years | 0 (0.0%) | $0 |
| 25 to 44 Years | 44 (38.6%) | $88,929 |
| 45 to 64 Years | 60 (52.6%) | $102,976 |
| 65+ Years | 10 (8.8%) | $0 |
| Total | 114 (100.0%) | $94,583 |
Poverty in Garden Valley
Income Below Poverty by Sex and Age in Garden Valley
With 14.1% poverty level for males and 6.5% for females among the residents of Garden Valley, 12 to 14 year old males and 55 to 64 year old females are the most vulnerable to poverty, with 8 males (38.1%) and 7 females (36.8%) in their respective age groups living below the poverty level.
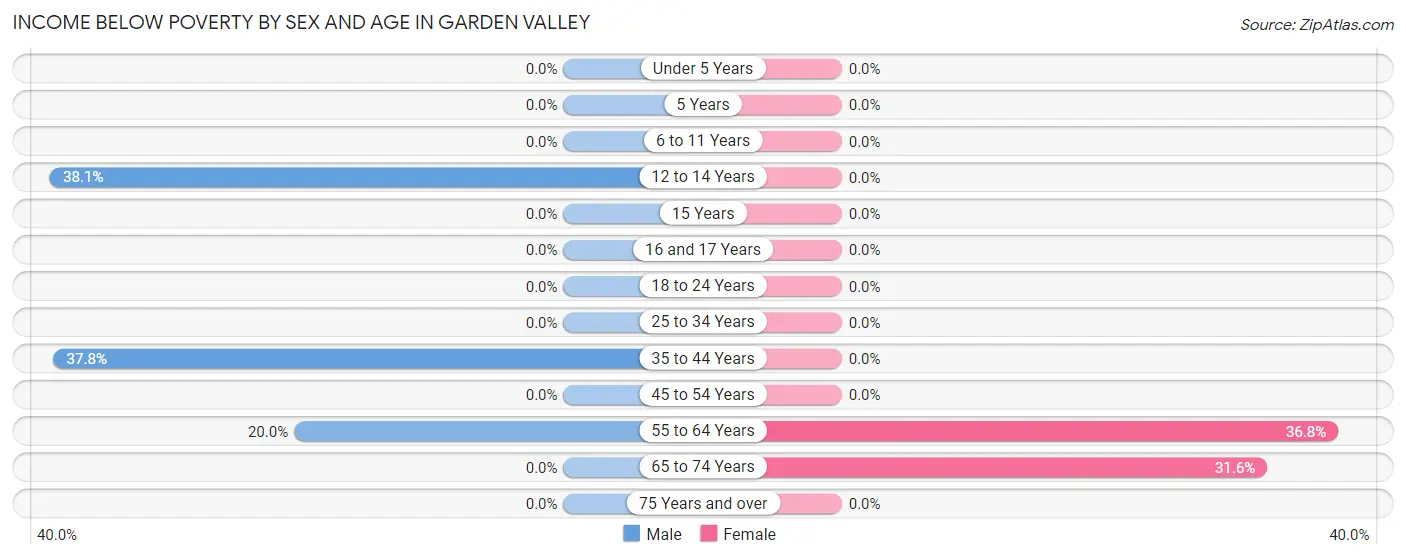
| Age Bracket | Male | Female |
| Under 5 Years | 0 (0.0%) | 0 (0.0%) |
| 5 Years | 0 (0.0%) | 0 (0.0%) |
| 6 to 11 Years | 0 (0.0%) | 0 (0.0%) |
| 12 to 14 Years | 8 (38.1%) | 0 (0.0%) |
| 15 Years | 0 (0.0%) | 0 (0.0%) |
| 16 and 17 Years | 0 (0.0%) | 0 (0.0%) |
| 18 to 24 Years | 0 (0.0%) | 0 (0.0%) |
| 25 to 34 Years | 0 (0.0%) | 0 (0.0%) |
| 35 to 44 Years | 14 (37.8%) | 0 (0.0%) |
| 45 to 54 Years | 0 (0.0%) | 0 (0.0%) |
| 55 to 64 Years | 6 (20.0%) | 7 (36.8%) |
| 65 to 74 Years | 0 (0.0%) | 6 (31.6%) |
| 75 Years and over | 0 (0.0%) | 0 (0.0%) |
| Total | 28 (14.1%) | 13 (6.5%) |
Income Above Poverty by Sex and Age in Garden Valley
According to the poverty statistics in Garden Valley, males aged under 5 years and females aged under 5 years are the age groups that are most secure financially, with 100.0% of males and 100.0% of females in these age groups living above the poverty line.
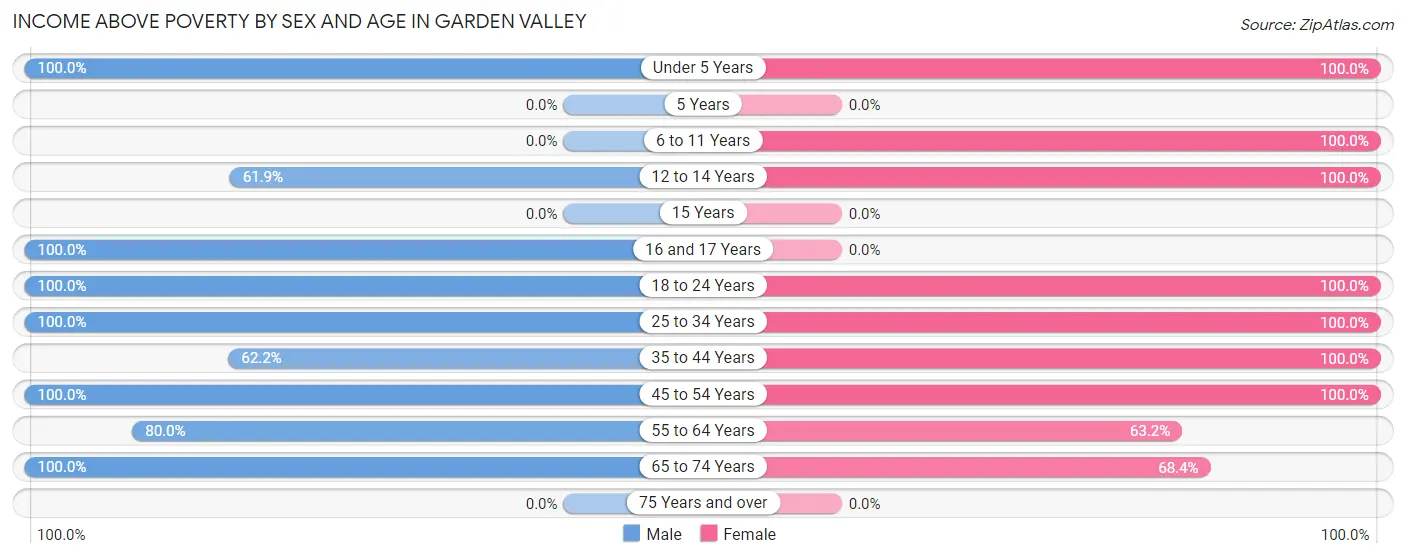
| Age Bracket | Male | Female |
| Under 5 Years | 4 (100.0%) | 14 (100.0%) |
| 5 Years | 0 (0.0%) | 0 (0.0%) |
| 6 to 11 Years | 0 (0.0%) | 9 (100.0%) |
| 12 to 14 Years | 13 (61.9%) | 10 (100.0%) |
| 15 Years | 0 (0.0%) | 0 (0.0%) |
| 16 and 17 Years | 7 (100.0%) | 0 (0.0%) |
| 18 to 24 Years | 38 (100.0%) | 27 (100.0%) |
| 25 to 34 Years | 44 (100.0%) | 41 (100.0%) |
| 35 to 44 Years | 23 (62.2%) | 33 (100.0%) |
| 45 to 54 Years | 6 (100.0%) | 28 (100.0%) |
| 55 to 64 Years | 24 (80.0%) | 12 (63.2%) |
| 65 to 74 Years | 11 (100.0%) | 13 (68.4%) |
| 75 Years and over | 0 (0.0%) | 0 (0.0%) |
| Total | 170 (85.9%) | 187 (93.5%) |
Income Below Poverty Among Married-Couple Families in Garden Valley
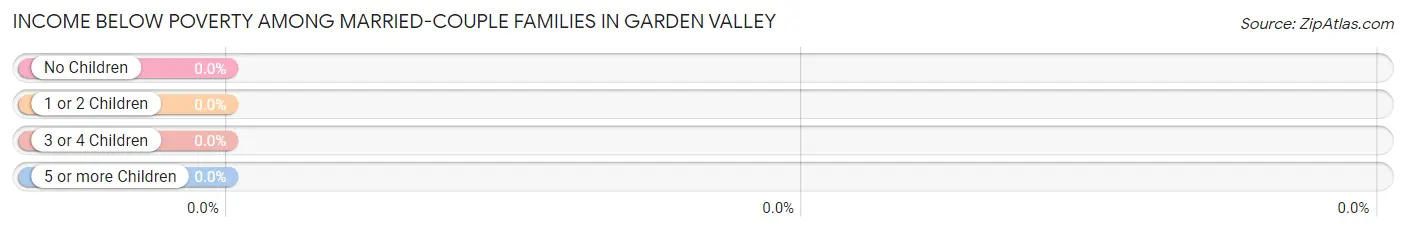
| Children | Above Poverty | Below Poverty |
| No Children | 33 (100.0%) | 0 (0.0%) |
| 1 or 2 Children | 22 (100.0%) | 0 (0.0%) |
| 3 or 4 Children | 0 (0.0%) | 0 (0.0%) |
| 5 or more Children | 0 (0.0%) | 0 (0.0%) |
| Total | 55 (100.0%) | 0 (0.0%) |
Income Below Poverty Among Single-Parent Households in Garden Valley
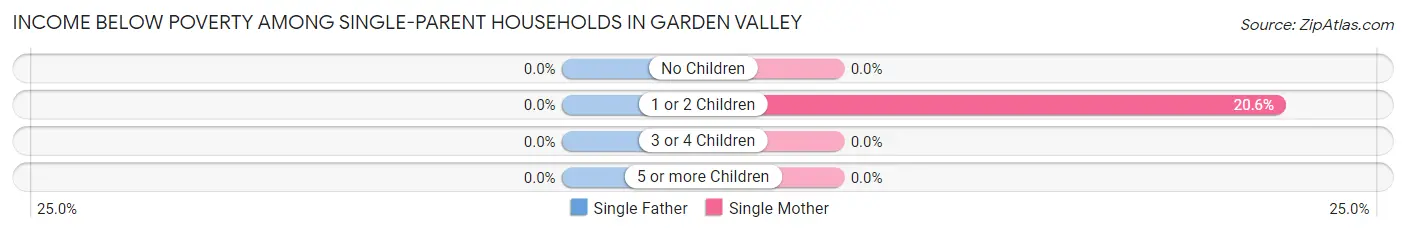
| Children | Single Father | Single Mother |
| No Children | 0 (0.0%) | 0 (0.0%) |
| 1 or 2 Children | 0 (0.0%) | 7 (20.6%) |
| 3 or 4 Children | 0 (0.0%) | 0 (0.0%) |
| 5 or more Children | 0 (0.0%) | 0 (0.0%) |
| Total | 0 (0.0%) | 7 (20.6%) |
Income Below Poverty Among Married-Couple vs Single-Parent Households in Garden Valley
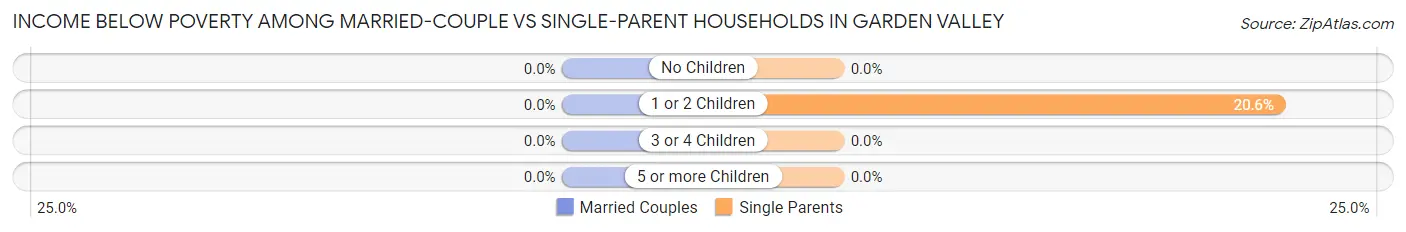
| Children | Married-Couple Families | Single-Parent Households |
| No Children | 0 (0.0%) | 0 (0.0%) |
| 1 or 2 Children | 0 (0.0%) | 7 (20.6%) |
| 3 or 4 Children | 0 (0.0%) | 0 (0.0%) |
| 5 or more Children | 0 (0.0%) | 0 (0.0%) |
| Total | 0 (0.0%) | 7 (17.5%) |
Employment Characteristics in Garden Valley
Employment by Class of Employer in Garden Valley
Among the 269 employed individuals in Garden Valley, private company employees (192 | 71.4%), not-for-profit organizations (23 | 8.6%), and state government employees (21 | 7.8%) make up the most common classes of employment.
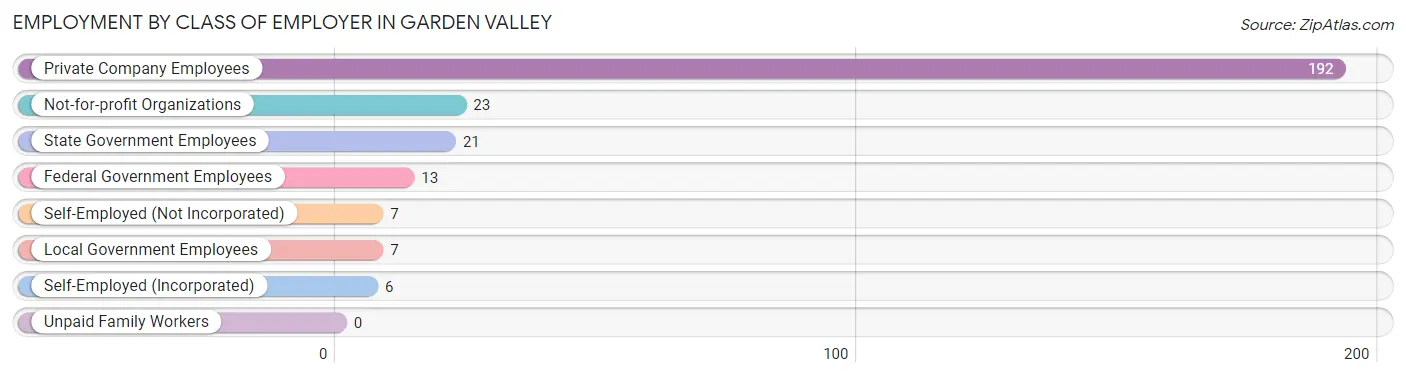
| Employer Class | # Employees | % Employees |
| Private Company Employees | 192 | 71.4% |
| Self-Employed (Incorporated) | 6 | 2.2% |
| Self-Employed (Not Incorporated) | 7 | 2.6% |
| Not-for-profit Organizations | 23 | 8.6% |
| Local Government Employees | 7 | 2.6% |
| State Government Employees | 21 | 7.8% |
| Federal Government Employees | 13 | 4.8% |
| Unpaid Family Workers | 0 | 0.0% |
| Total | 269 | 100.0% |
Employment Status by Age in Garden Valley
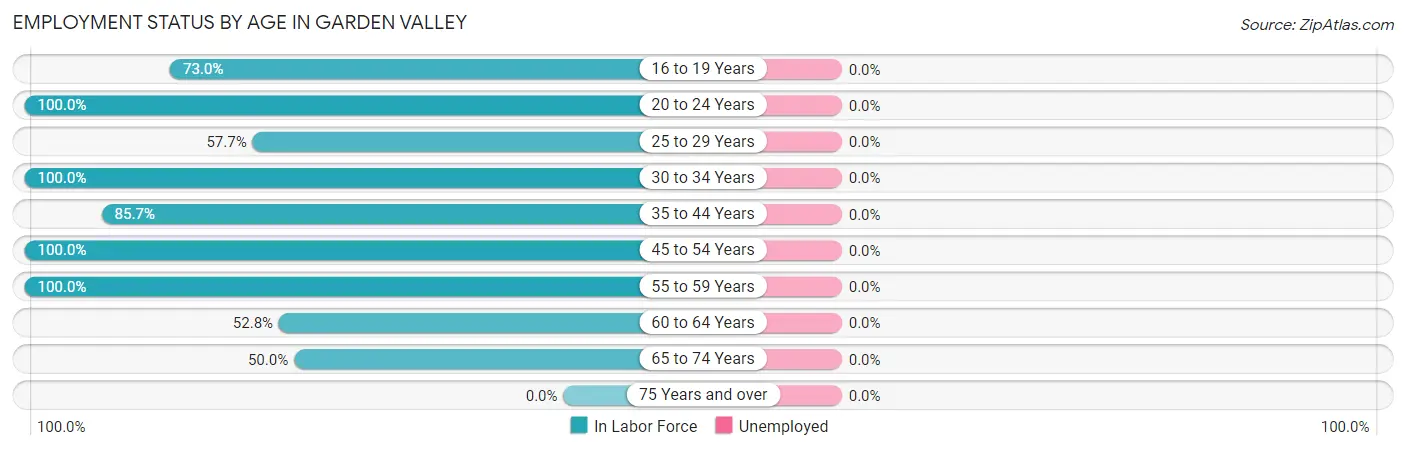
| Age Bracket | In Labor Force | Unemployed |
| 16 to 19 Years | 27 (73.0%) | 0 (0.0%) |
| 20 to 24 Years | 38 (100.0%) | 0 (0.0%) |
| 25 to 29 Years | 30 (57.7%) | 0 (0.0%) |
| 30 to 34 Years | 33 (100.0%) | 0 (0.0%) |
| 35 to 44 Years | 60 (85.7%) | 0 (0.0%) |
| 45 to 54 Years | 34 (100.0%) | 0 (0.0%) |
| 55 to 59 Years | 13 (100.0%) | 0 (0.0%) |
| 60 to 64 Years | 19 (52.8%) | 0 (0.0%) |
| 65 to 74 Years | 15 (50.0%) | 0 (0.0%) |
| 75 Years and over | 0 (0.0%) | 0 (0.0%) |
| Total | 269 (78.4%) | 0 (0.0%) |
Employment Status by Educational Attainment in Garden Valley
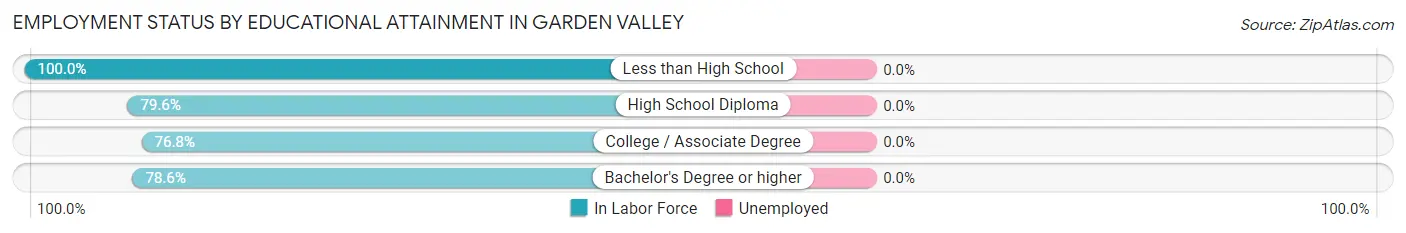
| Educational Attainment | In Labor Force | Unemployed |
| Less than High School | 12 (100.0%) | 0 (0.0%) |
| High School Diploma | 43 (79.6%) | 0 (0.0%) |
| College / Associate Degree | 53 (76.8%) | 0 (0.0%) |
| Bachelor's Degree or higher | 81 (78.6%) | 0 (0.0%) |
| Total | 189 (79.4%) | 0 (0.0%) |
Employment Occupations by Sex in Garden Valley
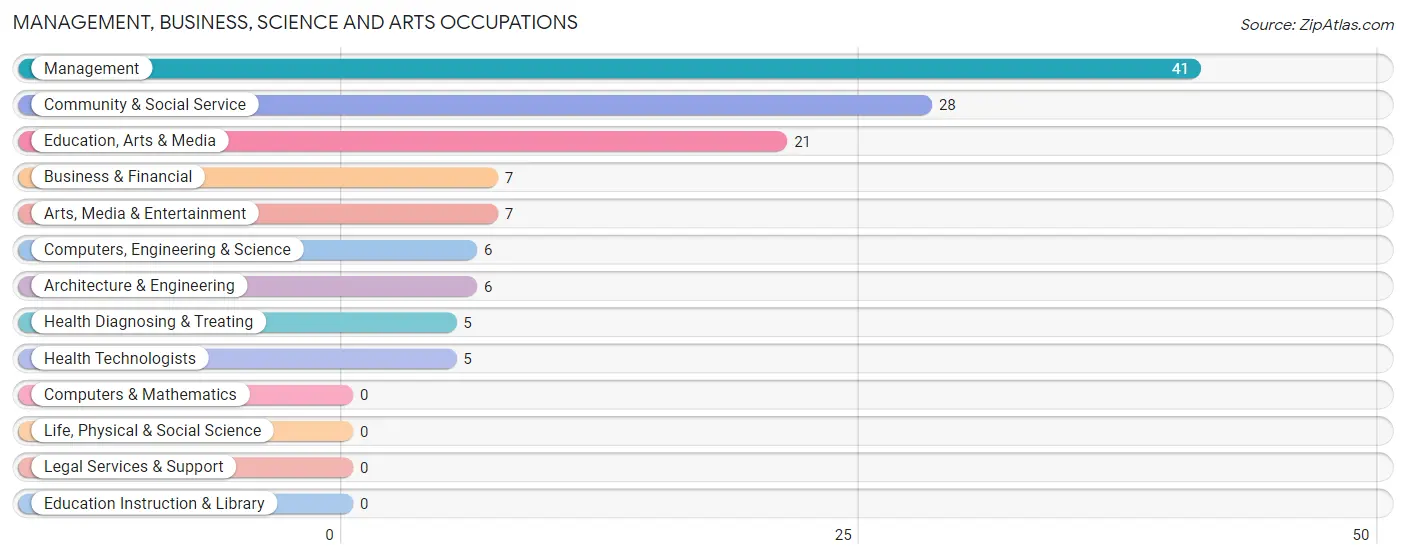
Management, Business, Science and Arts Occupations
The most common Management, Business, Science and Arts occupations in Garden Valley are Management (41 | 15.2%), Community & Social Service (28 | 10.4%), Education, Arts & Media (21 | 7.8%), Business & Financial (7 | 2.6%), and Arts, Media & Entertainment (7 | 2.6%).
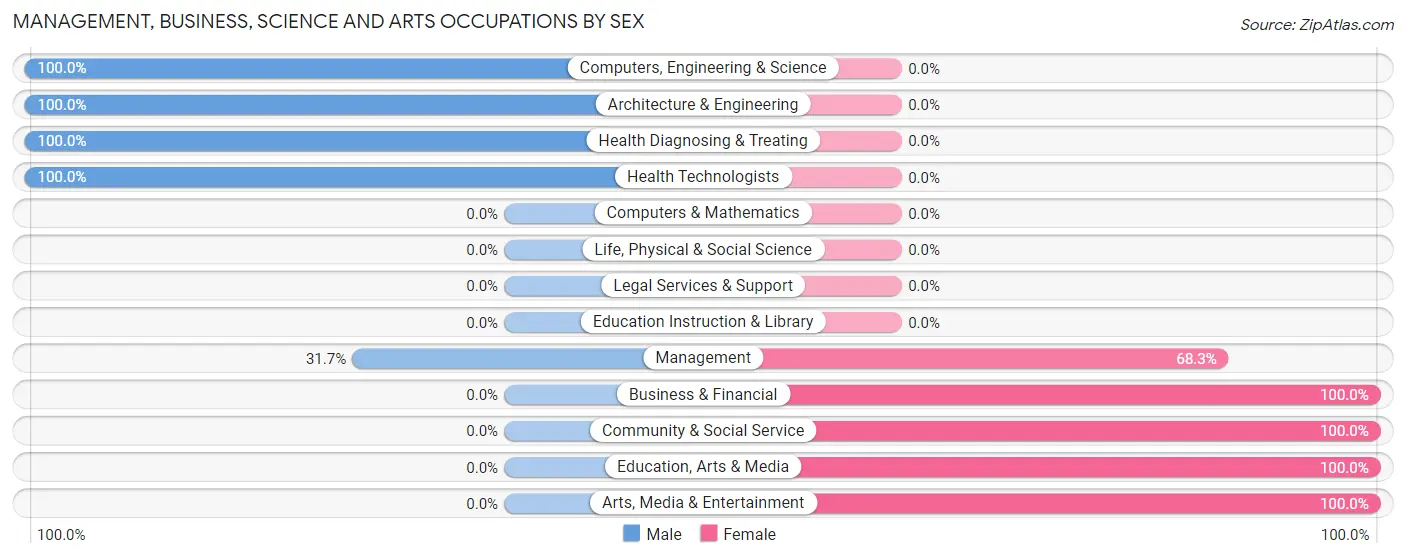
Management, Business, Science and Arts Occupations by Sex
Within the Management, Business, Science and Arts occupations in Garden Valley, the most male-oriented occupations are Computers, Engineering & Science (100.0%), Architecture & Engineering (100.0%), and Health Diagnosing & Treating (100.0%), while the most female-oriented occupations are Business & Financial (100.0%), Community & Social Service (100.0%), and Education, Arts & Media (100.0%).
| Occupation | Male | Female |
| Management | 13 (31.7%) | 28 (68.3%) |
| Business & Financial | 0 (0.0%) | 7 (100.0%) |
| Computers, Engineering & Science | 6 (100.0%) | 0 (0.0%) |
| Computers & Mathematics | 0 (0.0%) | 0 (0.0%) |
| Architecture & Engineering | 6 (100.0%) | 0 (0.0%) |
| Life, Physical & Social Science | 0 (0.0%) | 0 (0.0%) |
| Community & Social Service | 0 (0.0%) | 28 (100.0%) |
| Education, Arts & Media | 0 (0.0%) | 21 (100.0%) |
| Legal Services & Support | 0 (0.0%) | 0 (0.0%) |
| Education Instruction & Library | 0 (0.0%) | 0 (0.0%) |
| Arts, Media & Entertainment | 0 (0.0%) | 7 (100.0%) |
| Health Diagnosing & Treating | 5 (100.0%) | 0 (0.0%) |
| Health Technologists | 5 (100.0%) | 0 (0.0%) |
| Total (Category) | 24 (27.6%) | 63 (72.4%) |
| Total (Overall) | 139 (51.7%) | 130 (48.3%) |
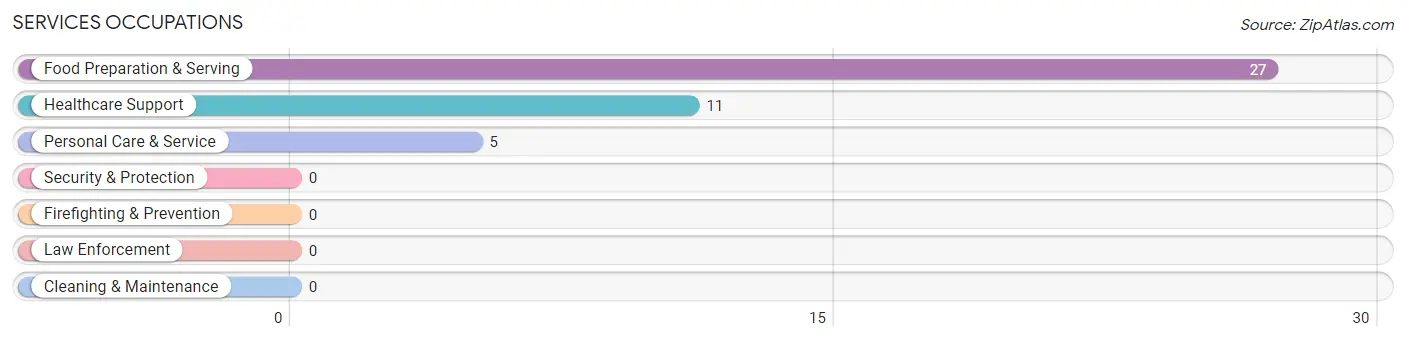
Services Occupations
The most common Services occupations in Garden Valley are Food Preparation & Serving (27 | 10.0%), Healthcare Support (11 | 4.1%), and Personal Care & Service (5 | 1.9%).
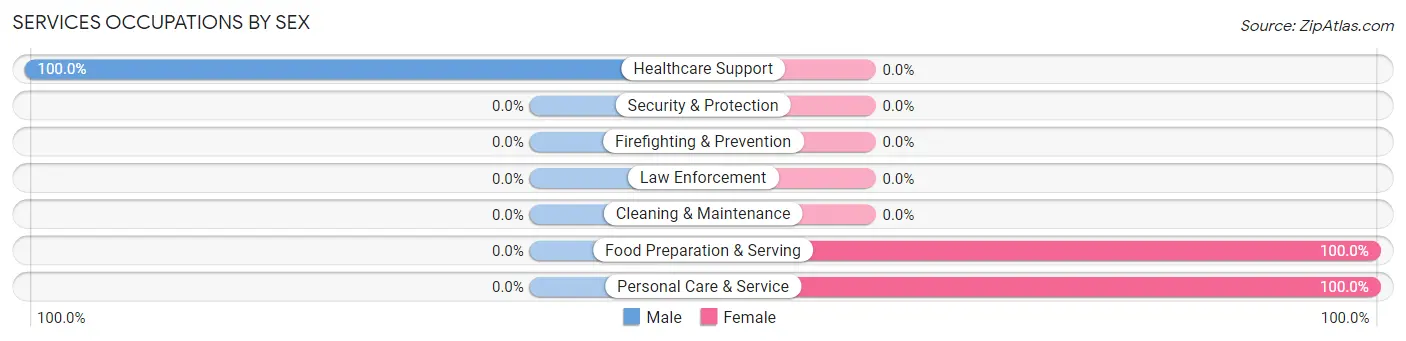
Services Occupations by Sex
| Occupation | Male | Female |
| Healthcare Support | 11 (100.0%) | 0 (0.0%) |
| Security & Protection | 0 (0.0%) | 0 (0.0%) |
| Firefighting & Prevention | 0 (0.0%) | 0 (0.0%) |
| Law Enforcement | 0 (0.0%) | 0 (0.0%) |
| Food Preparation & Serving | 0 (0.0%) | 27 (100.0%) |
| Cleaning & Maintenance | 0 (0.0%) | 0 (0.0%) |
| Personal Care & Service | 0 (0.0%) | 5 (100.0%) |
| Total (Category) | 11 (25.6%) | 32 (74.4%) |
| Total (Overall) | 139 (51.7%) | 130 (48.3%) |
Sales and Office Occupations
The most common Sales and Office occupations in Garden Valley are Sales & Related (43 | 16.0%), and Office & Administration (29 | 10.8%).
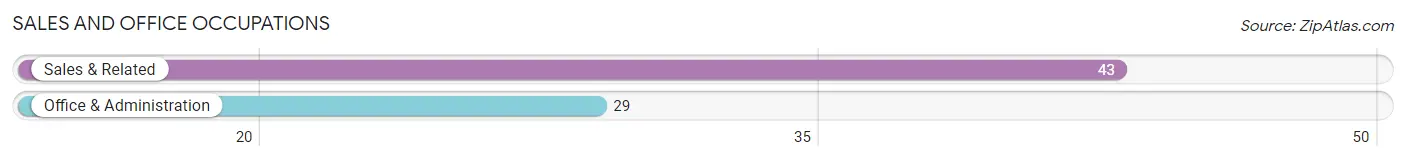
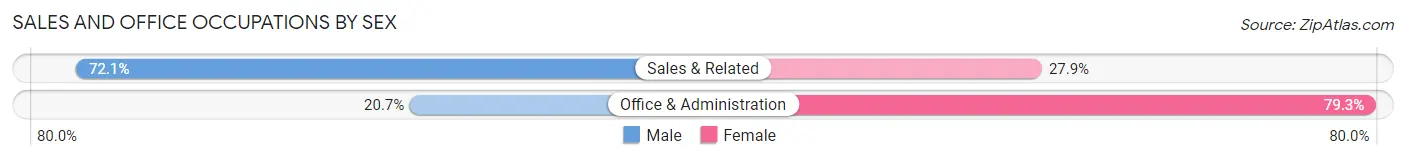
Sales and Office Occupations by Sex
| Occupation | Male | Female |
| Sales & Related | 31 (72.1%) | 12 (27.9%) |
| Office & Administration | 6 (20.7%) | 23 (79.3%) |
| Total (Category) | 37 (51.4%) | 35 (48.6%) |
| Total (Overall) | 139 (51.7%) | 130 (48.3%) |
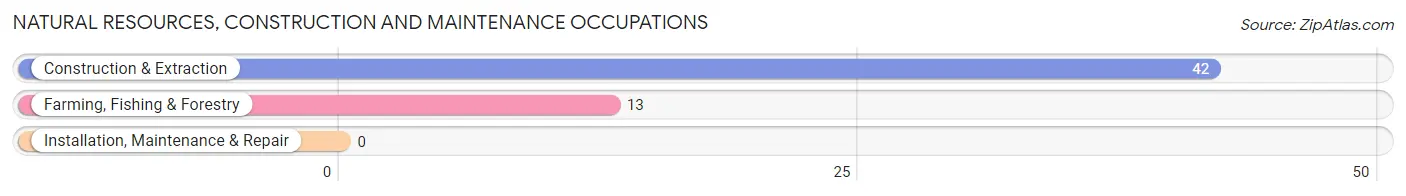
Natural Resources, Construction and Maintenance Occupations
The most common Natural Resources, Construction and Maintenance occupations in Garden Valley are Construction & Extraction (42 | 15.6%), and Farming, Fishing & Forestry (13 | 4.8%).
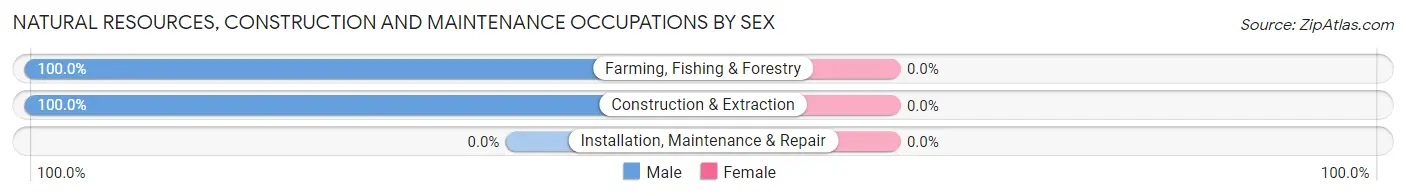
Natural Resources, Construction and Maintenance Occupations by Sex
| Occupation | Male | Female |
| Farming, Fishing & Forestry | 13 (100.0%) | 0 (0.0%) |
| Construction & Extraction | 42 (100.0%) | 0 (0.0%) |
| Installation, Maintenance & Repair | 0 (0.0%) | 0 (0.0%) |
| Total (Category) | 55 (100.0%) | 0 (0.0%) |
| Total (Overall) | 139 (51.7%) | 130 (48.3%) |
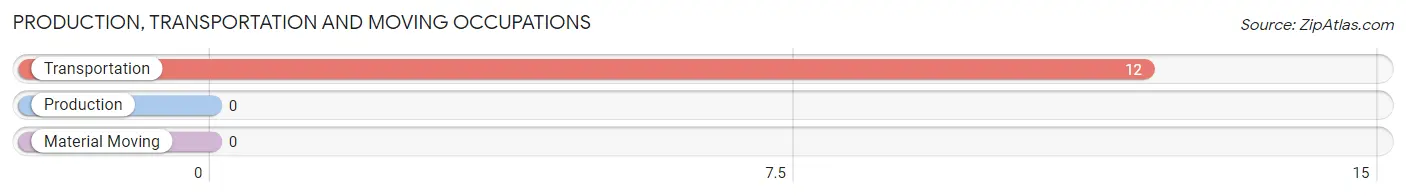
Production, Transportation and Moving Occupations
The most common Production, Transportation and Moving occupations in Garden Valley are , and Transportation (12 | 4.5%).
Production, Transportation and Moving Occupations by Sex
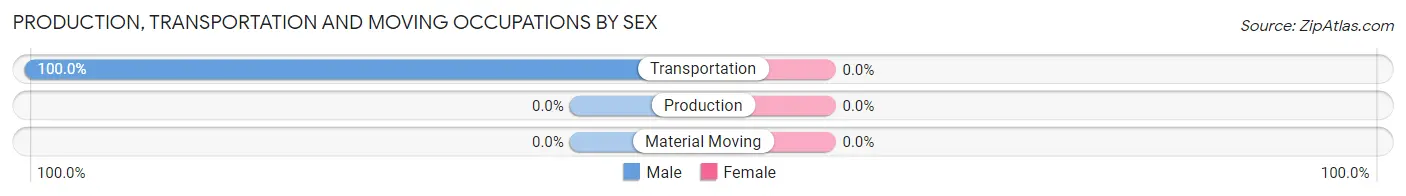
| Occupation | Male | Female |
| Production | 0 (0.0%) | 0 (0.0%) |
| Transportation | 12 (100.0%) | 0 (0.0%) |
| Material Moving | 0 (0.0%) | 0 (0.0%) |
| Total (Category) | 12 (100.0%) | 0 (0.0%) |
| Total (Overall) | 139 (51.7%) | 130 (48.3%) |
Employment Industries by Sex in Garden Valley
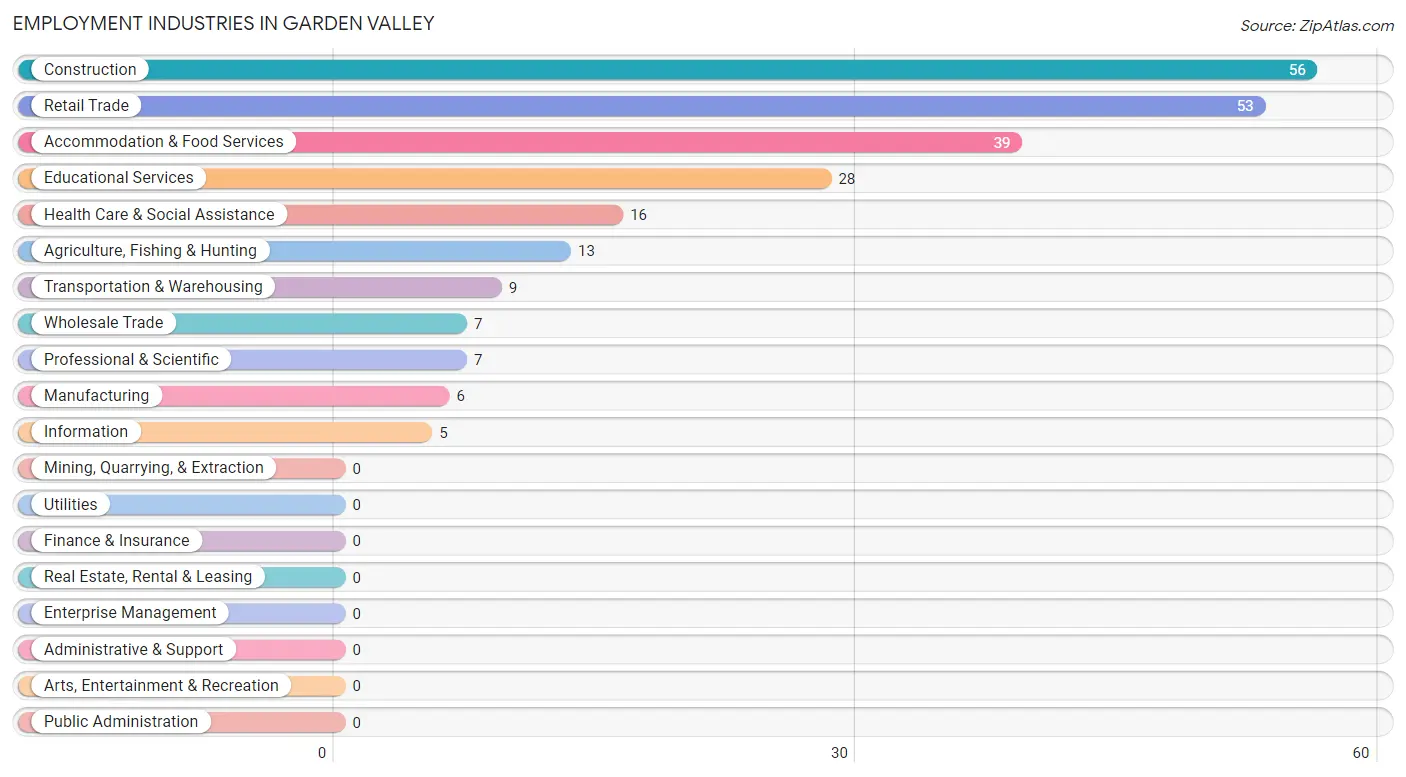
Employment Industries in Garden Valley
The major employment industries in Garden Valley include Construction (56 | 20.8%), Retail Trade (53 | 19.7%), Accommodation & Food Services (39 | 14.5%), Educational Services (28 | 10.4%), and Health Care & Social Assistance (16 | 5.9%).
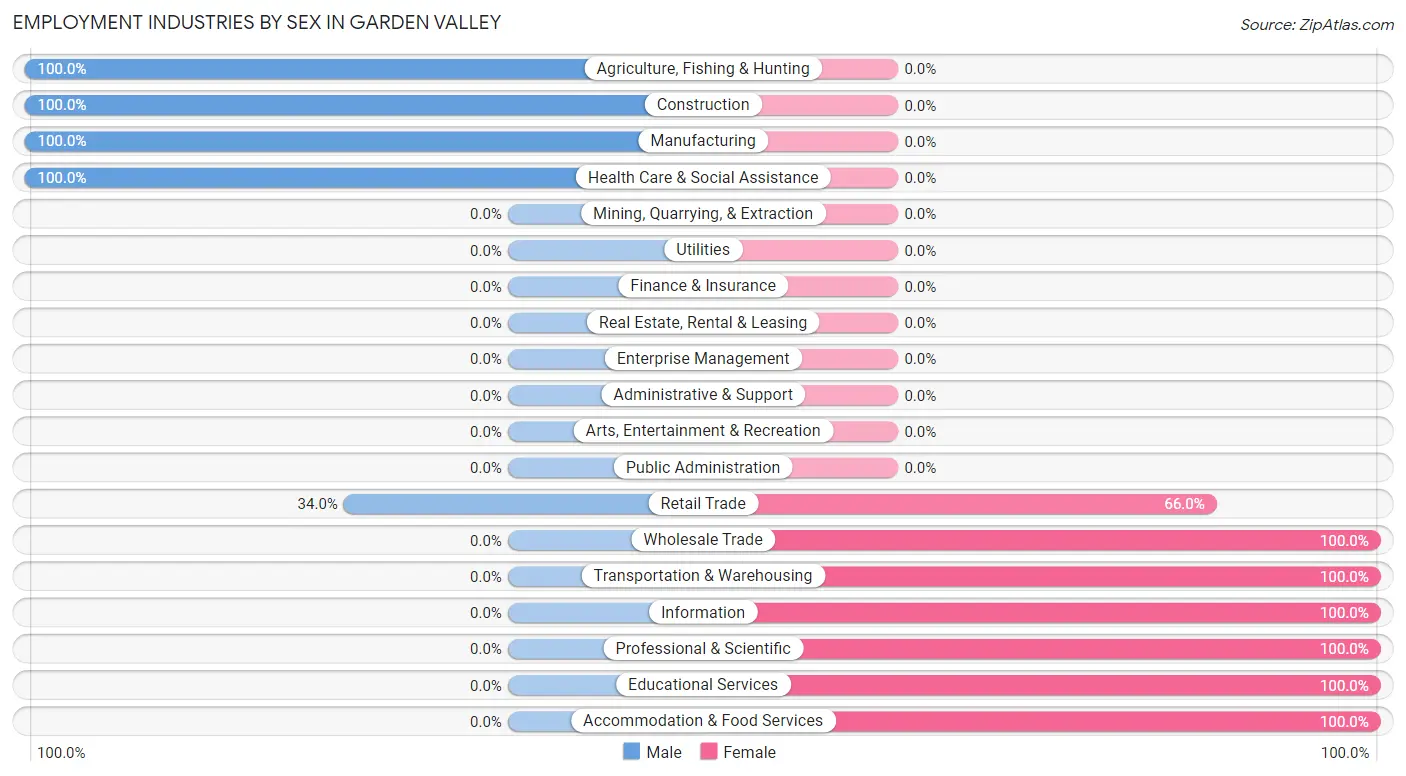
Employment Industries by Sex in Garden Valley
The Garden Valley industries that see more men than women are Agriculture, Fishing & Hunting (100.0%), Construction (100.0%), and Manufacturing (100.0%), whereas the industries that tend to have a higher number of women are Wholesale Trade (100.0%), Transportation & Warehousing (100.0%), and Information (100.0%).
| Industry | Male | Female |
| Agriculture, Fishing & Hunting | 13 (100.0%) | 0 (0.0%) |
| Mining, Quarrying, & Extraction | 0 (0.0%) | 0 (0.0%) |
| Construction | 56 (100.0%) | 0 (0.0%) |
| Manufacturing | 6 (100.0%) | 0 (0.0%) |
| Wholesale Trade | 0 (0.0%) | 7 (100.0%) |
| Retail Trade | 18 (34.0%) | 35 (66.0%) |
| Transportation & Warehousing | 0 (0.0%) | 9 (100.0%) |
| Utilities | 0 (0.0%) | 0 (0.0%) |
| Information | 0 (0.0%) | 5 (100.0%) |
| Finance & Insurance | 0 (0.0%) | 0 (0.0%) |
| Real Estate, Rental & Leasing | 0 (0.0%) | 0 (0.0%) |
| Professional & Scientific | 0 (0.0%) | 7 (100.0%) |
| Enterprise Management | 0 (0.0%) | 0 (0.0%) |
| Administrative & Support | 0 (0.0%) | 0 (0.0%) |
| Educational Services | 0 (0.0%) | 28 (100.0%) |
| Health Care & Social Assistance | 16 (100.0%) | 0 (0.0%) |
| Arts, Entertainment & Recreation | 0 (0.0%) | 0 (0.0%) |
| Accommodation & Food Services | 0 (0.0%) | 39 (100.0%) |
| Public Administration | 0 (0.0%) | 0 (0.0%) |
| Total | 139 (51.7%) | 130 (48.3%) |
Education in Garden Valley
School Enrollment in Garden Valley
The most common levels of schooling among the 49 students in Garden Valley are middle school (21 | 42.9%), high school (14 | 28.6%), and college / undergraduate (7 | 14.3%).
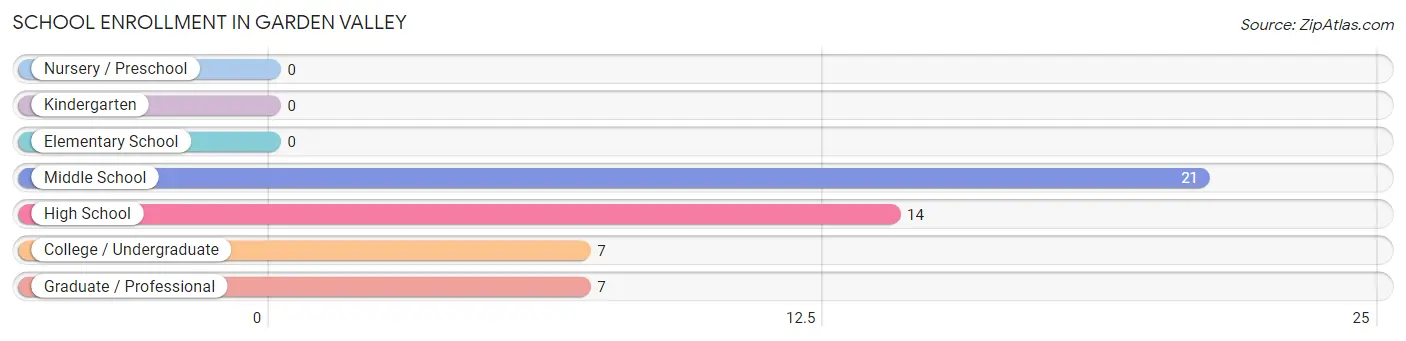
| School Level | # Students | % Students |
| Nursery / Preschool | 0 | 0.0% |
| Kindergarten | 0 | 0.0% |
| Elementary School | 0 | 0.0% |
| Middle School | 21 | 42.9% |
| High School | 14 | 28.6% |
| College / Undergraduate | 7 | 14.3% |
| Graduate / Professional | 7 | 14.3% |
| Total | 49 | 100.0% |
School Enrollment by Age by Funding Source in Garden Valley
Out of a total of 49 students who are enrolled in schools in Garden Valley, 10 (20.4%) attend a private institution, while the remaining 39 (79.6%) are enrolled in public schools. The age group of 15 to 17 year olds has the highest likelihood of being enrolled in private schools, with 4 (36.4% in the age bracket) enrolled. Conversely, the age group of 25 to 34 year olds has the lowest likelihood of being enrolled in a private school, with 7 (100.0% in the age bracket) attending a public institution.
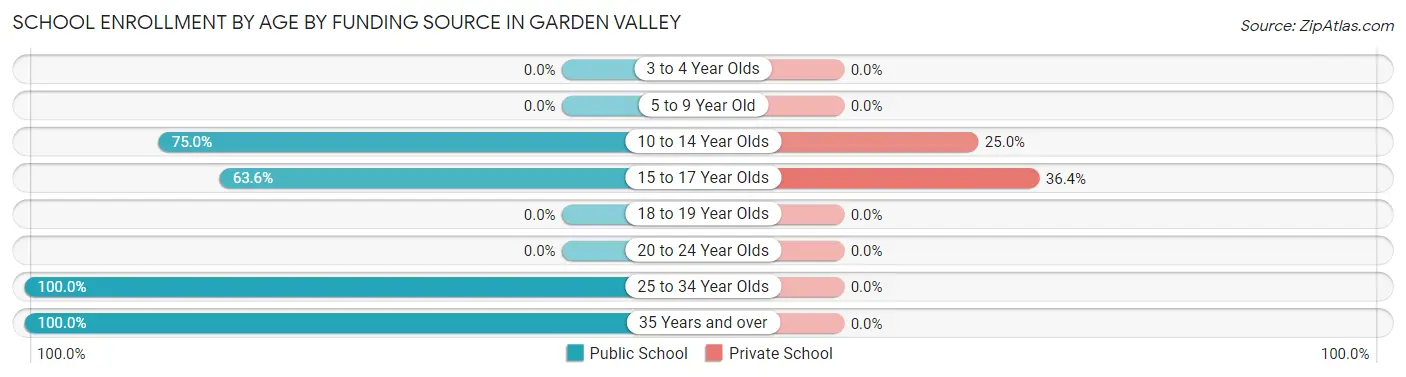
| Age Bracket | Public School | Private School |
| 3 to 4 Year Olds | 0 (0.0%) | 0 (0.0%) |
| 5 to 9 Year Old | 0 (0.0%) | 0 (0.0%) |
| 10 to 14 Year Olds | 18 (75.0%) | 6 (25.0%) |
| 15 to 17 Year Olds | 7 (63.6%) | 4 (36.4%) |
| 18 to 19 Year Olds | 0 (0.0%) | 0 (0.0%) |
| 20 to 24 Year Olds | 0 (0.0%) | 0 (0.0%) |
| 25 to 34 Year Olds | 7 (100.0%) | 0 (0.0%) |
| 35 Years and over | 7 (100.0%) | 0 (0.0%) |
| Total | 39 (79.6%) | 10 (20.4%) |
Educational Attainment by Field of Study in Garden Valley
Arts & humanities (33 | 28.2%), multidisciplinary studies (22 | 18.8%), bio, nature & agricultural (18 | 15.4%), social sciences (12 | 10.3%), and psychology (11 | 9.4%) are the most common fields of study among 117 individuals in Garden Valley who have obtained a bachelor's degree or higher.
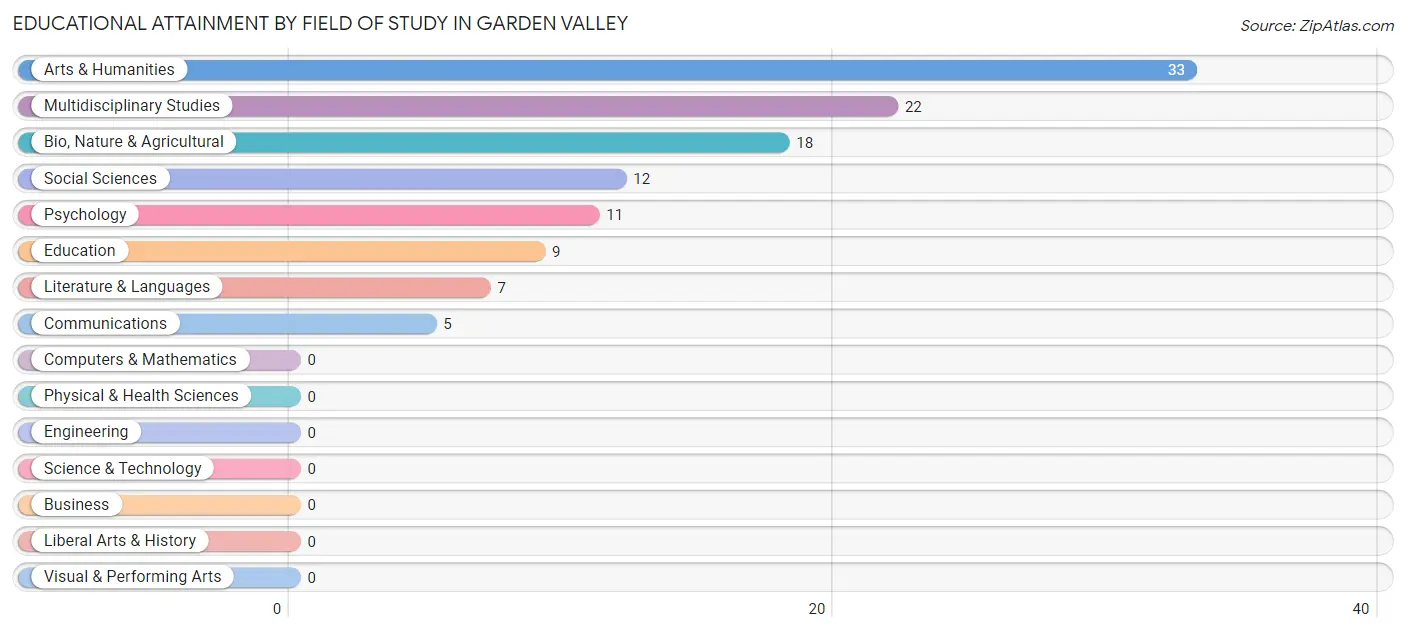
| Field of Study | # Graduates | % Graduates |
| Computers & Mathematics | 0 | 0.0% |
| Bio, Nature & Agricultural | 18 | 15.4% |
| Physical & Health Sciences | 0 | 0.0% |
| Psychology | 11 | 9.4% |
| Social Sciences | 12 | 10.3% |
| Engineering | 0 | 0.0% |
| Multidisciplinary Studies | 22 | 18.8% |
| Science & Technology | 0 | 0.0% |
| Business | 0 | 0.0% |
| Education | 9 | 7.7% |
| Literature & Languages | 7 | 6.0% |
| Liberal Arts & History | 0 | 0.0% |
| Visual & Performing Arts | 0 | 0.0% |
| Communications | 5 | 4.3% |
| Arts & Humanities | 33 | 28.2% |
| Total | 117 | 100.0% |
Transportation & Commute in Garden Valley
Vehicle Availability by Sex in Garden Valley
The most prevalent vehicle ownership categories in Garden Valley are males with 4 vehicles (32, accounting for 33.7%) and females with 4 vehicles (36, making up 24.6%).
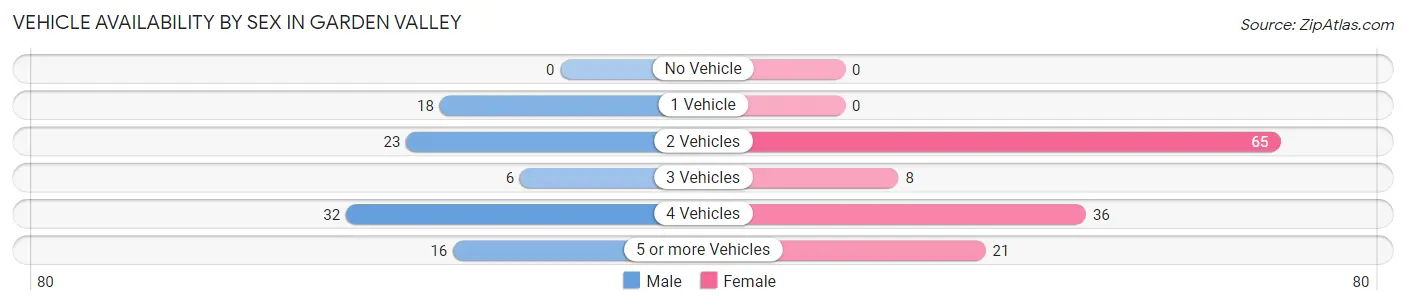
| Vehicles Available | Male | Female |
| No Vehicle | 0 (0.0%) | 0 (0.0%) |
| 1 Vehicle | 18 (19.0%) | 0 (0.0%) |
| 2 Vehicles | 23 (24.2%) | 65 (50.0%) |
| 3 Vehicles | 6 (6.3%) | 8 (6.1%) |
| 4 Vehicles | 32 (33.7%) | 36 (27.7%) |
| 5 or more Vehicles | 16 (16.8%) | 21 (16.2%) |
| Total | 95 (100.0%) | 130 (100.0%) |
Commute Time in Garden Valley
The most frequently occuring commute durations in Garden Valley are less than 5 minutes (102 commuters, 41.0%), 10 to 14 minutes (74 commuters, 29.7%), and 5 to 9 minutes (32 commuters, 12.9%).
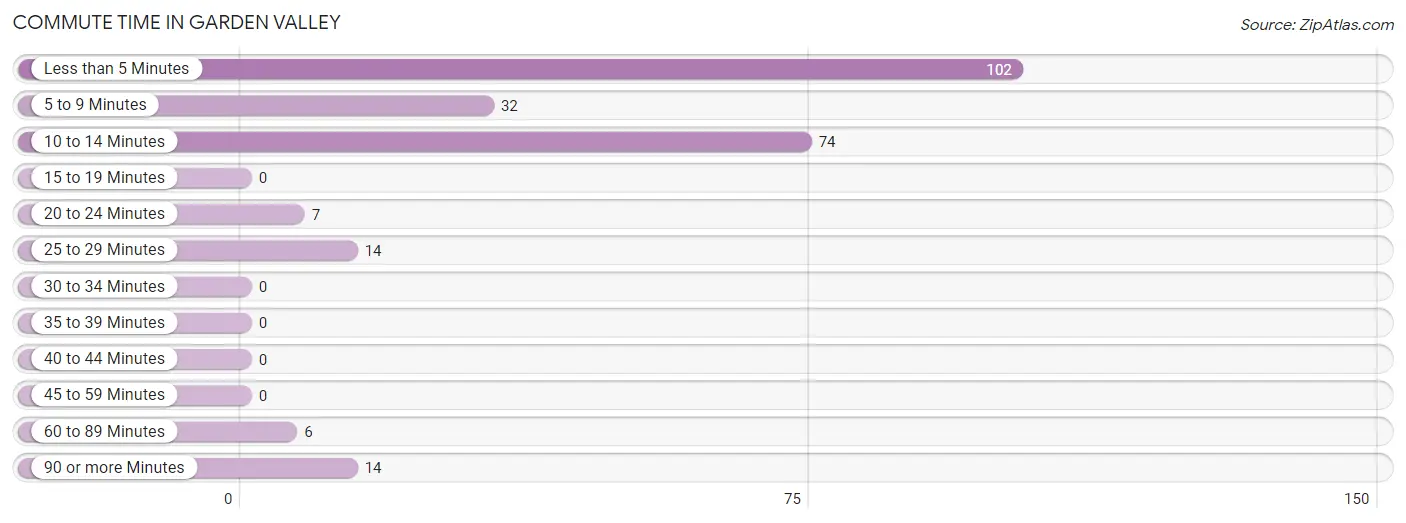
| Commute Time | # Commuters | % Commuters |
| Less than 5 Minutes | 102 | 41.0% |
| 5 to 9 Minutes | 32 | 12.9% |
| 10 to 14 Minutes | 74 | 29.7% |
| 15 to 19 Minutes | 0 | 0.0% |
| 20 to 24 Minutes | 7 | 2.8% |
| 25 to 29 Minutes | 14 | 5.6% |
| 30 to 34 Minutes | 0 | 0.0% |
| 35 to 39 Minutes | 0 | 0.0% |
| 40 to 44 Minutes | 0 | 0.0% |
| 45 to 59 Minutes | 0 | 0.0% |
| 60 to 89 Minutes | 6 | 2.4% |
| 90 or more Minutes | 14 | 5.6% |
Commute Time by Sex in Garden Valley
The most common commute times in Garden Valley are 10 to 14 minutes (54 commuters, 42.9%) for males and less than 5 minutes (67 commuters, 54.5%) for females.
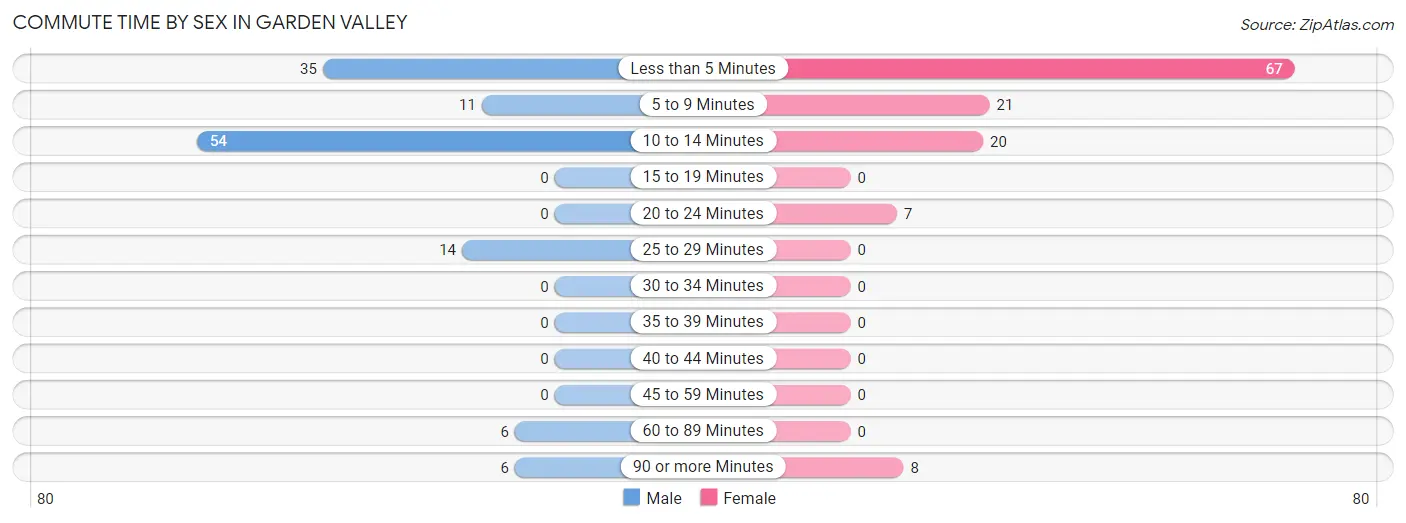
| Commute Time | Male | Female |
| Less than 5 Minutes | 35 (27.8%) | 67 (54.5%) |
| 5 to 9 Minutes | 11 (8.7%) | 21 (17.1%) |
| 10 to 14 Minutes | 54 (42.9%) | 20 (16.3%) |
| 15 to 19 Minutes | 0 (0.0%) | 0 (0.0%) |
| 20 to 24 Minutes | 0 (0.0%) | 7 (5.7%) |
| 25 to 29 Minutes | 14 (11.1%) | 0 (0.0%) |
| 30 to 34 Minutes | 0 (0.0%) | 0 (0.0%) |
| 35 to 39 Minutes | 0 (0.0%) | 0 (0.0%) |
| 40 to 44 Minutes | 0 (0.0%) | 0 (0.0%) |
| 45 to 59 Minutes | 0 (0.0%) | 0 (0.0%) |
| 60 to 89 Minutes | 6 (4.8%) | 0 (0.0%) |
| 90 or more Minutes | 6 (4.8%) | 8 (6.5%) |
Time of Departure to Work by Sex in Garden Valley
The most frequent times of departure to work in Garden Valley are 7:30 AM to 7:59 AM (58, 46.0%) for males and 12:00 AM to 4:59 AM (27, 22.0%) for females.
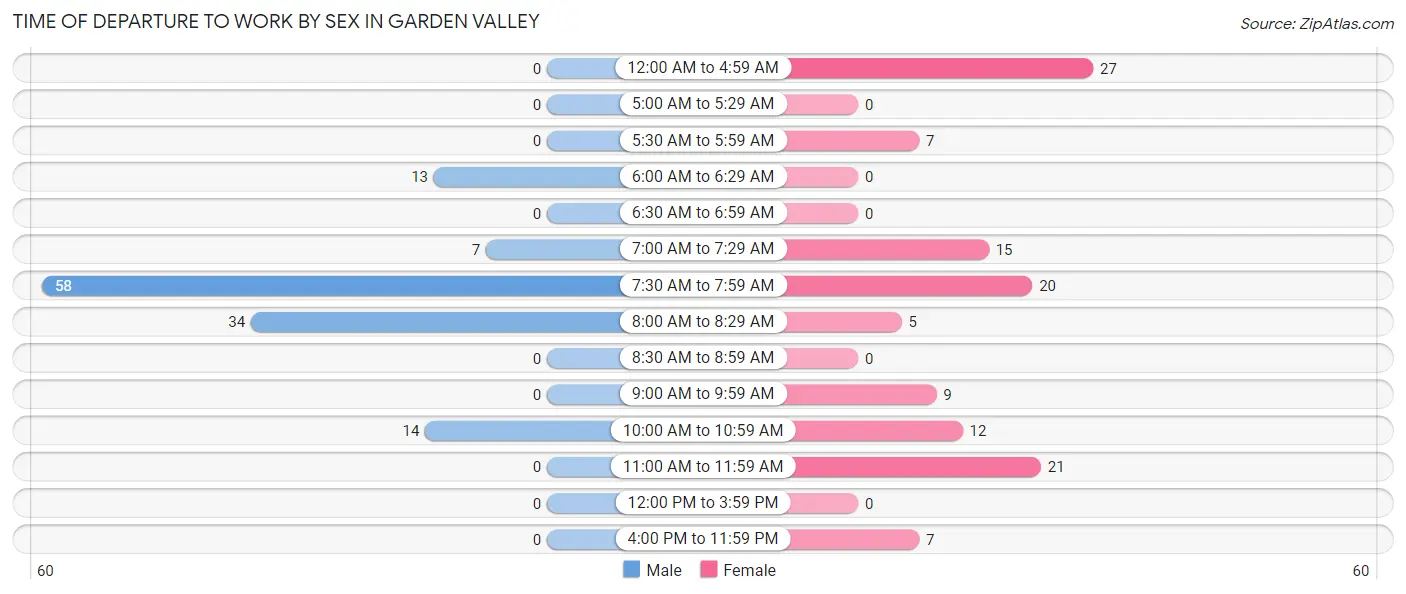
| Time of Departure | Male | Female |
| 12:00 AM to 4:59 AM | 0 (0.0%) | 27 (22.0%) |
| 5:00 AM to 5:29 AM | 0 (0.0%) | 0 (0.0%) |
| 5:30 AM to 5:59 AM | 0 (0.0%) | 7 (5.7%) |
| 6:00 AM to 6:29 AM | 13 (10.3%) | 0 (0.0%) |
| 6:30 AM to 6:59 AM | 0 (0.0%) | 0 (0.0%) |
| 7:00 AM to 7:29 AM | 7 (5.6%) | 15 (12.2%) |
| 7:30 AM to 7:59 AM | 58 (46.0%) | 20 (16.3%) |
| 8:00 AM to 8:29 AM | 34 (27.0%) | 5 (4.1%) |
| 8:30 AM to 8:59 AM | 0 (0.0%) | 0 (0.0%) |
| 9:00 AM to 9:59 AM | 0 (0.0%) | 9 (7.3%) |
| 10:00 AM to 10:59 AM | 14 (11.1%) | 12 (9.8%) |
| 11:00 AM to 11:59 AM | 0 (0.0%) | 21 (17.1%) |
| 12:00 PM to 3:59 PM | 0 (0.0%) | 0 (0.0%) |
| 4:00 PM to 11:59 PM | 0 (0.0%) | 7 (5.7%) |
| Total | 126 (100.0%) | 123 (100.0%) |
Housing Occupancy in Garden Valley
Occupancy by Ownership in Garden Valley
Of the total 114 dwellings in Garden Valley, owner-occupied units account for 81 (71.1%), while renter-occupied units make up 33 (28.9%).
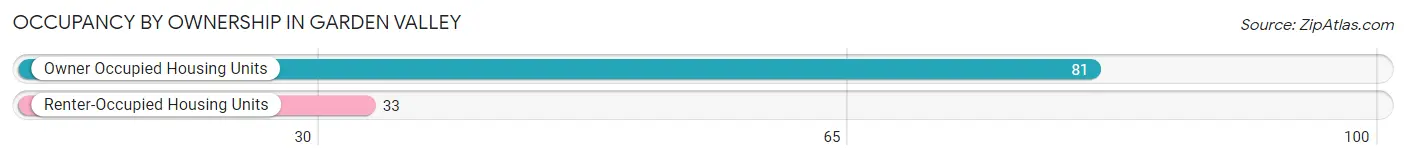
| Occupancy | # Housing Units | % Housing Units |
| Owner Occupied Housing Units | 81 | 71.1% |
| Renter-Occupied Housing Units | 33 | 28.9% |
| Total Occupied Housing Units | 114 | 100.0% |
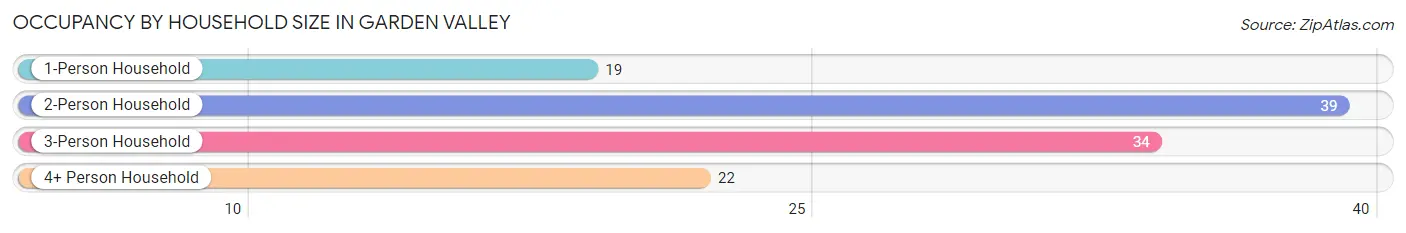
Occupancy by Household Size in Garden Valley
| Household Size | # Housing Units | % Housing Units |
| 1-Person Household | 19 | 16.7% |
| 2-Person Household | 39 | 34.2% |
| 3-Person Household | 34 | 29.8% |
| 4+ Person Household | 22 | 19.3% |
| Total Housing Units | 114 | 100.0% |
Occupancy by Ownership by Household Size in Garden Valley
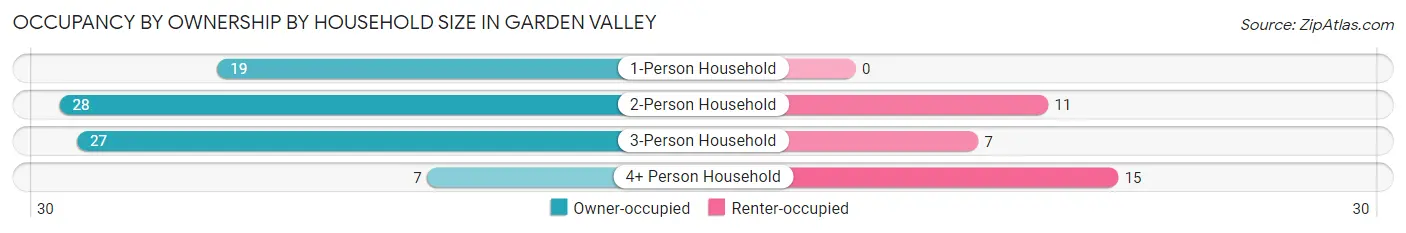
| Household Size | Owner-occupied | Renter-occupied |
| 1-Person Household | 19 (100.0%) | 0 (0.0%) |
| 2-Person Household | 28 (71.8%) | 11 (28.2%) |
| 3-Person Household | 27 (79.4%) | 7 (20.6%) |
| 4+ Person Household | 7 (31.8%) | 15 (68.2%) |
| Total Housing Units | 81 (71.1%) | 33 (28.9%) |
Occupancy by Educational Attainment in Garden Valley
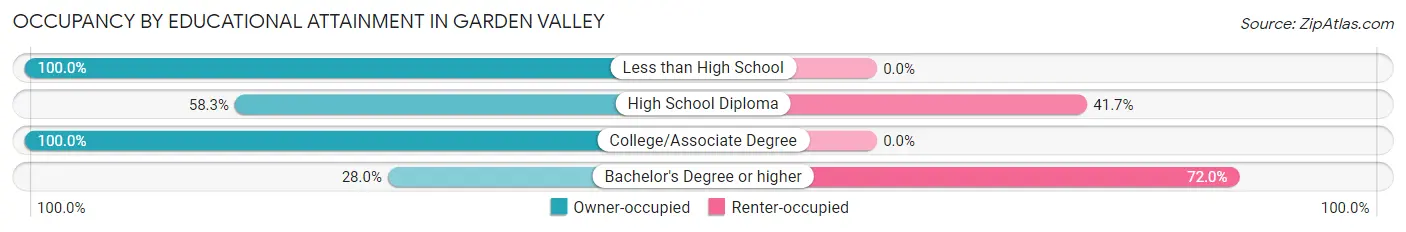
| Household Size | Owner-occupied | Renter-occupied |
| Less than High School | 12 (100.0%) | 0 (0.0%) |
| High School Diploma | 21 (58.3%) | 15 (41.7%) |
| College/Associate Degree | 41 (100.0%) | 0 (0.0%) |
| Bachelor's Degree or higher | 7 (28.0%) | 18 (72.0%) |
Occupancy by Age of Householder in Garden Valley
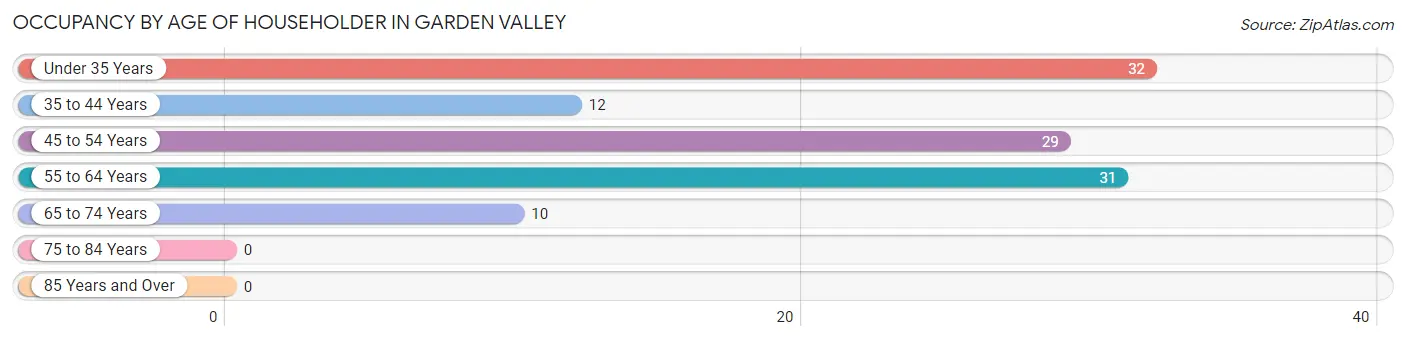
| Age Bracket | # Households | % Households |
| Under 35 Years | 32 | 28.1% |
| 35 to 44 Years | 12 | 10.5% |
| 45 to 54 Years | 29 | 25.4% |
| 55 to 64 Years | 31 | 27.2% |
| 65 to 74 Years | 10 | 8.8% |
| 75 to 84 Years | 0 | 0.0% |
| 85 Years and Over | 0 | 0.0% |
| Total | 114 | 100.0% |
Housing Finances in Garden Valley
Median Income by Occupancy in Garden Valley
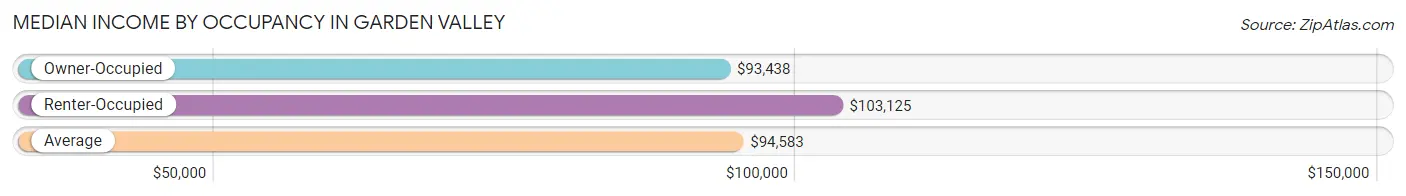
| Occupancy Type | # Households | Median Income |
| Owner-Occupied | 81 (71.1%) | $93,438 |
| Renter-Occupied | 33 (28.9%) | $103,125 |
| Average | 114 (100.0%) | $94,583 |
Occupancy by Householder Income Bracket in Garden Valley
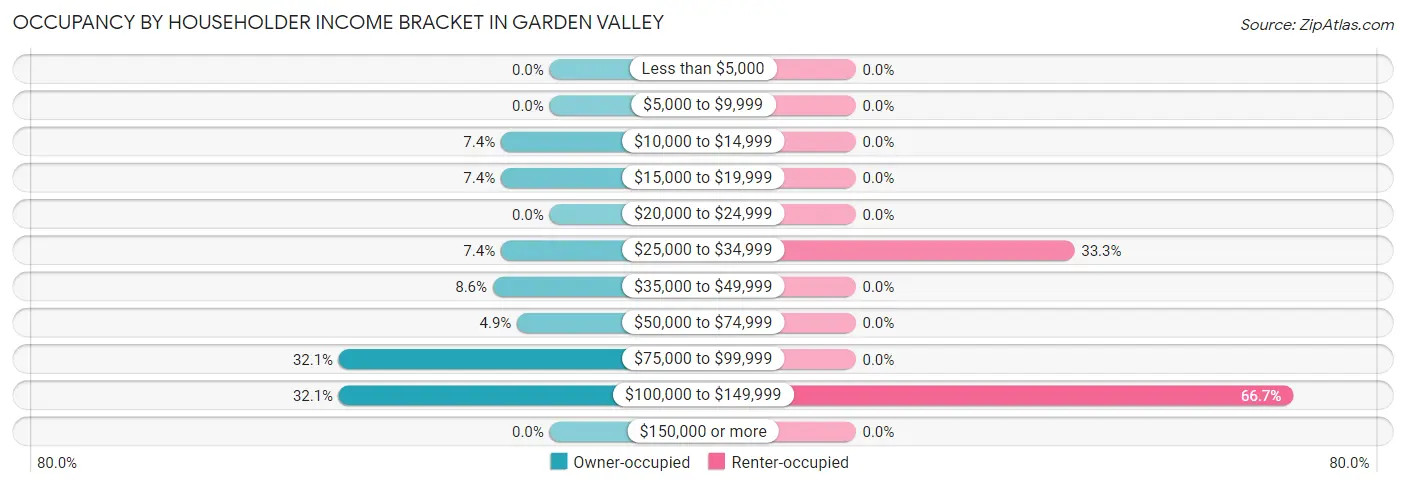
| Income Bracket | Owner-occupied | Renter-occupied |
| Less than $5,000 | 0 (0.0%) | 0 (0.0%) |
| $5,000 to $9,999 | 0 (0.0%) | 0 (0.0%) |
| $10,000 to $14,999 | 6 (7.4%) | 0 (0.0%) |
| $15,000 to $19,999 | 6 (7.4%) | 0 (0.0%) |
| $20,000 to $24,999 | 0 (0.0%) | 0 (0.0%) |
| $25,000 to $34,999 | 6 (7.4%) | 11 (33.3%) |
| $35,000 to $49,999 | 7 (8.6%) | 0 (0.0%) |
| $50,000 to $74,999 | 4 (4.9%) | 0 (0.0%) |
| $75,000 to $99,999 | 26 (32.1%) | 0 (0.0%) |
| $100,000 to $149,999 | 26 (32.1%) | 22 (66.7%) |
| $150,000 or more | 0 (0.0%) | 0 (0.0%) |
| Total | 81 (100.0%) | 33 (100.0%) |
Monthly Housing Cost Tiers in Garden Valley
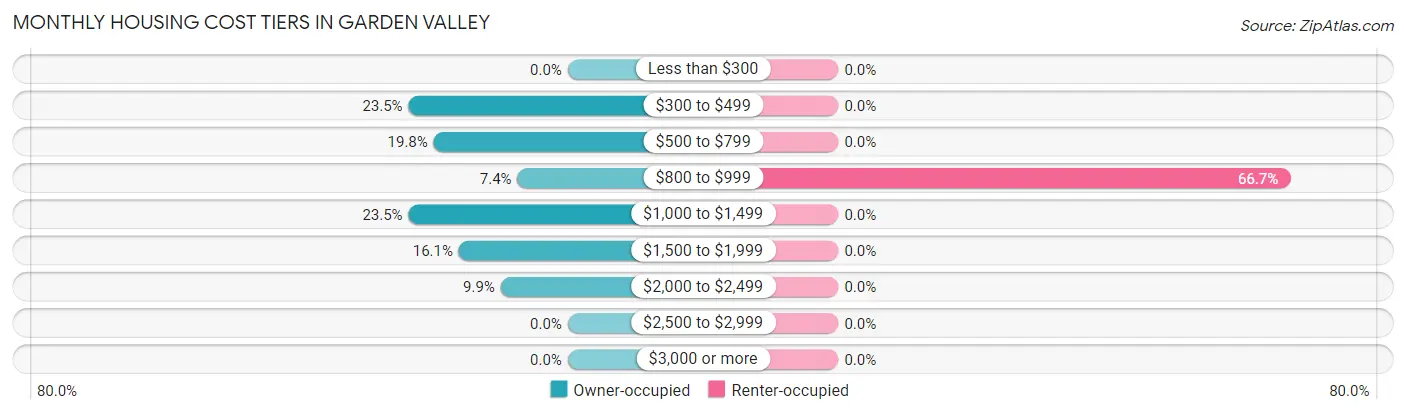
| Monthly Cost | Owner-occupied | Renter-occupied |
| Less than $300 | 0 (0.0%) | 0 (0.0%) |
| $300 to $499 | 19 (23.5%) | 0 (0.0%) |
| $500 to $799 | 16 (19.8%) | 0 (0.0%) |
| $800 to $999 | 6 (7.4%) | 22 (66.7%) |
| $1,000 to $1,499 | 19 (23.5%) | 0 (0.0%) |
| $1,500 to $1,999 | 13 (16.1%) | 0 (0.0%) |
| $2,000 to $2,499 | 8 (9.9%) | 0 (0.0%) |
| $2,500 to $2,999 | 0 (0.0%) | 0 (0.0%) |
| $3,000 or more | 0 (0.0%) | 0 (0.0%) |
| Total | 81 (100.0%) | 33 (100.0%) |
Physical Housing Characteristics in Garden Valley
Housing Structures in Garden Valley
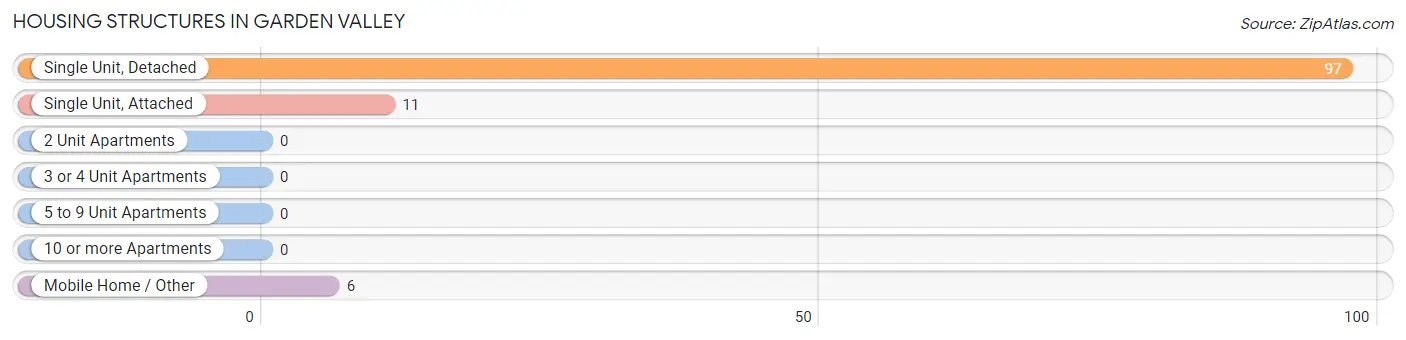
| Structure Type | # Housing Units | % Housing Units |
| Single Unit, Detached | 97 | 85.1% |
| Single Unit, Attached | 11 | 9.7% |
| 2 Unit Apartments | 0 | 0.0% |
| 3 or 4 Unit Apartments | 0 | 0.0% |
| 5 to 9 Unit Apartments | 0 | 0.0% |
| 10 or more Apartments | 0 | 0.0% |
| Mobile Home / Other | 6 | 5.3% |
| Total | 114 | 100.0% |
Housing Structures by Occupancy in Garden Valley
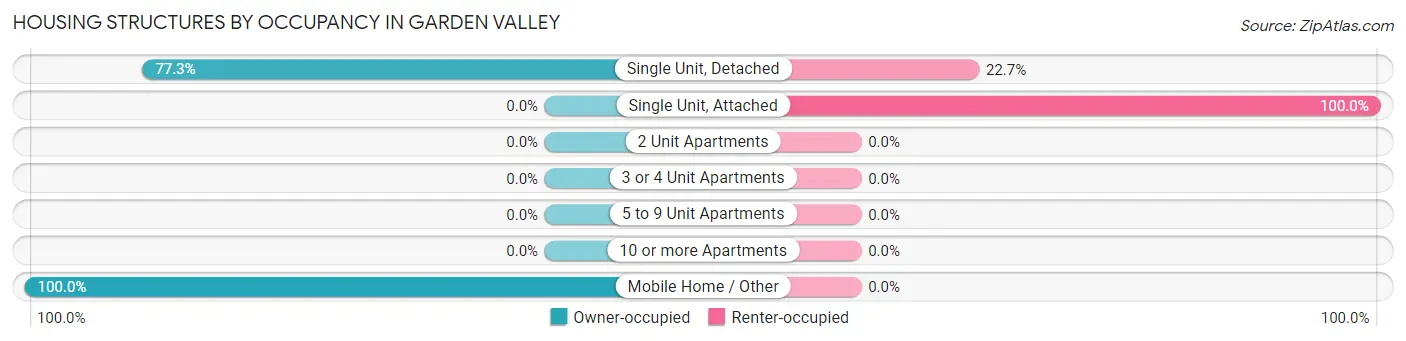
| Structure Type | Owner-occupied | Renter-occupied |
| Single Unit, Detached | 75 (77.3%) | 22 (22.7%) |
| Single Unit, Attached | 0 (0.0%) | 11 (100.0%) |
| 2 Unit Apartments | 0 (0.0%) | 0 (0.0%) |
| 3 or 4 Unit Apartments | 0 (0.0%) | 0 (0.0%) |
| 5 to 9 Unit Apartments | 0 (0.0%) | 0 (0.0%) |
| 10 or more Apartments | 0 (0.0%) | 0 (0.0%) |
| Mobile Home / Other | 6 (100.0%) | 0 (0.0%) |
| Total | 81 (71.1%) | 33 (28.9%) |
Housing Structures by Number of Rooms in Garden Valley
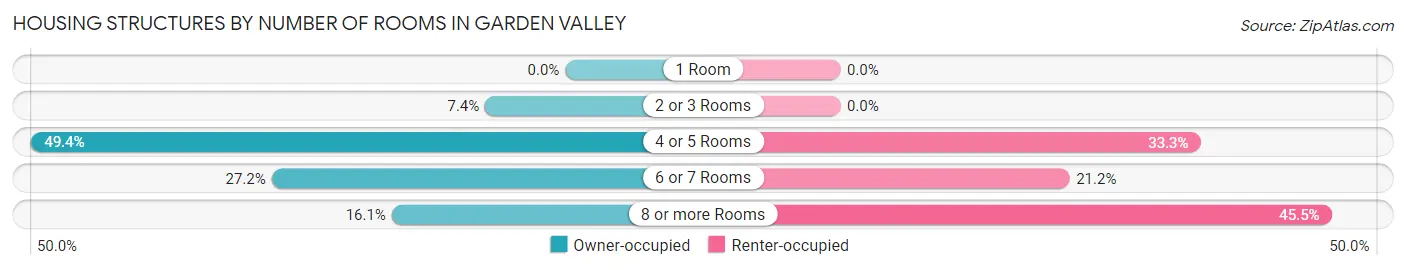
| Number of Rooms | Owner-occupied | Renter-occupied |
| 1 Room | 0 (0.0%) | 0 (0.0%) |
| 2 or 3 Rooms | 6 (7.4%) | 0 (0.0%) |
| 4 or 5 Rooms | 40 (49.4%) | 11 (33.3%) |
| 6 or 7 Rooms | 22 (27.2%) | 7 (21.2%) |
| 8 or more Rooms | 13 (16.1%) | 15 (45.5%) |
| Total | 81 (100.0%) | 33 (100.0%) |
Housing Structure by Heating Type in Garden Valley
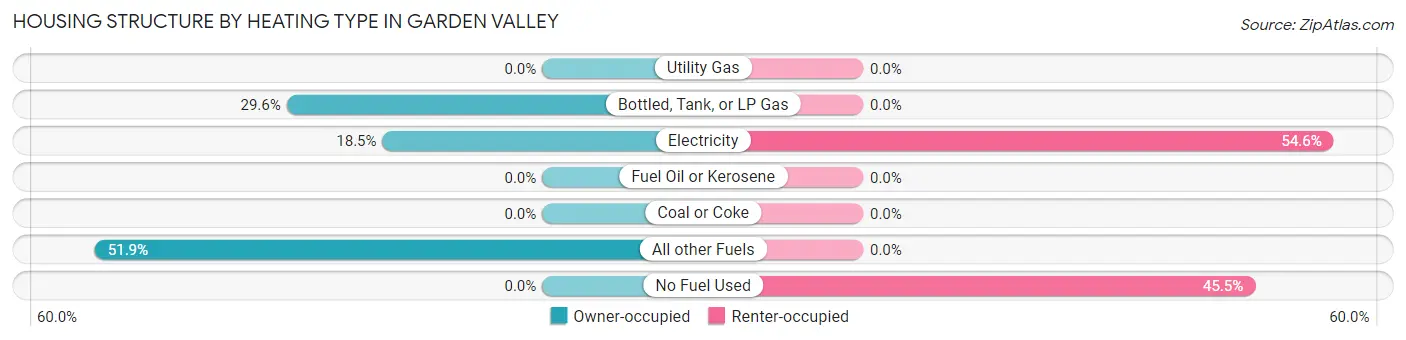
| Heating Type | Owner-occupied | Renter-occupied |
| Utility Gas | 0 (0.0%) | 0 (0.0%) |
| Bottled, Tank, or LP Gas | 24 (29.6%) | 0 (0.0%) |
| Electricity | 15 (18.5%) | 18 (54.5%) |
| Fuel Oil or Kerosene | 0 (0.0%) | 0 (0.0%) |
| Coal or Coke | 0 (0.0%) | 0 (0.0%) |
| All other Fuels | 42 (51.8%) | 0 (0.0%) |
| No Fuel Used | 0 (0.0%) | 15 (45.5%) |
| Total | 81 (100.0%) | 33 (100.0%) |
Household Vehicle Usage in Garden Valley
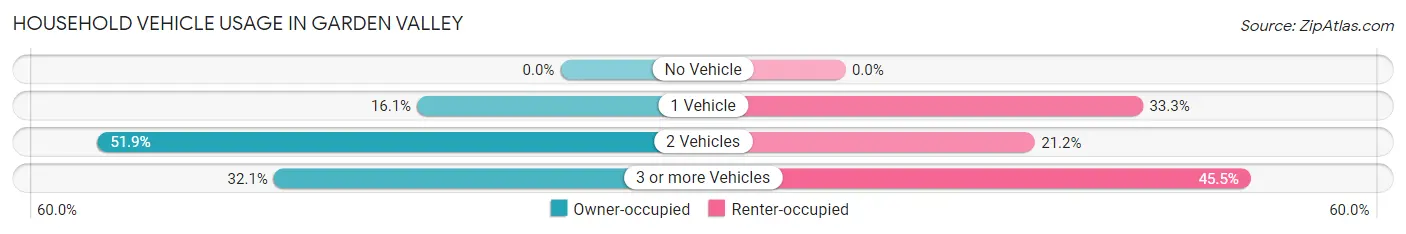
| Vehicles per Household | Owner-occupied | Renter-occupied |
| No Vehicle | 0 (0.0%) | 0 (0.0%) |
| 1 Vehicle | 13 (16.1%) | 11 (33.3%) |
| 2 Vehicles | 42 (51.8%) | 7 (21.2%) |
| 3 or more Vehicles | 26 (32.1%) | 15 (45.5%) |
| Total | 81 (100.0%) | 33 (100.0%) |
Real Estate & Mortgages in Garden Valley
Real Estate and Mortgage Overview in Garden Valley
| Characteristic | Without Mortgage | With Mortgage |
| Housing Units | 29 | 52 |
| Median Property Value | $331,800 | $284,200 |
| Median Household Income | - | - |
| Monthly Housing Costs | $384 | $0 |
| Real Estate Taxes | $1,813 | $0 |
Property Value by Mortgage Status in Garden Valley
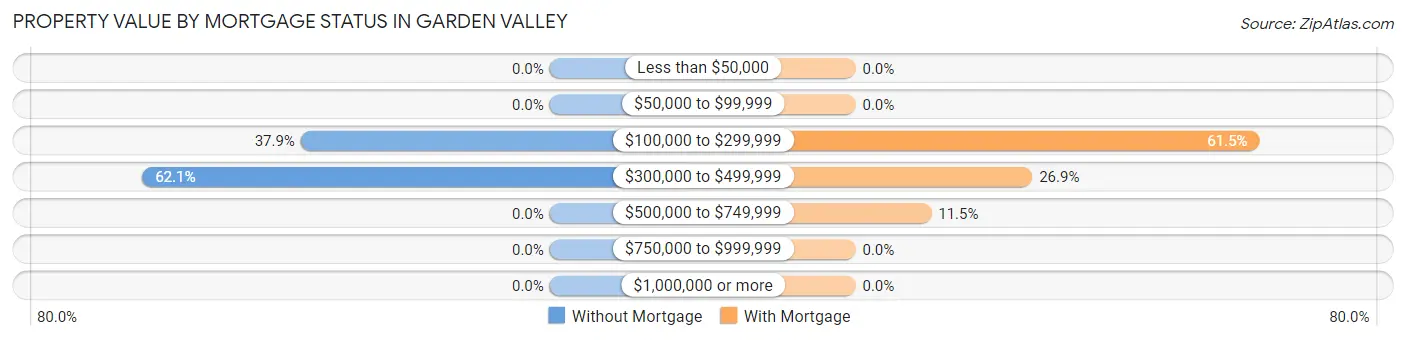
| Property Value | Without Mortgage | With Mortgage |
| Less than $50,000 | 0 (0.0%) | 0 (0.0%) |
| $50,000 to $99,999 | 0 (0.0%) | 0 (0.0%) |
| $100,000 to $299,999 | 11 (37.9%) | 32 (61.5%) |
| $300,000 to $499,999 | 18 (62.1%) | 14 (26.9%) |
| $500,000 to $749,999 | 0 (0.0%) | 6 (11.5%) |
| $750,000 to $999,999 | 0 (0.0%) | 0 (0.0%) |
| $1,000,000 or more | 0 (0.0%) | 0 (0.0%) |
| Total | 29 (100.0%) | 52 (100.0%) |
Household Income by Mortgage Status in Garden Valley
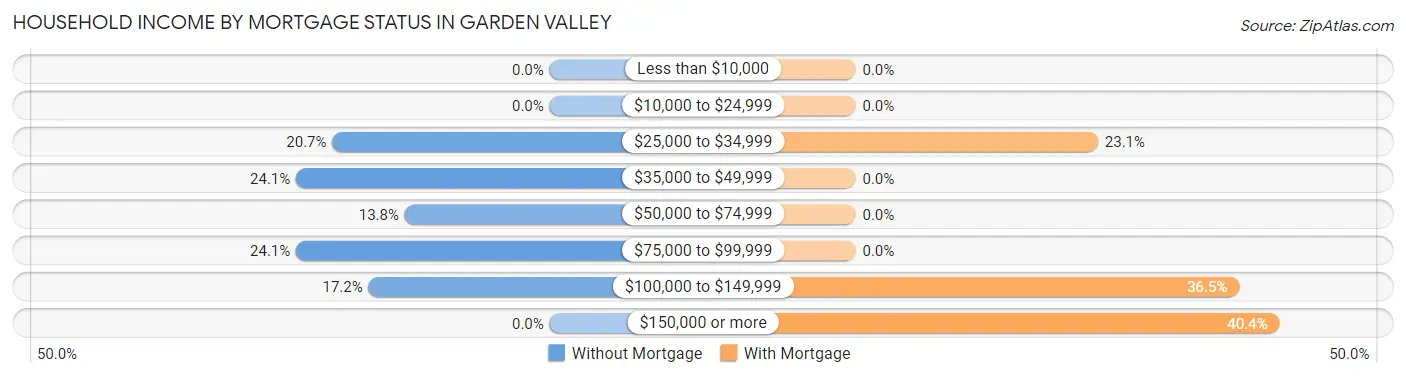
| Household Income | Without Mortgage | With Mortgage |
| Less than $10,000 | 0 (0.0%) | 0 (0.0%) |
| $10,000 to $24,999 | 0 (0.0%) | 0 (0.0%) |
| $25,000 to $34,999 | 6 (20.7%) | 12 (23.1%) |
| $35,000 to $49,999 | 7 (24.1%) | 0 (0.0%) |
| $50,000 to $74,999 | 4 (13.8%) | 0 (0.0%) |
| $75,000 to $99,999 | 7 (24.1%) | 0 (0.0%) |
| $100,000 to $149,999 | 5 (17.2%) | 19 (36.5%) |
| $150,000 or more | 0 (0.0%) | 21 (40.4%) |
| Total | 29 (100.0%) | 52 (100.0%) |
Property Value to Household Income Ratio in Garden Valley
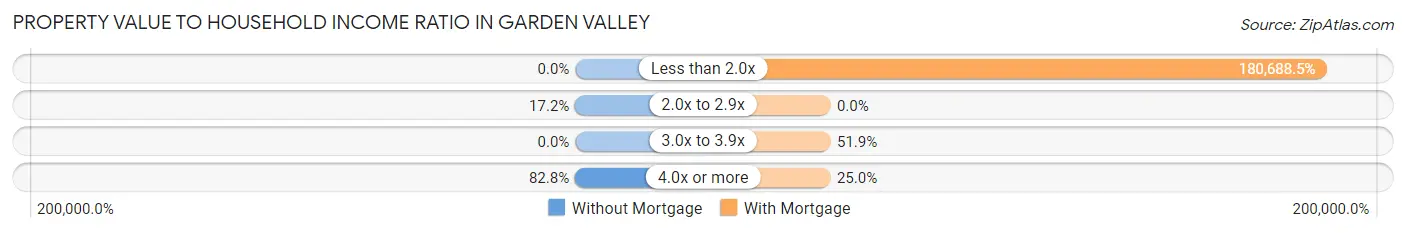
| Value-to-Income Ratio | Without Mortgage | With Mortgage |
| Less than 2.0x | 0 (0.0%) | 93,958 (180,688.5%) |
| 2.0x to 2.9x | 5 (17.2%) | 0 (0.0%) |
| 3.0x to 3.9x | 0 (0.0%) | 27 (51.9%) |
| 4.0x or more | 24 (82.8%) | 13 (25.0%) |
| Total | 29 (100.0%) | 52 (100.0%) |
Real Estate Taxes by Mortgage Status in Garden Valley
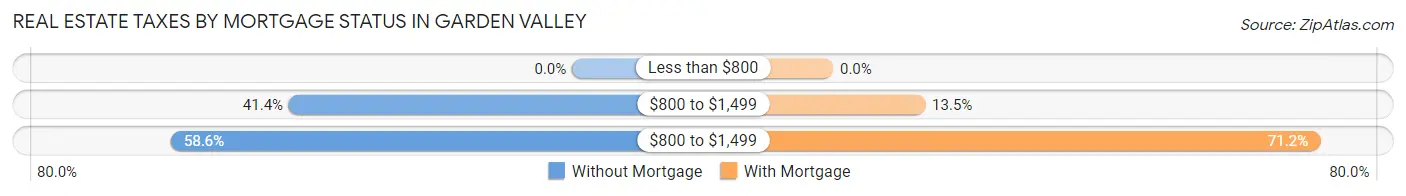
| Property Taxes | Without Mortgage | With Mortgage |
| Less than $800 | 0 (0.0%) | 0 (0.0%) |
| $800 to $1,499 | 12 (41.4%) | 7 (13.5%) |
| $800 to $1,499 | 17 (58.6%) | 37 (71.2%) |
| Total | 29 (100.0%) | 52 (100.0%) |
Health & Disability in Garden Valley
Health Insurance Coverage by Age in Garden Valley
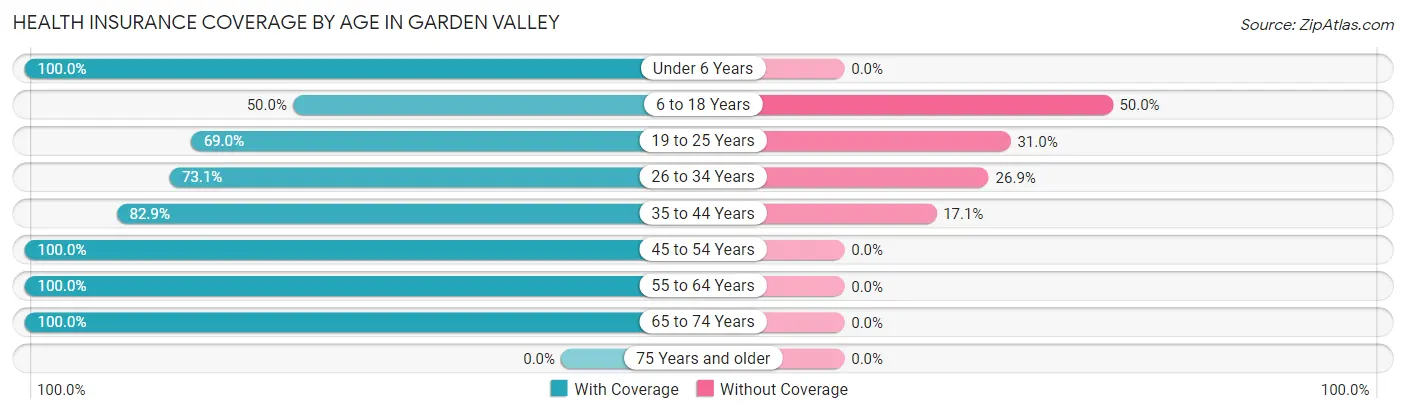
| Age Bracket | With Coverage | Without Coverage |
| Under 6 Years | 18 (100.0%) | 0 (0.0%) |
| 6 to 18 Years | 37 (50.0%) | 37 (50.0%) |
| 19 to 25 Years | 49 (69.0%) | 22 (31.0%) |
| 26 to 34 Years | 38 (73.1%) | 14 (26.9%) |
| 35 to 44 Years | 58 (82.9%) | 12 (17.1%) |
| 45 to 54 Years | 34 (100.0%) | 0 (0.0%) |
| 55 to 64 Years | 49 (100.0%) | 0 (0.0%) |
| 65 to 74 Years | 30 (100.0%) | 0 (0.0%) |
| 75 Years and older | 0 (0.0%) | 0 (0.0%) |
| Total | 313 (78.6%) | 85 (21.4%) |
Health Insurance Coverage by Citizenship Status in Garden Valley
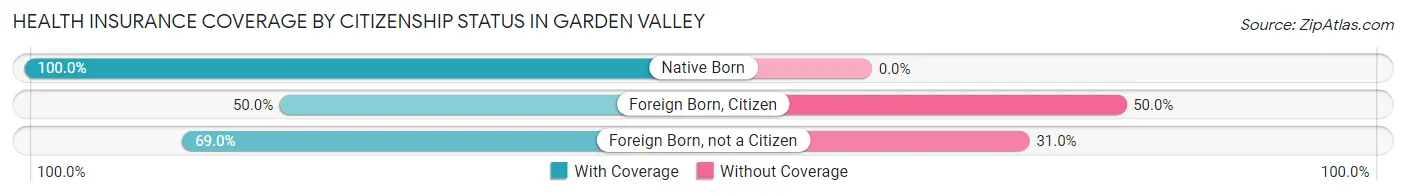
| Citizenship Status | With Coverage | Without Coverage |
| Native Born | 18 (100.0%) | 0 (0.0%) |
| Foreign Born, Citizen | 37 (50.0%) | 37 (50.0%) |
| Foreign Born, not a Citizen | 49 (69.0%) | 22 (31.0%) |
Health Insurance Coverage by Household Income in Garden Valley
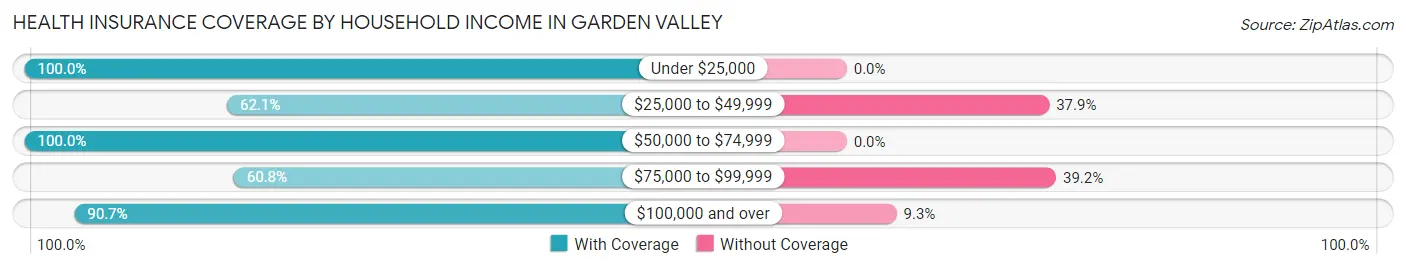
| Household Income | With Coverage | Without Coverage |
| Under $25,000 | 12 (100.0%) | 0 (0.0%) |
| $25,000 to $49,999 | 36 (62.1%) | 22 (37.9%) |
| $50,000 to $74,999 | 9 (100.0%) | 0 (0.0%) |
| $75,000 to $99,999 | 76 (60.8%) | 49 (39.2%) |
| $100,000 and over | 136 (90.7%) | 14 (9.3%) |
Public vs Private Health Insurance Coverage by Age in Garden Valley
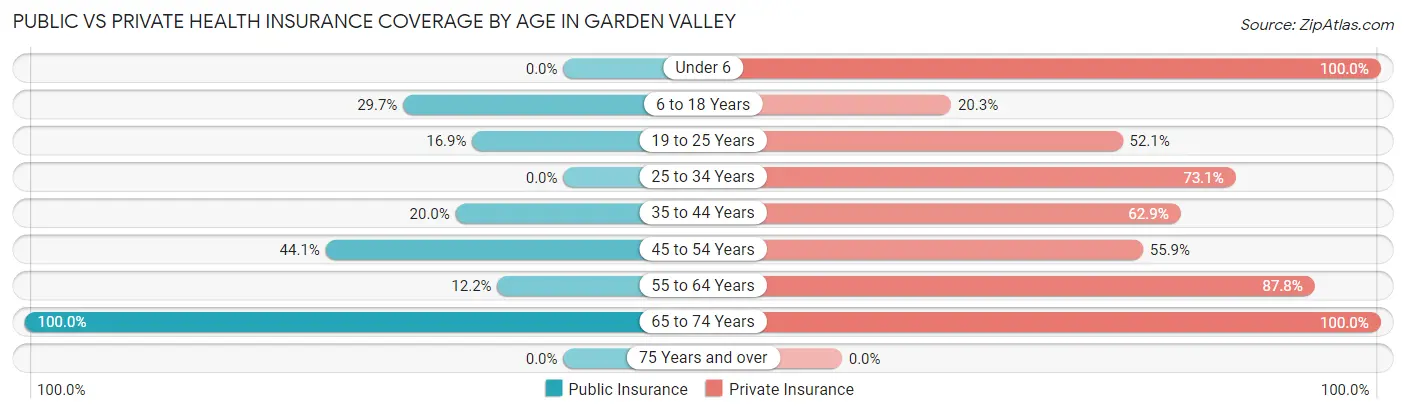
| Age Bracket | Public Insurance | Private Insurance |
| Under 6 | 0 (0.0%) | 18 (100.0%) |
| 6 to 18 Years | 22 (29.7%) | 15 (20.3%) |
| 19 to 25 Years | 12 (16.9%) | 37 (52.1%) |
| 25 to 34 Years | 0 (0.0%) | 38 (73.1%) |
| 35 to 44 Years | 14 (20.0%) | 44 (62.9%) |
| 45 to 54 Years | 15 (44.1%) | 19 (55.9%) |
| 55 to 64 Years | 6 (12.2%) | 43 (87.8%) |
| 65 to 74 Years | 30 (100.0%) | 30 (100.0%) |
| 75 Years and over | 0 (0.0%) | 0 (0.0%) |
| Total | 99 (24.9%) | 244 (61.3%) |
Disability Status by Sex by Age in Garden Valley
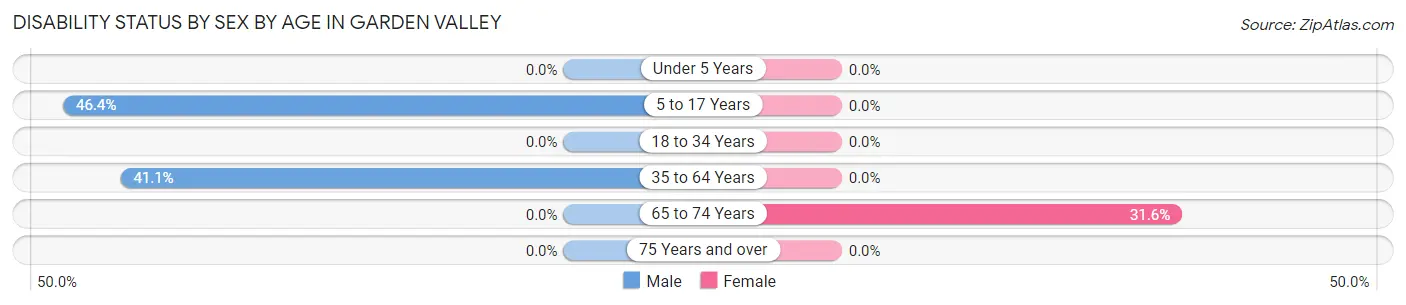
| Age Bracket | Male | Female |
| Under 5 Years | 0 (0.0%) | 0 (0.0%) |
| 5 to 17 Years | 13 (46.4%) | 0 (0.0%) |
| 18 to 34 Years | 0 (0.0%) | 0 (0.0%) |
| 35 to 64 Years | 30 (41.1%) | 0 (0.0%) |
| 65 to 74 Years | 0 (0.0%) | 6 (31.6%) |
| 75 Years and over | 0 (0.0%) | 0 (0.0%) |
Disability Class by Sex by Age in Garden Valley
Disability Class: Hearing Difficulty
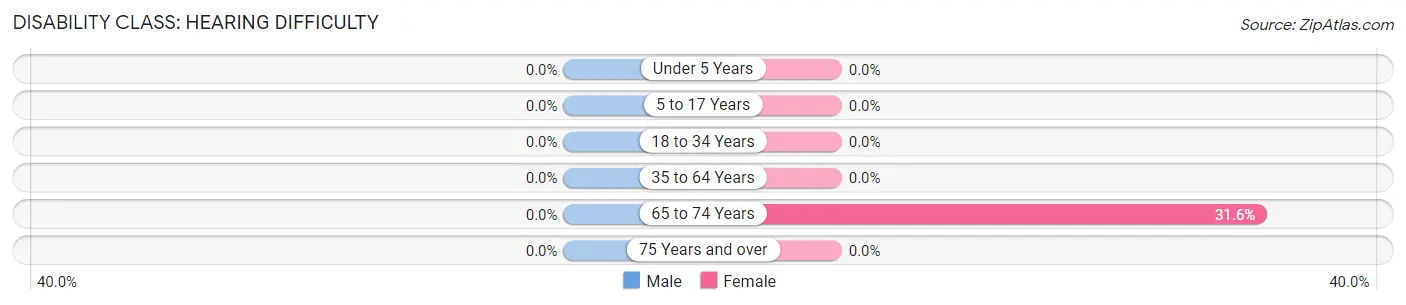
| Age Bracket | Male | Female |
| Under 5 Years | 0 (0.0%) | 0 (0.0%) |
| 5 to 17 Years | 0 (0.0%) | 0 (0.0%) |
| 18 to 34 Years | 0 (0.0%) | 0 (0.0%) |
| 35 to 64 Years | 0 (0.0%) | 0 (0.0%) |
| 65 to 74 Years | 0 (0.0%) | 6 (31.6%) |
| 75 Years and over | 0 (0.0%) | 0 (0.0%) |
Disability Class: Vision Difficulty
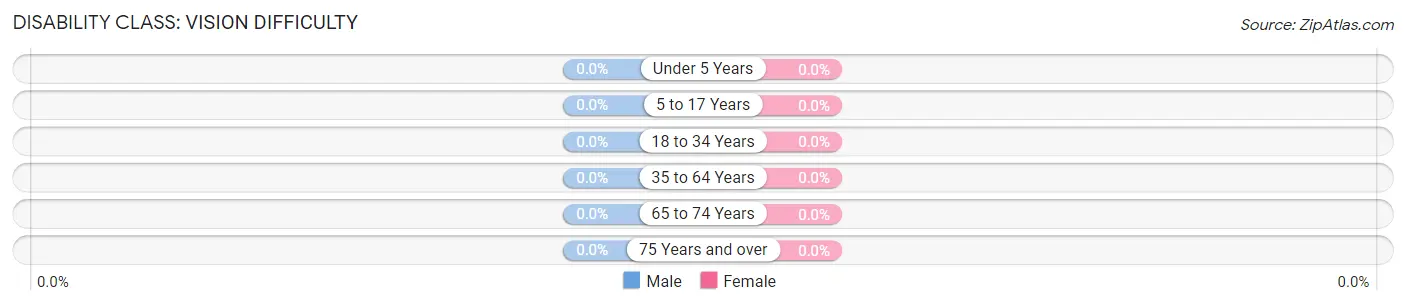
| Age Bracket | Male | Female |
| Under 5 Years | 0 (0.0%) | 0 (0.0%) |
| 5 to 17 Years | 0 (0.0%) | 0 (0.0%) |
| 18 to 34 Years | 0 (0.0%) | 0 (0.0%) |
| 35 to 64 Years | 0 (0.0%) | 0 (0.0%) |
| 65 to 74 Years | 0 (0.0%) | 0 (0.0%) |
| 75 Years and over | 0 (0.0%) | 0 (0.0%) |
Disability Class: Cognitive Difficulty
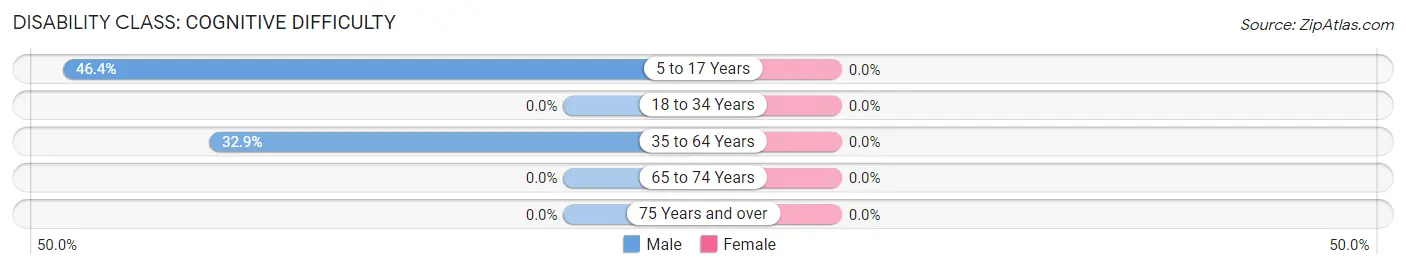
| Age Bracket | Male | Female |
| 5 to 17 Years | 13 (46.4%) | 0 (0.0%) |
| 18 to 34 Years | 0 (0.0%) | 0 (0.0%) |
| 35 to 64 Years | 24 (32.9%) | 0 (0.0%) |
| 65 to 74 Years | 0 (0.0%) | 0 (0.0%) |
| 75 Years and over | 0 (0.0%) | 0 (0.0%) |
Disability Class: Ambulatory Difficulty
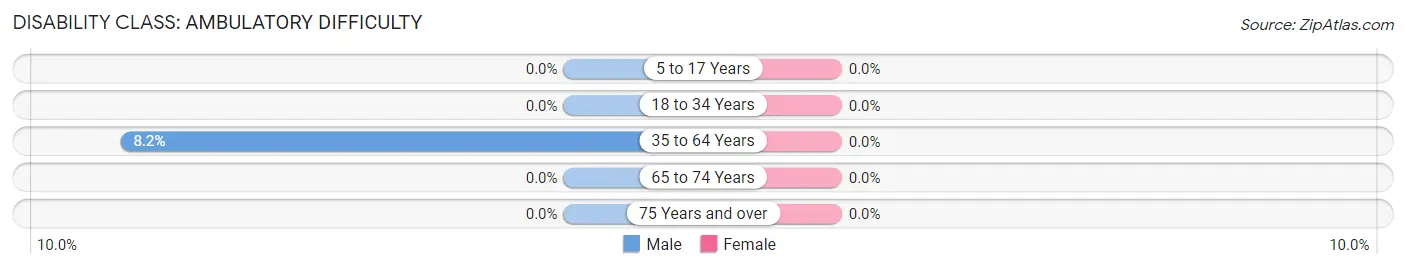
| Age Bracket | Male | Female |
| 5 to 17 Years | 0 (0.0%) | 0 (0.0%) |
| 18 to 34 Years | 0 (0.0%) | 0 (0.0%) |
| 35 to 64 Years | 6 (8.2%) | 0 (0.0%) |
| 65 to 74 Years | 0 (0.0%) | 0 (0.0%) |
| 75 Years and over | 0 (0.0%) | 0 (0.0%) |
Disability Class: Self-Care Difficulty
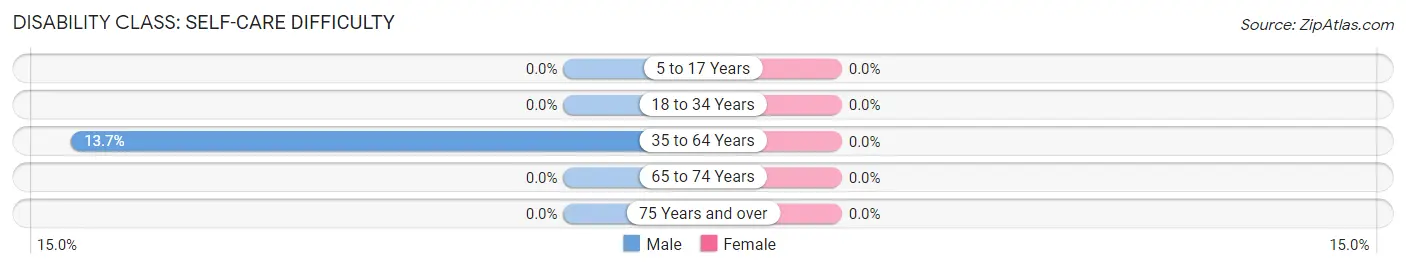
| Age Bracket | Male | Female |
| 5 to 17 Years | 0 (0.0%) | 0 (0.0%) |
| 18 to 34 Years | 0 (0.0%) | 0 (0.0%) |
| 35 to 64 Years | 10 (13.7%) | 0 (0.0%) |
| 65 to 74 Years | 0 (0.0%) | 0 (0.0%) |
| 75 Years and over | 0 (0.0%) | 0 (0.0%) |
Technology Access in Garden Valley
Computing Device Access in Garden Valley
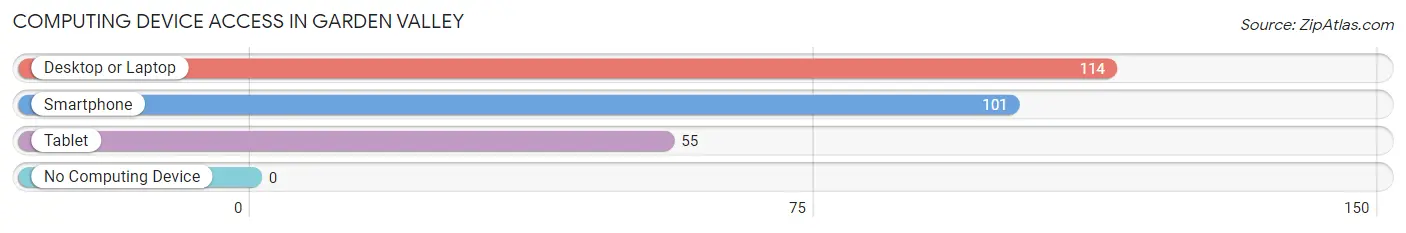
| Device Type | # Households | % Households |
| Desktop or Laptop | 114 | 100.0% |
| Smartphone | 101 | 88.6% |
| Tablet | 55 | 48.2% |
| No Computing Device | 0 | 0.0% |
| Total | 114 | 100.0% |
Internet Access in Garden Valley
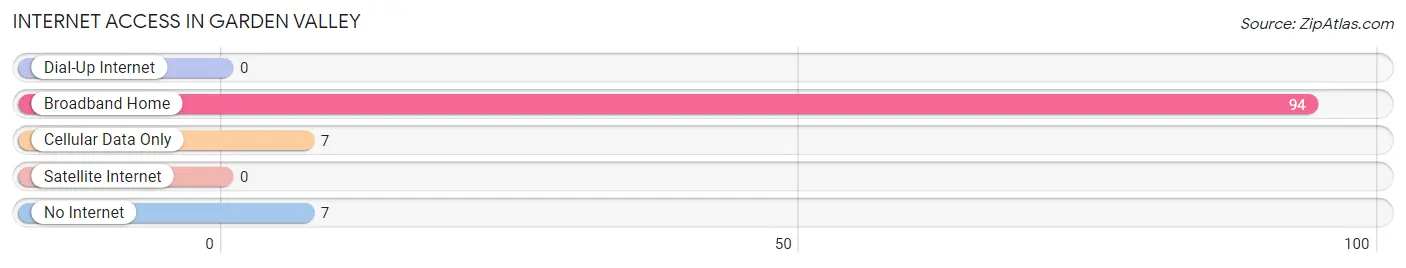
| Internet Type | # Households | % Households |
| Dial-Up Internet | 0 | 0.0% |
| Broadband Home | 94 | 82.5% |
| Cellular Data Only | 7 | 6.1% |
| Satellite Internet | 0 | 0.0% |
| No Internet | 7 | 6.1% |
| Total | 114 | 100.0% |
Garden Valley Summary
Garden Valley, Idaho is a small, rural community located in the Boise National Forest in the western part of the state. It is situated in the Payette River Valley, approximately 40 miles northeast of Boise. The population of Garden Valley was estimated to be 1,092 in 2019.
History
Garden Valley was first settled in the late 1800s by miners and loggers who were drawn to the area by the abundance of natural resources. The town was officially established in 1883 and named after the nearby Garden Creek. The first post office was established in 1884.
In the early 1900s, the area was a popular destination for tourists who came to enjoy the natural beauty of the Payette River Valley. The town was also home to several sawmills and a large lumber mill.
In the 1950s, the area began to experience a decline in population as the timber industry declined and the local economy shifted to ranching and farming. The town was incorporated in 1962.
Geography
Garden Valley is located in the western part of Idaho in the Payette River Valley. The town is situated at an elevation of 3,400 feet and is surrounded by the Boise National Forest. The area is known for its rugged terrain and scenic beauty.
The climate in Garden Valley is semi-arid, with hot summers and cold winters. The average annual temperature is approximately 50 degrees Fahrenheit. The area receives an average of 16 inches of precipitation per year.
Economy
The economy of Garden Valley is largely based on tourism and agriculture. The area is home to several small businesses, including restaurants, lodging, and retail stores.
Agriculture is an important part of the local economy. The area is known for its production of potatoes, hay, and other crops. Livestock production is also important, with cattle, sheep, and horses being raised in the area.
Demographics
As of 2019, the population of Garden Valley was estimated to be 1,092. The population is predominantly white, with approximately 95% of the population identifying as Caucasian. The median household income is $45,000, and the median age is 44.
The area is served by the Garden Valley School District, which includes an elementary school, a middle school, and a high school. The town is also home to a public library and a community center.
Conclusion
Garden Valley, Idaho is a small, rural community located in the Boise National Forest in the western part of the state. It is situated in the Payette River Valley, approximately 40 miles northeast of Boise. The population of Garden Valley was estimated to be 1,092 in 2019. The economy of Garden Valley is largely based on tourism and agriculture, and the area is known for its production of potatoes, hay, and other crops. The population is predominantly white, with approximately 95% of the population identifying as Caucasian. The area is served by the Garden Valley School District, which includes an elementary school, a middle school, and a high school. The town is also home to a public library and a community center.
Common Questions
What is the Total Population of Garden Valley?
Total Population of Garden Valley is 409.
What is the Total Male Population of Garden Valley?
Total Male Population of Garden Valley is 198.
What is the Total Female Population of Garden Valley?
Total Female Population of Garden Valley is 211.
What is the Ratio of Males per 100 Females in Garden Valley?
There are 93.84 Males per 100 Females in Garden Valley.
What is the Ratio of Females per 100 Males in Garden Valley?
There are 106.57 Females per 100 Males in Garden Valley.
What is the Median Population Age in Garden Valley?
Median Population Age in Garden Valley is 31.5 Years.
What is the Average Family Size in Garden Valley
Average Family Size in Garden Valley is 3.4 People.
What is the Average Household Size in Garden Valley
Average Household Size in Garden Valley is 3.1 People.
What is Per Capita Income in Garden Valley?
Per Capita income in Garden Valley is $26,161.
What is the Median Family Income in Garden Valley?
Median Family Income in Garden Valley is $100,179.
What is the Median Household income in Garden Valley?
Median Household Income in Garden Valley is $94,583.
What is Inequality or Gini Index in Garden Valley?
Inequality or Gini Index in Garden Valley is 0.26.
How Large is the Labor Force in Garden Valley?
There are 269 People in the Labor Forcein in Garden Valley.
What is the Percentage of People in the Labor Force in Garden Valley?
78.4% of People are in the Labor Force in Garden Valley.