Clifton, ID
Clifton Map
Clifton Overview
735
TOTAL POPULATION
345
MALE POPULATION
390
FEMALE POPULATION
88.46
MALES / 100 FEMALES
113.04
FEMALES / 100 MALES
22.8
MEDIAN AGE
3.9
AVG FAMILY SIZE
3.5
AVG HOUSEHOLD SIZE
$26,976
PER CAPITA INCOME
$90,000
AVG FAMILY INCOME
$96,750
AVG HOUSEHOLD INCOME
0.25
INEQUALITY / GINI INDEX
382
LABOR FORCE [ PEOPLE ]
72.9%
PERCENT IN LABOR FORCE
2.4%
UNEMPLOYMENT RATE
Clifton Zip Codes
Clifton Area Codes
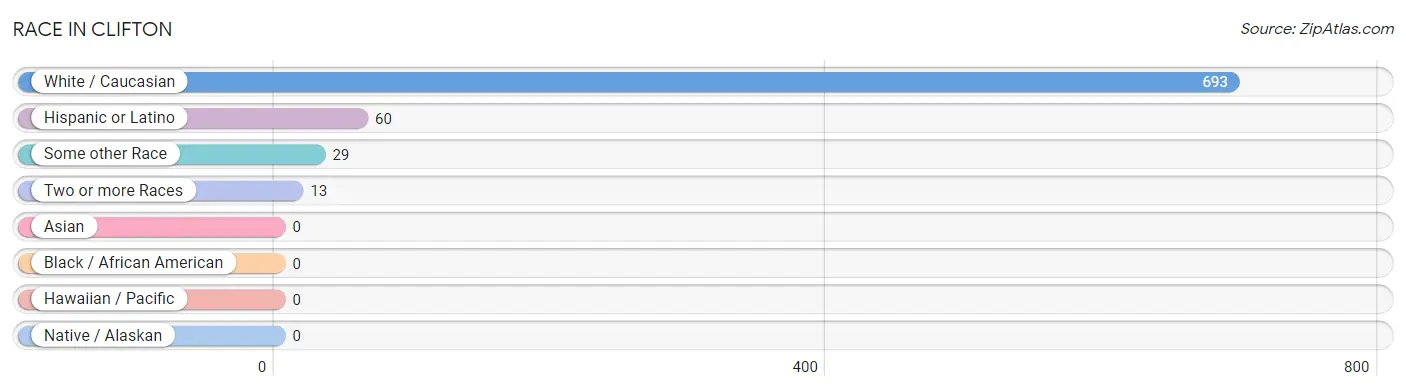
Race in Clifton
The most populous races in Clifton are White / Caucasian (693 | 94.3%), Hispanic or Latino (60 | 8.2%), and Some other Race (29 | 4.0%).
| Race | # Population | % Population |
| Asian | 0 | 0.0% |
| Black / African American | 0 | 0.0% |
| Hawaiian / Pacific | 0 | 0.0% |
| Hispanic or Latino | 60 | 8.2% |
| Native / Alaskan | 0 | 0.0% |
| White / Caucasian | 693 | 94.3% |
| Two or more Races | 13 | 1.8% |
| Some other Race | 29 | 4.0% |
| Total | 735 | 100.0% |
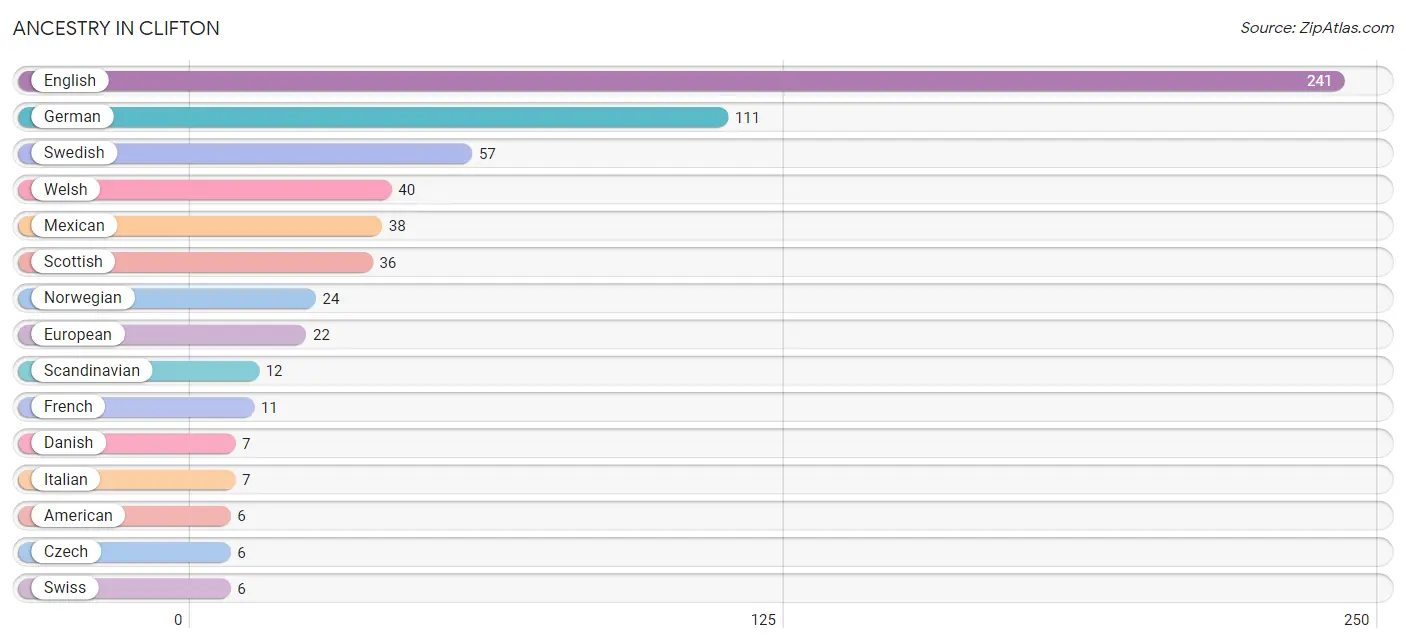
Ancestry in Clifton
The most populous ancestries reported in Clifton are English (241 | 32.8%), German (111 | 15.1%), Swedish (57 | 7.8%), Welsh (40 | 5.4%), and Mexican (38 | 5.2%), together accounting for 66.3% of all Clifton residents.
| Ancestry | # Population | % Population |
| American | 6 | 0.8% |
| Arab | 1 | 0.1% |
| Blackfeet | 1 | 0.1% |
| British | 2 | 0.3% |
| Czech | 6 | 0.8% |
| Danish | 7 | 0.9% |
| English | 241 | 32.8% |
| European | 22 | 3.0% |
| French | 11 | 1.5% |
| German | 111 | 15.1% |
| Irish | 2 | 0.3% |
| Italian | 7 | 0.9% |
| Lebanese | 1 | 0.1% |
| Mexican | 38 | 5.2% |
| Norwegian | 24 | 3.3% |
| Scandinavian | 12 | 1.6% |
| Scotch-Irish | 3 | 0.4% |
| Scottish | 36 | 4.9% |
| Swedish | 57 | 7.8% |
| Swiss | 6 | 0.8% |
| Welsh | 40 | 5.4% | View All 21 Rows |
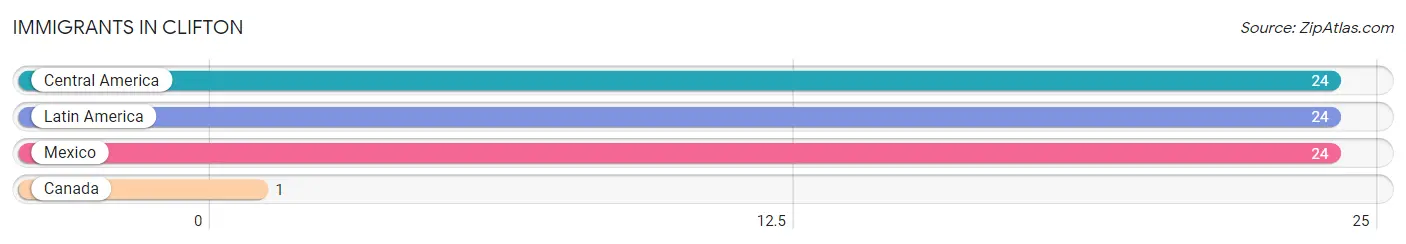
Immigrants in Clifton
The most numerous immigrant groups reported in Clifton came from Central America (24 | 3.3%), Latin America (24 | 3.3%), Mexico (24 | 3.3%), and Canada (1 | 0.1%), together accounting for 9.9% of all Clifton residents.
| Immigration Origin | # Population | % Population |
| Canada | 1 | 0.1% |
| Central America | 24 | 3.3% |
| Latin America | 24 | 3.3% |
| Mexico | 24 | 3.3% | View All 4 Rows |
Sex and Age in Clifton
Sex and Age in Clifton
The most populous age groups in Clifton are 10 to 14 Years (56 | 16.2%) for men and 20 to 24 Years (109 | 28.0%) for women.
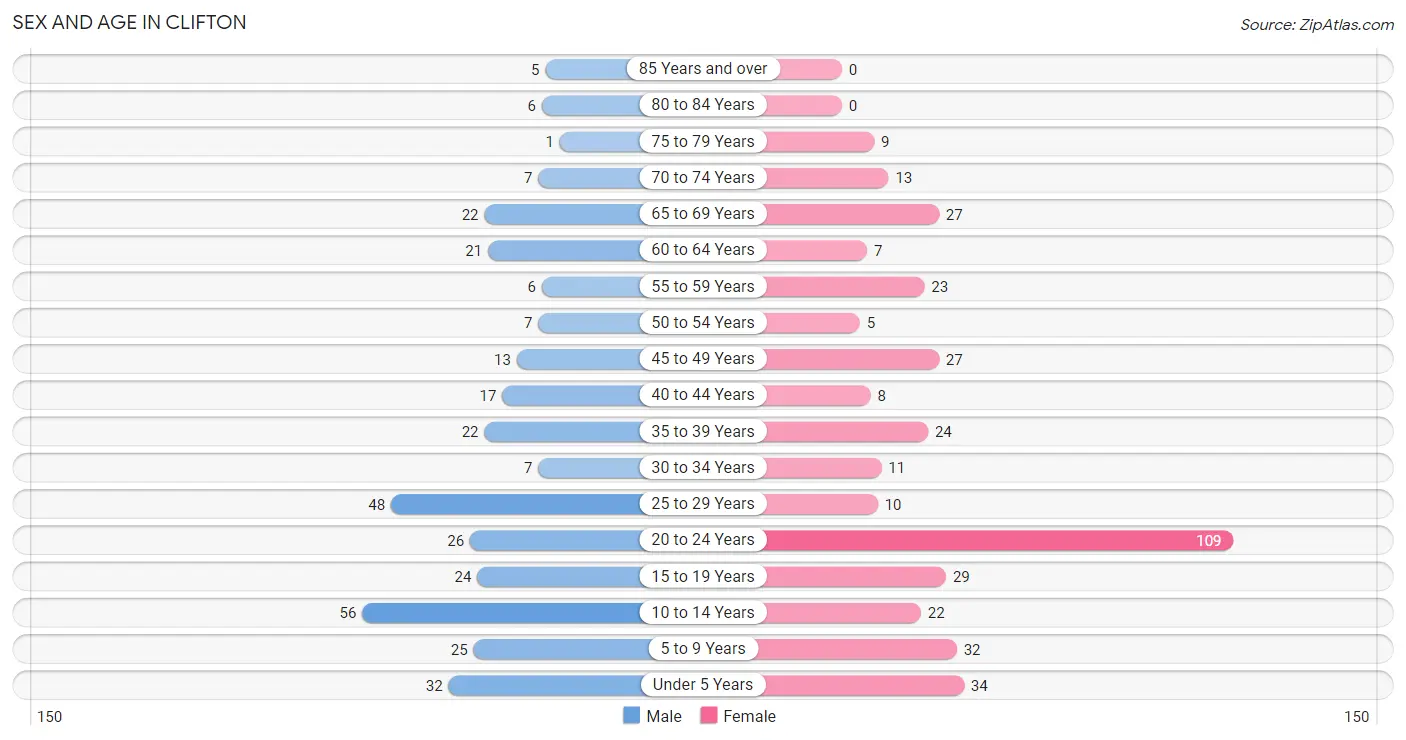
| Age Bracket | Male | Female |
| Under 5 Years | 32 (9.3%) | 34 (8.7%) |
| 5 to 9 Years | 25 (7.2%) | 32 (8.2%) |
| 10 to 14 Years | 56 (16.2%) | 22 (5.6%) |
| 15 to 19 Years | 24 (7.0%) | 29 (7.4%) |
| 20 to 24 Years | 26 (7.5%) | 109 (28.0%) |
| 25 to 29 Years | 48 (13.9%) | 10 (2.6%) |
| 30 to 34 Years | 7 (2.0%) | 11 (2.8%) |
| 35 to 39 Years | 22 (6.4%) | 24 (6.1%) |
| 40 to 44 Years | 17 (4.9%) | 8 (2.1%) |
| 45 to 49 Years | 13 (3.8%) | 27 (6.9%) |
| 50 to 54 Years | 7 (2.0%) | 5 (1.3%) |
| 55 to 59 Years | 6 (1.7%) | 23 (5.9%) |
| 60 to 64 Years | 21 (6.1%) | 7 (1.8%) |
| 65 to 69 Years | 22 (6.4%) | 27 (6.9%) |
| 70 to 74 Years | 7 (2.0%) | 13 (3.3%) |
| 75 to 79 Years | 1 (0.3%) | 9 (2.3%) |
| 80 to 84 Years | 6 (1.7%) | 0 (0.0%) |
| 85 Years and over | 5 (1.5%) | 0 (0.0%) |
| Total | 345 (100.0%) | 390 (100.0%) |
Families and Households in Clifton
Median Family Size in Clifton
The median family size in Clifton is 3.93 persons per family, with single male/father families (1 | 0.6%) accounting for the largest median family size of 4 persons per family. On the other hand, single female/mother families (4 | 2.4%) represent the smallest median family size with 2.50 persons per family.
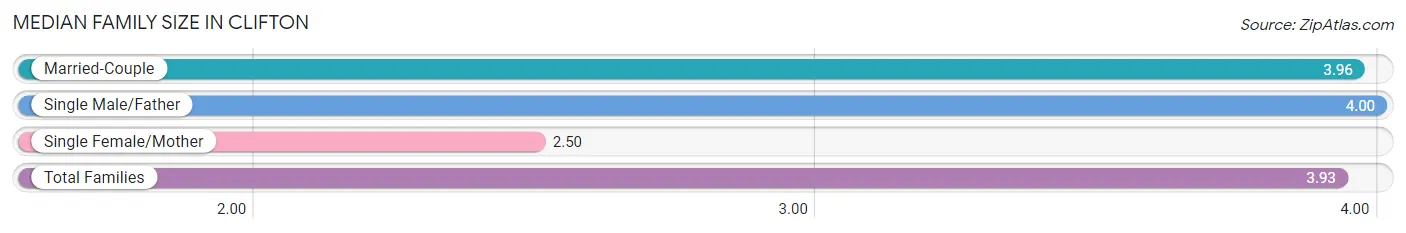
| Family Type | # Families | Family Size |
| Married-Couple | 165 (97.1%) | 3.96 |
| Single Male/Father | 1 (0.6%) | 4.00 |
| Single Female/Mother | 4 (2.4%) | 2.50 |
| Total Families | 170 (100.0%) | 3.93 |
Median Household Size in Clifton
The median household size in Clifton is 3.55 persons per household, with single male/father households (1 | 0.5%) accounting for the largest median household size of 4 persons per household. non-family households (37 | 17.9%) represent the smallest median household size with 1.81 persons per household.
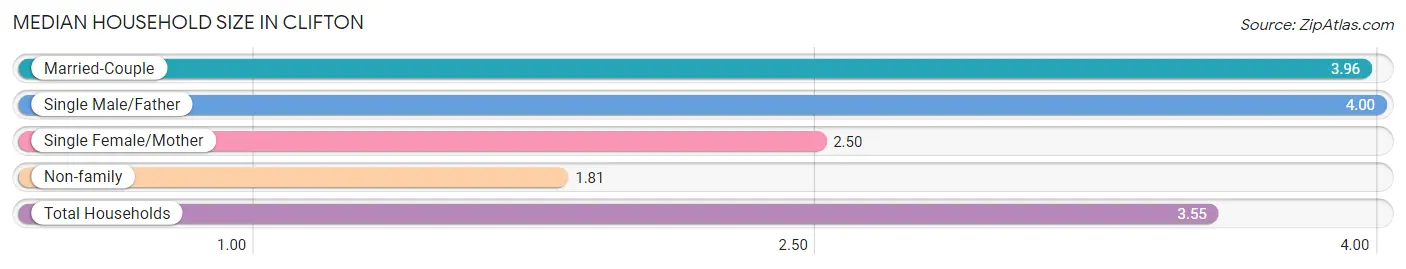
| Household Type | # Households | Household Size |
| Married-Couple | 165 (79.7%) | 3.96 |
| Single Male/Father | 1 (0.5%) | 4.00 |
| Single Female/Mother | 4 (1.9%) | 2.50 |
| Non-family | 37 (17.9%) | 1.81 |
| Total Households | 207 (100.0%) | 3.55 |
Household Size by Marriage Status in Clifton
Out of a total of 207 households in Clifton, 170 (82.1%) are family households, while 37 (17.9%) are nonfamily households. The most numerous type of family households are 2-person households, comprising 62, and the most common type of nonfamily households are 2-person households, comprising 25.
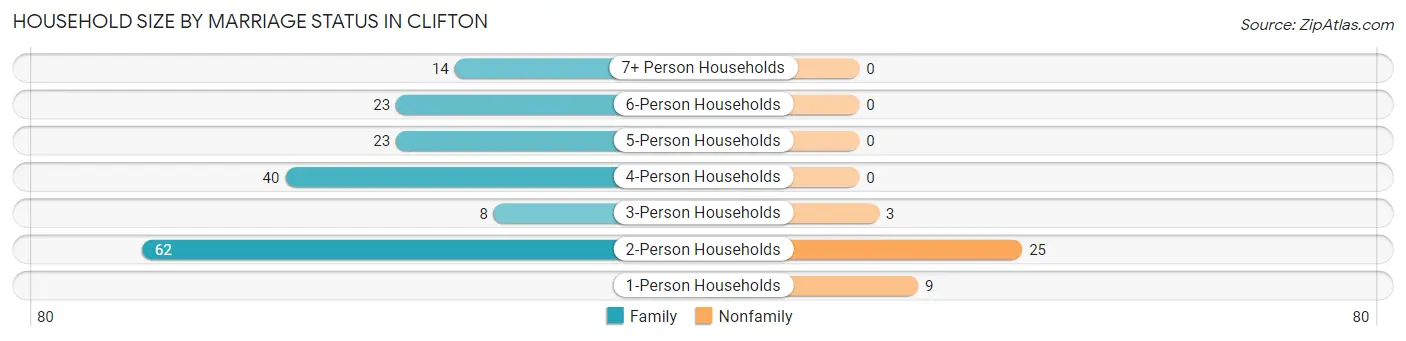
| Household Size | Family Households | Nonfamily Households |
| 1-Person Households | - | 9 (4.3%) |
| 2-Person Households | 62 (29.9%) | 25 (12.1%) |
| 3-Person Households | 8 (3.9%) | 3 (1.5%) |
| 4-Person Households | 40 (19.3%) | 0 (0.0%) |
| 5-Person Households | 23 (11.1%) | 0 (0.0%) |
| 6-Person Households | 23 (11.1%) | 0 (0.0%) |
| 7+ Person Households | 14 (6.8%) | 0 (0.0%) |
| Total | 170 (82.1%) | 37 (17.9%) |
Female Fertility in Clifton
Fertility by Age in Clifton
Average fertility rate in Clifton is 14.0 births per 1,000 women. Women in the age bracket of 35 to 50 years have the highest fertility rate with 17.0 births per 1,000 women. Women in the age bracket of 20 to 34 years acount for 66.7% of all women with births.
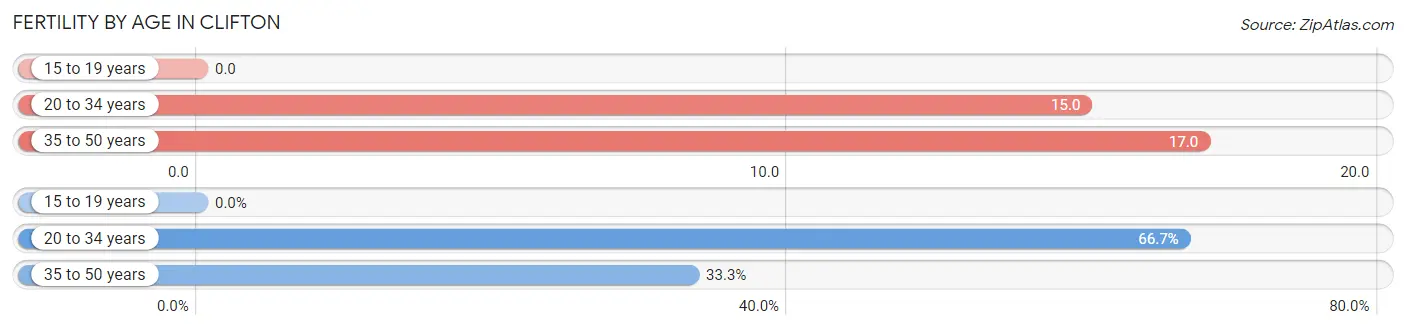
| Age Bracket | Women with Births | Births / 1,000 Women |
| 15 to 19 years | 0 (0.0%) | 0.0 |
| 20 to 34 years | 2 (66.7%) | 15.0 |
| 35 to 50 years | 1 (33.3%) | 17.0 |
| Total | 3 (100.0%) | 14.0 |
Fertility by Age by Marriage Status in Clifton
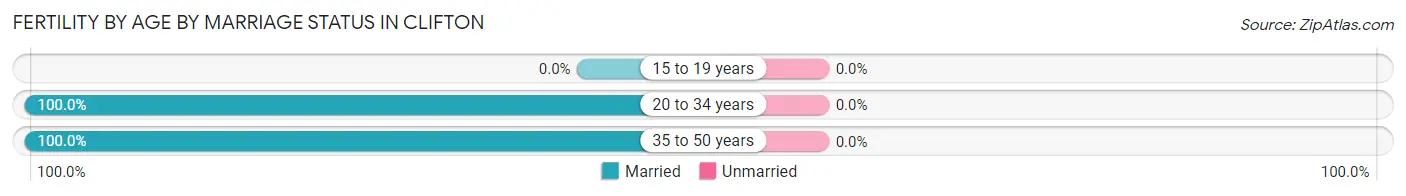
| Age Bracket | Married | Unmarried |
| 15 to 19 years | 0 (0.0%) | 0 (0.0%) |
| 20 to 34 years | 2 (100.0%) | 0 (0.0%) |
| 35 to 50 years | 1 (100.0%) | 0 (0.0%) |
| Total | 3 (100.0%) | 0 (0.0%) |
Fertility by Education in Clifton
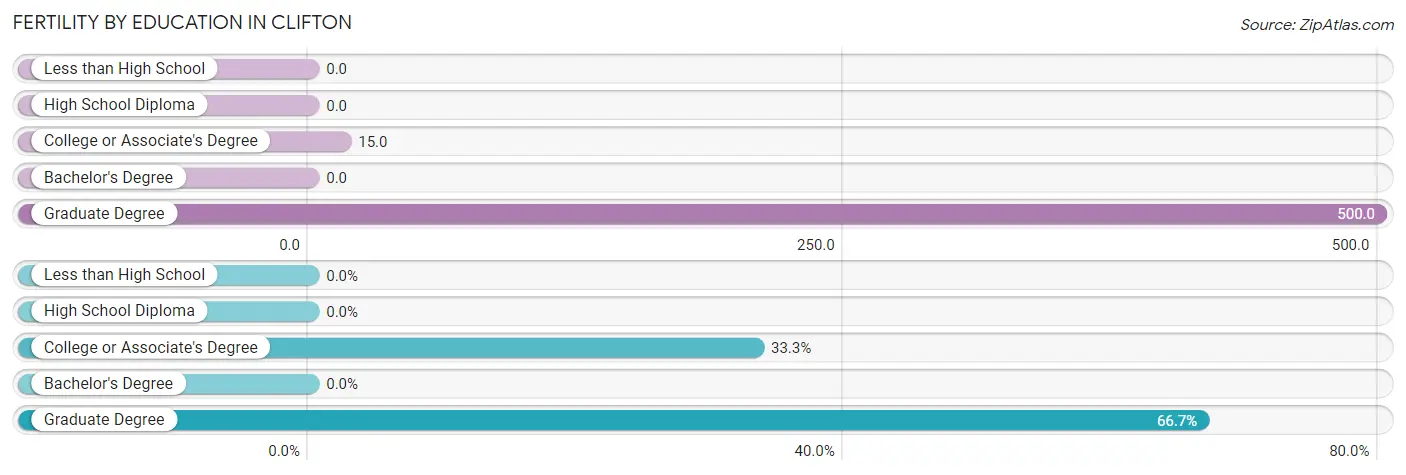
| Educational Attainment | Women with Births | Births / 1,000 Women |
| Less than High School | 0 (0.0%) | 0.0 |
| High School Diploma | 0 (0.0%) | 0.0 |
| College or Associate's Degree | 1 (33.3%) | 15.0 |
| Bachelor's Degree | 0 (0.0%) | 0.0 |
| Graduate Degree | 2 (66.7%) | 500.0 |
| Total | 3 (100.0%) | 14.0 |
Fertility by Education by Marriage Status in Clifton
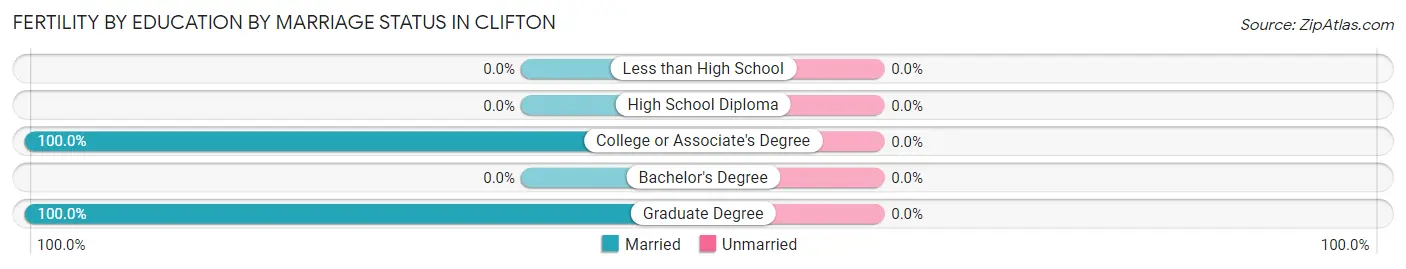
| Educational Attainment | Married | Unmarried |
| Less than High School | 0 (0.0%) | 0 (0.0%) |
| High School Diploma | 0 (0.0%) | 0 (0.0%) |
| College or Associate's Degree | 1 (100.0%) | 0 (0.0%) |
| Bachelor's Degree | 0 (0.0%) | 0 (0.0%) |
| Graduate Degree | 2 (100.0%) | 0 (0.0%) |
| Total | 3 (100.0%) | 0 (0.0%) |
Income in Clifton
Income Overview in Clifton
Per Capita Income in Clifton is $26,976, while median incomes of families and households are $90,000 and $96,750 respectively.
| Characteristic | Number | Measure |
| Per Capita Income | 735 | $26,976 |
| Median Family Income | 170 | $90,000 |
| Mean Family Income | 170 | $97,990 |
| Median Household Income | 207 | $96,750 |
| Mean Household Income | 207 | $96,338 |
| Income Deficit | 170 | $0 |
| Wage / Income Gap (%) | 735 | 0.00% |
| Wage / Income Gap ($) | 735 | 100.00¢ per $1 |
| Gini / Inequality Index | 735 | 0.25 |
Earnings by Sex in Clifton
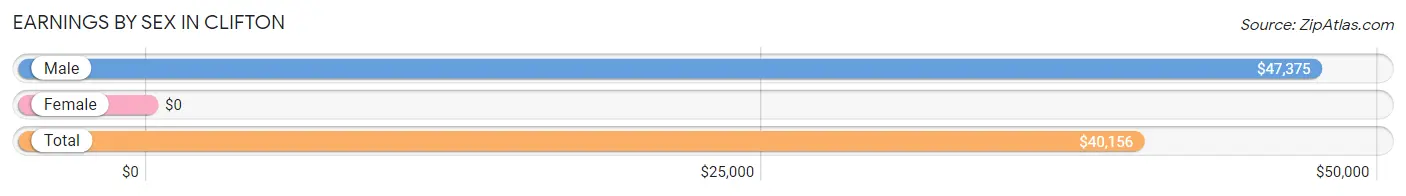
| Sex | Number | Average Earnings |
| Male | 197 (45.5%) | $47,375 |
| Female | 236 (54.5%) | $0 |
| Total | 433 (100.0%) | $40,156 |
Earnings by Sex by Income Bracket in Clifton
The most common earnings brackets in Clifton are $55,000 to $64,999 for men (42 | 21.3%) and $2,500 to $4,999 for women (41 | 17.4%).
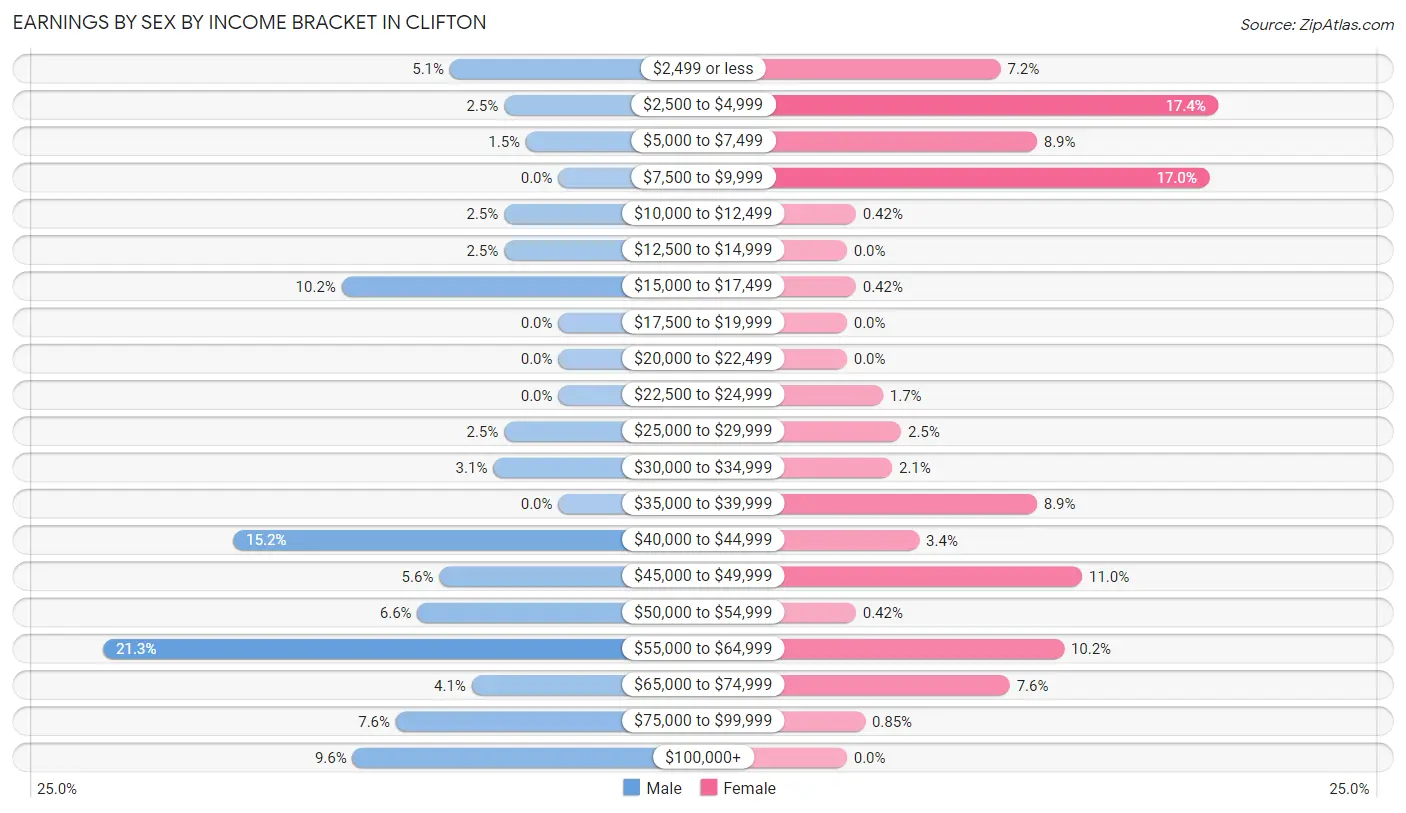
| Income | Male | Female |
| $2,499 or less | 10 (5.1%) | 17 (7.2%) |
| $2,500 to $4,999 | 5 (2.5%) | 41 (17.4%) |
| $5,000 to $7,499 | 3 (1.5%) | 21 (8.9%) |
| $7,500 to $9,999 | 0 (0.0%) | 40 (17.0%) |
| $10,000 to $12,499 | 5 (2.5%) | 1 (0.4%) |
| $12,500 to $14,999 | 5 (2.5%) | 0 (0.0%) |
| $15,000 to $17,499 | 20 (10.2%) | 1 (0.4%) |
| $17,500 to $19,999 | 0 (0.0%) | 0 (0.0%) |
| $20,000 to $22,499 | 0 (0.0%) | 0 (0.0%) |
| $22,500 to $24,999 | 0 (0.0%) | 4 (1.7%) |
| $25,000 to $29,999 | 5 (2.5%) | 6 (2.5%) |
| $30,000 to $34,999 | 6 (3.0%) | 5 (2.1%) |
| $35,000 to $39,999 | 0 (0.0%) | 21 (8.9%) |
| $40,000 to $44,999 | 30 (15.2%) | 8 (3.4%) |
| $45,000 to $49,999 | 11 (5.6%) | 26 (11.0%) |
| $50,000 to $54,999 | 13 (6.6%) | 1 (0.4%) |
| $55,000 to $64,999 | 42 (21.3%) | 24 (10.2%) |
| $65,000 to $74,999 | 8 (4.1%) | 18 (7.6%) |
| $75,000 to $99,999 | 15 (7.6%) | 2 (0.9%) |
| $100,000+ | 19 (9.6%) | 0 (0.0%) |
| Total | 197 (100.0%) | 236 (100.0%) |
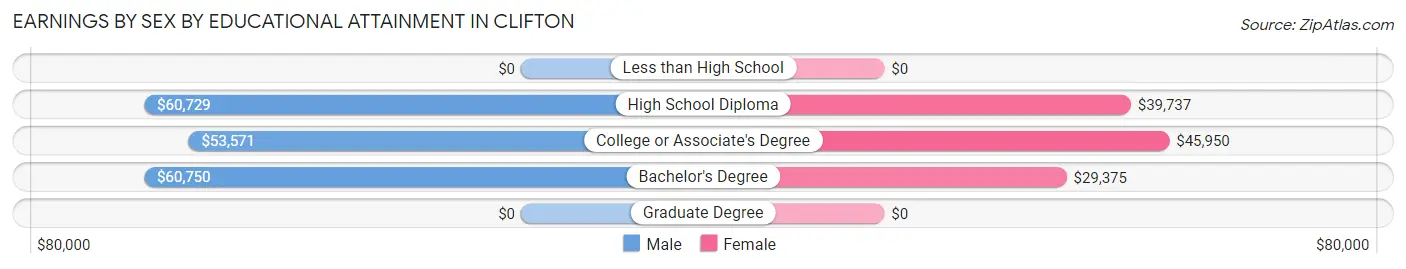
Earnings by Sex by Educational Attainment in Clifton
Average earnings in Clifton are $60,404 for men and $40,625 for women, a difference of 32.7%. Men with an educational attainment of bachelor's degree enjoy the highest average annual earnings of $60,750, while those with college or associate's degree education earn the least with $53,571. Women with an educational attainment of college or associate's degree earn the most with the average annual earnings of $45,950, while those with bachelor's degree education have the smallest earnings of $29,375.
| Educational Attainment | Male Income | Female Income |
| Less than High School | - | - |
| High School Diploma | $60,729 | $39,737 |
| College or Associate's Degree | $53,571 | $45,950 |
| Bachelor's Degree | $60,750 | $29,375 |
| Graduate Degree | - | - |
| Total | $60,404 | $40,625 |
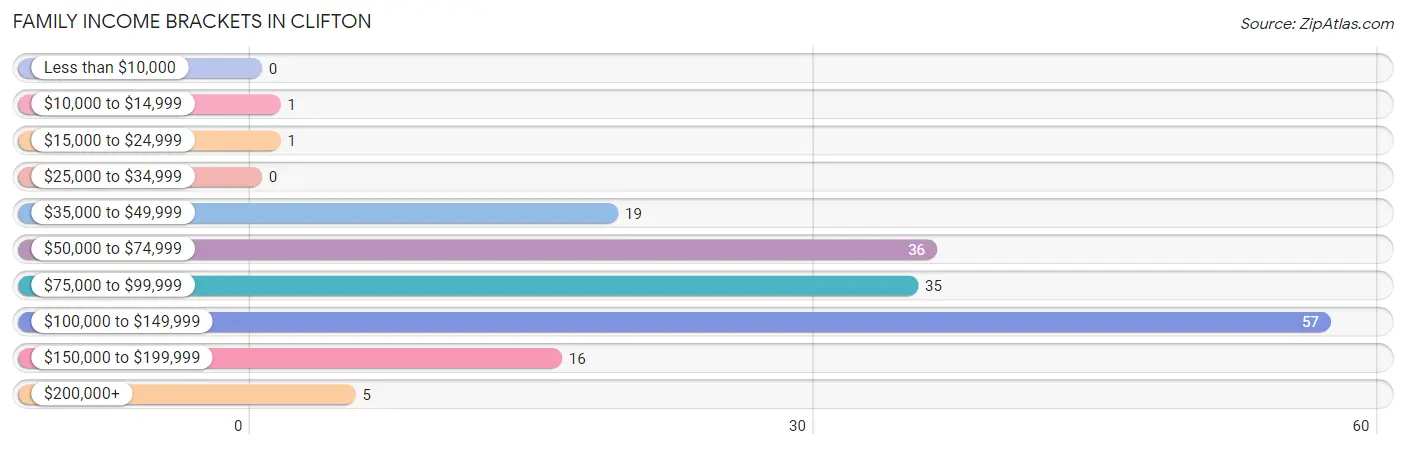
Family Income in Clifton
Family Income Brackets in Clifton
According to the Clifton family income data, there are 57 families falling into the $100,000 to $149,999 income range, which is the most common income bracket and makes up 33.5% of all families.
| Income Bracket | # Families | % Families |
| Less than $10,000 | 0 | 0.0% |
| $10,000 to $14,999 | 1 | 0.6% |
| $15,000 to $24,999 | 1 | 0.6% |
| $25,000 to $34,999 | 0 | 0.0% |
| $35,000 to $49,999 | 19 | 11.2% |
| $50,000 to $74,999 | 36 | 21.2% |
| $75,000 to $99,999 | 35 | 20.6% |
| $100,000 to $149,999 | 57 | 33.5% |
| $150,000 to $199,999 | 16 | 9.4% |
| $200,000+ | 5 | 2.9% |
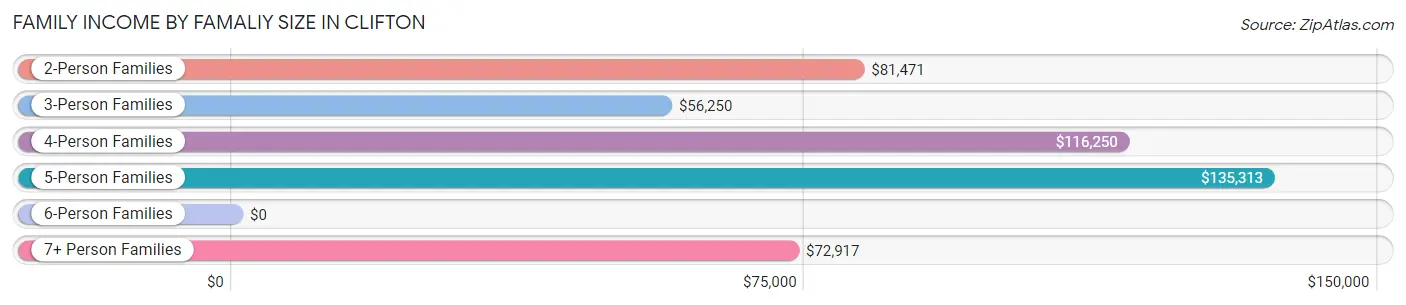
Family Income by Famaliy Size in Clifton
5-person families (23 | 13.5%) account for the highest median family income in Clifton with $135,313 per family, while 2-person families (62 | 36.5%) have the highest median income of $40,736 per family member.
| Income Bracket | # Families | Median Income |
| 2-Person Families | 62 (36.5%) | $81,471 |
| 3-Person Families | 8 (4.7%) | $56,250 |
| 4-Person Families | 40 (23.5%) | $116,250 |
| 5-Person Families | 23 (13.5%) | $135,313 |
| 6-Person Families | 23 (13.5%) | $0 |
| 7+ Person Families | 14 (8.2%) | $72,917 |
| Total | 170 (100.0%) | $90,000 |
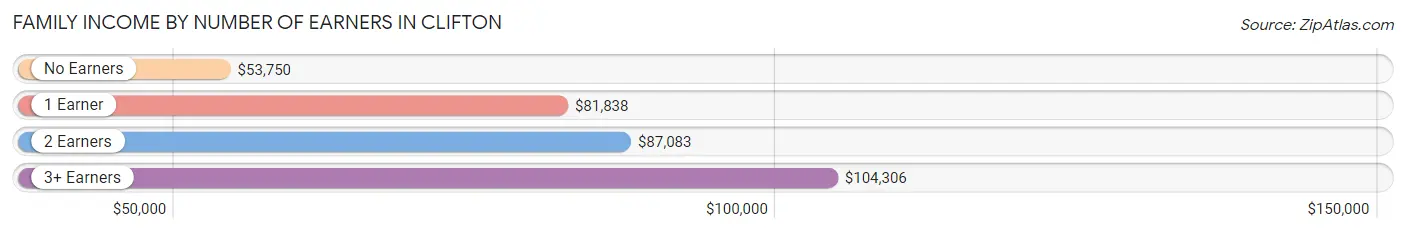
Family Income by Number of Earners in Clifton
The median family income in Clifton is $90,000, with families comprising 3+ earners (54) having the highest median family income of $104,306, while families with no earners (14) have the lowest median family income of $53,750, accounting for 31.8% and 8.2% of families, respectively.
| Number of Earners | # Families | Median Income |
| No Earners | 14 (8.2%) | $53,750 |
| 1 Earner | 59 (34.7%) | $81,838 |
| 2 Earners | 43 (25.3%) | $87,083 |
| 3+ Earners | 54 (31.8%) | $104,306 |
| Total | 170 (100.0%) | $90,000 |
Household Income in Clifton
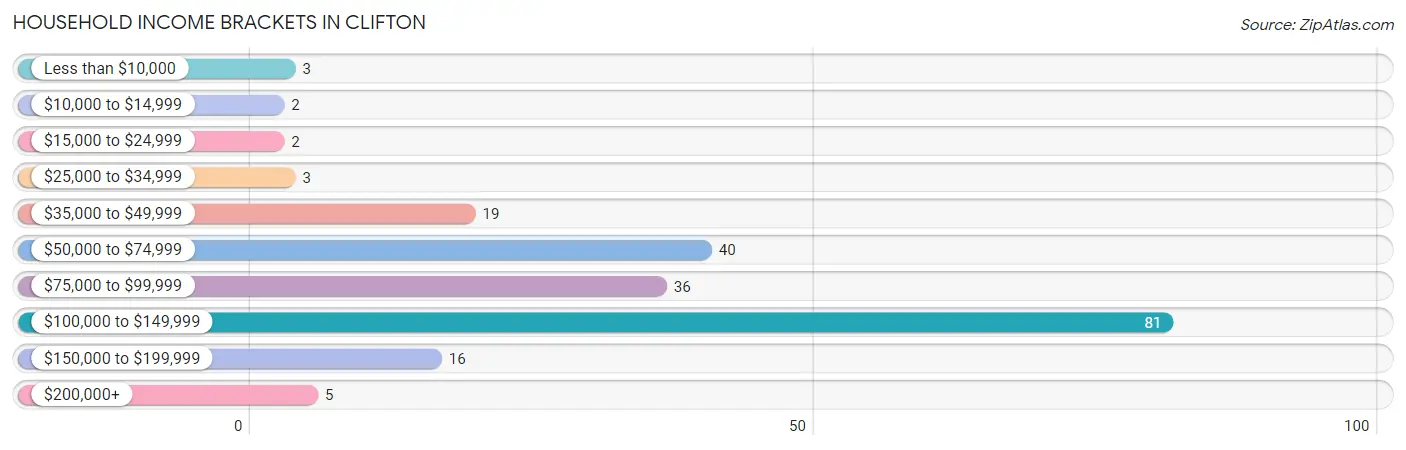
Household Income Brackets in Clifton
With 81 households falling in the category, the $100,000 to $149,999 income range is the most frequent in Clifton, accounting for 39.1% of all households. In contrast, only 2 households (1.0%) fall into the $10,000 to $14,999 income bracket, making it the least populous group.
| Income Bracket | # Households | % Households |
| Less than $10,000 | 3 | 1.4% |
| $10,000 to $14,999 | 2 | 1.0% |
| $15,000 to $24,999 | 2 | 1.0% |
| $25,000 to $34,999 | 3 | 1.4% |
| $35,000 to $49,999 | 19 | 9.2% |
| $50,000 to $74,999 | 40 | 19.3% |
| $75,000 to $99,999 | 36 | 17.4% |
| $100,000 to $149,999 | 81 | 39.1% |
| $150,000 to $199,999 | 16 | 7.7% |
| $200,000+ | 5 | 2.4% |
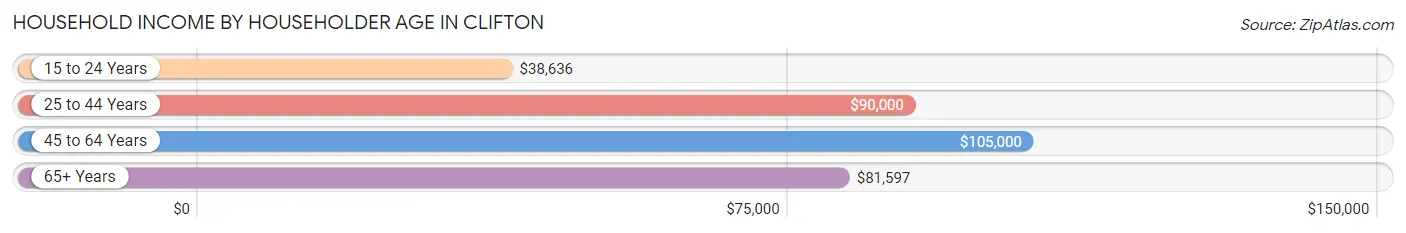
Household Income by Householder Age in Clifton
The median household income in Clifton is $96,750, with the highest median household income of $105,000 found in the 45 to 64 years age bracket for the primary householder. A total of 54 households (26.1%) fall into this category. Meanwhile, the 15 to 24 years age bracket for the primary householder has the lowest median household income of $38,636, with 16 households (7.7%) in this group.
| Income Bracket | # Households | Median Income |
| 15 to 24 Years | 16 (7.7%) | $38,636 |
| 25 to 44 Years | 86 (41.5%) | $90,000 |
| 45 to 64 Years | 54 (26.1%) | $105,000 |
| 65+ Years | 51 (24.6%) | $81,597 |
| Total | 207 (100.0%) | $96,750 |
Poverty in Clifton
Income Below Poverty by Sex and Age in Clifton
With 1.2% poverty level for males and 2.8% for females among the residents of Clifton, 12 to 14 year old males and 55 to 64 year old females are the most vulnerable to poverty, with 2 males (6.9%) and 3 females (10.0%) in their respective age groups living below the poverty level.
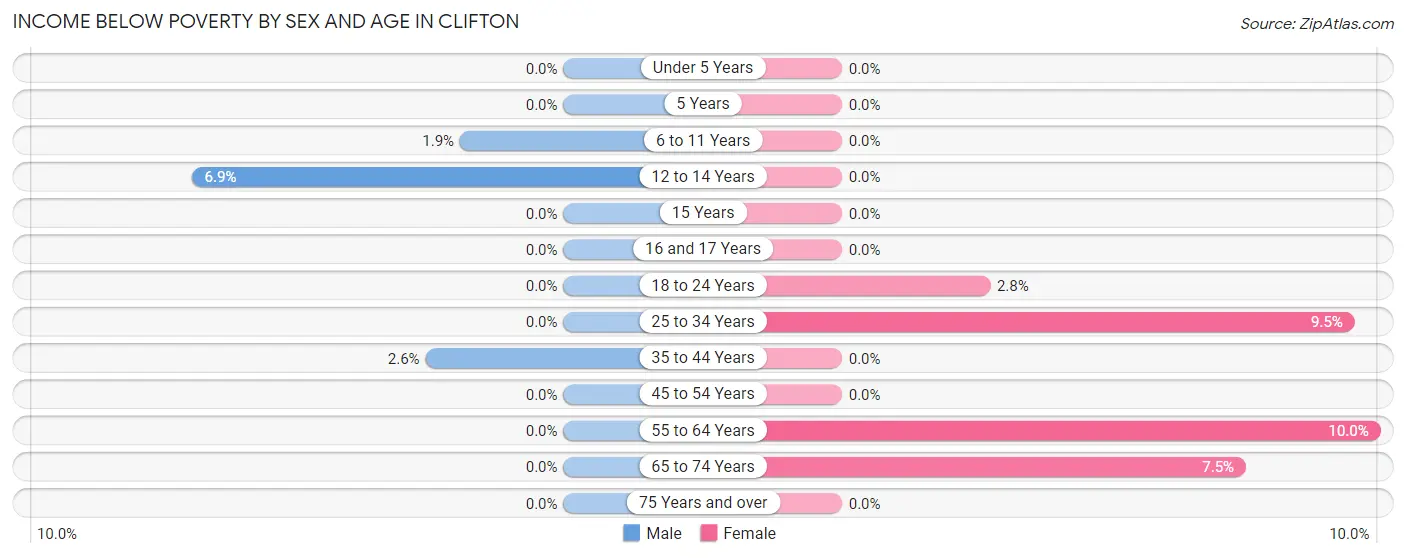
| Age Bracket | Male | Female |
| Under 5 Years | 0 (0.0%) | 0 (0.0%) |
| 5 Years | 0 (0.0%) | 0 (0.0%) |
| 6 to 11 Years | 1 (1.9%) | 0 (0.0%) |
| 12 to 14 Years | 2 (6.9%) | 0 (0.0%) |
| 15 Years | 0 (0.0%) | 0 (0.0%) |
| 16 and 17 Years | 0 (0.0%) | 0 (0.0%) |
| 18 to 24 Years | 0 (0.0%) | 3 (2.8%) |
| 25 to 34 Years | 0 (0.0%) | 2 (9.5%) |
| 35 to 44 Years | 1 (2.6%) | 0 (0.0%) |
| 45 to 54 Years | 0 (0.0%) | 0 (0.0%) |
| 55 to 64 Years | 0 (0.0%) | 3 (10.0%) |
| 65 to 74 Years | 0 (0.0%) | 3 (7.5%) |
| 75 Years and over | 0 (0.0%) | 0 (0.0%) |
| Total | 4 (1.2%) | 11 (2.8%) |
Income Above Poverty by Sex and Age in Clifton
According to the poverty statistics in Clifton, males aged under 5 years and females aged under 5 years are the age groups that are most secure financially, with 100.0% of males and 100.0% of females in these age groups living above the poverty line.
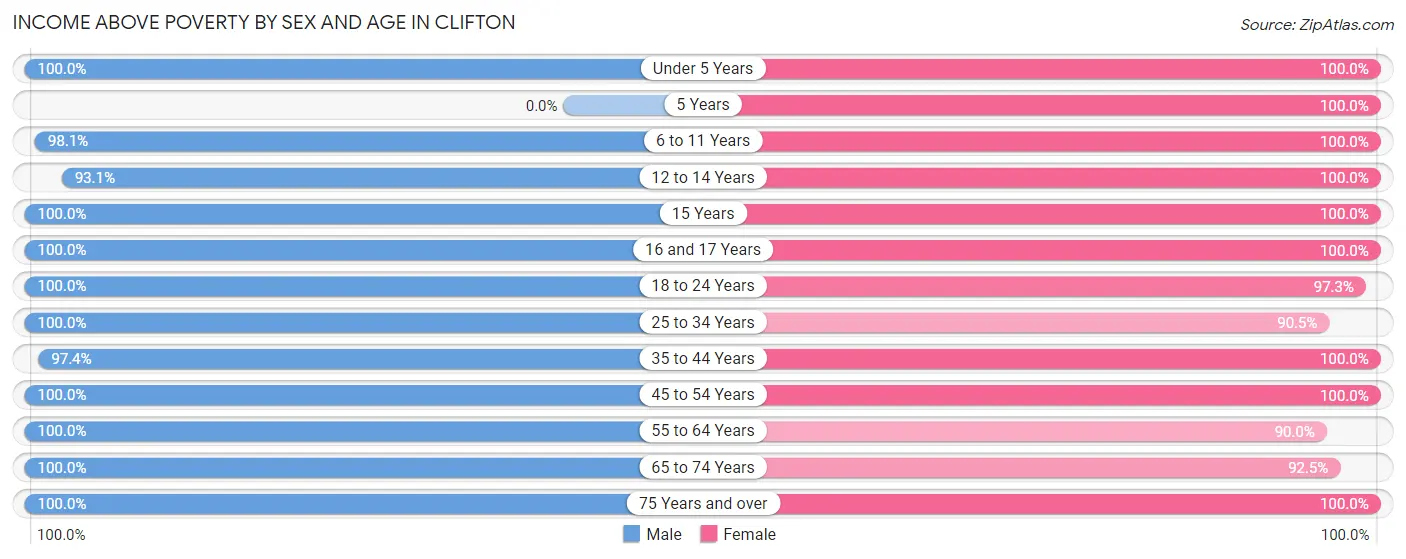
| Age Bracket | Male | Female |
| Under 5 Years | 32 (100.0%) | 34 (100.0%) |
| 5 Years | 0 (0.0%) | 6 (100.0%) |
| 6 to 11 Years | 51 (98.1%) | 30 (100.0%) |
| 12 to 14 Years | 27 (93.1%) | 18 (100.0%) |
| 15 Years | 4 (100.0%) | 6 (100.0%) |
| 16 and 17 Years | 15 (100.0%) | 23 (100.0%) |
| 18 to 24 Years | 31 (100.0%) | 106 (97.3%) |
| 25 to 34 Years | 55 (100.0%) | 19 (90.5%) |
| 35 to 44 Years | 38 (97.4%) | 32 (100.0%) |
| 45 to 54 Years | 20 (100.0%) | 32 (100.0%) |
| 55 to 64 Years | 27 (100.0%) | 27 (90.0%) |
| 65 to 74 Years | 29 (100.0%) | 37 (92.5%) |
| 75 Years and over | 12 (100.0%) | 9 (100.0%) |
| Total | 341 (98.8%) | 379 (97.2%) |
Income Below Poverty Among Married-Couple Families in Clifton
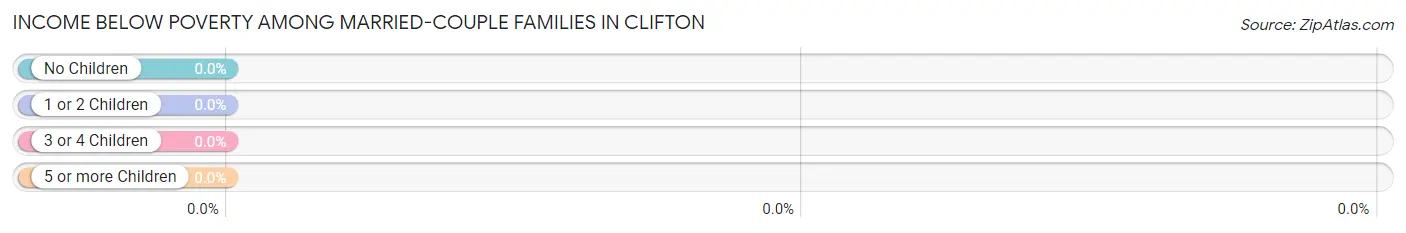
| Children | Above Poverty | Below Poverty |
| No Children | 78 (100.0%) | 0 (0.0%) |
| 1 or 2 Children | 36 (100.0%) | 0 (0.0%) |
| 3 or 4 Children | 37 (100.0%) | 0 (0.0%) |
| 5 or more Children | 14 (100.0%) | 0 (0.0%) |
| Total | 165 (100.0%) | 0 (0.0%) |
Income Below Poverty Among Single-Parent Households in Clifton
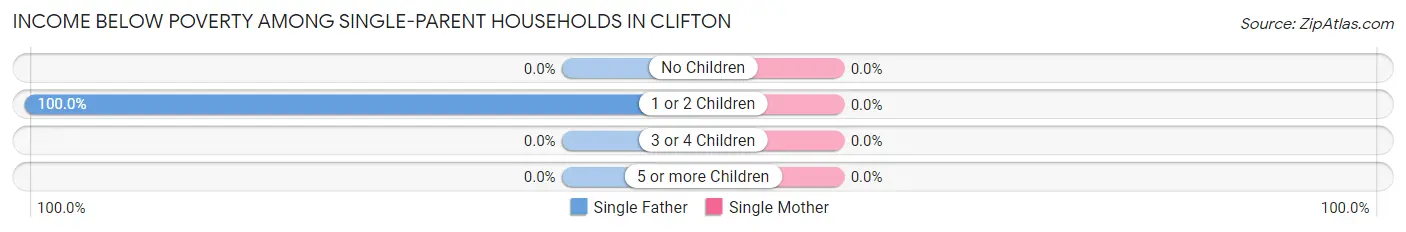
| Children | Single Father | Single Mother |
| No Children | 0 (0.0%) | 0 (0.0%) |
| 1 or 2 Children | 1 (100.0%) | 0 (0.0%) |
| 3 or 4 Children | 0 (0.0%) | 0 (0.0%) |
| 5 or more Children | 0 (0.0%) | 0 (0.0%) |
| Total | 1 (100.0%) | 0 (0.0%) |
Income Below Poverty Among Married-Couple vs Single-Parent Households in Clifton
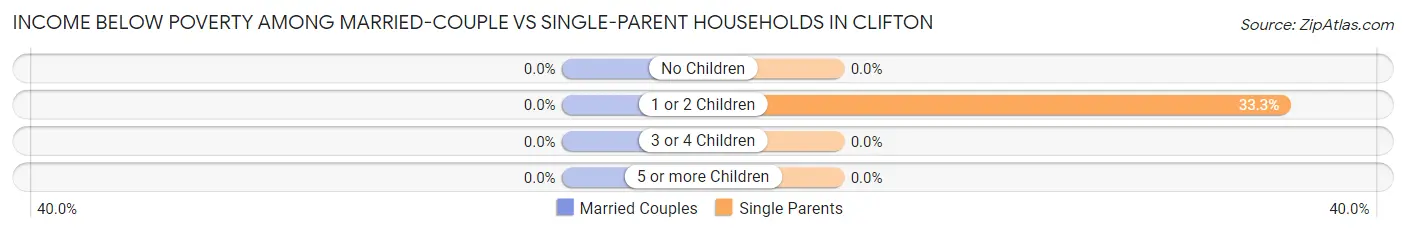
| Children | Married-Couple Families | Single-Parent Households |
| No Children | 0 (0.0%) | 0 (0.0%) |
| 1 or 2 Children | 0 (0.0%) | 1 (33.3%) |
| 3 or 4 Children | 0 (0.0%) | 0 (0.0%) |
| 5 or more Children | 0 (0.0%) | 0 (0.0%) |
| Total | 0 (0.0%) | 1 (20.0%) |
Employment Characteristics in Clifton
Employment by Class of Employer in Clifton
Among the 353 employed individuals in Clifton, private company employees (145 | 41.1%), local government employees (73 | 20.7%), and not-for-profit organizations (49 | 13.9%) make up the most common classes of employment.
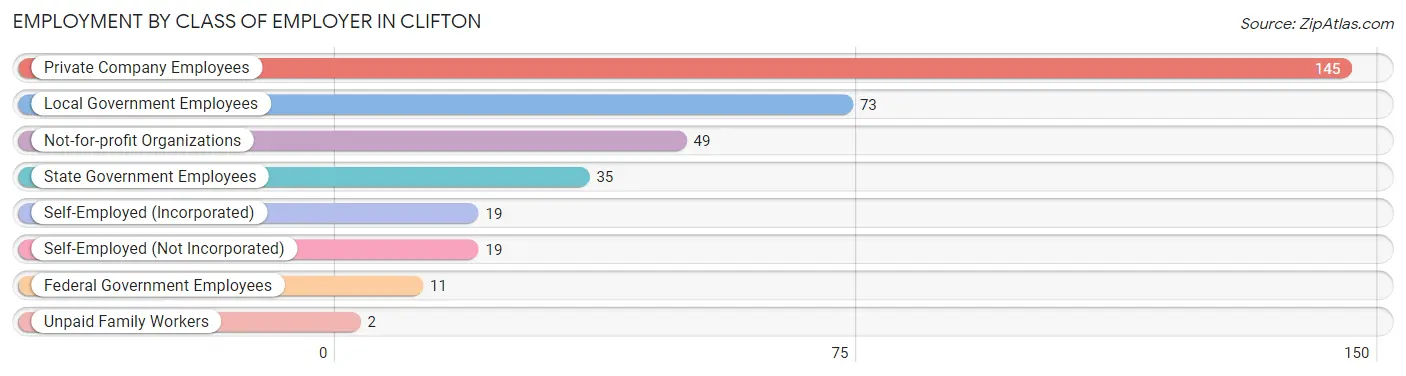
| Employer Class | # Employees | % Employees |
| Private Company Employees | 145 | 41.1% |
| Self-Employed (Incorporated) | 19 | 5.4% |
| Self-Employed (Not Incorporated) | 19 | 5.4% |
| Not-for-profit Organizations | 49 | 13.9% |
| Local Government Employees | 73 | 20.7% |
| State Government Employees | 35 | 9.9% |
| Federal Government Employees | 11 | 3.1% |
| Unpaid Family Workers | 2 | 0.6% |
| Total | 353 | 100.0% |
Employment Status by Age in Clifton
According to the labor force statistics for Clifton, out of the total population over 16 years of age (524), 72.9% or 382 individuals are in the labor force, with 2.4% or 9 of them unemployed. The age group with the highest labor force participation rate is 55 to 59 years, with 100.0% or 29 individuals in the labor force. Within the labor force, the 35 to 44 years age range has the highest percentage of unemployed individuals, with 7.7% or 4 of them being unemployed.
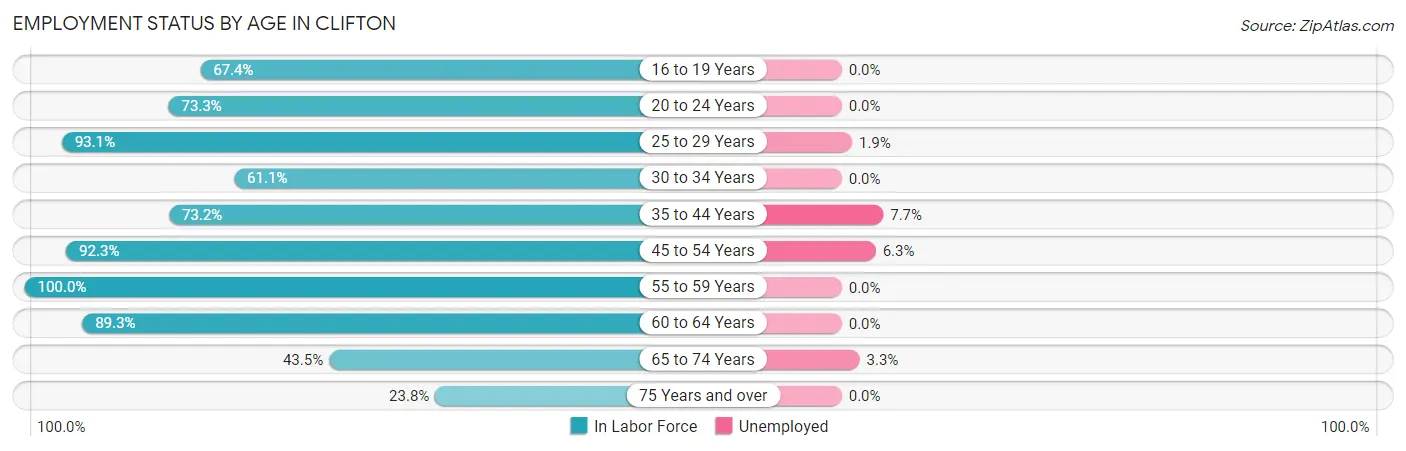
| Age Bracket | In Labor Force | Unemployed |
| 16 to 19 Years | 29 (67.4%) | 0 (0.0%) |
| 20 to 24 Years | 99 (73.3%) | 0 (0.0%) |
| 25 to 29 Years | 54 (93.1%) | 1 (1.9%) |
| 30 to 34 Years | 11 (61.1%) | 0 (0.0%) |
| 35 to 44 Years | 52 (73.2%) | 4 (7.7%) |
| 45 to 54 Years | 48 (92.3%) | 3 (6.3%) |
| 55 to 59 Years | 29 (100.0%) | 0 (0.0%) |
| 60 to 64 Years | 25 (89.3%) | 0 (0.0%) |
| 65 to 74 Years | 30 (43.5%) | 1 (3.3%) |
| 75 Years and over | 5 (23.8%) | 0 (0.0%) |
| Total | 382 (72.9%) | 9 (2.4%) |
Employment Status by Educational Attainment in Clifton
According to labor force statistics for Clifton, 85.5% of individuals (219) out of the total population between 25 and 64 years of age (256) are in the labor force, with 3.7% or 8 of them being unemployed. The group with the highest labor force participation rate are those with the educational attainment of less than high school, with 100.0% or 2 individuals in the labor force. Within the labor force, individuals with high school diploma education have the highest percentage of unemployment, with 5.6% or 5 of them being unemployed.
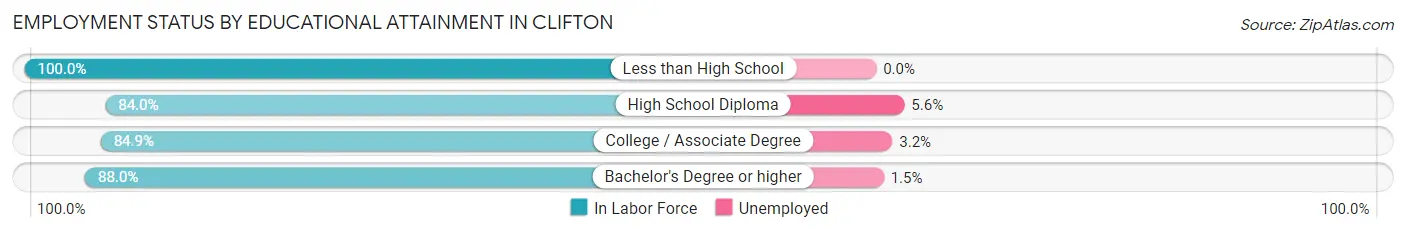
| Educational Attainment | In Labor Force | Unemployed |
| Less than High School | 2 (100.0%) | 0 (0.0%) |
| High School Diploma | 89 (84.0%) | 6 (5.6%) |
| College / Associate Degree | 62 (84.9%) | 2 (3.2%) |
| Bachelor's Degree or higher | 66 (88.0%) | 1 (1.5%) |
| Total | 219 (85.5%) | 9 (3.7%) |
Employment Occupations by Sex in Clifton
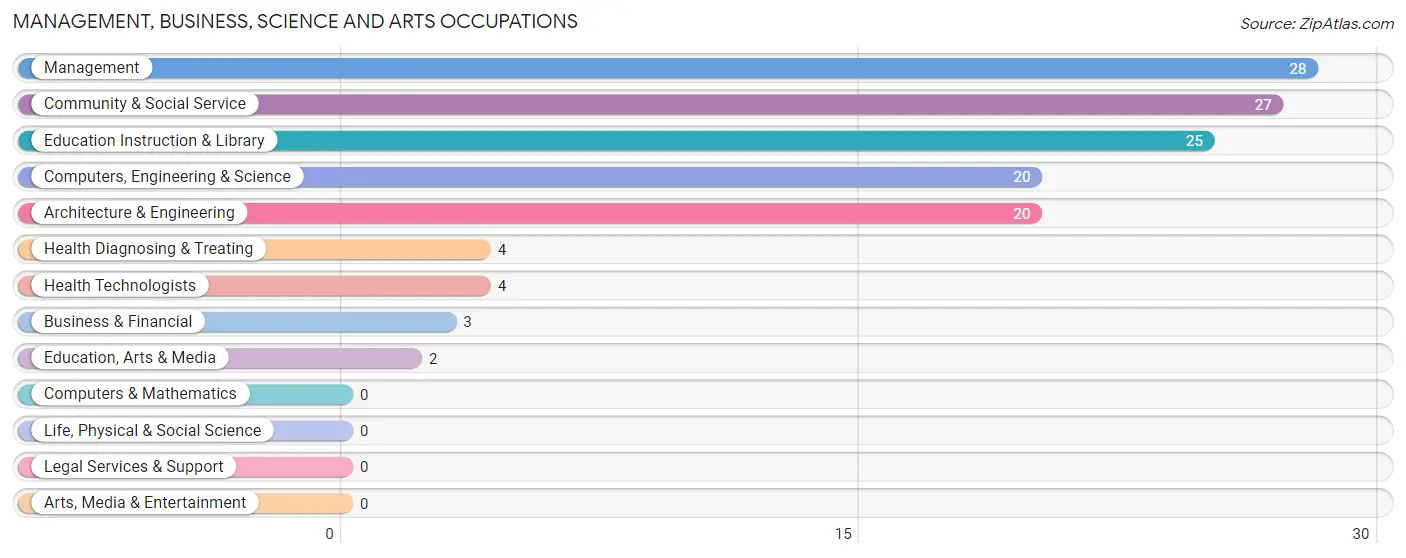
Management, Business, Science and Arts Occupations
The most common Management, Business, Science and Arts occupations in Clifton are Management (28 | 7.5%), Community & Social Service (27 | 7.2%), Education Instruction & Library (25 | 6.7%), Computers, Engineering & Science (20 | 5.4%), and Architecture & Engineering (20 | 5.4%).
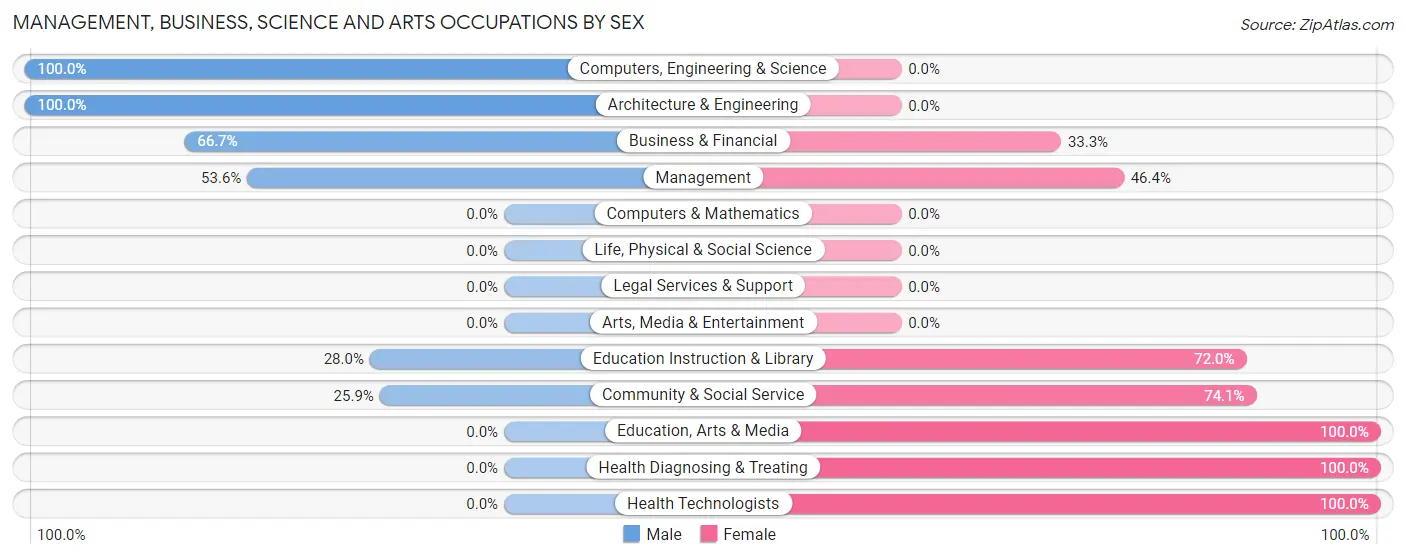
Management, Business, Science and Arts Occupations by Sex
Within the Management, Business, Science and Arts occupations in Clifton, the most male-oriented occupations are Computers, Engineering & Science (100.0%), Architecture & Engineering (100.0%), and Business & Financial (66.7%), while the most female-oriented occupations are Education, Arts & Media (100.0%), Health Diagnosing & Treating (100.0%), and Health Technologists (100.0%).
| Occupation | Male | Female |
| Management | 15 (53.6%) | 13 (46.4%) |
| Business & Financial | 2 (66.7%) | 1 (33.3%) |
| Computers, Engineering & Science | 20 (100.0%) | 0 (0.0%) |
| Computers & Mathematics | 0 (0.0%) | 0 (0.0%) |
| Architecture & Engineering | 20 (100.0%) | 0 (0.0%) |
| Life, Physical & Social Science | 0 (0.0%) | 0 (0.0%) |
| Community & Social Service | 7 (25.9%) | 20 (74.1%) |
| Education, Arts & Media | 0 (0.0%) | 2 (100.0%) |
| Legal Services & Support | 0 (0.0%) | 0 (0.0%) |
| Education Instruction & Library | 7 (28.0%) | 18 (72.0%) |
| Arts, Media & Entertainment | 0 (0.0%) | 0 (0.0%) |
| Health Diagnosing & Treating | 0 (0.0%) | 4 (100.0%) |
| Health Technologists | 0 (0.0%) | 4 (100.0%) |
| Total (Category) | 44 (53.7%) | 38 (46.3%) |
| Total (Overall) | 189 (50.7%) | 184 (49.3%) |
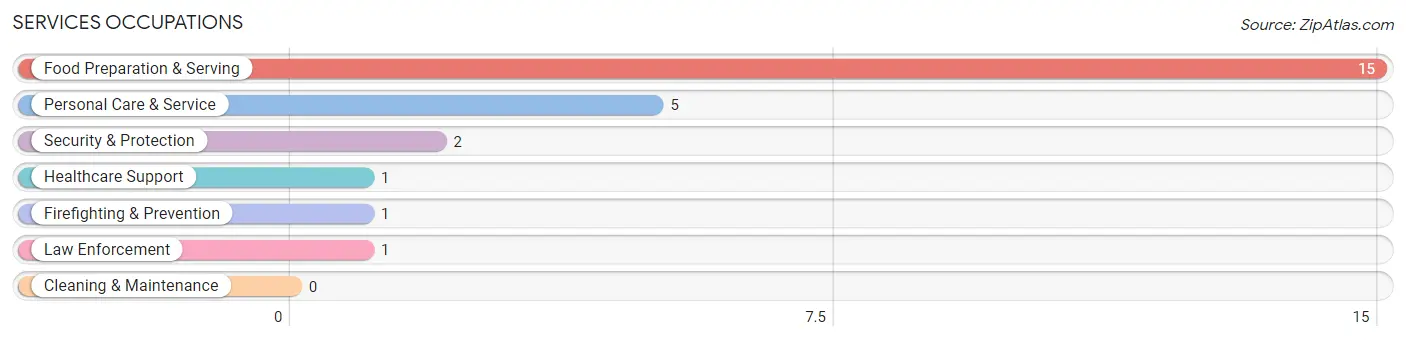
Services Occupations
The most common Services occupations in Clifton are Food Preparation & Serving (15 | 4.0%), Personal Care & Service (5 | 1.3%), Security & Protection (2 | 0.5%), Healthcare Support (1 | 0.3%), and Firefighting & Prevention (1 | 0.3%).
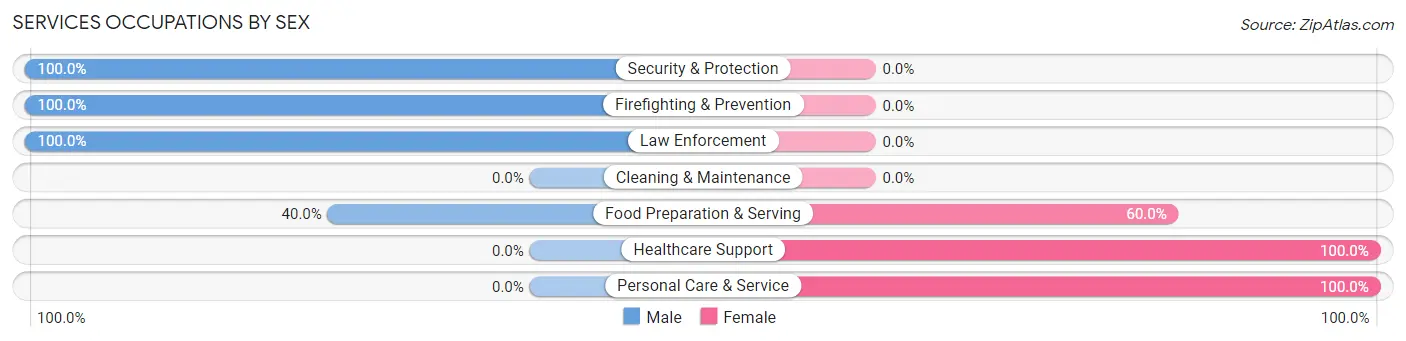
Services Occupations by Sex
Within the Services occupations in Clifton, the most male-oriented occupations are Security & Protection (100.0%), Firefighting & Prevention (100.0%), and Law Enforcement (100.0%), while the most female-oriented occupations are Healthcare Support (100.0%), Personal Care & Service (100.0%), and Food Preparation & Serving (60.0%).
| Occupation | Male | Female |
| Healthcare Support | 0 (0.0%) | 1 (100.0%) |
| Security & Protection | 2 (100.0%) | 0 (0.0%) |
| Firefighting & Prevention | 1 (100.0%) | 0 (0.0%) |
| Law Enforcement | 1 (100.0%) | 0 (0.0%) |
| Food Preparation & Serving | 6 (40.0%) | 9 (60.0%) |
| Cleaning & Maintenance | 0 (0.0%) | 0 (0.0%) |
| Personal Care & Service | 0 (0.0%) | 5 (100.0%) |
| Total (Category) | 8 (34.8%) | 15 (65.2%) |
| Total (Overall) | 189 (50.7%) | 184 (49.3%) |
Sales and Office Occupations
The most common Sales and Office occupations in Clifton are Office & Administration (54 | 14.5%), and Sales & Related (14 | 3.7%).
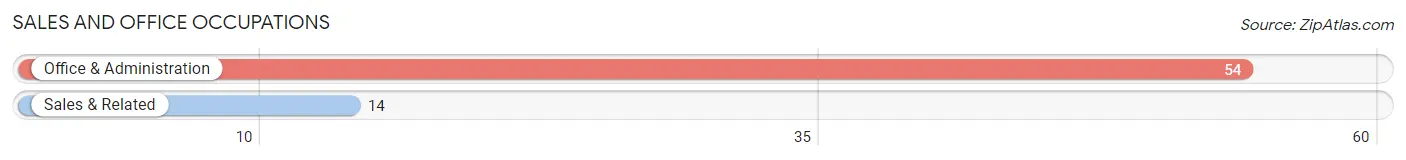
Sales and Office Occupations by Sex
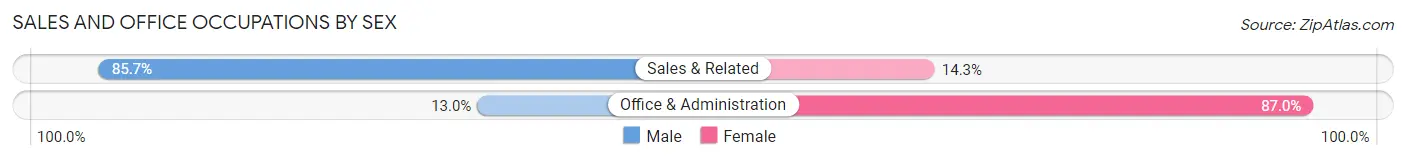
| Occupation | Male | Female |
| Sales & Related | 12 (85.7%) | 2 (14.3%) |
| Office & Administration | 7 (13.0%) | 47 (87.0%) |
| Total (Category) | 19 (27.9%) | 49 (72.1%) |
| Total (Overall) | 189 (50.7%) | 184 (49.3%) |
Natural Resources, Construction and Maintenance Occupations
The most common Natural Resources, Construction and Maintenance occupations in Clifton are Construction & Extraction (60 | 16.1%), Installation, Maintenance & Repair (43 | 11.5%), and Farming, Fishing & Forestry (15 | 4.0%).
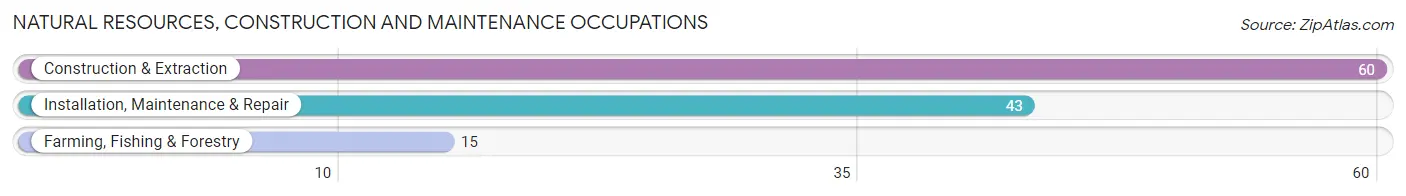
Natural Resources, Construction and Maintenance Occupations by Sex
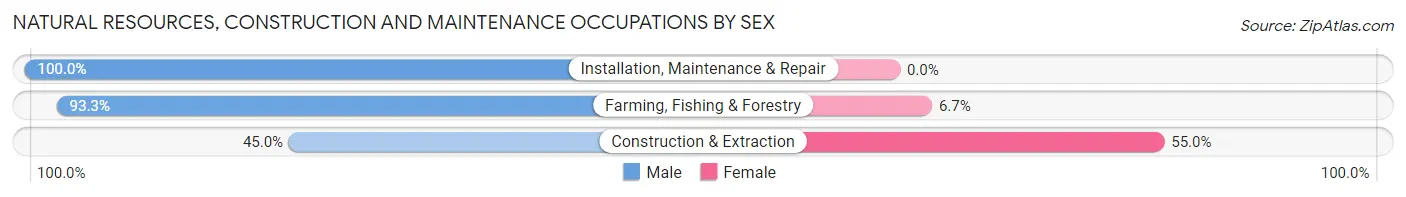
| Occupation | Male | Female |
| Farming, Fishing & Forestry | 14 (93.3%) | 1 (6.7%) |
| Construction & Extraction | 27 (45.0%) | 33 (55.0%) |
| Installation, Maintenance & Repair | 43 (100.0%) | 0 (0.0%) |
| Total (Category) | 84 (71.2%) | 34 (28.8%) |
| Total (Overall) | 189 (50.7%) | 184 (49.3%) |
Production, Transportation and Moving Occupations
The most common Production, Transportation and Moving occupations in Clifton are Production (68 | 18.2%), Transportation (7 | 1.9%), and Material Moving (7 | 1.9%).
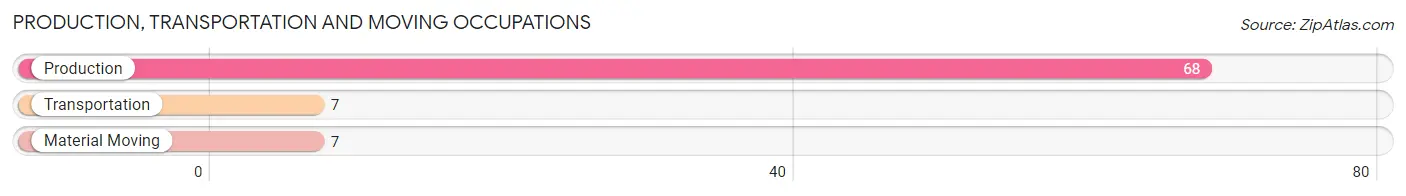
Production, Transportation and Moving Occupations by Sex
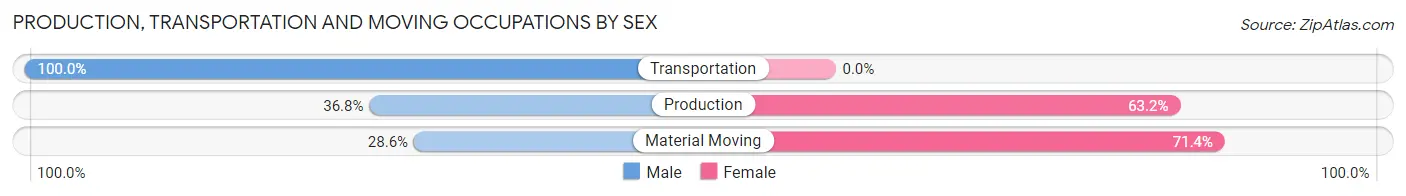
| Occupation | Male | Female |
| Production | 25 (36.8%) | 43 (63.2%) |
| Transportation | 7 (100.0%) | 0 (0.0%) |
| Material Moving | 2 (28.6%) | 5 (71.4%) |
| Total (Category) | 34 (41.5%) | 48 (58.5%) |
| Total (Overall) | 189 (50.7%) | 184 (49.3%) |
Employment Industries by Sex in Clifton
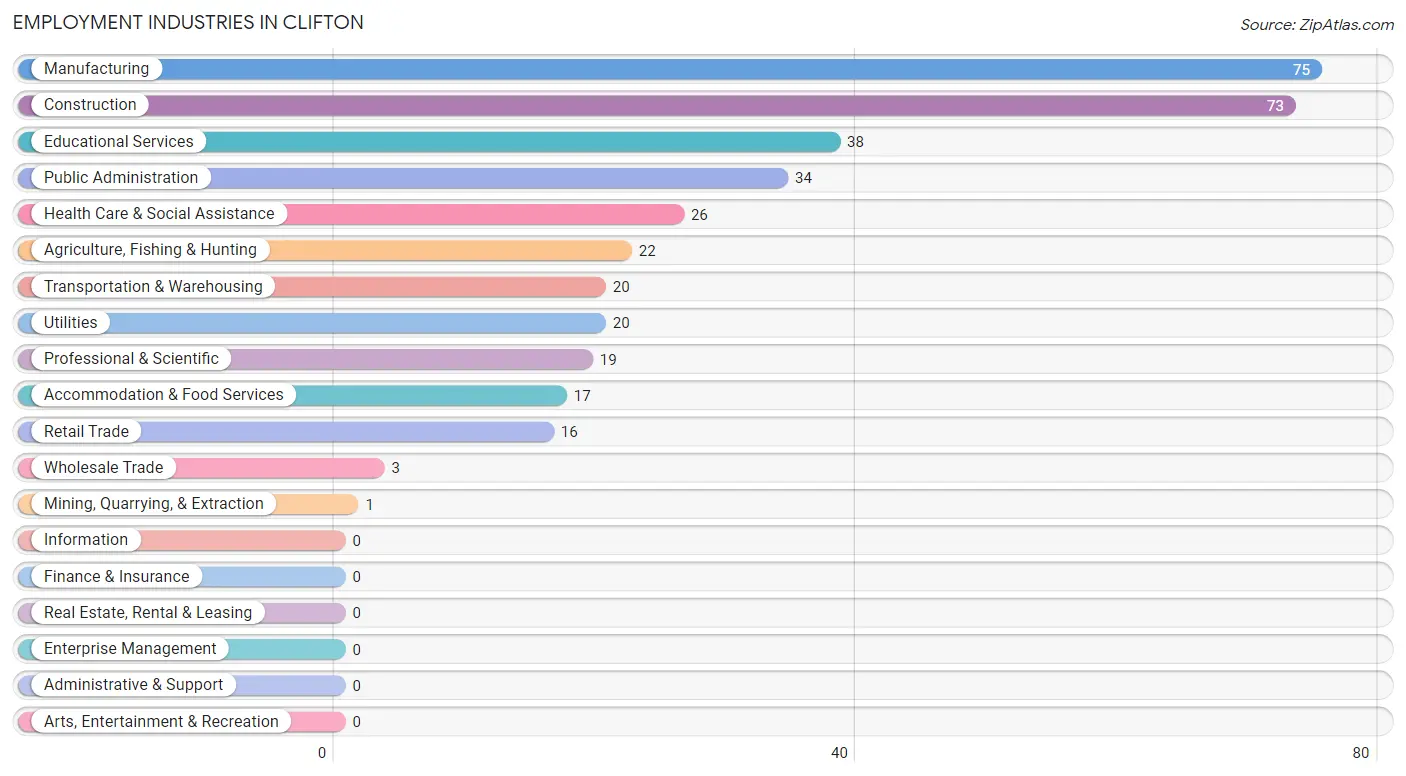
Employment Industries in Clifton
The major employment industries in Clifton include Manufacturing (75 | 20.1%), Construction (73 | 19.6%), Educational Services (38 | 10.2%), Public Administration (34 | 9.1%), and Health Care & Social Assistance (26 | 7.0%).
Employment Industries by Sex in Clifton
The Clifton industries that see more men than women are Mining, Quarrying, & Extraction (100.0%), Utilities (100.0%), and Professional & Scientific (100.0%), whereas the industries that tend to have a higher number of women are Health Care & Social Assistance (100.0%), Educational Services (73.7%), and Public Administration (61.8%).
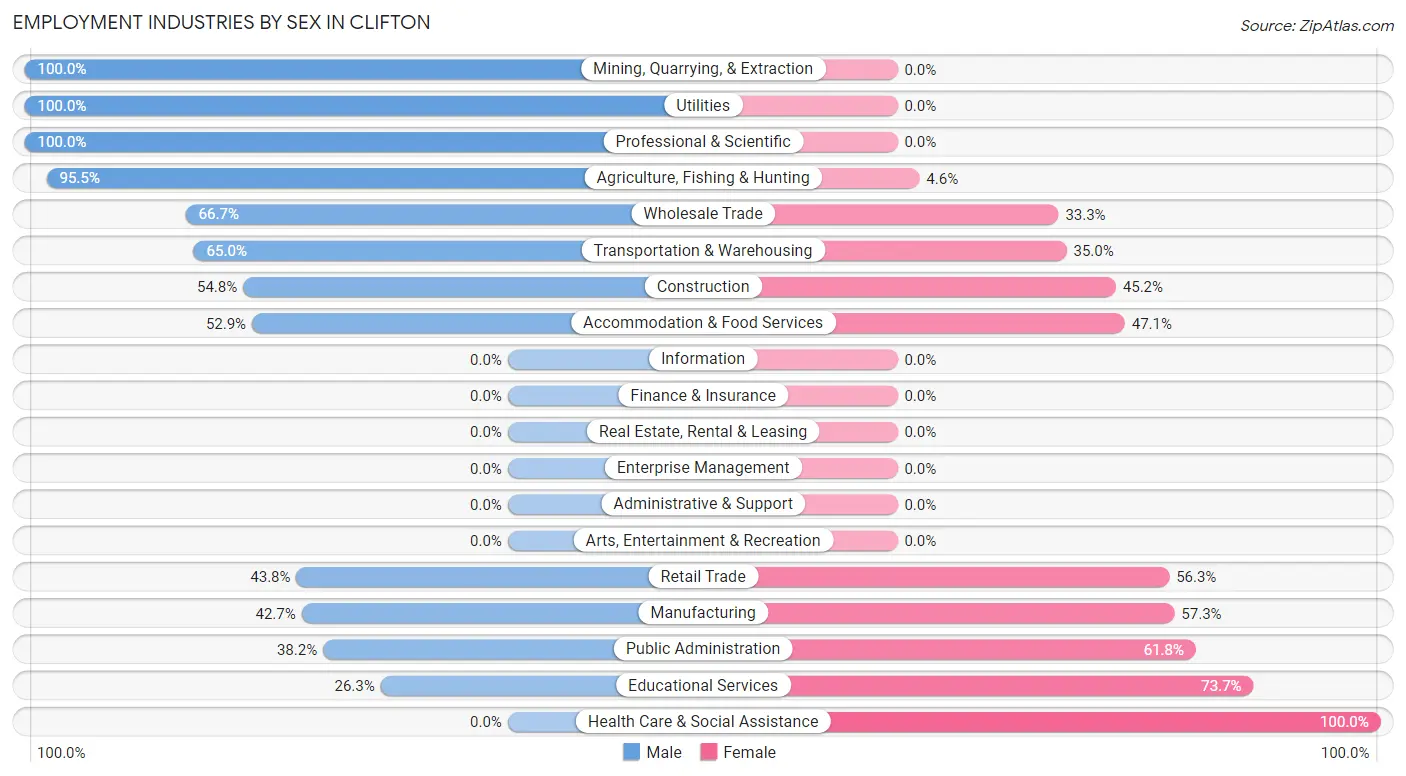
| Industry | Male | Female |
| Agriculture, Fishing & Hunting | 21 (95.5%) | 1 (4.5%) |
| Mining, Quarrying, & Extraction | 1 (100.0%) | 0 (0.0%) |
| Construction | 40 (54.8%) | 33 (45.2%) |
| Manufacturing | 32 (42.7%) | 43 (57.3%) |
| Wholesale Trade | 2 (66.7%) | 1 (33.3%) |
| Retail Trade | 7 (43.8%) | 9 (56.2%) |
| Transportation & Warehousing | 13 (65.0%) | 7 (35.0%) |
| Utilities | 20 (100.0%) | 0 (0.0%) |
| Information | 0 (0.0%) | 0 (0.0%) |
| Finance & Insurance | 0 (0.0%) | 0 (0.0%) |
| Real Estate, Rental & Leasing | 0 (0.0%) | 0 (0.0%) |
| Professional & Scientific | 19 (100.0%) | 0 (0.0%) |
| Enterprise Management | 0 (0.0%) | 0 (0.0%) |
| Administrative & Support | 0 (0.0%) | 0 (0.0%) |
| Educational Services | 10 (26.3%) | 28 (73.7%) |
| Health Care & Social Assistance | 0 (0.0%) | 26 (100.0%) |
| Arts, Entertainment & Recreation | 0 (0.0%) | 0 (0.0%) |
| Accommodation & Food Services | 9 (52.9%) | 8 (47.1%) |
| Public Administration | 13 (38.2%) | 21 (61.8%) |
| Total | 189 (50.7%) | 184 (49.3%) |
Education in Clifton
School Enrollment in Clifton
The most common levels of schooling among the 286 students in Clifton are middle school (67 | 23.4%), college / undergraduate (63 | 22.0%), and elementary school (60 | 21.0%).
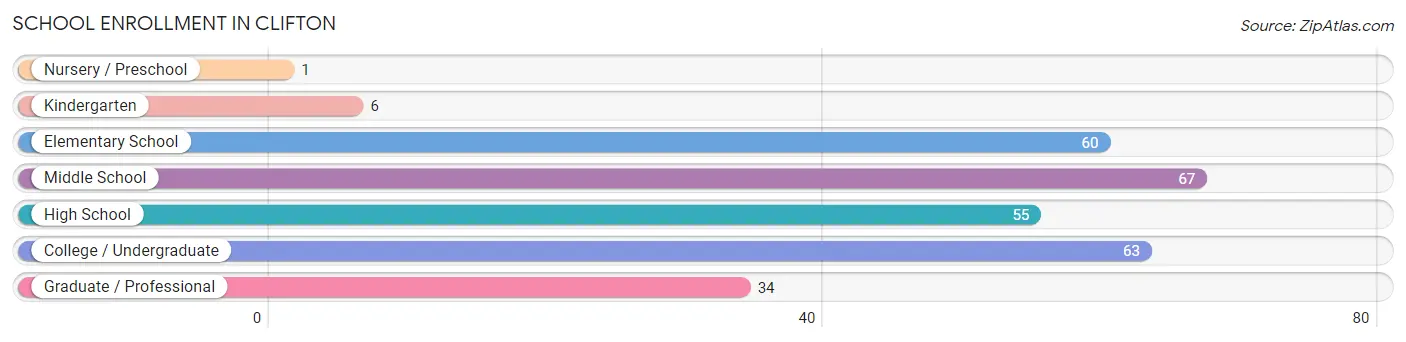
| School Level | # Students | % Students |
| Nursery / Preschool | 1 | 0.4% |
| Kindergarten | 6 | 2.1% |
| Elementary School | 60 | 21.0% |
| Middle School | 67 | 23.4% |
| High School | 55 | 19.2% |
| College / Undergraduate | 63 | 22.0% |
| Graduate / Professional | 34 | 11.9% |
| Total | 286 | 100.0% |
School Enrollment by Age by Funding Source in Clifton
Out of a total of 286 students who are enrolled in schools in Clifton, 11 (3.8%) attend a private institution, while the remaining 275 (96.2%) are enrolled in public schools. The age group of 3 to 4 year olds has the highest likelihood of being enrolled in private schools, with 1 (100.0% in the age bracket) enrolled. Conversely, the age group of 15 to 17 year olds has the lowest likelihood of being enrolled in a private school, with 48 (100.0% in the age bracket) attending a public institution.
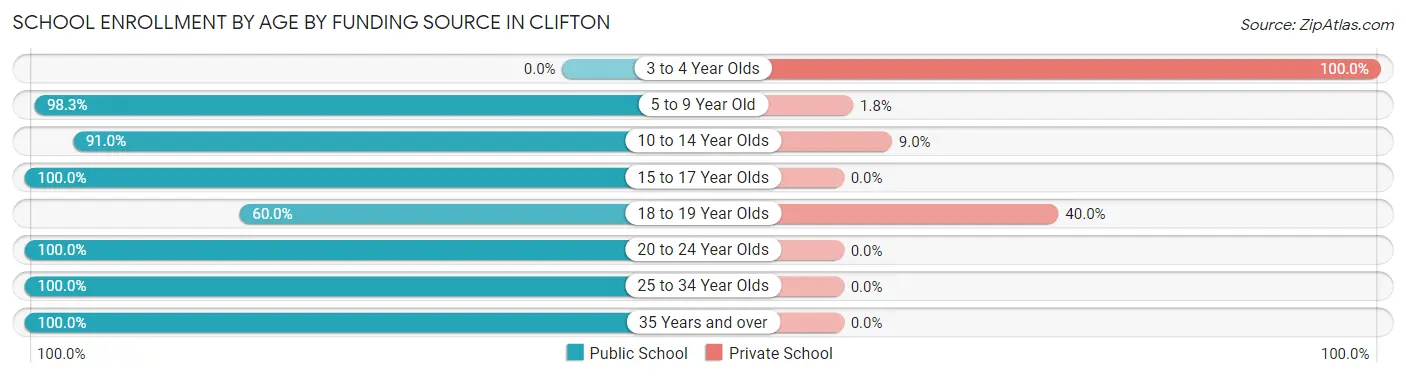
| Age Bracket | Public School | Private School |
| 3 to 4 Year Olds | 0 (0.0%) | 1 (100.0%) |
| 5 to 9 Year Old | 56 (98.3%) | 1 (1.8%) |
| 10 to 14 Year Olds | 71 (91.0%) | 7 (9.0%) |
| 15 to 17 Year Olds | 48 (100.0%) | 0 (0.0%) |
| 18 to 19 Year Olds | 3 (60.0%) | 2 (40.0%) |
| 20 to 24 Year Olds | 89 (100.0%) | 0 (0.0%) |
| 25 to 34 Year Olds | 7 (100.0%) | 0 (0.0%) |
| 35 Years and over | 1 (100.0%) | 0 (0.0%) |
| Total | 275 (96.2%) | 11 (3.8%) |
Educational Attainment by Field of Study in Clifton
Education (28 | 29.5%), arts & humanities (22 | 23.2%), engineering (20 | 21.0%), social sciences (8 | 8.4%), and psychology (7 | 7.4%) are the most common fields of study among 95 individuals in Clifton who have obtained a bachelor's degree or higher.
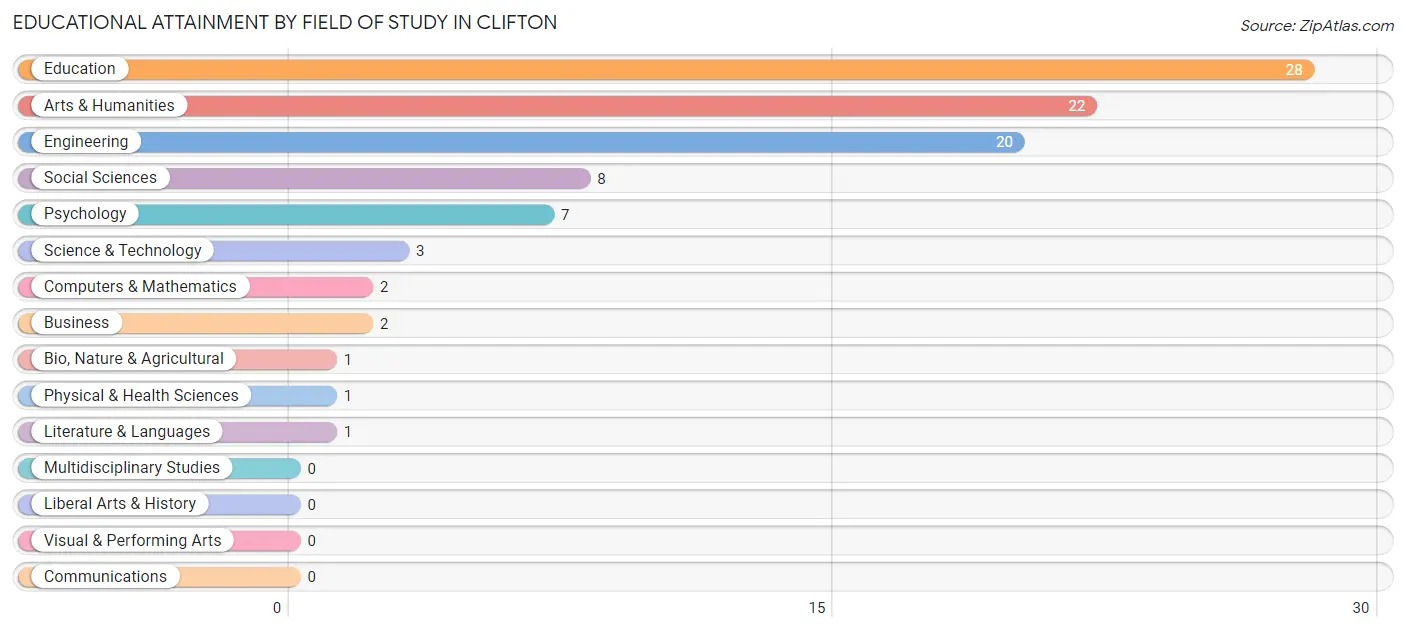
| Field of Study | # Graduates | % Graduates |
| Computers & Mathematics | 2 | 2.1% |
| Bio, Nature & Agricultural | 1 | 1.1% |
| Physical & Health Sciences | 1 | 1.1% |
| Psychology | 7 | 7.4% |
| Social Sciences | 8 | 8.4% |
| Engineering | 20 | 21.0% |
| Multidisciplinary Studies | 0 | 0.0% |
| Science & Technology | 3 | 3.2% |
| Business | 2 | 2.1% |
| Education | 28 | 29.5% |
| Literature & Languages | 1 | 1.1% |
| Liberal Arts & History | 0 | 0.0% |
| Visual & Performing Arts | 0 | 0.0% |
| Communications | 0 | 0.0% |
| Arts & Humanities | 22 | 23.2% |
| Total | 95 | 100.0% |
Transportation & Commute in Clifton
Vehicle Availability by Sex in Clifton
The most prevalent vehicle ownership categories in Clifton are males with 3 vehicles (67, accounting for 39.6%) and females with 3 vehicles (60, making up 36.4%).
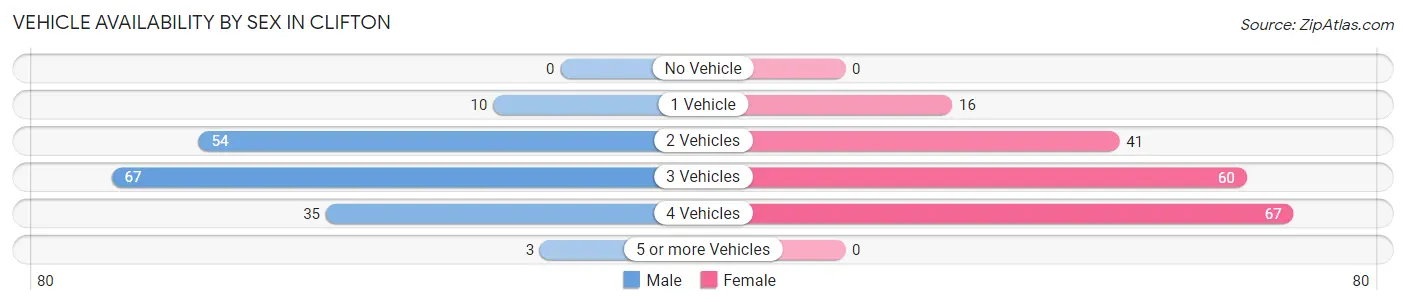
| Vehicles Available | Male | Female |
| No Vehicle | 0 (0.0%) | 0 (0.0%) |
| 1 Vehicle | 10 (5.9%) | 16 (8.7%) |
| 2 Vehicles | 54 (32.0%) | 41 (22.3%) |
| 3 Vehicles | 67 (39.6%) | 60 (32.6%) |
| 4 Vehicles | 35 (20.7%) | 67 (36.4%) |
| 5 or more Vehicles | 3 (1.8%) | 0 (0.0%) |
| Total | 169 (100.0%) | 184 (100.0%) |
Commute Time in Clifton
The most frequently occuring commute durations in Clifton are 20 to 24 minutes (58 commuters, 17.8%), 30 to 34 minutes (47 commuters, 14.5%), and 5 to 9 minutes (40 commuters, 12.3%).
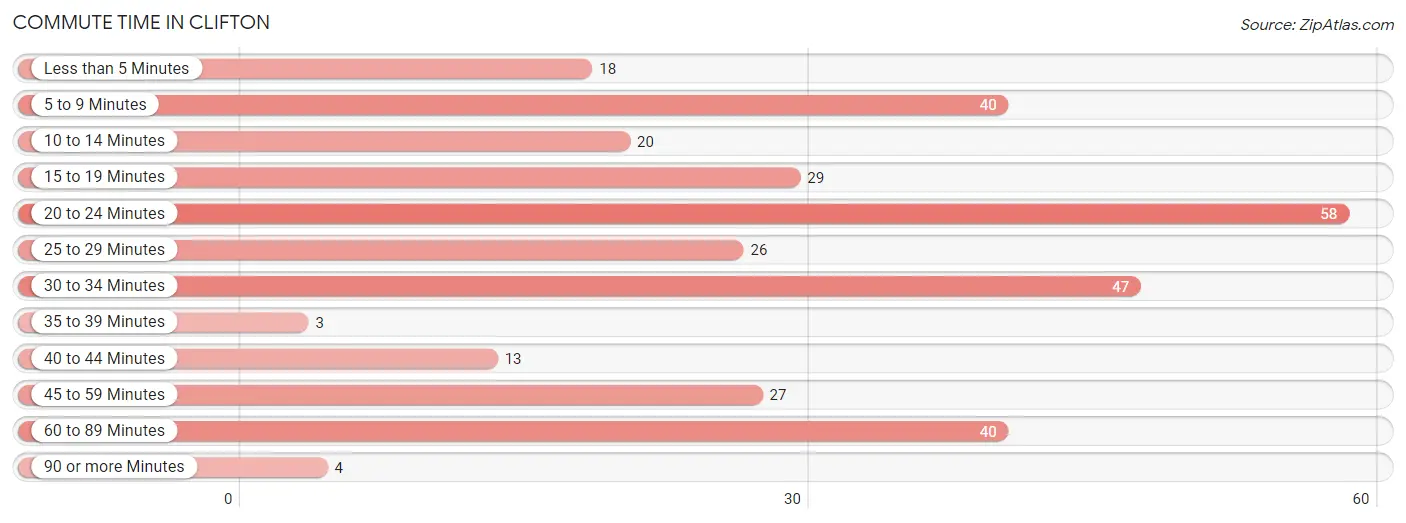
| Commute Time | # Commuters | % Commuters |
| Less than 5 Minutes | 18 | 5.5% |
| 5 to 9 Minutes | 40 | 12.3% |
| 10 to 14 Minutes | 20 | 6.1% |
| 15 to 19 Minutes | 29 | 8.9% |
| 20 to 24 Minutes | 58 | 17.8% |
| 25 to 29 Minutes | 26 | 8.0% |
| 30 to 34 Minutes | 47 | 14.5% |
| 35 to 39 Minutes | 3 | 0.9% |
| 40 to 44 Minutes | 13 | 4.0% |
| 45 to 59 Minutes | 27 | 8.3% |
| 60 to 89 Minutes | 40 | 12.3% |
| 90 or more Minutes | 4 | 1.2% |
Commute Time by Sex in Clifton
The most common commute times in Clifton are 20 to 24 minutes (29 commuters, 19.9%) for males and 30 to 34 minutes (42 commuters, 23.5%) for females.
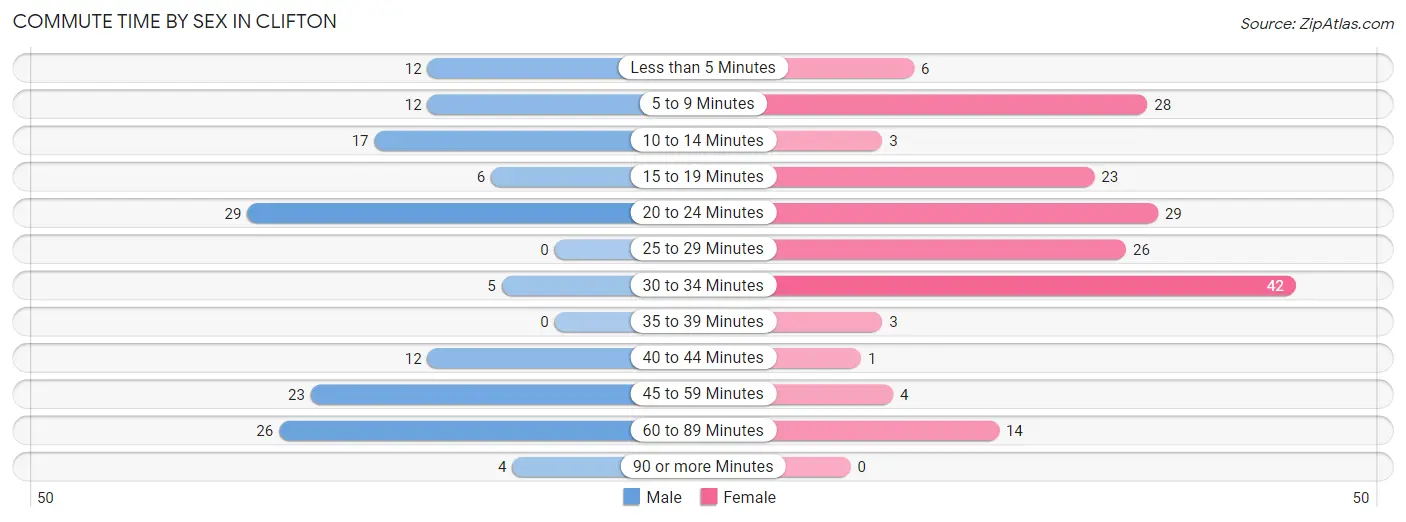
| Commute Time | Male | Female |
| Less than 5 Minutes | 12 (8.2%) | 6 (3.4%) |
| 5 to 9 Minutes | 12 (8.2%) | 28 (15.6%) |
| 10 to 14 Minutes | 17 (11.6%) | 3 (1.7%) |
| 15 to 19 Minutes | 6 (4.1%) | 23 (12.9%) |
| 20 to 24 Minutes | 29 (19.9%) | 29 (16.2%) |
| 25 to 29 Minutes | 0 (0.0%) | 26 (14.5%) |
| 30 to 34 Minutes | 5 (3.4%) | 42 (23.5%) |
| 35 to 39 Minutes | 0 (0.0%) | 3 (1.7%) |
| 40 to 44 Minutes | 12 (8.2%) | 1 (0.6%) |
| 45 to 59 Minutes | 23 (15.8%) | 4 (2.2%) |
| 60 to 89 Minutes | 26 (17.8%) | 14 (7.8%) |
| 90 or more Minutes | 4 (2.7%) | 0 (0.0%) |
Time of Departure to Work by Sex in Clifton
The most frequent times of departure to work in Clifton are 6:00 AM to 6:29 AM (60, 41.1%) for males and 7:30 AM to 7:59 AM (69, 38.6%) for females.
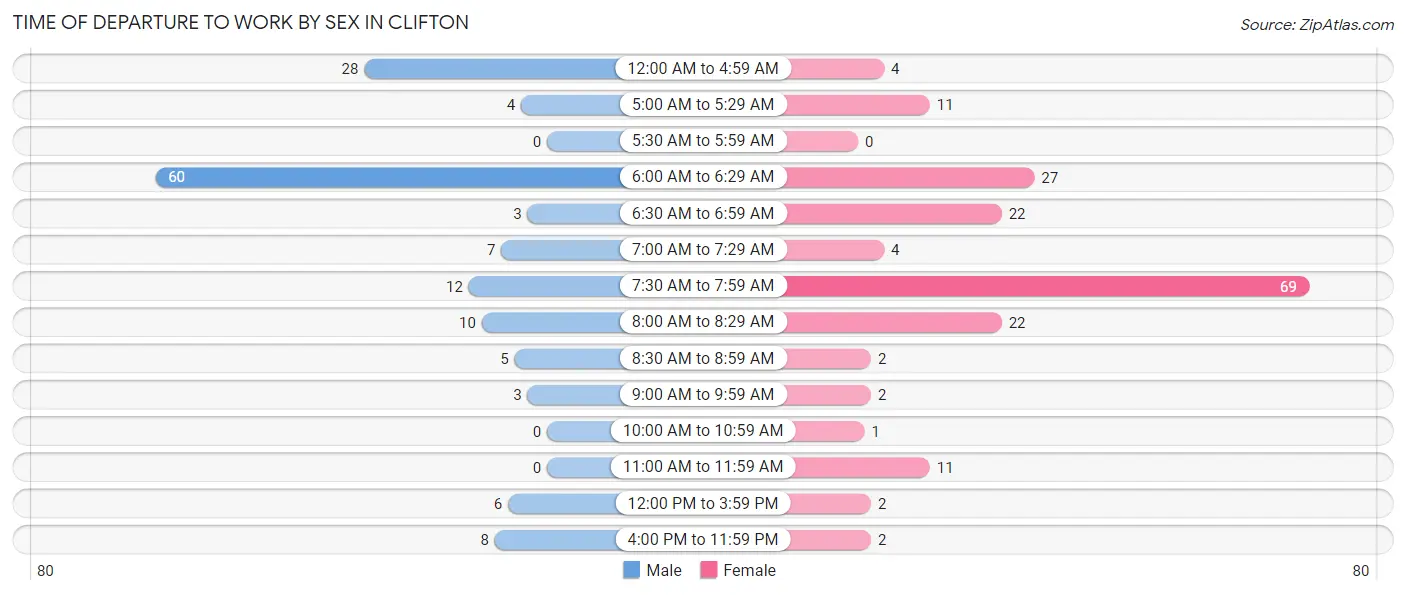
| Time of Departure | Male | Female |
| 12:00 AM to 4:59 AM | 28 (19.2%) | 4 (2.2%) |
| 5:00 AM to 5:29 AM | 4 (2.7%) | 11 (6.1%) |
| 5:30 AM to 5:59 AM | 0 (0.0%) | 0 (0.0%) |
| 6:00 AM to 6:29 AM | 60 (41.1%) | 27 (15.1%) |
| 6:30 AM to 6:59 AM | 3 (2.1%) | 22 (12.3%) |
| 7:00 AM to 7:29 AM | 7 (4.8%) | 4 (2.2%) |
| 7:30 AM to 7:59 AM | 12 (8.2%) | 69 (38.6%) |
| 8:00 AM to 8:29 AM | 10 (6.9%) | 22 (12.3%) |
| 8:30 AM to 8:59 AM | 5 (3.4%) | 2 (1.1%) |
| 9:00 AM to 9:59 AM | 3 (2.1%) | 2 (1.1%) |
| 10:00 AM to 10:59 AM | 0 (0.0%) | 1 (0.6%) |
| 11:00 AM to 11:59 AM | 0 (0.0%) | 11 (6.1%) |
| 12:00 PM to 3:59 PM | 6 (4.1%) | 2 (1.1%) |
| 4:00 PM to 11:59 PM | 8 (5.5%) | 2 (1.1%) |
| Total | 146 (100.0%) | 179 (100.0%) |
Housing Occupancy in Clifton
Occupancy by Ownership in Clifton
Of the total 207 dwellings in Clifton, owner-occupied units account for 182 (87.9%), while renter-occupied units make up 25 (12.1%).
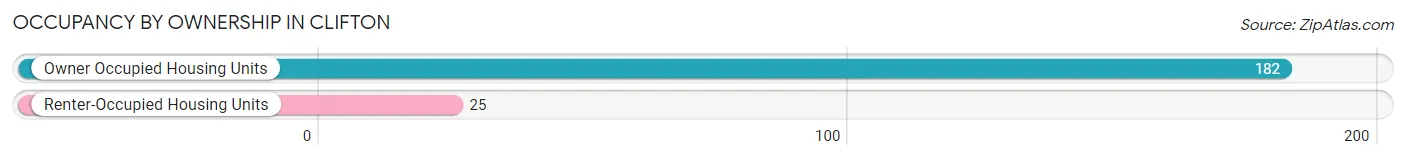
| Occupancy | # Housing Units | % Housing Units |
| Owner Occupied Housing Units | 182 | 87.9% |
| Renter-Occupied Housing Units | 25 | 12.1% |
| Total Occupied Housing Units | 207 | 100.0% |
Occupancy by Household Size in Clifton
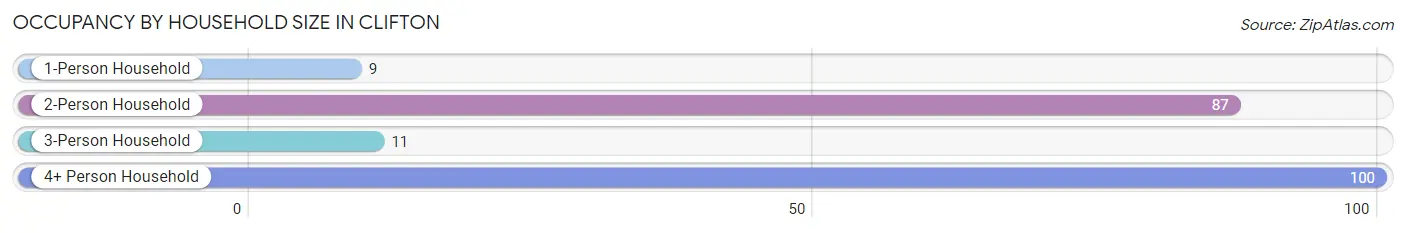
| Household Size | # Housing Units | % Housing Units |
| 1-Person Household | 9 | 4.3% |
| 2-Person Household | 87 | 42.0% |
| 3-Person Household | 11 | 5.3% |
| 4+ Person Household | 100 | 48.3% |
| Total Housing Units | 207 | 100.0% |
Occupancy by Ownership by Household Size in Clifton
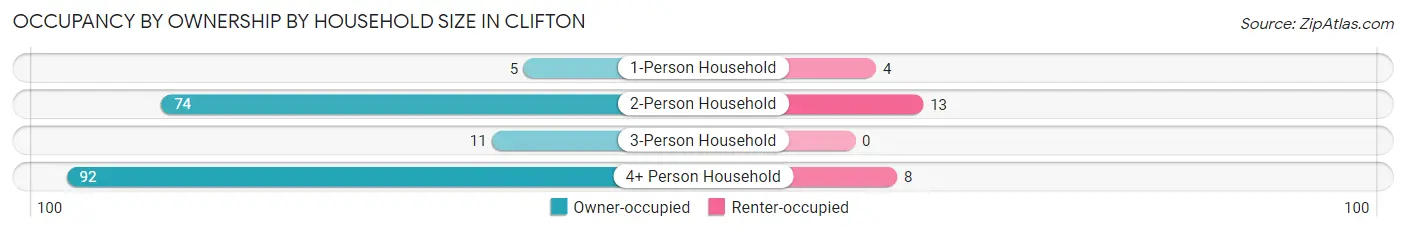
| Household Size | Owner-occupied | Renter-occupied |
| 1-Person Household | 5 (55.6%) | 4 (44.4%) |
| 2-Person Household | 74 (85.1%) | 13 (14.9%) |
| 3-Person Household | 11 (100.0%) | 0 (0.0%) |
| 4+ Person Household | 92 (92.0%) | 8 (8.0%) |
| Total Housing Units | 182 (87.9%) | 25 (12.1%) |
Occupancy by Educational Attainment in Clifton
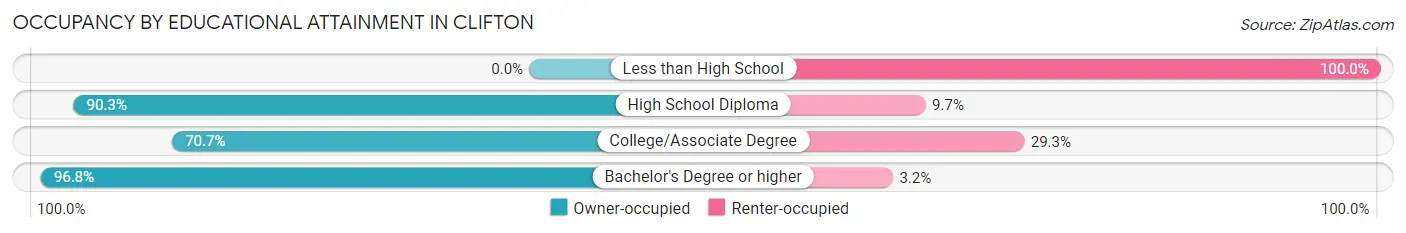
| Household Size | Owner-occupied | Renter-occupied |
| Less than High School | 0 (0.0%) | 1 (100.0%) |
| High School Diploma | 93 (90.3%) | 10 (9.7%) |
| College/Associate Degree | 29 (70.7%) | 12 (29.3%) |
| Bachelor's Degree or higher | 60 (96.8%) | 2 (3.2%) |
Occupancy by Age of Householder in Clifton
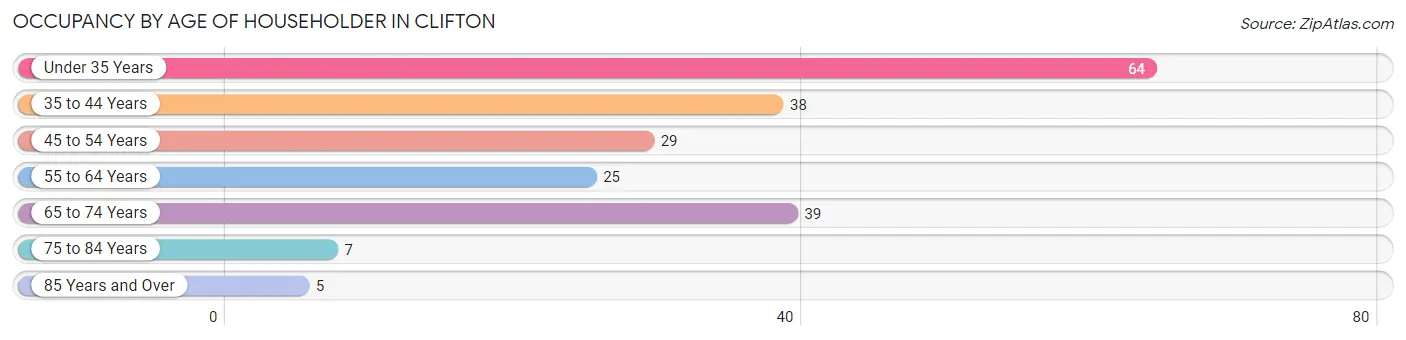
| Age Bracket | # Households | % Households |
| Under 35 Years | 64 | 30.9% |
| 35 to 44 Years | 38 | 18.4% |
| 45 to 54 Years | 29 | 14.0% |
| 55 to 64 Years | 25 | 12.1% |
| 65 to 74 Years | 39 | 18.8% |
| 75 to 84 Years | 7 | 3.4% |
| 85 Years and Over | 5 | 2.4% |
| Total | 207 | 100.0% |
Housing Finances in Clifton
Median Income by Occupancy in Clifton
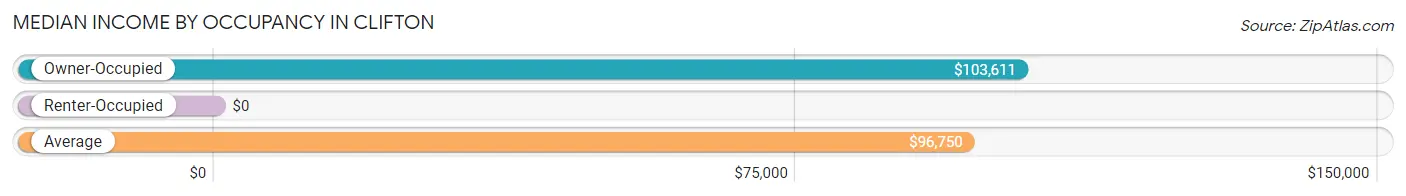
| Occupancy Type | # Households | Median Income |
| Owner-Occupied | 182 (87.9%) | $103,611 |
| Renter-Occupied | 25 (12.1%) | $0 |
| Average | 207 (100.0%) | $96,750 |
Occupancy by Householder Income Bracket in Clifton
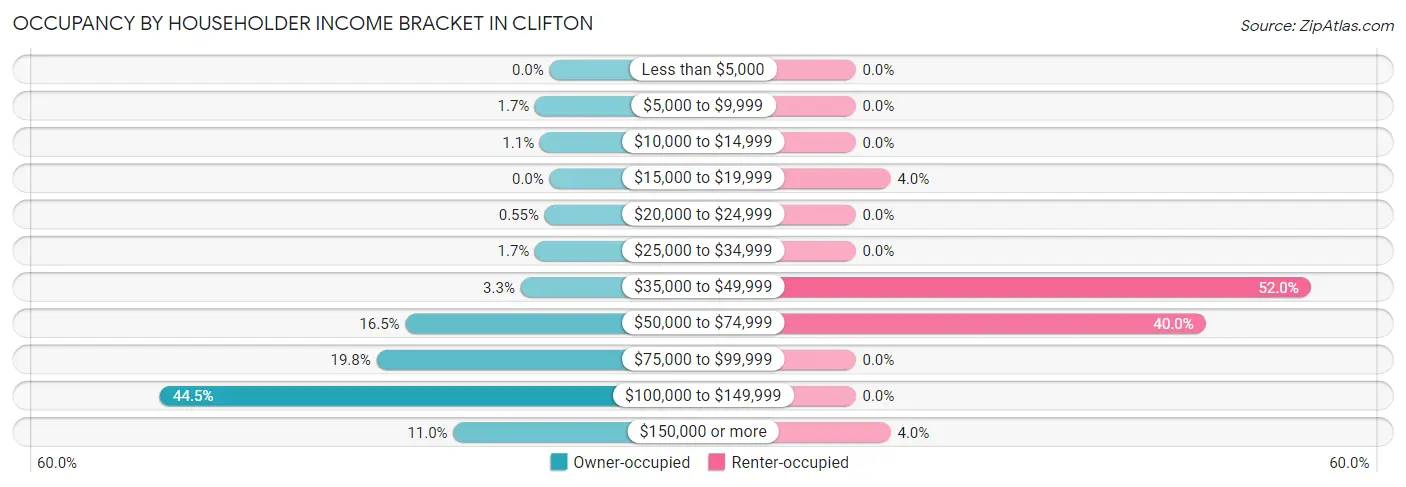
| Income Bracket | Owner-occupied | Renter-occupied |
| Less than $5,000 | 0 (0.0%) | 0 (0.0%) |
| $5,000 to $9,999 | 3 (1.7%) | 0 (0.0%) |
| $10,000 to $14,999 | 2 (1.1%) | 0 (0.0%) |
| $15,000 to $19,999 | 0 (0.0%) | 1 (4.0%) |
| $20,000 to $24,999 | 1 (0.5%) | 0 (0.0%) |
| $25,000 to $34,999 | 3 (1.7%) | 0 (0.0%) |
| $35,000 to $49,999 | 6 (3.3%) | 13 (52.0%) |
| $50,000 to $74,999 | 30 (16.5%) | 10 (40.0%) |
| $75,000 to $99,999 | 36 (19.8%) | 0 (0.0%) |
| $100,000 to $149,999 | 81 (44.5%) | 0 (0.0%) |
| $150,000 or more | 20 (11.0%) | 1 (4.0%) |
| Total | 182 (100.0%) | 25 (100.0%) |
Monthly Housing Cost Tiers in Clifton
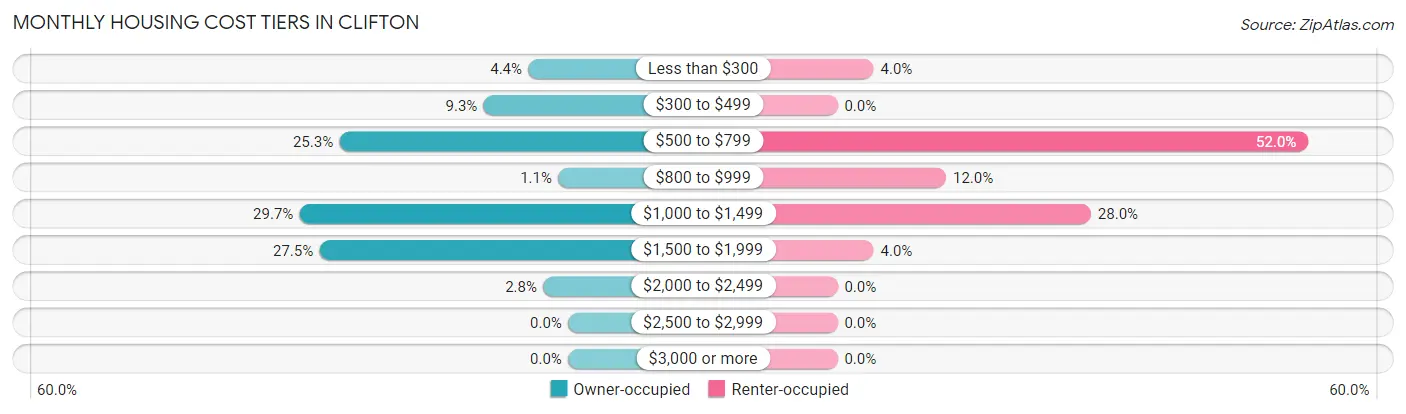
| Monthly Cost | Owner-occupied | Renter-occupied |
| Less than $300 | 8 (4.4%) | 1 (4.0%) |
| $300 to $499 | 17 (9.3%) | 0 (0.0%) |
| $500 to $799 | 46 (25.3%) | 13 (52.0%) |
| $800 to $999 | 2 (1.1%) | 3 (12.0%) |
| $1,000 to $1,499 | 54 (29.7%) | 7 (28.0%) |
| $1,500 to $1,999 | 50 (27.5%) | 1 (4.0%) |
| $2,000 to $2,499 | 5 (2.8%) | 0 (0.0%) |
| $2,500 to $2,999 | 0 (0.0%) | 0 (0.0%) |
| $3,000 or more | 0 (0.0%) | 0 (0.0%) |
| Total | 182 (100.0%) | 25 (100.0%) |
Physical Housing Characteristics in Clifton
Housing Structures in Clifton
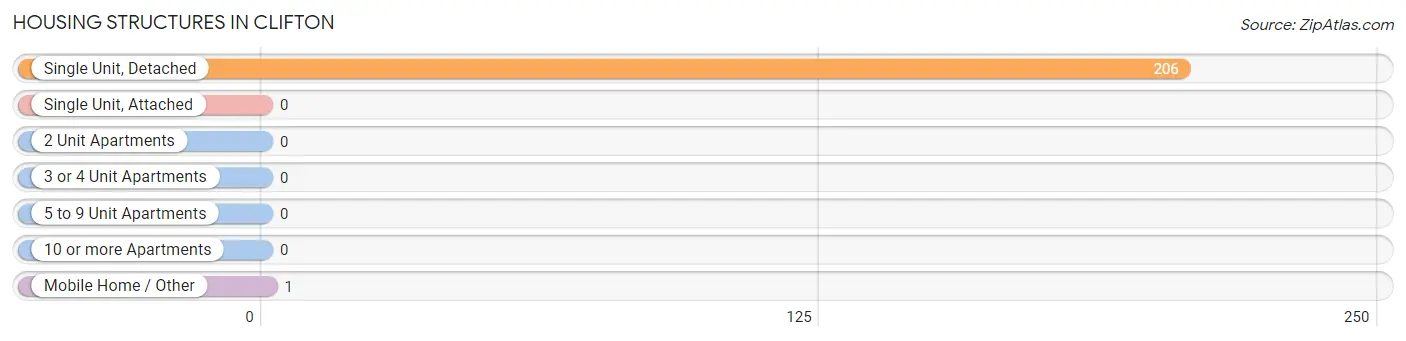
| Structure Type | # Housing Units | % Housing Units |
| Single Unit, Detached | 206 | 99.5% |
| Single Unit, Attached | 0 | 0.0% |
| 2 Unit Apartments | 0 | 0.0% |
| 3 or 4 Unit Apartments | 0 | 0.0% |
| 5 to 9 Unit Apartments | 0 | 0.0% |
| 10 or more Apartments | 0 | 0.0% |
| Mobile Home / Other | 1 | 0.5% |
| Total | 207 | 100.0% |
Housing Structures by Occupancy in Clifton
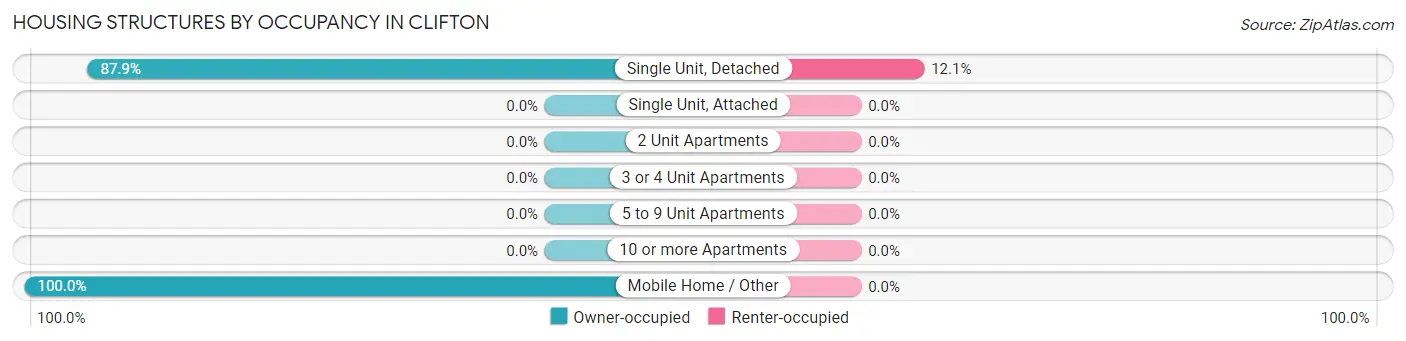
| Structure Type | Owner-occupied | Renter-occupied |
| Single Unit, Detached | 181 (87.9%) | 25 (12.1%) |
| Single Unit, Attached | 0 (0.0%) | 0 (0.0%) |
| 2 Unit Apartments | 0 (0.0%) | 0 (0.0%) |
| 3 or 4 Unit Apartments | 0 (0.0%) | 0 (0.0%) |
| 5 to 9 Unit Apartments | 0 (0.0%) | 0 (0.0%) |
| 10 or more Apartments | 0 (0.0%) | 0 (0.0%) |
| Mobile Home / Other | 1 (100.0%) | 0 (0.0%) |
| Total | 182 (87.9%) | 25 (12.1%) |
Housing Structures by Number of Rooms in Clifton
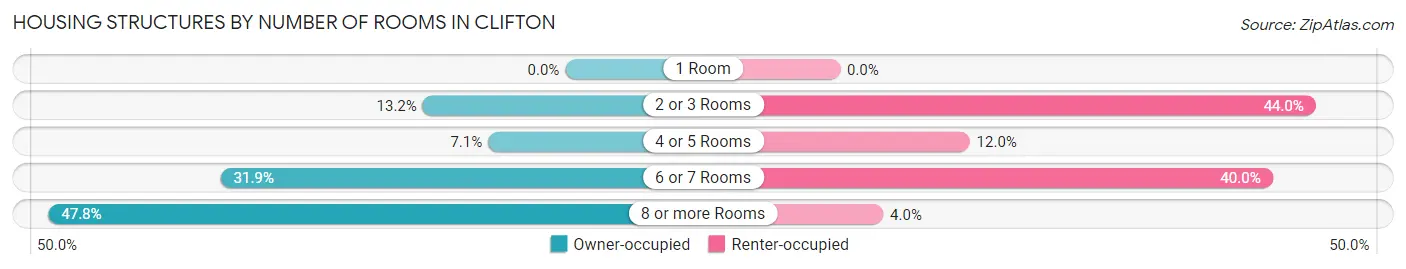
| Number of Rooms | Owner-occupied | Renter-occupied |
| 1 Room | 0 (0.0%) | 0 (0.0%) |
| 2 or 3 Rooms | 24 (13.2%) | 11 (44.0%) |
| 4 or 5 Rooms | 13 (7.1%) | 3 (12.0%) |
| 6 or 7 Rooms | 58 (31.9%) | 10 (40.0%) |
| 8 or more Rooms | 87 (47.8%) | 1 (4.0%) |
| Total | 182 (100.0%) | 25 (100.0%) |
Housing Structure by Heating Type in Clifton
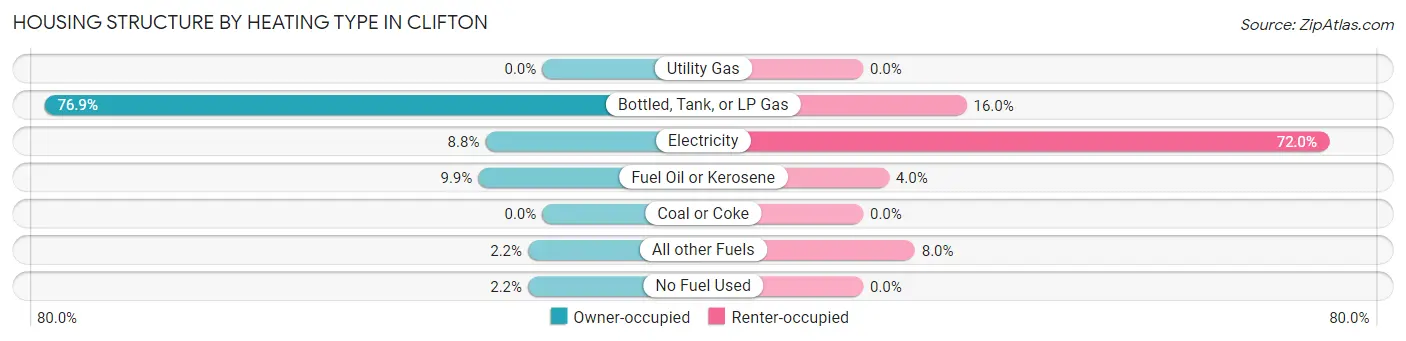
| Heating Type | Owner-occupied | Renter-occupied |
| Utility Gas | 0 (0.0%) | 0 (0.0%) |
| Bottled, Tank, or LP Gas | 140 (76.9%) | 4 (16.0%) |
| Electricity | 16 (8.8%) | 18 (72.0%) |
| Fuel Oil or Kerosene | 18 (9.9%) | 1 (4.0%) |
| Coal or Coke | 0 (0.0%) | 0 (0.0%) |
| All other Fuels | 4 (2.2%) | 2 (8.0%) |
| No Fuel Used | 4 (2.2%) | 0 (0.0%) |
| Total | 182 (100.0%) | 25 (100.0%) |
Household Vehicle Usage in Clifton
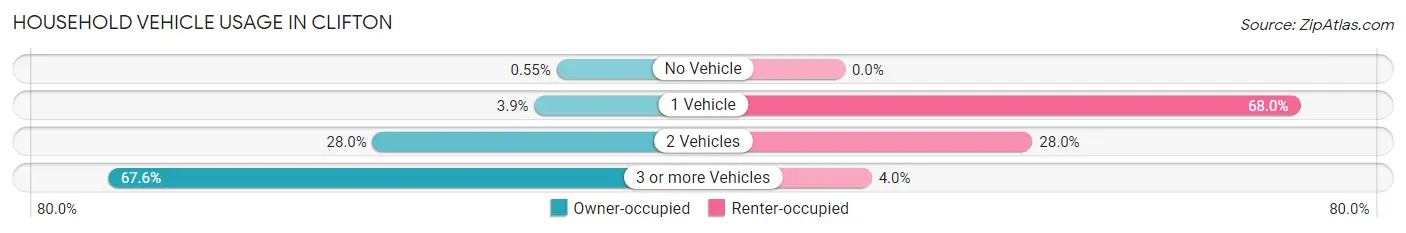
| Vehicles per Household | Owner-occupied | Renter-occupied |
| No Vehicle | 1 (0.5%) | 0 (0.0%) |
| 1 Vehicle | 7 (3.8%) | 17 (68.0%) |
| 2 Vehicles | 51 (28.0%) | 7 (28.0%) |
| 3 or more Vehicles | 123 (67.6%) | 1 (4.0%) |
| Total | 182 (100.0%) | 25 (100.0%) |
Real Estate & Mortgages in Clifton
Real Estate and Mortgage Overview in Clifton
| Characteristic | Without Mortgage | With Mortgage |
| Housing Units | 53 | 129 |
| Median Property Value | $230,400 | $255,000 |
| Median Household Income | $133,125 | $10 |
| Monthly Housing Costs | $506 | $0 |
| Real Estate Taxes | $1,565 | $10 |
Property Value by Mortgage Status in Clifton
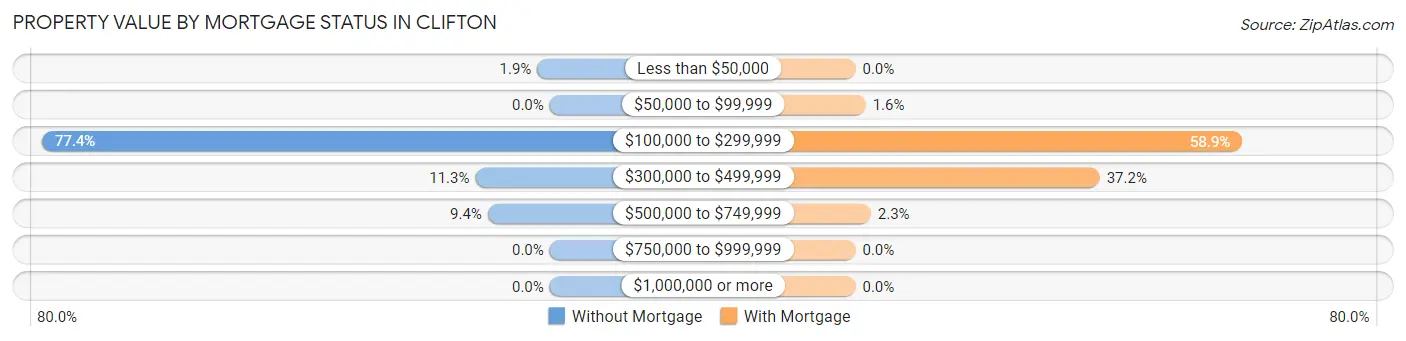
| Property Value | Without Mortgage | With Mortgage |
| Less than $50,000 | 1 (1.9%) | 0 (0.0%) |
| $50,000 to $99,999 | 0 (0.0%) | 2 (1.5%) |
| $100,000 to $299,999 | 41 (77.4%) | 76 (58.9%) |
| $300,000 to $499,999 | 6 (11.3%) | 48 (37.2%) |
| $500,000 to $749,999 | 5 (9.4%) | 3 (2.3%) |
| $750,000 to $999,999 | 0 (0.0%) | 0 (0.0%) |
| $1,000,000 or more | 0 (0.0%) | 0 (0.0%) |
| Total | 53 (100.0%) | 129 (100.0%) |
Household Income by Mortgage Status in Clifton
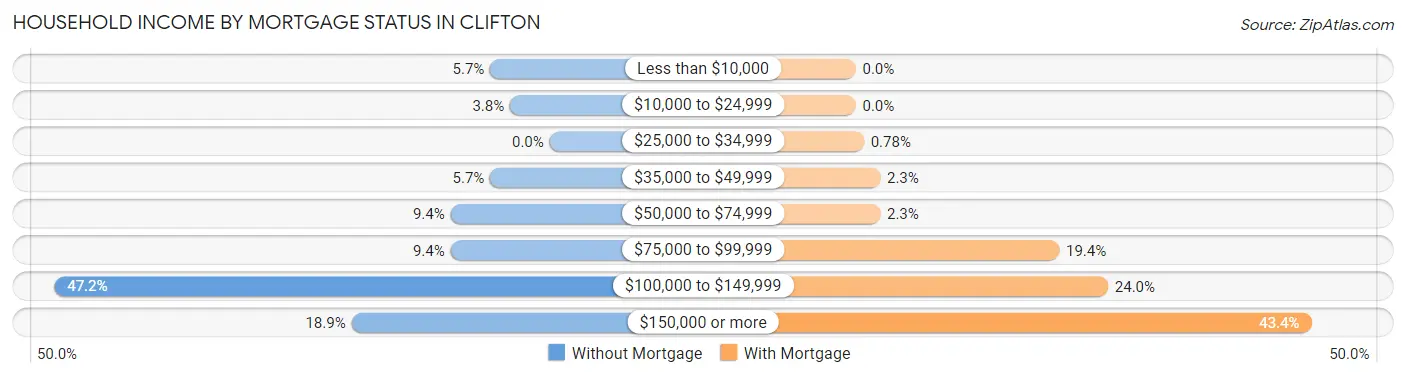
| Household Income | Without Mortgage | With Mortgage |
| Less than $10,000 | 3 (5.7%) | 0 (0.0%) |
| $10,000 to $24,999 | 2 (3.8%) | 0 (0.0%) |
| $25,000 to $34,999 | 0 (0.0%) | 1 (0.8%) |
| $35,000 to $49,999 | 3 (5.7%) | 3 (2.3%) |
| $50,000 to $74,999 | 5 (9.4%) | 3 (2.3%) |
| $75,000 to $99,999 | 5 (9.4%) | 25 (19.4%) |
| $100,000 to $149,999 | 25 (47.2%) | 31 (24.0%) |
| $150,000 or more | 10 (18.9%) | 56 (43.4%) |
| Total | 53 (100.0%) | 129 (100.0%) |
Property Value to Household Income Ratio in Clifton
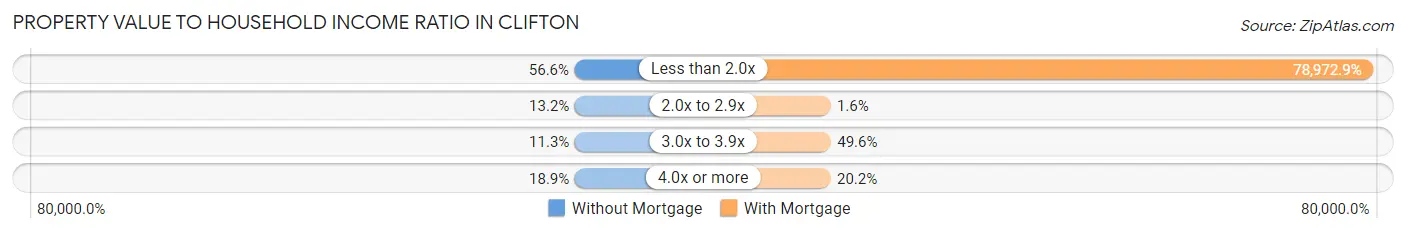
| Value-to-Income Ratio | Without Mortgage | With Mortgage |
| Less than 2.0x | 30 (56.6%) | 101,875 (78,972.9%) |
| 2.0x to 2.9x | 7 (13.2%) | 2 (1.5%) |
| 3.0x to 3.9x | 6 (11.3%) | 64 (49.6%) |
| 4.0x or more | 10 (18.9%) | 26 (20.2%) |
| Total | 53 (100.0%) | 129 (100.0%) |
Real Estate Taxes by Mortgage Status in Clifton
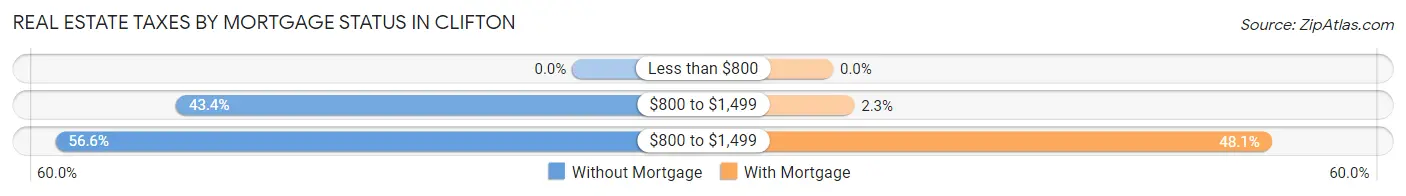
| Property Taxes | Without Mortgage | With Mortgage |
| Less than $800 | 0 (0.0%) | 0 (0.0%) |
| $800 to $1,499 | 23 (43.4%) | 3 (2.3%) |
| $800 to $1,499 | 30 (56.6%) | 62 (48.1%) |
| Total | 53 (100.0%) | 129 (100.0%) |
Health & Disability in Clifton
Health Insurance Coverage by Age in Clifton
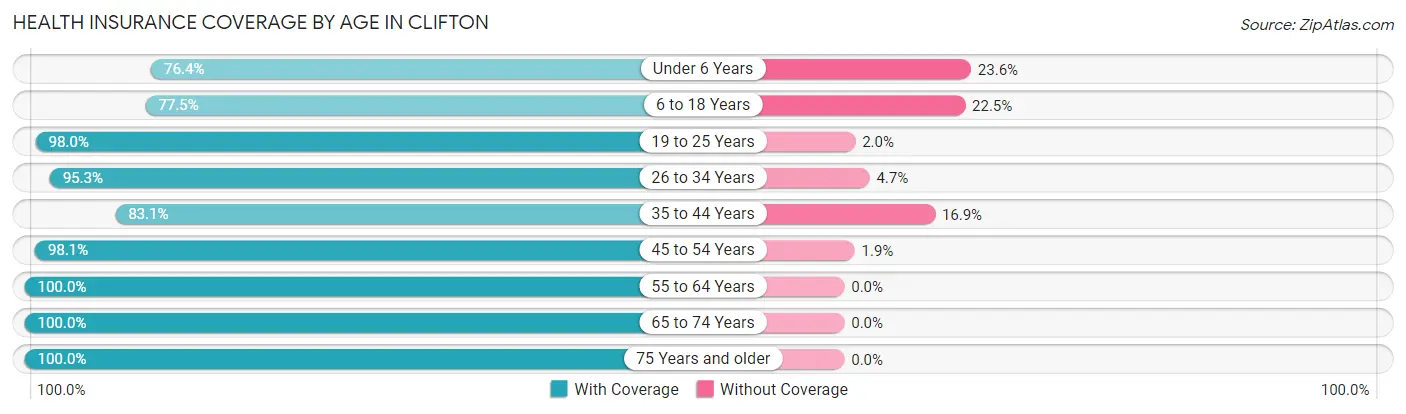
| Age Bracket | With Coverage | Without Coverage |
| Under 6 Years | 55 (76.4%) | 17 (23.6%) |
| 6 to 18 Years | 141 (77.5%) | 41 (22.5%) |
| 19 to 25 Years | 144 (98.0%) | 3 (2.0%) |
| 26 to 34 Years | 61 (95.3%) | 3 (4.7%) |
| 35 to 44 Years | 59 (83.1%) | 12 (16.9%) |
| 45 to 54 Years | 51 (98.1%) | 1 (1.9%) |
| 55 to 64 Years | 57 (100.0%) | 0 (0.0%) |
| 65 to 74 Years | 69 (100.0%) | 0 (0.0%) |
| 75 Years and older | 21 (100.0%) | 0 (0.0%) |
| Total | 658 (89.5%) | 77 (10.5%) |
Health Insurance Coverage by Citizenship Status in Clifton
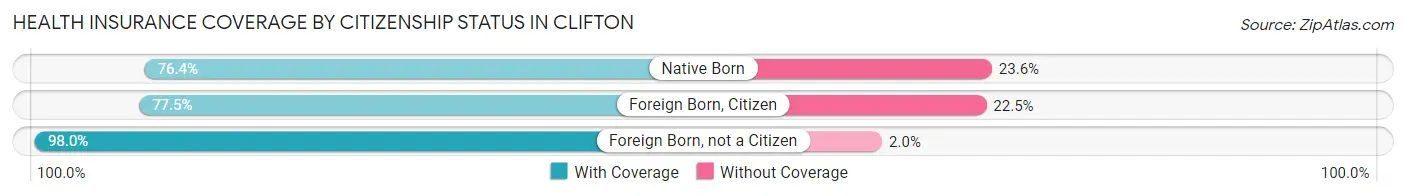
| Citizenship Status | With Coverage | Without Coverage |
| Native Born | 55 (76.4%) | 17 (23.6%) |
| Foreign Born, Citizen | 141 (77.5%) | 41 (22.5%) |
| Foreign Born, not a Citizen | 144 (98.0%) | 3 (2.0%) |
Health Insurance Coverage by Household Income in Clifton
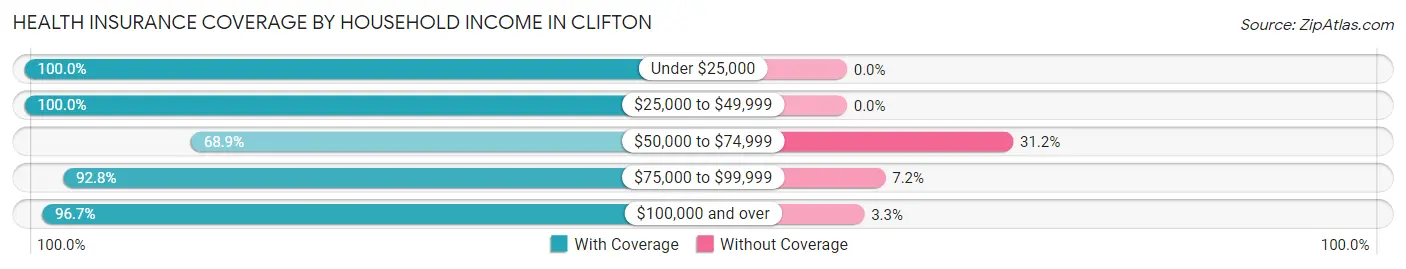
| Household Income | With Coverage | Without Coverage |
| Under $25,000 | 11 (100.0%) | 0 (0.0%) |
| $25,000 to $49,999 | 63 (100.0%) | 0 (0.0%) |
| $50,000 to $74,999 | 126 (68.9%) | 57 (31.1%) |
| $75,000 to $99,999 | 103 (92.8%) | 8 (7.2%) |
| $100,000 and over | 355 (96.7%) | 12 (3.3%) |
Public vs Private Health Insurance Coverage by Age in Clifton
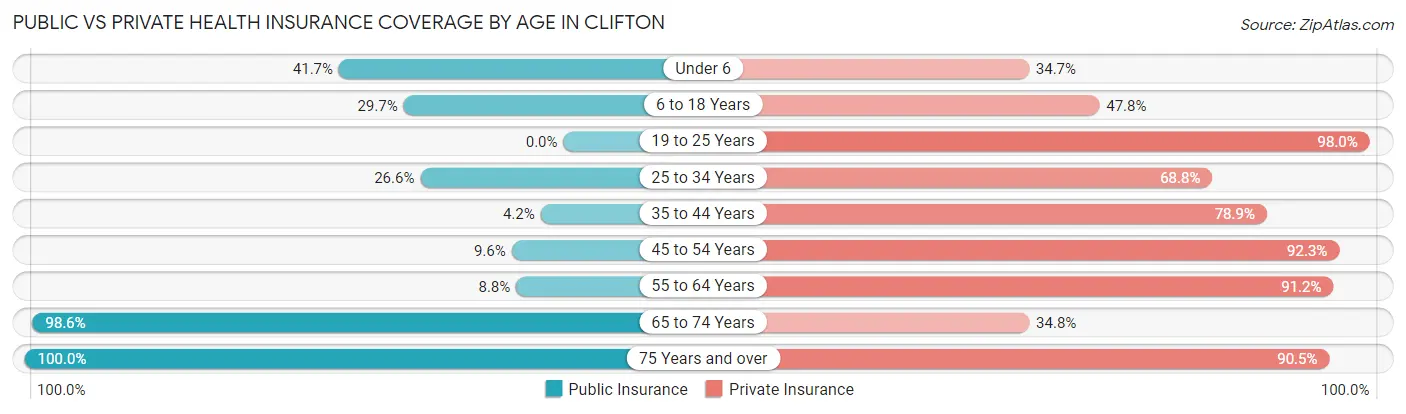
| Age Bracket | Public Insurance | Private Insurance |
| Under 6 | 30 (41.7%) | 25 (34.7%) |
| 6 to 18 Years | 54 (29.7%) | 87 (47.8%) |
| 19 to 25 Years | 0 (0.0%) | 144 (98.0%) |
| 25 to 34 Years | 17 (26.6%) | 44 (68.8%) |
| 35 to 44 Years | 3 (4.2%) | 56 (78.9%) |
| 45 to 54 Years | 5 (9.6%) | 48 (92.3%) |
| 55 to 64 Years | 5 (8.8%) | 52 (91.2%) |
| 65 to 74 Years | 68 (98.6%) | 24 (34.8%) |
| 75 Years and over | 21 (100.0%) | 19 (90.5%) |
| Total | 203 (27.6%) | 499 (67.9%) |
Disability Status by Sex by Age in Clifton
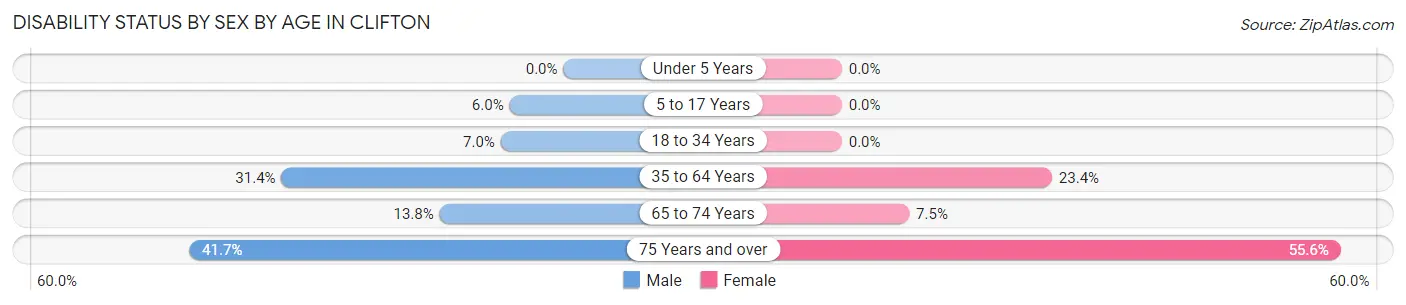
| Age Bracket | Male | Female |
| Under 5 Years | 0 (0.0%) | 0 (0.0%) |
| 5 to 17 Years | 6 (6.0%) | 0 (0.0%) |
| 18 to 34 Years | 6 (7.0%) | 0 (0.0%) |
| 35 to 64 Years | 27 (31.4%) | 22 (23.4%) |
| 65 to 74 Years | 4 (13.8%) | 3 (7.5%) |
| 75 Years and over | 5 (41.7%) | 5 (55.6%) |
Disability Class by Sex by Age in Clifton
Disability Class: Hearing Difficulty
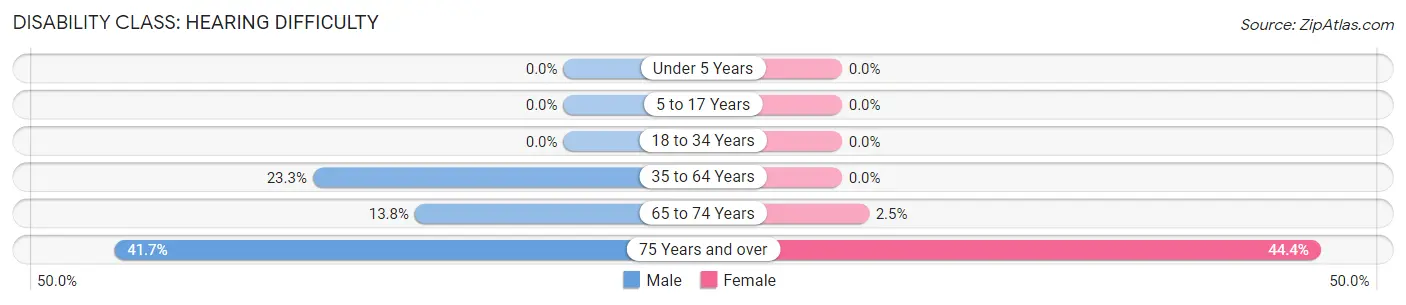
| Age Bracket | Male | Female |
| Under 5 Years | 0 (0.0%) | 0 (0.0%) |
| 5 to 17 Years | 0 (0.0%) | 0 (0.0%) |
| 18 to 34 Years | 0 (0.0%) | 0 (0.0%) |
| 35 to 64 Years | 20 (23.3%) | 0 (0.0%) |
| 65 to 74 Years | 4 (13.8%) | 1 (2.5%) |
| 75 Years and over | 5 (41.7%) | 4 (44.4%) |
Disability Class: Vision Difficulty
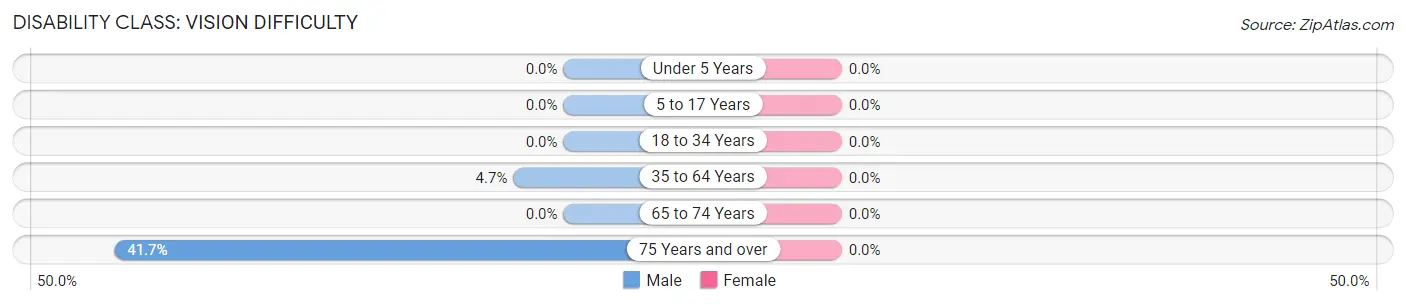
| Age Bracket | Male | Female |
| Under 5 Years | 0 (0.0%) | 0 (0.0%) |
| 5 to 17 Years | 0 (0.0%) | 0 (0.0%) |
| 18 to 34 Years | 0 (0.0%) | 0 (0.0%) |
| 35 to 64 Years | 4 (4.6%) | 0 (0.0%) |
| 65 to 74 Years | 0 (0.0%) | 0 (0.0%) |
| 75 Years and over | 5 (41.7%) | 0 (0.0%) |
Disability Class: Cognitive Difficulty
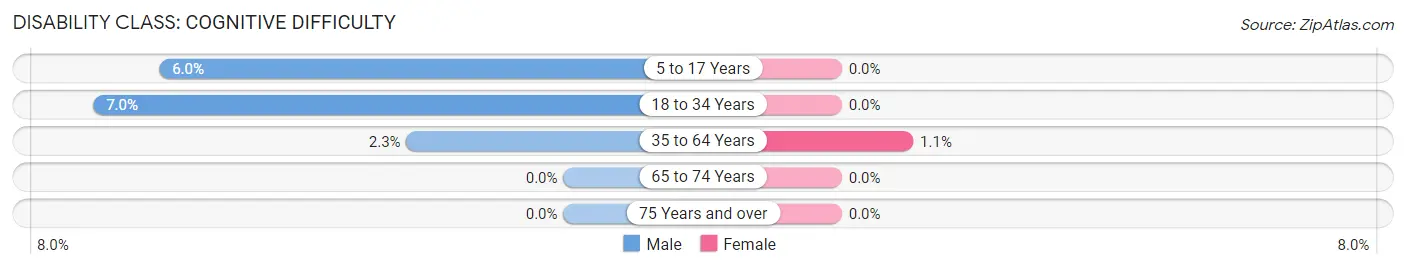
| Age Bracket | Male | Female |
| 5 to 17 Years | 6 (6.0%) | 0 (0.0%) |
| 18 to 34 Years | 6 (7.0%) | 0 (0.0%) |
| 35 to 64 Years | 2 (2.3%) | 1 (1.1%) |
| 65 to 74 Years | 0 (0.0%) | 0 (0.0%) |
| 75 Years and over | 0 (0.0%) | 0 (0.0%) |
Disability Class: Ambulatory Difficulty
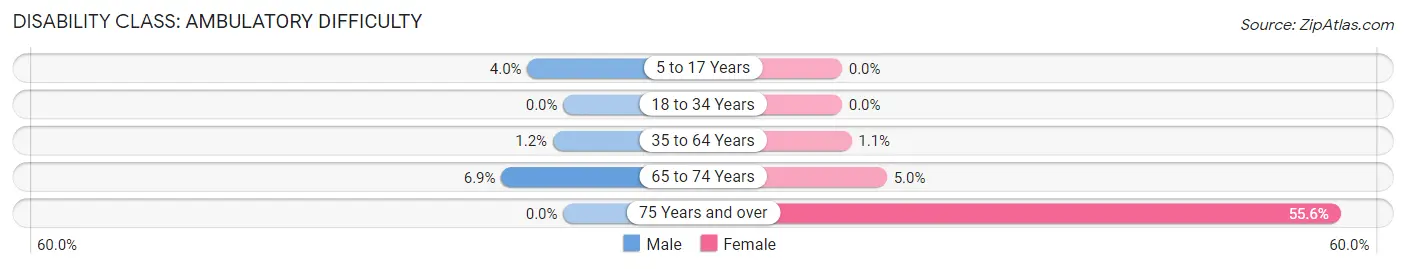
| Age Bracket | Male | Female |
| 5 to 17 Years | 4 (4.0%) | 0 (0.0%) |
| 18 to 34 Years | 0 (0.0%) | 0 (0.0%) |
| 35 to 64 Years | 1 (1.2%) | 1 (1.1%) |
| 65 to 74 Years | 2 (6.9%) | 2 (5.0%) |
| 75 Years and over | 0 (0.0%) | 5 (55.6%) |
Disability Class: Self-Care Difficulty
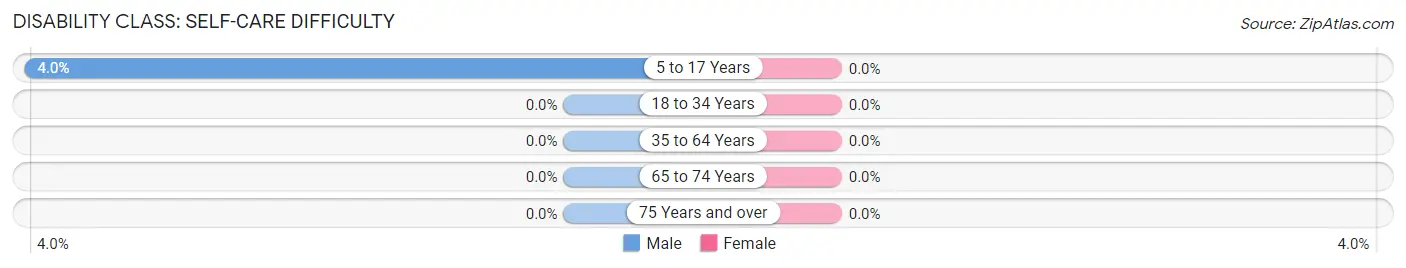
| Age Bracket | Male | Female |
| 5 to 17 Years | 4 (4.0%) | 0 (0.0%) |
| 18 to 34 Years | 0 (0.0%) | 0 (0.0%) |
| 35 to 64 Years | 0 (0.0%) | 0 (0.0%) |
| 65 to 74 Years | 0 (0.0%) | 0 (0.0%) |
| 75 Years and over | 0 (0.0%) | 0 (0.0%) |
Technology Access in Clifton
Computing Device Access in Clifton
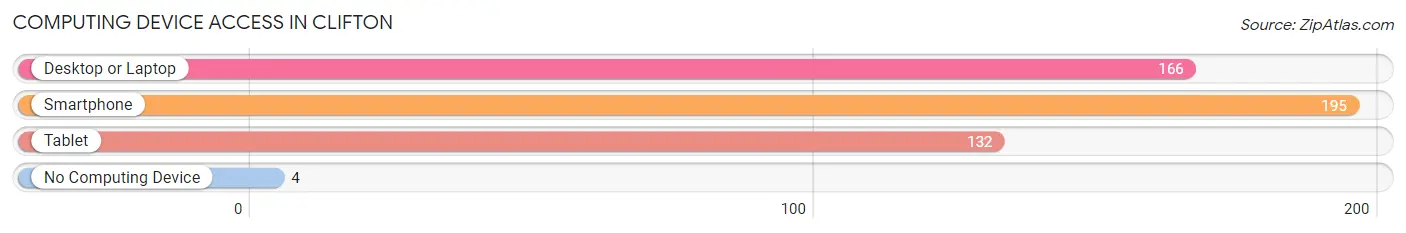
| Device Type | # Households | % Households |
| Desktop or Laptop | 166 | 80.2% |
| Smartphone | 195 | 94.2% |
| Tablet | 132 | 63.8% |
| No Computing Device | 4 | 1.9% |
| Total | 207 | 100.0% |
Internet Access in Clifton
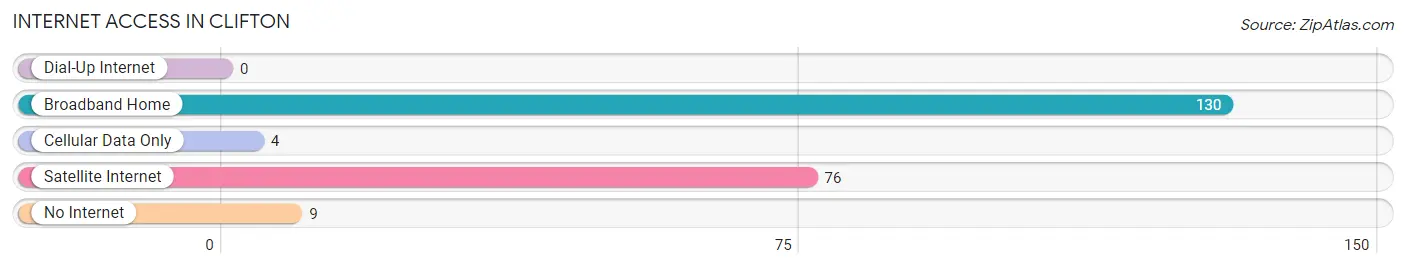
| Internet Type | # Households | % Households |
| Dial-Up Internet | 0 | 0.0% |
| Broadband Home | 130 | 62.8% |
| Cellular Data Only | 4 | 1.9% |
| Satellite Internet | 76 | 36.7% |
| No Internet | 9 | 4.3% |
| Total | 207 | 100.0% |
Clifton Summary
Clifton, Idaho is a small town located in the southeastern corner of the state, near the border of Utah. It is part of the larger Bannock County, and is situated in a rural area surrounded by farmland and rolling hills. The town has a population of just over 1,000 people, and is known for its friendly atmosphere and small-town charm.
History
Clifton was first settled in the late 1800s by Mormon pioneers who were looking for a place to call home. The town was originally named “Cliftonville” after the nearby Clifton Creek, but the name was later changed to Clifton. The town was officially incorporated in 1909, and has remained a small, rural community ever since.
Geography
Clifton is located in the southeastern corner of Idaho, near the border of Utah. It is situated in a rural area surrounded by farmland and rolling hills. The town is located at an elevation of 4,890 feet, and is part of the larger Bannock County. The nearby Clifton Creek runs through the town, and is a popular spot for fishing and swimming.
Economy
Clifton’s economy is largely based on agriculture and tourism. The town is home to several farms and ranches, and the surrounding area is known for its production of potatoes, wheat, and other crops. Tourism is also an important part of the local economy, as the town is a popular destination for outdoor recreation.
Demographics
As of the 2010 census, Clifton had a population of 1,072 people. The racial makeup of the town was 95.3% White, 0.7% Native American, 0.3% Asian, 0.2% African American, and 3.5% from other races. The median household income was $37,917, and the median age was 37.7 years.
Conclusion
Clifton, Idaho is a small town located in the southeastern corner of the state, near the border of Utah. It has a population of just over 1,000 people, and is known for its friendly atmosphere and small-town charm. The town’s economy is largely based on agriculture and tourism, and the surrounding area is known for its production of potatoes, wheat, and other crops. Clifton is a popular destination for outdoor recreation, and is a great place to visit for those looking for a peaceful, rural getaway.
Common Questions
What is the Total Population of Clifton?
Total Population of Clifton is 735.
What is the Total Male Population of Clifton?
Total Male Population of Clifton is 345.
What is the Total Female Population of Clifton?
Total Female Population of Clifton is 390.
What is the Ratio of Males per 100 Females in Clifton?
There are 88.46 Males per 100 Females in Clifton.
What is the Ratio of Females per 100 Males in Clifton?
There are 113.04 Females per 100 Males in Clifton.
What is the Median Population Age in Clifton?
Median Population Age in Clifton is 22.8 Years.
What is the Average Family Size in Clifton
Average Family Size in Clifton is 3.9 People.
What is the Average Household Size in Clifton
Average Household Size in Clifton is 3.5 People.
What is Per Capita Income in Clifton?
Per Capita income in Clifton is $26,976.
What is the Median Family Income in Clifton?
Median Family Income in Clifton is $90,000.
What is the Median Household income in Clifton?
Median Household Income in Clifton is $96,750.
What is Inequality or Gini Index in Clifton?
Inequality or Gini Index in Clifton is 0.25.
How Large is the Labor Force in Clifton?
There are 382 People in the Labor Forcein in Clifton.
What is the Percentage of People in the Labor Force in Clifton?
72.9% of People are in the Labor Force in Clifton.
What is the Unemployment Rate in Clifton?
Unemployment Rate in Clifton is 2.4%.