Washington County, ID
Washington County Map
Washington County Overview
10,612
TOTAL POPULATION
5,264
MALE POPULATION
5,348
FEMALE POPULATION
98.43
MALES / 100 FEMALES
101.60
FEMALES / 100 MALES
44.7
MEDIAN AGE
3.0
AVG FAMILY SIZE
2.5
AVG HOUSEHOLD SIZE
$26,213
PER CAPITA INCOME
$58,577
AVG FAMILY INCOME
$50,046
AVG HOUSEHOLD INCOME
40.0%
WAGE / INCOME GAP [ % ]
60.0¢/ $1
WAGE / INCOME GAP [ $ ]
$12,153
FAMILY INCOME DEFICIT
0.45
INEQUALITY / GINI INDEX
4,194
LABOR FORCE [ PEOPLE ]
49.4%
PERCENT IN LABOR FORCE
4.5%
UNEMPLOYMENT RATE
Washington County Area Codes
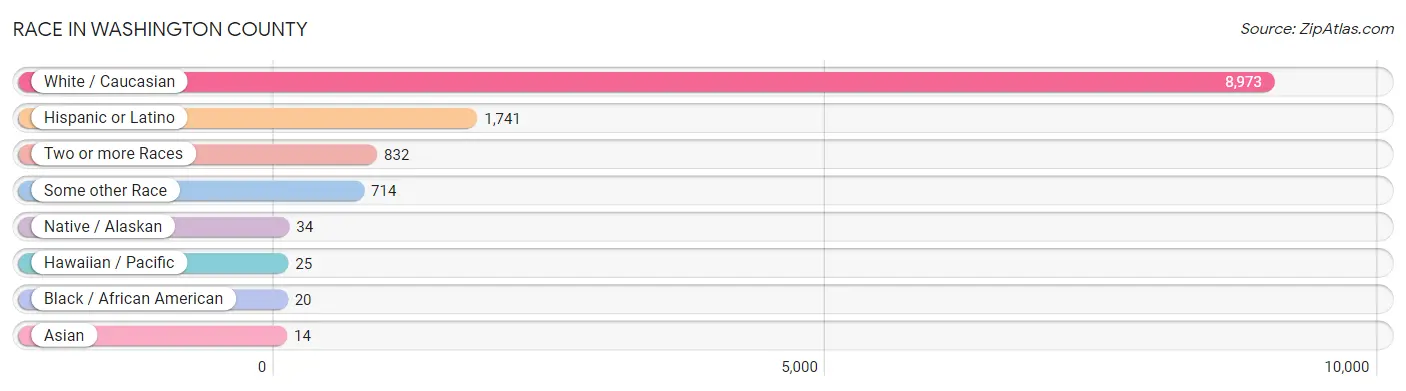
Race in Washington County
The most populous races in Washington County are White / Caucasian (8,973 | 84.6%), Hispanic or Latino (1,741 | 16.4%), and Two or more Races (832 | 7.8%).
| Race | # Population | % Population |
| Asian | 14 | 0.1% |
| Black / African American | 20 | 0.2% |
| Hawaiian / Pacific | 25 | 0.2% |
| Hispanic or Latino | 1,741 | 16.4% |
| Native / Alaskan | 34 | 0.3% |
| White / Caucasian | 8,973 | 84.6% |
| Two or more Races | 832 | 7.8% |
| Some other Race | 714 | 6.7% |
| Total | 10,612 | 100.0% |
Ancestry in Washington County
The most populous ancestries reported in Washington County are English (1,732 | 16.3%), Mexican (1,685 | 15.9%), German (1,572 | 14.8%), Irish (1,436 | 13.5%), and American (700 | 6.6%), together accounting for 67.1% of all Washington County residents.

| Ancestry | # Population | % Population |
| American | 700 | 6.6% |
| Arab | 2 | 0.0% |
| Armenian | 6 | 0.1% |
| Basque | 26 | 0.3% |
| Bhutanese | 42 | 0.4% |
| Blackfeet | 3 | 0.0% |
| British | 10 | 0.1% |
| Burmese | 1 | 0.0% |
| Canadian | 27 | 0.3% |
| Cherokee | 36 | 0.3% |
| Chickasaw | 10 | 0.1% |
| Choctaw | 9 | 0.1% |
| Czech | 2 | 0.0% |
| Danish | 124 | 1.2% |
| Delaware | 22 | 0.2% |
| Dutch | 224 | 2.1% |
| Eastern European | 19 | 0.2% |
| English | 1,732 | 16.3% |
| European | 389 | 3.7% |
| French | 196 | 1.8% |
| French Canadian | 16 | 0.2% |
| German | 1,572 | 14.8% |
| Greek | 83 | 0.8% |
| Haitian | 7 | 0.1% |
| Irish | 1,436 | 13.5% |
| Italian | 241 | 2.3% |
| Lebanese | 2 | 0.0% |
| Mexican | 1,685 | 15.9% |
| Navajo | 2 | 0.0% |
| Northern European | 16 | 0.2% |
| Norwegian | 96 | 0.9% |
| Polish | 45 | 0.4% |
| Portuguese | 58 | 0.5% |
| Puerto Rican | 32 | 0.3% |
| Romanian | 11 | 0.1% |
| Russian | 185 | 1.7% |
| Scandinavian | 89 | 0.8% |
| Scotch-Irish | 173 | 1.6% |
| Scottish | 389 | 3.7% |
| Sioux | 128 | 1.2% |
| Slovak | 9 | 0.1% |
| South African | 5 | 0.1% |
| Spaniard | 20 | 0.2% |
| Spanish | 2 | 0.0% |
| Sri Lankan | 6 | 0.1% |
| Subsaharan African | 5 | 0.1% |
| Swedish | 287 | 2.7% |
| Swiss | 65 | 0.6% |
| Welsh | 107 | 1.0% |
| Yugoslavian | 20 | 0.2% | View All 50 Rows |
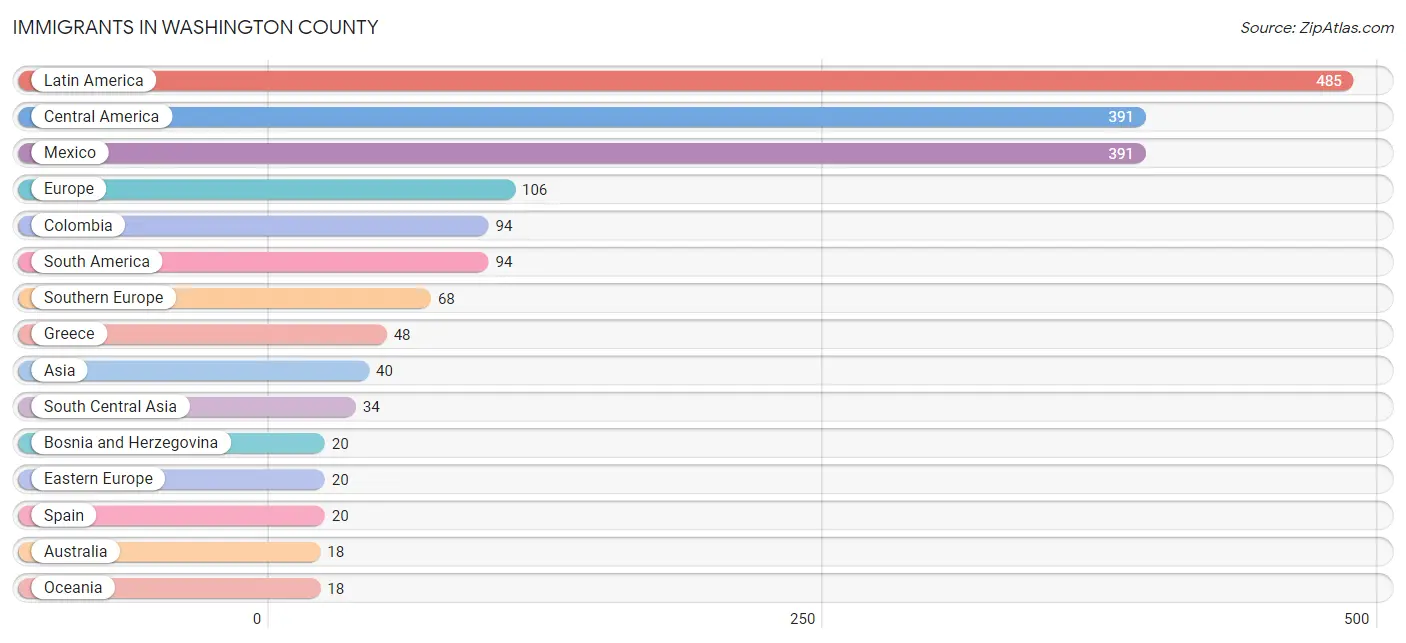
Immigrants in Washington County
The most numerous immigrant groups reported in Washington County came from Latin America (485 | 4.6%), Central America (391 | 3.7%), Mexico (391 | 3.7%), Europe (106 | 1.0%), and Colombia (94 | 0.9%), together accounting for 13.8% of all Washington County residents.
| Immigration Origin | # Population | % Population |
| Asia | 40 | 0.4% |
| Australia | 18 | 0.2% |
| Bosnia and Herzegovina | 20 | 0.2% |
| Central America | 391 | 3.7% |
| China | 6 | 0.1% |
| Colombia | 94 | 0.9% |
| Denmark | 3 | 0.0% |
| Eastern Asia | 6 | 0.1% |
| Eastern Europe | 20 | 0.2% |
| Europe | 106 | 1.0% |
| Germany | 10 | 0.1% |
| Greece | 48 | 0.4% |
| Latin America | 485 | 4.6% |
| Mexico | 391 | 3.7% |
| Northern Europe | 8 | 0.1% |
| Oceania | 18 | 0.2% |
| South America | 94 | 0.9% |
| South Central Asia | 34 | 0.3% |
| Southern Europe | 68 | 0.6% |
| Spain | 20 | 0.2% |
| Sweden | 5 | 0.1% |
| Taiwan | 6 | 0.1% |
| Western Europe | 10 | 0.1% | View All 23 Rows |
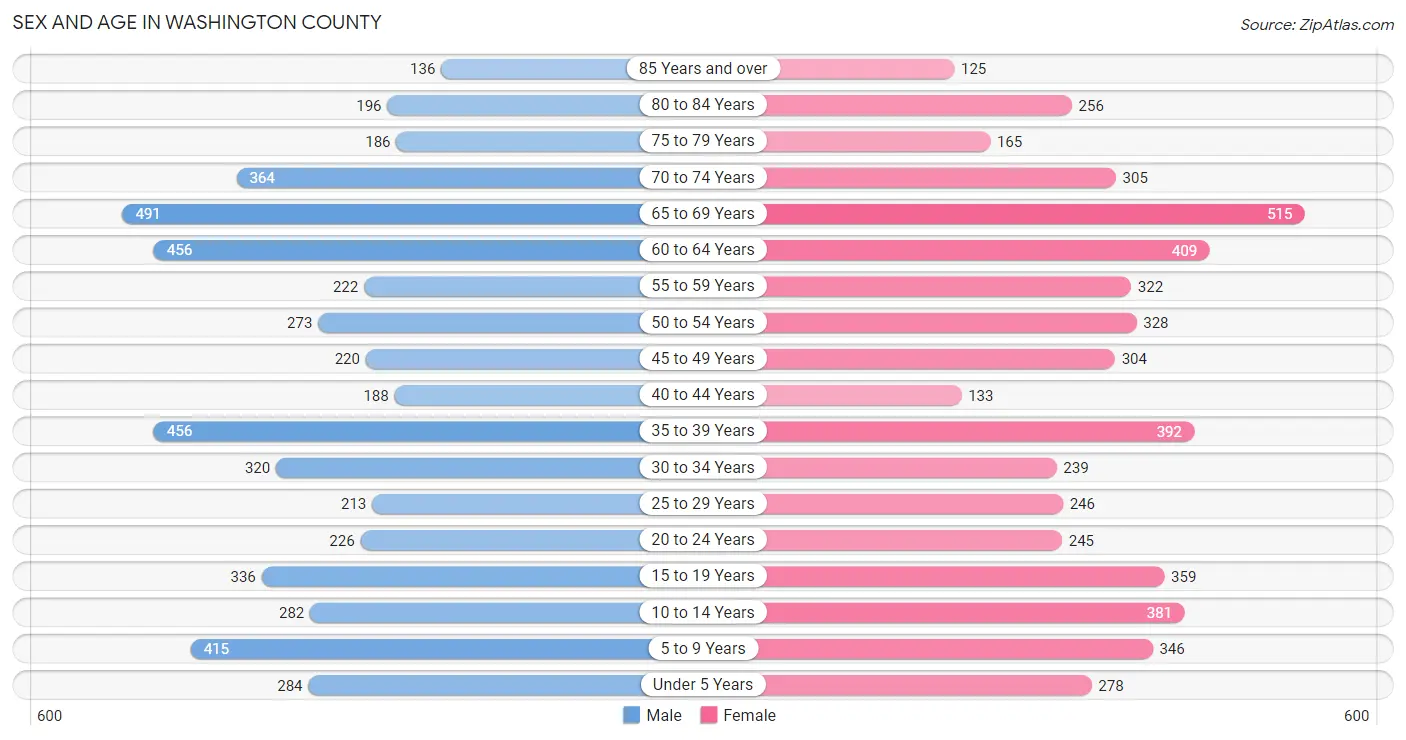
Sex and Age in Washington County
Sex and Age in Washington County
The most populous age groups in Washington County are 65 to 69 Years (491 | 9.3%) for men and 65 to 69 Years (515 | 9.6%) for women.
| Age Bracket | Male | Female |
| Under 5 Years | 284 (5.4%) | 278 (5.2%) |
| 5 to 9 Years | 415 (7.9%) | 346 (6.5%) |
| 10 to 14 Years | 282 (5.4%) | 381 (7.1%) |
| 15 to 19 Years | 336 (6.4%) | 359 (6.7%) |
| 20 to 24 Years | 226 (4.3%) | 245 (4.6%) |
| 25 to 29 Years | 213 (4.1%) | 246 (4.6%) |
| 30 to 34 Years | 320 (6.1%) | 239 (4.5%) |
| 35 to 39 Years | 456 (8.7%) | 392 (7.3%) |
| 40 to 44 Years | 188 (3.6%) | 133 (2.5%) |
| 45 to 49 Years | 220 (4.2%) | 304 (5.7%) |
| 50 to 54 Years | 273 (5.2%) | 328 (6.1%) |
| 55 to 59 Years | 222 (4.2%) | 322 (6.0%) |
| 60 to 64 Years | 456 (8.7%) | 409 (7.6%) |
| 65 to 69 Years | 491 (9.3%) | 515 (9.6%) |
| 70 to 74 Years | 364 (6.9%) | 305 (5.7%) |
| 75 to 79 Years | 186 (3.5%) | 165 (3.1%) |
| 80 to 84 Years | 196 (3.7%) | 256 (4.8%) |
| 85 Years and over | 136 (2.6%) | 125 (2.3%) |
| Total | 5,264 (100.0%) | 5,348 (100.0%) |
Families and Households in Washington County
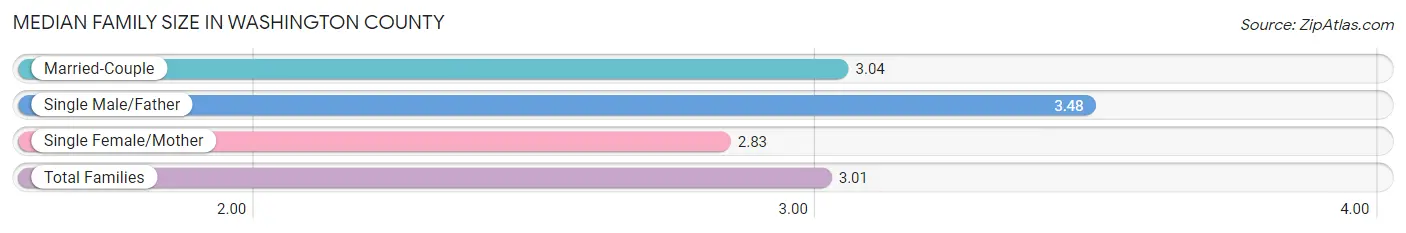
Median Family Size in Washington County
The median family size in Washington County is 3.01 persons per family, with single male/father families (121 | 4.3%) accounting for the largest median family size of 3.48 persons per family. On the other hand, single female/mother families (665 | 23.6%) represent the smallest median family size with 2.83 persons per family.
| Family Type | # Families | Family Size |
| Married-Couple | 2,031 (72.1%) | 3.04 |
| Single Male/Father | 121 (4.3%) | 3.48 |
| Single Female/Mother | 665 (23.6%) | 2.83 |
| Total Families | 2,817 (100.0%) | 3.01 |
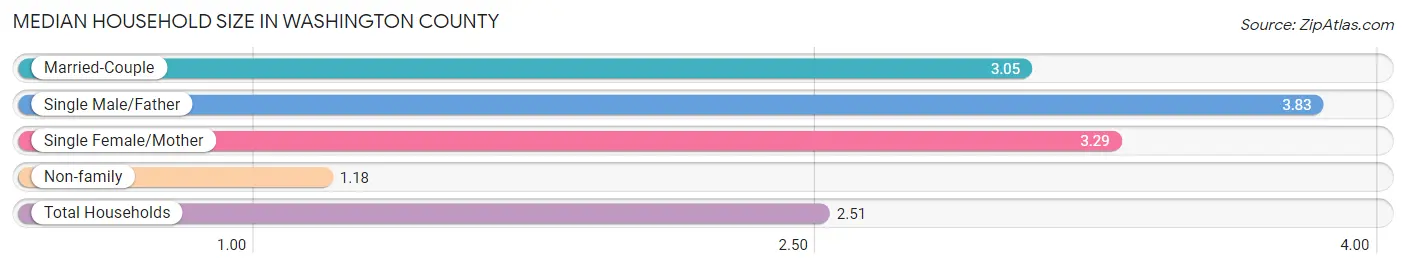
Median Household Size in Washington County
The median household size in Washington County is 2.51 persons per household, with single male/father households (121 | 2.9%) accounting for the largest median household size of 3.83 persons per household. non-family households (1,326 | 32.0%) represent the smallest median household size with 1.18 persons per household.
| Household Type | # Households | Household Size |
| Married-Couple | 2,031 (49.0%) | 3.05 |
| Single Male/Father | 121 (2.9%) | 3.83 |
| Single Female/Mother | 665 (16.1%) | 3.29 |
| Non-family | 1,326 (32.0%) | 1.18 |
| Total Households | 4,143 (100.0%) | 2.51 |
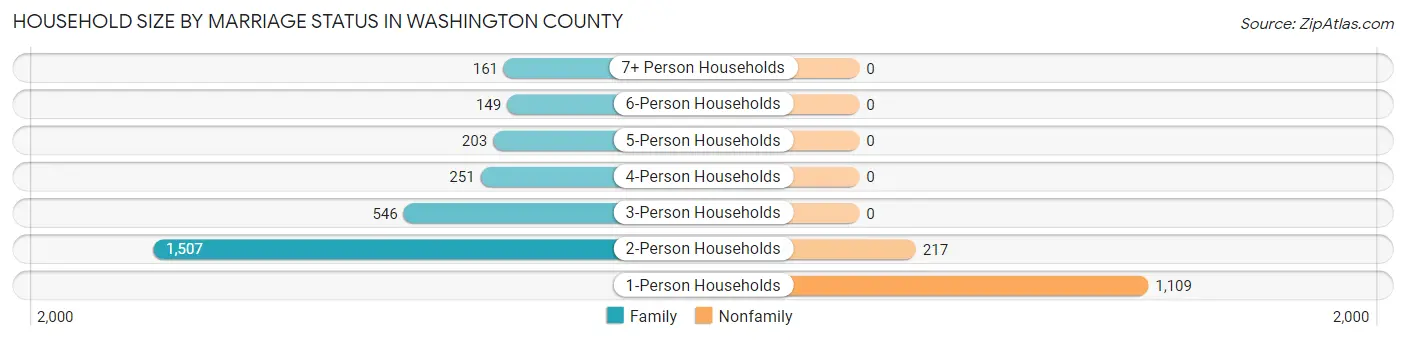
Household Size by Marriage Status in Washington County
Out of a total of 4,143 households in Washington County, 2,817 (68.0%) are family households, while 1,326 (32.0%) are nonfamily households. The most numerous type of family households are 2-person households, comprising 1,507, and the most common type of nonfamily households are 1-person households, comprising 1,109.
| Household Size | Family Households | Nonfamily Households |
| 1-Person Households | - | 1,109 (26.8%) |
| 2-Person Households | 1,507 (36.4%) | 217 (5.2%) |
| 3-Person Households | 546 (13.2%) | 0 (0.0%) |
| 4-Person Households | 251 (6.1%) | 0 (0.0%) |
| 5-Person Households | 203 (4.9%) | 0 (0.0%) |
| 6-Person Households | 149 (3.6%) | 0 (0.0%) |
| 7+ Person Households | 161 (3.9%) | 0 (0.0%) |
| Total | 2,817 (68.0%) | 1,326 (32.0%) |
Female Fertility in Washington County
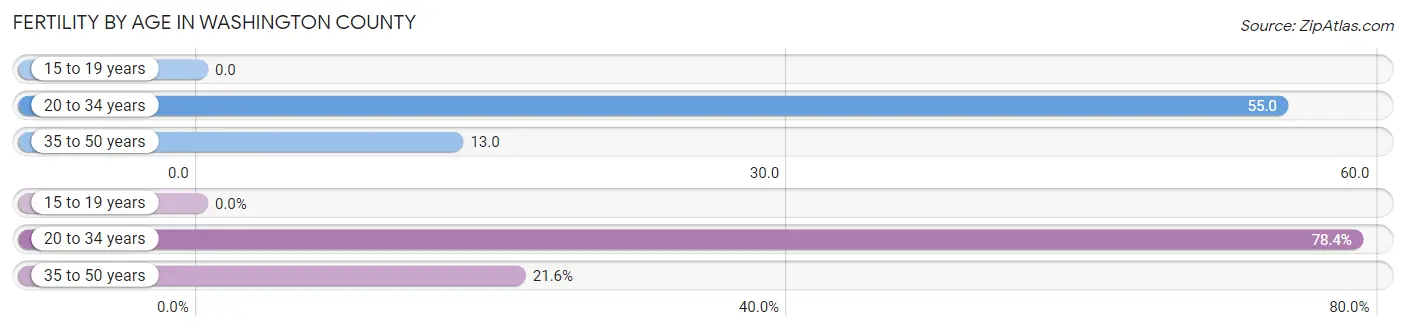
Fertility by Age in Washington County
Average fertility rate in Washington County is 26.0 births per 1,000 women. Women in the age bracket of 20 to 34 years have the highest fertility rate with 55.0 births per 1,000 women. Women in the age bracket of 20 to 34 years acount for 78.4% of all women with births.
| Age Bracket | Women with Births | Births / 1,000 Women |
| 15 to 19 years | 0 (0.0%) | 0.0 |
| 20 to 34 years | 40 (78.4%) | 55.0 |
| 35 to 50 years | 11 (21.6%) | 13.0 |
| Total | 51 (100.0%) | 26.0 |
Fertility by Age by Marriage Status in Washington County
52.9% of women with births (51) in Washington County are married. The highest percentage of unmarried women with births falls into 20 to 34 years age bracket with 60.0% of them unmarried at the time of birth, while the lowest percentage of unmarried women with births belong to 35 to 50 years age bracket with 0.0% of them unmarried.
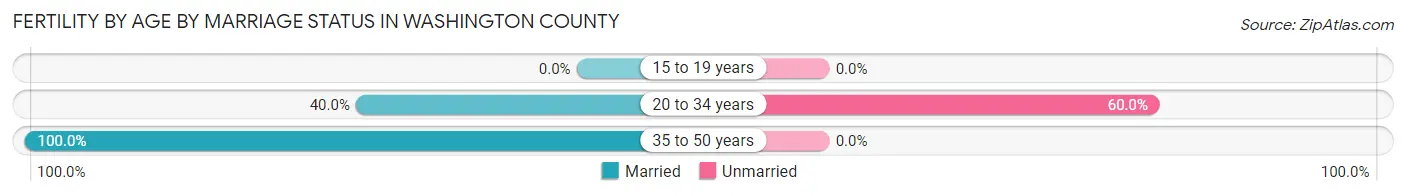
| Age Bracket | Married | Unmarried |
| 15 to 19 years | 0 (0.0%) | 0 (0.0%) |
| 20 to 34 years | 16 (40.0%) | 24 (60.0%) |
| 35 to 50 years | 11 (100.0%) | 0 (0.0%) |
| Total | 27 (52.9%) | 24 (47.1%) |
Fertility by Education in Washington County
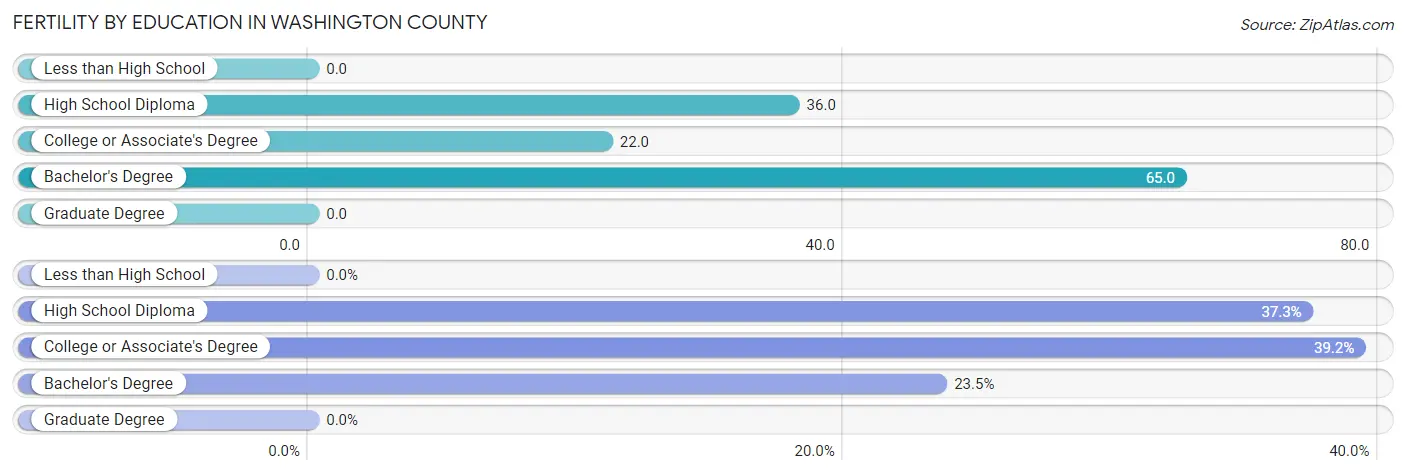
| Educational Attainment | Women with Births | Births / 1,000 Women |
| Less than High School | 0 (0.0%) | 0.0 |
| High School Diploma | 19 (37.2%) | 36.0 |
| College or Associate's Degree | 20 (39.2%) | 22.0 |
| Bachelor's Degree | 12 (23.5%) | 65.0 |
| Graduate Degree | 0 (0.0%) | 0.0 |
| Total | 51 (100.0%) | 26.0 |
Fertility by Education by Marriage Status in Washington County
47.1% of women with births in Washington County are unmarried. Women with the educational attainment of bachelor's degree are most likely to be married with 100.0% of them married at childbirth, while women with the educational attainment of college or associate's degree are least likely to be married with 70.0% of them unmarried at childbirth.
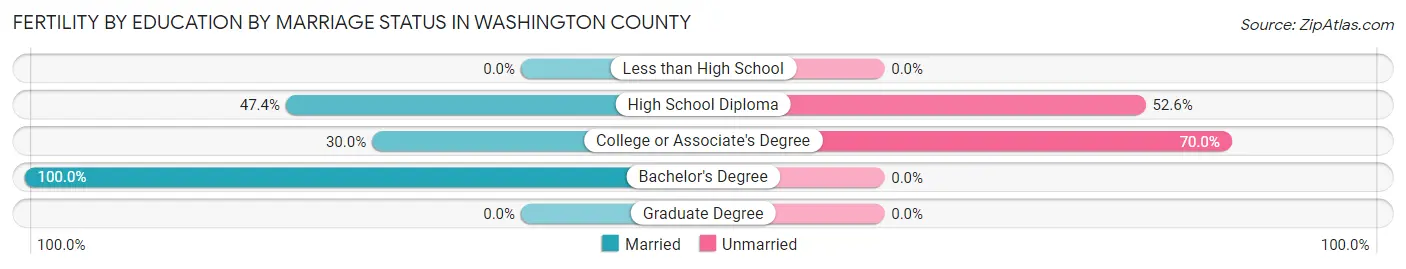
| Educational Attainment | Married | Unmarried |
| Less than High School | 0 (0.0%) | 0 (0.0%) |
| High School Diploma | 9 (47.4%) | 10 (52.6%) |
| College or Associate's Degree | 6 (30.0%) | 14 (70.0%) |
| Bachelor's Degree | 12 (100.0%) | 0 (0.0%) |
| Graduate Degree | 0 (0.0%) | 0 (0.0%) |
| Total | 27 (52.9%) | 24 (47.1%) |
Income in Washington County
Income Overview in Washington County
Per Capita Income in Washington County is $26,213, while median incomes of families and households are $58,577 and $50,046 respectively.
| Characteristic | Number | Measure |
| Per Capita Income | 10,612 | $26,213 |
| Median Family Income | 2,817 | $58,577 |
| Mean Family Income | 2,817 | $71,018 |
| Median Household Income | 4,143 | $50,046 |
| Mean Household Income | 4,143 | $62,962 |
| Income Deficit | 2,817 | $12,153 |
| Wage / Income Gap (%) | 10,612 | 40.01% |
| Wage / Income Gap ($) | 10,612 | 59.99¢ per $1 |
| Gini / Inequality Index | 10,612 | 0.45 |
Earnings by Sex in Washington County
Average Earnings in Washington County are $29,859, $36,920 for men and $22,147 for women, a difference of 40.0%.

| Sex | Number | Average Earnings |
| Male | 2,647 (58.8%) | $36,920 |
| Female | 1,854 (41.2%) | $22,147 |
| Total | 4,501 (100.0%) | $29,859 |
Earnings by Sex by Income Bracket in Washington County
The most common earnings brackets in Washington County are $100,000+ for men (292 | 11.0%) and $25,000 to $29,999 for women (215 | 11.6%).
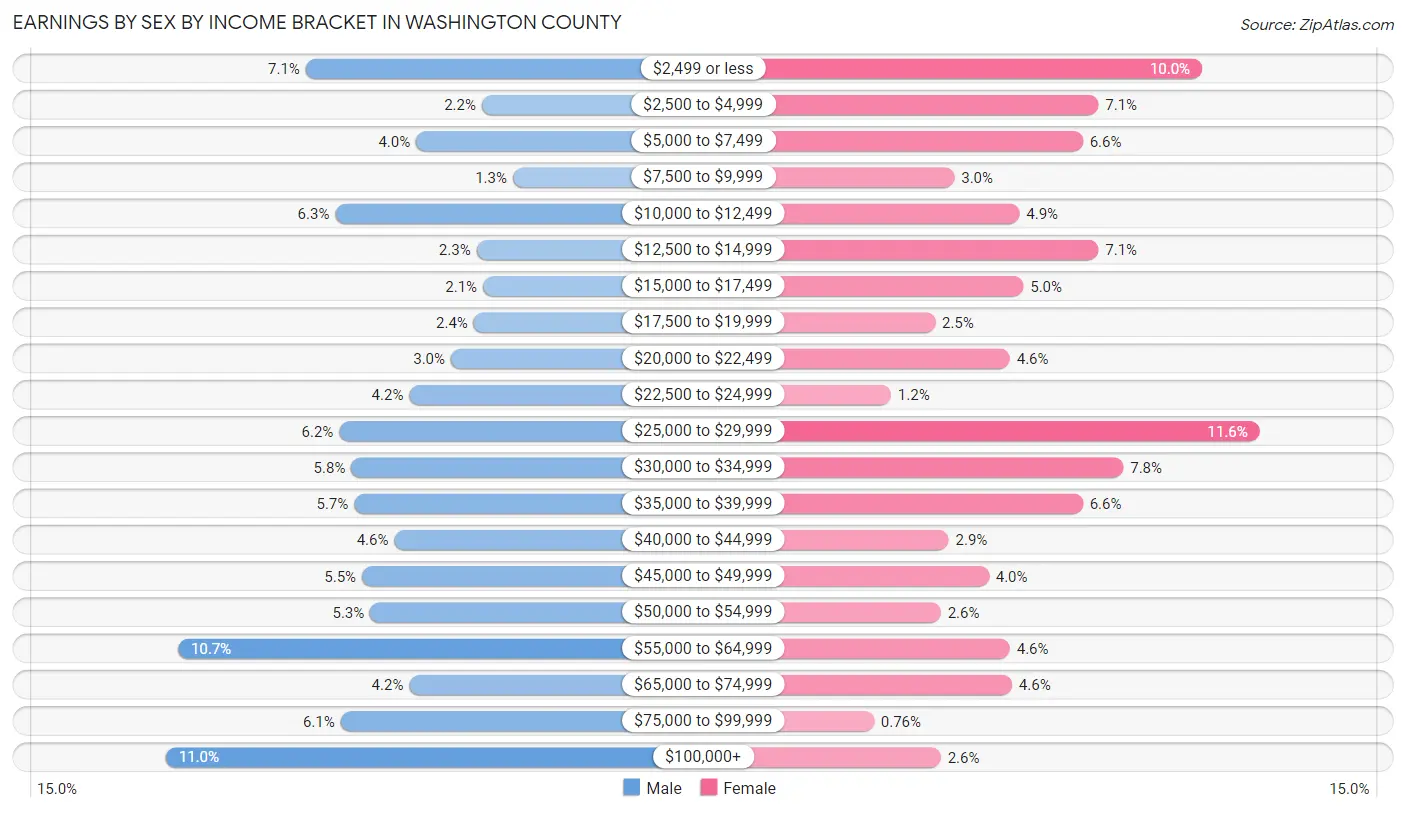
| Income | Male | Female |
| $2,499 or less | 188 (7.1%) | 185 (10.0%) |
| $2,500 to $4,999 | 57 (2.1%) | 131 (7.1%) |
| $5,000 to $7,499 | 106 (4.0%) | 123 (6.6%) |
| $7,500 to $9,999 | 34 (1.3%) | 56 (3.0%) |
| $10,000 to $12,499 | 166 (6.3%) | 90 (4.9%) |
| $12,500 to $14,999 | 61 (2.3%) | 131 (7.1%) |
| $15,000 to $17,499 | 56 (2.1%) | 92 (5.0%) |
| $17,500 to $19,999 | 63 (2.4%) | 46 (2.5%) |
| $20,000 to $22,499 | 80 (3.0%) | 85 (4.6%) |
| $22,500 to $24,999 | 111 (4.2%) | 23 (1.2%) |
| $25,000 to $29,999 | 163 (6.2%) | 215 (11.6%) |
| $30,000 to $34,999 | 154 (5.8%) | 144 (7.8%) |
| $35,000 to $39,999 | 152 (5.7%) | 123 (6.6%) |
| $40,000 to $44,999 | 122 (4.6%) | 53 (2.9%) |
| $45,000 to $49,999 | 146 (5.5%) | 74 (4.0%) |
| $50,000 to $54,999 | 140 (5.3%) | 49 (2.6%) |
| $55,000 to $64,999 | 283 (10.7%) | 85 (4.6%) |
| $65,000 to $74,999 | 111 (4.2%) | 86 (4.6%) |
| $75,000 to $99,999 | 162 (6.1%) | 14 (0.8%) |
| $100,000+ | 292 (11.0%) | 49 (2.6%) |
| Total | 2,647 (100.0%) | 1,854 (100.0%) |
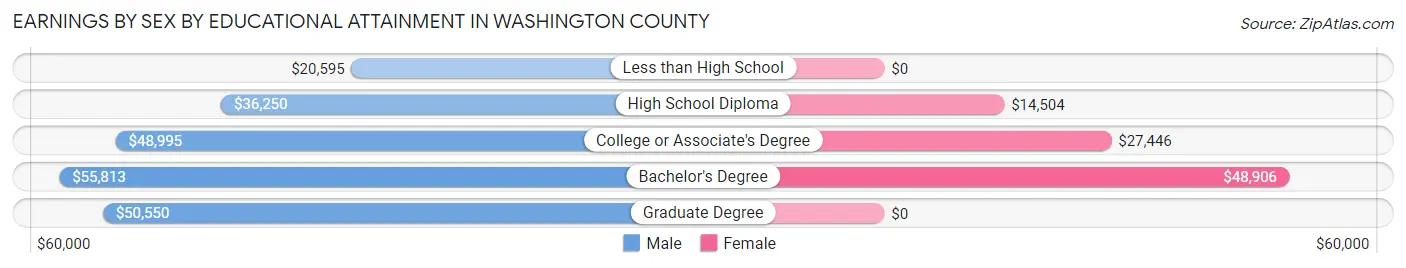
Earnings by Sex by Educational Attainment in Washington County
Average earnings in Washington County are $43,958 for men and $25,685 for women, a difference of 41.6%. Men with an educational attainment of bachelor's degree enjoy the highest average annual earnings of $55,813, while those with less than high school education earn the least with $20,595. Women with an educational attainment of bachelor's degree earn the most with the average annual earnings of $48,906, while those with high school diploma education have the smallest earnings of $14,504.
| Educational Attainment | Male Income | Female Income |
| Less than High School | $20,595 | $0 |
| High School Diploma | $36,250 | $14,504 |
| College or Associate's Degree | $48,995 | $27,446 |
| Bachelor's Degree | $55,813 | $48,906 |
| Graduate Degree | $50,550 | $0 |
| Total | $43,958 | $25,685 |
Family Income in Washington County
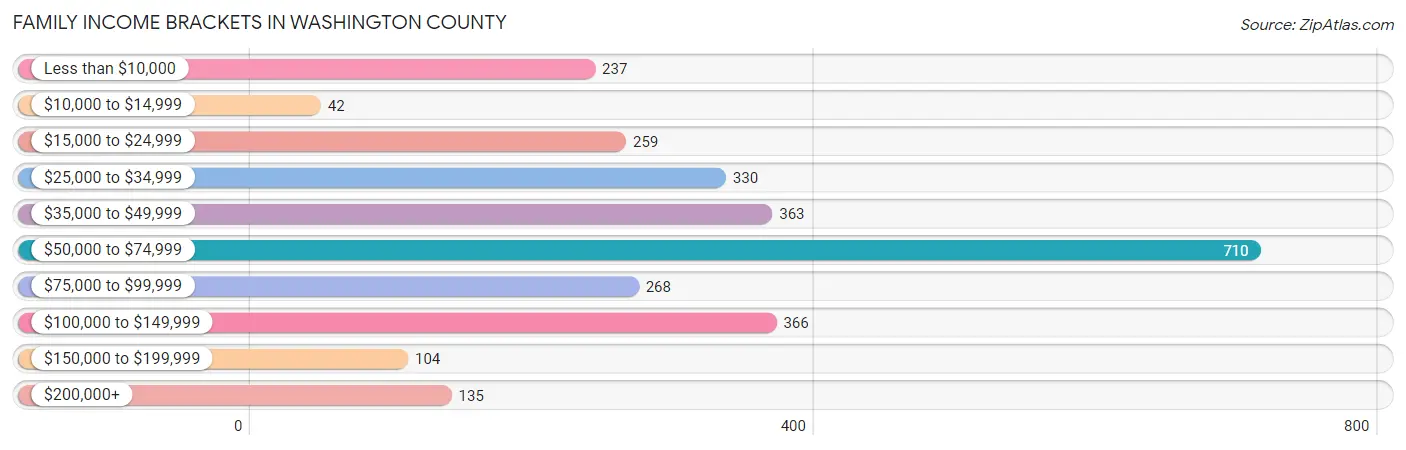
Family Income Brackets in Washington County
According to the Washington County family income data, there are 710 families falling into the $50,000 to $74,999 income range, which is the most common income bracket and makes up 25.2% of all families. Conversely, the $10,000 to $14,999 income bracket is the least frequent group with only 42 families (1.5%) belonging to this category.
| Income Bracket | # Families | % Families |
| Less than $10,000 | 237 | 8.4% |
| $10,000 to $14,999 | 42 | 1.5% |
| $15,000 to $24,999 | 259 | 9.2% |
| $25,000 to $34,999 | 330 | 11.7% |
| $35,000 to $49,999 | 363 | 12.9% |
| $50,000 to $74,999 | 710 | 25.2% |
| $75,000 to $99,999 | 268 | 9.5% |
| $100,000 to $149,999 | 366 | 13.0% |
| $150,000 to $199,999 | 104 | 3.7% |
| $200,000+ | 135 | 4.8% |
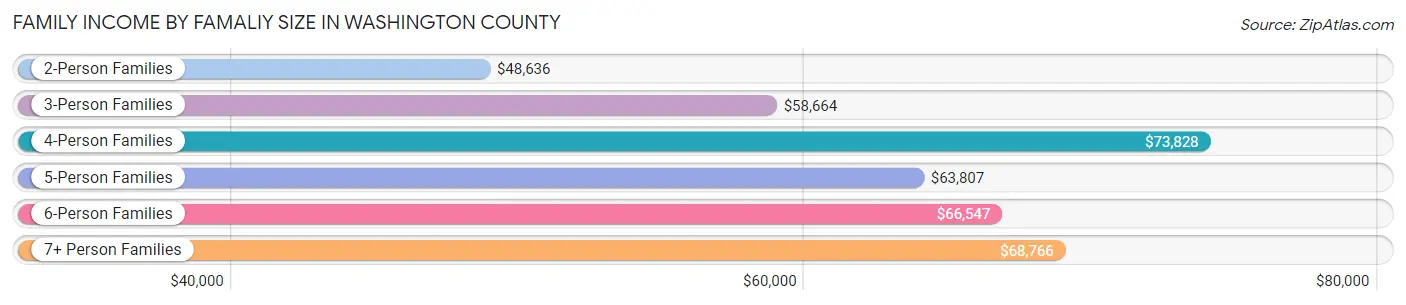
Family Income by Famaliy Size in Washington County
4-person families (209 | 7.4%) account for the highest median family income in Washington County with $73,828 per family, while 2-person families (1,600 | 56.8%) have the highest median income of $24,318 per family member.
| Income Bracket | # Families | Median Income |
| 2-Person Families | 1,600 (56.8%) | $48,636 |
| 3-Person Families | 524 (18.6%) | $58,664 |
| 4-Person Families | 209 (7.4%) | $73,828 |
| 5-Person Families | 202 (7.2%) | $63,807 |
| 6-Person Families | 149 (5.3%) | $66,547 |
| 7+ Person Families | 133 (4.7%) | $68,766 |
| Total | 2,817 (100.0%) | $58,577 |
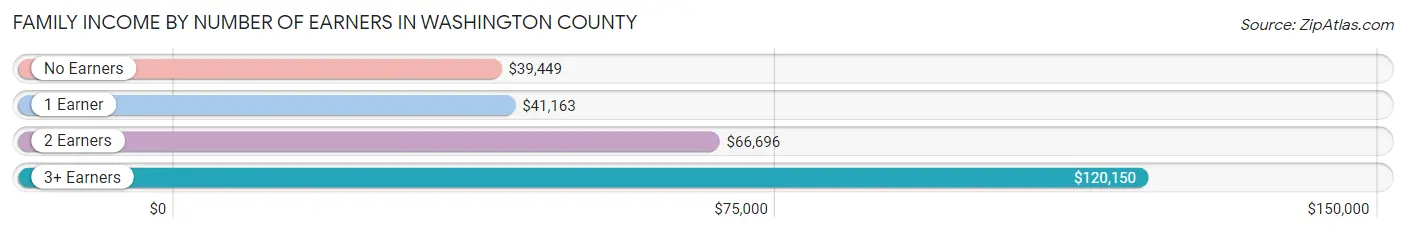
Family Income by Number of Earners in Washington County
The median family income in Washington County is $58,577, with families comprising 3+ earners (175) having the highest median family income of $120,150, while families with no earners (751) have the lowest median family income of $39,449, accounting for 6.2% and 26.7% of families, respectively.
| Number of Earners | # Families | Median Income |
| No Earners | 751 (26.7%) | $39,449 |
| 1 Earner | 1,034 (36.7%) | $41,163 |
| 2 Earners | 857 (30.4%) | $66,696 |
| 3+ Earners | 175 (6.2%) | $120,150 |
| Total | 2,817 (100.0%) | $58,577 |
Household Income in Washington County
Household Income Brackets in Washington County
With 994 households falling in the category, the $50,000 to $74,999 income range is the most frequent in Washington County, accounting for 24.0% of all households. In contrast, only 116 households (2.8%) fall into the $150,000 to $199,999 income bracket, making it the least populous group.
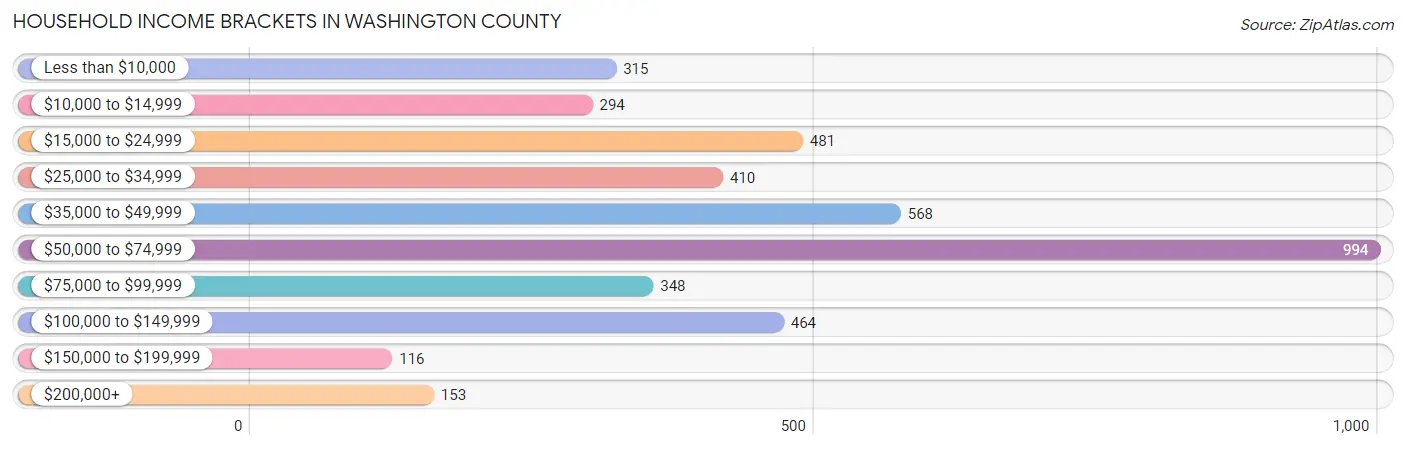
| Income Bracket | # Households | % Households |
| Less than $10,000 | 315 | 7.6% |
| $10,000 to $14,999 | 294 | 7.1% |
| $15,000 to $24,999 | 481 | 11.6% |
| $25,000 to $34,999 | 410 | 9.9% |
| $35,000 to $49,999 | 568 | 13.7% |
| $50,000 to $74,999 | 994 | 24.0% |
| $75,000 to $99,999 | 348 | 8.4% |
| $100,000 to $149,999 | 464 | 11.2% |
| $150,000 to $199,999 | 116 | 2.8% |
| $200,000+ | 153 | 3.7% |
Household Income by Householder Age in Washington County
The median household income in Washington County is $50,046, with the highest median household income of $64,514 found in the 45 to 64 years age bracket for the primary householder. A total of 1,299 households (31.4%) fall into this category. Meanwhile, the 65+ years age bracket for the primary householder has the lowest median household income of $39,808, with 1,728 households (41.7%) in this group.
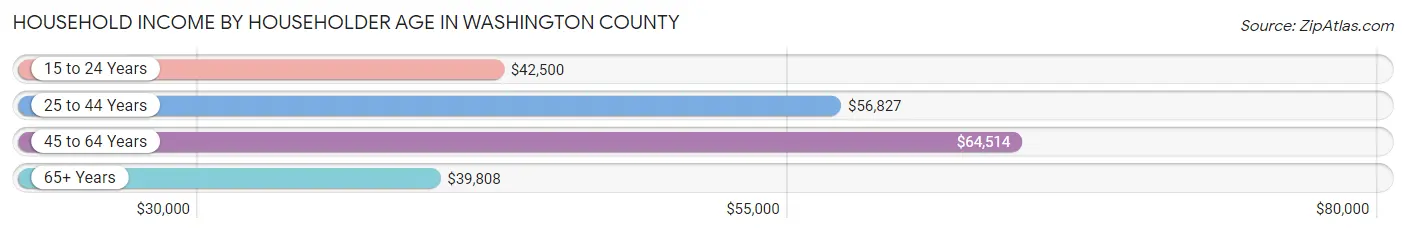
| Income Bracket | # Households | Median Income |
| 15 to 24 Years | 106 (2.6%) | $42,500 |
| 25 to 44 Years | 1,010 (24.4%) | $56,827 |
| 45 to 64 Years | 1,299 (31.4%) | $64,514 |
| 65+ Years | 1,728 (41.7%) | $39,808 |
| Total | 4,143 (100.0%) | $50,046 |
Poverty in Washington County
Income Below Poverty by Sex and Age in Washington County
With 14.4% poverty level for males and 21.8% for females among the residents of Washington County, 5 year old males and 5 year old females are the most vulnerable to poverty, with 19 males (44.2%) and 53 females (66.2%) in their respective age groups living below the poverty level.
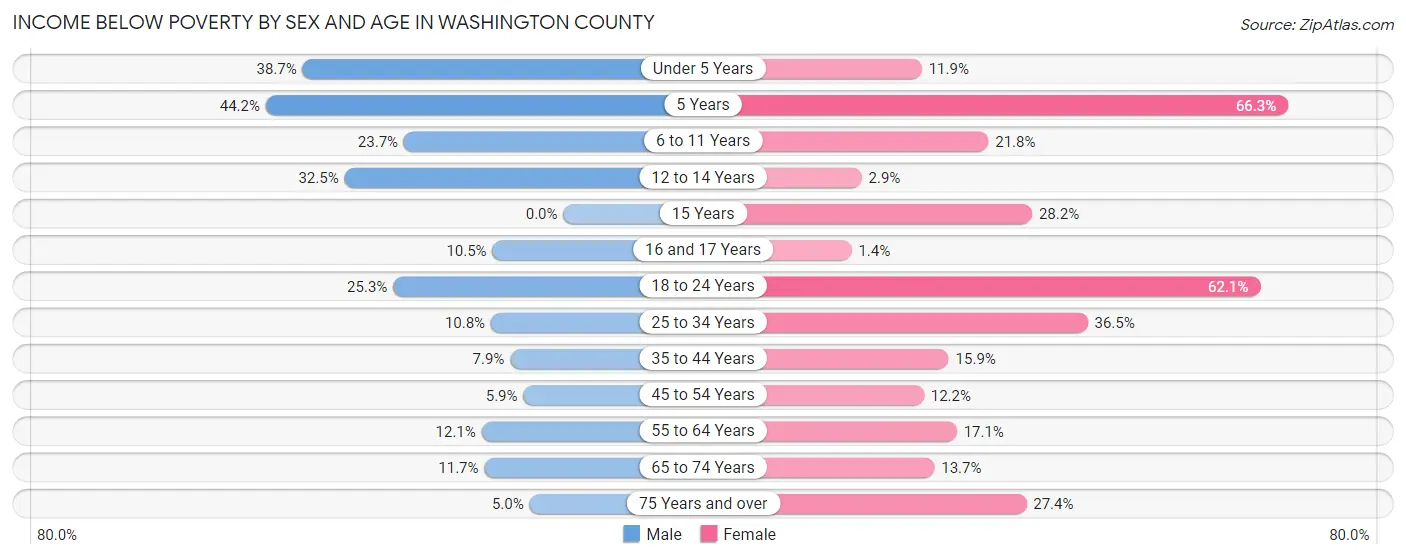
| Age Bracket | Male | Female |
| Under 5 Years | 110 (38.7%) | 33 (11.9%) |
| 5 Years | 19 (44.2%) | 53 (66.2%) |
| 6 to 11 Years | 117 (23.7%) | 89 (21.8%) |
| 12 to 14 Years | 52 (32.5%) | 7 (2.9%) |
| 15 Years | 0 (0.0%) | 24 (28.2%) |
| 16 and 17 Years | 14 (10.5%) | 2 (1.4%) |
| 18 to 24 Years | 93 (25.3%) | 236 (62.1%) |
| 25 to 34 Years | 56 (10.7%) | 177 (36.5%) |
| 35 to 44 Years | 50 (7.9%) | 80 (15.9%) |
| 45 to 54 Years | 28 (5.9%) | 77 (12.2%) |
| 55 to 64 Years | 81 (12.1%) | 123 (17.1%) |
| 65 to 74 Years | 99 (11.7%) | 111 (13.7%) |
| 75 Years and over | 26 (5.0%) | 137 (27.4%) |
| Total | 745 (14.4%) | 1,149 (21.8%) |
Income Above Poverty by Sex and Age in Washington County
According to the poverty statistics in Washington County, males aged 15 years and females aged 16 and 17 years are the age groups that are most secure financially, with 100.0% of males and 98.6% of females in these age groups living above the poverty line.
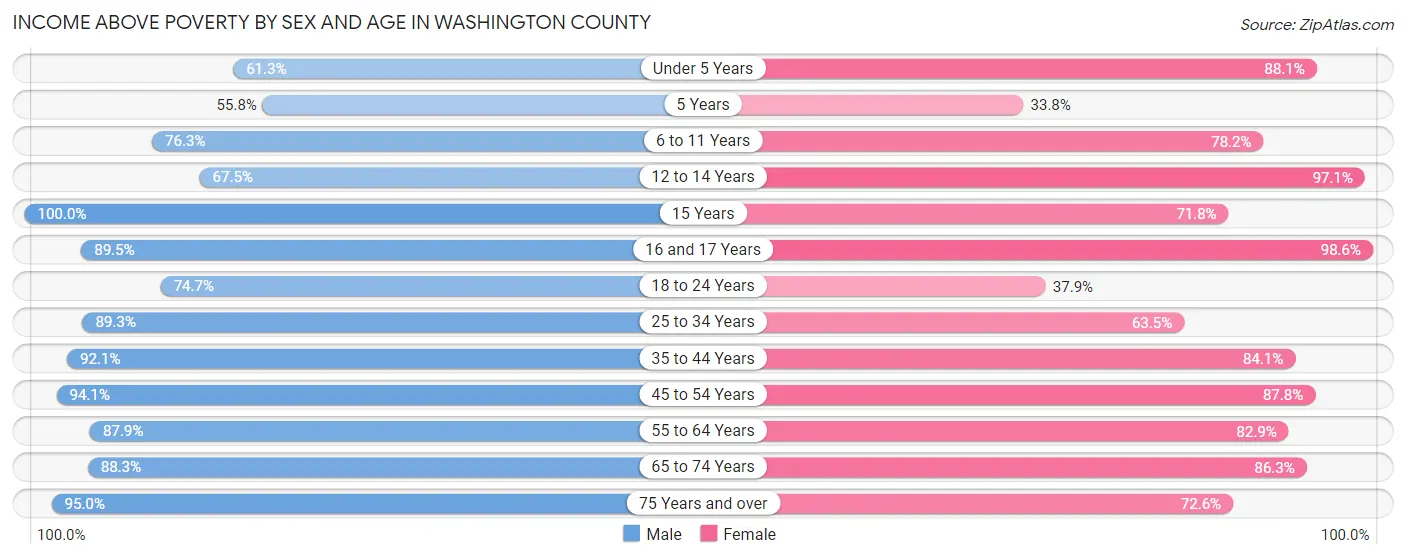
| Age Bracket | Male | Female |
| Under 5 Years | 174 (61.3%) | 245 (88.1%) |
| 5 Years | 24 (55.8%) | 27 (33.8%) |
| 6 to 11 Years | 377 (76.3%) | 320 (78.2%) |
| 12 to 14 Years | 108 (67.5%) | 231 (97.1%) |
| 15 Years | 52 (100.0%) | 61 (71.8%) |
| 16 and 17 Years | 119 (89.5%) | 137 (98.6%) |
| 18 to 24 Years | 275 (74.7%) | 144 (37.9%) |
| 25 to 34 Years | 465 (89.2%) | 308 (63.5%) |
| 35 to 44 Years | 584 (92.1%) | 424 (84.1%) |
| 45 to 54 Years | 443 (94.1%) | 555 (87.8%) |
| 55 to 64 Years | 586 (87.9%) | 598 (82.9%) |
| 65 to 74 Years | 745 (88.3%) | 697 (86.3%) |
| 75 Years and over | 492 (95.0%) | 363 (72.6%) |
| Total | 4,444 (85.6%) | 4,110 (78.1%) |
Income Below Poverty Among Married-Couple Families in Washington County
The poverty statistics for married-couple families in Washington County show that 3.9% or 80 of the total 2,031 families live below the poverty line. Families with 3 or 4 children have the highest poverty rate of 8.5%, comprising of 21 families. On the other hand, families with no children have the lowest poverty rate of 2.6%, which includes 36 families.
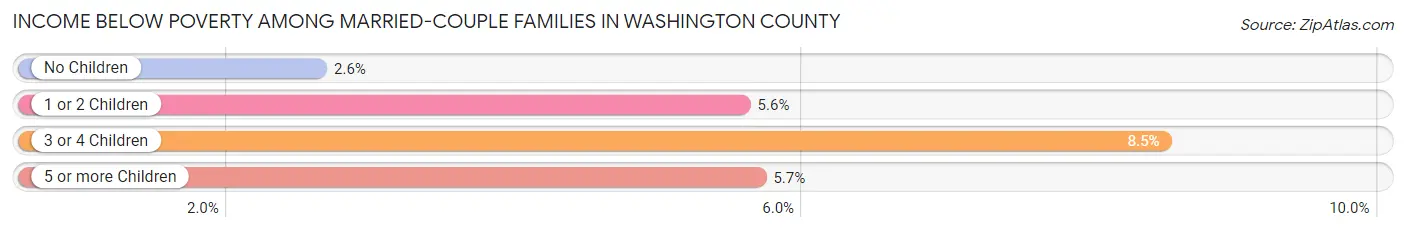
| Children | Above Poverty | Below Poverty |
| No Children | 1,337 (97.4%) | 36 (2.6%) |
| 1 or 2 Children | 305 (94.4%) | 18 (5.6%) |
| 3 or 4 Children | 226 (91.5%) | 21 (8.5%) |
| 5 or more Children | 83 (94.3%) | 5 (5.7%) |
| Total | 1,951 (96.1%) | 80 (3.9%) |
Income Below Poverty Among Single-Parent Households in Washington County
According to the poverty data in Washington County, 14.1% or 17 single-father households and 50.5% or 336 single-mother households are living below the poverty line. Among single-father households, those with 1 or 2 children have the highest poverty rate, with 17 households (23.9%) experiencing poverty. Likewise, among single-mother households, those with 5 or more children have the highest poverty rate, with 2 households (100.0%) falling below the poverty line.
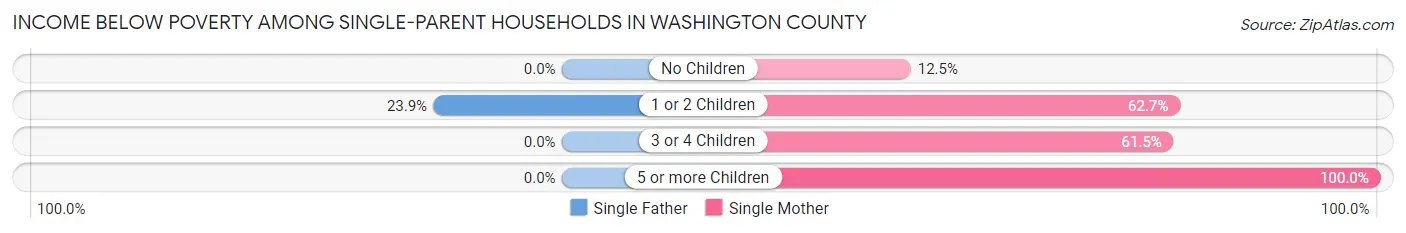
| Children | Single Father | Single Mother |
| No Children | 0 (0.0%) | 20 (12.5%) |
| 1 or 2 Children | 17 (23.9%) | 255 (62.6%) |
| 3 or 4 Children | 0 (0.0%) | 59 (61.5%) |
| 5 or more Children | 0 (0.0%) | 2 (100.0%) |
| Total | 17 (14.1%) | 336 (50.5%) |
Income Below Poverty Among Married-Couple vs Single-Parent Households in Washington County
The poverty data for Washington County shows that 80 of the married-couple family households (3.9%) and 353 of the single-parent households (44.9%) are living below the poverty level. Within the married-couple family households, those with 3 or 4 children have the highest poverty rate, with 21 households (8.5%) falling below the poverty line. Among the single-parent households, those with 5 or more children have the highest poverty rate, with 2 household (100.0%) living below poverty.
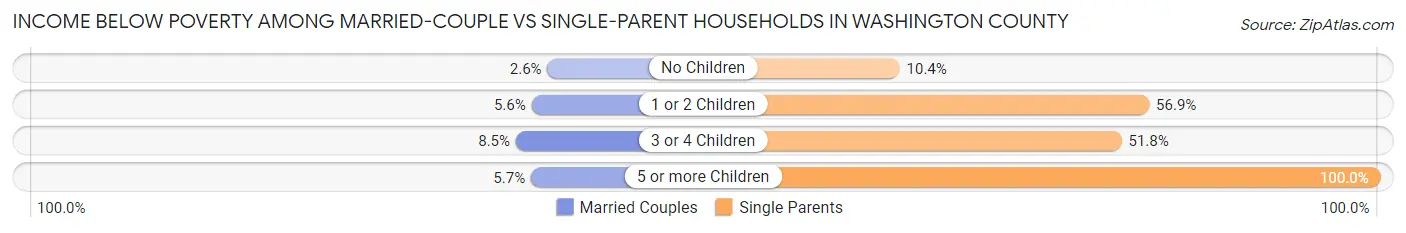
| Children | Married-Couple Families | Single-Parent Households |
| No Children | 36 (2.6%) | 20 (10.4%) |
| 1 or 2 Children | 18 (5.6%) | 272 (56.9%) |
| 3 or 4 Children | 21 (8.5%) | 59 (51.7%) |
| 5 or more Children | 5 (5.7%) | 2 (100.0%) |
| Total | 80 (3.9%) | 353 (44.9%) |
Employment Characteristics in Washington County
Employment by Class of Employer in Washington County
Among the 3,897 employed individuals in Washington County, private company employees (2,134 | 54.8%), local government employees (608 | 15.6%), and self-employed (not incorporated) (460 | 11.8%) make up the most common classes of employment.
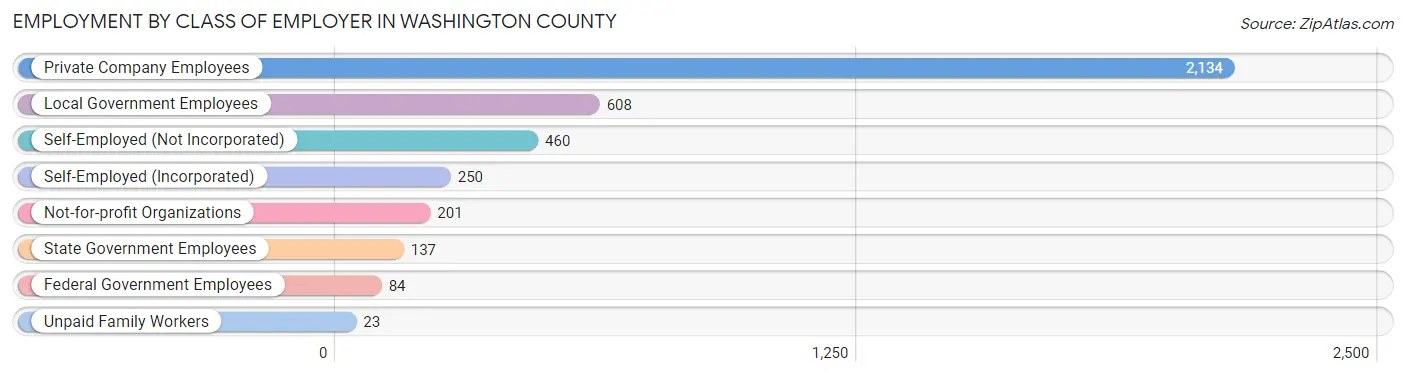
| Employer Class | # Employees | % Employees |
| Private Company Employees | 2,134 | 54.8% |
| Self-Employed (Incorporated) | 250 | 6.4% |
| Self-Employed (Not Incorporated) | 460 | 11.8% |
| Not-for-profit Organizations | 201 | 5.2% |
| Local Government Employees | 608 | 15.6% |
| State Government Employees | 137 | 3.5% |
| Federal Government Employees | 84 | 2.2% |
| Unpaid Family Workers | 23 | 0.6% |
| Total | 3,897 | 100.0% |
Employment Status by Age in Washington County
According to the labor force statistics for Washington County, out of the total population over 16 years of age (8,489), 49.4% or 4,194 individuals are in the labor force, with 4.5% or 189 of them unemployed. The age group with the highest labor force participation rate is 30 to 34 years, with 84.1% or 470 individuals in the labor force. Within the labor force, the 20 to 24 years age range has the highest percentage of unemployed individuals, with 33.9% or 119 of them being unemployed.
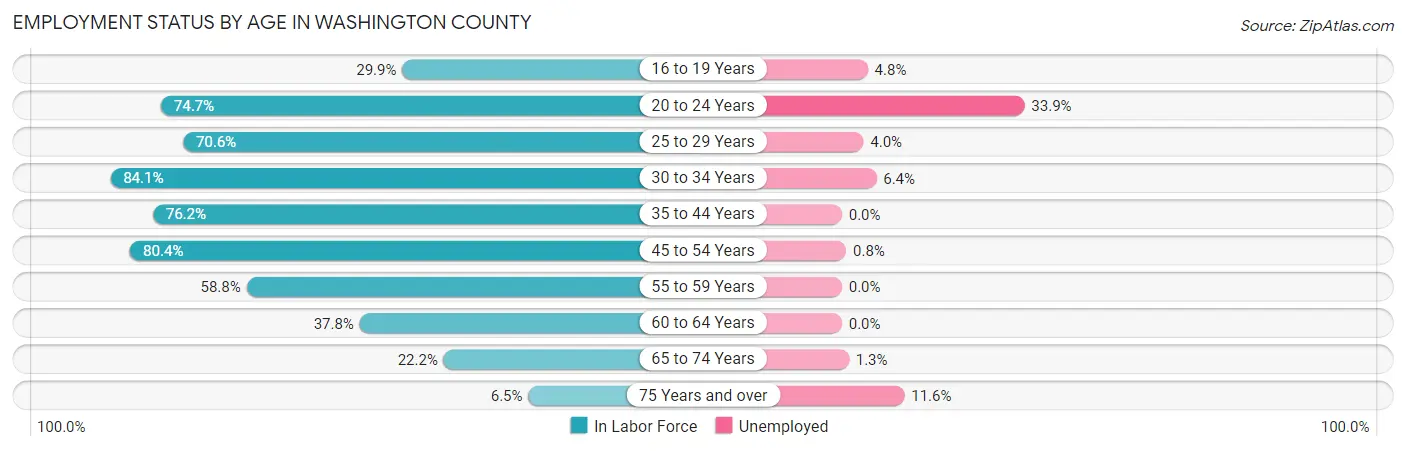
| Age Bracket | In Labor Force | Unemployed |
| 16 to 19 Years | 167 (29.9%) | 8 (4.8%) |
| 20 to 24 Years | 352 (74.7%) | 119 (33.9%) |
| 25 to 29 Years | 324 (70.6%) | 13 (4.0%) |
| 30 to 34 Years | 470 (84.1%) | 30 (6.4%) |
| 35 to 44 Years | 891 (76.2%) | 0 (0.0%) |
| 45 to 54 Years | 904 (80.4%) | 7 (0.8%) |
| 55 to 59 Years | 320 (58.8%) | 0 (0.0%) |
| 60 to 64 Years | 327 (37.8%) | 0 (0.0%) |
| 65 to 74 Years | 372 (22.2%) | 5 (1.3%) |
| 75 Years and over | 69 (6.5%) | 8 (11.6%) |
| Total | 4,194 (49.4%) | 189 (4.5%) |
Employment Status by Educational Attainment in Washington County
According to labor force statistics for Washington County, 68.6% of individuals (3,239) out of the total population between 25 and 64 years of age (4,721) are in the labor force, with 1.5% or 49 of them being unemployed. The group with the highest labor force participation rate are those with the educational attainment of college / associate degree, with 71.8% or 1,503 individuals in the labor force. Within the labor force, individuals with less than high school education have the highest percentage of unemployment, with 9.9% or 21 of them being unemployed.
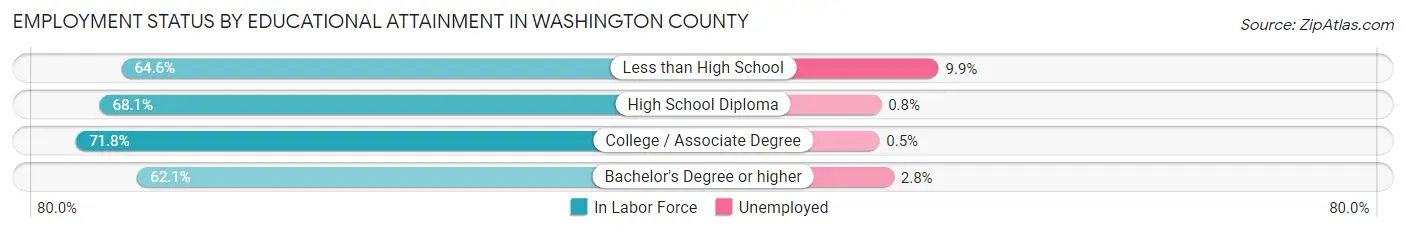
| Educational Attainment | In Labor Force | Unemployed |
| Less than High School | 212 (64.6%) | 32 (9.9%) |
| High School Diploma | 1,064 (68.1%) | 13 (0.8%) |
| College / Associate Degree | 1,503 (71.8%) | 10 (0.5%) |
| Bachelor's Degree or higher | 458 (62.1%) | 21 (2.8%) |
| Total | 3,239 (68.6%) | 71 (1.5%) |
Employment Occupations by Sex in Washington County
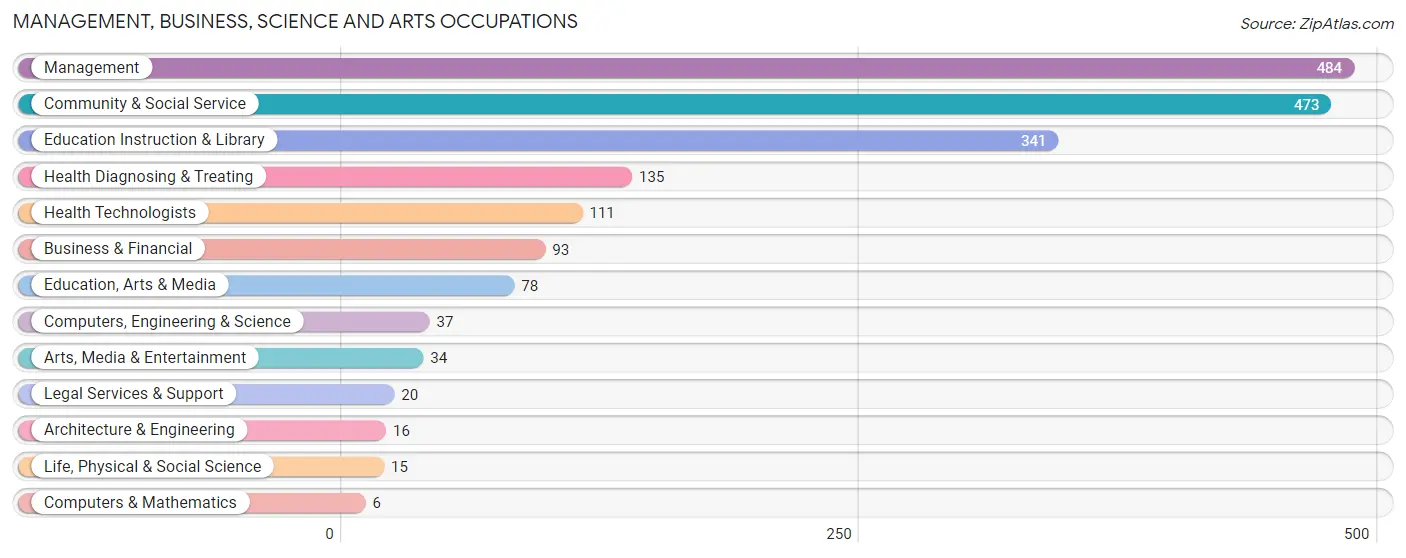
Management, Business, Science and Arts Occupations
The most common Management, Business, Science and Arts occupations in Washington County are Management (484 | 12.1%), Community & Social Service (473 | 11.8%), Education Instruction & Library (341 | 8.5%), Health Diagnosing & Treating (135 | 3.4%), and Health Technologists (111 | 2.8%).
Management, Business, Science and Arts Occupations by Sex
Within the Management, Business, Science and Arts occupations in Washington County, the most male-oriented occupations are Computers, Engineering & Science (100.0%), Computers & Mathematics (100.0%), and Architecture & Engineering (100.0%), while the most female-oriented occupations are Education Instruction & Library (59.8%), Health Diagnosing & Treating (57.8%), and Community & Social Service (50.9%).
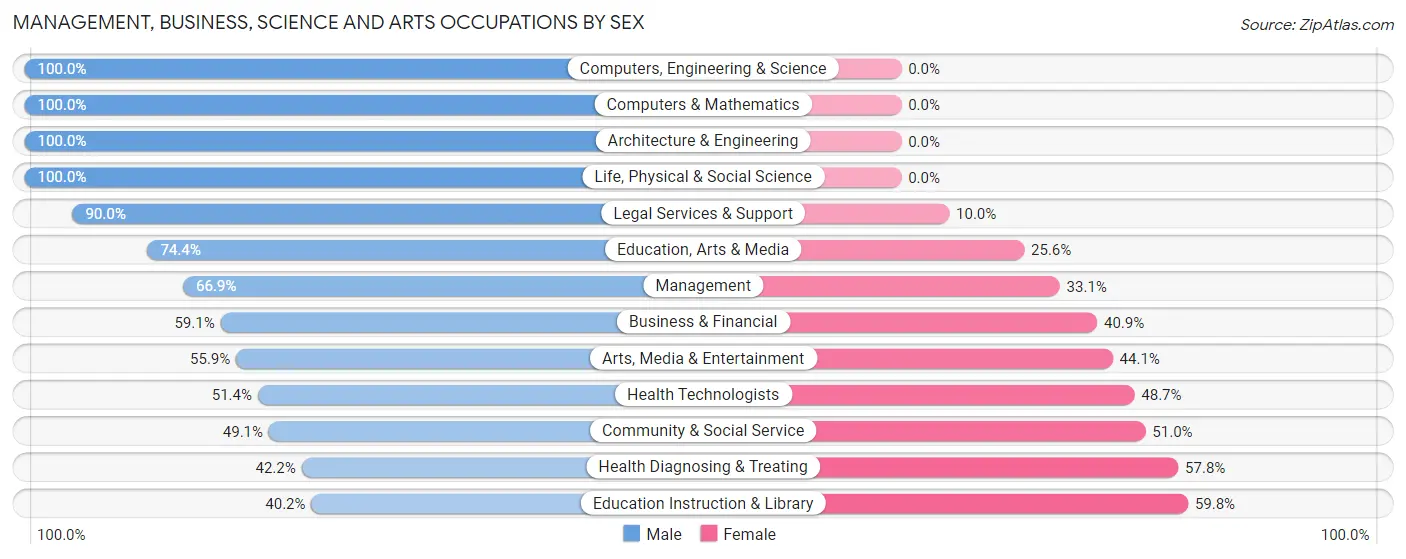
| Occupation | Male | Female |
| Management | 324 (66.9%) | 160 (33.1%) |
| Business & Financial | 55 (59.1%) | 38 (40.9%) |
| Computers, Engineering & Science | 37 (100.0%) | 0 (0.0%) |
| Computers & Mathematics | 6 (100.0%) | 0 (0.0%) |
| Architecture & Engineering | 16 (100.0%) | 0 (0.0%) |
| Life, Physical & Social Science | 15 (100.0%) | 0 (0.0%) |
| Community & Social Service | 232 (49.0%) | 241 (50.9%) |
| Education, Arts & Media | 58 (74.4%) | 20 (25.6%) |
| Legal Services & Support | 18 (90.0%) | 2 (10.0%) |
| Education Instruction & Library | 137 (40.2%) | 204 (59.8%) |
| Arts, Media & Entertainment | 19 (55.9%) | 15 (44.1%) |
| Health Diagnosing & Treating | 57 (42.2%) | 78 (57.8%) |
| Health Technologists | 57 (51.3%) | 54 (48.6%) |
| Total (Category) | 705 (57.7%) | 517 (42.3%) |
| Total (Overall) | 2,306 (57.7%) | 1,692 (42.3%) |
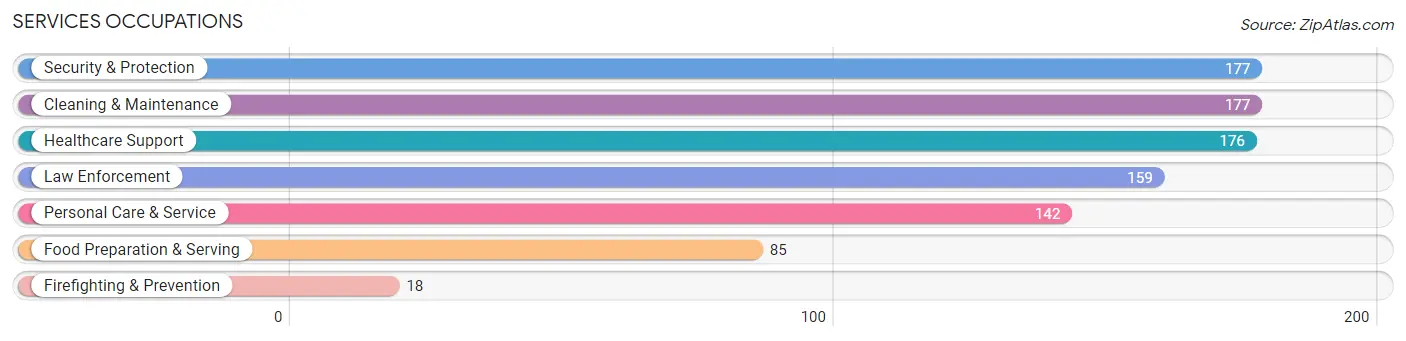
Services Occupations
The most common Services occupations in Washington County are Security & Protection (177 | 4.4%), Cleaning & Maintenance (177 | 4.4%), Healthcare Support (176 | 4.4%), Law Enforcement (159 | 4.0%), and Personal Care & Service (142 | 3.5%).
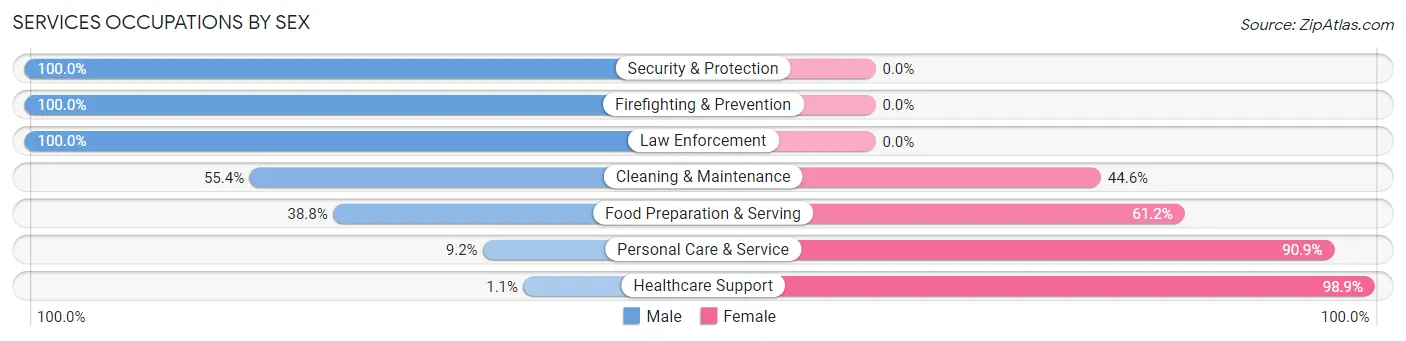
Services Occupations by Sex
Within the Services occupations in Washington County, the most male-oriented occupations are Security & Protection (100.0%), Firefighting & Prevention (100.0%), and Law Enforcement (100.0%), while the most female-oriented occupations are Healthcare Support (98.9%), Personal Care & Service (90.8%), and Food Preparation & Serving (61.2%).
| Occupation | Male | Female |
| Healthcare Support | 2 (1.1%) | 174 (98.9%) |
| Security & Protection | 177 (100.0%) | 0 (0.0%) |
| Firefighting & Prevention | 18 (100.0%) | 0 (0.0%) |
| Law Enforcement | 159 (100.0%) | 0 (0.0%) |
| Food Preparation & Serving | 33 (38.8%) | 52 (61.2%) |
| Cleaning & Maintenance | 98 (55.4%) | 79 (44.6%) |
| Personal Care & Service | 13 (9.1%) | 129 (90.8%) |
| Total (Category) | 323 (42.7%) | 434 (57.3%) |
| Total (Overall) | 2,306 (57.7%) | 1,692 (42.3%) |
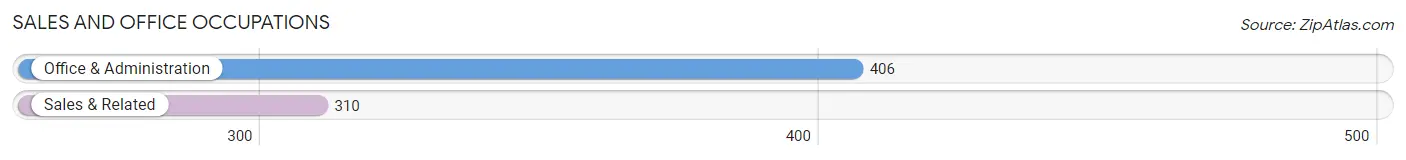
Sales and Office Occupations
The most common Sales and Office occupations in Washington County are Office & Administration (406 | 10.2%), and Sales & Related (310 | 7.7%).
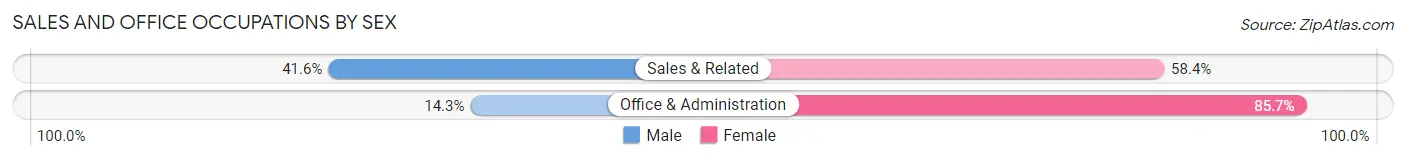
Sales and Office Occupations by Sex
| Occupation | Male | Female |
| Sales & Related | 129 (41.6%) | 181 (58.4%) |
| Office & Administration | 58 (14.3%) | 348 (85.7%) |
| Total (Category) | 187 (26.1%) | 529 (73.9%) |
| Total (Overall) | 2,306 (57.7%) | 1,692 (42.3%) |
Natural Resources, Construction and Maintenance Occupations
The most common Natural Resources, Construction and Maintenance occupations in Washington County are Construction & Extraction (269 | 6.7%), Installation, Maintenance & Repair (164 | 4.1%), and Farming, Fishing & Forestry (84 | 2.1%).
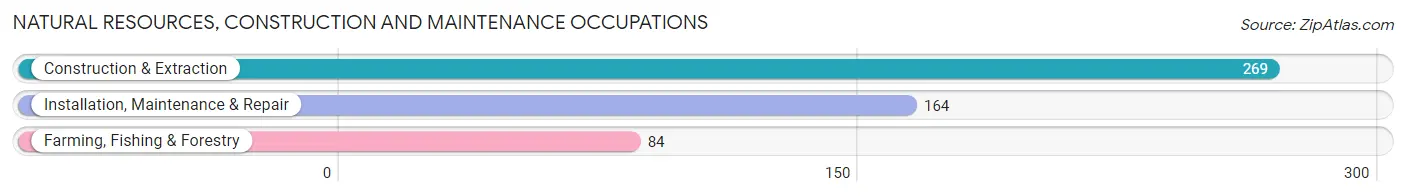
Natural Resources, Construction and Maintenance Occupations by Sex
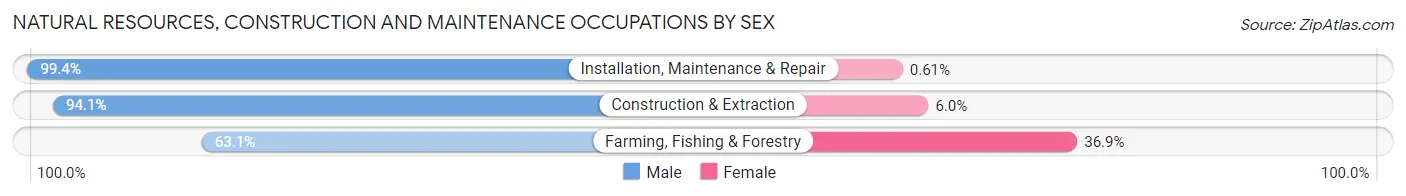
| Occupation | Male | Female |
| Farming, Fishing & Forestry | 53 (63.1%) | 31 (36.9%) |
| Construction & Extraction | 253 (94.1%) | 16 (5.9%) |
| Installation, Maintenance & Repair | 163 (99.4%) | 1 (0.6%) |
| Total (Category) | 469 (90.7%) | 48 (9.3%) |
| Total (Overall) | 2,306 (57.7%) | 1,692 (42.3%) |
Production, Transportation and Moving Occupations
The most common Production, Transportation and Moving occupations in Washington County are Production (436 | 10.9%), Material Moving (183 | 4.6%), and Transportation (167 | 4.2%).
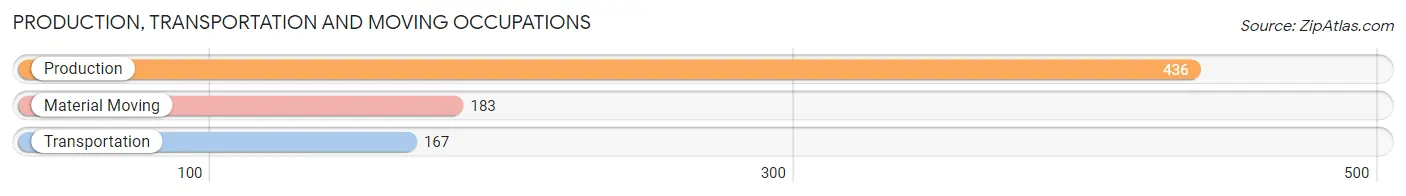
Production, Transportation and Moving Occupations by Sex
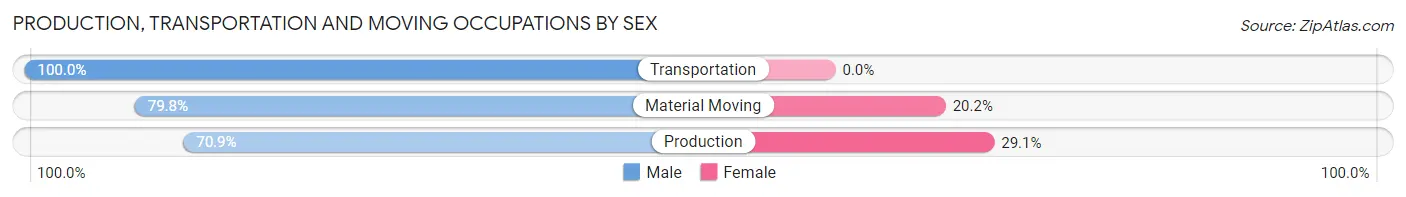
| Occupation | Male | Female |
| Production | 309 (70.9%) | 127 (29.1%) |
| Transportation | 167 (100.0%) | 0 (0.0%) |
| Material Moving | 146 (79.8%) | 37 (20.2%) |
| Total (Category) | 622 (79.1%) | 164 (20.9%) |
| Total (Overall) | 2,306 (57.7%) | 1,692 (42.3%) |
Employment Industries by Sex in Washington County
Employment Industries in Washington County
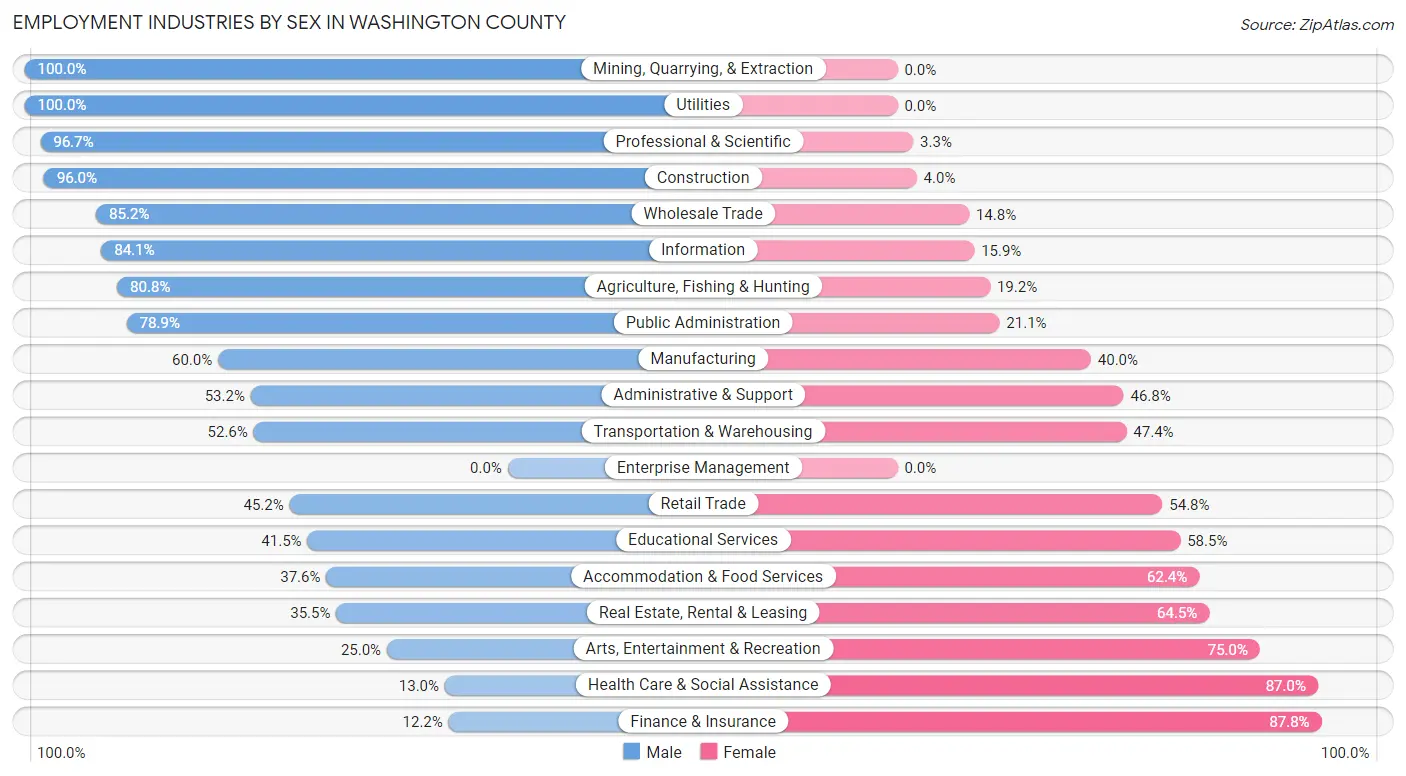
The major employment industries in Washington County include Manufacturing (567 | 14.2%), Health Care & Social Assistance (469 | 11.7%), Educational Services (439 | 11.0%), Agriculture, Fishing & Hunting (428 | 10.7%), and Public Administration (360 | 9.0%).

Employment Industries by Sex in Washington County
The Washington County industries that see more men than women are Mining, Quarrying, & Extraction (100.0%), Utilities (100.0%), and Professional & Scientific (96.7%), whereas the industries that tend to have a higher number of women are Finance & Insurance (87.8%), Health Care & Social Assistance (87.0%), and Arts, Entertainment & Recreation (75.0%).
| Industry | Male | Female |
| Agriculture, Fishing & Hunting | 346 (80.8%) | 82 (19.2%) |
| Mining, Quarrying, & Extraction | 17 (100.0%) | 0 (0.0%) |
| Construction | 241 (96.0%) | 10 (4.0%) |
| Manufacturing | 340 (60.0%) | 227 (40.0%) |
| Wholesale Trade | 92 (85.2%) | 16 (14.8%) |
| Retail Trade | 140 (45.2%) | 170 (54.8%) |
| Transportation & Warehousing | 101 (52.6%) | 91 (47.4%) |
| Utilities | 51 (100.0%) | 0 (0.0%) |
| Information | 90 (84.1%) | 17 (15.9%) |
| Finance & Insurance | 6 (12.2%) | 43 (87.8%) |
| Real Estate, Rental & Leasing | 11 (35.5%) | 20 (64.5%) |
| Professional & Scientific | 89 (96.7%) | 3 (3.3%) |
| Enterprise Management | 0 (0.0%) | 0 (0.0%) |
| Administrative & Support | 50 (53.2%) | 44 (46.8%) |
| Educational Services | 182 (41.5%) | 257 (58.5%) |
| Health Care & Social Assistance | 61 (13.0%) | 408 (87.0%) |
| Arts, Entertainment & Recreation | 14 (25.0%) | 42 (75.0%) |
| Accommodation & Food Services | 74 (37.6%) | 123 (62.4%) |
| Public Administration | 284 (78.9%) | 76 (21.1%) |
| Total | 2,306 (57.7%) | 1,692 (42.3%) |
Education in Washington County
School Enrollment in Washington County
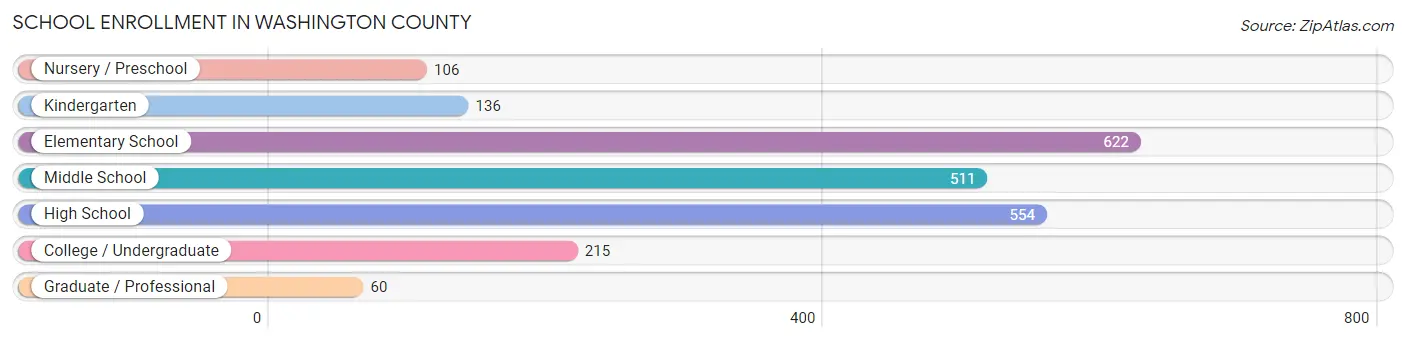
The most common levels of schooling among the 2,204 students in Washington County are elementary school (622 | 28.2%), high school (554 | 25.1%), and middle school (511 | 23.2%).
| School Level | # Students | % Students |
| Nursery / Preschool | 106 | 4.8% |
| Kindergarten | 136 | 6.2% |
| Elementary School | 622 | 28.2% |
| Middle School | 511 | 23.2% |
| High School | 554 | 25.1% |
| College / Undergraduate | 215 | 9.8% |
| Graduate / Professional | 60 | 2.7% |
| Total | 2,204 | 100.0% |
School Enrollment by Age by Funding Source in Washington County
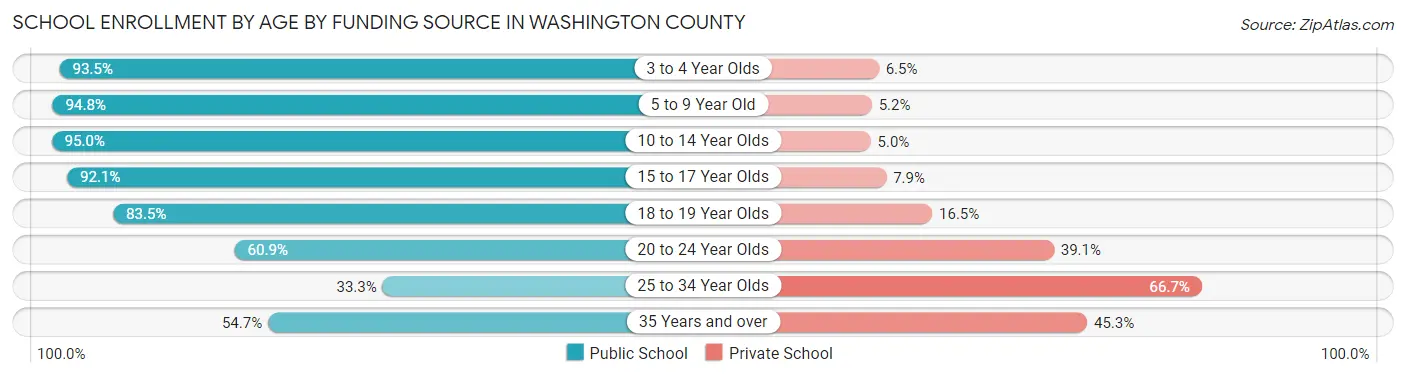
Out of a total of 2,204 students who are enrolled in schools in Washington County, 220 (10.0%) attend a private institution, while the remaining 1,984 (90.0%) are enrolled in public schools. The age group of 25 to 34 year olds has the highest likelihood of being enrolled in private schools, with 8 (66.7% in the age bracket) enrolled. Conversely, the age group of 10 to 14 year olds has the lowest likelihood of being enrolled in a private school, with 625 (95.0% in the age bracket) attending a public institution.
| Age Bracket | Public School | Private School |
| 3 to 4 Year Olds | 86 (93.5%) | 6 (6.5%) |
| 5 to 9 Year Old | 671 (94.8%) | 37 (5.2%) |
| 10 to 14 Year Olds | 625 (95.0%) | 33 (5.0%) |
| 15 to 17 Year Olds | 360 (92.1%) | 31 (7.9%) |
| 18 to 19 Year Olds | 142 (83.5%) | 28 (16.5%) |
| 20 to 24 Year Olds | 14 (60.9%) | 9 (39.1%) |
| 25 to 34 Year Olds | 4 (33.3%) | 8 (66.7%) |
| 35 Years and over | 82 (54.7%) | 68 (45.3%) |
| Total | 1,984 (90.0%) | 220 (10.0%) |
Educational Attainment by Field of Study in Washington County
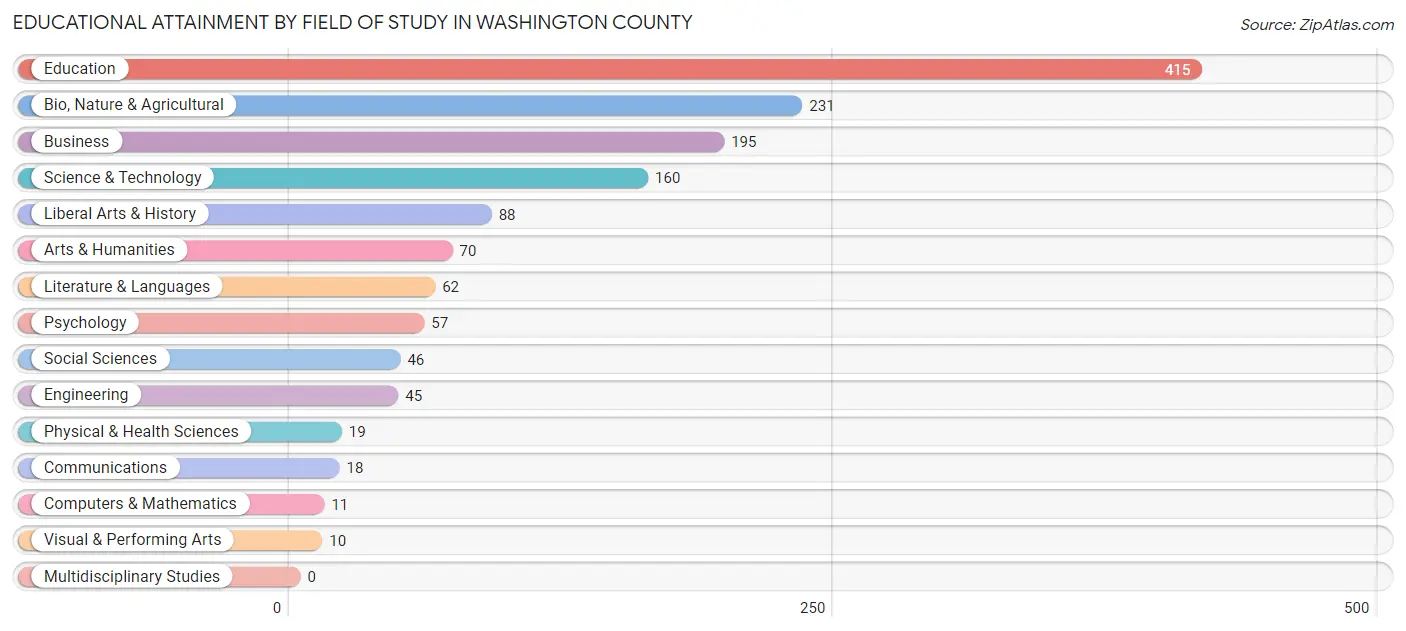
Education (415 | 29.1%), bio, nature & agricultural (231 | 16.2%), business (195 | 13.7%), science & technology (160 | 11.2%), and liberal arts & history (88 | 6.2%) are the most common fields of study among 1,427 individuals in Washington County who have obtained a bachelor's degree or higher.
| Field of Study | # Graduates | % Graduates |
| Computers & Mathematics | 11 | 0.8% |
| Bio, Nature & Agricultural | 231 | 16.2% |
| Physical & Health Sciences | 19 | 1.3% |
| Psychology | 57 | 4.0% |
| Social Sciences | 46 | 3.2% |
| Engineering | 45 | 3.2% |
| Multidisciplinary Studies | 0 | 0.0% |
| Science & Technology | 160 | 11.2% |
| Business | 195 | 13.7% |
| Education | 415 | 29.1% |
| Literature & Languages | 62 | 4.3% |
| Liberal Arts & History | 88 | 6.2% |
| Visual & Performing Arts | 10 | 0.7% |
| Communications | 18 | 1.3% |
| Arts & Humanities | 70 | 4.9% |
| Total | 1,427 | 100.0% |
Transportation & Commute in Washington County
Vehicle Availability by Sex in Washington County
The most prevalent vehicle ownership categories in Washington County are males with 2 vehicles (812, accounting for 36.1%) and females with 2 vehicles (379, making up 49.6%).
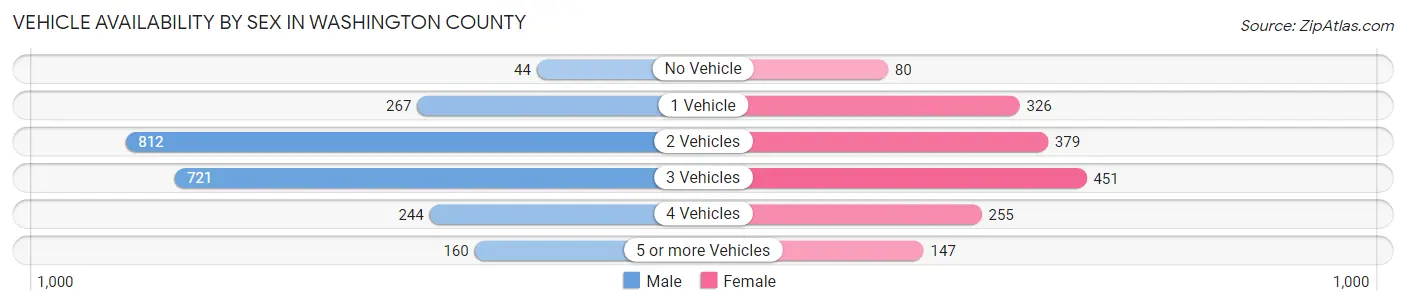
| Vehicles Available | Male | Female |
| No Vehicle | 44 (2.0%) | 80 (4.9%) |
| 1 Vehicle | 267 (11.9%) | 326 (19.9%) |
| 2 Vehicles | 812 (36.1%) | 379 (23.1%) |
| 3 Vehicles | 721 (32.1%) | 451 (27.5%) |
| 4 Vehicles | 244 (10.8%) | 255 (15.6%) |
| 5 or more Vehicles | 160 (7.1%) | 147 (9.0%) |
| Total | 2,248 (100.0%) | 1,638 (100.0%) |
Commute Time in Washington County
The most frequently occuring commute durations in Washington County are 5 to 9 minutes (874 commuters, 24.6%), 10 to 14 minutes (689 commuters, 19.4%), and less than 5 minutes (425 commuters, 12.0%).
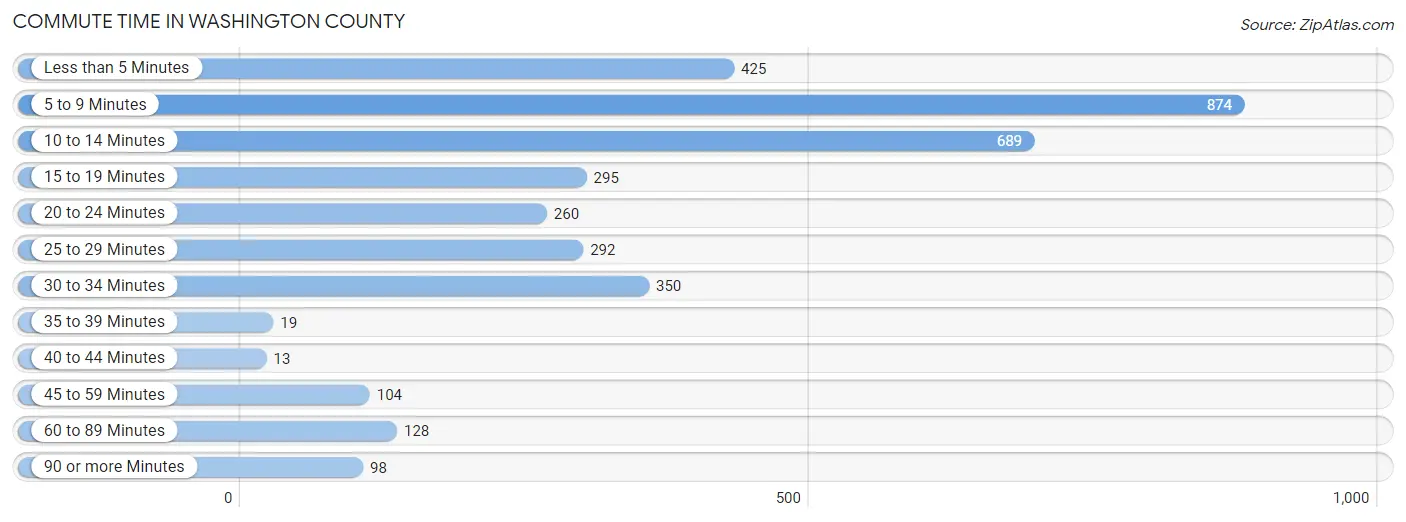
| Commute Time | # Commuters | % Commuters |
| Less than 5 Minutes | 425 | 12.0% |
| 5 to 9 Minutes | 874 | 24.6% |
| 10 to 14 Minutes | 689 | 19.4% |
| 15 to 19 Minutes | 295 | 8.3% |
| 20 to 24 Minutes | 260 | 7.3% |
| 25 to 29 Minutes | 292 | 8.2% |
| 30 to 34 Minutes | 350 | 9.9% |
| 35 to 39 Minutes | 19 | 0.5% |
| 40 to 44 Minutes | 13 | 0.4% |
| 45 to 59 Minutes | 104 | 2.9% |
| 60 to 89 Minutes | 128 | 3.6% |
| 90 or more Minutes | 98 | 2.8% |
Commute Time by Sex in Washington County
The most common commute times in Washington County are 5 to 9 minutes (512 commuters, 24.0%) for males and 5 to 9 minutes (362 commuters, 25.6%) for females.
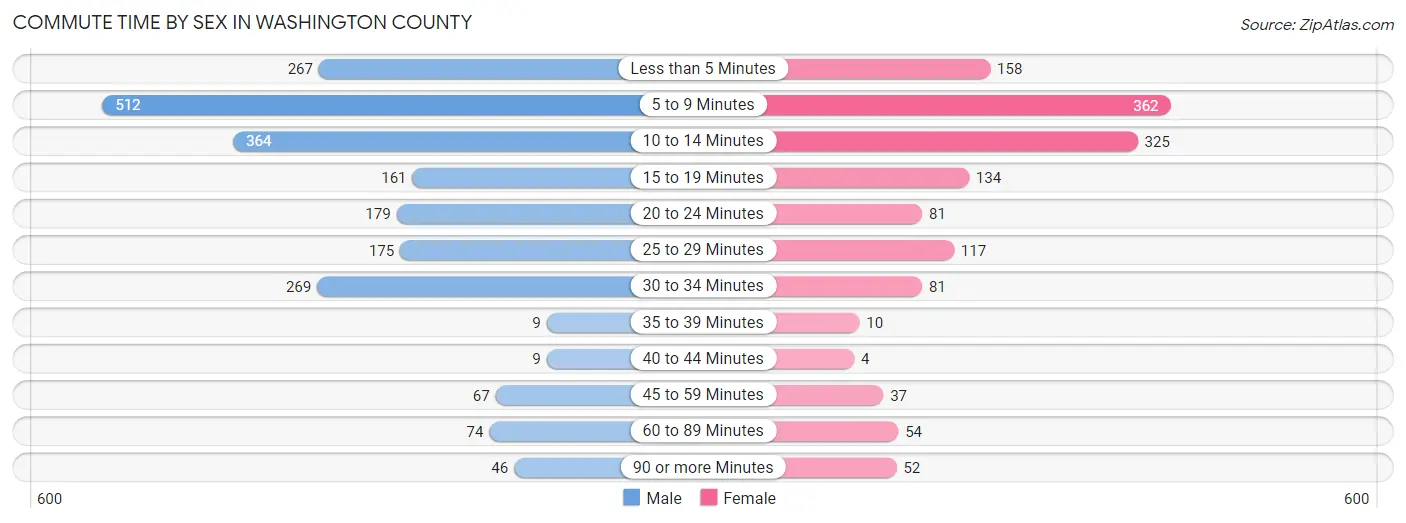
| Commute Time | Male | Female |
| Less than 5 Minutes | 267 (12.5%) | 158 (11.2%) |
| 5 to 9 Minutes | 512 (24.0%) | 362 (25.6%) |
| 10 to 14 Minutes | 364 (17.1%) | 325 (23.0%) |
| 15 to 19 Minutes | 161 (7.5%) | 134 (9.5%) |
| 20 to 24 Minutes | 179 (8.4%) | 81 (5.7%) |
| 25 to 29 Minutes | 175 (8.2%) | 117 (8.3%) |
| 30 to 34 Minutes | 269 (12.6%) | 81 (5.7%) |
| 35 to 39 Minutes | 9 (0.4%) | 10 (0.7%) |
| 40 to 44 Minutes | 9 (0.4%) | 4 (0.3%) |
| 45 to 59 Minutes | 67 (3.1%) | 37 (2.6%) |
| 60 to 89 Minutes | 74 (3.5%) | 54 (3.8%) |
| 90 or more Minutes | 46 (2.2%) | 52 (3.7%) |
Time of Departure to Work by Sex in Washington County
The most frequent times of departure to work in Washington County are 6:30 AM to 6:59 AM (336, 15.8%) for males and 7:30 AM to 7:59 AM (262, 18.5%) for females.
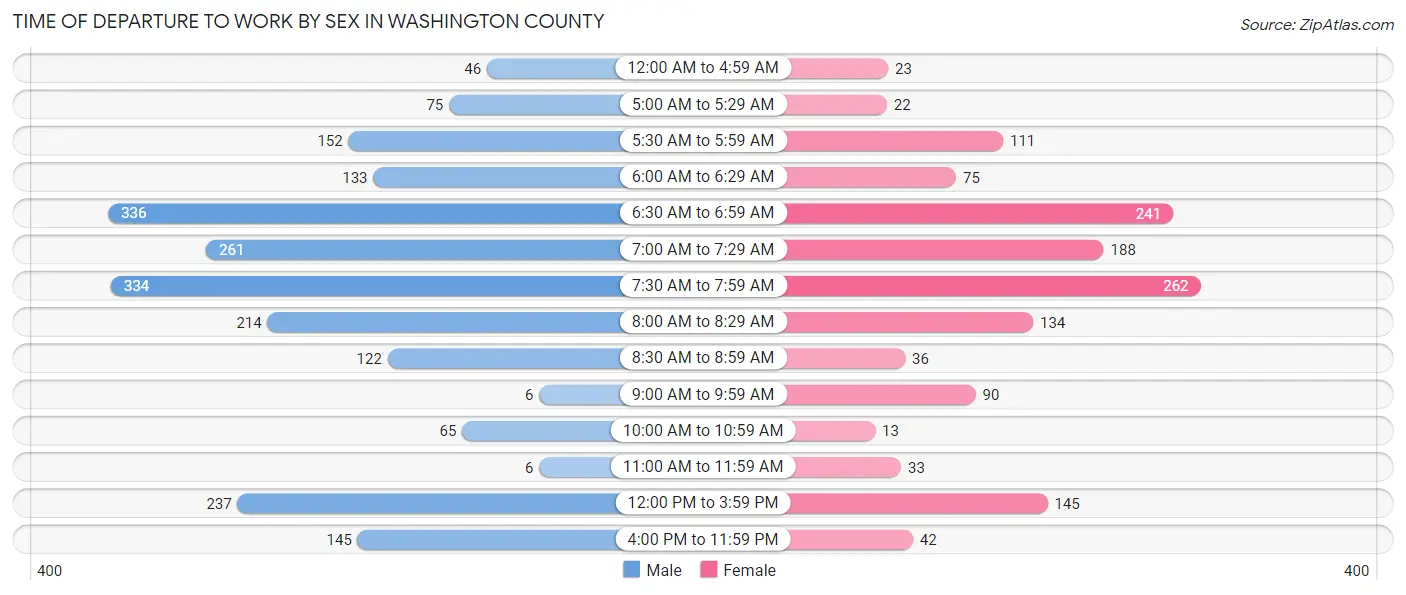
| Time of Departure | Male | Female |
| 12:00 AM to 4:59 AM | 46 (2.2%) | 23 (1.6%) |
| 5:00 AM to 5:29 AM | 75 (3.5%) | 22 (1.5%) |
| 5:30 AM to 5:59 AM | 152 (7.1%) | 111 (7.8%) |
| 6:00 AM to 6:29 AM | 133 (6.2%) | 75 (5.3%) |
| 6:30 AM to 6:59 AM | 336 (15.8%) | 241 (17.0%) |
| 7:00 AM to 7:29 AM | 261 (12.2%) | 188 (13.3%) |
| 7:30 AM to 7:59 AM | 334 (15.7%) | 262 (18.5%) |
| 8:00 AM to 8:29 AM | 214 (10.0%) | 134 (9.5%) |
| 8:30 AM to 8:59 AM | 122 (5.7%) | 36 (2.5%) |
| 9:00 AM to 9:59 AM | 6 (0.3%) | 90 (6.4%) |
| 10:00 AM to 10:59 AM | 65 (3.0%) | 13 (0.9%) |
| 11:00 AM to 11:59 AM | 6 (0.3%) | 33 (2.3%) |
| 12:00 PM to 3:59 PM | 237 (11.1%) | 145 (10.2%) |
| 4:00 PM to 11:59 PM | 145 (6.8%) | 42 (3.0%) |
| Total | 2,132 (100.0%) | 1,415 (100.0%) |
Housing Occupancy in Washington County
Occupancy by Ownership in Washington County
Of the total 4,143 dwellings in Washington County, owner-occupied units account for 2,973 (71.8%), while renter-occupied units make up 1,170 (28.2%).
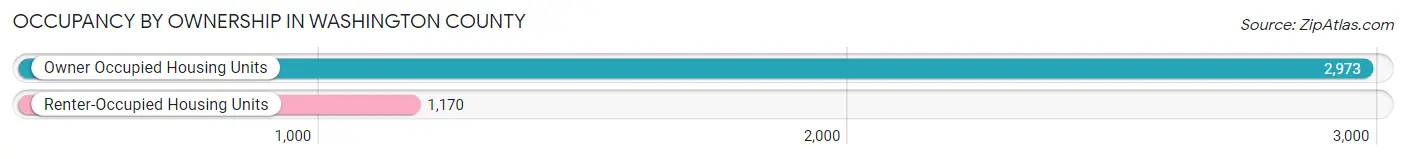
| Occupancy | # Housing Units | % Housing Units |
| Owner Occupied Housing Units | 2,973 | 71.8% |
| Renter-Occupied Housing Units | 1,170 | 28.2% |
| Total Occupied Housing Units | 4,143 | 100.0% |
Occupancy by Household Size in Washington County
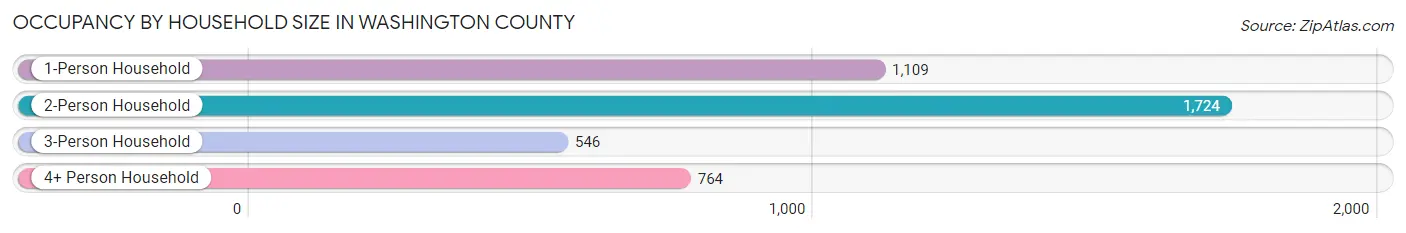
| Household Size | # Housing Units | % Housing Units |
| 1-Person Household | 1,109 | 26.8% |
| 2-Person Household | 1,724 | 41.6% |
| 3-Person Household | 546 | 13.2% |
| 4+ Person Household | 764 | 18.4% |
| Total Housing Units | 4,143 | 100.0% |
Occupancy by Ownership by Household Size in Washington County
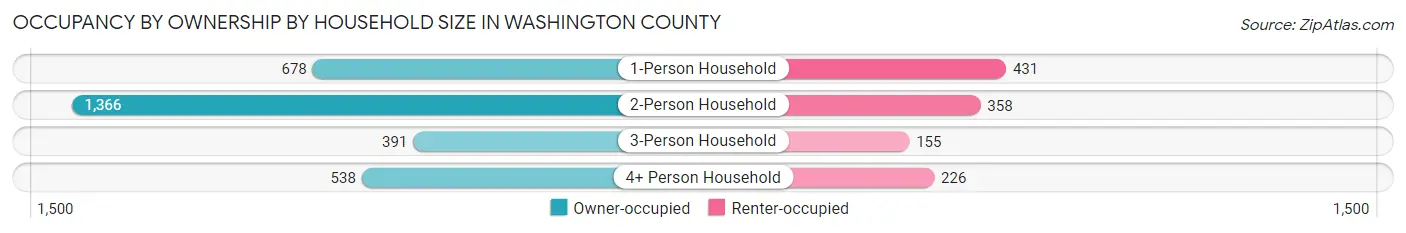
| Household Size | Owner-occupied | Renter-occupied |
| 1-Person Household | 678 (61.1%) | 431 (38.9%) |
| 2-Person Household | 1,366 (79.2%) | 358 (20.8%) |
| 3-Person Household | 391 (71.6%) | 155 (28.4%) |
| 4+ Person Household | 538 (70.4%) | 226 (29.6%) |
| Total Housing Units | 2,973 (71.8%) | 1,170 (28.2%) |
Occupancy by Educational Attainment in Washington County
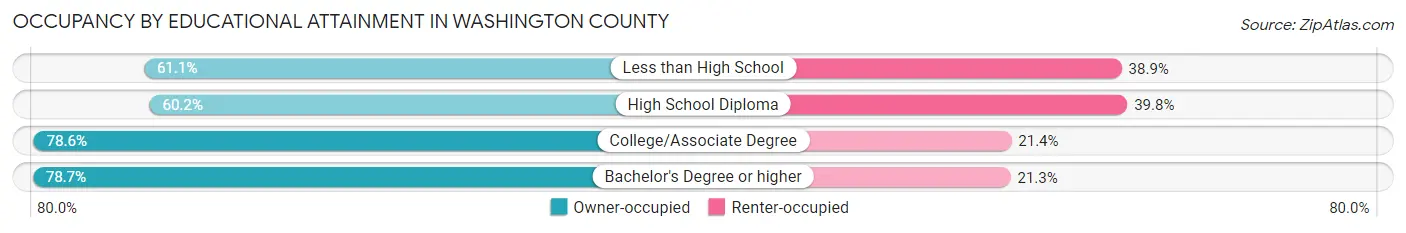
| Household Size | Owner-occupied | Renter-occupied |
| Less than High School | 265 (61.1%) | 169 (38.9%) |
| High School Diploma | 677 (60.2%) | 448 (39.8%) |
| College/Associate Degree | 1,407 (78.6%) | 384 (21.4%) |
| Bachelor's Degree or higher | 624 (78.7%) | 169 (21.3%) |
Occupancy by Age of Householder in Washington County
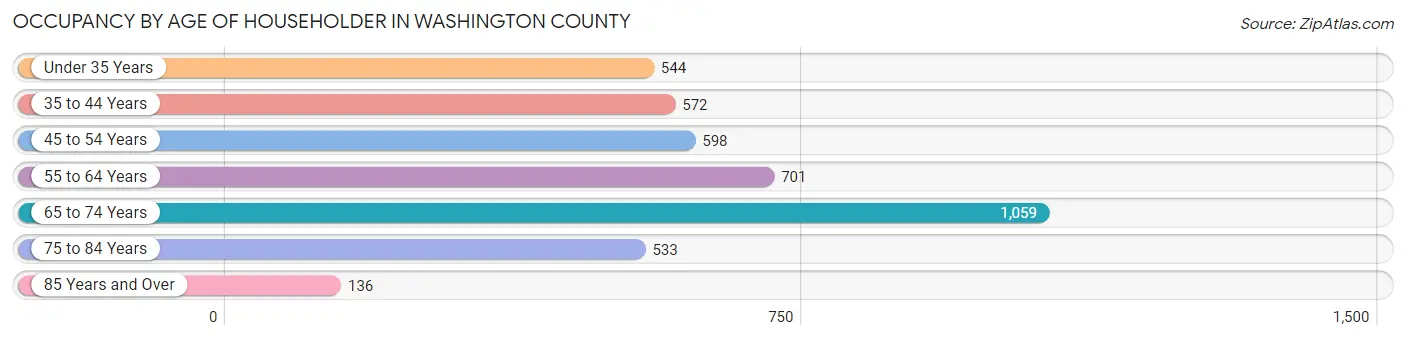
| Age Bracket | # Households | % Households |
| Under 35 Years | 544 | 13.1% |
| 35 to 44 Years | 572 | 13.8% |
| 45 to 54 Years | 598 | 14.4% |
| 55 to 64 Years | 701 | 16.9% |
| 65 to 74 Years | 1,059 | 25.6% |
| 75 to 84 Years | 533 | 12.9% |
| 85 Years and Over | 136 | 3.3% |
| Total | 4,143 | 100.0% |
Housing Finances in Washington County
Median Income by Occupancy in Washington County
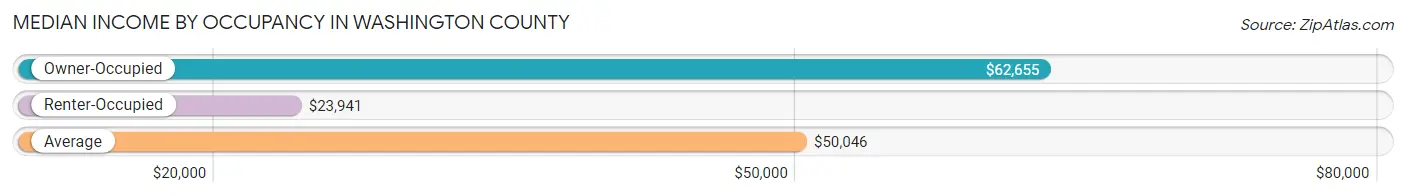
| Occupancy Type | # Households | Median Income |
| Owner-Occupied | 2,973 (71.8%) | $62,655 |
| Renter-Occupied | 1,170 (28.2%) | $23,941 |
| Average | 4,143 (100.0%) | $50,046 |
Occupancy by Householder Income Bracket in Washington County
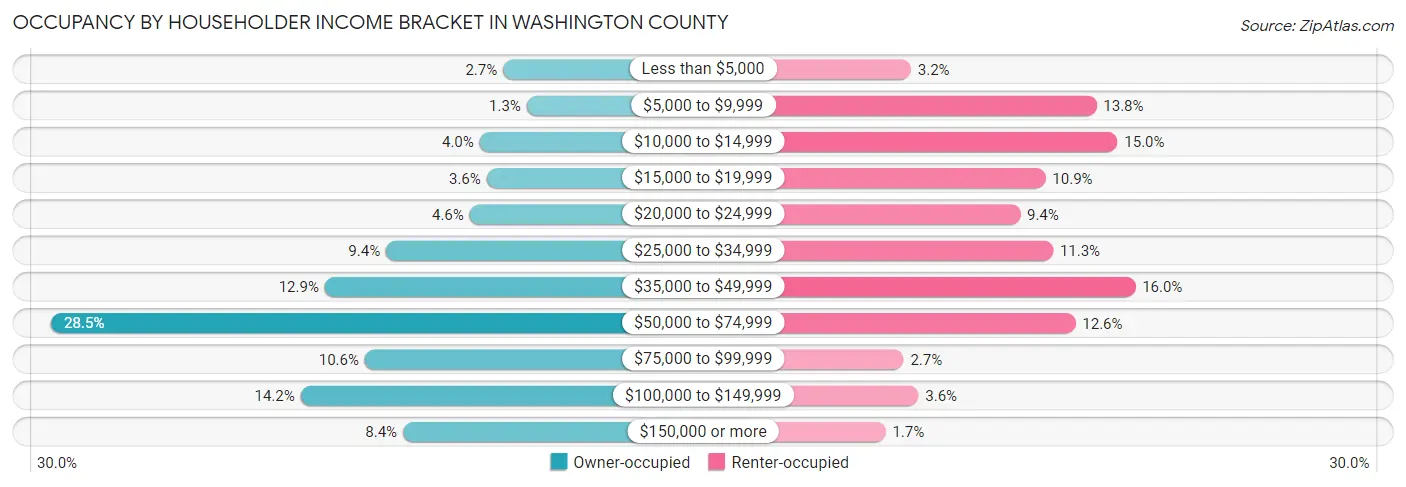
| Income Bracket | Owner-occupied | Renter-occupied |
| Less than $5,000 | 79 (2.7%) | 37 (3.2%) |
| $5,000 to $9,999 | 39 (1.3%) | 161 (13.8%) |
| $10,000 to $14,999 | 119 (4.0%) | 175 (15.0%) |
| $15,000 to $19,999 | 107 (3.6%) | 127 (10.8%) |
| $20,000 to $24,999 | 136 (4.6%) | 110 (9.4%) |
| $25,000 to $34,999 | 278 (9.3%) | 132 (11.3%) |
| $35,000 to $49,999 | 382 (12.9%) | 187 (16.0%) |
| $50,000 to $74,999 | 847 (28.5%) | 147 (12.6%) |
| $75,000 to $99,999 | 314 (10.6%) | 32 (2.7%) |
| $100,000 to $149,999 | 423 (14.2%) | 42 (3.6%) |
| $150,000 or more | 249 (8.4%) | 20 (1.7%) |
| Total | 2,973 (100.0%) | 1,170 (100.0%) |
Monthly Housing Cost Tiers in Washington County
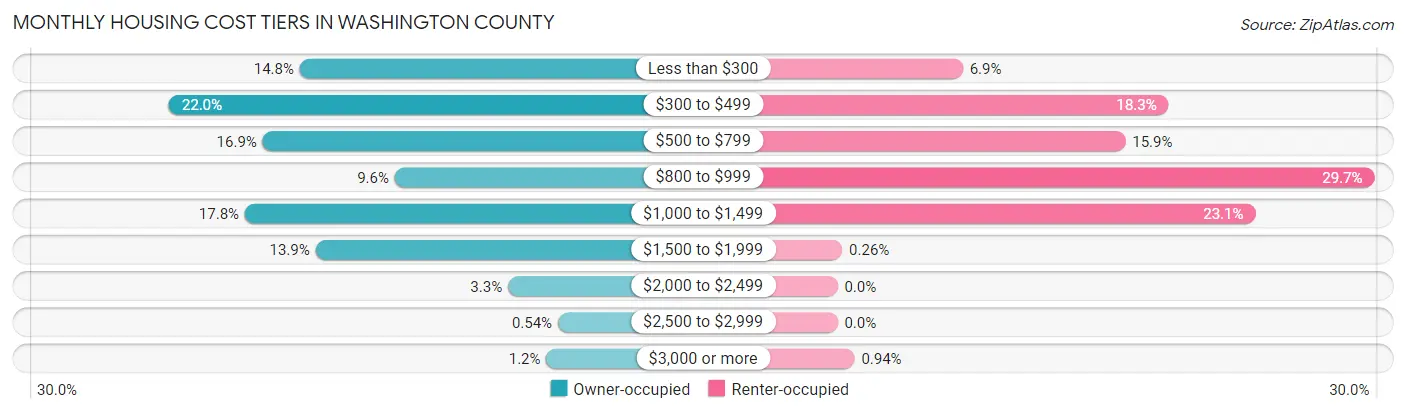
| Monthly Cost | Owner-occupied | Renter-occupied |
| Less than $300 | 440 (14.8%) | 81 (6.9%) |
| $300 to $499 | 655 (22.0%) | 214 (18.3%) |
| $500 to $799 | 501 (16.9%) | 186 (15.9%) |
| $800 to $999 | 284 (9.6%) | 347 (29.7%) |
| $1,000 to $1,499 | 530 (17.8%) | 270 (23.1%) |
| $1,500 to $1,999 | 414 (13.9%) | 3 (0.3%) |
| $2,000 to $2,499 | 98 (3.3%) | 0 (0.0%) |
| $2,500 to $2,999 | 16 (0.5%) | 0 (0.0%) |
| $3,000 or more | 35 (1.2%) | 11 (0.9%) |
| Total | 2,973 (100.0%) | 1,170 (100.0%) |
Physical Housing Characteristics in Washington County
Housing Structures in Washington County
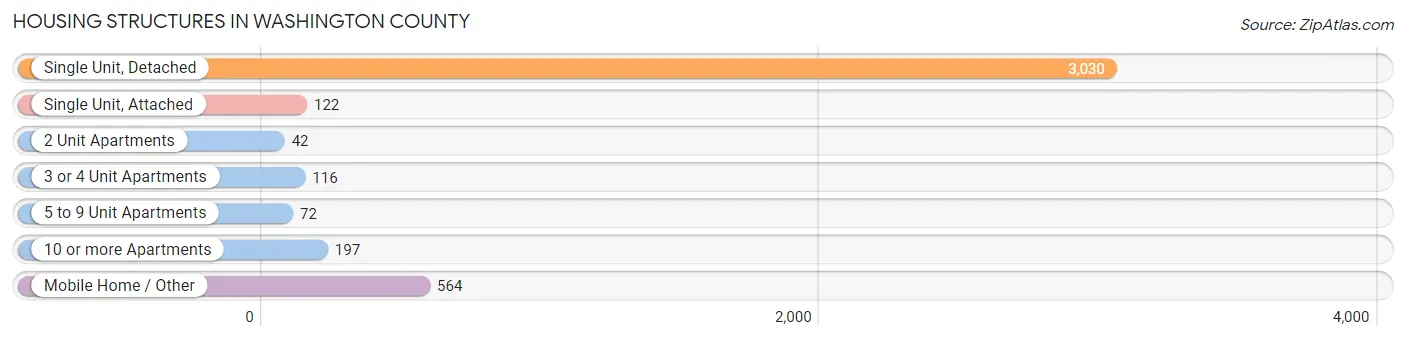
| Structure Type | # Housing Units | % Housing Units |
| Single Unit, Detached | 3,030 | 73.1% |
| Single Unit, Attached | 122 | 2.9% |
| 2 Unit Apartments | 42 | 1.0% |
| 3 or 4 Unit Apartments | 116 | 2.8% |
| 5 to 9 Unit Apartments | 72 | 1.7% |
| 10 or more Apartments | 197 | 4.8% |
| Mobile Home / Other | 564 | 13.6% |
| Total | 4,143 | 100.0% |
Housing Structures by Occupancy in Washington County
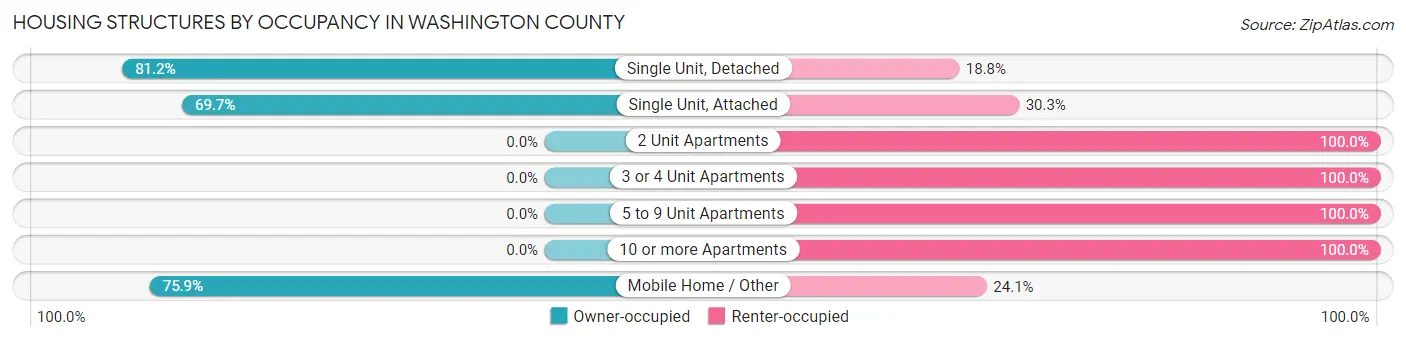
| Structure Type | Owner-occupied | Renter-occupied |
| Single Unit, Detached | 2,460 (81.2%) | 570 (18.8%) |
| Single Unit, Attached | 85 (69.7%) | 37 (30.3%) |
| 2 Unit Apartments | 0 (0.0%) | 42 (100.0%) |
| 3 or 4 Unit Apartments | 0 (0.0%) | 116 (100.0%) |
| 5 to 9 Unit Apartments | 0 (0.0%) | 72 (100.0%) |
| 10 or more Apartments | 0 (0.0%) | 197 (100.0%) |
| Mobile Home / Other | 428 (75.9%) | 136 (24.1%) |
| Total | 2,973 (71.8%) | 1,170 (28.2%) |
Housing Structures by Number of Rooms in Washington County
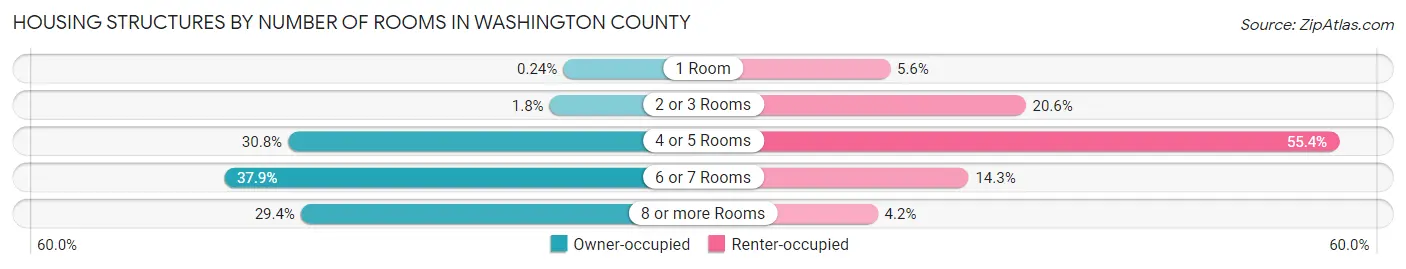
| Number of Rooms | Owner-occupied | Renter-occupied |
| 1 Room | 7 (0.2%) | 65 (5.6%) |
| 2 or 3 Rooms | 52 (1.8%) | 241 (20.6%) |
| 4 or 5 Rooms | 915 (30.8%) | 648 (55.4%) |
| 6 or 7 Rooms | 1,126 (37.9%) | 167 (14.3%) |
| 8 or more Rooms | 873 (29.4%) | 49 (4.2%) |
| Total | 2,973 (100.0%) | 1,170 (100.0%) |
Housing Structure by Heating Type in Washington County
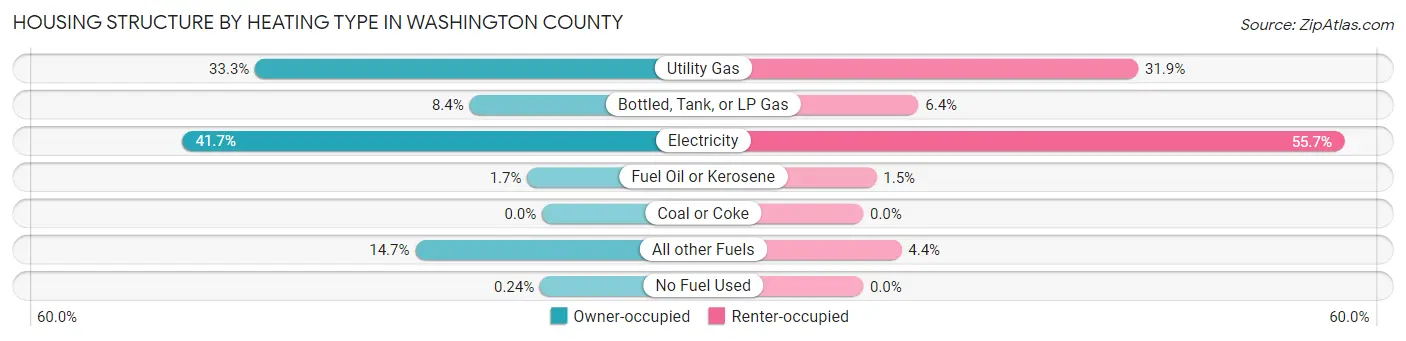
| Heating Type | Owner-occupied | Renter-occupied |
| Utility Gas | 989 (33.3%) | 373 (31.9%) |
| Bottled, Tank, or LP Gas | 250 (8.4%) | 75 (6.4%) |
| Electricity | 1,239 (41.7%) | 652 (55.7%) |
| Fuel Oil or Kerosene | 51 (1.7%) | 18 (1.5%) |
| Coal or Coke | 0 (0.0%) | 0 (0.0%) |
| All other Fuels | 437 (14.7%) | 52 (4.4%) |
| No Fuel Used | 7 (0.2%) | 0 (0.0%) |
| Total | 2,973 (100.0%) | 1,170 (100.0%) |
Household Vehicle Usage in Washington County
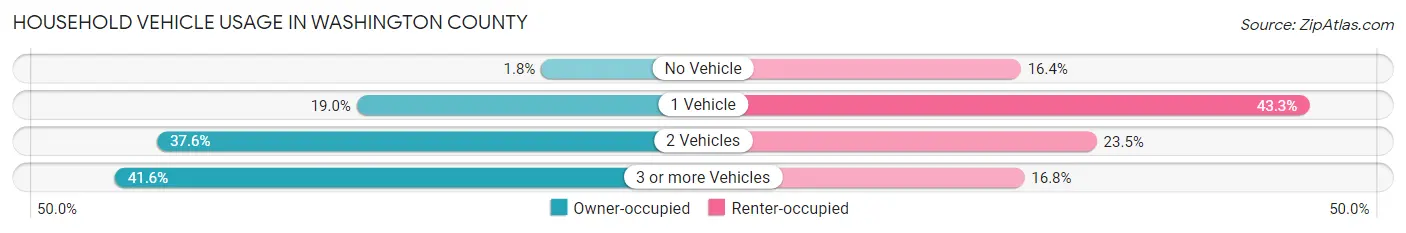
| Vehicles per Household | Owner-occupied | Renter-occupied |
| No Vehicle | 53 (1.8%) | 192 (16.4%) |
| 1 Vehicle | 565 (19.0%) | 507 (43.3%) |
| 2 Vehicles | 1,119 (37.6%) | 275 (23.5%) |
| 3 or more Vehicles | 1,236 (41.6%) | 196 (16.8%) |
| Total | 2,973 (100.0%) | 1,170 (100.0%) |
Real Estate & Mortgages in Washington County
Real Estate and Mortgage Overview in Washington County
| Characteristic | Without Mortgage | With Mortgage |
| Housing Units | 1,390 | 1,583 |
| Median Property Value | $197,500 | $239,600 |
| Median Household Income | $44,323 | $138 |
| Monthly Housing Costs | $360 | $35 |
| Real Estate Taxes | $1,137 | $20 |
Property Value by Mortgage Status in Washington County
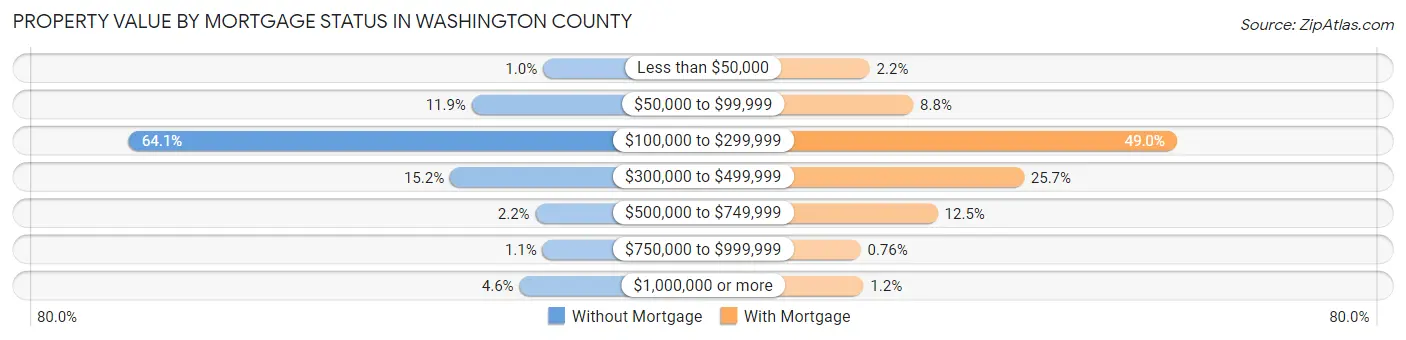
| Property Value | Without Mortgage | With Mortgage |
| Less than $50,000 | 14 (1.0%) | 34 (2.1%) |
| $50,000 to $99,999 | 165 (11.9%) | 139 (8.8%) |
| $100,000 to $299,999 | 891 (64.1%) | 775 (49.0%) |
| $300,000 to $499,999 | 211 (15.2%) | 406 (25.7%) |
| $500,000 to $749,999 | 30 (2.2%) | 198 (12.5%) |
| $750,000 to $999,999 | 15 (1.1%) | 12 (0.8%) |
| $1,000,000 or more | 64 (4.6%) | 19 (1.2%) |
| Total | 1,390 (100.0%) | 1,583 (100.0%) |
Household Income by Mortgage Status in Washington County
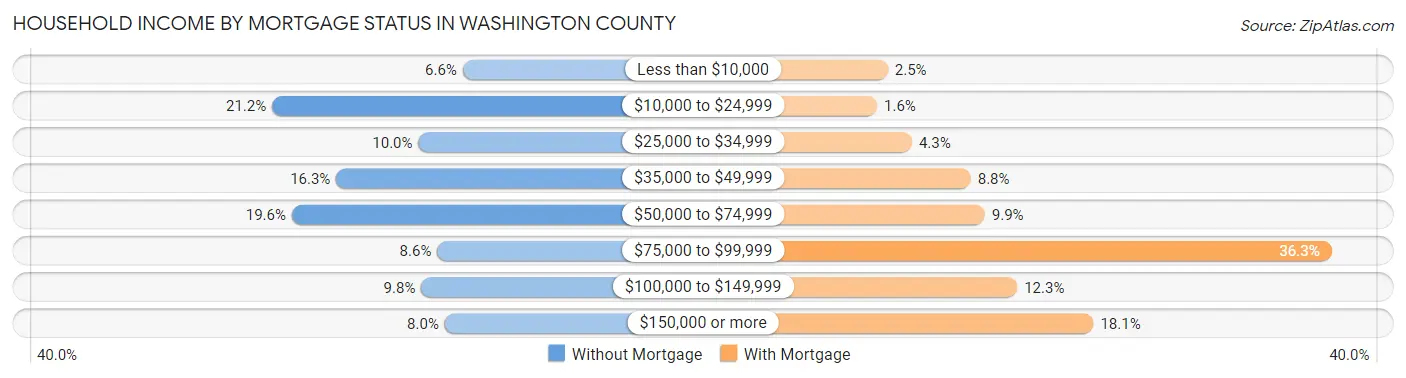
| Household Income | Without Mortgage | With Mortgage |
| Less than $10,000 | 92 (6.6%) | 39 (2.5%) |
| $10,000 to $24,999 | 294 (21.1%) | 26 (1.6%) |
| $25,000 to $34,999 | 139 (10.0%) | 68 (4.3%) |
| $35,000 to $49,999 | 226 (16.3%) | 139 (8.8%) |
| $50,000 to $74,999 | 273 (19.6%) | 156 (9.9%) |
| $75,000 to $99,999 | 119 (8.6%) | 574 (36.3%) |
| $100,000 to $149,999 | 136 (9.8%) | 195 (12.3%) |
| $150,000 or more | 111 (8.0%) | 287 (18.1%) |
| Total | 1,390 (100.0%) | 1,583 (100.0%) |
Property Value to Household Income Ratio in Washington County
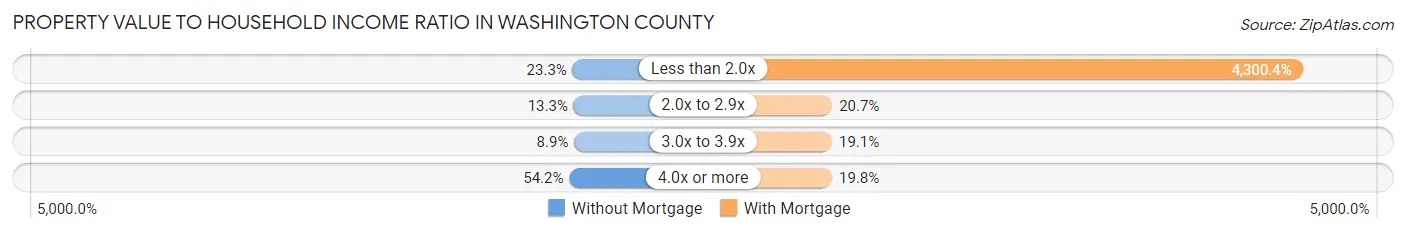
| Value-to-Income Ratio | Without Mortgage | With Mortgage |
| Less than 2.0x | 324 (23.3%) | 68,075 (4,300.4%) |
| 2.0x to 2.9x | 185 (13.3%) | 328 (20.7%) |
| 3.0x to 3.9x | 124 (8.9%) | 302 (19.1%) |
| 4.0x or more | 753 (54.2%) | 313 (19.8%) |
| Total | 1,390 (100.0%) | 1,583 (100.0%) |
Real Estate Taxes by Mortgage Status in Washington County
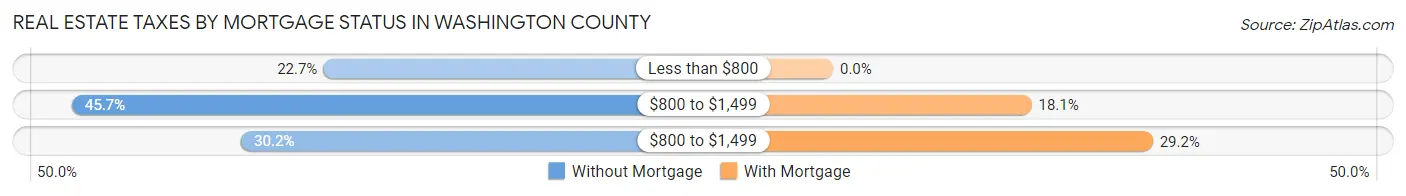
| Property Taxes | Without Mortgage | With Mortgage |
| Less than $800 | 316 (22.7%) | 0 (0.0%) |
| $800 to $1,499 | 635 (45.7%) | 287 (18.1%) |
| $800 to $1,499 | 420 (30.2%) | 462 (29.2%) |
| Total | 1,390 (100.0%) | 1,583 (100.0%) |
Health & Disability in Washington County
Health Insurance Coverage by Age in Washington County
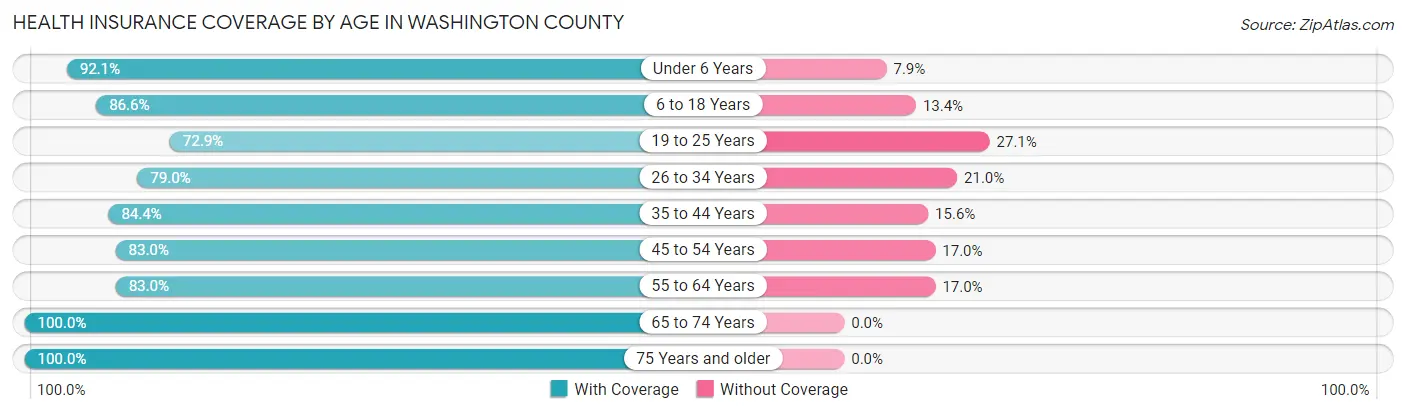
| Age Bracket | With Coverage | Without Coverage |
| Under 6 Years | 631 (92.1%) | 54 (7.9%) |
| 6 to 18 Years | 1,557 (86.6%) | 240 (13.4%) |
| 19 to 25 Years | 546 (72.9%) | 203 (27.1%) |
| 26 to 34 Years | 717 (79.0%) | 191 (21.0%) |
| 35 to 44 Years | 960 (84.4%) | 178 (15.6%) |
| 45 to 54 Years | 914 (83.0%) | 187 (17.0%) |
| 55 to 64 Years | 1,152 (83.0%) | 236 (17.0%) |
| 65 to 74 Years | 1,652 (100.0%) | 0 (0.0%) |
| 75 Years and older | 1,018 (100.0%) | 0 (0.0%) |
| Total | 9,147 (87.6%) | 1,289 (12.3%) |
Health Insurance Coverage by Citizenship Status in Washington County
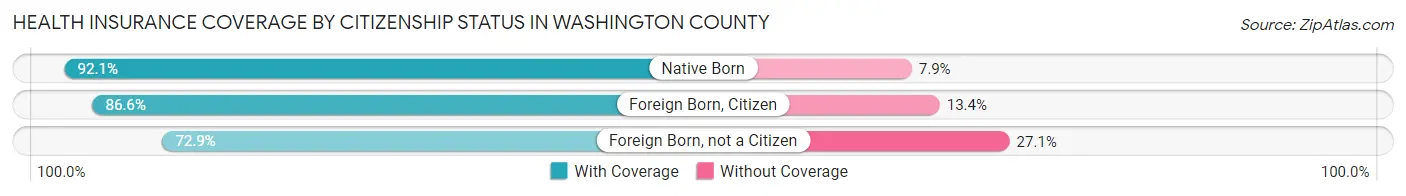
| Citizenship Status | With Coverage | Without Coverage |
| Native Born | 631 (92.1%) | 54 (7.9%) |
| Foreign Born, Citizen | 1,557 (86.6%) | 240 (13.4%) |
| Foreign Born, not a Citizen | 546 (72.9%) | 203 (27.1%) |
Health Insurance Coverage by Household Income in Washington County
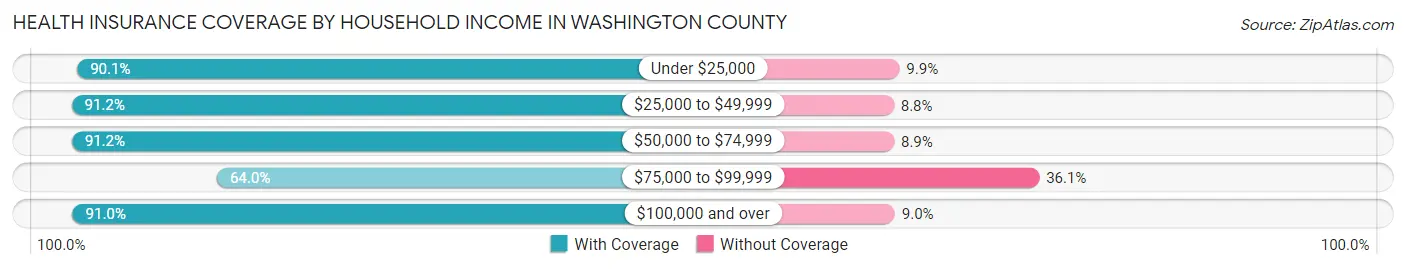
| Household Income | With Coverage | Without Coverage |
| Under $25,000 | 1,564 (90.1%) | 171 (9.9%) |
| $25,000 to $49,999 | 2,093 (91.2%) | 202 (8.8%) |
| $50,000 to $74,999 | 2,450 (91.1%) | 238 (8.8%) |
| $75,000 to $99,999 | 816 (63.9%) | 460 (36.0%) |
| $100,000 and over | 2,194 (91.0%) | 217 (9.0%) |
Public vs Private Health Insurance Coverage by Age in Washington County
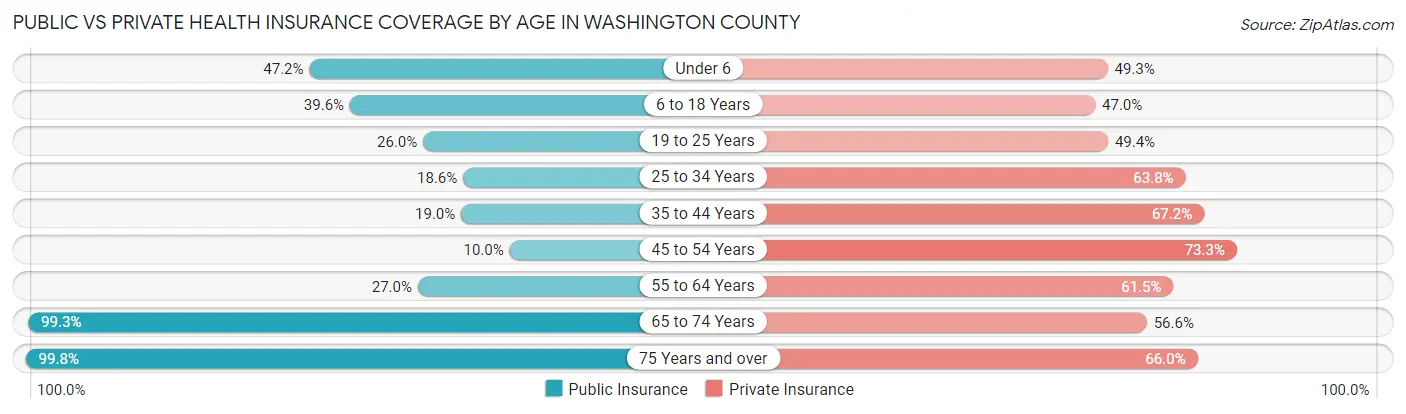
| Age Bracket | Public Insurance | Private Insurance |
| Under 6 | 323 (47.1%) | 338 (49.3%) |
| 6 to 18 Years | 712 (39.6%) | 845 (47.0%) |
| 19 to 25 Years | 195 (26.0%) | 370 (49.4%) |
| 25 to 34 Years | 169 (18.6%) | 579 (63.8%) |
| 35 to 44 Years | 216 (19.0%) | 765 (67.2%) |
| 45 to 54 Years | 110 (10.0%) | 807 (73.3%) |
| 55 to 64 Years | 375 (27.0%) | 854 (61.5%) |
| 65 to 74 Years | 1,641 (99.3%) | 935 (56.6%) |
| 75 Years and over | 1,016 (99.8%) | 672 (66.0%) |
| Total | 4,757 (45.6%) | 6,165 (59.1%) |
Disability Status by Sex by Age in Washington County
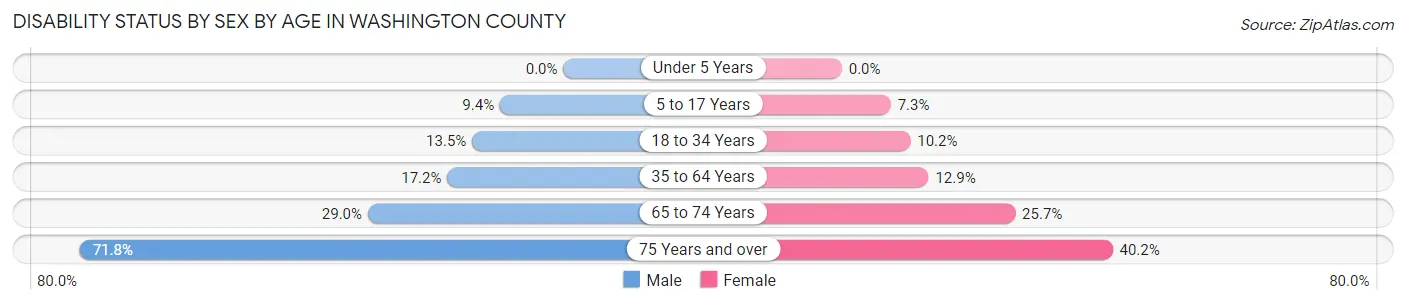
| Age Bracket | Male | Female |
| Under 5 Years | 0 (0.0%) | 0 (0.0%) |
| 5 to 17 Years | 83 (9.4%) | 69 (7.3%) |
| 18 to 34 Years | 119 (13.5%) | 88 (10.2%) |
| 35 to 64 Years | 305 (17.2%) | 239 (12.9%) |
| 65 to 74 Years | 245 (29.0%) | 208 (25.7%) |
| 75 Years and over | 372 (71.8%) | 201 (40.2%) |
Disability Class by Sex by Age in Washington County
Disability Class: Hearing Difficulty
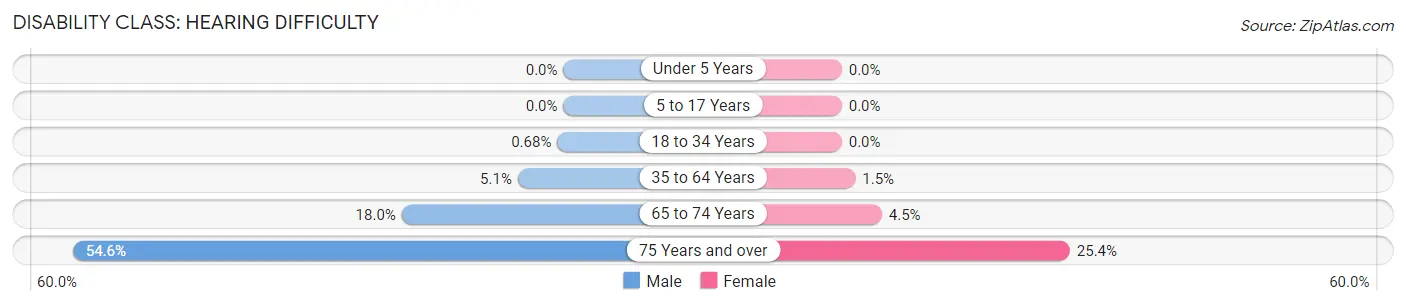
| Age Bracket | Male | Female |
| Under 5 Years | 0 (0.0%) | 0 (0.0%) |
| 5 to 17 Years | 0 (0.0%) | 0 (0.0%) |
| 18 to 34 Years | 6 (0.7%) | 0 (0.0%) |
| 35 to 64 Years | 90 (5.1%) | 28 (1.5%) |
| 65 to 74 Years | 152 (18.0%) | 36 (4.5%) |
| 75 Years and over | 283 (54.6%) | 127 (25.4%) |
Disability Class: Vision Difficulty
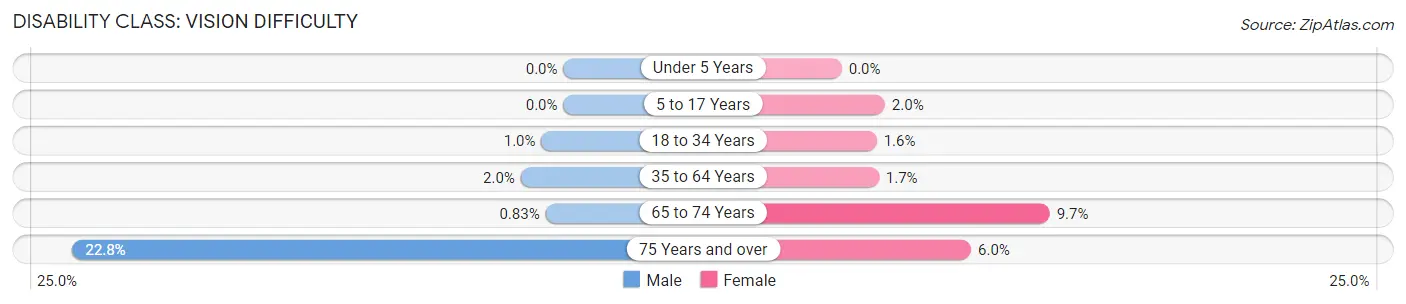
| Age Bracket | Male | Female |
| Under 5 Years | 0 (0.0%) | 0 (0.0%) |
| 5 to 17 Years | 0 (0.0%) | 19 (2.0%) |
| 18 to 34 Years | 9 (1.0%) | 14 (1.6%) |
| 35 to 64 Years | 35 (2.0%) | 32 (1.7%) |
| 65 to 74 Years | 7 (0.8%) | 78 (9.7%) |
| 75 Years and over | 118 (22.8%) | 30 (6.0%) |
Disability Class: Cognitive Difficulty
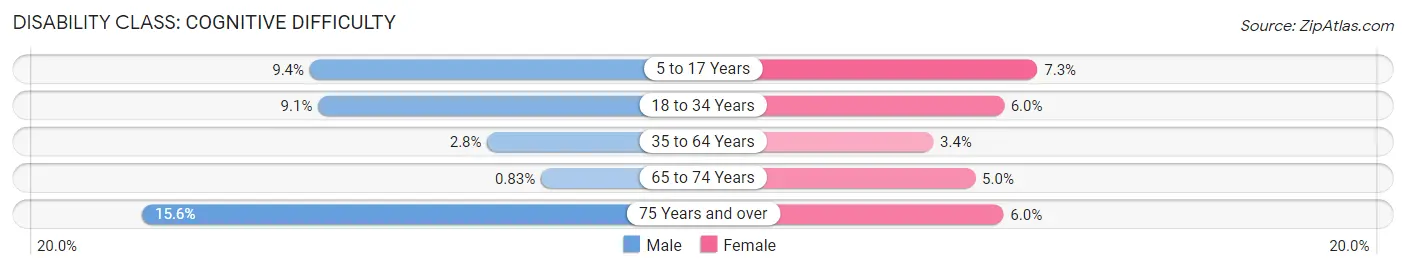
| Age Bracket | Male | Female |
| 5 to 17 Years | 83 (9.4%) | 69 (7.3%) |
| 18 to 34 Years | 80 (9.1%) | 52 (6.0%) |
| 35 to 64 Years | 50 (2.8%) | 63 (3.4%) |
| 65 to 74 Years | 7 (0.8%) | 40 (5.0%) |
| 75 Years and over | 81 (15.6%) | 30 (6.0%) |
Disability Class: Ambulatory Difficulty
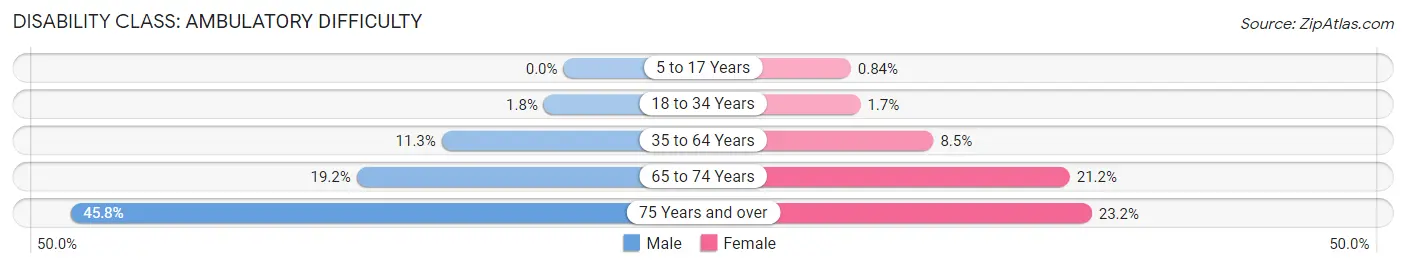
| Age Bracket | Male | Female |
| 5 to 17 Years | 0 (0.0%) | 8 (0.8%) |
| 18 to 34 Years | 16 (1.8%) | 15 (1.7%) |
| 35 to 64 Years | 200 (11.3%) | 158 (8.5%) |
| 65 to 74 Years | 162 (19.2%) | 171 (21.2%) |
| 75 Years and over | 237 (45.8%) | 116 (23.2%) |
Disability Class: Self-Care Difficulty
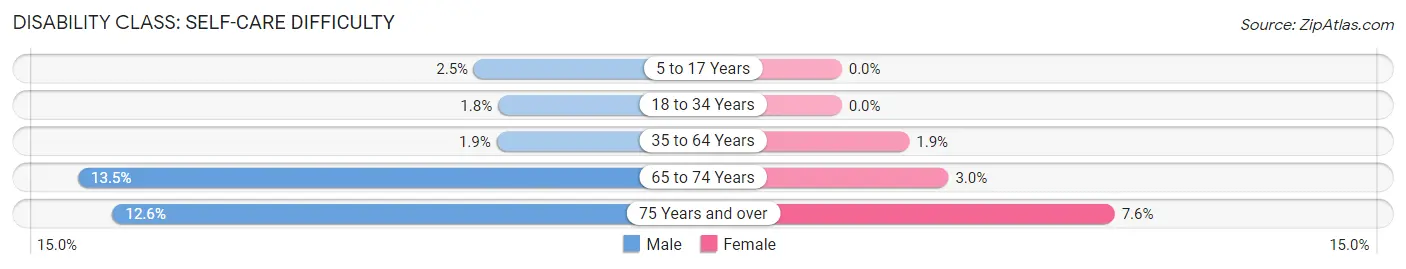
| Age Bracket | Male | Female |
| 5 to 17 Years | 22 (2.5%) | 0 (0.0%) |
| 18 to 34 Years | 16 (1.8%) | 0 (0.0%) |
| 35 to 64 Years | 33 (1.9%) | 35 (1.9%) |
| 65 to 74 Years | 114 (13.5%) | 24 (3.0%) |
| 75 Years and over | 65 (12.6%) | 38 (7.6%) |
Technology Access in Washington County
Computing Device Access in Washington County
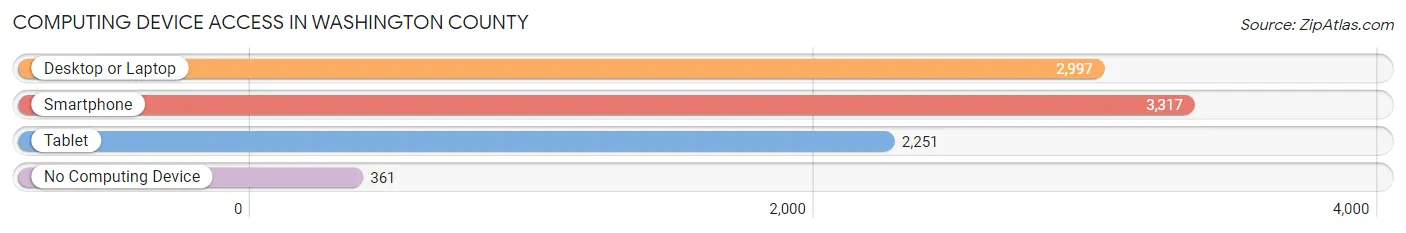
| Device Type | # Households | % Households |
| Desktop or Laptop | 2,997 | 72.3% |
| Smartphone | 3,317 | 80.1% |
| Tablet | 2,251 | 54.3% |
| No Computing Device | 361 | 8.7% |
| Total | 4,143 | 100.0% |
Internet Access in Washington County
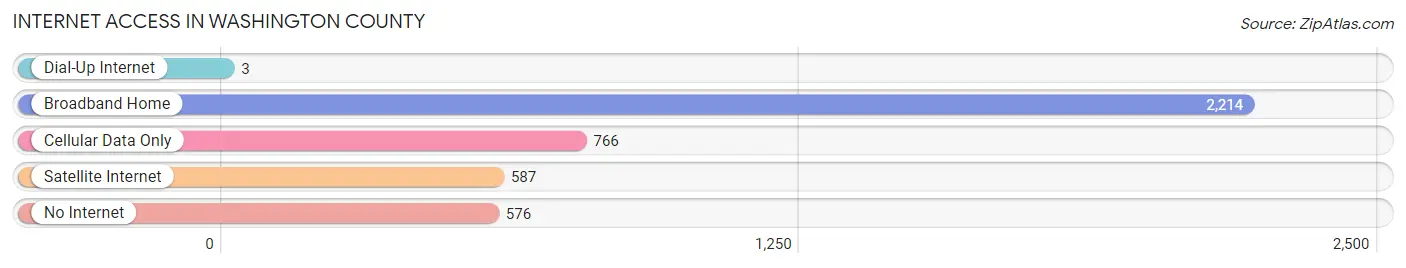
| Internet Type | # Households | % Households |
| Dial-Up Internet | 3 | 0.1% |
| Broadband Home | 2,214 | 53.4% |
| Cellular Data Only | 766 | 18.5% |
| Satellite Internet | 587 | 14.2% |
| No Internet | 576 | 13.9% |
| Total | 4,143 | 100.0% |
Washington County Summary
Introduction
Washington County, Idaho is located in the southeastern corner of the state and is bordered by Oregon to the south and Nevada to the east. It is the second-largest county in Idaho, covering an area of 2,717 square miles. The county seat is Weiser, and the largest city is Payette. The county was established in 1879 and named after George Washington, the first president of the United States.
Geography
Washington County is located in the Snake River Plain, a large area of flat land that stretches across southern Idaho. The county is mostly covered by agricultural land, with some areas of forest and desert. The Snake River runs through the county, and there are several smaller rivers and streams. The highest point in the county is the summit of Squaw Butte, which is 6,912 feet above sea level.
The climate of Washington County is semi-arid, with hot summers and cold winters. The average annual precipitation is about 11 inches, and the average annual temperature is about 50 degrees Fahrenheit.
Economy
Agriculture is the main economic activity in Washington County. The county is home to many farms and ranches, and the main crops grown are potatoes, wheat, barley, and hay. Livestock production is also important, and the county is home to many cattle, sheep, and horses.
The county also has a growing manufacturing sector, with several companies producing food products, furniture, and other goods. The county is also home to several mining operations, including gold, silver, and copper mines.
Demographics
As of the 2010 census, the population of Washington County was 20,972. The population is mostly white (90.3%), with small percentages of Native American (2.2%), Hispanic (2.1%), and African American (0.7%) residents. The median household income is $41,945, and the median home value is $127,400.
Conclusion
Washington County, Idaho is a rural county located in the southeastern corner of the state. The county is mostly covered by agricultural land, and the main economic activities are farming and ranching. The population is mostly white, and the median household income is $41,945. The county is home to many farms and ranches, and there is also a growing manufacturing sector.
Common Questions
What is the Total Population of Washington County?
Total Population of Washington County is 10,612.
What is the Total Male Population of Washington County?
Total Male Population of Washington County is 5,264.
What is the Total Female Population of Washington County?
Total Female Population of Washington County is 5,348.
What is the Ratio of Males per 100 Females in Washington County?
There are 98.43 Males per 100 Females in Washington County.
What is the Ratio of Females per 100 Males in Washington County?
There are 101.60 Females per 100 Males in Washington County.
What is the Median Population Age in Washington County?
Median Population Age in Washington County is 44.7 Years.
What is the Average Family Size in Washington County
Average Family Size in Washington County is 3.0 People.
What is the Average Household Size in Washington County
Average Household Size in Washington County is 2.5 People.
What is Per Capita Income in Washington County?
Per Capita income in Washington County is $26,213.
What is the Median Family Income in Washington County?
Median Family Income in Washington County is $58,577.
What is the Median Household income in Washington County?
Median Household Income in Washington County is $50,046.
What is Income or Wage Gap in Washington County?
Income or Wage Gap in Washington County is 40.0%.
Women in Washington County earn 60.0 cents for every dollar earned by a man.
What is Family Income Deficit in Washington County?
Family Income Deficit in Washington County is $12,153.
Families that are below poverty line in Washington County earn $12,153 less on average than the poverty threshold level.
What is Inequality or Gini Index in Washington County?
Inequality or Gini Index in Washington County is 0.45.
How Large is the Labor Force in Washington County?
There are 4,194 People in the Labor Forcein in Washington County.
What is the Percentage of People in the Labor Force in Washington County?
49.4% of People are in the Labor Force in Washington County.
What is the Unemployment Rate in Washington County?
Unemployment Rate in Washington County is 4.5%.