Valley County, ID
Valley County Map
Valley County Overview
11,830
TOTAL POPULATION
6,165
MALE POPULATION
5,665
FEMALE POPULATION
108.83
MALES / 100 FEMALES
91.89
FEMALES / 100 MALES
48.9
MEDIAN AGE
3.4
AVG FAMILY SIZE
3.0
AVG HOUSEHOLD SIZE
$34,544
PER CAPITA INCOME
$87,595
AVG FAMILY INCOME
$72,878
AVG HOUSEHOLD INCOME
45.3%
WAGE / INCOME GAP [ % ]
54.7¢/ $1
WAGE / INCOME GAP [ $ ]
0.47
INEQUALITY / GINI INDEX
5,008
LABOR FORCE [ PEOPLE ]
50.2%
PERCENT IN LABOR FORCE
1.5%
UNEMPLOYMENT RATE
Valley County Area Codes
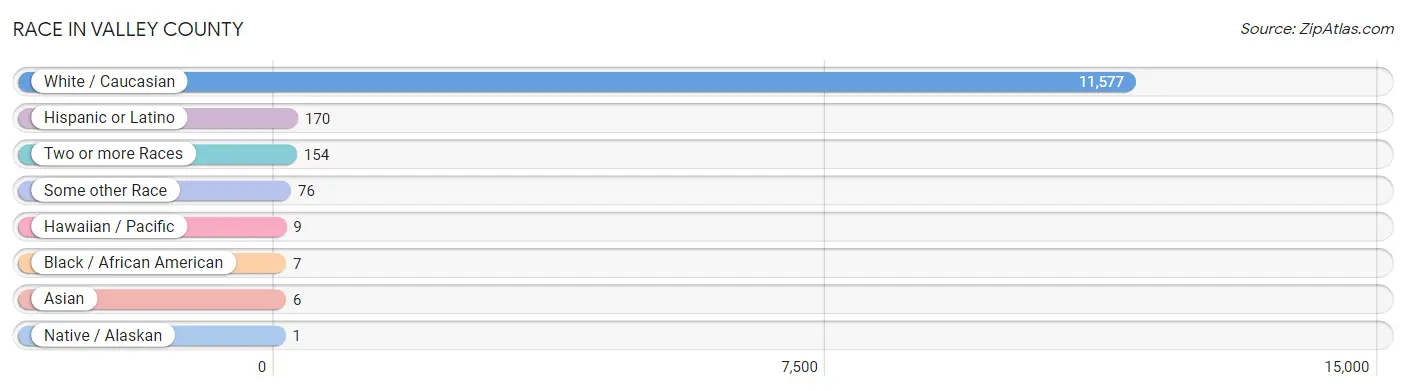
Race in Valley County
The most populous races in Valley County are White / Caucasian (11,577 | 97.9%), Hispanic or Latino (170 | 1.4%), and Two or more Races (154 | 1.3%).
| Race | # Population | % Population |
| Asian | 6 | 0.1% |
| Black / African American | 7 | 0.1% |
| Hawaiian / Pacific | 9 | 0.1% |
| Hispanic or Latino | 170 | 1.4% |
| Native / Alaskan | 1 | 0.0% |
| White / Caucasian | 11,577 | 97.9% |
| Two or more Races | 154 | 1.3% |
| Some other Race | 76 | 0.6% |
| Total | 11,830 | 100.0% |
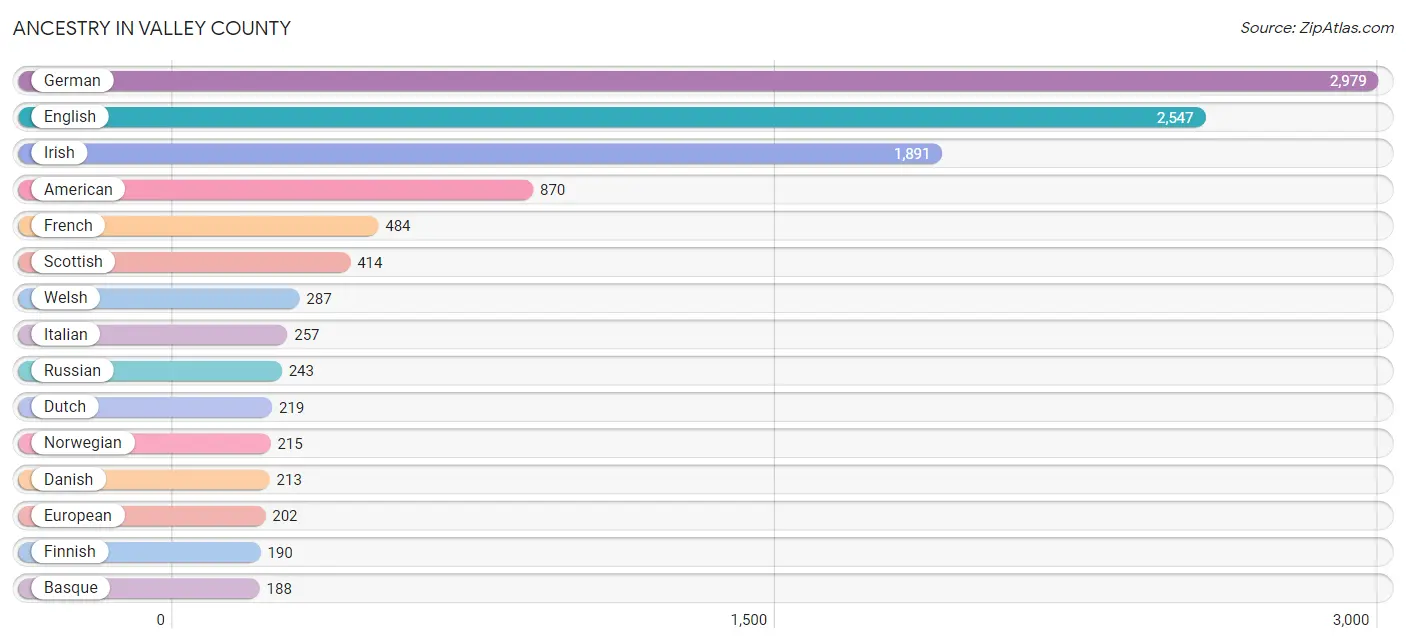
Ancestry in Valley County
The most populous ancestries reported in Valley County are German (2,979 | 25.2%), English (2,547 | 21.5%), Irish (1,891 | 16.0%), American (870 | 7.3%), and French (484 | 4.1%), together accounting for 74.1% of all Valley County residents.
| Ancestry | # Population | % Population |
| African | 62 | 0.5% |
| American | 870 | 7.3% |
| Basque | 188 | 1.6% |
| Belgian | 58 | 0.5% |
| Bhutanese | 6 | 0.1% |
| Blackfeet | 2 | 0.0% |
| British | 81 | 0.7% |
| Canadian | 18 | 0.2% |
| Central American | 1 | 0.0% |
| Cherokee | 10 | 0.1% |
| Chippewa | 32 | 0.3% |
| Croatian | 60 | 0.5% |
| Czech | 34 | 0.3% |
| Czechoslovakian | 11 | 0.1% |
| Danish | 213 | 1.8% |
| Dominican | 10 | 0.1% |
| Dutch | 219 | 1.8% |
| English | 2,547 | 21.5% |
| European | 202 | 1.7% |
| Finnish | 190 | 1.6% |
| French | 484 | 4.1% |
| French Canadian | 1 | 0.0% |
| German | 2,979 | 25.2% |
| Greek | 7 | 0.1% |
| Irish | 1,891 | 16.0% |
| Italian | 257 | 2.2% |
| Korean | 18 | 0.2% |
| Lithuanian | 5 | 0.0% |
| Mexican | 105 | 0.9% |
| Native Hawaiian | 9 | 0.1% |
| Norwegian | 215 | 1.8% |
| Polish | 135 | 1.1% |
| Portuguese | 34 | 0.3% |
| Puerto Rican | 1 | 0.0% |
| Russian | 243 | 2.1% |
| Scandinavian | 26 | 0.2% |
| Scotch-Irish | 108 | 0.9% |
| Scottish | 414 | 3.5% |
| Slovak | 118 | 1.0% |
| Slovene | 8 | 0.1% |
| Spaniard | 22 | 0.2% |
| Spanish | 31 | 0.3% |
| Subsaharan African | 62 | 0.5% |
| Swedish | 119 | 1.0% |
| Swiss | 72 | 0.6% |
| Thai | 3 | 0.0% |
| Tongan | 5 | 0.0% |
| Ukrainian | 33 | 0.3% |
| Welsh | 287 | 2.4% |
| Yugoslavian | 93 | 0.8% | View All 50 Rows |
Immigrants in Valley County
The most numerous immigrant groups reported in Valley County came from Central America (33 | 0.3%), Latin America (33 | 0.3%), Mexico (32 | 0.3%), Europe (20 | 0.2%), and Asia (12 | 0.1%), together accounting for 1.1% of all Valley County residents.

| Immigration Origin | # Population | % Population |
| Asia | 12 | 0.1% |
| Canada | 10 | 0.1% |
| Central America | 33 | 0.3% |
| England | 9 | 0.1% |
| Europe | 20 | 0.2% |
| Germany | 11 | 0.1% |
| Guatemala | 1 | 0.0% |
| India | 3 | 0.0% |
| Indonesia | 3 | 0.0% |
| Latin America | 33 | 0.3% |
| Mexico | 32 | 0.3% |
| Northern Europe | 9 | 0.1% |
| Philippines | 6 | 0.1% |
| South Central Asia | 3 | 0.0% |
| South Eastern Asia | 9 | 0.1% |
| Western Europe | 11 | 0.1% | View All 16 Rows |
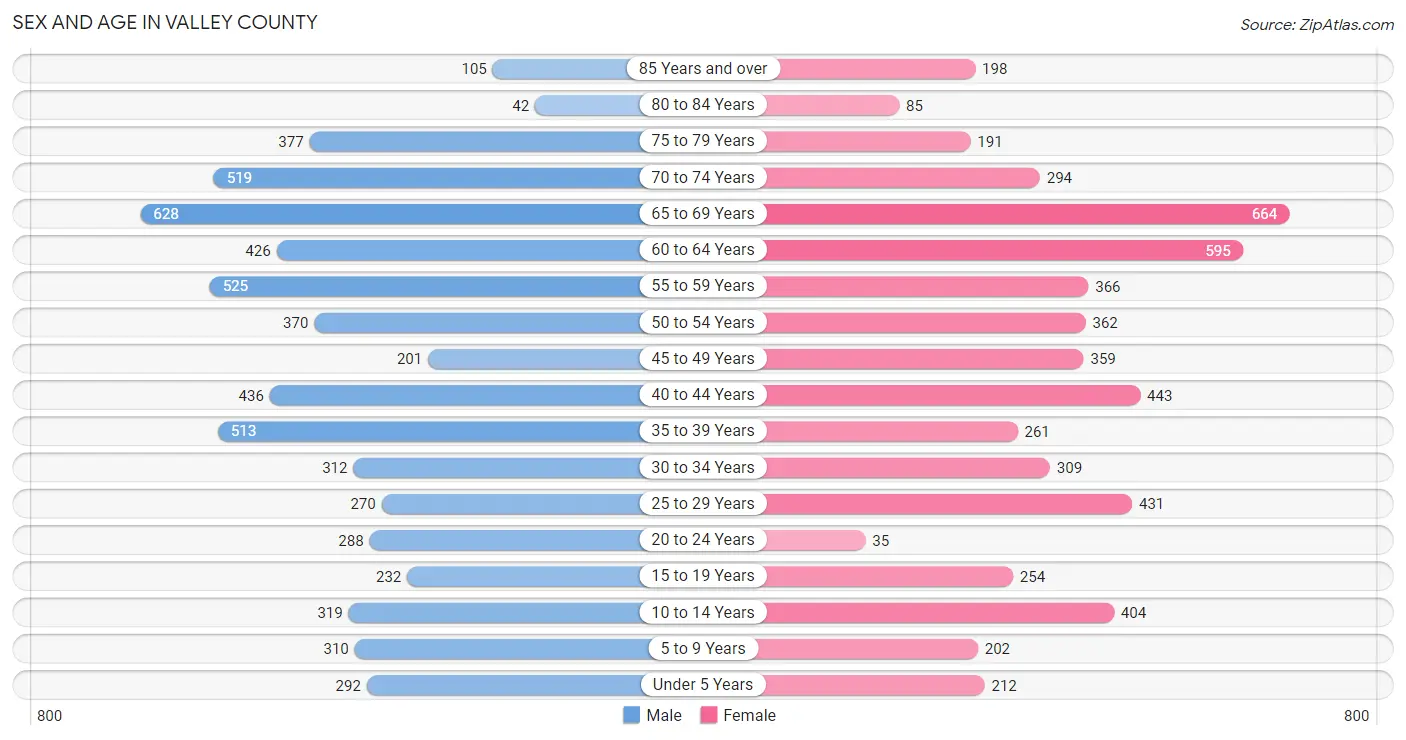
Sex and Age in Valley County
Sex and Age in Valley County
The most populous age groups in Valley County are 65 to 69 Years (628 | 10.2%) for men and 65 to 69 Years (664 | 11.7%) for women.
| Age Bracket | Male | Female |
| Under 5 Years | 292 (4.7%) | 212 (3.7%) |
| 5 to 9 Years | 310 (5.0%) | 202 (3.6%) |
| 10 to 14 Years | 319 (5.2%) | 404 (7.1%) |
| 15 to 19 Years | 232 (3.8%) | 254 (4.5%) |
| 20 to 24 Years | 288 (4.7%) | 35 (0.6%) |
| 25 to 29 Years | 270 (4.4%) | 431 (7.6%) |
| 30 to 34 Years | 312 (5.1%) | 309 (5.4%) |
| 35 to 39 Years | 513 (8.3%) | 261 (4.6%) |
| 40 to 44 Years | 436 (7.1%) | 443 (7.8%) |
| 45 to 49 Years | 201 (3.3%) | 359 (6.3%) |
| 50 to 54 Years | 370 (6.0%) | 362 (6.4%) |
| 55 to 59 Years | 525 (8.5%) | 366 (6.5%) |
| 60 to 64 Years | 426 (6.9%) | 595 (10.5%) |
| 65 to 69 Years | 628 (10.2%) | 664 (11.7%) |
| 70 to 74 Years | 519 (8.4%) | 294 (5.2%) |
| 75 to 79 Years | 377 (6.1%) | 191 (3.4%) |
| 80 to 84 Years | 42 (0.7%) | 85 (1.5%) |
| 85 Years and over | 105 (1.7%) | 198 (3.5%) |
| Total | 6,165 (100.0%) | 5,665 (100.0%) |
Families and Households in Valley County
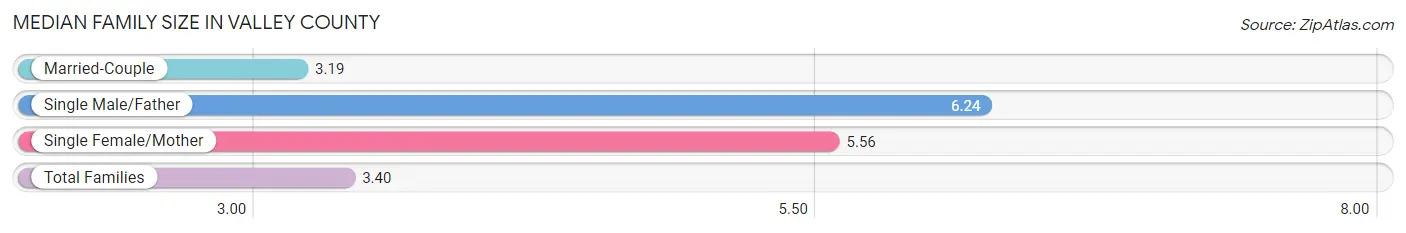
Median Family Size in Valley County
The median family size in Valley County is 3.40 persons per family, with single male/father families (94 | 3.6%) accounting for the largest median family size of 6.24 persons per family. On the other hand, married-couple families (2,394 | 92.4%) represent the smallest median family size with 3.19 persons per family.
| Family Type | # Families | Family Size |
| Married-Couple | 2,394 (92.4%) | 3.19 |
| Single Male/Father | 94 (3.6%) | 6.24 |
| Single Female/Mother | 104 (4.0%) | 5.56 |
| Total Families | 2,592 (100.0%) | 3.40 |
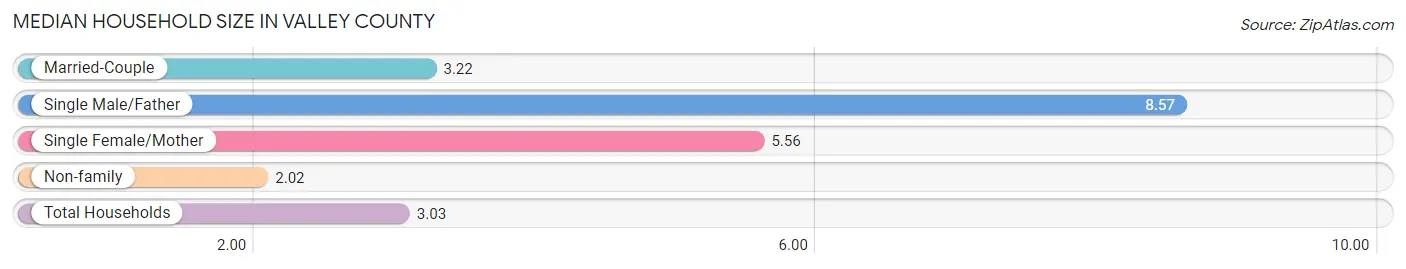
Median Household Size in Valley County
The median household size in Valley County is 3.03 persons per household, with single male/father households (94 | 2.5%) accounting for the largest median household size of 8.57 persons per household. non-family households (1,214 | 31.9%) represent the smallest median household size with 2.02 persons per household.
| Household Type | # Households | Household Size |
| Married-Couple | 2,394 (62.9%) | 3.22 |
| Single Male/Father | 94 (2.5%) | 8.57 |
| Single Female/Mother | 104 (2.7%) | 5.56 |
| Non-family | 1,214 (31.9%) | 2.02 |
| Total Households | 3,806 (100.0%) | 3.03 |
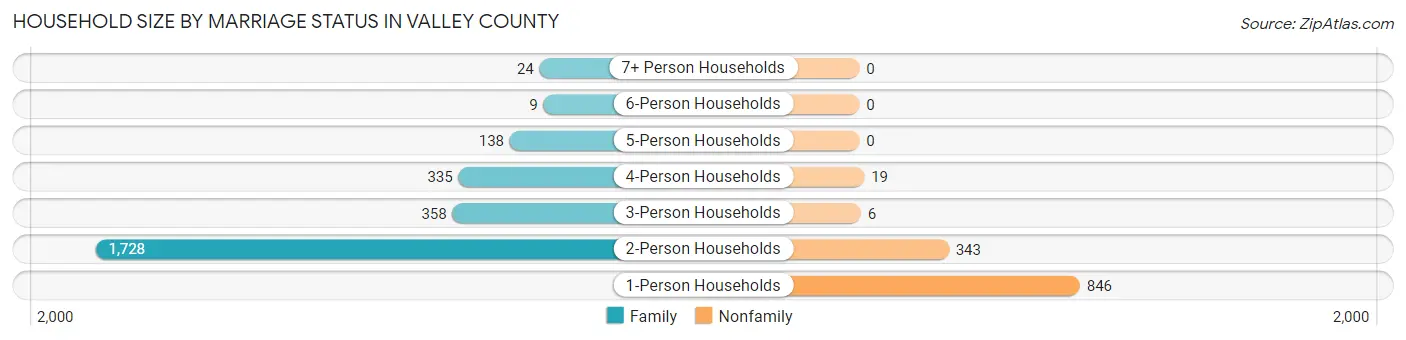
Household Size by Marriage Status in Valley County
Out of a total of 3,806 households in Valley County, 2,592 (68.1%) are family households, while 1,214 (31.9%) are nonfamily households. The most numerous type of family households are 2-person households, comprising 1,728, and the most common type of nonfamily households are 1-person households, comprising 846.
| Household Size | Family Households | Nonfamily Households |
| 1-Person Households | - | 846 (22.2%) |
| 2-Person Households | 1,728 (45.4%) | 343 (9.0%) |
| 3-Person Households | 358 (9.4%) | 6 (0.2%) |
| 4-Person Households | 335 (8.8%) | 19 (0.5%) |
| 5-Person Households | 138 (3.6%) | 0 (0.0%) |
| 6-Person Households | 9 (0.2%) | 0 (0.0%) |
| 7+ Person Households | 24 (0.6%) | 0 (0.0%) |
| Total | 2,592 (68.1%) | 1,214 (31.9%) |
Female Fertility in Valley County
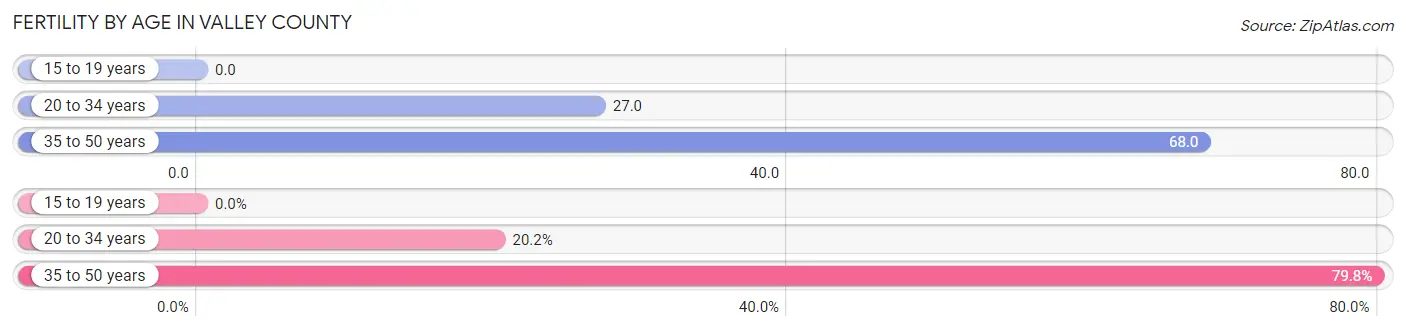
Fertility by Age in Valley County
Average fertility rate in Valley County is 46.0 births per 1,000 women. Women in the age bracket of 35 to 50 years have the highest fertility rate with 68.0 births per 1,000 women. Women in the age bracket of 35 to 50 years acount for 79.8% of all women with births.
| Age Bracket | Women with Births | Births / 1,000 Women |
| 15 to 19 years | 0 (0.0%) | 0.0 |
| 20 to 34 years | 21 (20.2%) | 27.0 |
| 35 to 50 years | 83 (79.8%) | 68.0 |
| Total | 104 (100.0%) | 46.0 |
Fertility by Age by Marriage Status in Valley County
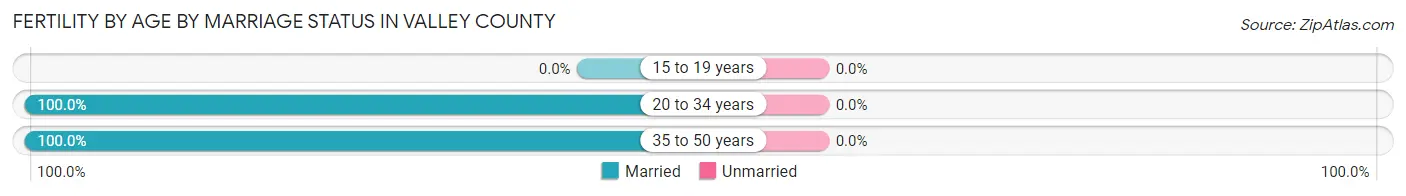
| Age Bracket | Married | Unmarried |
| 15 to 19 years | 0 (0.0%) | 0 (0.0%) |
| 20 to 34 years | 21 (100.0%) | 0 (0.0%) |
| 35 to 50 years | 83 (100.0%) | 0 (0.0%) |
| Total | 104 (100.0%) | 0 (0.0%) |
Fertility by Education in Valley County
Average fertility rate in Valley County is 46.0 births per 1,000 women. Women with the education attainment of bachelor's degree have the highest fertility rate of 103.0 births per 1,000 women, while women with the education attainment of college or associate's degree have the lowest fertility at 4.0 births per 1,000 women. Women with the education attainment of bachelor's degree represent 79.8% of all women with births.
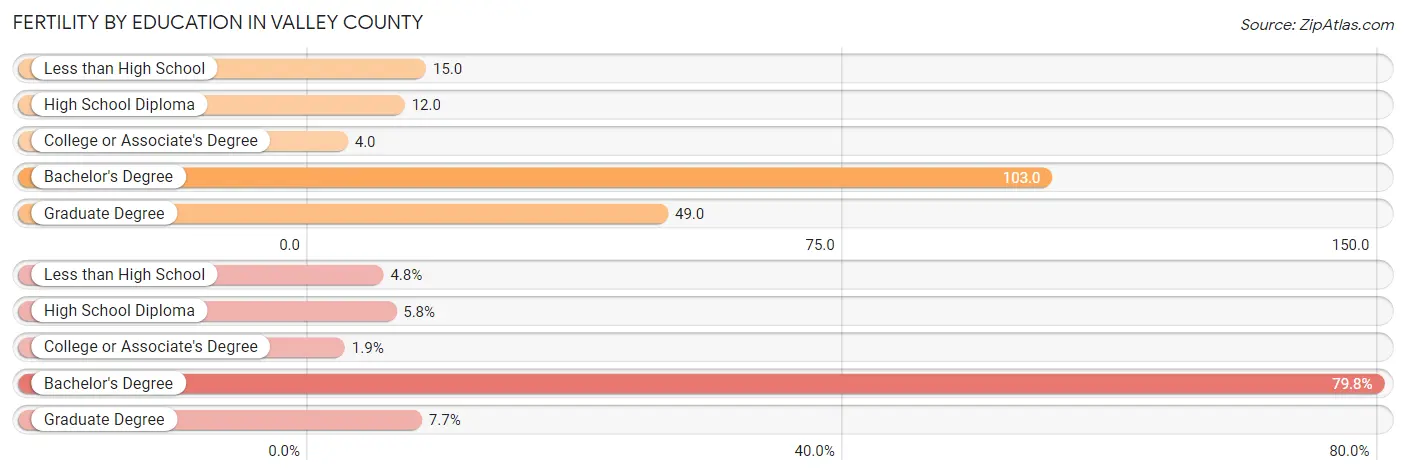
| Educational Attainment | Women with Births | Births / 1,000 Women |
| Less than High School | 5 (4.8%) | 15.0 |
| High School Diploma | 6 (5.8%) | 12.0 |
| College or Associate's Degree | 2 (1.9%) | 4.0 |
| Bachelor's Degree | 83 (79.8%) | 103.0 |
| Graduate Degree | 8 (7.7%) | 49.0 |
| Total | 104 (100.0%) | 46.0 |
Fertility by Education by Marriage Status in Valley County
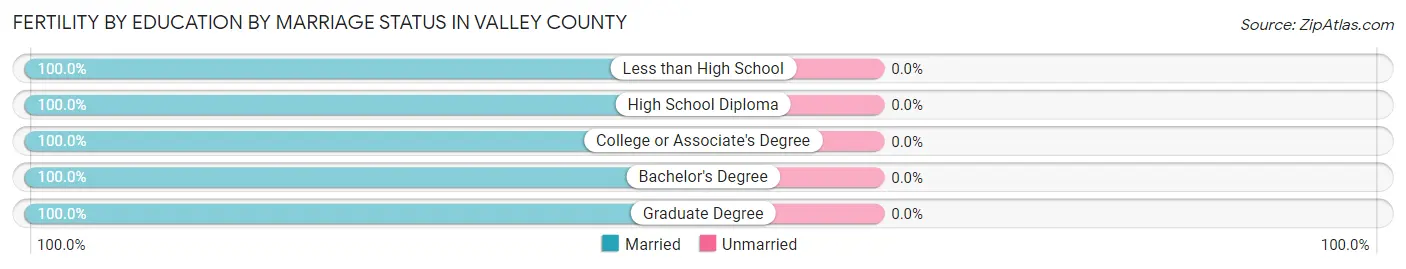
| Educational Attainment | Married | Unmarried |
| Less than High School | 5 (100.0%) | 0 (0.0%) |
| High School Diploma | 6 (100.0%) | 0 (0.0%) |
| College or Associate's Degree | 2 (100.0%) | 0 (0.0%) |
| Bachelor's Degree | 83 (100.0%) | 0 (0.0%) |
| Graduate Degree | 8 (100.0%) | 0 (0.0%) |
| Total | 104 (100.0%) | 0 (0.0%) |
Income in Valley County
Income Overview in Valley County
Per Capita Income in Valley County is $34,544, while median incomes of families and households are $87,595 and $72,878 respectively.
| Characteristic | Number | Measure |
| Per Capita Income | 11,830 | $34,544 |
| Median Family Income | 2,592 | $87,595 |
| Mean Family Income | 2,592 | $111,137 |
| Median Household Income | 3,806 | $72,878 |
| Mean Household Income | 3,806 | $95,069 |
| Income Deficit | 2,592 | $0 |
| Wage / Income Gap (%) | 11,830 | 45.35% |
| Wage / Income Gap ($) | 11,830 | 54.65¢ per $1 |
| Gini / Inequality Index | 11,830 | 0.47 |
Earnings by Sex in Valley County
Average Earnings in Valley County are $30,240, $39,326 for men and $21,492 for women, a difference of 45.4%.
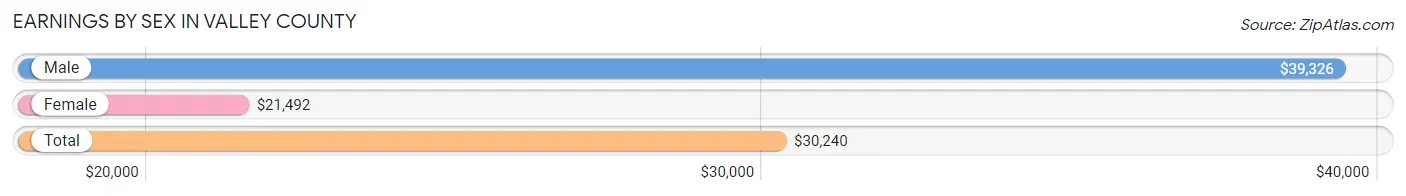
| Sex | Number | Average Earnings |
| Male | 3,007 (54.1%) | $39,326 |
| Female | 2,549 (45.9%) | $21,492 |
| Total | 5,556 (100.0%) | $30,240 |
Earnings by Sex by Income Bracket in Valley County
The most common earnings brackets in Valley County are $100,000+ for men (454 | 15.1%) and $12,500 to $14,999 for women (309 | 12.1%).
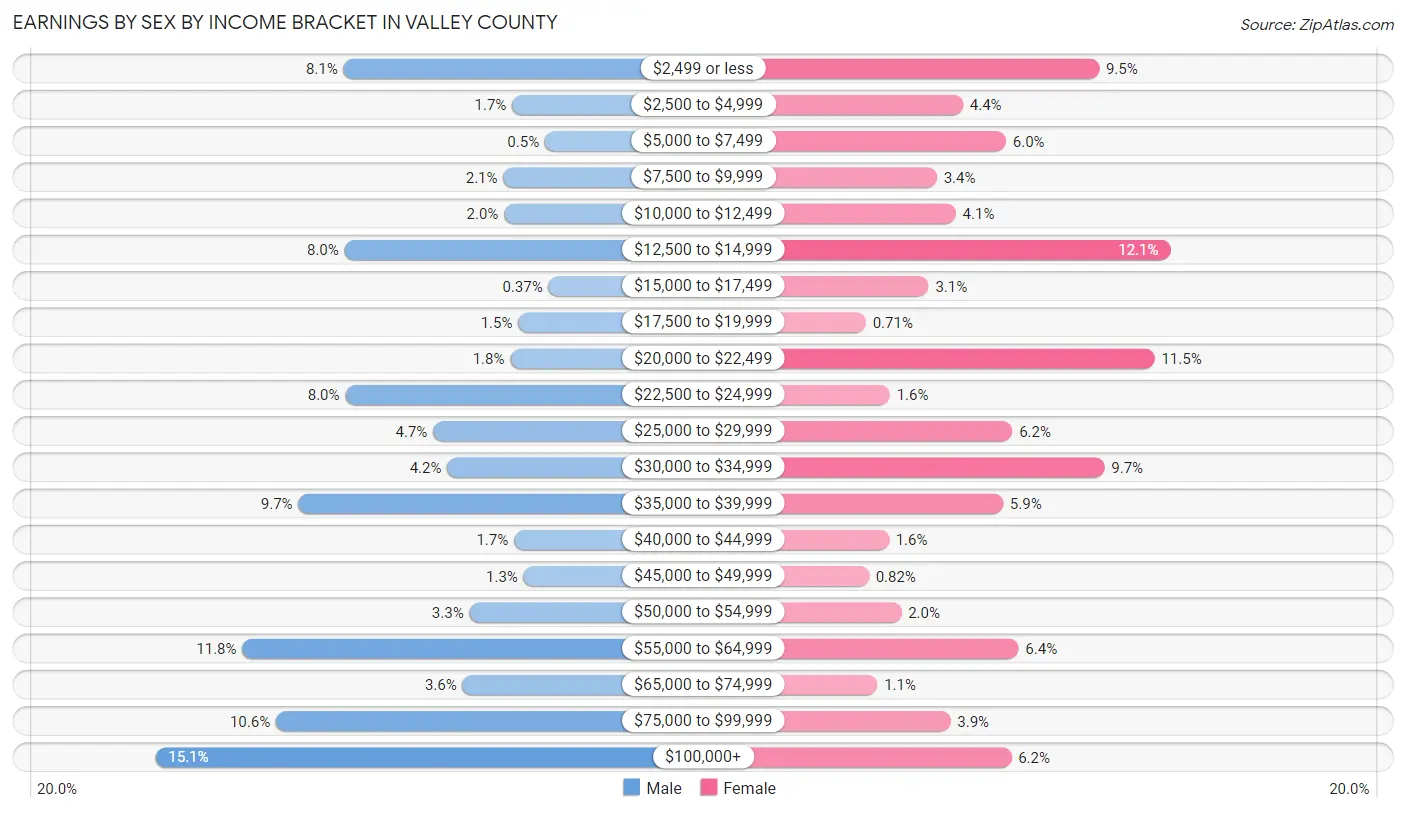
| Income | Male | Female |
| $2,499 or less | 242 (8.1%) | 241 (9.5%) |
| $2,500 to $4,999 | 52 (1.7%) | 111 (4.3%) |
| $5,000 to $7,499 | 15 (0.5%) | 152 (6.0%) |
| $7,500 to $9,999 | 62 (2.1%) | 86 (3.4%) |
| $10,000 to $12,499 | 61 (2.0%) | 104 (4.1%) |
| $12,500 to $14,999 | 241 (8.0%) | 309 (12.1%) |
| $15,000 to $17,499 | 11 (0.4%) | 78 (3.1%) |
| $17,500 to $19,999 | 45 (1.5%) | 18 (0.7%) |
| $20,000 to $22,499 | 54 (1.8%) | 294 (11.5%) |
| $22,500 to $24,999 | 240 (8.0%) | 41 (1.6%) |
| $25,000 to $29,999 | 141 (4.7%) | 158 (6.2%) |
| $30,000 to $34,999 | 125 (4.2%) | 246 (9.7%) |
| $35,000 to $39,999 | 293 (9.7%) | 149 (5.9%) |
| $40,000 to $44,999 | 50 (1.7%) | 40 (1.6%) |
| $45,000 to $49,999 | 39 (1.3%) | 21 (0.8%) |
| $50,000 to $54,999 | 100 (3.3%) | 52 (2.0%) |
| $55,000 to $64,999 | 356 (11.8%) | 164 (6.4%) |
| $65,000 to $74,999 | 108 (3.6%) | 29 (1.1%) |
| $75,000 to $99,999 | 318 (10.6%) | 99 (3.9%) |
| $100,000+ | 454 (15.1%) | 157 (6.2%) |
| Total | 3,007 (100.0%) | 2,549 (100.0%) |
Earnings by Sex by Educational Attainment in Valley County
Average earnings in Valley County are $39,884 for men and $21,730 for women, a difference of 45.5%. Men with an educational attainment of graduate degree enjoy the highest average annual earnings of $75,000, while those with college or associate's degree education earn the least with $37,960. Women with an educational attainment of graduate degree earn the most with the average annual earnings of $75,568, while those with bachelor's degree education have the smallest earnings of $20,515.
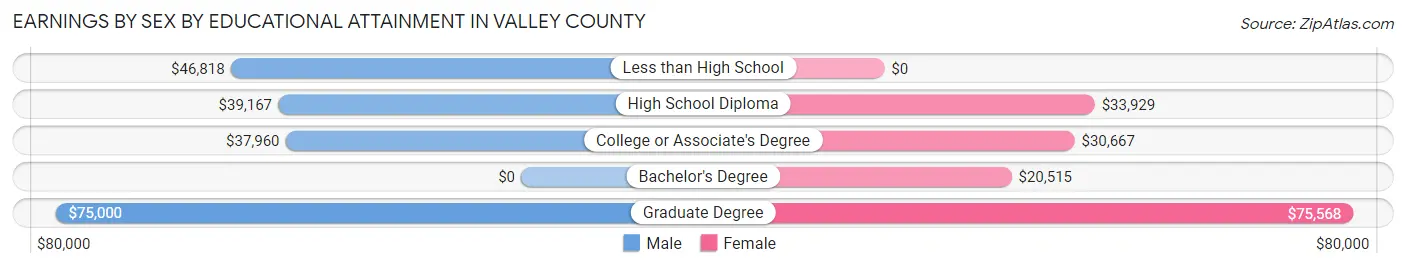
| Educational Attainment | Male Income | Female Income |
| Less than High School | $46,818 | $0 |
| High School Diploma | $39,167 | $33,929 |
| College or Associate's Degree | $37,960 | $30,667 |
| Bachelor's Degree | - | - |
| Graduate Degree | $75,000 | $75,568 |
| Total | $39,884 | $21,730 |
Family Income in Valley County
Family Income Brackets in Valley County
According to the Valley County family income data, there are 461 families falling into the $100,000 to $149,999 income range, which is the most common income bracket and makes up 17.8% of all families. Conversely, the $10,000 to $14,999 income bracket is the least frequent group with only 18 families (0.7%) belonging to this category.
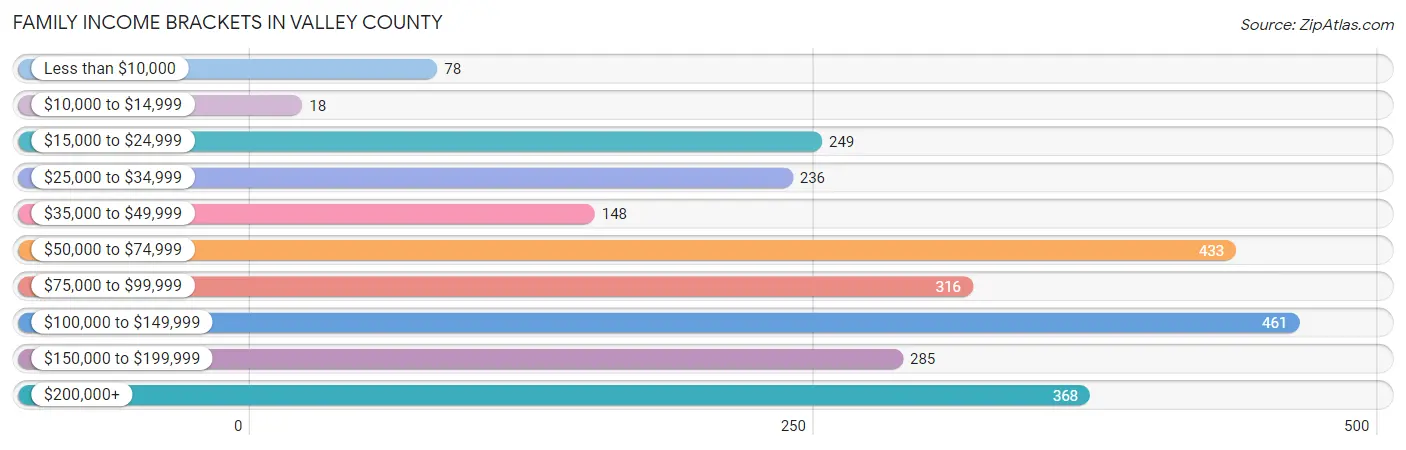
| Income Bracket | # Families | % Families |
| Less than $10,000 | 78 | 3.0% |
| $10,000 to $14,999 | 18 | 0.7% |
| $15,000 to $24,999 | 249 | 9.6% |
| $25,000 to $34,999 | 236 | 9.1% |
| $35,000 to $49,999 | 148 | 5.7% |
| $50,000 to $74,999 | 433 | 16.7% |
| $75,000 to $99,999 | 316 | 12.2% |
| $100,000 to $149,999 | 461 | 17.8% |
| $150,000 to $199,999 | 285 | 11.0% |
| $200,000+ | 368 | 14.2% |
Family Income by Famaliy Size in Valley County
3-person families (360 | 13.9%) account for the highest median family income in Valley County with $170,417 per family, while 3-person families (360 | 13.9%) have the highest median income of $56,806 per family member.
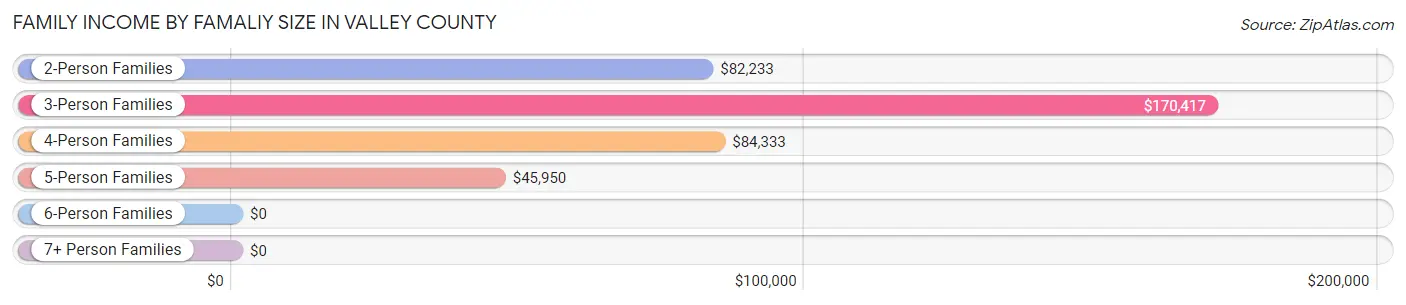
| Income Bracket | # Families | Median Income |
| 2-Person Families | 1,760 (67.9%) | $82,233 |
| 3-Person Families | 360 (13.9%) | $170,417 |
| 4-Person Families | 320 (12.3%) | $84,333 |
| 5-Person Families | 119 (4.6%) | $45,950 |
| 6-Person Families | 9 (0.4%) | $0 |
| 7+ Person Families | 24 (0.9%) | $0 |
| Total | 2,592 (100.0%) | $87,595 |
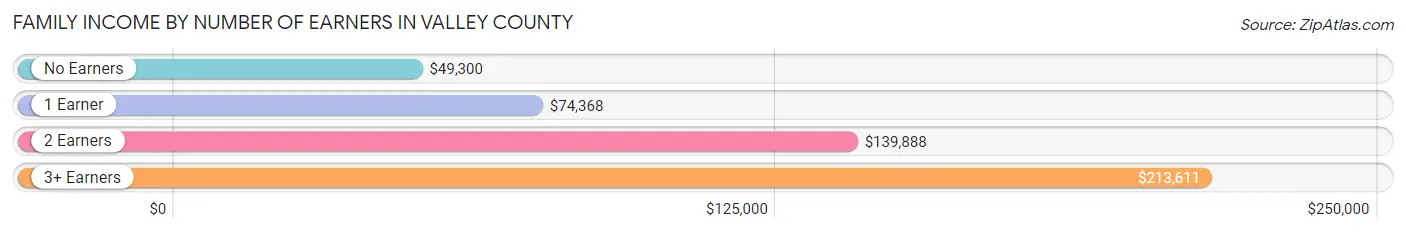
Family Income by Number of Earners in Valley County
The median family income in Valley County is $87,595, with families comprising 3+ earners (116) having the highest median family income of $213,611, while families with no earners (924) have the lowest median family income of $49,300, accounting for 4.5% and 35.6% of families, respectively.
| Number of Earners | # Families | Median Income |
| No Earners | 924 (35.6%) | $49,300 |
| 1 Earner | 714 (27.6%) | $74,368 |
| 2 Earners | 838 (32.3%) | $139,888 |
| 3+ Earners | 116 (4.5%) | $213,611 |
| Total | 2,592 (100.0%) | $87,595 |
Household Income in Valley County
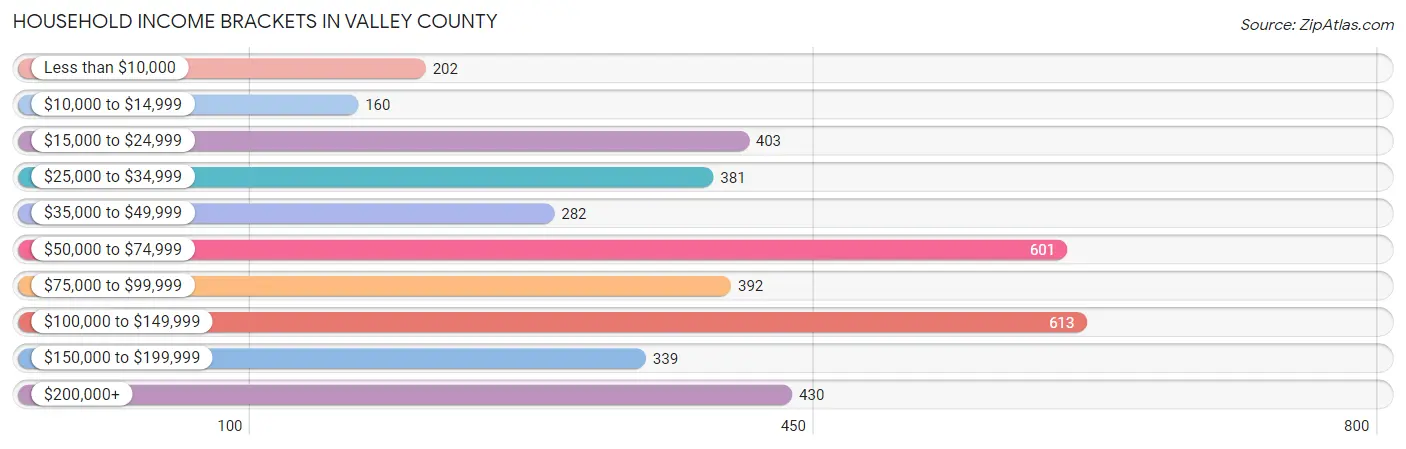
Household Income Brackets in Valley County
With 613 households falling in the category, the $100,000 to $149,999 income range is the most frequent in Valley County, accounting for 16.1% of all households. In contrast, only 160 households (4.2%) fall into the $10,000 to $14,999 income bracket, making it the least populous group.
| Income Bracket | # Households | % Households |
| Less than $10,000 | 202 | 5.3% |
| $10,000 to $14,999 | 160 | 4.2% |
| $15,000 to $24,999 | 403 | 10.6% |
| $25,000 to $34,999 | 381 | 10.0% |
| $35,000 to $49,999 | 282 | 7.4% |
| $50,000 to $74,999 | 601 | 15.8% |
| $75,000 to $99,999 | 392 | 10.3% |
| $100,000 to $149,999 | 613 | 16.1% |
| $150,000 to $199,999 | 339 | 8.9% |
| $200,000+ | 430 | 11.3% |
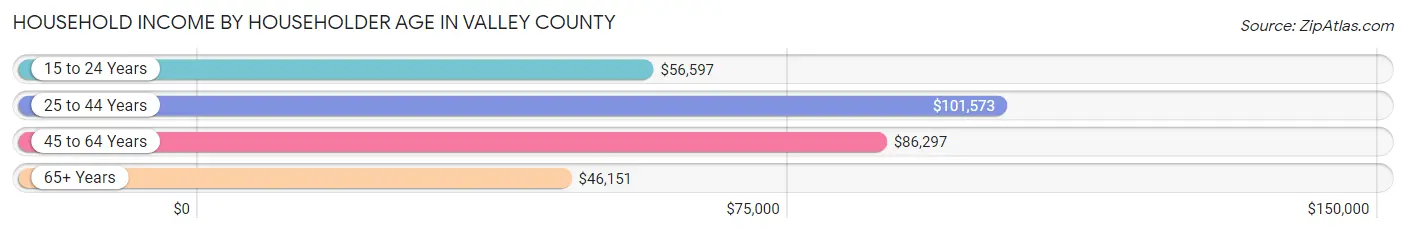
Household Income by Householder Age in Valley County
The median household income in Valley County is $72,878, with the highest median household income of $101,573 found in the 25 to 44 years age bracket for the primary householder. A total of 785 households (20.6%) fall into this category. Meanwhile, the 65+ years age bracket for the primary householder has the lowest median household income of $46,151, with 1,921 households (50.5%) in this group.
| Income Bracket | # Households | Median Income |
| 15 to 24 Years | 25 (0.7%) | $56,597 |
| 25 to 44 Years | 785 (20.6%) | $101,573 |
| 45 to 64 Years | 1,075 (28.2%) | $86,297 |
| 65+ Years | 1,921 (50.5%) | $46,151 |
| Total | 3,806 (100.0%) | $72,878 |
Poverty in Valley County
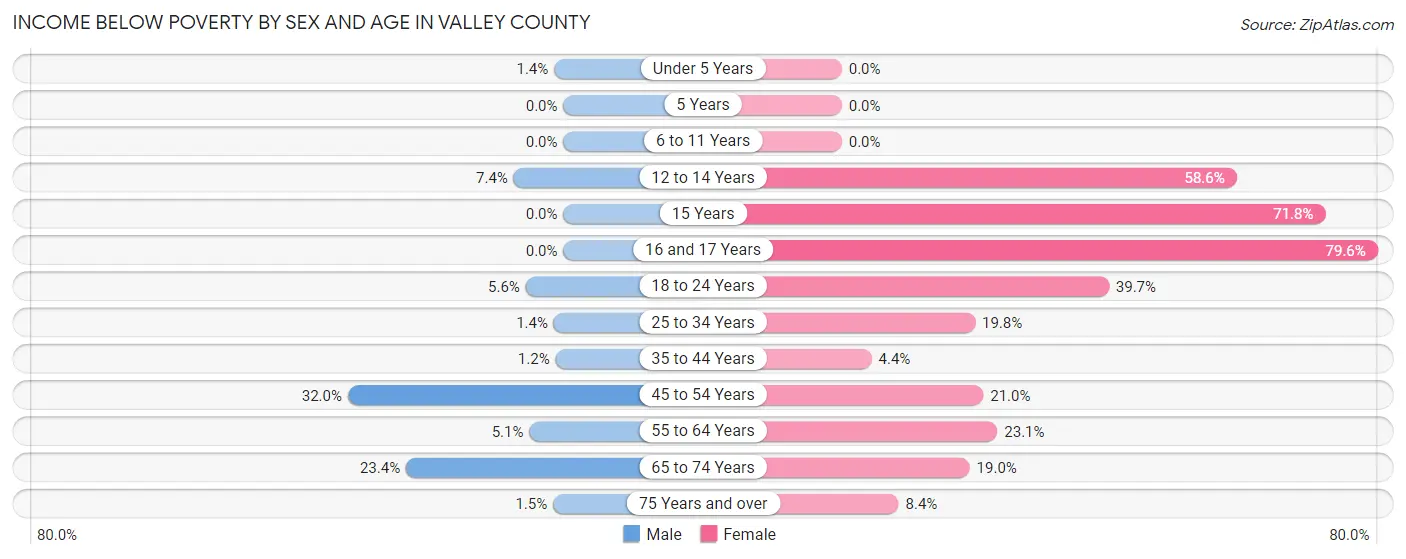
Income Below Poverty by Sex and Age in Valley County
With 9.2% poverty level for males and 19.3% for females among the residents of Valley County, 45 to 54 year old males and 16 and 17 year old females are the most vulnerable to poverty, with 178 males (32.0%) and 109 females (79.6%) in their respective age groups living below the poverty level.
| Age Bracket | Male | Female |
| Under 5 Years | 4 (1.4%) | 0 (0.0%) |
| 5 Years | 0 (0.0%) | 0 (0.0%) |
| 6 to 11 Years | 0 (0.0%) | 0 (0.0%) |
| 12 to 14 Years | 16 (7.4%) | 143 (58.6%) |
| 15 Years | 0 (0.0%) | 28 (71.8%) |
| 16 and 17 Years | 0 (0.0%) | 109 (79.6%) |
| 18 to 24 Years | 17 (5.6%) | 23 (39.7%) |
| 25 to 34 Years | 8 (1.4%) | 146 (19.8%) |
| 35 to 44 Years | 11 (1.2%) | 31 (4.4%) |
| 45 to 54 Years | 178 (32.0%) | 150 (21.0%) |
| 55 to 64 Years | 48 (5.1%) | 222 (23.1%) |
| 65 to 74 Years | 268 (23.4%) | 180 (19.0%) |
| 75 Years and over | 8 (1.5%) | 38 (8.4%) |
| Total | 558 (9.2%) | 1,070 (19.3%) |
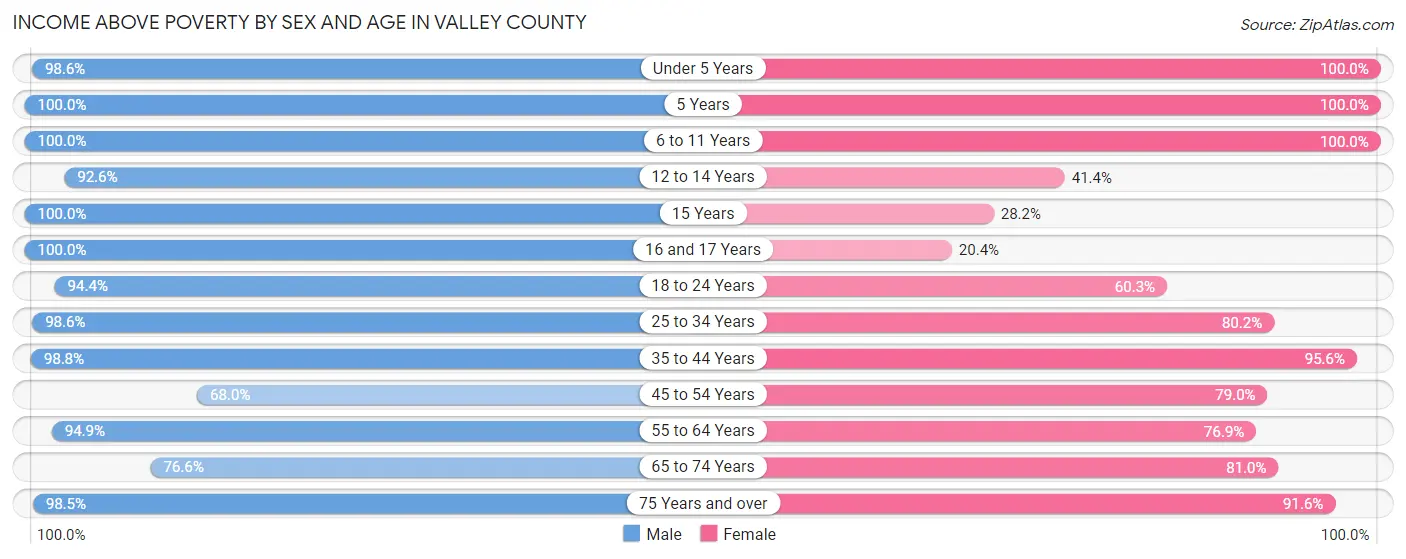
Income Above Poverty by Sex and Age in Valley County
According to the poverty statistics in Valley County, males aged 5 years and females aged under 5 years are the age groups that are most secure financially, with 100.0% of males and 100.0% of females in these age groups living above the poverty line.
| Age Bracket | Male | Female |
| Under 5 Years | 288 (98.6%) | 212 (100.0%) |
| 5 Years | 35 (100.0%) | 11 (100.0%) |
| 6 to 11 Years | 377 (100.0%) | 343 (100.0%) |
| 12 to 14 Years | 201 (92.6%) | 101 (41.4%) |
| 15 Years | 76 (100.0%) | 11 (28.2%) |
| 16 and 17 Years | 100 (100.0%) | 28 (20.4%) |
| 18 to 24 Years | 287 (94.4%) | 35 (60.3%) |
| 25 to 34 Years | 557 (98.6%) | 592 (80.2%) |
| 35 to 44 Years | 929 (98.8%) | 670 (95.6%) |
| 45 to 54 Years | 378 (68.0%) | 564 (79.0%) |
| 55 to 64 Years | 901 (94.9%) | 739 (76.9%) |
| 65 to 74 Years | 879 (76.6%) | 768 (81.0%) |
| 75 Years and over | 516 (98.5%) | 413 (91.6%) |
| Total | 5,524 (90.8%) | 4,487 (80.7%) |
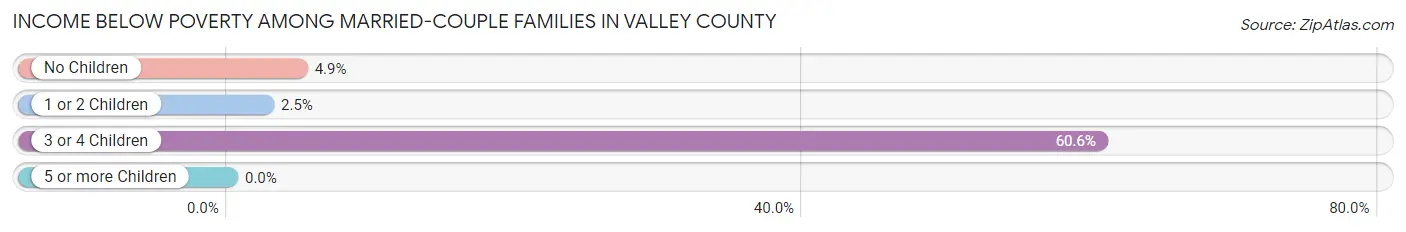
Income Below Poverty Among Married-Couple Families in Valley County
The poverty statistics for married-couple families in Valley County show that 6.0% or 144 of the total 2,394 families live below the poverty line. Families with 3 or 4 children have the highest poverty rate of 60.6%, comprising of 43 families. On the other hand, families with 5 or more children have the lowest poverty rate of 0.0%, which includes 0 families.
| Children | Above Poverty | Below Poverty |
| No Children | 1,746 (95.2%) | 89 (4.9%) |
| 1 or 2 Children | 467 (97.5%) | 12 (2.5%) |
| 3 or 4 Children | 28 (39.4%) | 43 (60.6%) |
| 5 or more Children | 9 (100.0%) | 0 (0.0%) |
| Total | 2,250 (94.0%) | 144 (6.0%) |
Income Below Poverty Among Single-Parent Households in Valley County
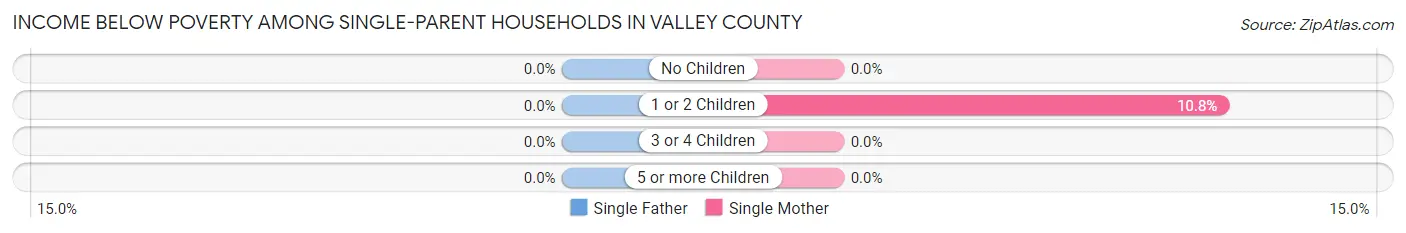
| Children | Single Father | Single Mother |
| No Children | 0 (0.0%) | 0 (0.0%) |
| 1 or 2 Children | 0 (0.0%) | 7 (10.8%) |
| 3 or 4 Children | 0 (0.0%) | 0 (0.0%) |
| 5 or more Children | 0 (0.0%) | 0 (0.0%) |
| Total | 0 (0.0%) | 7 (6.7%) |
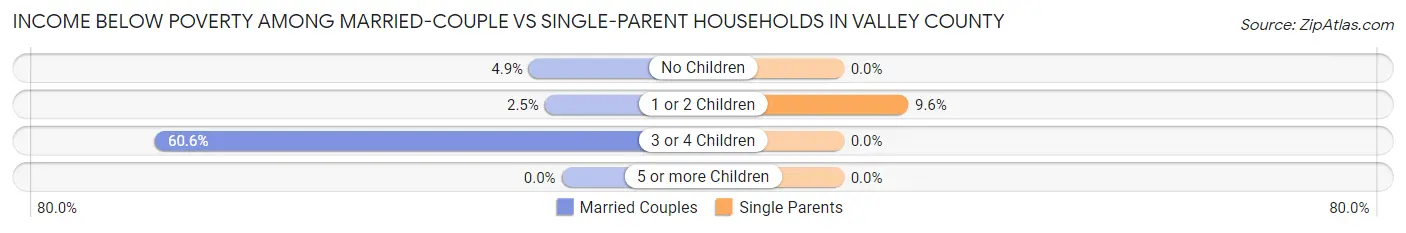
Income Below Poverty Among Married-Couple vs Single-Parent Households in Valley County
The poverty data for Valley County shows that 144 of the married-couple family households (6.0%) and 7 of the single-parent households (3.5%) are living below the poverty level. Within the married-couple family households, those with 3 or 4 children have the highest poverty rate, with 43 households (60.6%) falling below the poverty line. Among the single-parent households, those with 1 or 2 children have the highest poverty rate, with 7 household (9.6%) living below poverty.
| Children | Married-Couple Families | Single-Parent Households |
| No Children | 89 (4.9%) | 0 (0.0%) |
| 1 or 2 Children | 12 (2.5%) | 7 (9.6%) |
| 3 or 4 Children | 43 (60.6%) | 0 (0.0%) |
| 5 or more Children | 0 (0.0%) | 0 (0.0%) |
| Total | 144 (6.0%) | 7 (3.5%) |
Employment Characteristics in Valley County
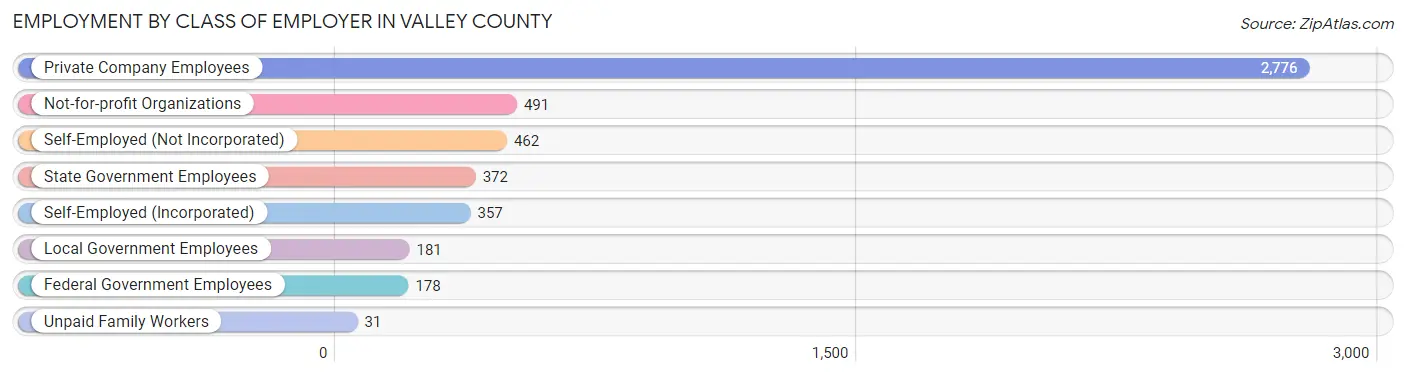
Employment by Class of Employer in Valley County
Among the 4,848 employed individuals in Valley County, private company employees (2,776 | 57.3%), not-for-profit organizations (491 | 10.1%), and self-employed (not incorporated) (462 | 9.5%) make up the most common classes of employment.
| Employer Class | # Employees | % Employees |
| Private Company Employees | 2,776 | 57.3% |
| Self-Employed (Incorporated) | 357 | 7.4% |
| Self-Employed (Not Incorporated) | 462 | 9.5% |
| Not-for-profit Organizations | 491 | 10.1% |
| Local Government Employees | 181 | 3.7% |
| State Government Employees | 372 | 7.7% |
| Federal Government Employees | 178 | 3.7% |
| Unpaid Family Workers | 31 | 0.6% |
| Total | 4,848 | 100.0% |
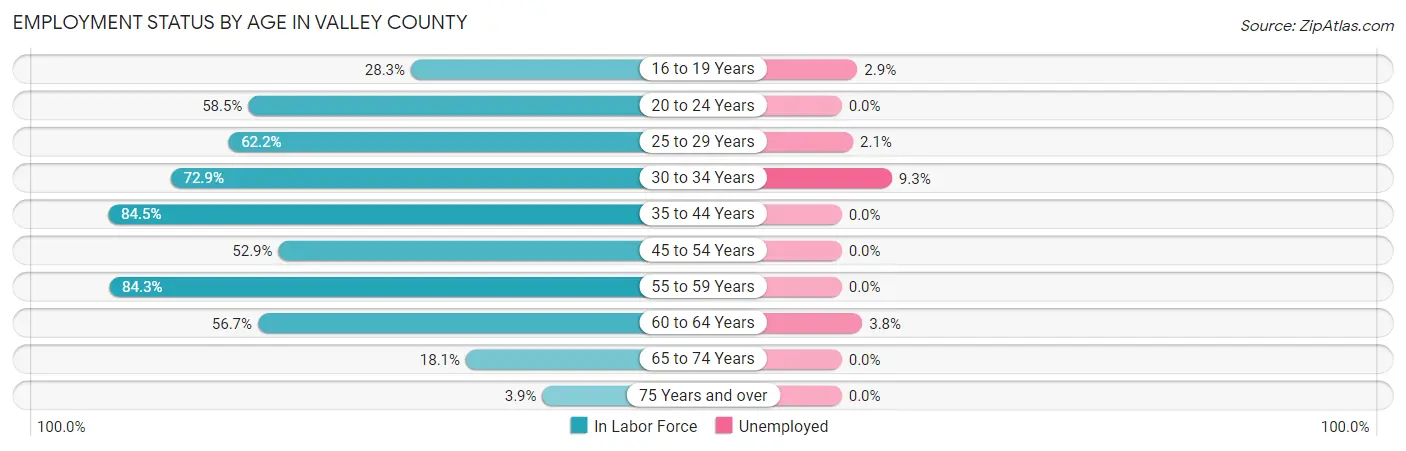
Employment Status by Age in Valley County
According to the labor force statistics for Valley County, out of the total population over 16 years of age (9,976), 50.2% or 5,008 individuals are in the labor force, with 1.5% or 75 of them unemployed. The age group with the highest labor force participation rate is 35 to 44 years, with 84.5% or 1,397 individuals in the labor force. Within the labor force, the 30 to 34 years age range has the highest percentage of unemployed individuals, with 9.3% or 42 of them being unemployed.
| Age Bracket | In Labor Force | Unemployed |
| 16 to 19 Years | 105 (28.3%) | 3 (2.9%) |
| 20 to 24 Years | 189 (58.5%) | 0 (0.0%) |
| 25 to 29 Years | 436 (62.2%) | 9 (2.1%) |
| 30 to 34 Years | 453 (72.9%) | 42 (9.3%) |
| 35 to 44 Years | 1,397 (84.5%) | 0 (0.0%) |
| 45 to 54 Years | 683 (52.9%) | 0 (0.0%) |
| 55 to 59 Years | 751 (84.3%) | 0 (0.0%) |
| 60 to 64 Years | 579 (56.7%) | 22 (3.8%) |
| 65 to 74 Years | 381 (18.1%) | 0 (0.0%) |
| 75 Years and over | 39 (3.9%) | 0 (0.0%) |
| Total | 5,008 (50.2%) | 75 (1.5%) |
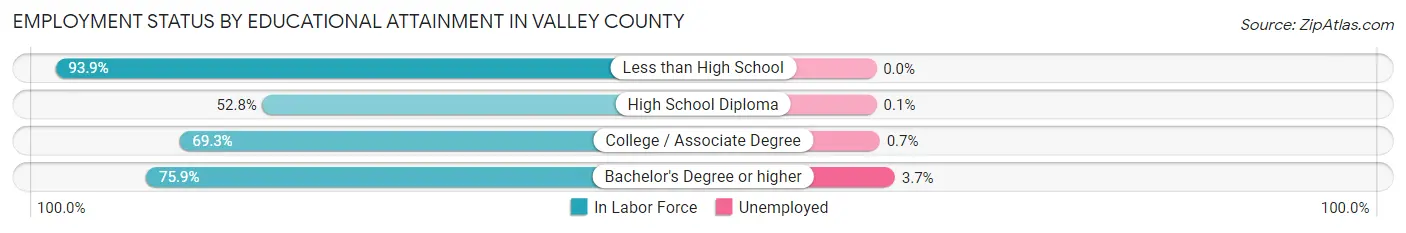
Employment Status by Educational Attainment in Valley County
According to labor force statistics for Valley County, 69.6% of individuals (4,301) out of the total population between 25 and 64 years of age (6,179) are in the labor force, with 1.7% or 73 of them being unemployed. The group with the highest labor force participation rate are those with the educational attainment of less than high school, with 93.9% or 493 individuals in the labor force. Within the labor force, individuals with bachelor's degree or higher education have the highest percentage of unemployment, with 3.7% or 63 of them being unemployed.
| Educational Attainment | In Labor Force | Unemployed |
| Less than High School | 493 (93.9%) | 0 (0.0%) |
| High School Diploma | 840 (52.8%) | 2 (0.1%) |
| College / Associate Degree | 1,261 (69.3%) | 13 (0.7%) |
| Bachelor's Degree or higher | 1,702 (75.9%) | 83 (3.7%) |
| Total | 4,301 (69.6%) | 105 (1.7%) |
Employment Occupations by Sex in Valley County
Management, Business, Science and Arts Occupations
The most common Management, Business, Science and Arts occupations in Valley County are Management (729 | 14.8%), Health Diagnosing & Treating (309 | 6.3%), Business & Financial (307 | 6.2%), Health Technologists (306 | 6.2%), and Community & Social Service (159 | 3.2%).
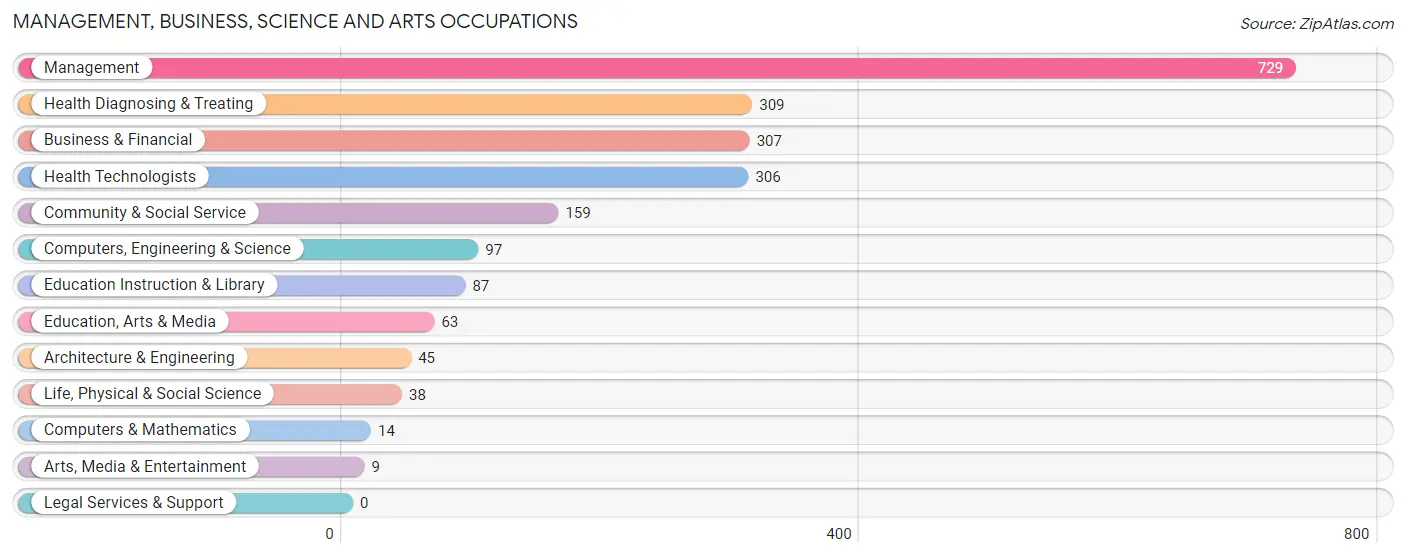
Management, Business, Science and Arts Occupations by Sex
Within the Management, Business, Science and Arts occupations in Valley County, the most male-oriented occupations are Architecture & Engineering (100.0%), Computers & Mathematics (92.9%), and Computers, Engineering & Science (82.5%), while the most female-oriented occupations are Education Instruction & Library (88.5%), Community & Social Service (59.8%), and Business & Financial (58.0%).

| Occupation | Male | Female |
| Management | 452 (62.0%) | 277 (38.0%) |
| Business & Financial | 129 (42.0%) | 178 (58.0%) |
| Computers, Engineering & Science | 80 (82.5%) | 17 (17.5%) |
| Computers & Mathematics | 13 (92.9%) | 1 (7.1%) |
| Architecture & Engineering | 45 (100.0%) | 0 (0.0%) |
| Life, Physical & Social Science | 22 (57.9%) | 16 (42.1%) |
| Community & Social Service | 64 (40.3%) | 95 (59.8%) |
| Education, Arts & Media | 49 (77.8%) | 14 (22.2%) |
| Legal Services & Support | 0 (0.0%) | 0 (0.0%) |
| Education Instruction & Library | 10 (11.5%) | 77 (88.5%) |
| Arts, Media & Entertainment | 5 (55.6%) | 4 (44.4%) |
| Health Diagnosing & Treating | 159 (51.5%) | 150 (48.5%) |
| Health Technologists | 159 (52.0%) | 147 (48.0%) |
| Total (Category) | 884 (55.2%) | 717 (44.8%) |
| Total (Overall) | 2,620 (53.1%) | 2,316 (46.9%) |
Services Occupations
The most common Services occupations in Valley County are Cleaning & Maintenance (312 | 6.3%), Food Preparation & Serving (263 | 5.3%), Healthcare Support (225 | 4.6%), Personal Care & Service (82 | 1.7%), and Security & Protection (38 | 0.8%).

Services Occupations by Sex
Within the Services occupations in Valley County, the most male-oriented occupations are Security & Protection (100.0%), Firefighting & Prevention (100.0%), and Food Preparation & Serving (78.3%), while the most female-oriented occupations are Healthcare Support (100.0%), Personal Care & Service (84.2%), and Cleaning & Maintenance (70.5%).
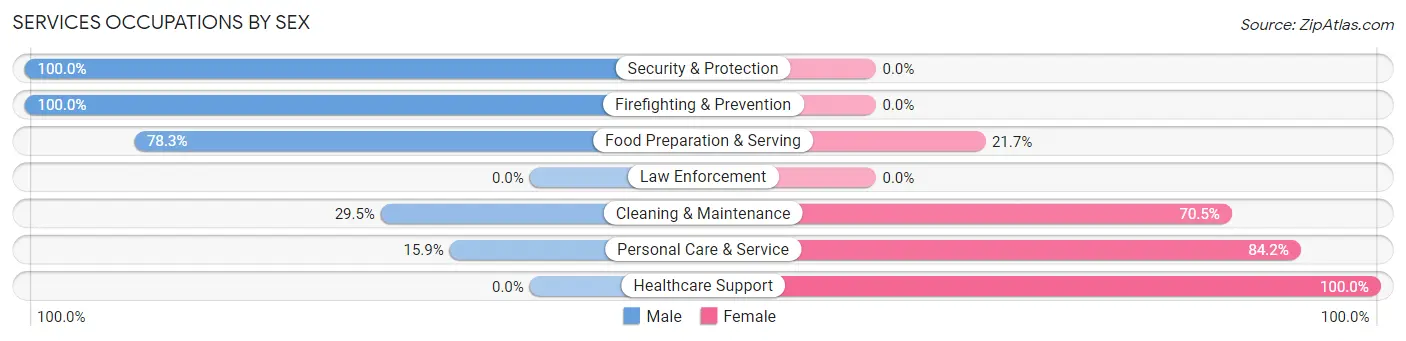
| Occupation | Male | Female |
| Healthcare Support | 0 (0.0%) | 225 (100.0%) |
| Security & Protection | 38 (100.0%) | 0 (0.0%) |
| Firefighting & Prevention | 38 (100.0%) | 0 (0.0%) |
| Law Enforcement | 0 (0.0%) | 0 (0.0%) |
| Food Preparation & Serving | 206 (78.3%) | 57 (21.7%) |
| Cleaning & Maintenance | 92 (29.5%) | 220 (70.5%) |
| Personal Care & Service | 13 (15.9%) | 69 (84.2%) |
| Total (Category) | 349 (37.9%) | 571 (62.1%) |
| Total (Overall) | 2,620 (53.1%) | 2,316 (46.9%) |
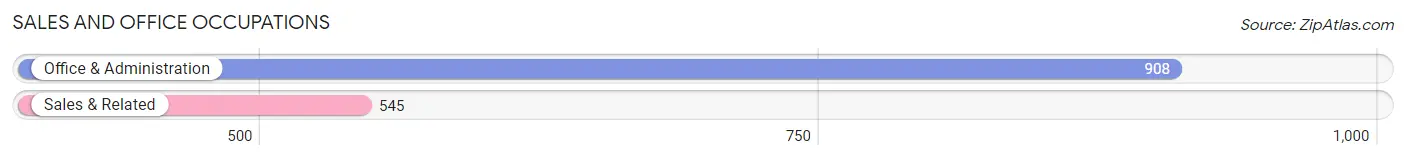
Sales and Office Occupations
The most common Sales and Office occupations in Valley County are Office & Administration (908 | 18.4%), and Sales & Related (545 | 11.0%).
Sales and Office Occupations by Sex
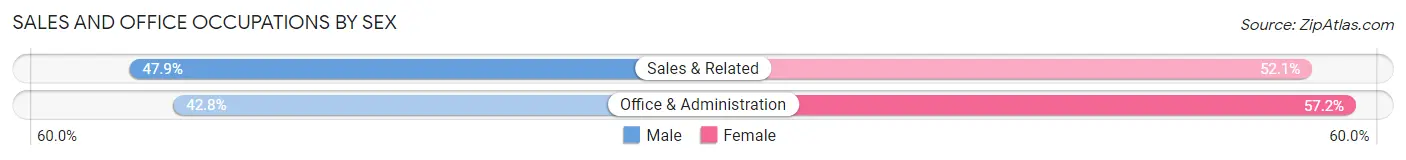
| Occupation | Male | Female |
| Sales & Related | 261 (47.9%) | 284 (52.1%) |
| Office & Administration | 389 (42.8%) | 519 (57.2%) |
| Total (Category) | 650 (44.7%) | 803 (55.3%) |
| Total (Overall) | 2,620 (53.1%) | 2,316 (46.9%) |
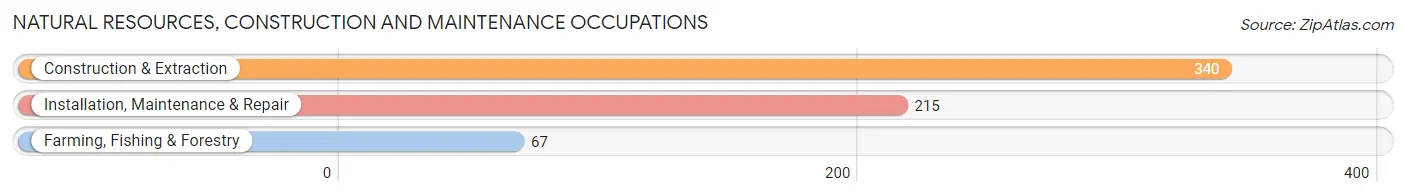
Natural Resources, Construction and Maintenance Occupations
The most common Natural Resources, Construction and Maintenance occupations in Valley County are Construction & Extraction (340 | 6.9%), Installation, Maintenance & Repair (215 | 4.4%), and Farming, Fishing & Forestry (67 | 1.4%).
Natural Resources, Construction and Maintenance Occupations by Sex
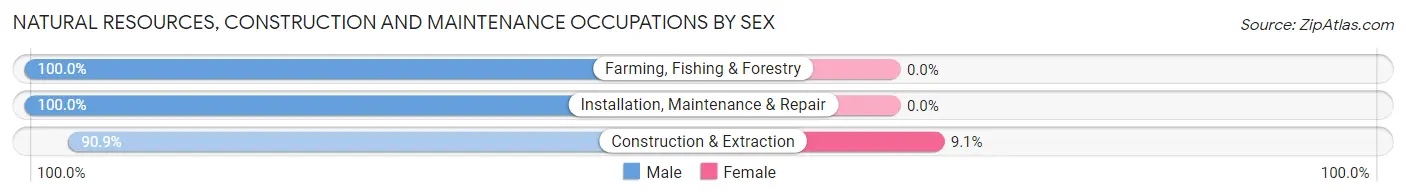
| Occupation | Male | Female |
| Farming, Fishing & Forestry | 67 (100.0%) | 0 (0.0%) |
| Construction & Extraction | 309 (90.9%) | 31 (9.1%) |
| Installation, Maintenance & Repair | 215 (100.0%) | 0 (0.0%) |
| Total (Category) | 591 (95.0%) | 31 (5.0%) |
| Total (Overall) | 2,620 (53.1%) | 2,316 (46.9%) |
Production, Transportation and Moving Occupations
The most common Production, Transportation and Moving occupations in Valley County are Transportation (182 | 3.7%), Production (133 | 2.7%), and Material Moving (25 | 0.5%).
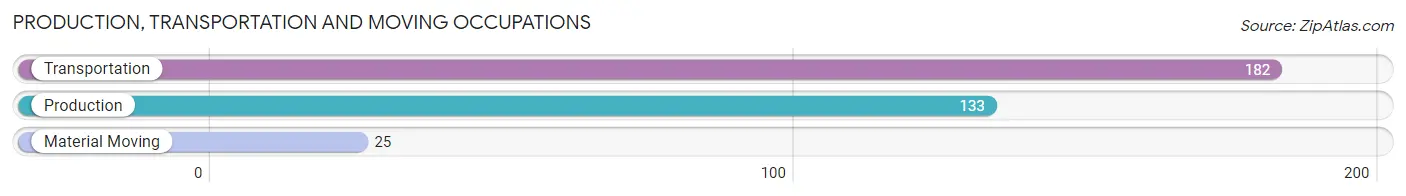
Production, Transportation and Moving Occupations by Sex

| Occupation | Male | Female |
| Production | 31 (23.3%) | 102 (76.7%) |
| Transportation | 95 (52.2%) | 87 (47.8%) |
| Material Moving | 20 (80.0%) | 5 (20.0%) |
| Total (Category) | 146 (42.9%) | 194 (57.1%) |
| Total (Overall) | 2,620 (53.1%) | 2,316 (46.9%) |
Employment Industries by Sex in Valley County
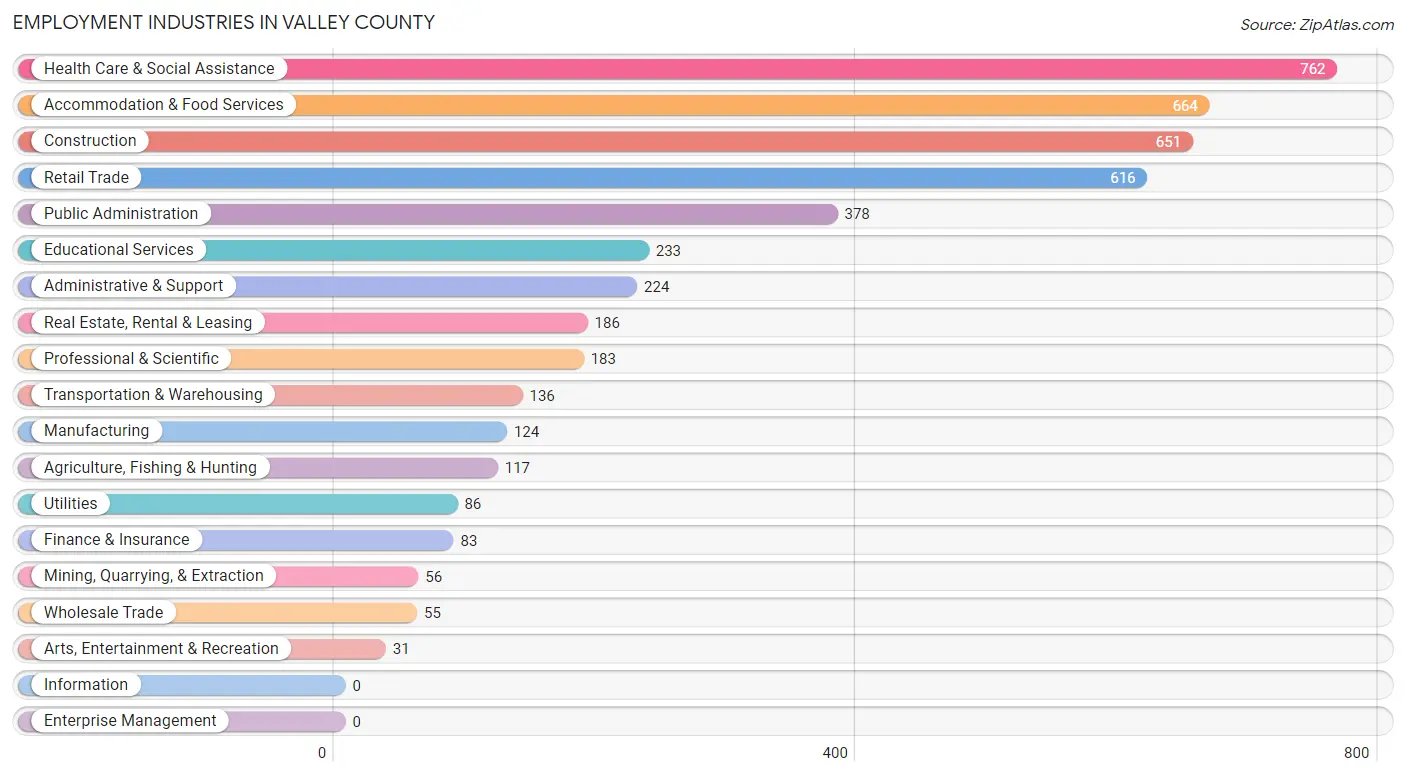
Employment Industries in Valley County
The major employment industries in Valley County include Health Care & Social Assistance (762 | 15.4%), Accommodation & Food Services (664 | 13.5%), Construction (651 | 13.2%), Retail Trade (616 | 12.5%), and Public Administration (378 | 7.7%).
Employment Industries by Sex in Valley County
The Valley County industries that see more men than women are Utilities (100.0%), Agriculture, Fishing & Hunting (99.2%), and Wholesale Trade (89.1%), whereas the industries that tend to have a higher number of women are Real Estate, Rental & Leasing (79.6%), Health Care & Social Assistance (78.5%), and Educational Services (75.5%).
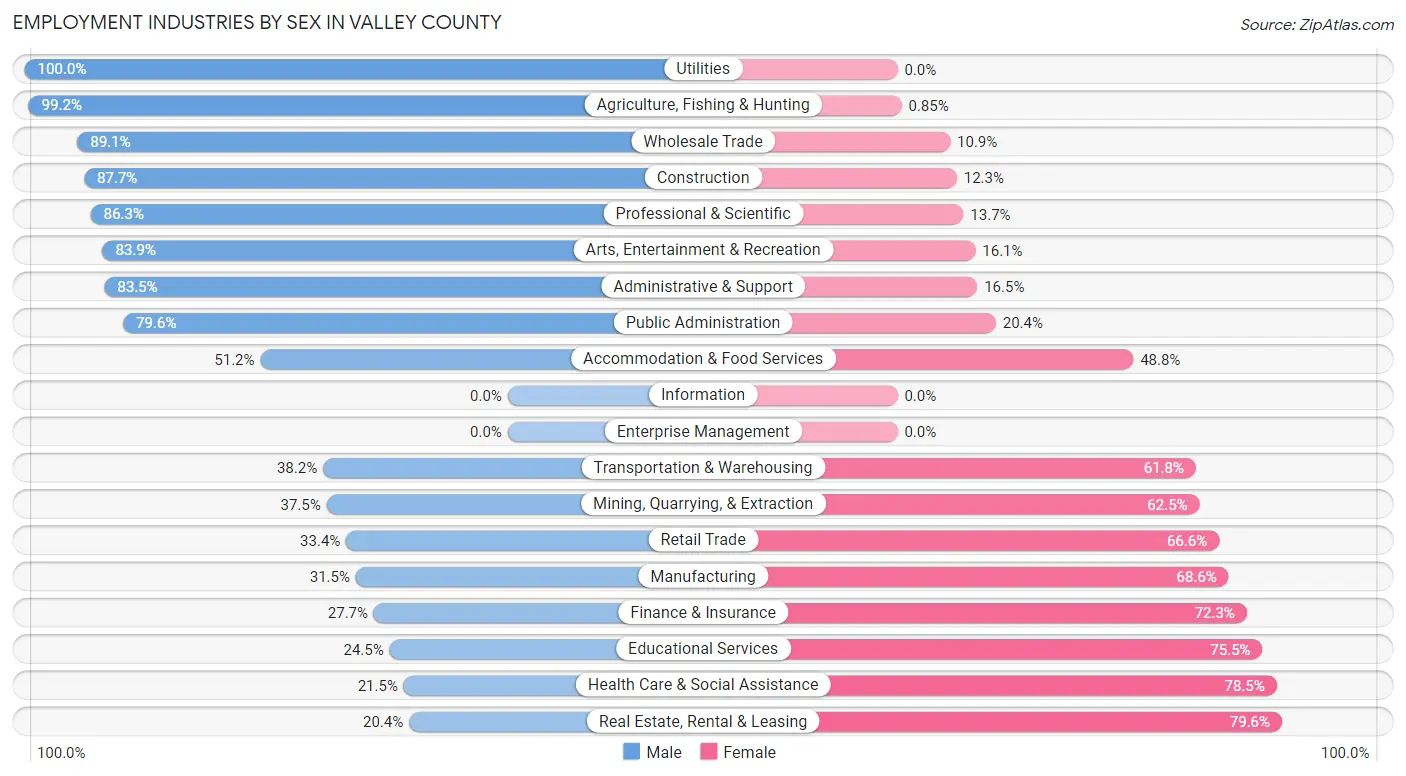
| Industry | Male | Female |
| Agriculture, Fishing & Hunting | 116 (99.2%) | 1 (0.9%) |
| Mining, Quarrying, & Extraction | 21 (37.5%) | 35 (62.5%) |
| Construction | 571 (87.7%) | 80 (12.3%) |
| Manufacturing | 39 (31.5%) | 85 (68.5%) |
| Wholesale Trade | 49 (89.1%) | 6 (10.9%) |
| Retail Trade | 206 (33.4%) | 410 (66.6%) |
| Transportation & Warehousing | 52 (38.2%) | 84 (61.8%) |
| Utilities | 86 (100.0%) | 0 (0.0%) |
| Information | 0 (0.0%) | 0 (0.0%) |
| Finance & Insurance | 23 (27.7%) | 60 (72.3%) |
| Real Estate, Rental & Leasing | 38 (20.4%) | 148 (79.6%) |
| Professional & Scientific | 158 (86.3%) | 25 (13.7%) |
| Enterprise Management | 0 (0.0%) | 0 (0.0%) |
| Administrative & Support | 187 (83.5%) | 37 (16.5%) |
| Educational Services | 57 (24.5%) | 176 (75.5%) |
| Health Care & Social Assistance | 164 (21.5%) | 598 (78.5%) |
| Arts, Entertainment & Recreation | 26 (83.9%) | 5 (16.1%) |
| Accommodation & Food Services | 340 (51.2%) | 324 (48.8%) |
| Public Administration | 301 (79.6%) | 77 (20.4%) |
| Total | 2,620 (53.1%) | 2,316 (46.9%) |
Education in Valley County
School Enrollment in Valley County
The most common levels of schooling among the 1,895 students in Valley County are high school (492 | 26.0%), middle school (485 | 25.6%), and elementary school (418 | 22.1%).
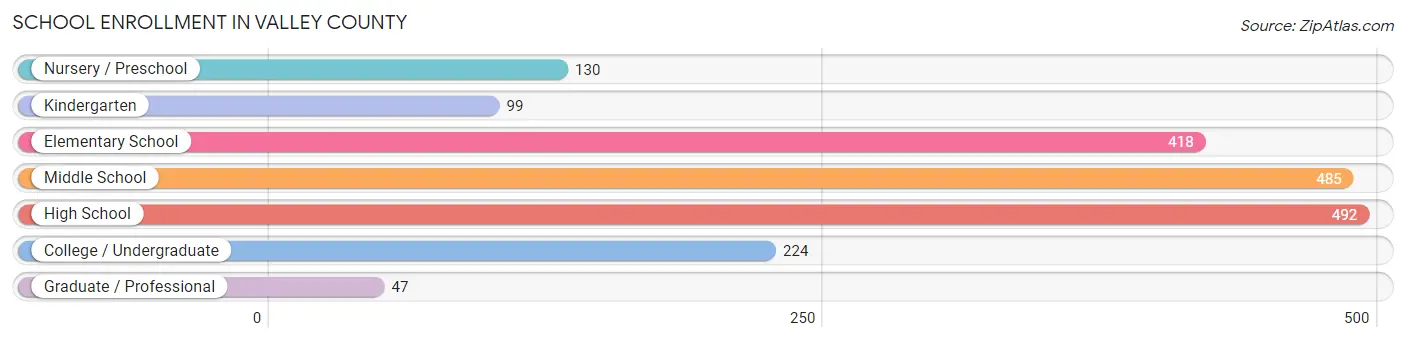
| School Level | # Students | % Students |
| Nursery / Preschool | 130 | 6.9% |
| Kindergarten | 99 | 5.2% |
| Elementary School | 418 | 22.1% |
| Middle School | 485 | 25.6% |
| High School | 492 | 26.0% |
| College / Undergraduate | 224 | 11.8% |
| Graduate / Professional | 47 | 2.5% |
| Total | 1,895 | 100.0% |
School Enrollment by Age by Funding Source in Valley County
Out of a total of 1,895 students who are enrolled in schools in Valley County, 347 (18.3%) attend a private institution, while the remaining 1,548 (81.7%) are enrolled in public schools. The age group of 3 to 4 year olds has the highest likelihood of being enrolled in private schools, with 136 (100.0% in the age bracket) enrolled. Conversely, the age group of 20 to 24 year olds has the lowest likelihood of being enrolled in a private school, with 110 (100.0% in the age bracket) attending a public institution.
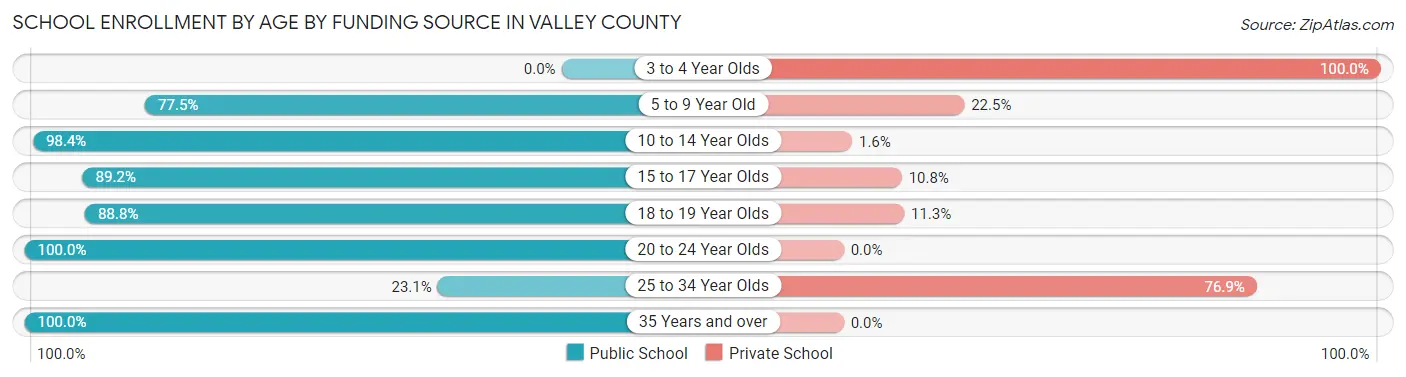
| Age Bracket | Public School | Private School |
| 3 to 4 Year Olds | 0 (0.0%) | 136 (100.0%) |
| 5 to 9 Year Old | 397 (77.5%) | 115 (22.5%) |
| 10 to 14 Year Olds | 629 (98.4%) | 10 (1.6%) |
| 15 to 17 Year Olds | 297 (89.2%) | 36 (10.8%) |
| 18 to 19 Year Olds | 71 (88.7%) | 9 (11.3%) |
| 20 to 24 Year Olds | 110 (100.0%) | 0 (0.0%) |
| 25 to 34 Year Olds | 12 (23.1%) | 40 (76.9%) |
| 35 Years and over | 33 (100.0%) | 0 (0.0%) |
| Total | 1,548 (81.7%) | 347 (18.3%) |
Educational Attainment by Field of Study in Valley County
Business (671 | 19.1%), education (505 | 14.4%), science & technology (395 | 11.3%), liberal arts & history (314 | 8.9%), and bio, nature & agricultural (292 | 8.3%) are the most common fields of study among 3,509 individuals in Valley County who have obtained a bachelor's degree or higher.

| Field of Study | # Graduates | % Graduates |
| Computers & Mathematics | 60 | 1.7% |
| Bio, Nature & Agricultural | 292 | 8.3% |
| Physical & Health Sciences | 284 | 8.1% |
| Psychology | 80 | 2.3% |
| Social Sciences | 108 | 3.1% |
| Engineering | 220 | 6.3% |
| Multidisciplinary Studies | 1 | 0.0% |
| Science & Technology | 395 | 11.3% |
| Business | 671 | 19.1% |
| Education | 505 | 14.4% |
| Literature & Languages | 25 | 0.7% |
| Liberal Arts & History | 314 | 8.9% |
| Visual & Performing Arts | 106 | 3.0% |
| Communications | 175 | 5.0% |
| Arts & Humanities | 273 | 7.8% |
| Total | 3,509 | 100.0% |
Transportation & Commute in Valley County
Vehicle Availability by Sex in Valley County
The most prevalent vehicle ownership categories in Valley County are males with 2 vehicles (1,198, accounting for 48.9%) and females with 2 vehicles (993, making up 52.4%).
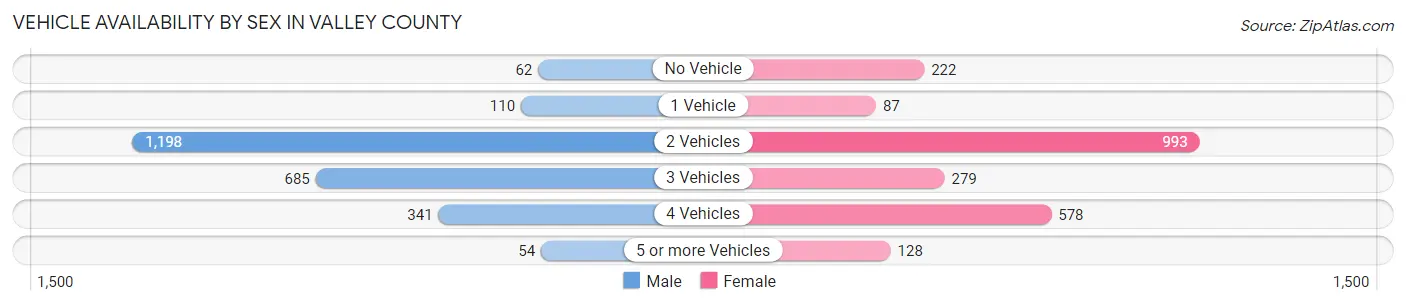
| Vehicles Available | Male | Female |
| No Vehicle | 62 (2.5%) | 222 (9.7%) |
| 1 Vehicle | 110 (4.5%) | 87 (3.8%) |
| 2 Vehicles | 1,198 (48.9%) | 993 (43.4%) |
| 3 Vehicles | 685 (28.0%) | 279 (12.2%) |
| 4 Vehicles | 341 (13.9%) | 578 (25.3%) |
| 5 or more Vehicles | 54 (2.2%) | 128 (5.6%) |
| Total | 2,450 (100.0%) | 2,287 (100.0%) |
Commute Time in Valley County
The most frequently occuring commute durations in Valley County are 5 to 9 minutes (984 commuters, 24.7%), less than 5 minutes (855 commuters, 21.5%), and 15 to 19 minutes (848 commuters, 21.3%).
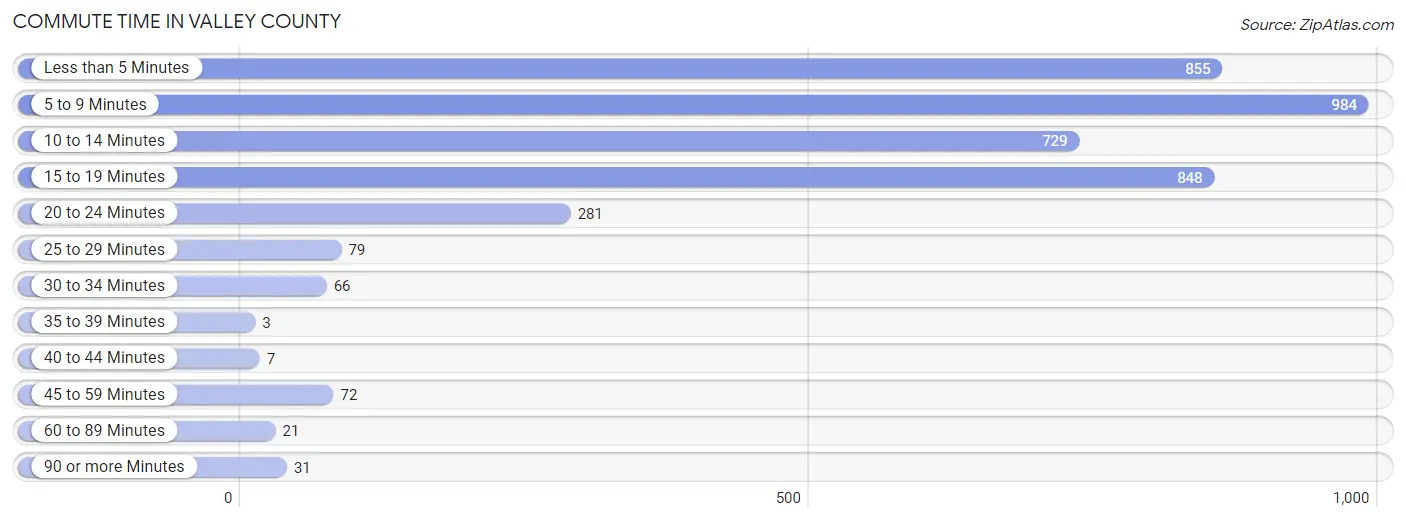
| Commute Time | # Commuters | % Commuters |
| Less than 5 Minutes | 855 | 21.5% |
| 5 to 9 Minutes | 984 | 24.7% |
| 10 to 14 Minutes | 729 | 18.3% |
| 15 to 19 Minutes | 848 | 21.3% |
| 20 to 24 Minutes | 281 | 7.1% |
| 25 to 29 Minutes | 79 | 2.0% |
| 30 to 34 Minutes | 66 | 1.7% |
| 35 to 39 Minutes | 3 | 0.1% |
| 40 to 44 Minutes | 7 | 0.2% |
| 45 to 59 Minutes | 72 | 1.8% |
| 60 to 89 Minutes | 21 | 0.5% |
| 90 or more Minutes | 31 | 0.8% |
Commute Time by Sex in Valley County
The most common commute times in Valley County are 5 to 9 minutes (533 commuters, 28.3%) for males and 15 to 19 minutes (601 commuters, 28.7%) for females.
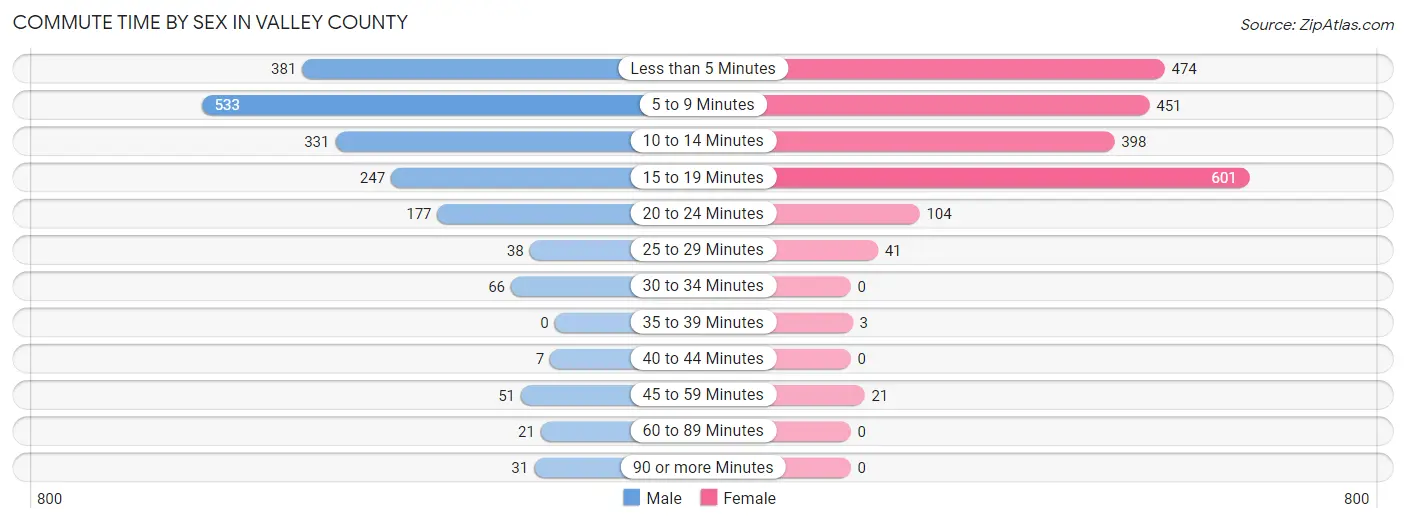
| Commute Time | Male | Female |
| Less than 5 Minutes | 381 (20.2%) | 474 (22.7%) |
| 5 to 9 Minutes | 533 (28.3%) | 451 (21.5%) |
| 10 to 14 Minutes | 331 (17.6%) | 398 (19.0%) |
| 15 to 19 Minutes | 247 (13.1%) | 601 (28.7%) |
| 20 to 24 Minutes | 177 (9.4%) | 104 (5.0%) |
| 25 to 29 Minutes | 38 (2.0%) | 41 (2.0%) |
| 30 to 34 Minutes | 66 (3.5%) | 0 (0.0%) |
| 35 to 39 Minutes | 0 (0.0%) | 3 (0.1%) |
| 40 to 44 Minutes | 7 (0.4%) | 0 (0.0%) |
| 45 to 59 Minutes | 51 (2.7%) | 21 (1.0%) |
| 60 to 89 Minutes | 21 (1.1%) | 0 (0.0%) |
| 90 or more Minutes | 31 (1.7%) | 0 (0.0%) |
Time of Departure to Work by Sex in Valley County
The most frequent times of departure to work in Valley County are 7:00 AM to 7:29 AM (349, 18.5%) for males and 7:30 AM to 7:59 AM (735, 35.1%) for females.

| Time of Departure | Male | Female |
| 12:00 AM to 4:59 AM | 57 (3.0%) | 0 (0.0%) |
| 5:00 AM to 5:29 AM | 28 (1.5%) | 85 (4.1%) |
| 5:30 AM to 5:59 AM | 90 (4.8%) | 17 (0.8%) |
| 6:00 AM to 6:29 AM | 44 (2.3%) | 11 (0.5%) |
| 6:30 AM to 6:59 AM | 216 (11.5%) | 90 (4.3%) |
| 7:00 AM to 7:29 AM | 349 (18.5%) | 228 (10.9%) |
| 7:30 AM to 7:59 AM | 235 (12.5%) | 735 (35.1%) |
| 8:00 AM to 8:29 AM | 311 (16.5%) | 371 (17.7%) |
| 8:30 AM to 8:59 AM | 40 (2.1%) | 79 (3.8%) |
| 9:00 AM to 9:59 AM | 280 (14.9%) | 326 (15.6%) |
| 10:00 AM to 10:59 AM | 59 (3.1%) | 48 (2.3%) |
| 11:00 AM to 11:59 AM | 6 (0.3%) | 35 (1.7%) |
| 12:00 PM to 3:59 PM | 25 (1.3%) | 58 (2.8%) |
| 4:00 PM to 11:59 PM | 143 (7.6%) | 10 (0.5%) |
| Total | 1,883 (100.0%) | 2,093 (100.0%) |
Housing Occupancy in Valley County
Occupancy by Ownership in Valley County
Of the total 3,806 dwellings in Valley County, owner-occupied units account for 3,225 (84.7%), while renter-occupied units make up 581 (15.3%).
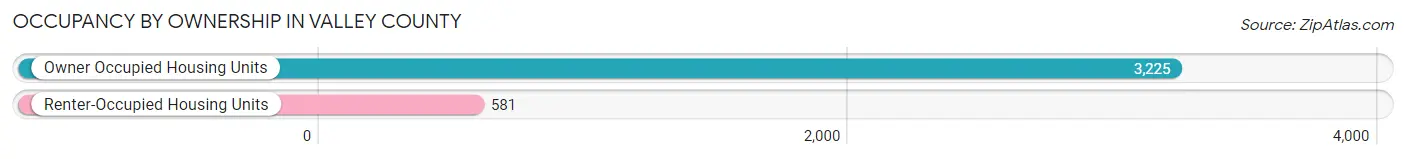
| Occupancy | # Housing Units | % Housing Units |
| Owner Occupied Housing Units | 3,225 | 84.7% |
| Renter-Occupied Housing Units | 581 | 15.3% |
| Total Occupied Housing Units | 3,806 | 100.0% |
Occupancy by Household Size in Valley County
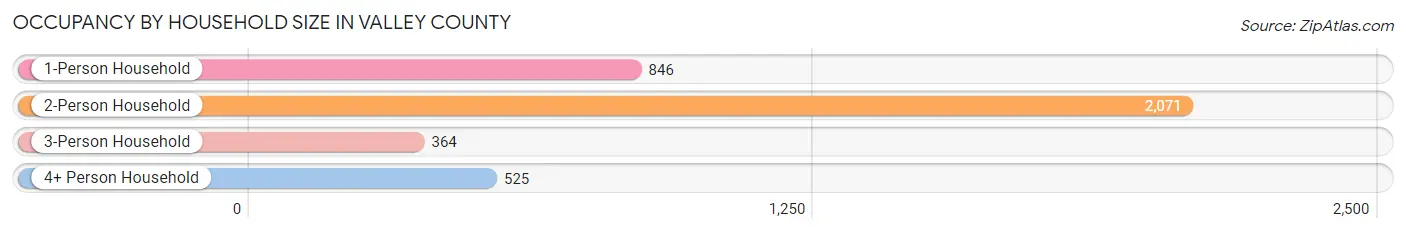
| Household Size | # Housing Units | % Housing Units |
| 1-Person Household | 846 | 22.2% |
| 2-Person Household | 2,071 | 54.4% |
| 3-Person Household | 364 | 9.6% |
| 4+ Person Household | 525 | 13.8% |
| Total Housing Units | 3,806 | 100.0% |
Occupancy by Ownership by Household Size in Valley County
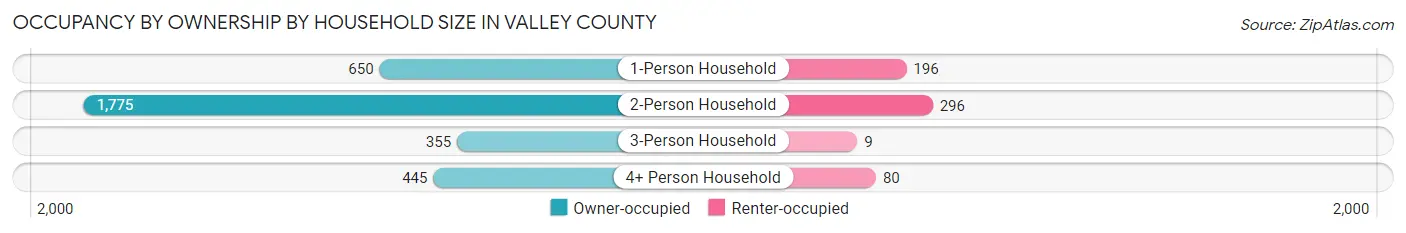
| Household Size | Owner-occupied | Renter-occupied |
| 1-Person Household | 650 (76.8%) | 196 (23.2%) |
| 2-Person Household | 1,775 (85.7%) | 296 (14.3%) |
| 3-Person Household | 355 (97.5%) | 9 (2.5%) |
| 4+ Person Household | 445 (84.8%) | 80 (15.2%) |
| Total Housing Units | 3,225 (84.7%) | 581 (15.3%) |
Occupancy by Educational Attainment in Valley County
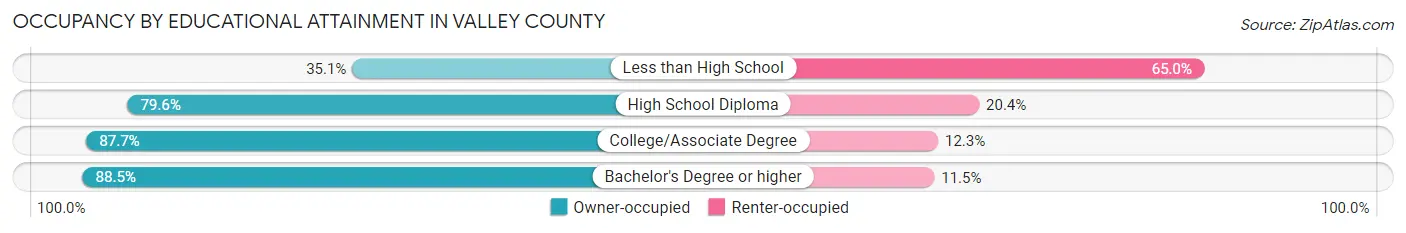
| Household Size | Owner-occupied | Renter-occupied |
| Less than High School | 34 (35.0%) | 63 (64.9%) |
| High School Diploma | 741 (79.6%) | 190 (20.4%) |
| College/Associate Degree | 945 (87.7%) | 132 (12.3%) |
| Bachelor's Degree or higher | 1,505 (88.5%) | 196 (11.5%) |
Occupancy by Age of Householder in Valley County
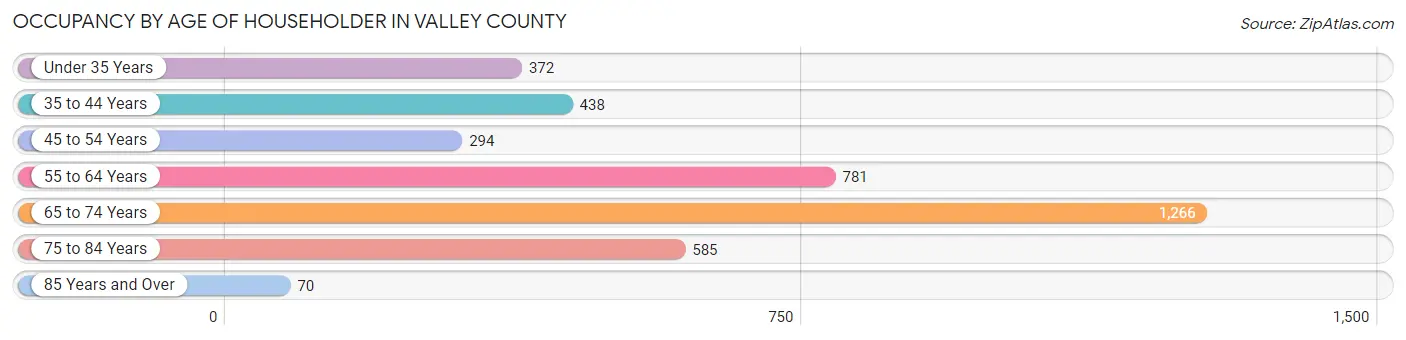
| Age Bracket | # Households | % Households |
| Under 35 Years | 372 | 9.8% |
| 35 to 44 Years | 438 | 11.5% |
| 45 to 54 Years | 294 | 7.7% |
| 55 to 64 Years | 781 | 20.5% |
| 65 to 74 Years | 1,266 | 33.3% |
| 75 to 84 Years | 585 | 15.4% |
| 85 Years and Over | 70 | 1.8% |
| Total | 3,806 | 100.0% |
Housing Finances in Valley County
Median Income by Occupancy in Valley County
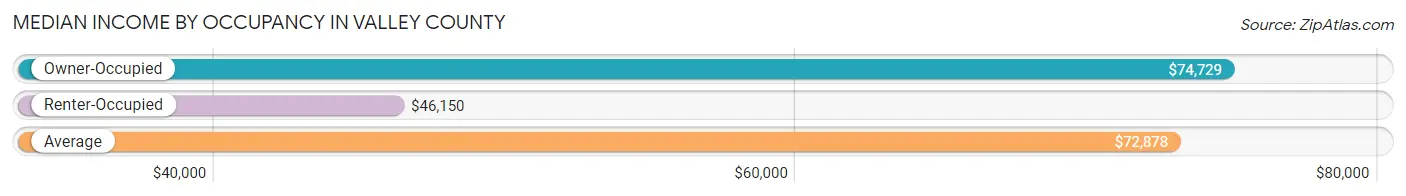
| Occupancy Type | # Households | Median Income |
| Owner-Occupied | 3,225 (84.7%) | $74,729 |
| Renter-Occupied | 581 (15.3%) | $46,150 |
| Average | 3,806 (100.0%) | $72,878 |
Occupancy by Householder Income Bracket in Valley County
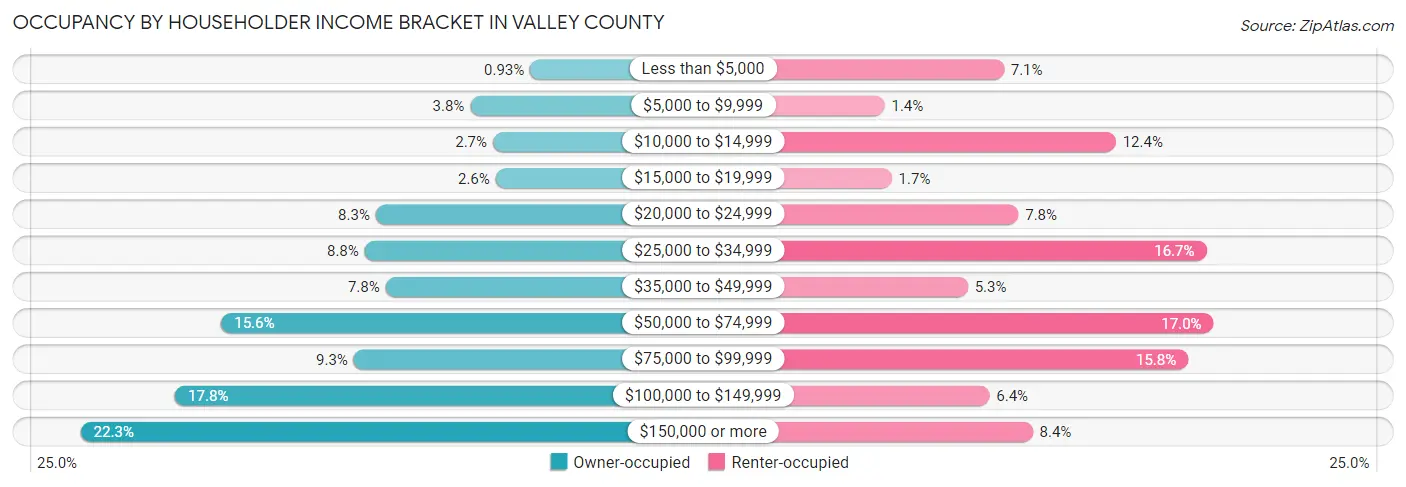
| Income Bracket | Owner-occupied | Renter-occupied |
| Less than $5,000 | 30 (0.9%) | 41 (7.1%) |
| $5,000 to $9,999 | 122 (3.8%) | 8 (1.4%) |
| $10,000 to $14,999 | 87 (2.7%) | 72 (12.4%) |
| $15,000 to $19,999 | 83 (2.6%) | 10 (1.7%) |
| $20,000 to $24,999 | 267 (8.3%) | 45 (7.7%) |
| $25,000 to $34,999 | 284 (8.8%) | 97 (16.7%) |
| $35,000 to $49,999 | 252 (7.8%) | 31 (5.3%) |
| $50,000 to $74,999 | 504 (15.6%) | 99 (17.0%) |
| $75,000 to $99,999 | 301 (9.3%) | 92 (15.8%) |
| $100,000 to $149,999 | 575 (17.8%) | 37 (6.4%) |
| $150,000 or more | 720 (22.3%) | 49 (8.4%) |
| Total | 3,225 (100.0%) | 581 (100.0%) |
Monthly Housing Cost Tiers in Valley County
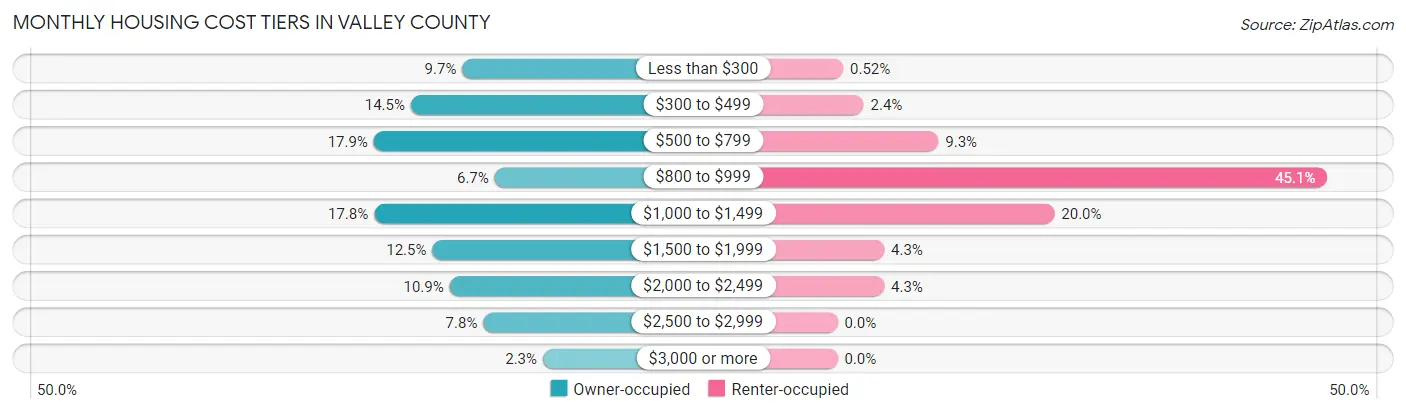
| Monthly Cost | Owner-occupied | Renter-occupied |
| Less than $300 | 313 (9.7%) | 3 (0.5%) |
| $300 to $499 | 466 (14.4%) | 14 (2.4%) |
| $500 to $799 | 576 (17.9%) | 54 (9.3%) |
| $800 to $999 | 217 (6.7%) | 262 (45.1%) |
| $1,000 to $1,499 | 575 (17.8%) | 116 (20.0%) |
| $1,500 to $1,999 | 402 (12.5%) | 25 (4.3%) |
| $2,000 to $2,499 | 351 (10.9%) | 25 (4.3%) |
| $2,500 to $2,999 | 251 (7.8%) | 0 (0.0%) |
| $3,000 or more | 74 (2.3%) | 0 (0.0%) |
| Total | 3,225 (100.0%) | 581 (100.0%) |
Physical Housing Characteristics in Valley County
Housing Structures in Valley County
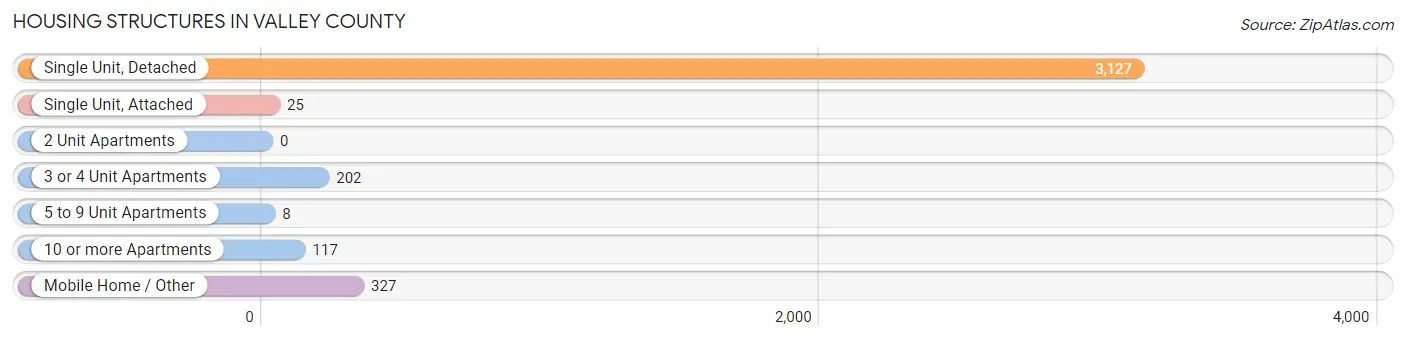
| Structure Type | # Housing Units | % Housing Units |
| Single Unit, Detached | 3,127 | 82.2% |
| Single Unit, Attached | 25 | 0.7% |
| 2 Unit Apartments | 0 | 0.0% |
| 3 or 4 Unit Apartments | 202 | 5.3% |
| 5 to 9 Unit Apartments | 8 | 0.2% |
| 10 or more Apartments | 117 | 3.1% |
| Mobile Home / Other | 327 | 8.6% |
| Total | 3,806 | 100.0% |
Housing Structures by Occupancy in Valley County
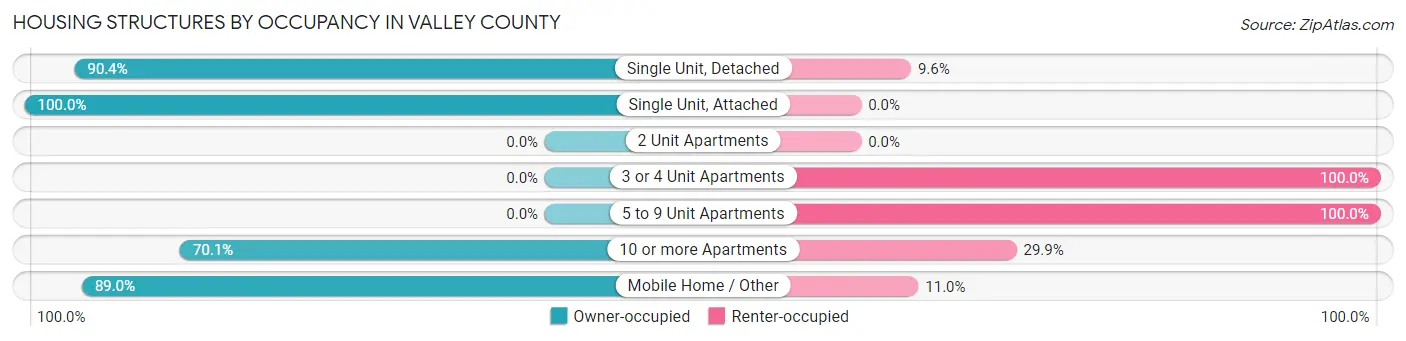
| Structure Type | Owner-occupied | Renter-occupied |
| Single Unit, Detached | 2,827 (90.4%) | 300 (9.6%) |
| Single Unit, Attached | 25 (100.0%) | 0 (0.0%) |
| 2 Unit Apartments | 0 (0.0%) | 0 (0.0%) |
| 3 or 4 Unit Apartments | 0 (0.0%) | 202 (100.0%) |
| 5 to 9 Unit Apartments | 0 (0.0%) | 8 (100.0%) |
| 10 or more Apartments | 82 (70.1%) | 35 (29.9%) |
| Mobile Home / Other | 291 (89.0%) | 36 (11.0%) |
| Total | 3,225 (84.7%) | 581 (15.3%) |
Housing Structures by Number of Rooms in Valley County

| Number of Rooms | Owner-occupied | Renter-occupied |
| 1 Room | 17 (0.5%) | 8 (1.4%) |
| 2 or 3 Rooms | 130 (4.0%) | 161 (27.7%) |
| 4 or 5 Rooms | 1,190 (36.9%) | 243 (41.8%) |
| 6 or 7 Rooms | 1,068 (33.1%) | 161 (27.7%) |
| 8 or more Rooms | 820 (25.4%) | 8 (1.4%) |
| Total | 3,225 (100.0%) | 581 (100.0%) |
Housing Structure by Heating Type in Valley County
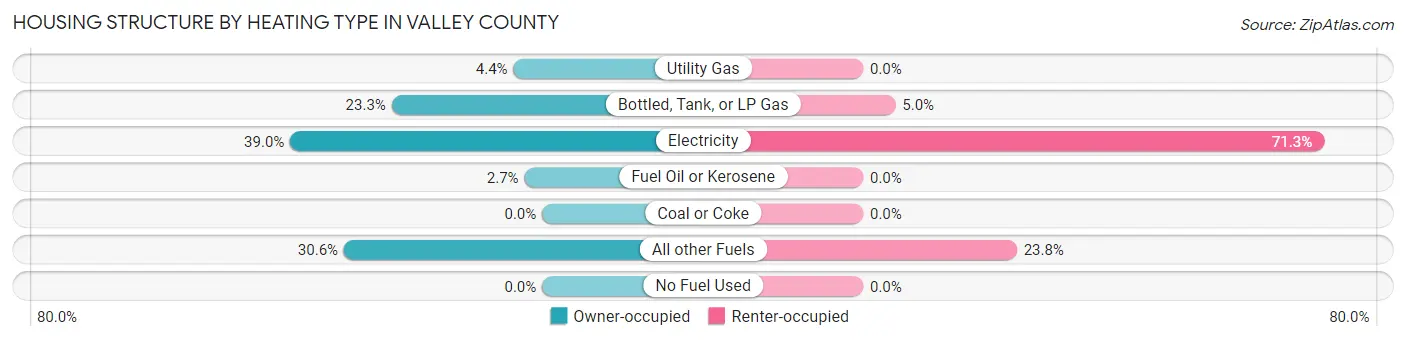
| Heating Type | Owner-occupied | Renter-occupied |
| Utility Gas | 143 (4.4%) | 0 (0.0%) |
| Bottled, Tank, or LP Gas | 750 (23.3%) | 29 (5.0%) |
| Electricity | 1,256 (39.0%) | 414 (71.3%) |
| Fuel Oil or Kerosene | 88 (2.7%) | 0 (0.0%) |
| Coal or Coke | 0 (0.0%) | 0 (0.0%) |
| All other Fuels | 988 (30.6%) | 138 (23.7%) |
| No Fuel Used | 0 (0.0%) | 0 (0.0%) |
| Total | 3,225 (100.0%) | 581 (100.0%) |
Household Vehicle Usage in Valley County
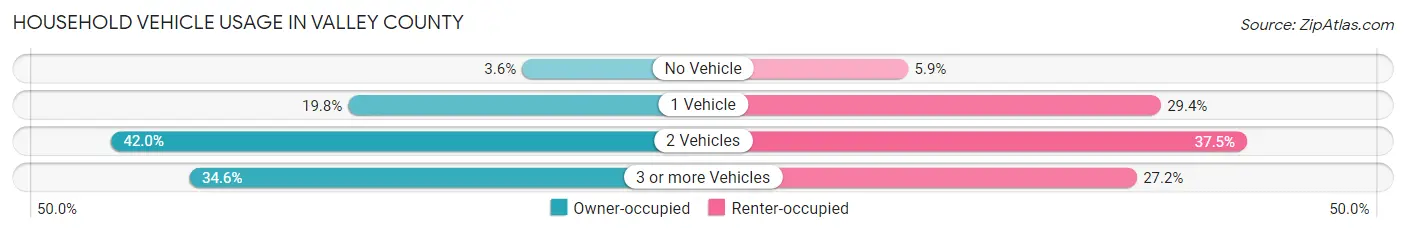
| Vehicles per Household | Owner-occupied | Renter-occupied |
| No Vehicle | 115 (3.6%) | 34 (5.9%) |
| 1 Vehicle | 639 (19.8%) | 171 (29.4%) |
| 2 Vehicles | 1,354 (42.0%) | 218 (37.5%) |
| 3 or more Vehicles | 1,117 (34.6%) | 158 (27.2%) |
| Total | 3,225 (100.0%) | 581 (100.0%) |
Real Estate & Mortgages in Valley County
Real Estate and Mortgage Overview in Valley County
| Characteristic | Without Mortgage | With Mortgage |
| Housing Units | 1,503 | 1,722 |
| Median Property Value | $480,300 | $464,000 |
| Median Household Income | $68,966 | $514 |
| Monthly Housing Costs | $487 | $74 |
| Real Estate Taxes | $1,530 | $27 |
Property Value by Mortgage Status in Valley County
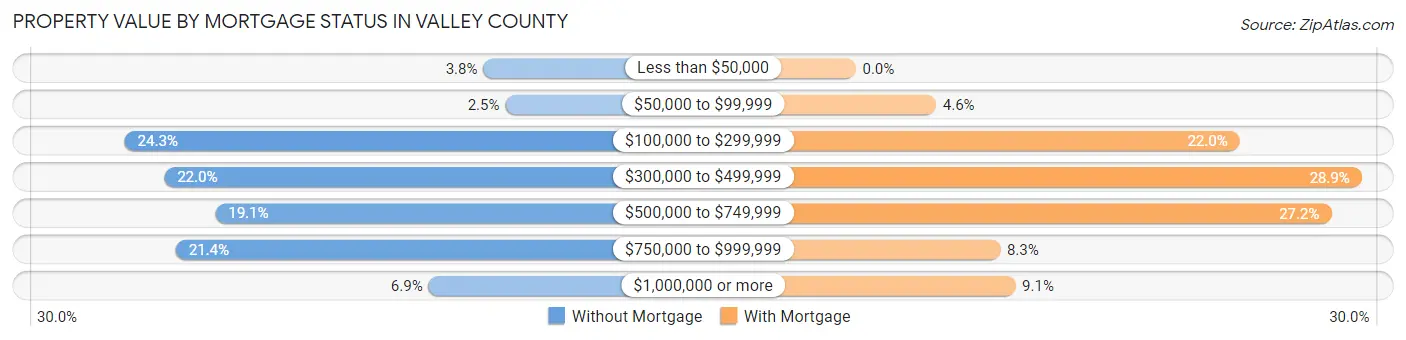
| Property Value | Without Mortgage | With Mortgage |
| Less than $50,000 | 57 (3.8%) | 0 (0.0%) |
| $50,000 to $99,999 | 38 (2.5%) | 79 (4.6%) |
| $100,000 to $299,999 | 365 (24.3%) | 378 (22.0%) |
| $300,000 to $499,999 | 331 (22.0%) | 498 (28.9%) |
| $500,000 to $749,999 | 287 (19.1%) | 468 (27.2%) |
| $750,000 to $999,999 | 321 (21.4%) | 142 (8.3%) |
| $1,000,000 or more | 104 (6.9%) | 157 (9.1%) |
| Total | 1,503 (100.0%) | 1,722 (100.0%) |
Household Income by Mortgage Status in Valley County
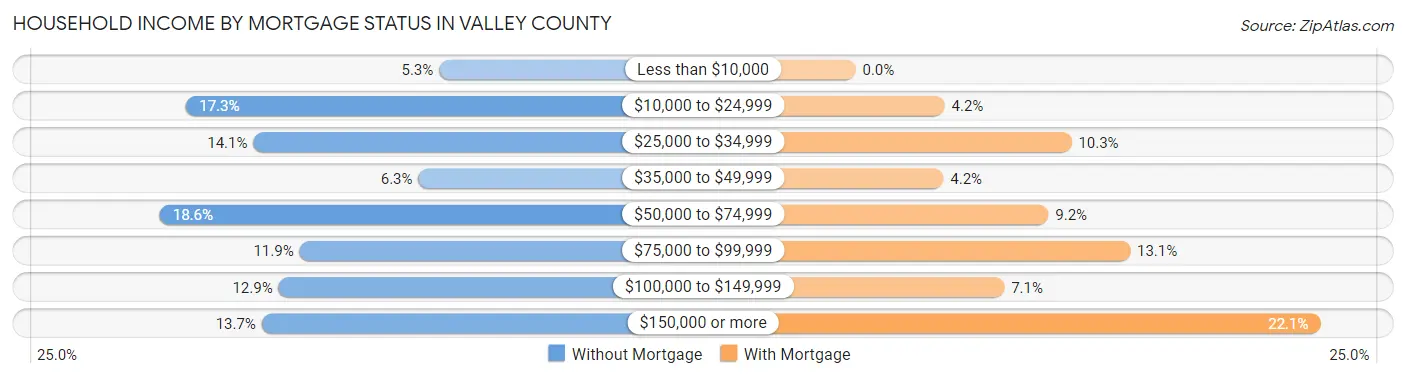
| Household Income | Without Mortgage | With Mortgage |
| Less than $10,000 | 79 (5.3%) | 0 (0.0%) |
| $10,000 to $24,999 | 260 (17.3%) | 73 (4.2%) |
| $25,000 to $34,999 | 212 (14.1%) | 177 (10.3%) |
| $35,000 to $49,999 | 94 (6.2%) | 72 (4.2%) |
| $50,000 to $74,999 | 279 (18.6%) | 158 (9.2%) |
| $75,000 to $99,999 | 179 (11.9%) | 225 (13.1%) |
| $100,000 to $149,999 | 194 (12.9%) | 122 (7.1%) |
| $150,000 or more | 206 (13.7%) | 381 (22.1%) |
| Total | 1,503 (100.0%) | 1,722 (100.0%) |
Property Value to Household Income Ratio in Valley County
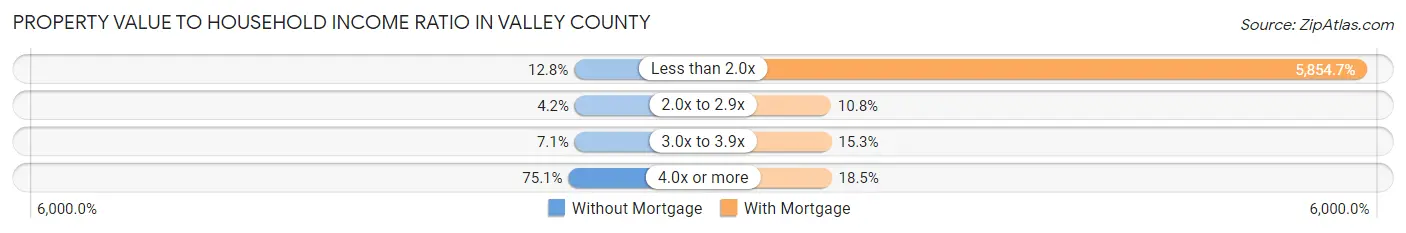
| Value-to-Income Ratio | Without Mortgage | With Mortgage |
| Less than 2.0x | 193 (12.8%) | 100,817 (5,854.7%) |
| 2.0x to 2.9x | 63 (4.2%) | 186 (10.8%) |
| 3.0x to 3.9x | 107 (7.1%) | 264 (15.3%) |
| 4.0x or more | 1,129 (75.1%) | 319 (18.5%) |
| Total | 1,503 (100.0%) | 1,722 (100.0%) |
Real Estate Taxes by Mortgage Status in Valley County
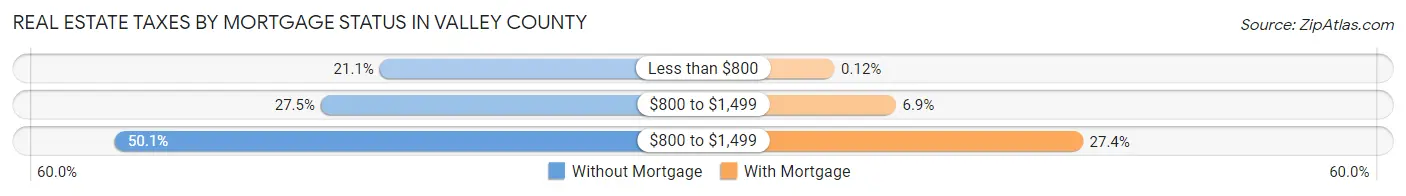
| Property Taxes | Without Mortgage | With Mortgage |
| Less than $800 | 317 (21.1%) | 2 (0.1%) |
| $800 to $1,499 | 414 (27.5%) | 118 (6.9%) |
| $800 to $1,499 | 753 (50.1%) | 471 (27.4%) |
| Total | 1,503 (100.0%) | 1,722 (100.0%) |
Health & Disability in Valley County
Health Insurance Coverage by Age in Valley County
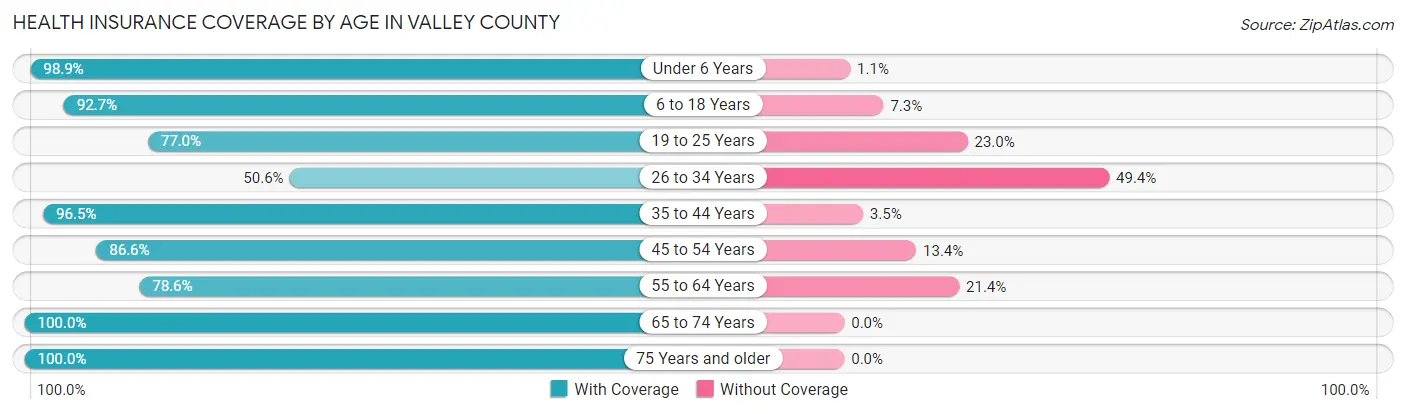
| Age Bracket | With Coverage | Without Coverage |
| Under 6 Years | 544 (98.9%) | 6 (1.1%) |
| 6 to 18 Years | 1,470 (92.7%) | 116 (7.3%) |
| 19 to 25 Years | 429 (77.0%) | 128 (23.0%) |
| 26 to 34 Years | 573 (50.6%) | 559 (49.4%) |
| 35 to 44 Years | 1,584 (96.5%) | 57 (3.5%) |
| 45 to 54 Years | 1,100 (86.6%) | 170 (13.4%) |
| 55 to 64 Years | 1,501 (78.6%) | 409 (21.4%) |
| 65 to 74 Years | 2,095 (100.0%) | 0 (0.0%) |
| 75 Years and older | 975 (100.0%) | 0 (0.0%) |
| Total | 10,271 (87.7%) | 1,445 (12.3%) |
Health Insurance Coverage by Citizenship Status in Valley County

| Citizenship Status | With Coverage | Without Coverage |
| Native Born | 544 (98.9%) | 6 (1.1%) |
| Foreign Born, Citizen | 1,470 (92.7%) | 116 (7.3%) |
| Foreign Born, not a Citizen | 429 (77.0%) | 128 (23.0%) |
Health Insurance Coverage by Household Income in Valley County
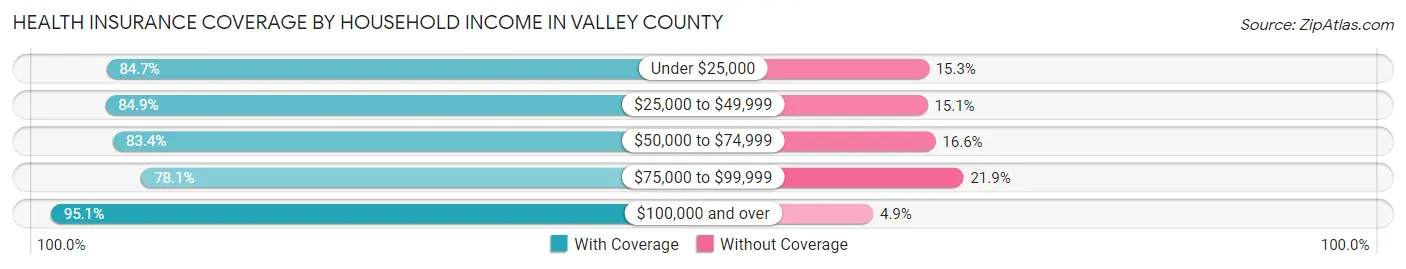
| Household Income | With Coverage | Without Coverage |
| Under $25,000 | 1,302 (84.7%) | 236 (15.3%) |
| $25,000 to $49,999 | 1,595 (84.9%) | 284 (15.1%) |
| $50,000 to $74,999 | 1,788 (83.4%) | 356 (16.6%) |
| $75,000 to $99,999 | 1,058 (78.1%) | 296 (21.9%) |
| $100,000 and over | 4,406 (95.1%) | 228 (4.9%) |
Public vs Private Health Insurance Coverage by Age in Valley County
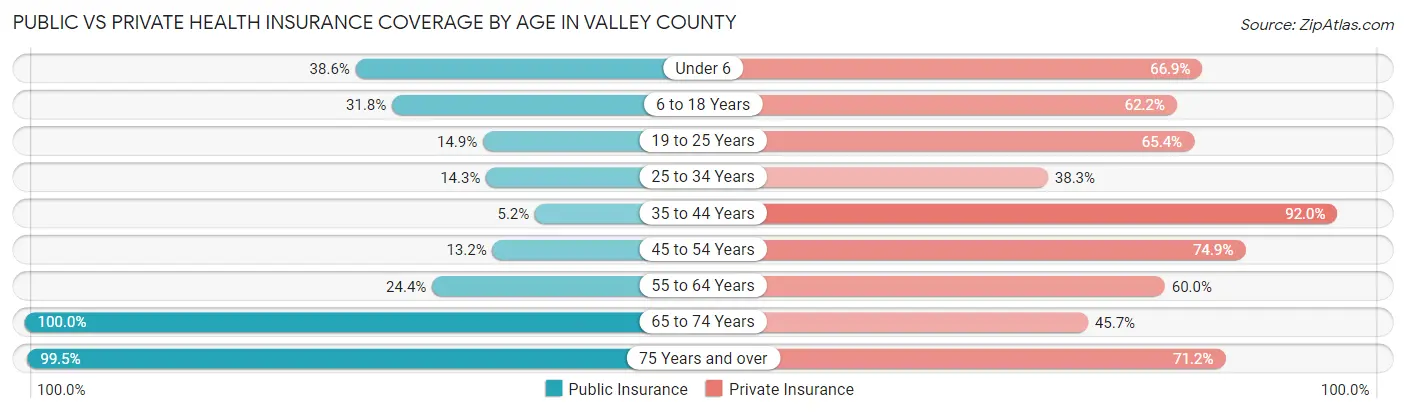
| Age Bracket | Public Insurance | Private Insurance |
| Under 6 | 212 (38.6%) | 368 (66.9%) |
| 6 to 18 Years | 504 (31.8%) | 986 (62.2%) |
| 19 to 25 Years | 83 (14.9%) | 364 (65.3%) |
| 25 to 34 Years | 162 (14.3%) | 433 (38.3%) |
| 35 to 44 Years | 86 (5.2%) | 1,509 (92.0%) |
| 45 to 54 Years | 167 (13.2%) | 951 (74.9%) |
| 55 to 64 Years | 465 (24.3%) | 1,145 (60.0%) |
| 65 to 74 Years | 2,095 (100.0%) | 957 (45.7%) |
| 75 Years and over | 970 (99.5%) | 694 (71.2%) |
| Total | 4,744 (40.5%) | 7,407 (63.2%) |
Disability Status by Sex by Age in Valley County
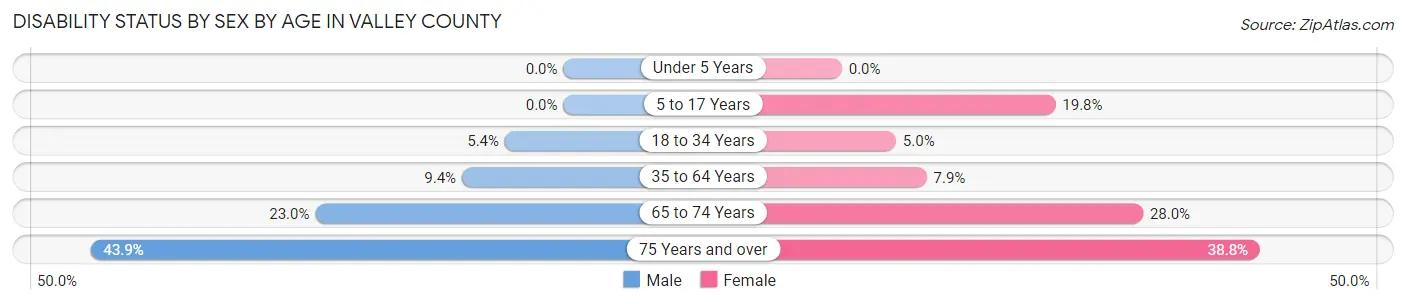
| Age Bracket | Male | Female |
| Under 5 Years | 0 (0.0%) | 0 (0.0%) |
| 5 to 17 Years | 0 (0.0%) | 154 (19.8%) |
| 18 to 34 Years | 49 (5.4%) | 42 (5.0%) |
| 35 to 64 Years | 230 (9.4%) | 187 (7.9%) |
| 65 to 74 Years | 264 (23.0%) | 265 (28.0%) |
| 75 Years and over | 230 (43.9%) | 175 (38.8%) |
Disability Class by Sex by Age in Valley County
Disability Class: Hearing Difficulty
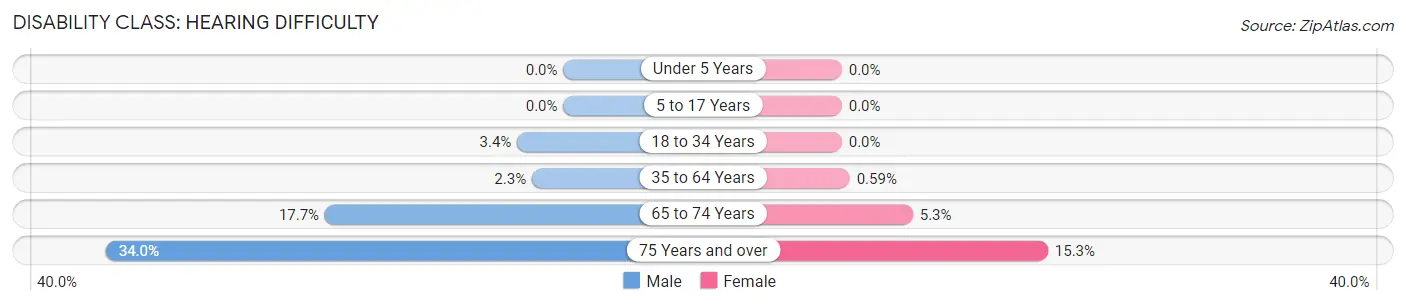
| Age Bracket | Male | Female |
| Under 5 Years | 0 (0.0%) | 0 (0.0%) |
| 5 to 17 Years | 0 (0.0%) | 0 (0.0%) |
| 18 to 34 Years | 31 (3.4%) | 0 (0.0%) |
| 35 to 64 Years | 57 (2.3%) | 14 (0.6%) |
| 65 to 74 Years | 203 (17.7%) | 50 (5.3%) |
| 75 Years and over | 178 (34.0%) | 69 (15.3%) |
Disability Class: Vision Difficulty
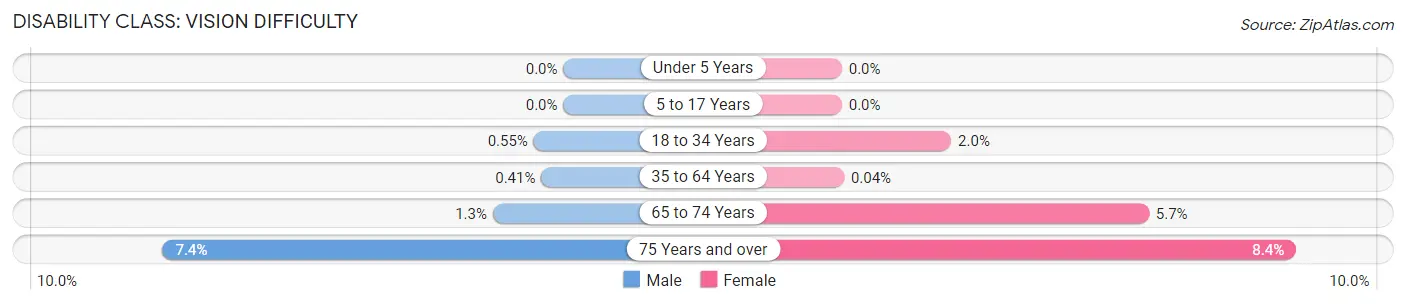
| Age Bracket | Male | Female |
| Under 5 Years | 0 (0.0%) | 0 (0.0%) |
| 5 to 17 Years | 0 (0.0%) | 0 (0.0%) |
| 18 to 34 Years | 5 (0.5%) | 17 (2.0%) |
| 35 to 64 Years | 10 (0.4%) | 1 (0.0%) |
| 65 to 74 Years | 15 (1.3%) | 54 (5.7%) |
| 75 Years and over | 39 (7.4%) | 38 (8.4%) |
Disability Class: Cognitive Difficulty
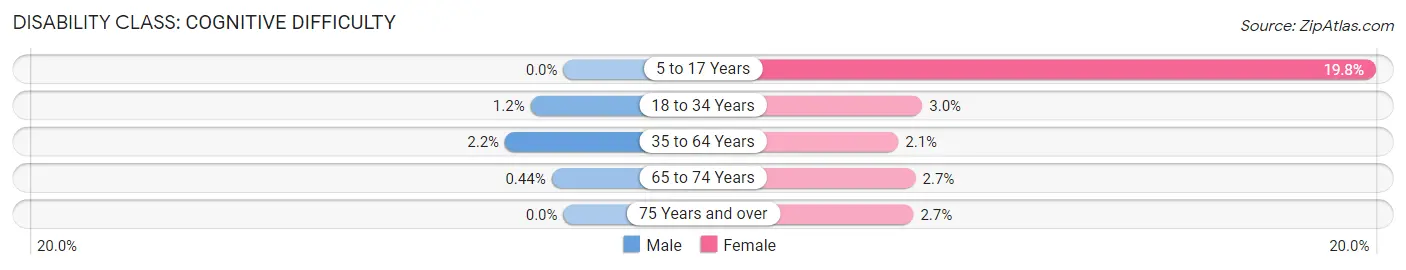
| Age Bracket | Male | Female |
| 5 to 17 Years | 0 (0.0%) | 154 (19.8%) |
| 18 to 34 Years | 11 (1.2%) | 25 (3.0%) |
| 35 to 64 Years | 53 (2.2%) | 50 (2.1%) |
| 65 to 74 Years | 5 (0.4%) | 26 (2.7%) |
| 75 Years and over | 0 (0.0%) | 12 (2.7%) |
Disability Class: Ambulatory Difficulty
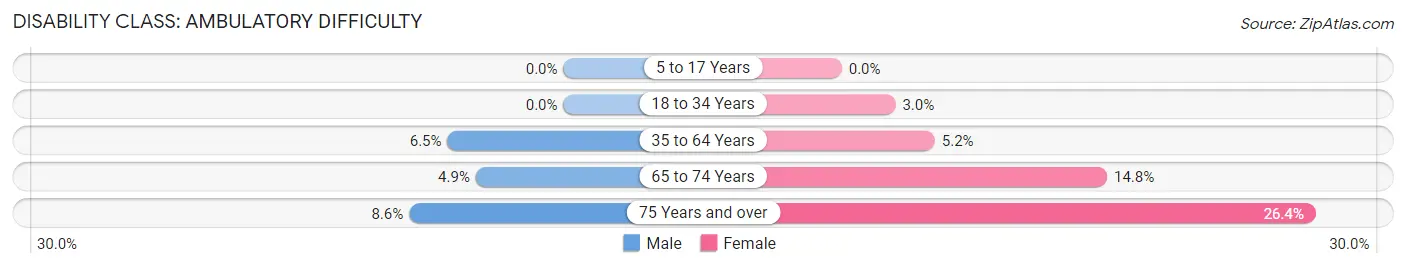
| Age Bracket | Male | Female |
| 5 to 17 Years | 0 (0.0%) | 0 (0.0%) |
| 18 to 34 Years | 0 (0.0%) | 25 (3.0%) |
| 35 to 64 Years | 158 (6.5%) | 123 (5.2%) |
| 65 to 74 Years | 56 (4.9%) | 140 (14.8%) |
| 75 Years and over | 45 (8.6%) | 119 (26.4%) |
Disability Class: Self-Care Difficulty
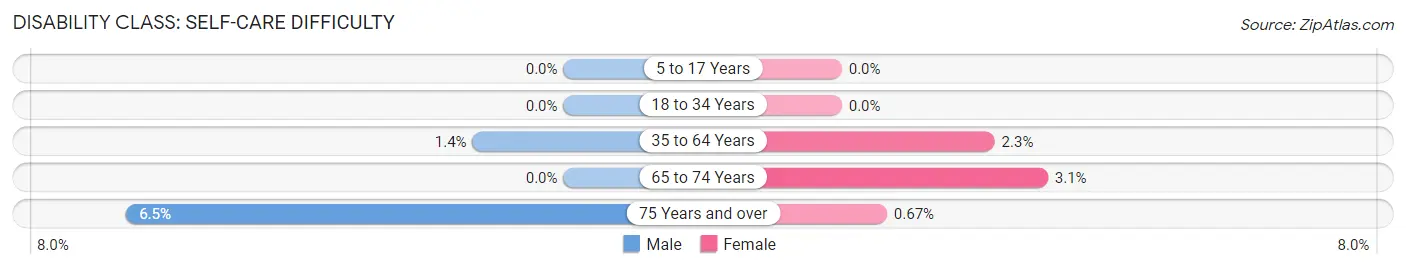
| Age Bracket | Male | Female |
| 5 to 17 Years | 0 (0.0%) | 0 (0.0%) |
| 18 to 34 Years | 0 (0.0%) | 0 (0.0%) |
| 35 to 64 Years | 33 (1.3%) | 54 (2.3%) |
| 65 to 74 Years | 0 (0.0%) | 29 (3.1%) |
| 75 Years and over | 34 (6.5%) | 3 (0.7%) |
Technology Access in Valley County
Computing Device Access in Valley County
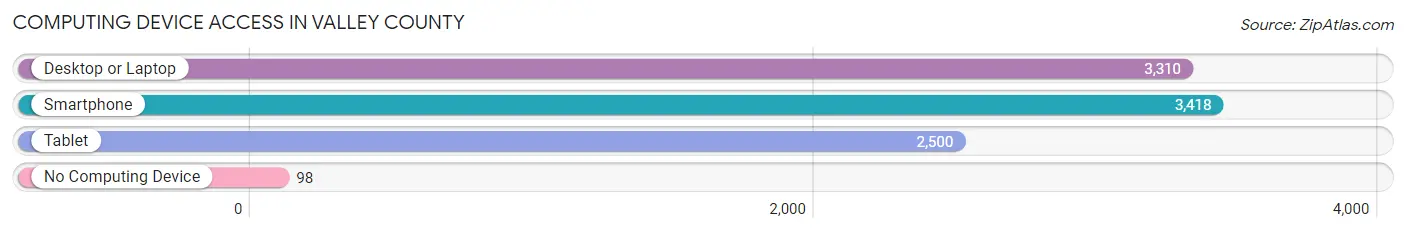
| Device Type | # Households | % Households |
| Desktop or Laptop | 3,310 | 87.0% |
| Smartphone | 3,418 | 89.8% |
| Tablet | 2,500 | 65.7% |
| No Computing Device | 98 | 2.6% |
| Total | 3,806 | 100.0% |
Internet Access in Valley County
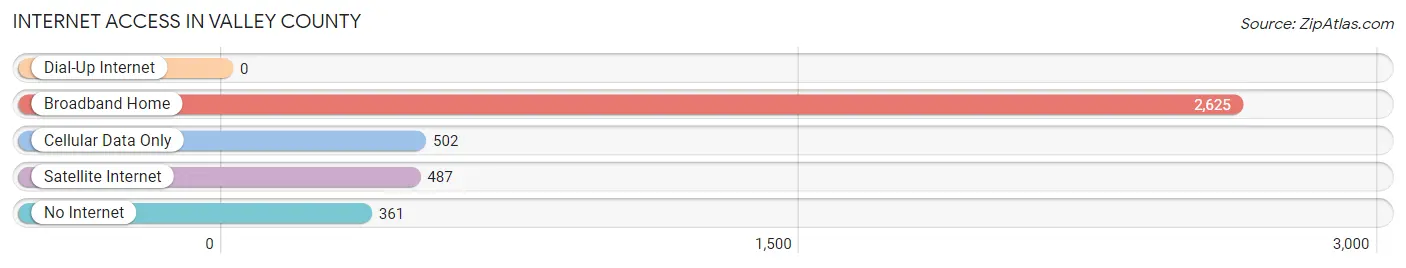
| Internet Type | # Households | % Households |
| Dial-Up Internet | 0 | 0.0% |
| Broadband Home | 2,625 | 69.0% |
| Cellular Data Only | 502 | 13.2% |
| Satellite Internet | 487 | 12.8% |
| No Internet | 361 | 9.5% |
| Total | 3,806 | 100.0% |
Valley County Summary
Valley County, Idaho is located in the western part of the state and is bordered by Adams County to the north, Boise County to the east, Gem County to the south, and Washington County to the west. The county seat is Cascade, and the largest city is McCall. Valley County is part of the Boise Metropolitan Statistical Area.
History
Valley County was established in 1917 from a portion of Boise County. The county was named for the Payette River Valley, which runs through the county. The area was originally inhabited by the Shoshone-Bannock tribes, and the first white settlers arrived in the 1860s. The area was primarily used for ranching and logging, and the first sawmill was built in 1883.
Geography
Valley County covers an area of 2,072 square miles, making it the fourth-largest county in Idaho. The county is located in the western part of the state and is bordered by Adams County to the north, Boise County to the east, Gem County to the south, and Washington County to the west. The county is located in the Payette River Valley, and the Payette River runs through the county. The county is also home to several lakes, including Lake Cascade, Payette Lake, and Lake Fork. The highest point in the county is Squaw Butte, which has an elevation of 8,717 feet.
Economy
The economy of Valley County is largely based on tourism, agriculture, and timber. The county is home to several ski resorts, including Brundage Mountain and Tamarack Resort. Agriculture is also an important part of the economy, with the county producing potatoes, hay, and other crops. The timber industry is also an important part of the economy, with the county producing lumber, paper, and other wood products.
Demographics
As of the 2010 census, Valley County had a population of 9,862. The population was spread out, with 24.3% under the age of 18, 8.2% from 18 to 24, 24.3% from 25 to 44, 28.2% from 45 to 64, and 14.0% who were 65 years of age or older. The median age was 40.3 years. The median income for a household in the county was $41,945, and the median income for a family was $50,945. The per capita income for the county was $25,945. The largest ethnic group in the county was White (93.2%), followed by Hispanic or Latino (2.7%), and Native American (1.2%).
Common Questions
What is the Total Population of Valley County?
Total Population of Valley County is 11,830.
What is the Total Male Population of Valley County?
Total Male Population of Valley County is 6,165.
What is the Total Female Population of Valley County?
Total Female Population of Valley County is 5,665.
What is the Ratio of Males per 100 Females in Valley County?
There are 108.83 Males per 100 Females in Valley County.
What is the Ratio of Females per 100 Males in Valley County?
There are 91.89 Females per 100 Males in Valley County.
What is the Median Population Age in Valley County?
Median Population Age in Valley County is 48.9 Years.
What is the Average Family Size in Valley County
Average Family Size in Valley County is 3.4 People.
What is the Average Household Size in Valley County
Average Household Size in Valley County is 3.0 People.
What is Per Capita Income in Valley County?
Per Capita income in Valley County is $34,544.
What is the Median Family Income in Valley County?
Median Family Income in Valley County is $87,595.
What is the Median Household income in Valley County?
Median Household Income in Valley County is $72,878.
What is Income or Wage Gap in Valley County?
Income or Wage Gap in Valley County is 45.3%.
Women in Valley County earn 54.7 cents for every dollar earned by a man.
What is Inequality or Gini Index in Valley County?
Inequality or Gini Index in Valley County is 0.47.
How Large is the Labor Force in Valley County?
There are 5,008 People in the Labor Forcein in Valley County.
What is the Percentage of People in the Labor Force in Valley County?
50.2% of People are in the Labor Force in Valley County.
What is the Unemployment Rate in Valley County?
Unemployment Rate in Valley County is 1.5%.