Twin Falls County, ID
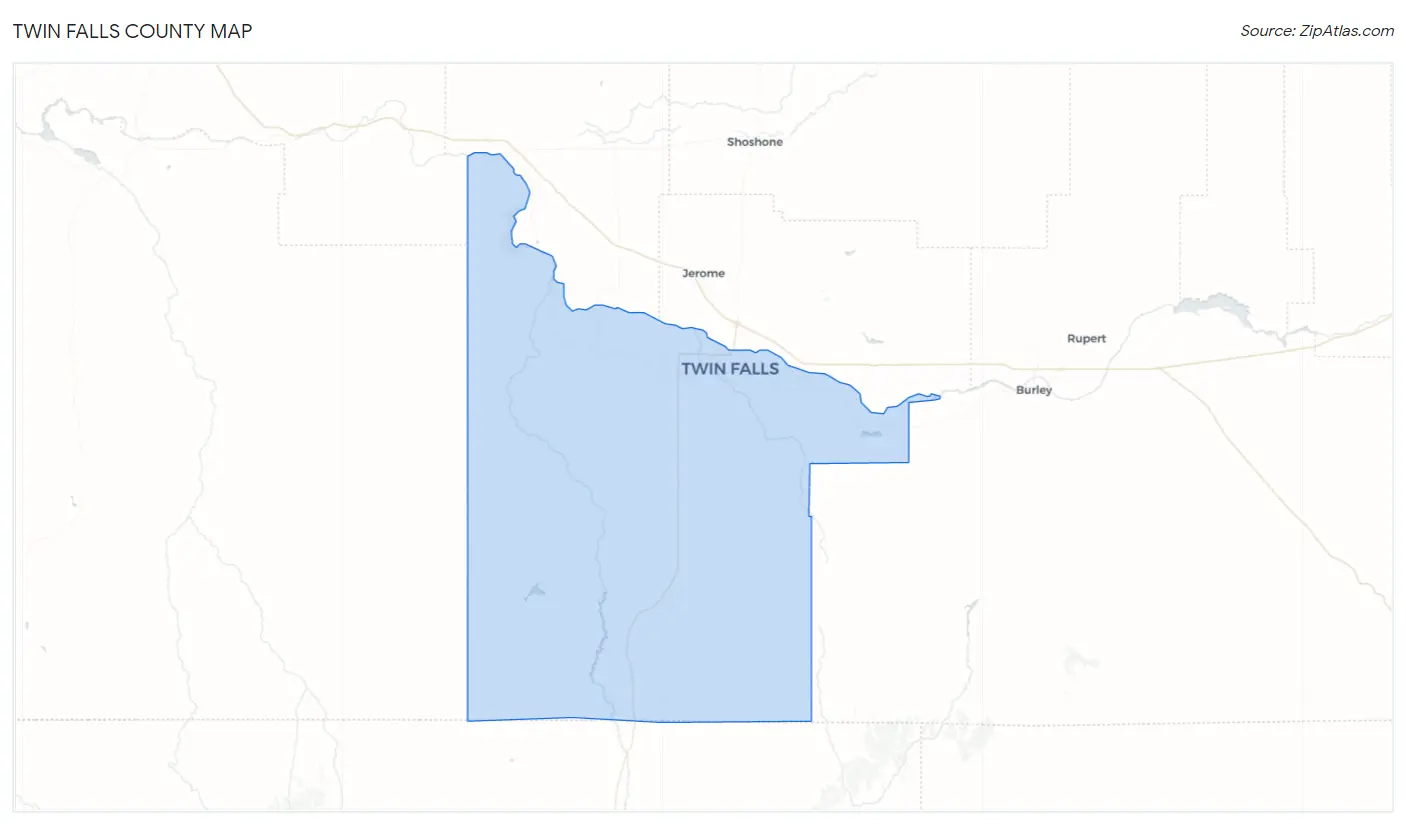
Twin Falls County Map
Twin Falls County Overview
90,592
TOTAL POPULATION
45,073
MALE POPULATION
45,519
FEMALE POPULATION
99.02
MALES / 100 FEMALES
100.99
FEMALES / 100 MALES
35.5
MEDIAN AGE
3.2
AVG FAMILY SIZE
2.7
AVG HOUSEHOLD SIZE
$32,393
PER CAPITA INCOME
$73,929
AVG FAMILY INCOME
$61,183
AVG HOUSEHOLD INCOME
41.1%
WAGE / INCOME GAP [ % ]
58.9¢/ $1
WAGE / INCOME GAP [ $ ]
$9,804
FAMILY INCOME DEFICIT
0.45
INEQUALITY / GINI INDEX
43,734
LABOR FORCE [ PEOPLE ]
63.3%
PERCENT IN LABOR FORCE
3.1%
UNEMPLOYMENT RATE
Twin Falls County Area Codes
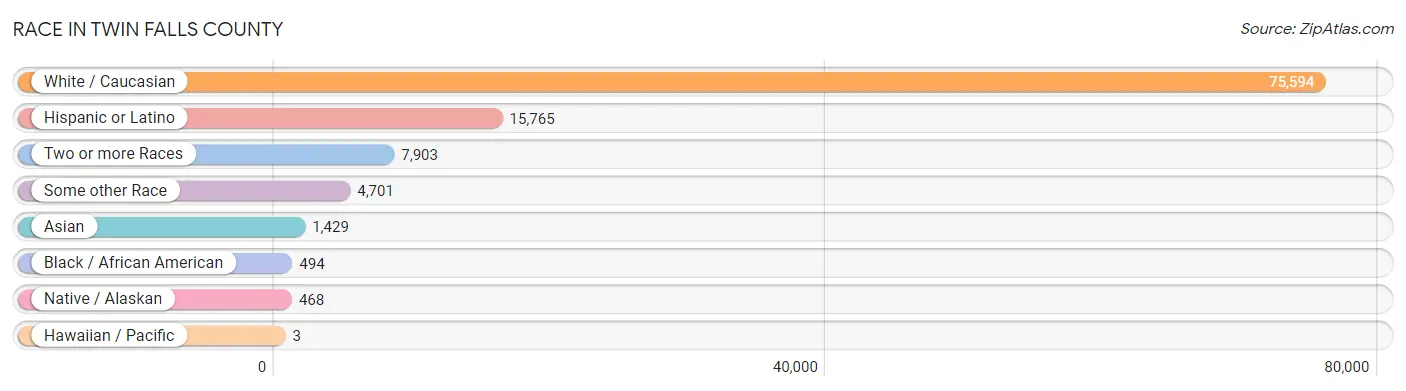
Race in Twin Falls County
The most populous races in Twin Falls County are White / Caucasian (75,594 | 83.4%), Hispanic or Latino (15,765 | 17.4%), and Two or more Races (7,903 | 8.7%).
| Race | # Population | % Population |
| Asian | 1,429 | 1.6% |
| Black / African American | 494 | 0.5% |
| Hawaiian / Pacific | 3 | 0.0% |
| Hispanic or Latino | 15,765 | 17.4% |
| Native / Alaskan | 468 | 0.5% |
| White / Caucasian | 75,594 | 83.4% |
| Two or more Races | 7,903 | 8.7% |
| Some other Race | 4,701 | 5.2% |
| Total | 90,592 | 100.0% |
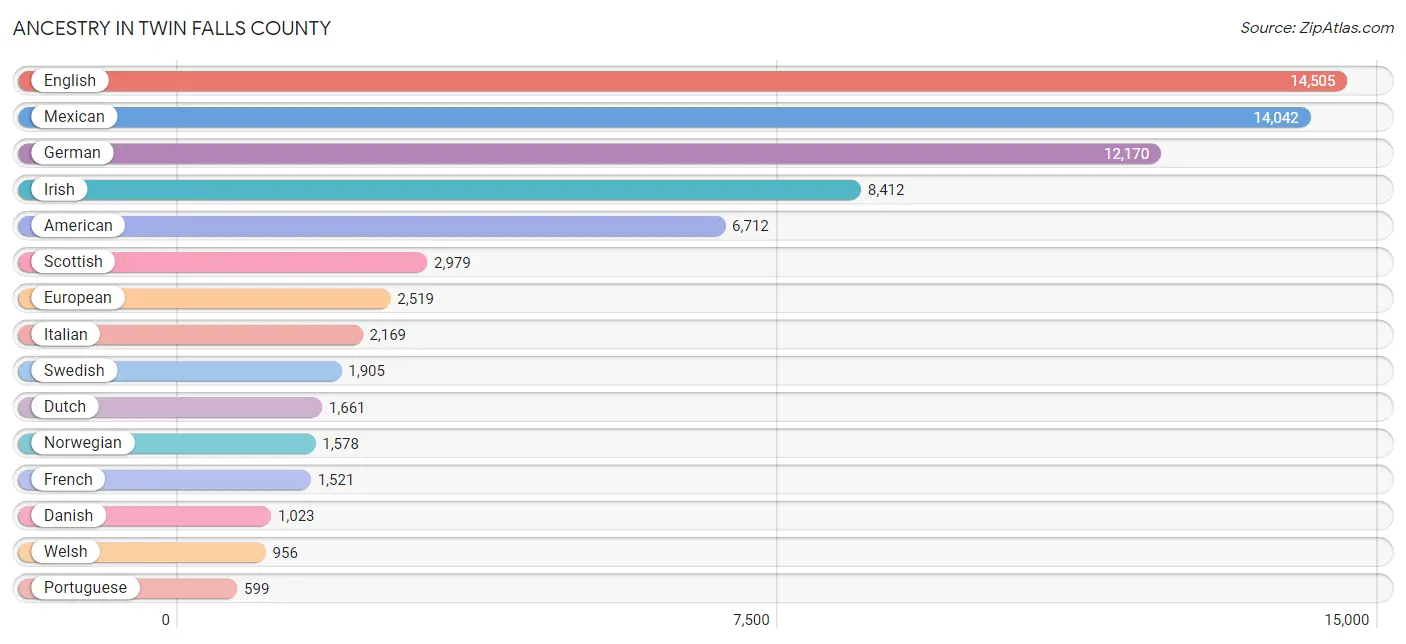
Ancestry in Twin Falls County
The most populous ancestries reported in Twin Falls County are English (14,505 | 16.0%), Mexican (14,042 | 15.5%), German (12,170 | 13.4%), Irish (8,412 | 9.3%), and American (6,712 | 7.4%), together accounting for 61.6% of all Twin Falls County residents.
| Ancestry | # Population | % Population |
| Afghan | 66 | 0.1% |
| African | 157 | 0.2% |
| Albanian | 19 | 0.0% |
| American | 6,712 | 7.4% |
| Apache | 3 | 0.0% |
| Arab | 387 | 0.4% |
| Armenian | 24 | 0.0% |
| Austrian | 85 | 0.1% |
| Basque | 369 | 0.4% |
| Belgian | 53 | 0.1% |
| Belizean | 1 | 0.0% |
| Bhutanese | 439 | 0.5% |
| Blackfeet | 20 | 0.0% |
| British | 370 | 0.4% |
| Bulgarian | 201 | 0.2% |
| Burmese | 135 | 0.2% |
| Cambodian | 30 | 0.0% |
| Canadian | 177 | 0.2% |
| Central American | 439 | 0.5% |
| Central American Indian | 5 | 0.0% |
| Cherokee | 556 | 0.6% |
| Cheyenne | 13 | 0.0% |
| Chippewa | 15 | 0.0% |
| Choctaw | 60 | 0.1% |
| Colombian | 57 | 0.1% |
| Costa Rican | 142 | 0.2% |
| Creek | 1 | 0.0% |
| Croatian | 106 | 0.1% |
| Cuban | 8 | 0.0% |
| Czech | 339 | 0.4% |
| Czechoslovakian | 89 | 0.1% |
| Danish | 1,023 | 1.1% |
| Dominican | 13 | 0.0% |
| Dutch | 1,661 | 1.8% |
| Dutch West Indian | 12 | 0.0% |
| Eastern European | 30 | 0.0% |
| English | 14,505 | 16.0% |
| European | 2,519 | 2.8% |
| Finnish | 140 | 0.2% |
| French | 1,521 | 1.7% |
| French American Indian | 7 | 0.0% |
| French Canadian | 252 | 0.3% |
| German | 12,170 | 13.4% |
| German Russian | 31 | 0.0% |
| Ghanaian | 36 | 0.0% |
| Greek | 178 | 0.2% |
| Guatemalan | 226 | 0.3% |
| Haitian | 12 | 0.0% |
| Hopi | 7 | 0.0% |
| Hungarian | 247 | 0.3% |
| Icelander | 24 | 0.0% |
| Indian (Asian) | 58 | 0.1% |
| Indonesian | 173 | 0.2% |
| Iranian | 196 | 0.2% |
| Iraqi | 108 | 0.1% |
| Irish | 8,412 | 9.3% |
| Iroquois | 29 | 0.0% |
| Italian | 2,169 | 2.4% |
| Kenyan | 8 | 0.0% |
| Korean | 213 | 0.2% |
| Laotian | 23 | 0.0% |
| Latvian | 49 | 0.1% |
| Lebanese | 138 | 0.2% |
| Luxembourger | 19 | 0.0% |
| Malaysian | 48 | 0.1% |
| Marshallese | 3 | 0.0% |
| Mexican | 14,042 | 15.5% |
| Mexican American Indian | 106 | 0.1% |
| Moroccan | 12 | 0.0% |
| Native Hawaiian | 64 | 0.1% |
| Navajo | 91 | 0.1% |
| Nigerian | 30 | 0.0% |
| Northern European | 396 | 0.4% |
| Norwegian | 1,578 | 1.7% |
| Paiute | 9 | 0.0% |
| Pakistani | 16 | 0.0% |
| Peruvian | 105 | 0.1% |
| Polish | 391 | 0.4% |
| Portuguese | 599 | 0.7% |
| Potawatomi | 7 | 0.0% |
| Pueblo | 1 | 0.0% |
| Puerto Rican | 72 | 0.1% |
| Russian | 403 | 0.4% |
| Salvadoran | 18 | 0.0% |
| Scandinavian | 468 | 0.5% |
| Scotch-Irish | 387 | 0.4% |
| Scottish | 2,979 | 3.3% |
| Serbian | 54 | 0.1% |
| Shoshone | 40 | 0.0% |
| Sioux | 7 | 0.0% |
| Slavic | 14 | 0.0% |
| Slovak | 7 | 0.0% |
| Slovene | 3 | 0.0% |
| South American | 162 | 0.2% |
| Spaniard | 64 | 0.1% |
| Spanish | 159 | 0.2% |
| Sri Lankan | 31 | 0.0% |
| Subsaharan African | 239 | 0.3% |
| Swedish | 1,905 | 2.1% |
| Swiss | 539 | 0.6% |
| Thai | 134 | 0.2% |
| Tongan | 139 | 0.2% |
| Ukrainian | 100 | 0.1% |
| Welsh | 956 | 1.1% |
| West Indian | 17 | 0.0% |
| Yugoslavian | 230 | 0.3% | View All 106 Rows |
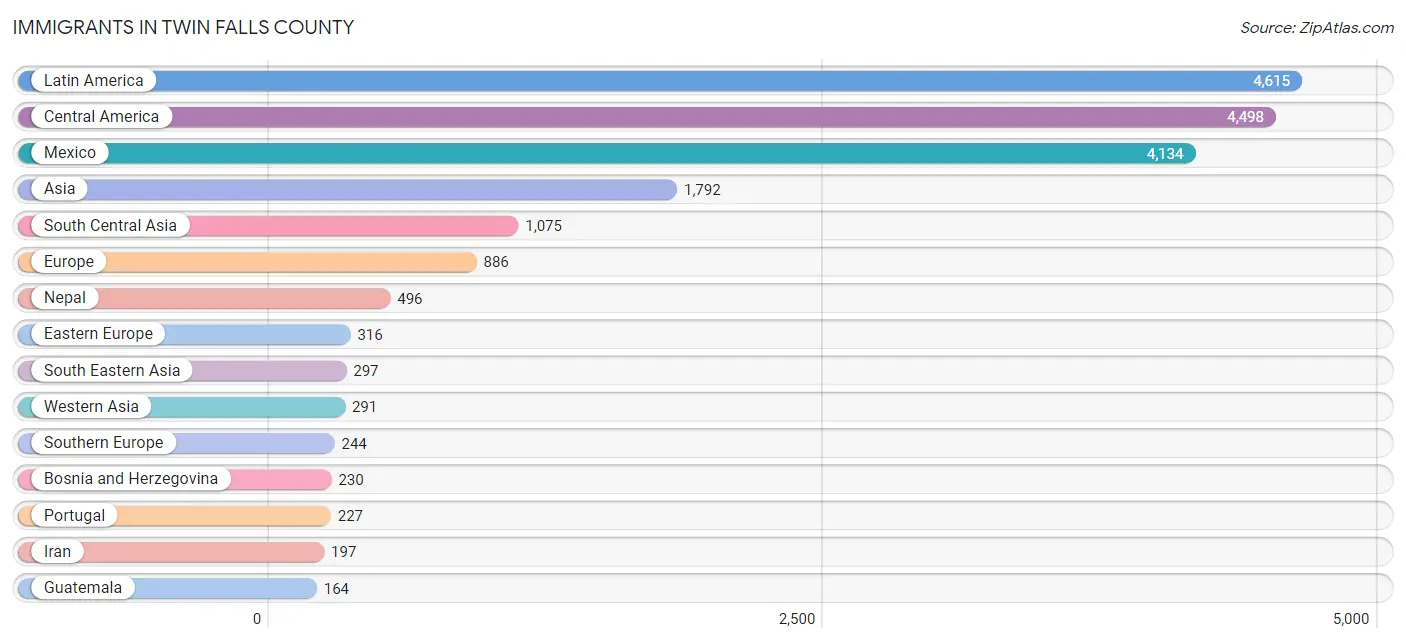
Immigrants in Twin Falls County
The most numerous immigrant groups reported in Twin Falls County came from Latin America (4,615 | 5.1%), Central America (4,498 | 5.0%), Mexico (4,134 | 4.6%), Asia (1,792 | 2.0%), and South Central Asia (1,075 | 1.2%), together accounting for 17.8% of all Twin Falls County residents.
| Immigration Origin | # Population | % Population |
| Afghanistan | 19 | 0.0% |
| Africa | 16 | 0.0% |
| Asia | 1,792 | 2.0% |
| Australia | 55 | 0.1% |
| Azores | 77 | 0.1% |
| Bosnia and Herzegovina | 230 | 0.3% |
| Bulgaria | 3 | 0.0% |
| Canada | 128 | 0.1% |
| Caribbean | 12 | 0.0% |
| Central America | 4,498 | 5.0% |
| China | 38 | 0.0% |
| Congo | 8 | 0.0% |
| Costa Rica | 129 | 0.1% |
| Czechoslovakia | 10 | 0.0% |
| Eastern Africa | 8 | 0.0% |
| Eastern Asia | 129 | 0.1% |
| Eastern Europe | 316 | 0.4% |
| El Salvador | 18 | 0.0% |
| England | 77 | 0.1% |
| Europe | 886 | 1.0% |
| France | 7 | 0.0% |
| Germany | 61 | 0.1% |
| Guatemala | 164 | 0.2% |
| Haiti | 12 | 0.0% |
| Honduras | 53 | 0.1% |
| India | 127 | 0.1% |
| Iran | 197 | 0.2% |
| Iraq | 141 | 0.2% |
| Italy | 17 | 0.0% |
| Kenya | 8 | 0.0% |
| Korea | 61 | 0.1% |
| Laos | 3 | 0.0% |
| Latin America | 4,615 | 5.1% |
| Lebanon | 140 | 0.2% |
| Malaysia | 47 | 0.1% |
| Mexico | 4,134 | 4.6% |
| Micronesia | 3 | 0.0% |
| Middle Africa | 8 | 0.0% |
| Nepal | 496 | 0.5% |
| Netherlands | 11 | 0.0% |
| Northern Europe | 115 | 0.1% |
| Norway | 23 | 0.0% |
| Oceania | 58 | 0.1% |
| Peru | 105 | 0.1% |
| Philippines | 114 | 0.1% |
| Portugal | 227 | 0.3% |
| Romania | 27 | 0.0% |
| Russia | 21 | 0.0% |
| Scotland | 15 | 0.0% |
| South America | 105 | 0.1% |
| South Central Asia | 1,075 | 1.2% |
| South Eastern Asia | 297 | 0.3% |
| Southern Europe | 244 | 0.3% |
| Thailand | 12 | 0.0% |
| Ukraine | 25 | 0.0% |
| Vietnam | 31 | 0.0% |
| Western Asia | 291 | 0.3% |
| Western Europe | 79 | 0.1% | View All 58 Rows |
Sex and Age in Twin Falls County
Sex and Age in Twin Falls County
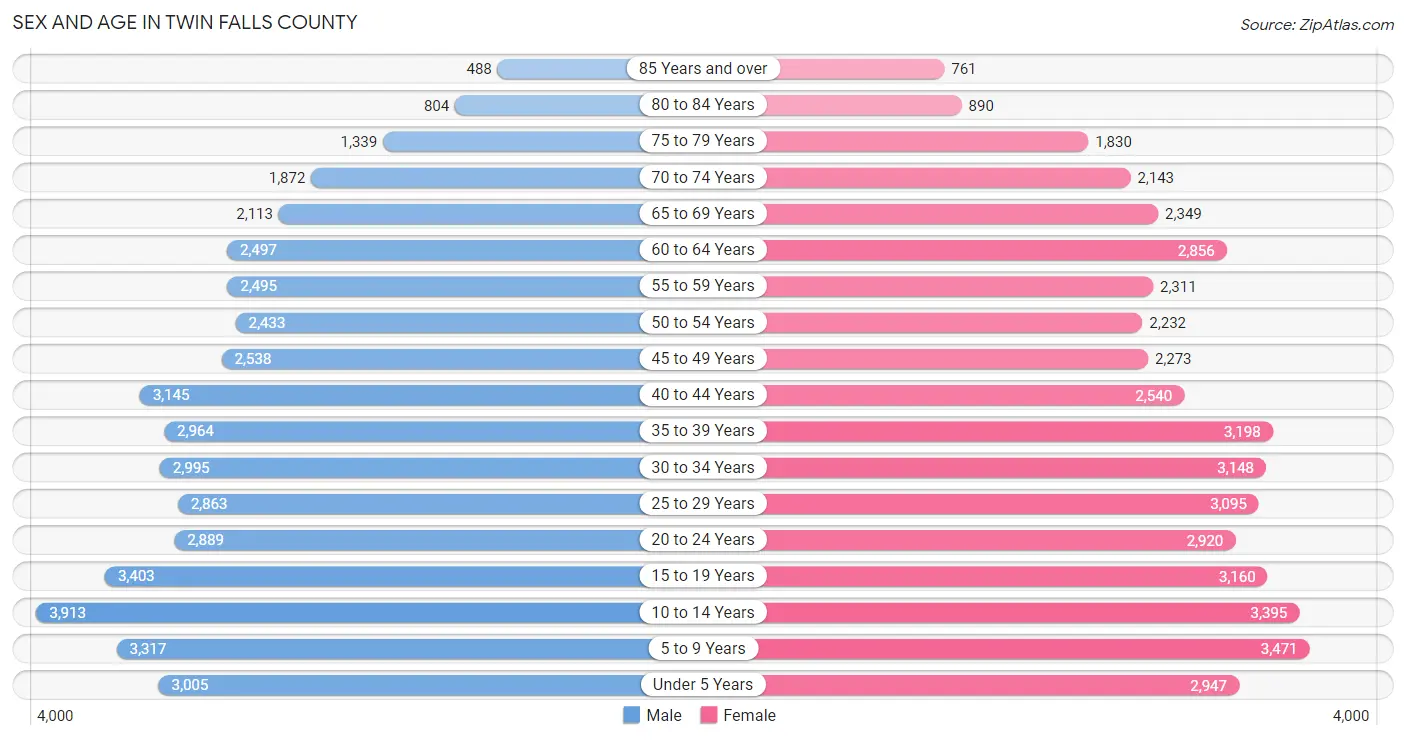
The most populous age groups in Twin Falls County are 10 to 14 Years (3,913 | 8.7%) for men and 5 to 9 Years (3,471 | 7.6%) for women.
| Age Bracket | Male | Female |
| Under 5 Years | 3,005 (6.7%) | 2,947 (6.5%) |
| 5 to 9 Years | 3,317 (7.4%) | 3,471 (7.6%) |
| 10 to 14 Years | 3,913 (8.7%) | 3,395 (7.5%) |
| 15 to 19 Years | 3,403 (7.5%) | 3,160 (6.9%) |
| 20 to 24 Years | 2,889 (6.4%) | 2,920 (6.4%) |
| 25 to 29 Years | 2,863 (6.4%) | 3,095 (6.8%) |
| 30 to 34 Years | 2,995 (6.6%) | 3,148 (6.9%) |
| 35 to 39 Years | 2,964 (6.6%) | 3,198 (7.0%) |
| 40 to 44 Years | 3,145 (7.0%) | 2,540 (5.6%) |
| 45 to 49 Years | 2,538 (5.6%) | 2,273 (5.0%) |
| 50 to 54 Years | 2,433 (5.4%) | 2,232 (4.9%) |
| 55 to 59 Years | 2,495 (5.5%) | 2,311 (5.1%) |
| 60 to 64 Years | 2,497 (5.5%) | 2,856 (6.3%) |
| 65 to 69 Years | 2,113 (4.7%) | 2,349 (5.2%) |
| 70 to 74 Years | 1,872 (4.2%) | 2,143 (4.7%) |
| 75 to 79 Years | 1,339 (3.0%) | 1,830 (4.0%) |
| 80 to 84 Years | 804 (1.8%) | 890 (2.0%) |
| 85 Years and over | 488 (1.1%) | 761 (1.7%) |
| Total | 45,073 (100.0%) | 45,519 (100.0%) |
Families and Households in Twin Falls County
Median Family Size in Twin Falls County
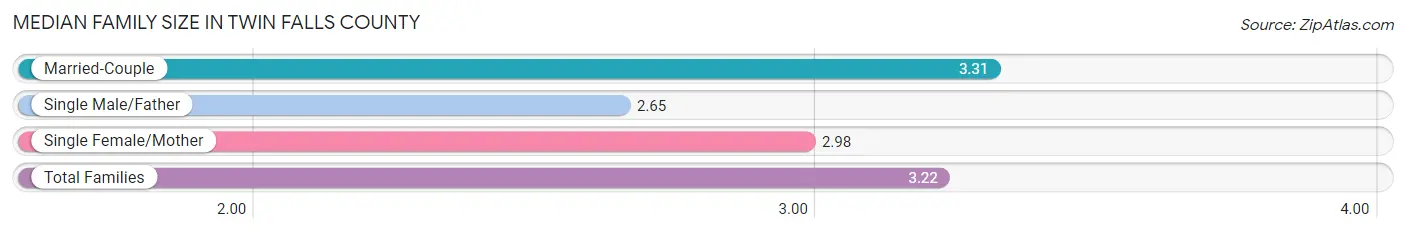
The median family size in Twin Falls County is 3.22 persons per family, with married-couple families (18,330 | 79.4%) accounting for the largest median family size of 3.31 persons per family. On the other hand, single male/father families (1,505 | 6.5%) represent the smallest median family size with 2.65 persons per family.
| Family Type | # Families | Family Size |
| Married-Couple | 18,330 (79.4%) | 3.31 |
| Single Male/Father | 1,505 (6.5%) | 2.65 |
| Single Female/Mother | 3,261 (14.1%) | 2.98 |
| Total Families | 23,096 (100.0%) | 3.22 |
Median Household Size in Twin Falls County
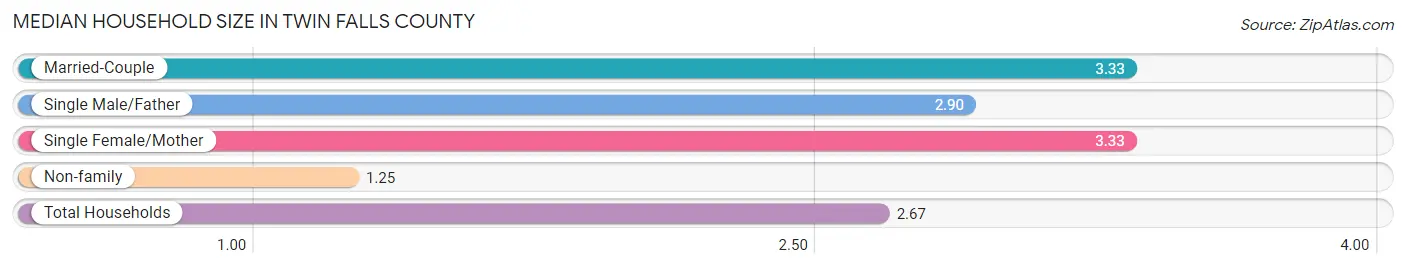
The median household size in Twin Falls County is 2.67 persons per household, with married-couple households (18,330 | 54.9%) accounting for the largest median household size of 3.33 persons per household. non-family households (10,264 | 30.8%) represent the smallest median household size with 1.25 persons per household.
| Household Type | # Households | Household Size |
| Married-Couple | 18,330 (54.9%) | 3.33 |
| Single Male/Father | 1,505 (4.5%) | 2.90 |
| Single Female/Mother | 3,261 (9.8%) | 3.33 |
| Non-family | 10,264 (30.8%) | 1.25 |
| Total Households | 33,360 (100.0%) | 2.67 |
Household Size by Marriage Status in Twin Falls County
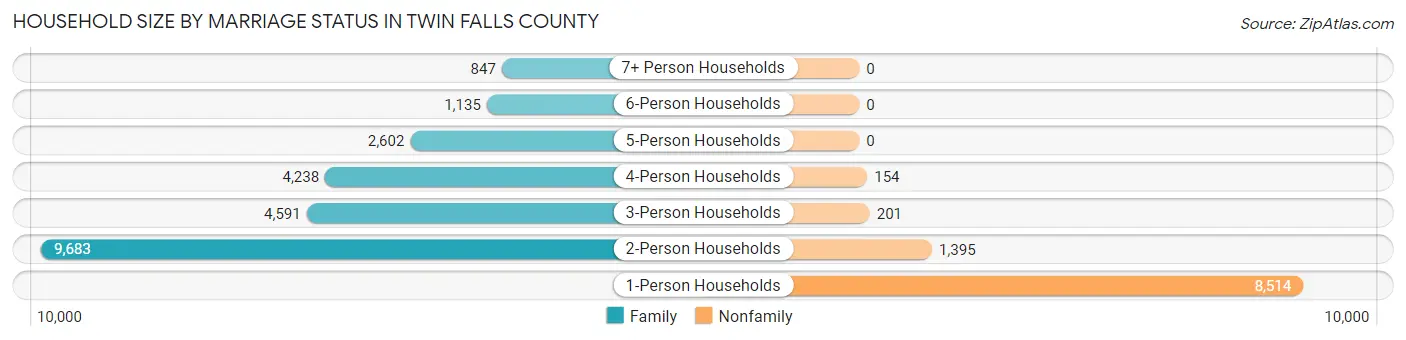
Out of a total of 33,360 households in Twin Falls County, 23,096 (69.2%) are family households, while 10,264 (30.8%) are nonfamily households. The most numerous type of family households are 2-person households, comprising 9,683, and the most common type of nonfamily households are 1-person households, comprising 8,514.
| Household Size | Family Households | Nonfamily Households |
| 1-Person Households | - | 8,514 (25.5%) |
| 2-Person Households | 9,683 (29.0%) | 1,395 (4.2%) |
| 3-Person Households | 4,591 (13.8%) | 201 (0.6%) |
| 4-Person Households | 4,238 (12.7%) | 154 (0.5%) |
| 5-Person Households | 2,602 (7.8%) | 0 (0.0%) |
| 6-Person Households | 1,135 (3.4%) | 0 (0.0%) |
| 7+ Person Households | 847 (2.5%) | 0 (0.0%) |
| Total | 23,096 (69.2%) | 10,264 (30.8%) |
Female Fertility in Twin Falls County
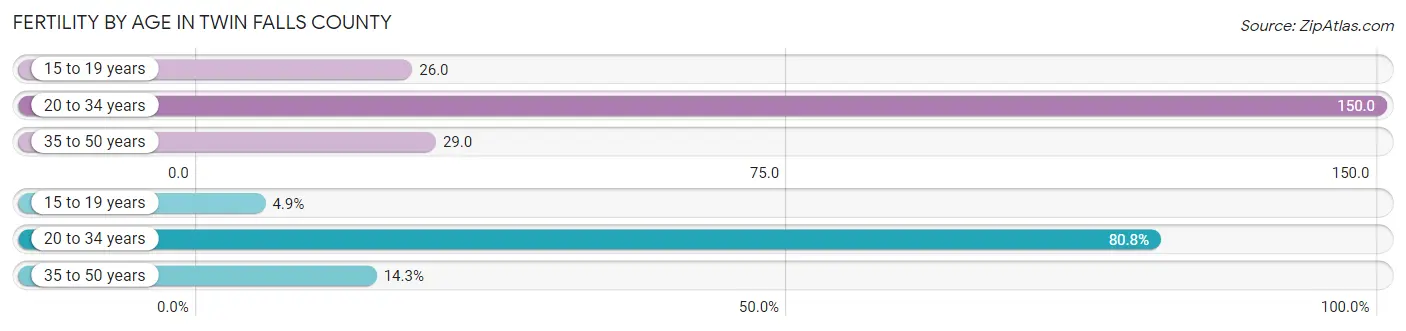
Fertility by Age in Twin Falls County
Average fertility rate in Twin Falls County is 82.0 births per 1,000 women. Women in the age bracket of 20 to 34 years have the highest fertility rate with 150.0 births per 1,000 women. Women in the age bracket of 20 to 34 years acount for 80.8% of all women with births.
| Age Bracket | Women with Births | Births / 1,000 Women |
| 15 to 19 years | 83 (4.9%) | 26.0 |
| 20 to 34 years | 1,378 (80.8%) | 150.0 |
| 35 to 50 years | 244 (14.3%) | 29.0 |
| Total | 1,705 (100.0%) | 82.0 |
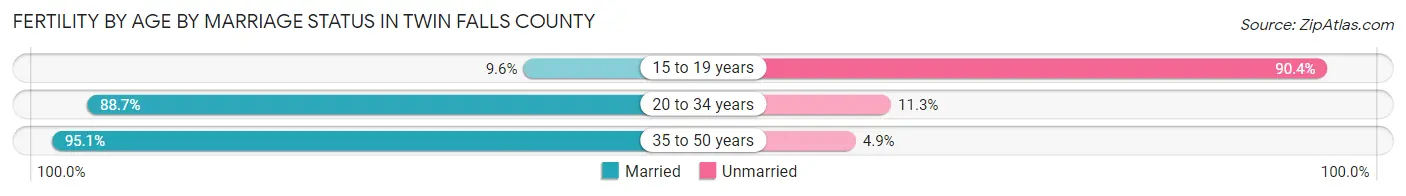
Fertility by Age by Marriage Status in Twin Falls County
85.7% of women with births (1,705) in Twin Falls County are married. The highest percentage of unmarried women with births falls into 15 to 19 years age bracket with 90.4% of them unmarried at the time of birth, while the lowest percentage of unmarried women with births belong to 35 to 50 years age bracket with 4.9% of them unmarried.
| Age Bracket | Married | Unmarried |
| 15 to 19 years | 8 (9.6%) | 75 (90.4%) |
| 20 to 34 years | 1,222 (88.7%) | 156 (11.3%) |
| 35 to 50 years | 232 (95.1%) | 12 (4.9%) |
| Total | 1,461 (85.7%) | 244 (14.3%) |
Fertility by Education in Twin Falls County
Average fertility rate in Twin Falls County is 82.0 births per 1,000 women. Women with the education attainment of bachelor's degree have the highest fertility rate of 123.0 births per 1,000 women, while women with the education attainment of less than high school have the lowest fertility at 31.0 births per 1,000 women. Women with the education attainment of high school diploma represent 34.4% of all women with births.

| Educational Attainment | Women with Births | Births / 1,000 Women |
| Less than High School | 129 (7.6%) | 31.0 |
| High School Diploma | 587 (34.4%) | 118.0 |
| College or Associate's Degree | 548 (32.1%) | 75.0 |
| Bachelor's Degree | 377 (22.1%) | 123.0 |
| Graduate Degree | 64 (3.7%) | 48.0 |
| Total | 1,705 (100.0%) | 82.0 |
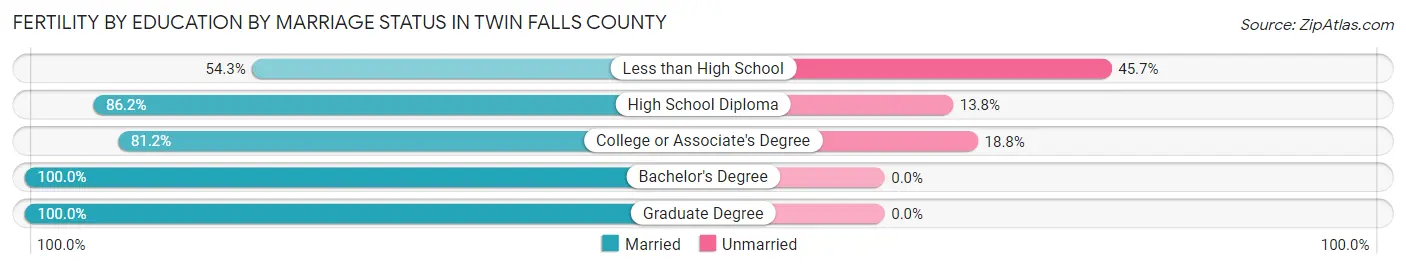
Fertility by Education by Marriage Status in Twin Falls County
14.3% of women with births in Twin Falls County are unmarried. Women with the educational attainment of bachelor's degree are most likely to be married with 100.0% of them married at childbirth, while women with the educational attainment of less than high school are least likely to be married with 45.7% of them unmarried at childbirth.
| Educational Attainment | Married | Unmarried |
| Less than High School | 70 (54.3%) | 59 (45.7%) |
| High School Diploma | 506 (86.2%) | 81 (13.8%) |
| College or Associate's Degree | 445 (81.2%) | 103 (18.8%) |
| Bachelor's Degree | 377 (100.0%) | 0 (0.0%) |
| Graduate Degree | 64 (100.0%) | 0 (0.0%) |
| Total | 1,461 (85.7%) | 244 (14.3%) |
Income in Twin Falls County
Income Overview in Twin Falls County
Per Capita Income in Twin Falls County is $32,393, while median incomes of families and households are $73,929 and $61,183 respectively.
| Characteristic | Number | Measure |
| Per Capita Income | 90,592 | $32,393 |
| Median Family Income | 23,096 | $73,929 |
| Mean Family Income | 23,096 | $97,580 |
| Median Household Income | 33,360 | $61,183 |
| Mean Household Income | 33,360 | $84,035 |
| Income Deficit | 23,096 | $9,804 |
| Wage / Income Gap (%) | 90,592 | 41.13% |
| Wage / Income Gap ($) | 90,592 | 58.87¢ per $1 |
| Gini / Inequality Index | 90,592 | 0.45 |
Earnings by Sex in Twin Falls County
Average Earnings in Twin Falls County are $34,448, $44,087 for men and $25,956 for women, a difference of 41.1%.
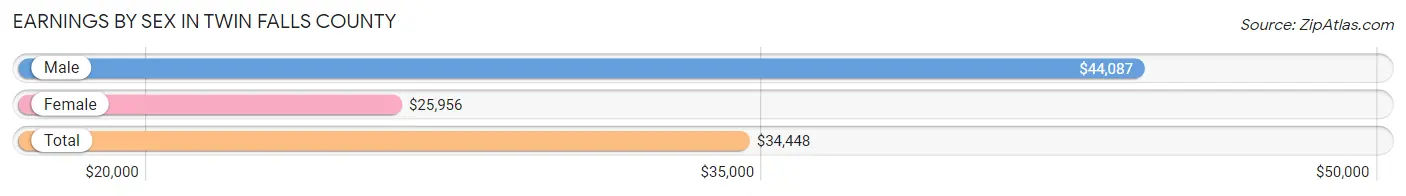
| Sex | Number | Average Earnings |
| Male | 25,723 (54.7%) | $44,087 |
| Female | 21,268 (45.3%) | $25,956 |
| Total | 46,991 (100.0%) | $34,448 |
Earnings by Sex by Income Bracket in Twin Falls County
The most common earnings brackets in Twin Falls County are $100,000+ for men (3,241 | 12.6%) and $30,000 to $34,999 for women (1,816 | 8.5%).
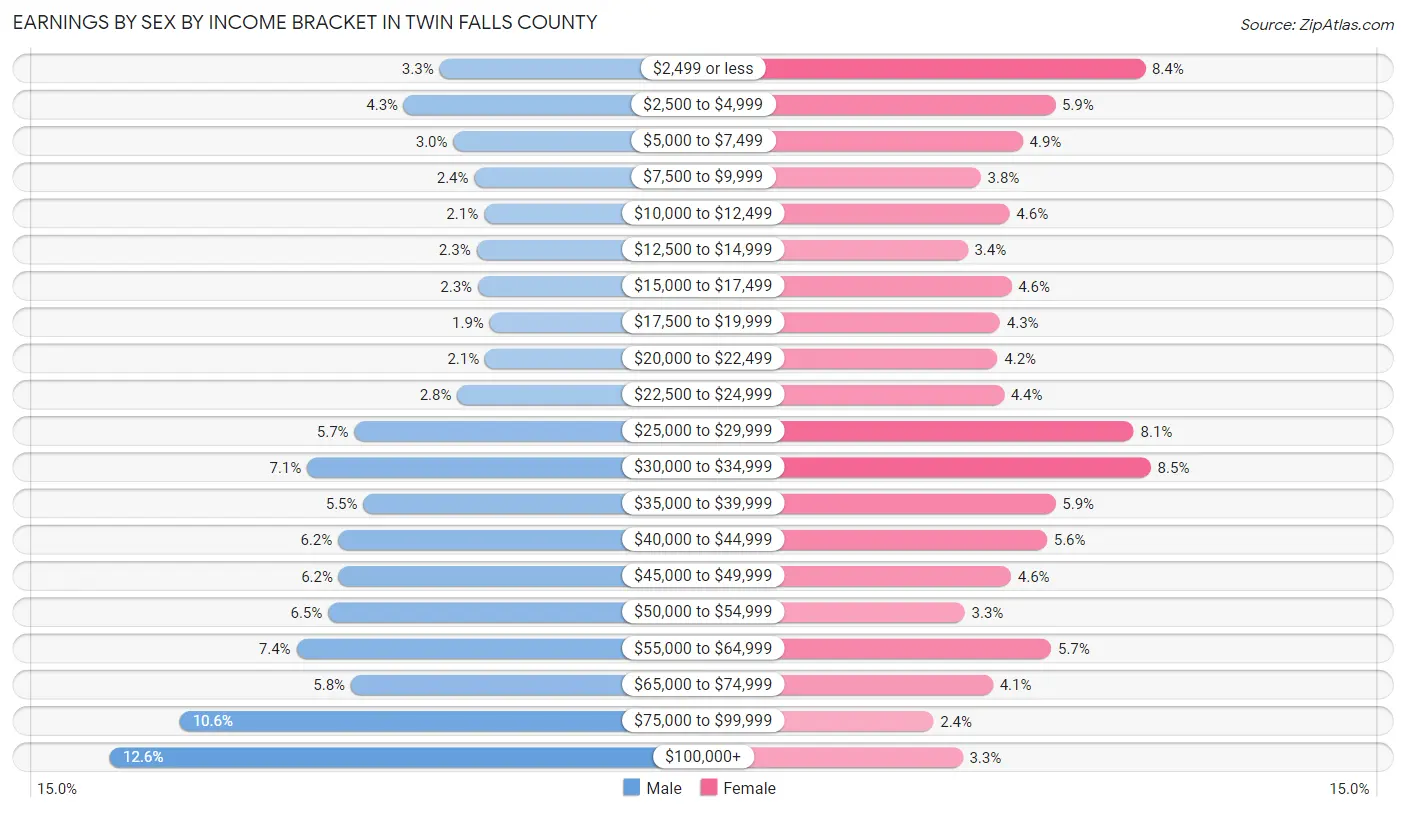
| Income | Male | Female |
| $2,499 or less | 859 (3.3%) | 1,783 (8.4%) |
| $2,500 to $4,999 | 1,117 (4.3%) | 1,244 (5.9%) |
| $5,000 to $7,499 | 758 (2.9%) | 1,051 (4.9%) |
| $7,500 to $9,999 | 606 (2.4%) | 800 (3.8%) |
| $10,000 to $12,499 | 538 (2.1%) | 973 (4.6%) |
| $12,500 to $14,999 | 591 (2.3%) | 722 (3.4%) |
| $15,000 to $17,499 | 582 (2.3%) | 982 (4.6%) |
| $17,500 to $19,999 | 496 (1.9%) | 915 (4.3%) |
| $20,000 to $22,499 | 531 (2.1%) | 900 (4.2%) |
| $22,500 to $24,999 | 731 (2.8%) | 937 (4.4%) |
| $25,000 to $29,999 | 1,474 (5.7%) | 1,715 (8.1%) |
| $30,000 to $34,999 | 1,817 (7.1%) | 1,816 (8.5%) |
| $35,000 to $39,999 | 1,409 (5.5%) | 1,247 (5.9%) |
| $40,000 to $44,999 | 1,592 (6.2%) | 1,196 (5.6%) |
| $45,000 to $49,999 | 1,588 (6.2%) | 981 (4.6%) |
| $50,000 to $54,999 | 1,663 (6.5%) | 705 (3.3%) |
| $55,000 to $64,999 | 1,892 (7.4%) | 1,221 (5.7%) |
| $65,000 to $74,999 | 1,500 (5.8%) | 872 (4.1%) |
| $75,000 to $99,999 | 2,738 (10.6%) | 516 (2.4%) |
| $100,000+ | 3,241 (12.6%) | 692 (3.3%) |
| Total | 25,723 (100.0%) | 21,268 (100.0%) |
Earnings by Sex by Educational Attainment in Twin Falls County
Average earnings in Twin Falls County are $50,591 for men and $29,243 for women, a difference of 42.2%. Men with an educational attainment of graduate degree enjoy the highest average annual earnings of $71,397, while those with less than high school education earn the least with $42,860. Women with an educational attainment of graduate degree earn the most with the average annual earnings of $53,028, while those with less than high school education have the smallest earnings of $22,339.
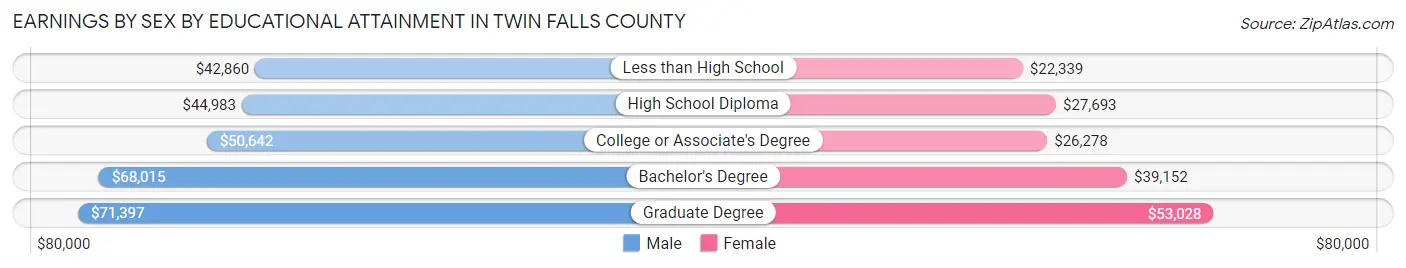
| Educational Attainment | Male Income | Female Income |
| Less than High School | $42,860 | $22,339 |
| High School Diploma | $44,983 | $27,693 |
| College or Associate's Degree | $50,642 | $26,278 |
| Bachelor's Degree | $68,015 | $39,152 |
| Graduate Degree | $71,397 | $53,028 |
| Total | $50,591 | $29,243 |
Family Income in Twin Falls County
Family Income Brackets in Twin Falls County
According to the Twin Falls County family income data, there are 4,873 families falling into the $50,000 to $74,999 income range, which is the most common income bracket and makes up 21.1% of all families. Conversely, the less than $10,000 income bracket is the least frequent group with only 346 families (1.5%) belonging to this category.
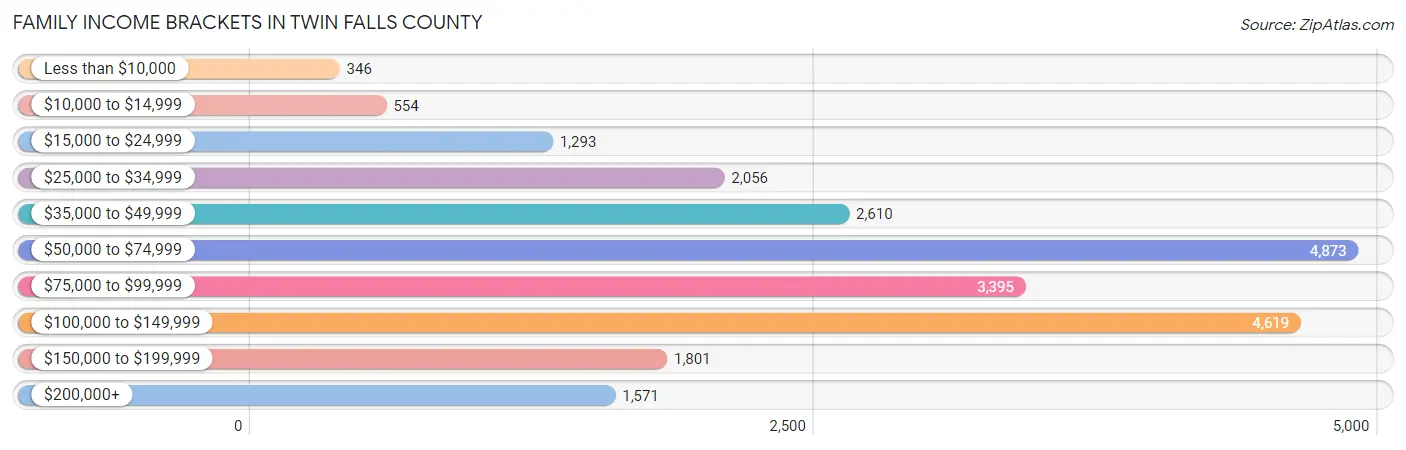
| Income Bracket | # Families | % Families |
| Less than $10,000 | 346 | 1.5% |
| $10,000 to $14,999 | 554 | 2.4% |
| $15,000 to $24,999 | 1,293 | 5.6% |
| $25,000 to $34,999 | 2,056 | 8.9% |
| $35,000 to $49,999 | 2,610 | 11.3% |
| $50,000 to $74,999 | 4,873 | 21.1% |
| $75,000 to $99,999 | 3,395 | 14.7% |
| $100,000 to $149,999 | 4,619 | 20.0% |
| $150,000 to $199,999 | 1,801 | 7.8% |
| $200,000+ | 1,571 | 6.8% |
Family Income by Famaliy Size in Twin Falls County
7+ person families (842 | 3.6%) account for the highest median family income in Twin Falls County with $99,684 per family, while 2-person families (10,511 | 45.5%) have the highest median income of $32,226 per family member.
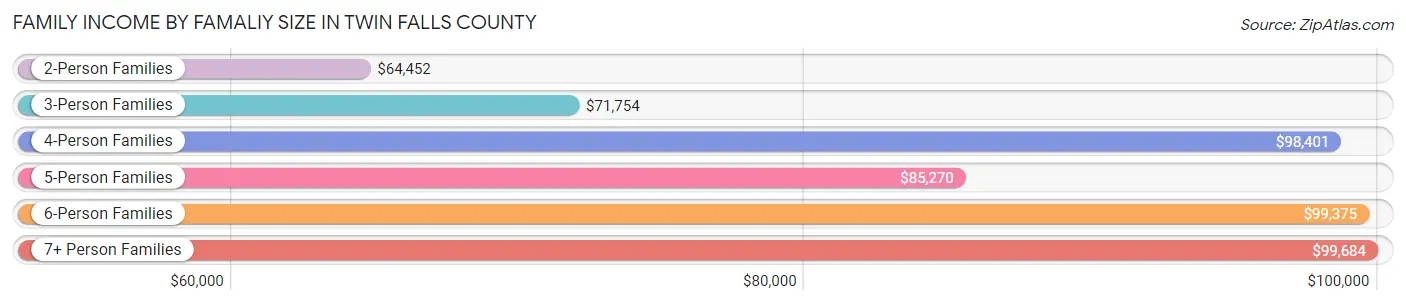
| Income Bracket | # Families | Median Income |
| 2-Person Families | 10,511 (45.5%) | $64,452 |
| 3-Person Families | 4,456 (19.3%) | $71,754 |
| 4-Person Families | 3,796 (16.4%) | $98,401 |
| 5-Person Families | 2,464 (10.7%) | $85,270 |
| 6-Person Families | 1,027 (4.4%) | $99,375 |
| 7+ Person Families | 842 (3.6%) | $99,684 |
| Total | 23,096 (100.0%) | $73,929 |
Family Income by Number of Earners in Twin Falls County
The median family income in Twin Falls County is $73,929, with families comprising 3+ earners (2,657) having the highest median family income of $122,853, while families with 1 earner (7,099) have the lowest median family income of $49,651, accounting for 11.5% and 30.7% of families, respectively.
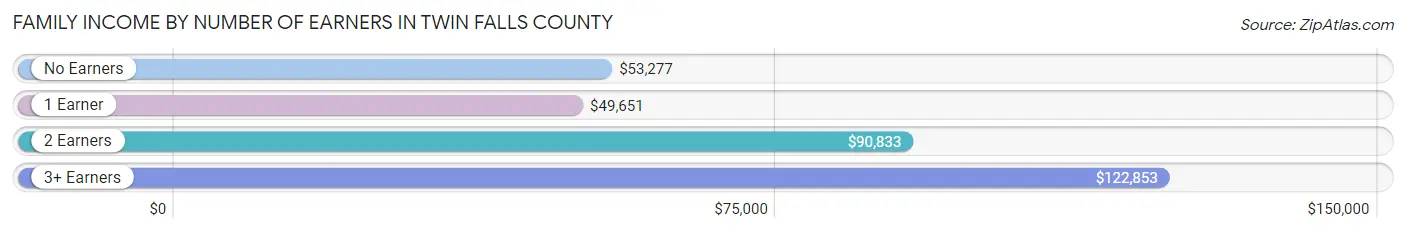
| Number of Earners | # Families | Median Income |
| No Earners | 3,230 (14.0%) | $53,277 |
| 1 Earner | 7,099 (30.7%) | $49,651 |
| 2 Earners | 10,110 (43.8%) | $90,833 |
| 3+ Earners | 2,657 (11.5%) | $122,853 |
| Total | 23,096 (100.0%) | $73,929 |
Household Income in Twin Falls County
Household Income Brackets in Twin Falls County
With 7,039 households falling in the category, the $50,000 to $74,999 income range is the most frequent in Twin Falls County, accounting for 21.1% of all households. In contrast, only 767 households (2.3%) fall into the less than $10,000 income bracket, making it the least populous group.
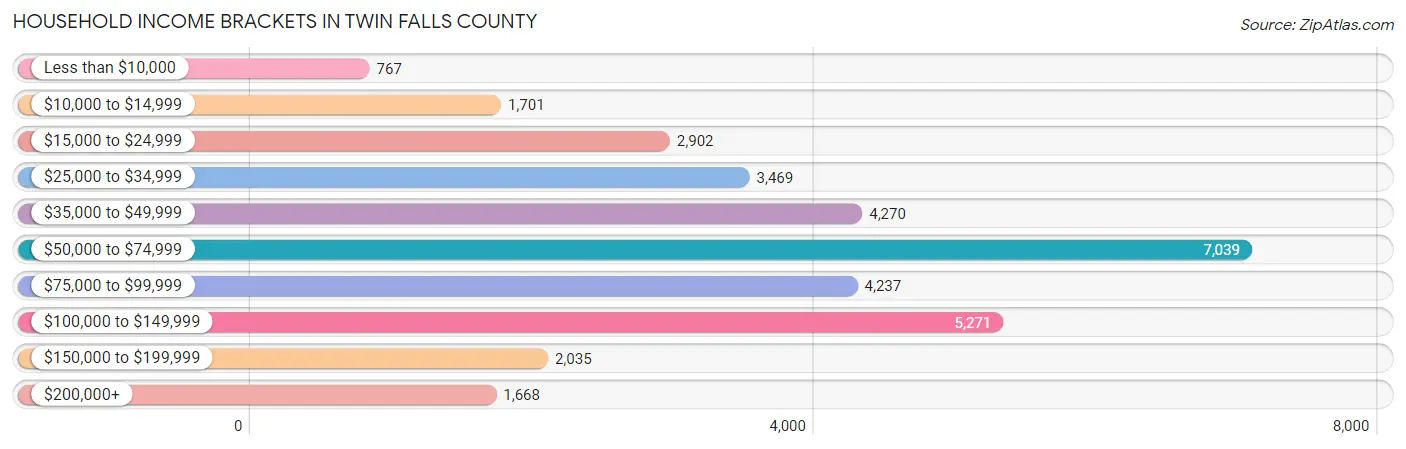
| Income Bracket | # Households | % Households |
| Less than $10,000 | 767 | 2.3% |
| $10,000 to $14,999 | 1,701 | 5.1% |
| $15,000 to $24,999 | 2,902 | 8.7% |
| $25,000 to $34,999 | 3,469 | 10.4% |
| $35,000 to $49,999 | 4,270 | 12.8% |
| $50,000 to $74,999 | 7,039 | 21.1% |
| $75,000 to $99,999 | 4,237 | 12.7% |
| $100,000 to $149,999 | 5,271 | 15.8% |
| $150,000 to $199,999 | 2,035 | 6.1% |
| $200,000+ | 1,668 | 5.0% |
Household Income by Householder Age in Twin Falls County
The median household income in Twin Falls County is $61,183, with the highest median household income of $73,803 found in the 45 to 64 years age bracket for the primary householder. A total of 11,160 households (33.5%) fall into this category. Meanwhile, the 65+ years age bracket for the primary householder has the lowest median household income of $43,783, with 8,711 households (26.1%) in this group.
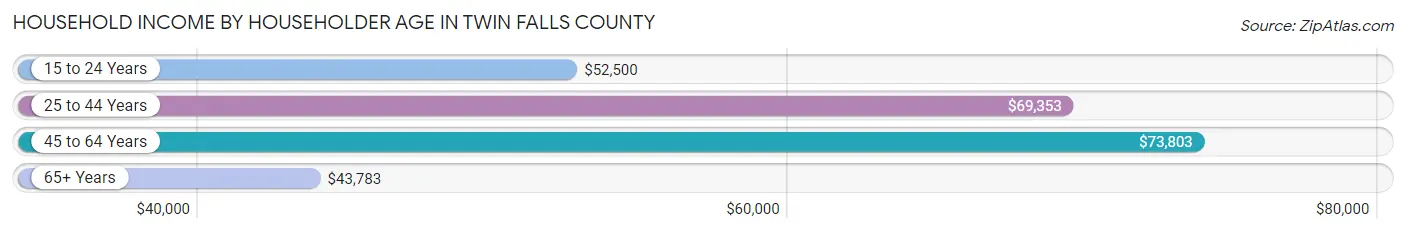
| Income Bracket | # Households | Median Income |
| 15 to 24 Years | 1,820 (5.5%) | $52,500 |
| 25 to 44 Years | 11,669 (35.0%) | $69,353 |
| 45 to 64 Years | 11,160 (33.5%) | $73,803 |
| 65+ Years | 8,711 (26.1%) | $43,783 |
| Total | 33,360 (100.0%) | $61,183 |
Poverty in Twin Falls County
Income Below Poverty by Sex and Age in Twin Falls County
With 11.9% poverty level for males and 13.0% for females among the residents of Twin Falls County, 5 year old males and under 5 year old females are the most vulnerable to poverty, with 239 males (29.4%) and 688 females (23.4%) in their respective age groups living below the poverty level.
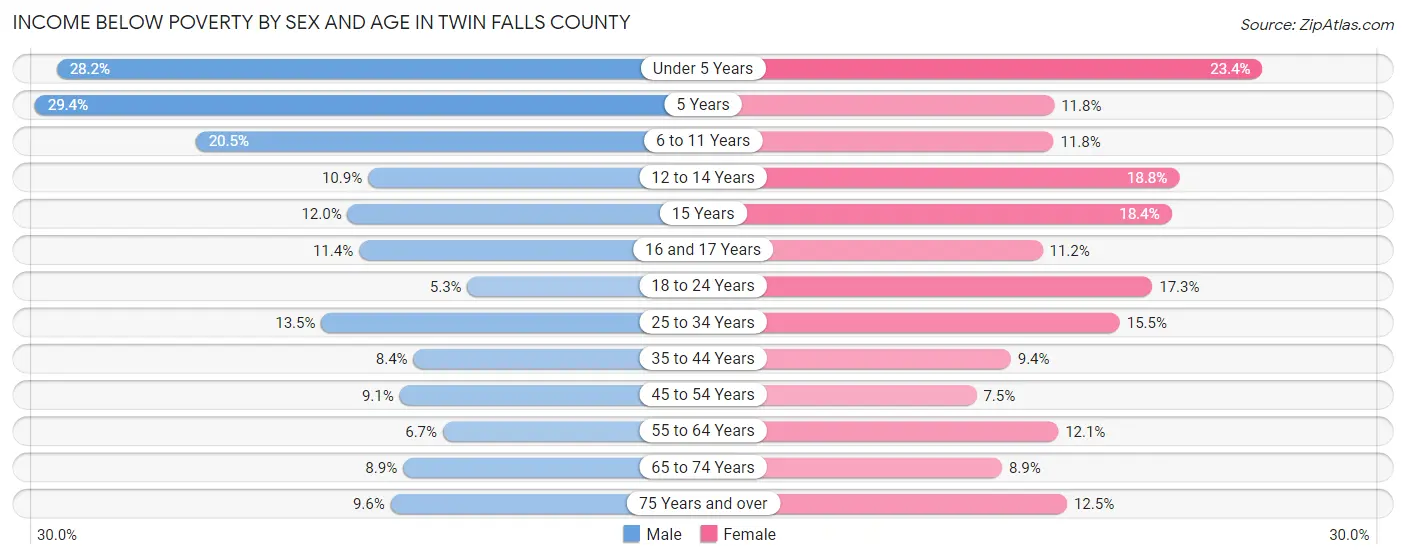
| Age Bracket | Male | Female |
| Under 5 Years | 844 (28.2%) | 688 (23.4%) |
| 5 Years | 239 (29.4%) | 68 (11.8%) |
| 6 to 11 Years | 868 (20.5%) | 490 (11.8%) |
| 12 to 14 Years | 230 (10.9%) | 398 (18.8%) |
| 15 Years | 72 (12.0%) | 157 (18.4%) |
| 16 and 17 Years | 163 (11.4%) | 135 (11.2%) |
| 18 to 24 Years | 212 (5.3%) | 645 (17.3%) |
| 25 to 34 Years | 782 (13.5%) | 958 (15.5%) |
| 35 to 44 Years | 504 (8.4%) | 537 (9.4%) |
| 45 to 54 Years | 450 (9.1%) | 335 (7.5%) |
| 55 to 64 Years | 334 (6.7%) | 618 (12.0%) |
| 65 to 74 Years | 350 (8.9%) | 392 (8.9%) |
| 75 Years and over | 246 (9.6%) | 411 (12.5%) |
| Total | 5,294 (11.9%) | 5,832 (13.0%) |
Income Above Poverty by Sex and Age in Twin Falls County
According to the poverty statistics in Twin Falls County, males aged 18 to 24 years and females aged 45 to 54 years are the age groups that are most secure financially, with 94.7% of males and 92.5% of females in these age groups living above the poverty line.
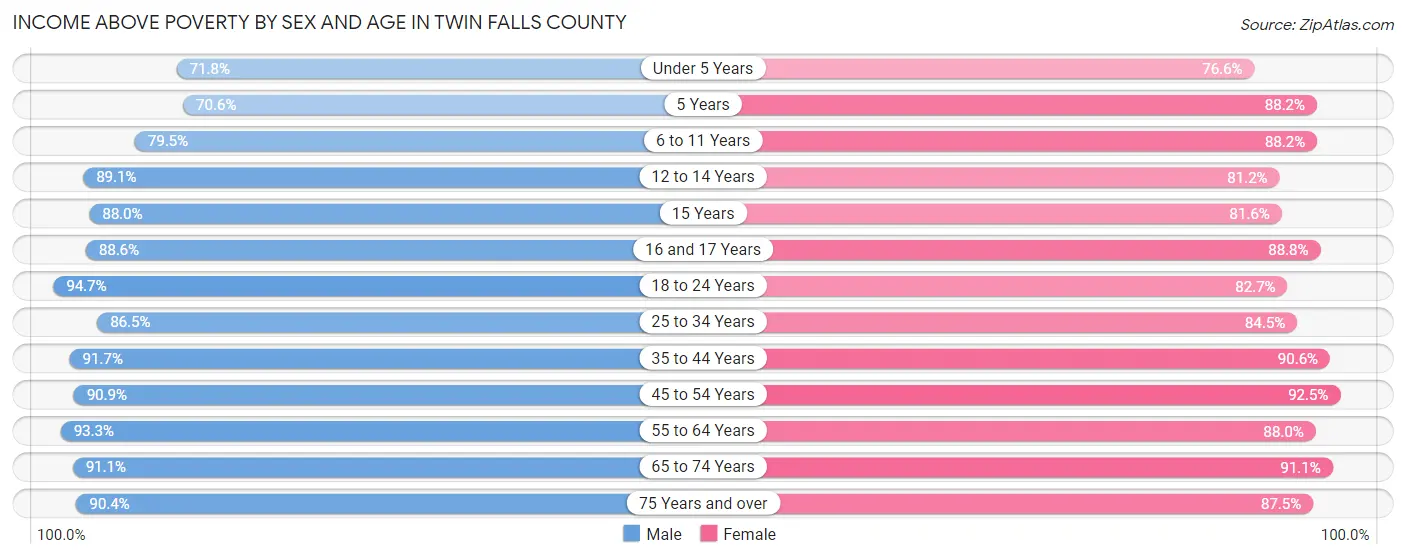
| Age Bracket | Male | Female |
| Under 5 Years | 2,148 (71.8%) | 2,250 (76.6%) |
| 5 Years | 573 (70.6%) | 507 (88.2%) |
| 6 to 11 Years | 3,373 (79.5%) | 3,667 (88.2%) |
| 12 to 14 Years | 1,883 (89.1%) | 1,721 (81.2%) |
| 15 Years | 527 (88.0%) | 698 (81.6%) |
| 16 and 17 Years | 1,269 (88.6%) | 1,072 (88.8%) |
| 18 to 24 Years | 3,757 (94.7%) | 3,085 (82.7%) |
| 25 to 34 Years | 5,021 (86.5%) | 5,231 (84.5%) |
| 35 to 44 Years | 5,535 (91.6%) | 5,168 (90.6%) |
| 45 to 54 Years | 4,486 (90.9%) | 4,132 (92.5%) |
| 55 to 64 Years | 4,646 (93.3%) | 4,510 (87.9%) |
| 65 to 74 Years | 3,569 (91.1%) | 4,002 (91.1%) |
| 75 Years and over | 2,310 (90.4%) | 2,867 (87.5%) |
| Total | 39,097 (88.1%) | 38,910 (87.0%) |
Income Below Poverty Among Married-Couple Families in Twin Falls County
The poverty statistics for married-couple families in Twin Falls County show that 6.4% or 1,172 of the total 18,330 families live below the poverty line. Families with 5 or more children have the highest poverty rate of 19.5%, comprising of 107 families. On the other hand, families with no children have the lowest poverty rate of 3.7%, which includes 368 families.
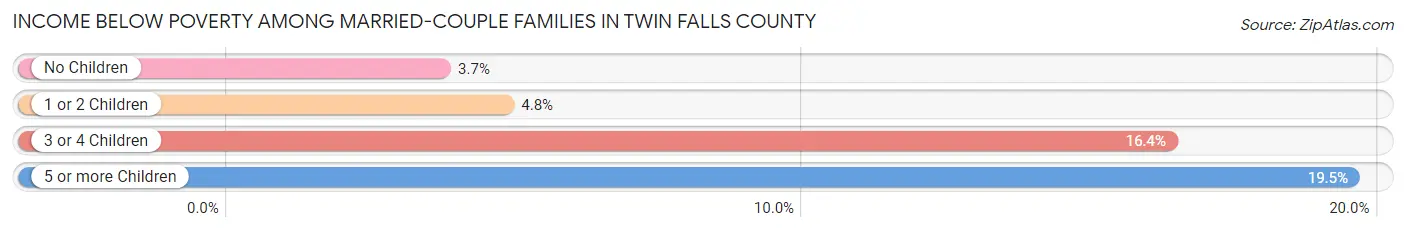
| Children | Above Poverty | Below Poverty |
| No Children | 9,543 (96.3%) | 368 (3.7%) |
| 1 or 2 Children | 4,869 (95.2%) | 246 (4.8%) |
| 3 or 4 Children | 2,305 (83.6%) | 451 (16.4%) |
| 5 or more Children | 441 (80.5%) | 107 (19.5%) |
| Total | 17,158 (93.6%) | 1,172 (6.4%) |
Income Below Poverty Among Single-Parent Households in Twin Falls County
According to the poverty data in Twin Falls County, 6.0% or 91 single-father households and 26.1% or 850 single-mother households are living below the poverty line. Among single-father households, those with 3 or 4 children have the highest poverty rate, with 22 households (26.5%) experiencing poverty. Likewise, among single-mother households, those with 3 or 4 children have the highest poverty rate, with 224 households (66.1%) falling below the poverty line.
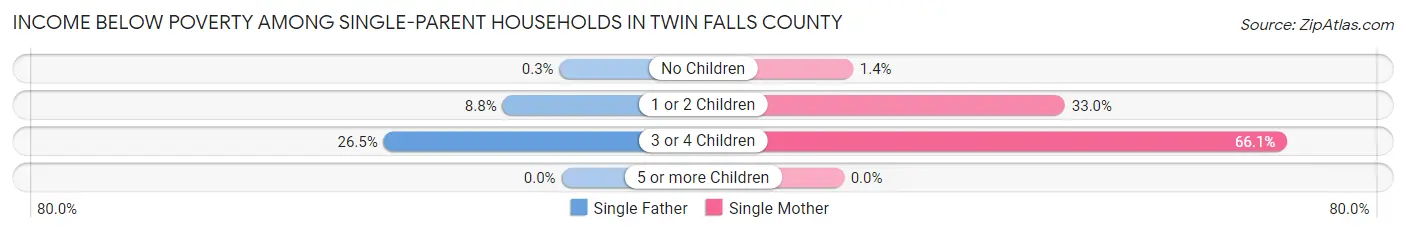
| Children | Single Father | Single Mother |
| No Children | 2 (0.3%) | 14 (1.4%) |
| 1 or 2 Children | 67 (8.8%) | 612 (33.0%) |
| 3 or 4 Children | 22 (26.5%) | 224 (66.1%) |
| 5 or more Children | 0 (0.0%) | 0 (0.0%) |
| Total | 91 (6.0%) | 850 (26.1%) |
Income Below Poverty Among Married-Couple vs Single-Parent Households in Twin Falls County
The poverty data for Twin Falls County shows that 1,172 of the married-couple family households (6.4%) and 941 of the single-parent households (19.7%) are living below the poverty level. Within the married-couple family households, those with 5 or more children have the highest poverty rate, with 107 households (19.5%) falling below the poverty line. Among the single-parent households, those with 3 or 4 children have the highest poverty rate, with 246 household (58.3%) living below poverty.
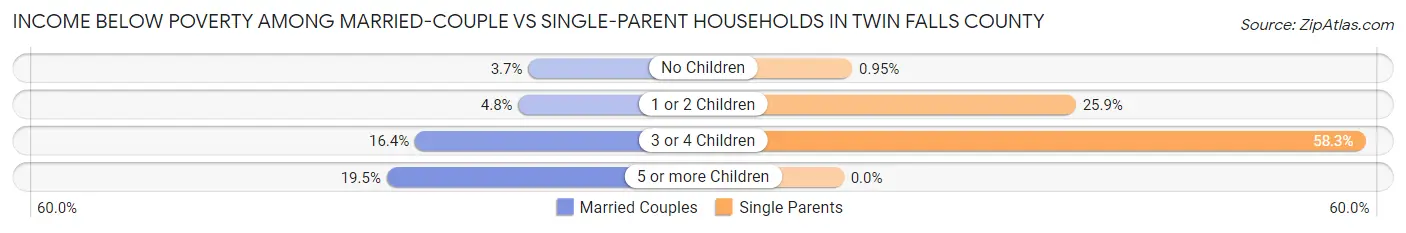
| Children | Married-Couple Families | Single-Parent Households |
| No Children | 368 (3.7%) | 16 (0.9%) |
| 1 or 2 Children | 246 (4.8%) | 679 (25.9%) |
| 3 or 4 Children | 451 (16.4%) | 246 (58.3%) |
| 5 or more Children | 107 (19.5%) | 0 (0.0%) |
| Total | 1,172 (6.4%) | 941 (19.7%) |
Employment Characteristics in Twin Falls County
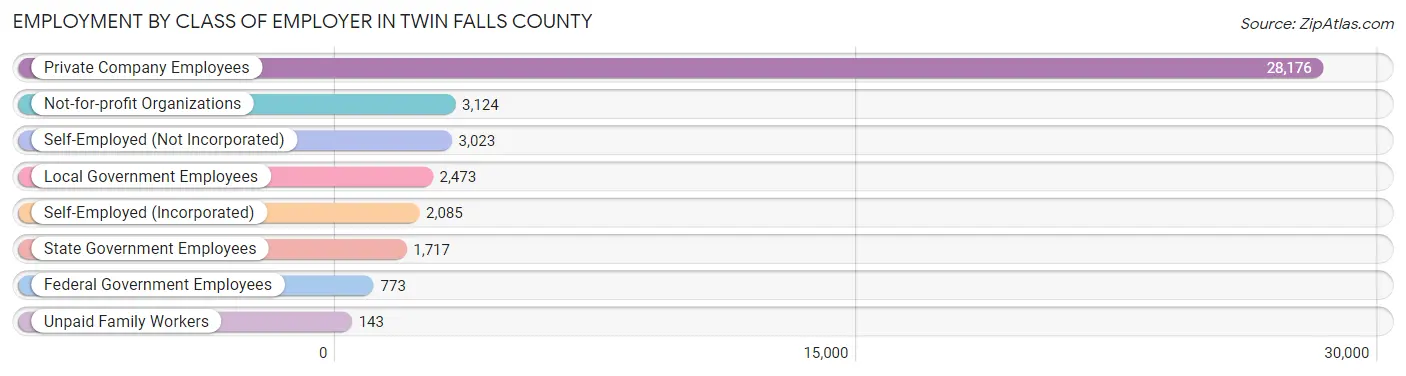
Employment by Class of Employer in Twin Falls County
Among the 41,514 employed individuals in Twin Falls County, private company employees (28,176 | 67.9%), not-for-profit organizations (3,124 | 7.5%), and self-employed (not incorporated) (3,023 | 7.3%) make up the most common classes of employment.
| Employer Class | # Employees | % Employees |
| Private Company Employees | 28,176 | 67.9% |
| Self-Employed (Incorporated) | 2,085 | 5.0% |
| Self-Employed (Not Incorporated) | 3,023 | 7.3% |
| Not-for-profit Organizations | 3,124 | 7.5% |
| Local Government Employees | 2,473 | 6.0% |
| State Government Employees | 1,717 | 4.1% |
| Federal Government Employees | 773 | 1.9% |
| Unpaid Family Workers | 143 | 0.3% |
| Total | 41,514 | 100.0% |
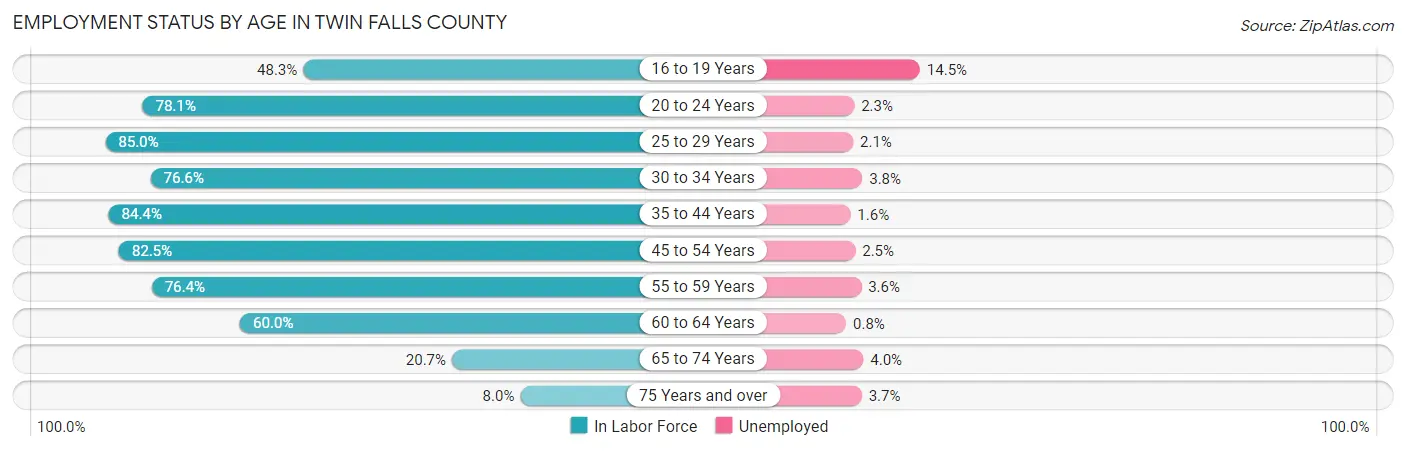
Employment Status by Age in Twin Falls County
According to the labor force statistics for Twin Falls County, out of the total population over 16 years of age (69,090), 63.3% or 43,734 individuals are in the labor force, with 3.1% or 1,356 of them unemployed. The age group with the highest labor force participation rate is 25 to 29 years, with 85.0% or 5,064 individuals in the labor force. Within the labor force, the 16 to 19 years age range has the highest percentage of unemployed individuals, with 14.5% or 358 of them being unemployed.
| Age Bracket | In Labor Force | Unemployed |
| 16 to 19 Years | 2,468 (48.3%) | 358 (14.5%) |
| 20 to 24 Years | 4,537 (78.1%) | 104 (2.3%) |
| 25 to 29 Years | 5,064 (85.0%) | 106 (2.1%) |
| 30 to 34 Years | 4,706 (76.6%) | 179 (3.8%) |
| 35 to 44 Years | 9,999 (84.4%) | 160 (1.6%) |
| 45 to 54 Years | 7,818 (82.5%) | 195 (2.5%) |
| 55 to 59 Years | 3,672 (76.4%) | 132 (3.6%) |
| 60 to 64 Years | 3,212 (60.0%) | 26 (0.8%) |
| 65 to 74 Years | 1,755 (20.7%) | 70 (4.0%) |
| 75 Years and over | 489 (8.0%) | 18 (3.7%) |
| Total | 43,734 (63.3%) | 1,356 (3.1%) |
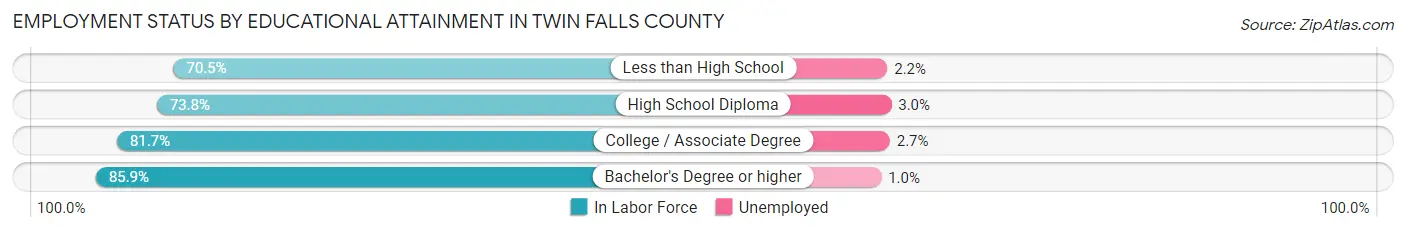
Employment Status by Educational Attainment in Twin Falls County
According to labor force statistics for Twin Falls County, 79.1% of individuals (34,474) out of the total population between 25 and 64 years of age (43,583) are in the labor force, with 2.3% or 793 of them being unemployed. The group with the highest labor force participation rate are those with the educational attainment of bachelor's degree or higher, with 85.9% or 8,612 individuals in the labor force. Within the labor force, individuals with high school diploma education have the highest percentage of unemployment, with 3.0% or 274 of them being unemployed.
| Educational Attainment | In Labor Force | Unemployed |
| Less than High School | 3,708 (70.5%) | 116 (2.2%) |
| High School Diploma | 9,136 (73.8%) | 371 (3.0%) |
| College / Associate Degree | 13,005 (81.7%) | 430 (2.7%) |
| Bachelor's Degree or higher | 8,612 (85.9%) | 100 (1.0%) |
| Total | 34,474 (79.1%) | 1,002 (2.3%) |
Employment Occupations by Sex in Twin Falls County
Management, Business, Science and Arts Occupations
The most common Management, Business, Science and Arts occupations in Twin Falls County are Management (4,836 | 11.4%), Community & Social Service (4,164 | 9.9%), Education Instruction & Library (2,401 | 5.7%), Health Diagnosing & Treating (2,190 | 5.2%), and Health Technologists (1,540 | 3.6%).
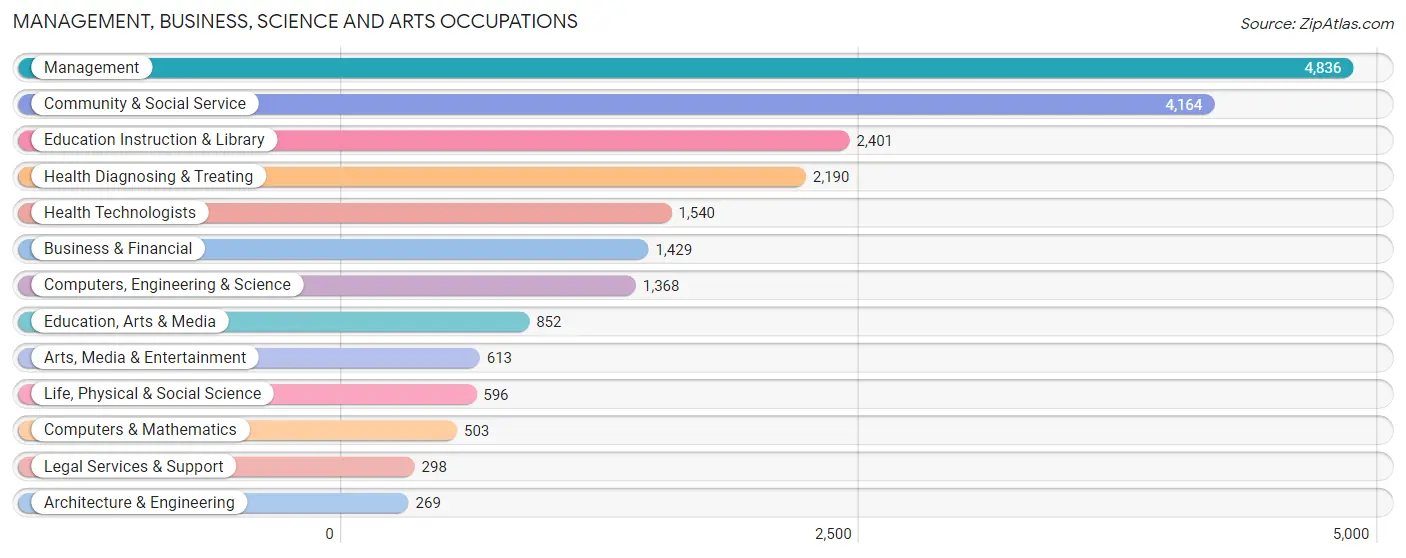
Management, Business, Science and Arts Occupations by Sex
Within the Management, Business, Science and Arts occupations in Twin Falls County, the most male-oriented occupations are Computers & Mathematics (84.9%), Architecture & Engineering (81.0%), and Management (70.2%), while the most female-oriented occupations are Education Instruction & Library (77.6%), Community & Social Service (72.0%), and Education, Arts & Media (68.4%).
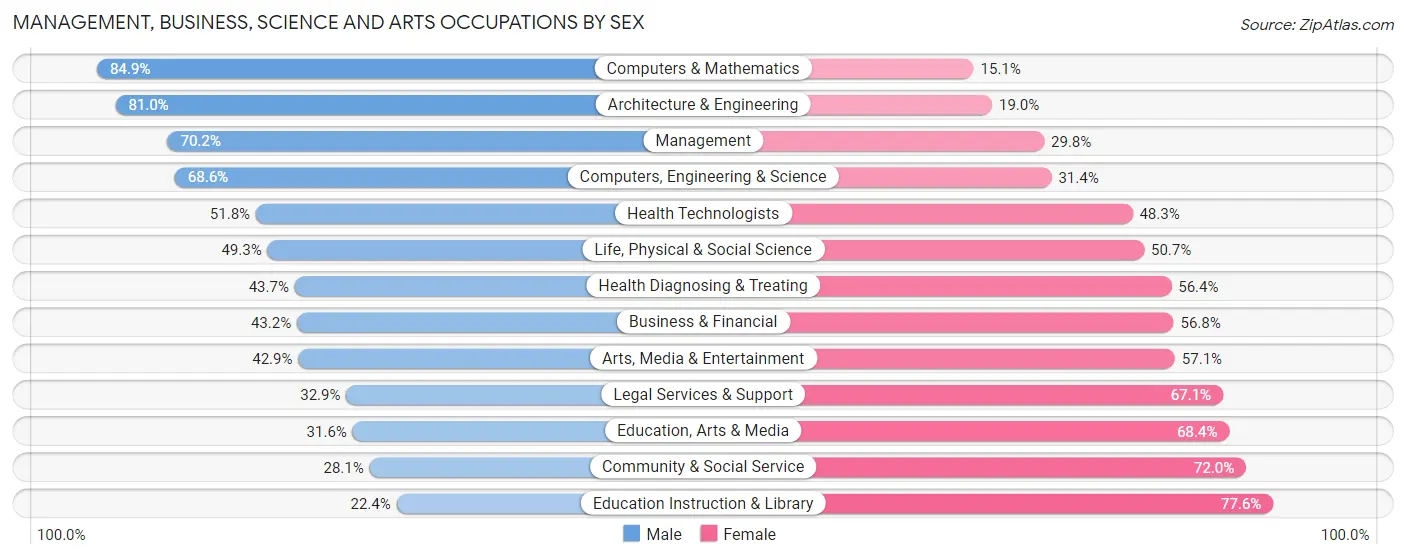
| Occupation | Male | Female |
| Management | 3,394 (70.2%) | 1,442 (29.8%) |
| Business & Financial | 617 (43.2%) | 812 (56.8%) |
| Computers, Engineering & Science | 939 (68.6%) | 429 (31.4%) |
| Computers & Mathematics | 427 (84.9%) | 76 (15.1%) |
| Architecture & Engineering | 218 (81.0%) | 51 (19.0%) |
| Life, Physical & Social Science | 294 (49.3%) | 302 (50.7%) |
| Community & Social Service | 1,168 (28.1%) | 2,996 (72.0%) |
| Education, Arts & Media | 269 (31.6%) | 583 (68.4%) |
| Legal Services & Support | 98 (32.9%) | 200 (67.1%) |
| Education Instruction & Library | 538 (22.4%) | 1,863 (77.6%) |
| Arts, Media & Entertainment | 263 (42.9%) | 350 (57.1%) |
| Health Diagnosing & Treating | 956 (43.6%) | 1,234 (56.4%) |
| Health Technologists | 797 (51.7%) | 743 (48.2%) |
| Total (Category) | 7,074 (50.6%) | 6,913 (49.4%) |
| Total (Overall) | 23,756 (56.2%) | 18,500 (43.8%) |
Services Occupations
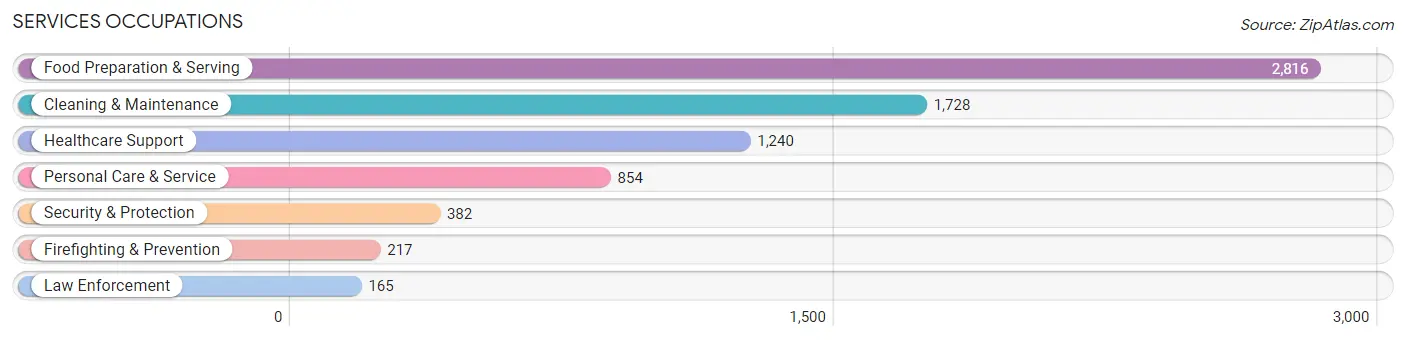
The most common Services occupations in Twin Falls County are Food Preparation & Serving (2,816 | 6.7%), Cleaning & Maintenance (1,728 | 4.1%), Healthcare Support (1,240 | 2.9%), Personal Care & Service (854 | 2.0%), and Security & Protection (382 | 0.9%).
Services Occupations by Sex
Within the Services occupations in Twin Falls County, the most male-oriented occupations are Law Enforcement (84.2%), Security & Protection (78.5%), and Firefighting & Prevention (74.2%), while the most female-oriented occupations are Healthcare Support (86.9%), Personal Care & Service (72.0%), and Food Preparation & Serving (57.0%).
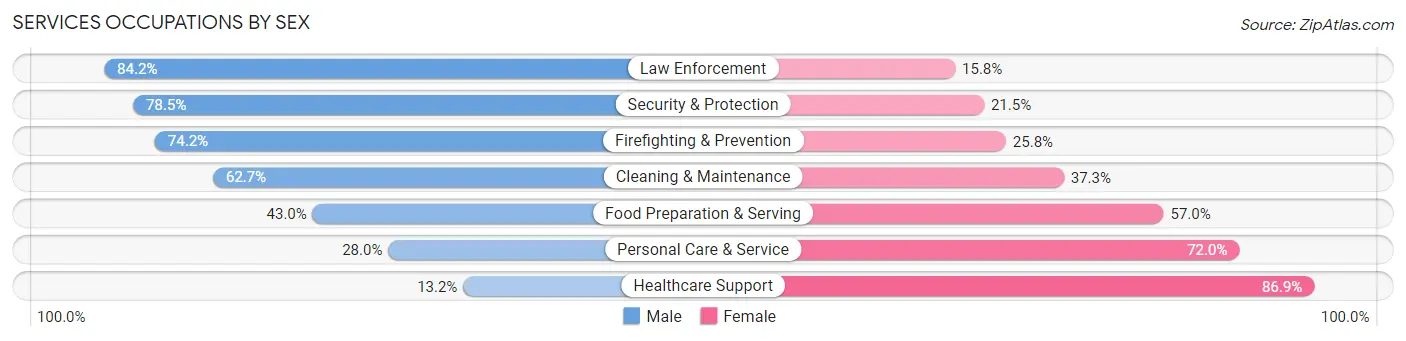
| Occupation | Male | Female |
| Healthcare Support | 163 (13.2%) | 1,077 (86.9%) |
| Security & Protection | 300 (78.5%) | 82 (21.5%) |
| Firefighting & Prevention | 161 (74.2%) | 56 (25.8%) |
| Law Enforcement | 139 (84.2%) | 26 (15.8%) |
| Food Preparation & Serving | 1,210 (43.0%) | 1,606 (57.0%) |
| Cleaning & Maintenance | 1,084 (62.7%) | 644 (37.3%) |
| Personal Care & Service | 239 (28.0%) | 615 (72.0%) |
| Total (Category) | 2,996 (42.7%) | 4,024 (57.3%) |
| Total (Overall) | 23,756 (56.2%) | 18,500 (43.8%) |
Sales and Office Occupations
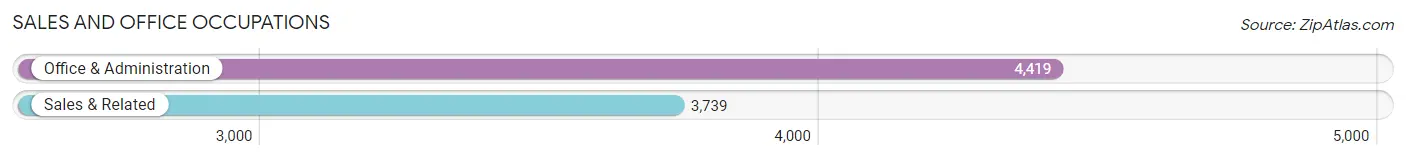
The most common Sales and Office occupations in Twin Falls County are Office & Administration (4,419 | 10.5%), and Sales & Related (3,739 | 8.8%).
Sales and Office Occupations by Sex
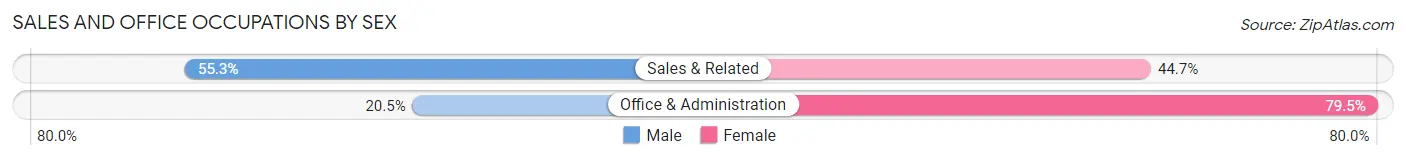
| Occupation | Male | Female |
| Sales & Related | 2,068 (55.3%) | 1,671 (44.7%) |
| Office & Administration | 905 (20.5%) | 3,514 (79.5%) |
| Total (Category) | 2,973 (36.4%) | 5,185 (63.6%) |
| Total (Overall) | 23,756 (56.2%) | 18,500 (43.8%) |
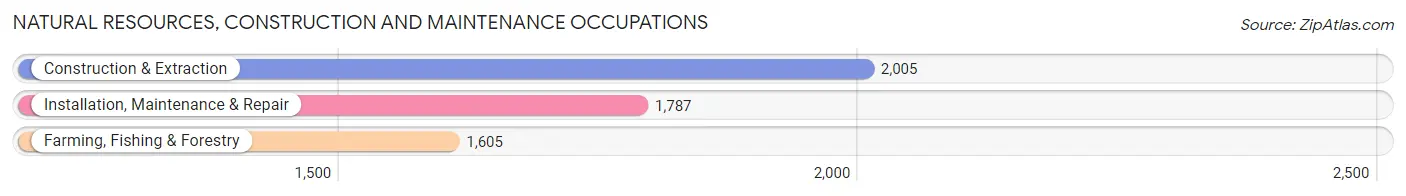
Natural Resources, Construction and Maintenance Occupations
The most common Natural Resources, Construction and Maintenance occupations in Twin Falls County are Construction & Extraction (2,005 | 4.7%), Installation, Maintenance & Repair (1,787 | 4.2%), and Farming, Fishing & Forestry (1,605 | 3.8%).
Natural Resources, Construction and Maintenance Occupations by Sex
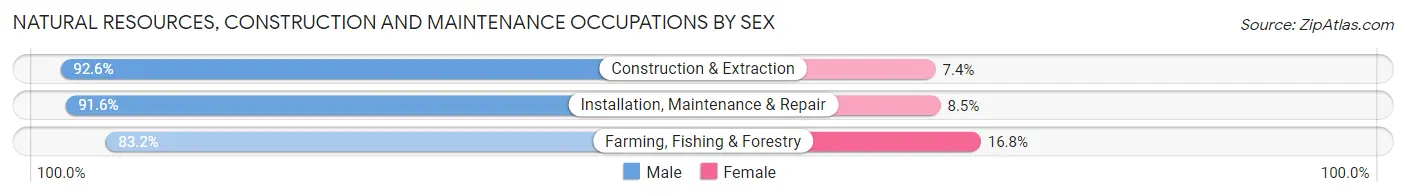
| Occupation | Male | Female |
| Farming, Fishing & Forestry | 1,335 (83.2%) | 270 (16.8%) |
| Construction & Extraction | 1,856 (92.6%) | 149 (7.4%) |
| Installation, Maintenance & Repair | 1,636 (91.5%) | 151 (8.5%) |
| Total (Category) | 4,827 (89.4%) | 570 (10.6%) |
| Total (Overall) | 23,756 (56.2%) | 18,500 (43.8%) |
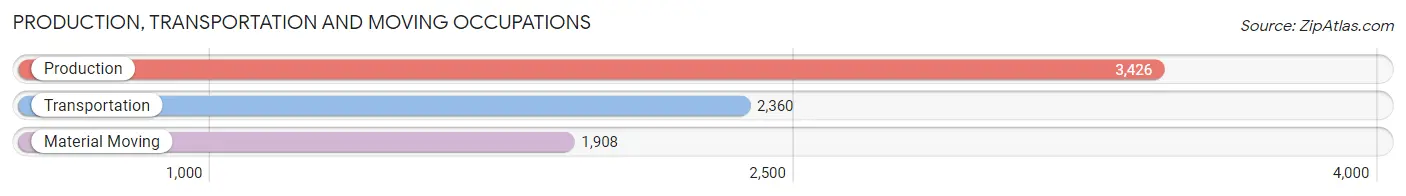
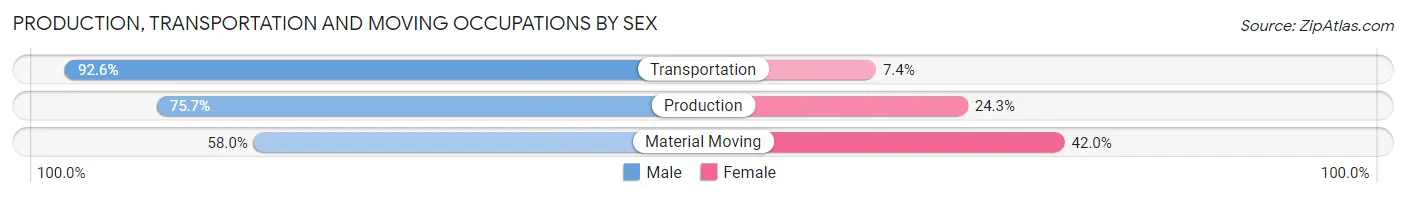
Production, Transportation and Moving Occupations
The most common Production, Transportation and Moving occupations in Twin Falls County are Production (3,426 | 8.1%), Transportation (2,360 | 5.6%), and Material Moving (1,908 | 4.5%).
Production, Transportation and Moving Occupations by Sex
| Occupation | Male | Female |
| Production | 2,595 (75.7%) | 831 (24.3%) |
| Transportation | 2,185 (92.6%) | 175 (7.4%) |
| Material Moving | 1,106 (58.0%) | 802 (42.0%) |
| Total (Category) | 5,886 (76.5%) | 1,808 (23.5%) |
| Total (Overall) | 23,756 (56.2%) | 18,500 (43.8%) |
Employment Industries by Sex in Twin Falls County
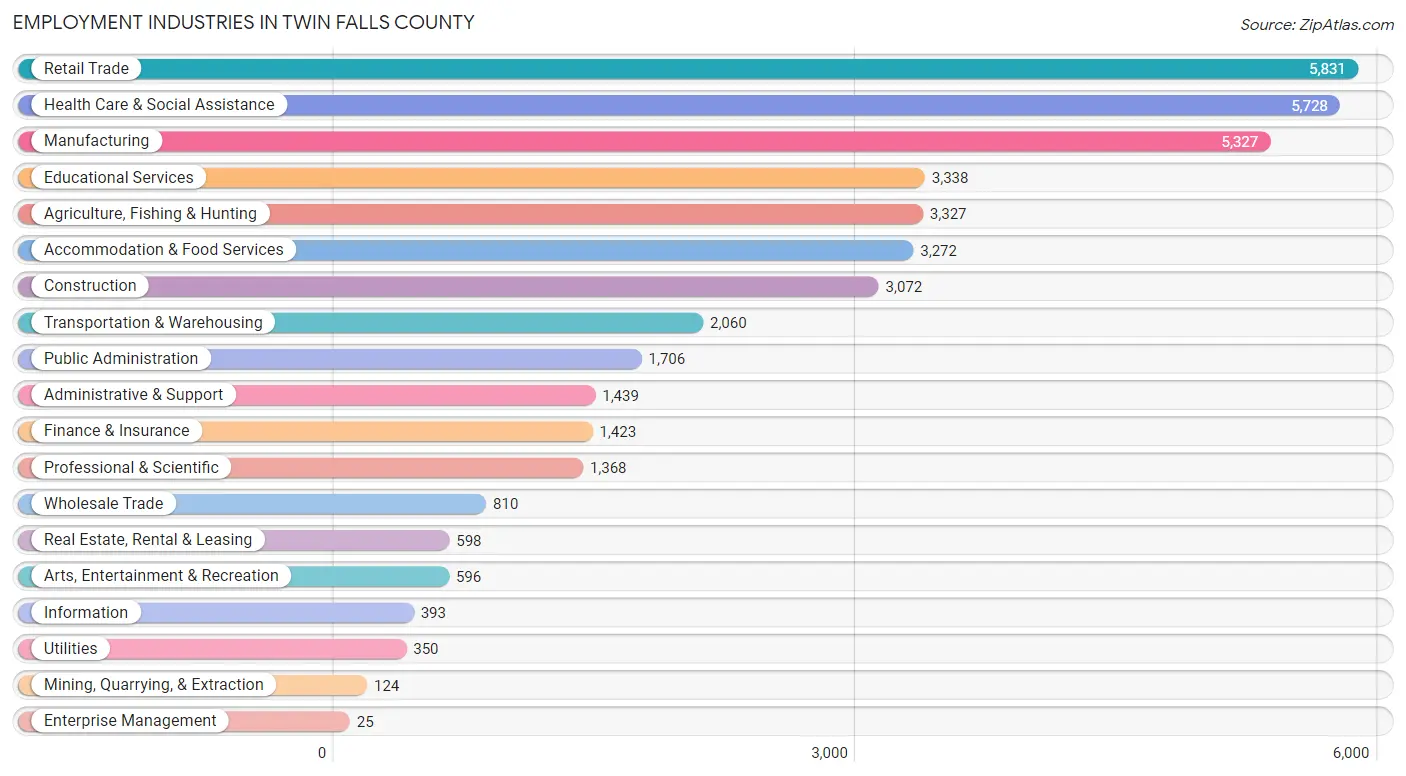
Employment Industries in Twin Falls County
The major employment industries in Twin Falls County include Retail Trade (5,831 | 13.8%), Health Care & Social Assistance (5,728 | 13.6%), Manufacturing (5,327 | 12.6%), Educational Services (3,338 | 7.9%), and Agriculture, Fishing & Hunting (3,327 | 7.9%).
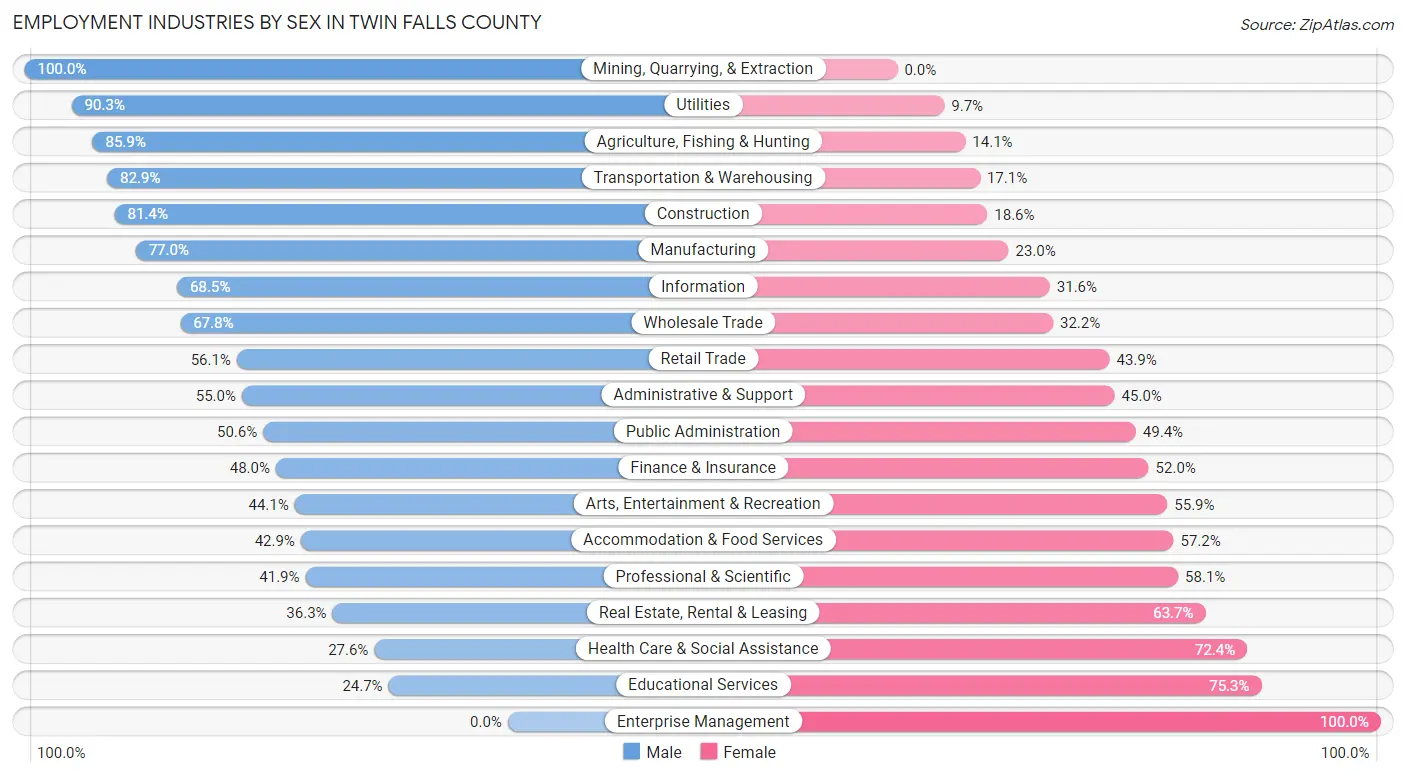
Employment Industries by Sex in Twin Falls County
The Twin Falls County industries that see more men than women are Mining, Quarrying, & Extraction (100.0%), Utilities (90.3%), and Agriculture, Fishing & Hunting (85.9%), whereas the industries that tend to have a higher number of women are Enterprise Management (100.0%), Educational Services (75.3%), and Health Care & Social Assistance (72.4%).
| Industry | Male | Female |
| Agriculture, Fishing & Hunting | 2,859 (85.9%) | 468 (14.1%) |
| Mining, Quarrying, & Extraction | 124 (100.0%) | 0 (0.0%) |
| Construction | 2,500 (81.4%) | 572 (18.6%) |
| Manufacturing | 4,102 (77.0%) | 1,225 (23.0%) |
| Wholesale Trade | 549 (67.8%) | 261 (32.2%) |
| Retail Trade | 3,271 (56.1%) | 2,560 (43.9%) |
| Transportation & Warehousing | 1,708 (82.9%) | 352 (17.1%) |
| Utilities | 316 (90.3%) | 34 (9.7%) |
| Information | 269 (68.4%) | 124 (31.6%) |
| Finance & Insurance | 683 (48.0%) | 740 (52.0%) |
| Real Estate, Rental & Leasing | 217 (36.3%) | 381 (63.7%) |
| Professional & Scientific | 573 (41.9%) | 795 (58.1%) |
| Enterprise Management | 0 (0.0%) | 25 (100.0%) |
| Administrative & Support | 792 (55.0%) | 647 (45.0%) |
| Educational Services | 824 (24.7%) | 2,514 (75.3%) |
| Health Care & Social Assistance | 1,583 (27.6%) | 4,145 (72.4%) |
| Arts, Entertainment & Recreation | 263 (44.1%) | 333 (55.9%) |
| Accommodation & Food Services | 1,402 (42.8%) | 1,870 (57.2%) |
| Public Administration | 864 (50.6%) | 842 (49.4%) |
| Total | 23,756 (56.2%) | 18,500 (43.8%) |
Education in Twin Falls County
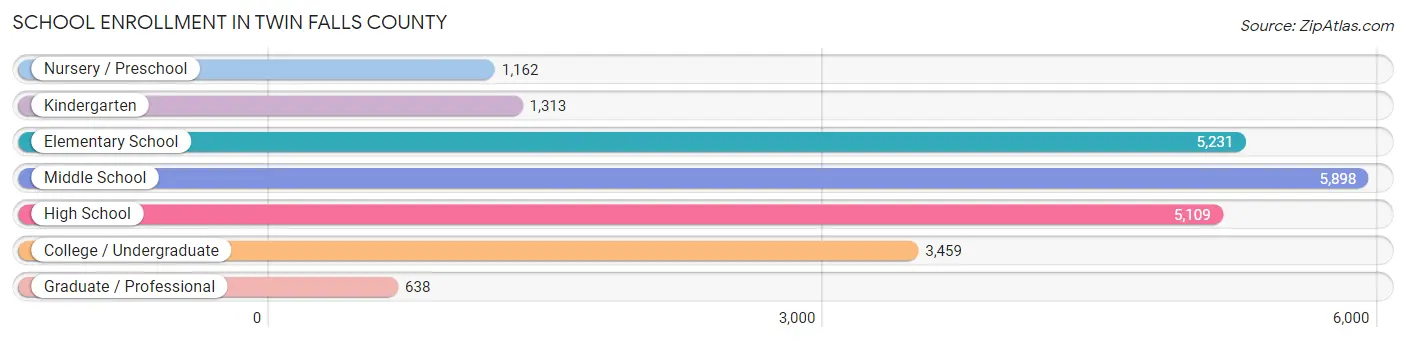
School Enrollment in Twin Falls County
The most common levels of schooling among the 22,810 students in Twin Falls County are middle school (5,898 | 25.9%), elementary school (5,231 | 22.9%), and high school (5,109 | 22.4%).
| School Level | # Students | % Students |
| Nursery / Preschool | 1,162 | 5.1% |
| Kindergarten | 1,313 | 5.8% |
| Elementary School | 5,231 | 22.9% |
| Middle School | 5,898 | 25.9% |
| High School | 5,109 | 22.4% |
| College / Undergraduate | 3,459 | 15.2% |
| Graduate / Professional | 638 | 2.8% |
| Total | 22,810 | 100.0% |
School Enrollment by Age by Funding Source in Twin Falls County
Out of a total of 22,810 students who are enrolled in schools in Twin Falls County, 3,011 (13.2%) attend a private institution, while the remaining 19,799 (86.8%) are enrolled in public schools. The age group of 3 to 4 year olds has the highest likelihood of being enrolled in private schools, with 419 (46.0% in the age bracket) enrolled. Conversely, the age group of 15 to 17 year olds has the lowest likelihood of being enrolled in a private school, with 3,528 (92.2% in the age bracket) attending a public institution.
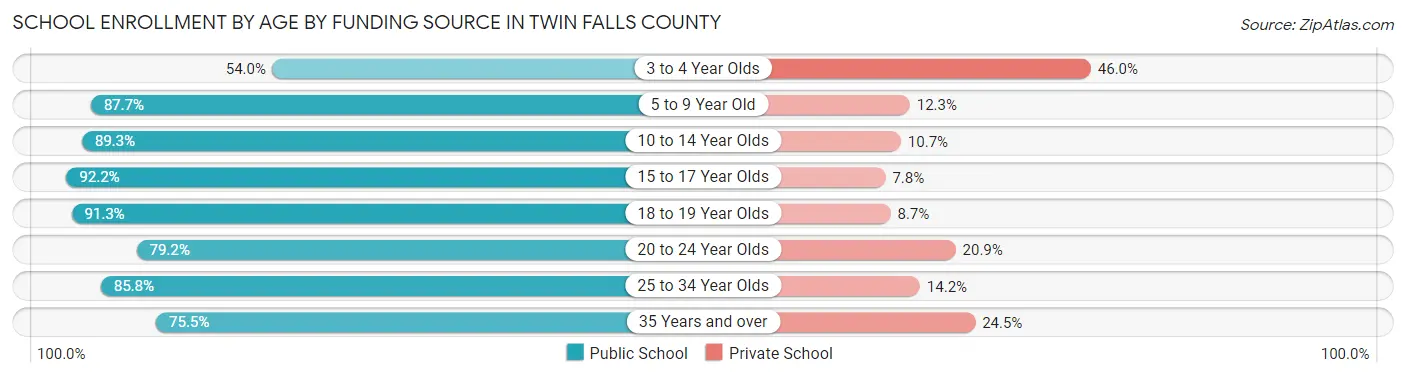
| Age Bracket | Public School | Private School |
| 3 to 4 Year Olds | 491 (54.0%) | 419 (46.0%) |
| 5 to 9 Year Old | 5,395 (87.7%) | 758 (12.3%) |
| 10 to 14 Year Olds | 6,402 (89.3%) | 764 (10.7%) |
| 15 to 17 Year Olds | 3,528 (92.2%) | 298 (7.8%) |
| 18 to 19 Year Olds | 1,401 (91.3%) | 134 (8.7%) |
| 20 to 24 Year Olds | 911 (79.1%) | 240 (20.8%) |
| 25 to 34 Year Olds | 882 (85.8%) | 146 (14.2%) |
| 35 Years and over | 786 (75.5%) | 255 (24.5%) |
| Total | 19,799 (86.8%) | 3,011 (13.2%) |
Educational Attainment by Field of Study in Twin Falls County
Education (2,922 | 19.8%), business (2,314 | 15.7%), bio, nature & agricultural (2,115 | 14.3%), science & technology (1,575 | 10.7%), and arts & humanities (1,263 | 8.6%) are the most common fields of study among 14,753 individuals in Twin Falls County who have obtained a bachelor's degree or higher.
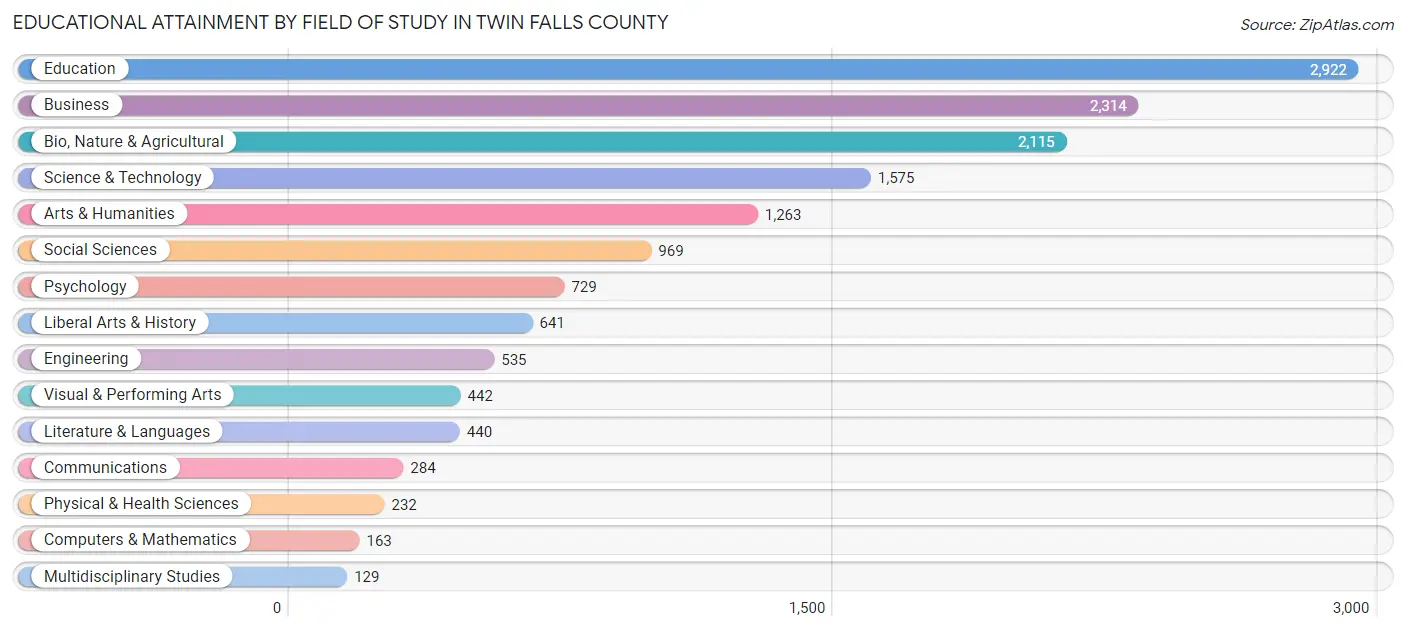
| Field of Study | # Graduates | % Graduates |
| Computers & Mathematics | 163 | 1.1% |
| Bio, Nature & Agricultural | 2,115 | 14.3% |
| Physical & Health Sciences | 232 | 1.6% |
| Psychology | 729 | 4.9% |
| Social Sciences | 969 | 6.6% |
| Engineering | 535 | 3.6% |
| Multidisciplinary Studies | 129 | 0.9% |
| Science & Technology | 1,575 | 10.7% |
| Business | 2,314 | 15.7% |
| Education | 2,922 | 19.8% |
| Literature & Languages | 440 | 3.0% |
| Liberal Arts & History | 641 | 4.3% |
| Visual & Performing Arts | 442 | 3.0% |
| Communications | 284 | 1.9% |
| Arts & Humanities | 1,263 | 8.6% |
| Total | 14,753 | 100.0% |
Transportation & Commute in Twin Falls County
Vehicle Availability by Sex in Twin Falls County
The most prevalent vehicle ownership categories in Twin Falls County are males with 2 vehicles (8,380, accounting for 35.9%) and females with 2 vehicles (6,689, making up 47.0%).
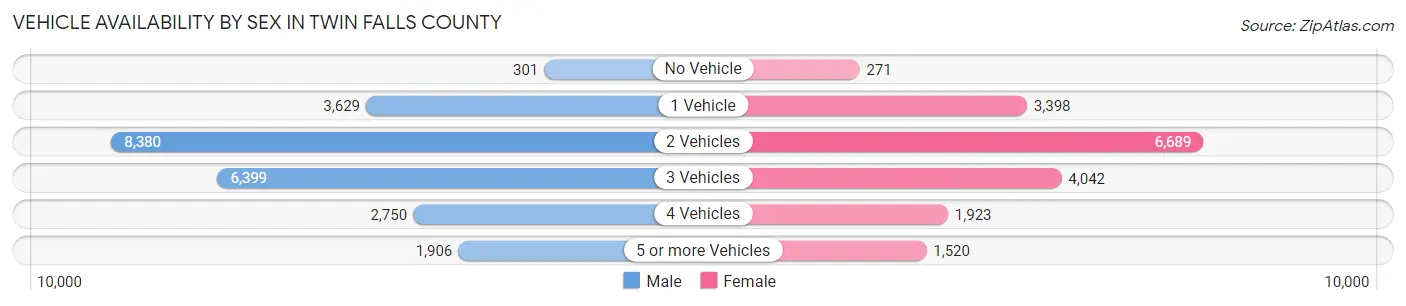
| Vehicles Available | Male | Female |
| No Vehicle | 301 (1.3%) | 271 (1.5%) |
| 1 Vehicle | 3,629 (15.5%) | 3,398 (19.0%) |
| 2 Vehicles | 8,380 (35.9%) | 6,689 (37.5%) |
| 3 Vehicles | 6,399 (27.4%) | 4,042 (22.7%) |
| 4 Vehicles | 2,750 (11.8%) | 1,923 (10.8%) |
| 5 or more Vehicles | 1,906 (8.2%) | 1,520 (8.5%) |
| Total | 23,365 (100.0%) | 17,843 (100.0%) |
Commute Time in Twin Falls County
The most frequently occuring commute durations in Twin Falls County are 10 to 14 minutes (7,721 commuters, 20.1%), 5 to 9 minutes (7,589 commuters, 19.8%), and 15 to 19 minutes (6,936 commuters, 18.1%).
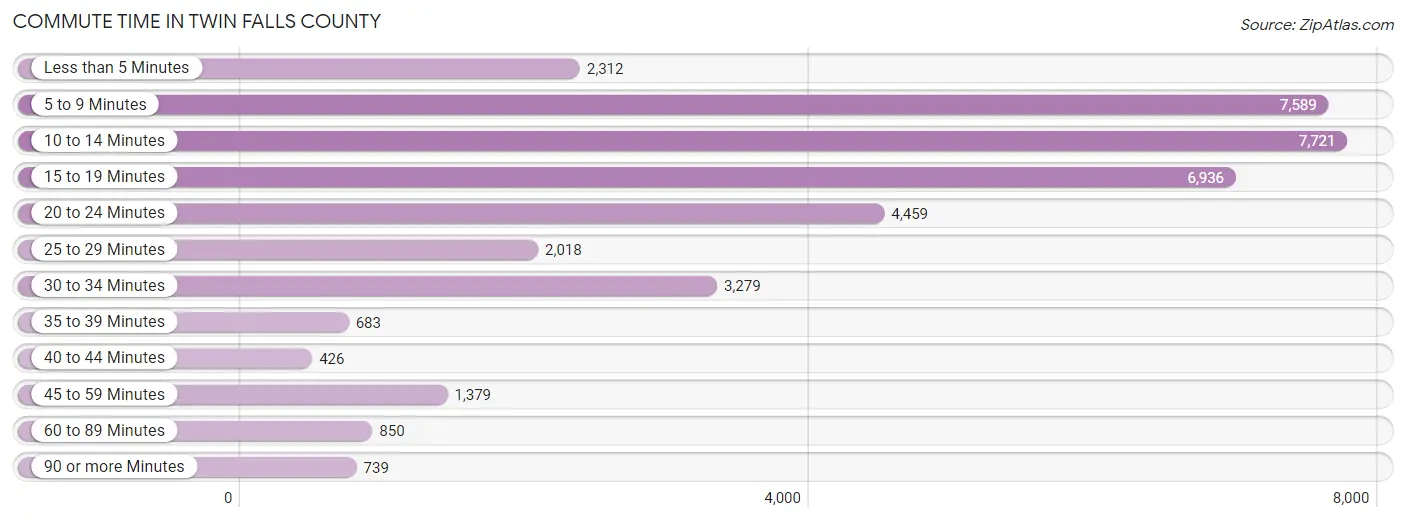
| Commute Time | # Commuters | % Commuters |
| Less than 5 Minutes | 2,312 | 6.0% |
| 5 to 9 Minutes | 7,589 | 19.8% |
| 10 to 14 Minutes | 7,721 | 20.1% |
| 15 to 19 Minutes | 6,936 | 18.1% |
| 20 to 24 Minutes | 4,459 | 11.6% |
| 25 to 29 Minutes | 2,018 | 5.3% |
| 30 to 34 Minutes | 3,279 | 8.5% |
| 35 to 39 Minutes | 683 | 1.8% |
| 40 to 44 Minutes | 426 | 1.1% |
| 45 to 59 Minutes | 1,379 | 3.6% |
| 60 to 89 Minutes | 850 | 2.2% |
| 90 or more Minutes | 739 | 1.9% |
Commute Time by Sex in Twin Falls County
The most common commute times in Twin Falls County are 10 to 14 minutes (4,586 commuters, 20.8%) for males and 5 to 9 minutes (3,911 commuters, 23.9%) for females.
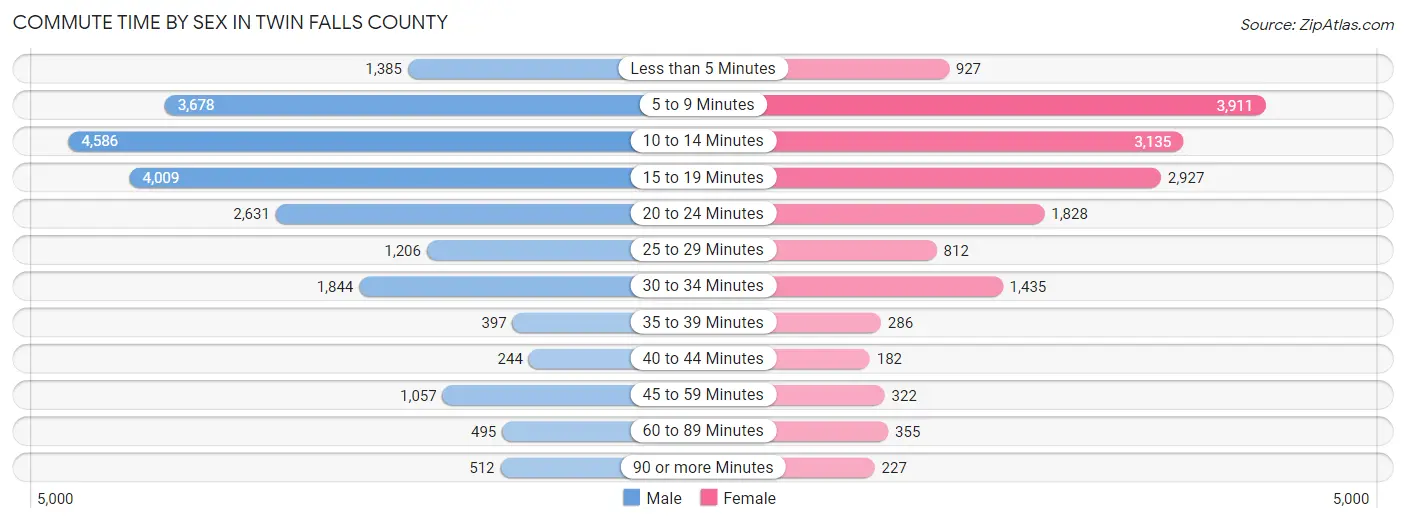
| Commute Time | Male | Female |
| Less than 5 Minutes | 1,385 (6.3%) | 927 (5.7%) |
| 5 to 9 Minutes | 3,678 (16.7%) | 3,911 (23.9%) |
| 10 to 14 Minutes | 4,586 (20.8%) | 3,135 (19.2%) |
| 15 to 19 Minutes | 4,009 (18.2%) | 2,927 (17.9%) |
| 20 to 24 Minutes | 2,631 (11.9%) | 1,828 (11.2%) |
| 25 to 29 Minutes | 1,206 (5.5%) | 812 (5.0%) |
| 30 to 34 Minutes | 1,844 (8.4%) | 1,435 (8.8%) |
| 35 to 39 Minutes | 397 (1.8%) | 286 (1.8%) |
| 40 to 44 Minutes | 244 (1.1%) | 182 (1.1%) |
| 45 to 59 Minutes | 1,057 (4.8%) | 322 (2.0%) |
| 60 to 89 Minutes | 495 (2.2%) | 355 (2.2%) |
| 90 or more Minutes | 512 (2.3%) | 227 (1.4%) |
Time of Departure to Work by Sex in Twin Falls County
The most frequent times of departure to work in Twin Falls County are 7:00 AM to 7:29 AM (3,473, 15.8%) for males and 7:30 AM to 7:59 AM (3,490, 21.3%) for females.
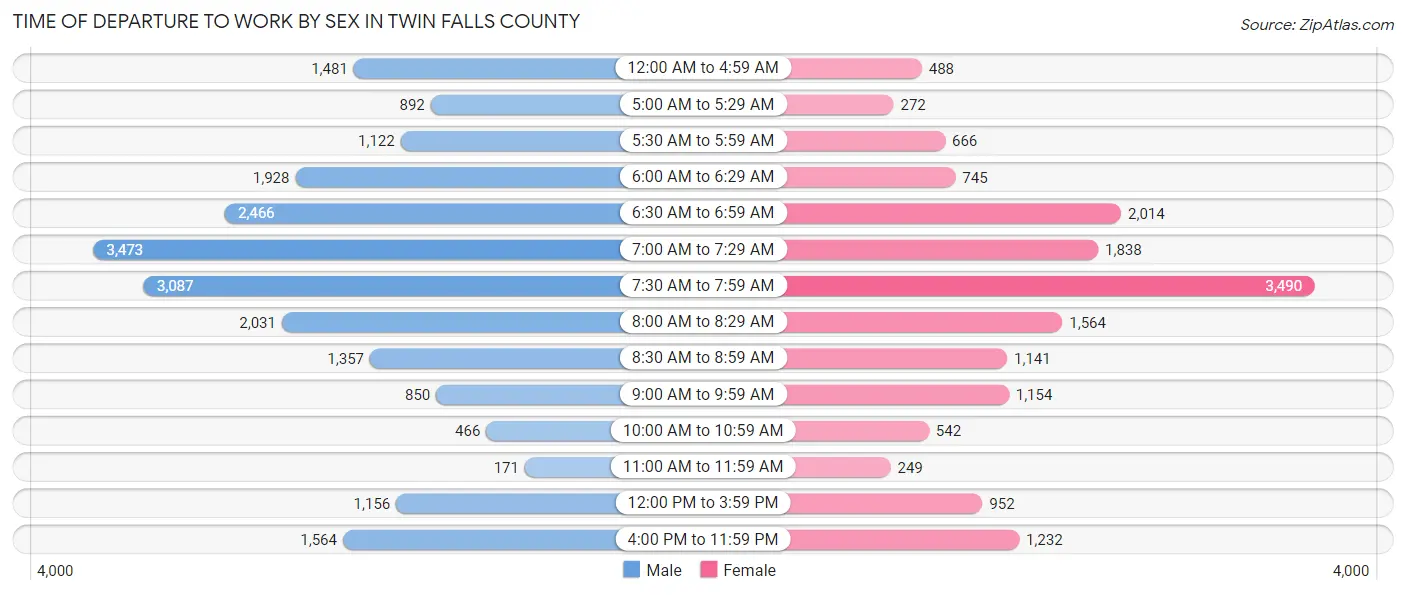
| Time of Departure | Male | Female |
| 12:00 AM to 4:59 AM | 1,481 (6.7%) | 488 (3.0%) |
| 5:00 AM to 5:29 AM | 892 (4.1%) | 272 (1.7%) |
| 5:30 AM to 5:59 AM | 1,122 (5.1%) | 666 (4.1%) |
| 6:00 AM to 6:29 AM | 1,928 (8.7%) | 745 (4.6%) |
| 6:30 AM to 6:59 AM | 2,466 (11.2%) | 2,014 (12.3%) |
| 7:00 AM to 7:29 AM | 3,473 (15.8%) | 1,838 (11.2%) |
| 7:30 AM to 7:59 AM | 3,087 (14.0%) | 3,490 (21.3%) |
| 8:00 AM to 8:29 AM | 2,031 (9.2%) | 1,564 (9.6%) |
| 8:30 AM to 8:59 AM | 1,357 (6.2%) | 1,141 (7.0%) |
| 9:00 AM to 9:59 AM | 850 (3.9%) | 1,154 (7.1%) |
| 10:00 AM to 10:59 AM | 466 (2.1%) | 542 (3.3%) |
| 11:00 AM to 11:59 AM | 171 (0.8%) | 249 (1.5%) |
| 12:00 PM to 3:59 PM | 1,156 (5.2%) | 952 (5.8%) |
| 4:00 PM to 11:59 PM | 1,564 (7.1%) | 1,232 (7.5%) |
| Total | 22,044 (100.0%) | 16,347 (100.0%) |
Housing Occupancy in Twin Falls County
Occupancy by Ownership in Twin Falls County
Of the total 33,360 dwellings in Twin Falls County, owner-occupied units account for 23,154 (69.4%), while renter-occupied units make up 10,206 (30.6%).
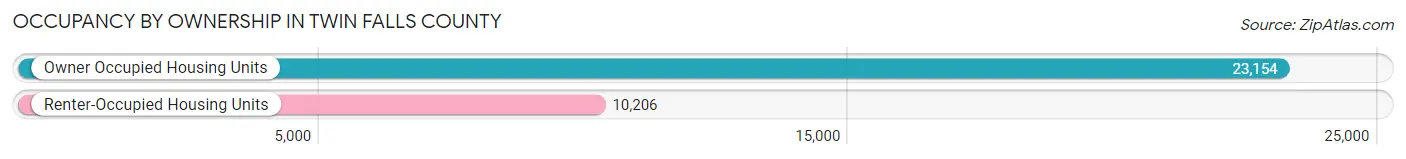
| Occupancy | # Housing Units | % Housing Units |
| Owner Occupied Housing Units | 23,154 | 69.4% |
| Renter-Occupied Housing Units | 10,206 | 30.6% |
| Total Occupied Housing Units | 33,360 | 100.0% |
Occupancy by Household Size in Twin Falls County
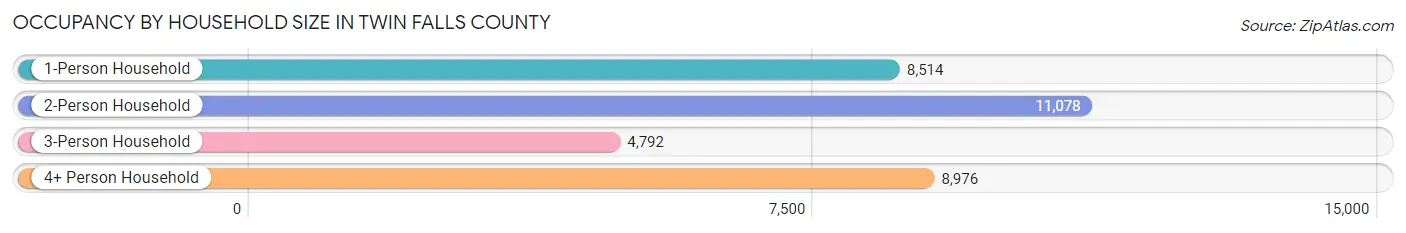
| Household Size | # Housing Units | % Housing Units |
| 1-Person Household | 8,514 | 25.5% |
| 2-Person Household | 11,078 | 33.2% |
| 3-Person Household | 4,792 | 14.4% |
| 4+ Person Household | 8,976 | 26.9% |
| Total Housing Units | 33,360 | 100.0% |
Occupancy by Ownership by Household Size in Twin Falls County
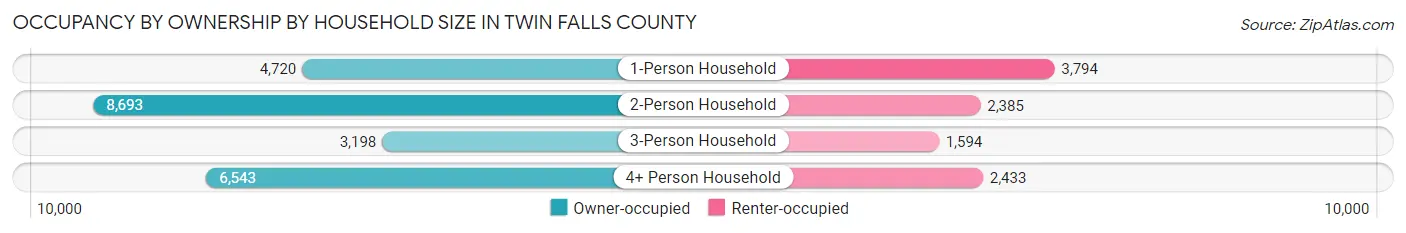
| Household Size | Owner-occupied | Renter-occupied |
| 1-Person Household | 4,720 (55.4%) | 3,794 (44.6%) |
| 2-Person Household | 8,693 (78.5%) | 2,385 (21.5%) |
| 3-Person Household | 3,198 (66.7%) | 1,594 (33.3%) |
| 4+ Person Household | 6,543 (72.9%) | 2,433 (27.1%) |
| Total Housing Units | 23,154 (69.4%) | 10,206 (30.6%) |
Occupancy by Educational Attainment in Twin Falls County
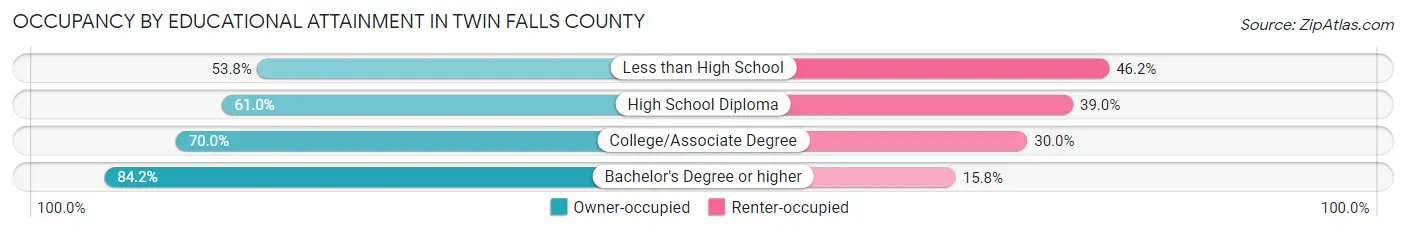
| Household Size | Owner-occupied | Renter-occupied |
| Less than High School | 2,004 (53.8%) | 1,721 (46.2%) |
| High School Diploma | 5,313 (61.0%) | 3,401 (39.0%) |
| College/Associate Degree | 8,790 (70.0%) | 3,762 (30.0%) |
| Bachelor's Degree or higher | 7,047 (84.2%) | 1,322 (15.8%) |
Occupancy by Age of Householder in Twin Falls County
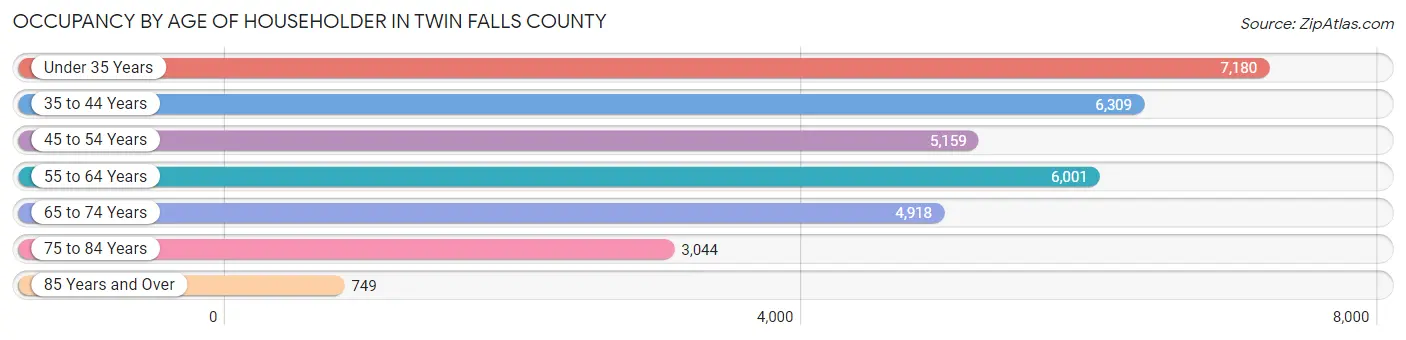
| Age Bracket | # Households | % Households |
| Under 35 Years | 7,180 | 21.5% |
| 35 to 44 Years | 6,309 | 18.9% |
| 45 to 54 Years | 5,159 | 15.5% |
| 55 to 64 Years | 6,001 | 18.0% |
| 65 to 74 Years | 4,918 | 14.7% |
| 75 to 84 Years | 3,044 | 9.1% |
| 85 Years and Over | 749 | 2.2% |
| Total | 33,360 | 100.0% |
Housing Finances in Twin Falls County
Median Income by Occupancy in Twin Falls County
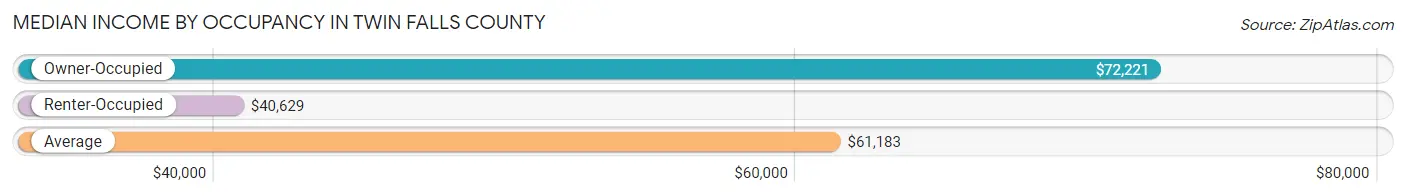
| Occupancy Type | # Households | Median Income |
| Owner-Occupied | 23,154 (69.4%) | $72,221 |
| Renter-Occupied | 10,206 (30.6%) | $40,629 |
| Average | 33,360 (100.0%) | $61,183 |
Occupancy by Householder Income Bracket in Twin Falls County
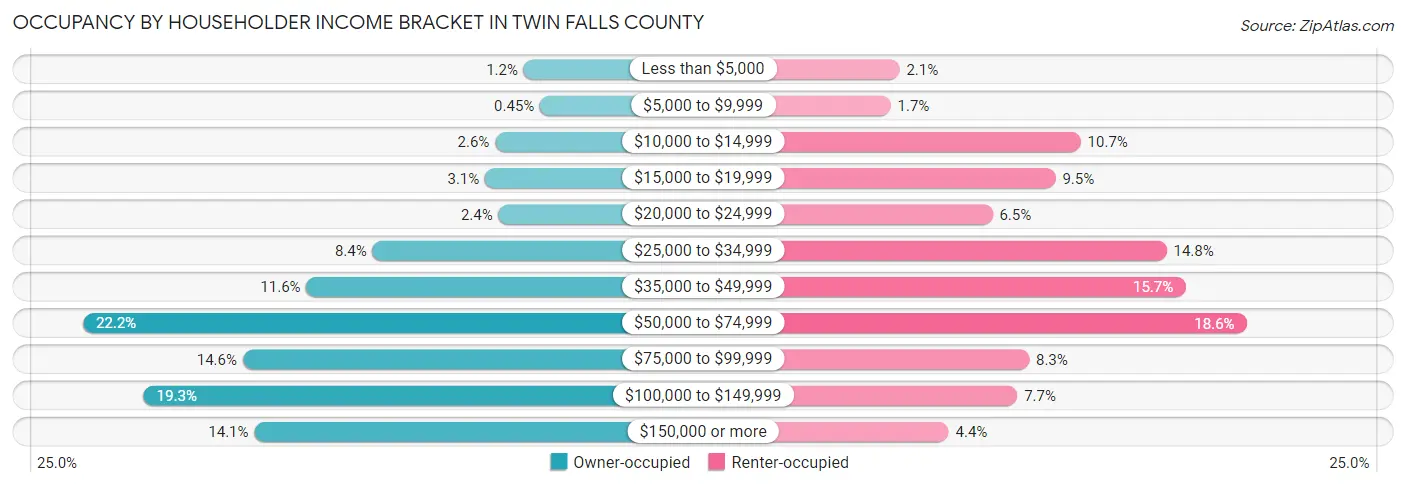
| Income Bracket | Owner-occupied | Renter-occupied |
| Less than $5,000 | 284 (1.2%) | 213 (2.1%) |
| $5,000 to $9,999 | 104 (0.4%) | 170 (1.7%) |
| $10,000 to $14,999 | 600 (2.6%) | 1,094 (10.7%) |
| $15,000 to $19,999 | 710 (3.1%) | 972 (9.5%) |
| $20,000 to $24,999 | 563 (2.4%) | 665 (6.5%) |
| $25,000 to $34,999 | 1,953 (8.4%) | 1,511 (14.8%) |
| $35,000 to $49,999 | 2,682 (11.6%) | 1,601 (15.7%) |
| $50,000 to $74,999 | 5,144 (22.2%) | 1,899 (18.6%) |
| $75,000 to $99,999 | 3,382 (14.6%) | 843 (8.3%) |
| $100,000 to $149,999 | 4,476 (19.3%) | 786 (7.7%) |
| $150,000 or more | 3,256 (14.1%) | 452 (4.4%) |
| Total | 23,154 (100.0%) | 10,206 (100.0%) |
Monthly Housing Cost Tiers in Twin Falls County
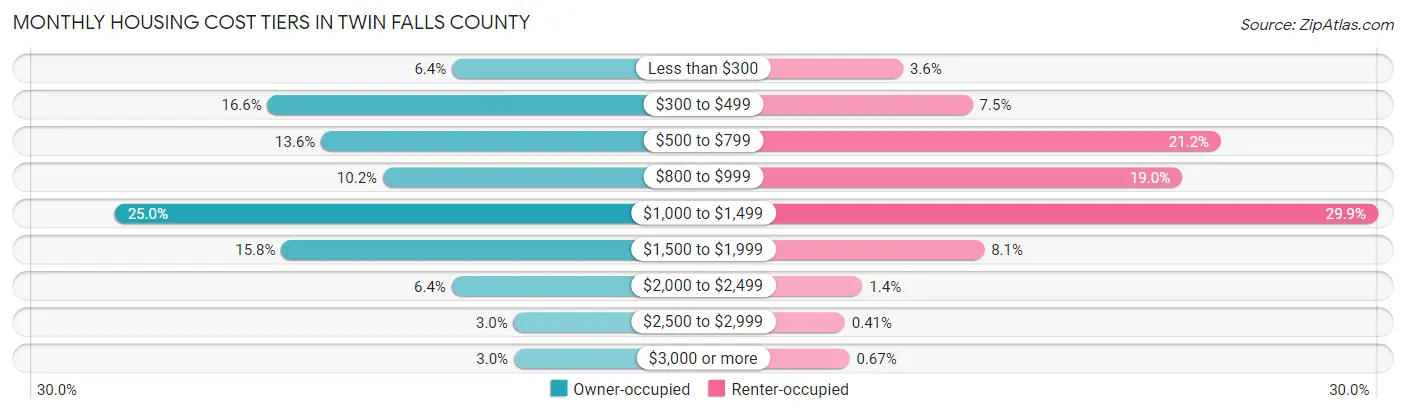
| Monthly Cost | Owner-occupied | Renter-occupied |
| Less than $300 | 1,480 (6.4%) | 369 (3.6%) |
| $300 to $499 | 3,839 (16.6%) | 762 (7.5%) |
| $500 to $799 | 3,153 (13.6%) | 2,162 (21.2%) |
| $800 to $999 | 2,364 (10.2%) | 1,942 (19.0%) |
| $1,000 to $1,499 | 5,792 (25.0%) | 3,047 (29.8%) |
| $1,500 to $1,999 | 3,663 (15.8%) | 828 (8.1%) |
| $2,000 to $2,499 | 1,484 (6.4%) | 141 (1.4%) |
| $2,500 to $2,999 | 692 (3.0%) | 42 (0.4%) |
| $3,000 or more | 687 (3.0%) | 68 (0.7%) |
| Total | 23,154 (100.0%) | 10,206 (100.0%) |
Physical Housing Characteristics in Twin Falls County
Housing Structures in Twin Falls County
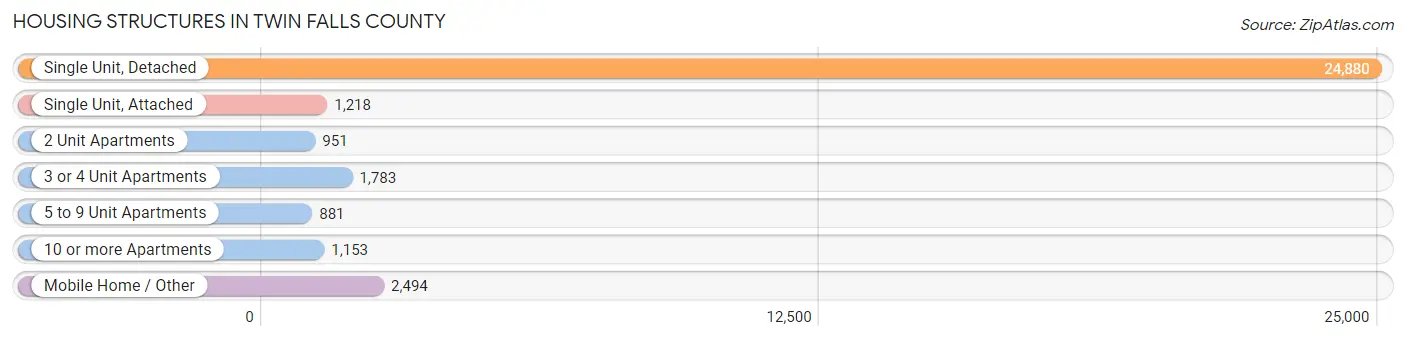
| Structure Type | # Housing Units | % Housing Units |
| Single Unit, Detached | 24,880 | 74.6% |
| Single Unit, Attached | 1,218 | 3.6% |
| 2 Unit Apartments | 951 | 2.9% |
| 3 or 4 Unit Apartments | 1,783 | 5.3% |
| 5 to 9 Unit Apartments | 881 | 2.6% |
| 10 or more Apartments | 1,153 | 3.5% |
| Mobile Home / Other | 2,494 | 7.5% |
| Total | 33,360 | 100.0% |
Housing Structures by Occupancy in Twin Falls County
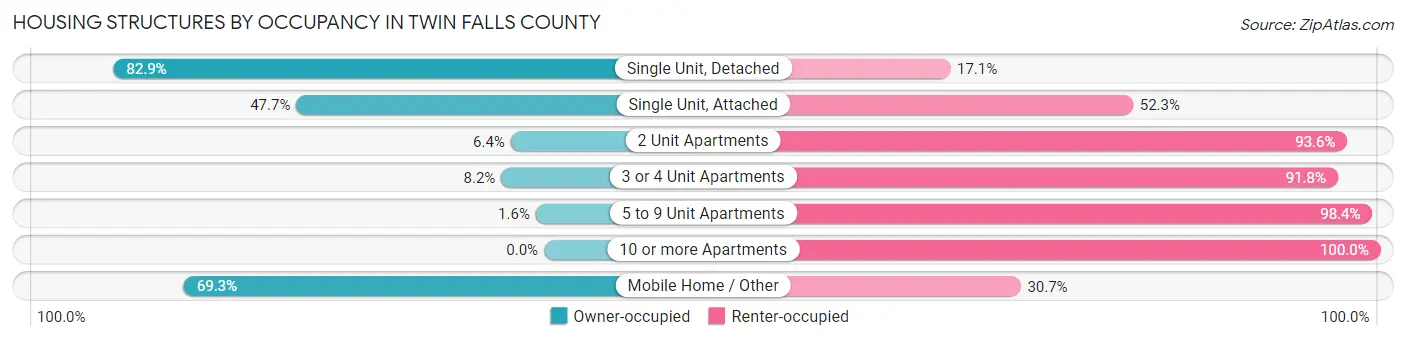
| Structure Type | Owner-occupied | Renter-occupied |
| Single Unit, Detached | 20,622 (82.9%) | 4,258 (17.1%) |
| Single Unit, Attached | 581 (47.7%) | 637 (52.3%) |
| 2 Unit Apartments | 61 (6.4%) | 890 (93.6%) |
| 3 or 4 Unit Apartments | 147 (8.2%) | 1,636 (91.8%) |
| 5 to 9 Unit Apartments | 14 (1.6%) | 867 (98.4%) |
| 10 or more Apartments | 0 (0.0%) | 1,153 (100.0%) |
| Mobile Home / Other | 1,729 (69.3%) | 765 (30.7%) |
| Total | 23,154 (69.4%) | 10,206 (30.6%) |
Housing Structures by Number of Rooms in Twin Falls County
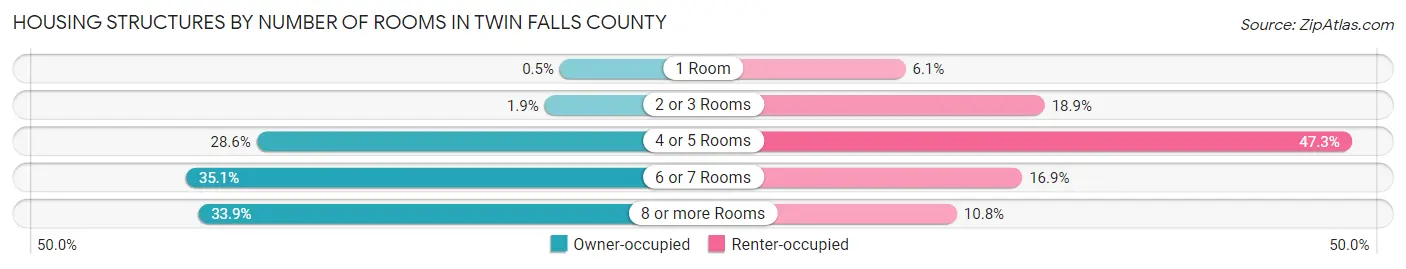
| Number of Rooms | Owner-occupied | Renter-occupied |
| 1 Room | 116 (0.5%) | 619 (6.1%) |
| 2 or 3 Rooms | 443 (1.9%) | 1,933 (18.9%) |
| 4 or 5 Rooms | 6,611 (28.5%) | 4,829 (47.3%) |
| 6 or 7 Rooms | 8,125 (35.1%) | 1,721 (16.9%) |
| 8 or more Rooms | 7,859 (33.9%) | 1,104 (10.8%) |
| Total | 23,154 (100.0%) | 10,206 (100.0%) |
Housing Structure by Heating Type in Twin Falls County
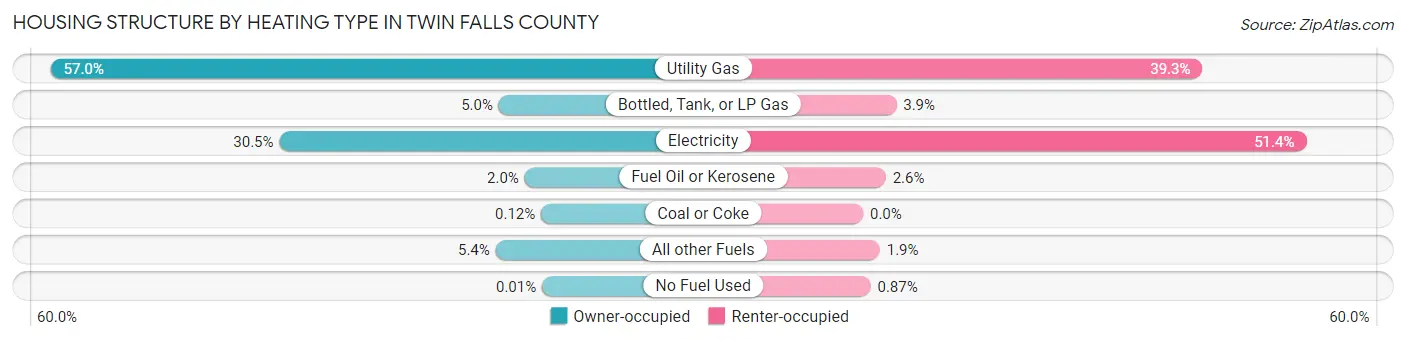
| Heating Type | Owner-occupied | Renter-occupied |
| Utility Gas | 13,194 (57.0%) | 4,014 (39.3%) |
| Bottled, Tank, or LP Gas | 1,163 (5.0%) | 393 (3.8%) |
| Electricity | 7,053 (30.5%) | 5,244 (51.4%) |
| Fuel Oil or Kerosene | 467 (2.0%) | 268 (2.6%) |
| Coal or Coke | 28 (0.1%) | 0 (0.0%) |
| All other Fuels | 1,247 (5.4%) | 198 (1.9%) |
| No Fuel Used | 2 (0.0%) | 89 (0.9%) |
| Total | 23,154 (100.0%) | 10,206 (100.0%) |
Household Vehicle Usage in Twin Falls County
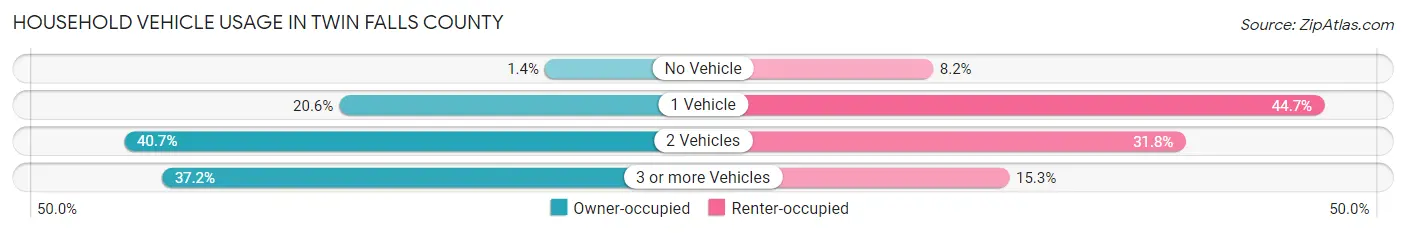
| Vehicles per Household | Owner-occupied | Renter-occupied |
| No Vehicle | 334 (1.4%) | 838 (8.2%) |
| 1 Vehicle | 4,779 (20.6%) | 4,563 (44.7%) |
| 2 Vehicles | 9,428 (40.7%) | 3,241 (31.8%) |
| 3 or more Vehicles | 8,613 (37.2%) | 1,564 (15.3%) |
| Total | 23,154 (100.0%) | 10,206 (100.0%) |
Real Estate & Mortgages in Twin Falls County
Real Estate and Mortgage Overview in Twin Falls County
| Characteristic | Without Mortgage | With Mortgage |
| Housing Units | 7,980 | 15,174 |
| Median Property Value | $249,500 | $268,100 |
| Median Household Income | $54,746 | $2,413 |
| Monthly Housing Costs | $454 | $662 |
| Real Estate Taxes | $1,661 | $546 |
Property Value by Mortgage Status in Twin Falls County
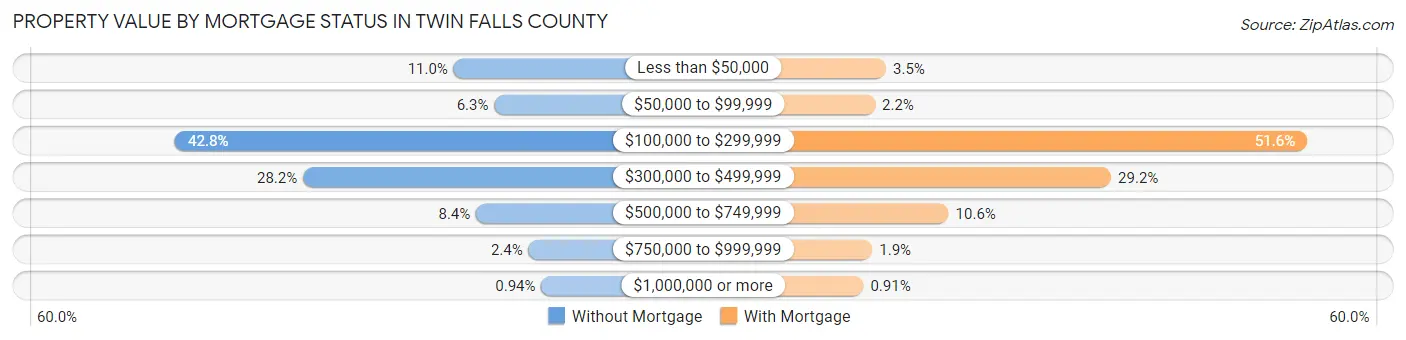
| Property Value | Without Mortgage | With Mortgage |
| Less than $50,000 | 875 (11.0%) | 529 (3.5%) |
| $50,000 to $99,999 | 504 (6.3%) | 338 (2.2%) |
| $100,000 to $299,999 | 3,415 (42.8%) | 7,829 (51.6%) |
| $300,000 to $499,999 | 2,249 (28.2%) | 4,433 (29.2%) |
| $500,000 to $749,999 | 670 (8.4%) | 1,615 (10.6%) |
| $750,000 to $999,999 | 192 (2.4%) | 292 (1.9%) |
| $1,000,000 or more | 75 (0.9%) | 138 (0.9%) |
| Total | 7,980 (100.0%) | 15,174 (100.0%) |
Household Income by Mortgage Status in Twin Falls County
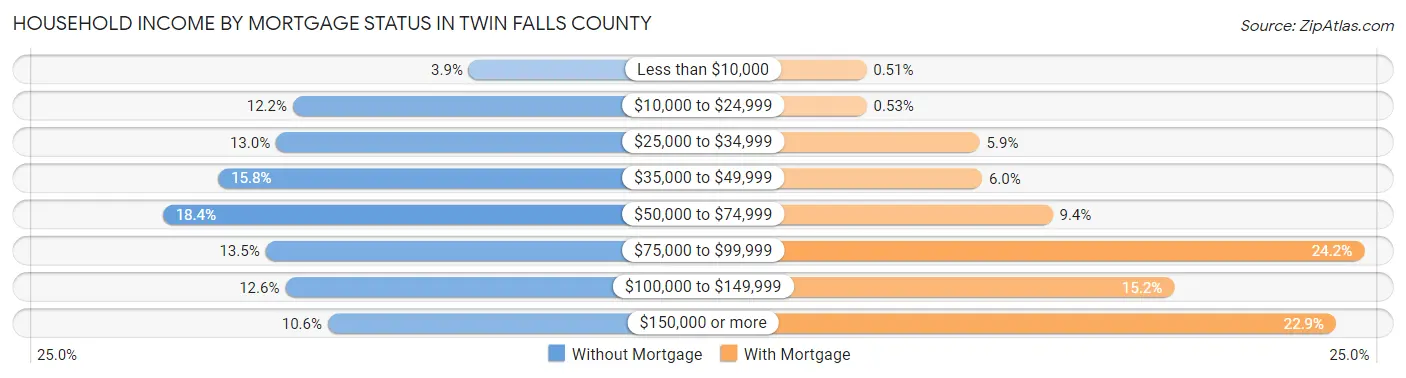
| Household Income | Without Mortgage | With Mortgage |
| Less than $10,000 | 307 (3.8%) | 77 (0.5%) |
| $10,000 to $24,999 | 976 (12.2%) | 81 (0.5%) |
| $25,000 to $34,999 | 1,040 (13.0%) | 897 (5.9%) |
| $35,000 to $49,999 | 1,259 (15.8%) | 913 (6.0%) |
| $50,000 to $74,999 | 1,470 (18.4%) | 1,423 (9.4%) |
| $75,000 to $99,999 | 1,080 (13.5%) | 3,674 (24.2%) |
| $100,000 to $149,999 | 1,005 (12.6%) | 2,302 (15.2%) |
| $150,000 or more | 843 (10.6%) | 3,471 (22.9%) |
| Total | 7,980 (100.0%) | 15,174 (100.0%) |
Property Value to Household Income Ratio in Twin Falls County
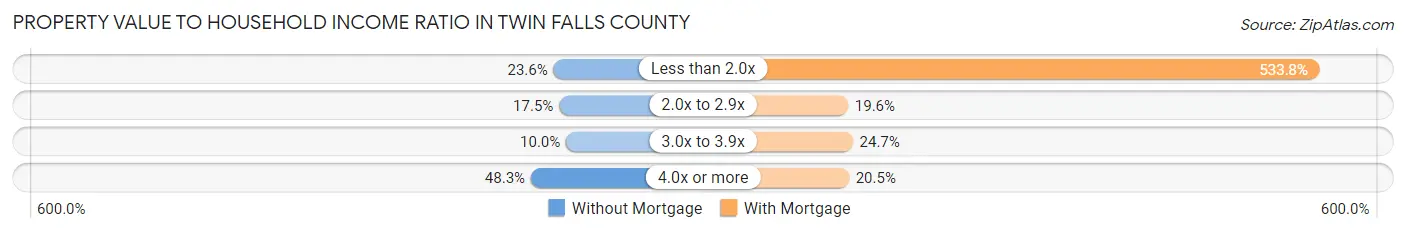
| Value-to-Income Ratio | Without Mortgage | With Mortgage |
| Less than 2.0x | 1,883 (23.6%) | 81,004 (533.8%) |
| 2.0x to 2.9x | 1,397 (17.5%) | 2,969 (19.6%) |
| 3.0x to 3.9x | 794 (10.0%) | 3,746 (24.7%) |
| 4.0x or more | 3,853 (48.3%) | 3,109 (20.5%) |
| Total | 7,980 (100.0%) | 15,174 (100.0%) |
Real Estate Taxes by Mortgage Status in Twin Falls County
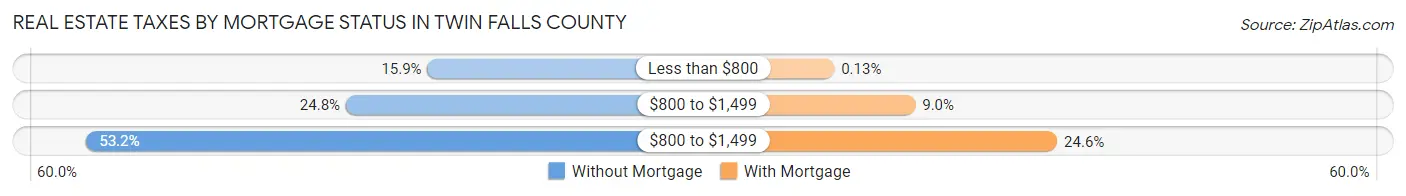
| Property Taxes | Without Mortgage | With Mortgage |
| Less than $800 | 1,265 (15.9%) | 20 (0.1%) |
| $800 to $1,499 | 1,978 (24.8%) | 1,367 (9.0%) |
| $800 to $1,499 | 4,248 (53.2%) | 3,726 (24.6%) |
| Total | 7,980 (100.0%) | 15,174 (100.0%) |
Health & Disability in Twin Falls County
Health Insurance Coverage by Age in Twin Falls County
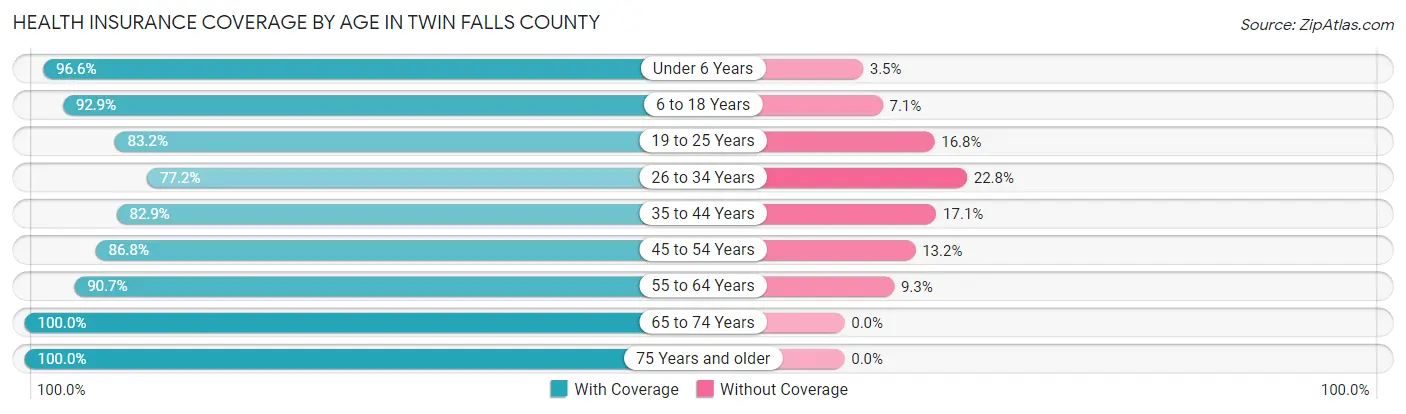
| Age Bracket | With Coverage | Without Coverage |
| Under 6 Years | 7,086 (96.6%) | 253 (3.5%) |
| 6 to 18 Years | 16,896 (92.9%) | 1,298 (7.1%) |
| 19 to 25 Years | 6,536 (83.2%) | 1,318 (16.8%) |
| 26 to 34 Years | 8,370 (77.2%) | 2,477 (22.8%) |
| 35 to 44 Years | 9,727 (82.9%) | 2,010 (17.1%) |
| 45 to 54 Years | 8,159 (86.8%) | 1,244 (13.2%) |
| 55 to 64 Years | 9,172 (90.7%) | 936 (9.3%) |
| 65 to 74 Years | 8,313 (100.0%) | 0 (0.0%) |
| 75 Years and older | 5,834 (100.0%) | 0 (0.0%) |
| Total | 80,093 (89.4%) | 9,536 (10.6%) |
Health Insurance Coverage by Citizenship Status in Twin Falls County
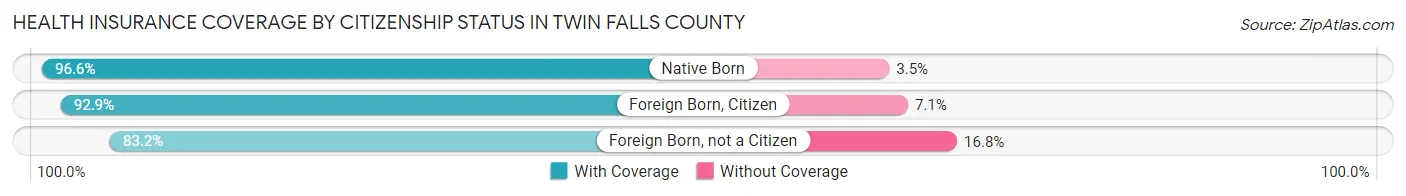
| Citizenship Status | With Coverage | Without Coverage |
| Native Born | 7,086 (96.6%) | 253 (3.5%) |
| Foreign Born, Citizen | 16,896 (92.9%) | 1,298 (7.1%) |
| Foreign Born, not a Citizen | 6,536 (83.2%) | 1,318 (16.8%) |
Health Insurance Coverage by Household Income in Twin Falls County
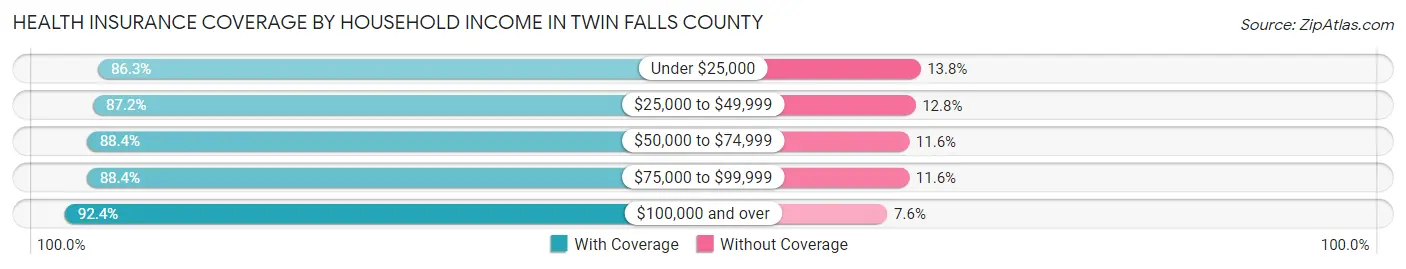
| Household Income | With Coverage | Without Coverage |
| Under $25,000 | 8,108 (86.3%) | 1,293 (13.8%) |
| $25,000 to $49,999 | 14,938 (87.2%) | 2,197 (12.8%) |
| $50,000 to $74,999 | 15,523 (88.4%) | 2,044 (11.6%) |
| $75,000 to $99,999 | 11,632 (88.4%) | 1,533 (11.6%) |
| $100,000 and over | 29,294 (92.4%) | 2,395 (7.6%) |
Public vs Private Health Insurance Coverage by Age in Twin Falls County
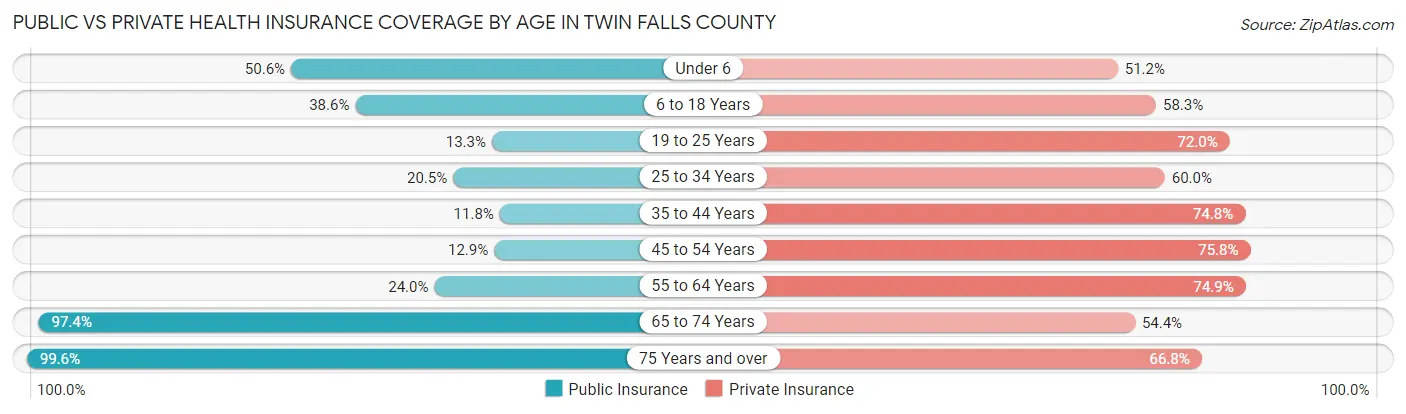
| Age Bracket | Public Insurance | Private Insurance |
| Under 6 | 3,711 (50.6%) | 3,760 (51.2%) |
| 6 to 18 Years | 7,028 (38.6%) | 10,612 (58.3%) |
| 19 to 25 Years | 1,043 (13.3%) | 5,653 (72.0%) |
| 25 to 34 Years | 2,220 (20.5%) | 6,503 (60.0%) |
| 35 to 44 Years | 1,387 (11.8%) | 8,784 (74.8%) |
| 45 to 54 Years | 1,209 (12.9%) | 7,129 (75.8%) |
| 55 to 64 Years | 2,422 (24.0%) | 7,575 (74.9%) |
| 65 to 74 Years | 8,097 (97.4%) | 4,523 (54.4%) |
| 75 Years and over | 5,810 (99.6%) | 3,896 (66.8%) |
| Total | 32,927 (36.7%) | 58,435 (65.2%) |
Disability Status by Sex by Age in Twin Falls County
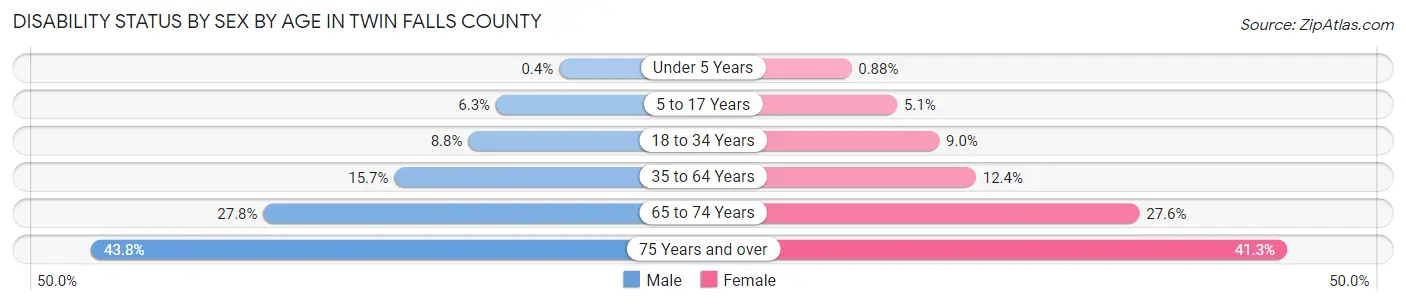
| Age Bracket | Male | Female |
| Under 5 Years | 12 (0.4%) | 26 (0.9%) |
| 5 to 17 Years | 580 (6.3%) | 458 (5.1%) |
| 18 to 34 Years | 873 (8.8%) | 920 (9.0%) |
| 35 to 64 Years | 2,503 (15.7%) | 1,903 (12.4%) |
| 65 to 74 Years | 1,091 (27.8%) | 1,213 (27.6%) |
| 75 Years and over | 1,120 (43.8%) | 1,354 (41.3%) |
Disability Class by Sex by Age in Twin Falls County
Disability Class: Hearing Difficulty
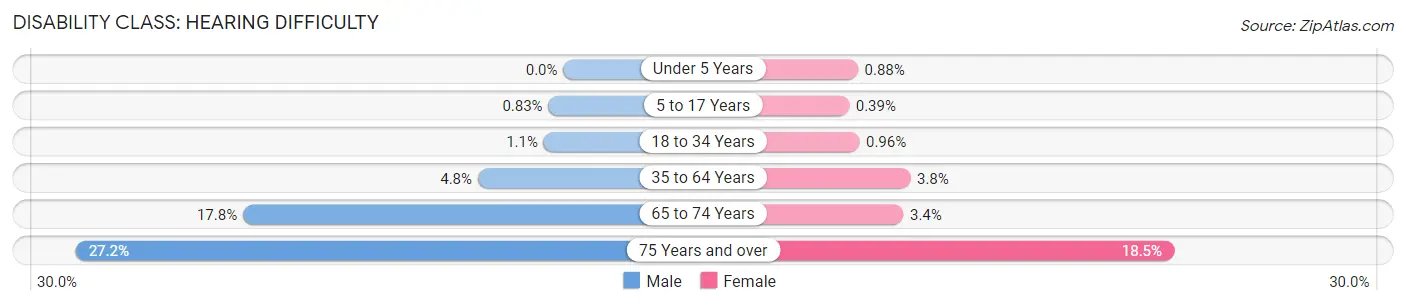
| Age Bracket | Male | Female |
| Under 5 Years | 0 (0.0%) | 26 (0.9%) |
| 5 to 17 Years | 77 (0.8%) | 35 (0.4%) |
| 18 to 34 Years | 108 (1.1%) | 98 (1.0%) |
| 35 to 64 Years | 759 (4.8%) | 582 (3.8%) |
| 65 to 74 Years | 699 (17.8%) | 150 (3.4%) |
| 75 Years and over | 694 (27.2%) | 606 (18.5%) |
Disability Class: Vision Difficulty
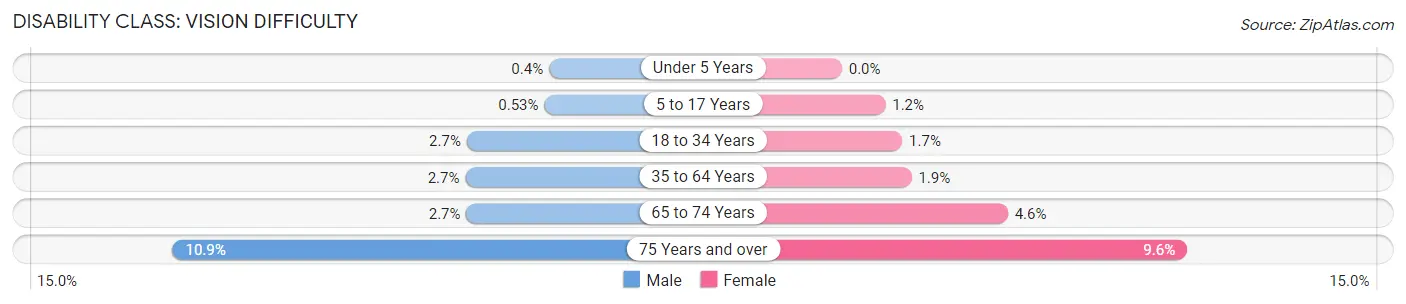
| Age Bracket | Male | Female |
| Under 5 Years | 12 (0.4%) | 0 (0.0%) |
| 5 to 17 Years | 49 (0.5%) | 108 (1.2%) |
| 18 to 34 Years | 266 (2.7%) | 171 (1.7%) |
| 35 to 64 Years | 435 (2.7%) | 296 (1.9%) |
| 65 to 74 Years | 106 (2.7%) | 203 (4.6%) |
| 75 Years and over | 278 (10.9%) | 315 (9.6%) |
Disability Class: Cognitive Difficulty
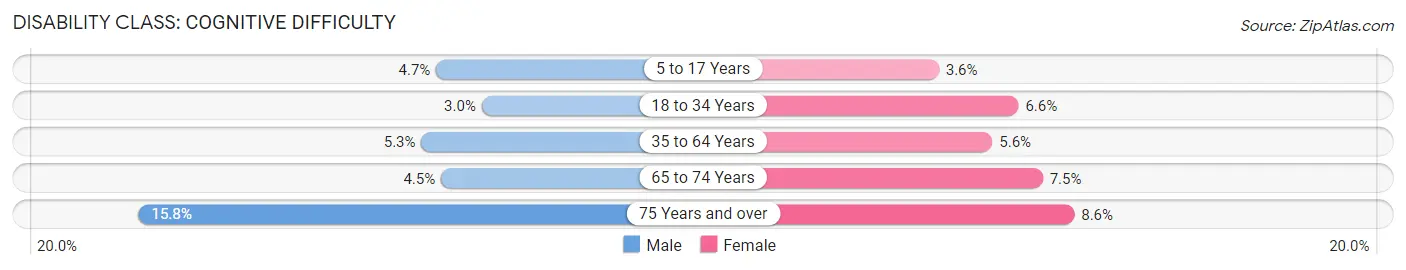
| Age Bracket | Male | Female |
| 5 to 17 Years | 437 (4.7%) | 322 (3.6%) |
| 18 to 34 Years | 300 (3.0%) | 668 (6.6%) |
| 35 to 64 Years | 840 (5.3%) | 855 (5.6%) |
| 65 to 74 Years | 178 (4.5%) | 328 (7.5%) |
| 75 Years and over | 403 (15.8%) | 283 (8.6%) |
Disability Class: Ambulatory Difficulty
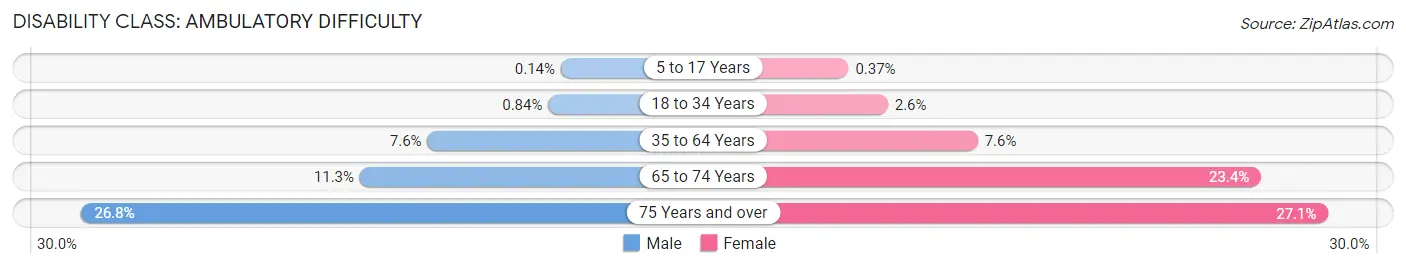
| Age Bracket | Male | Female |
| 5 to 17 Years | 13 (0.1%) | 33 (0.4%) |
| 18 to 34 Years | 83 (0.8%) | 261 (2.6%) |
| 35 to 64 Years | 1,208 (7.6%) | 1,158 (7.6%) |
| 65 to 74 Years | 444 (11.3%) | 1,026 (23.4%) |
| 75 Years and over | 686 (26.8%) | 888 (27.1%) |
Disability Class: Self-Care Difficulty
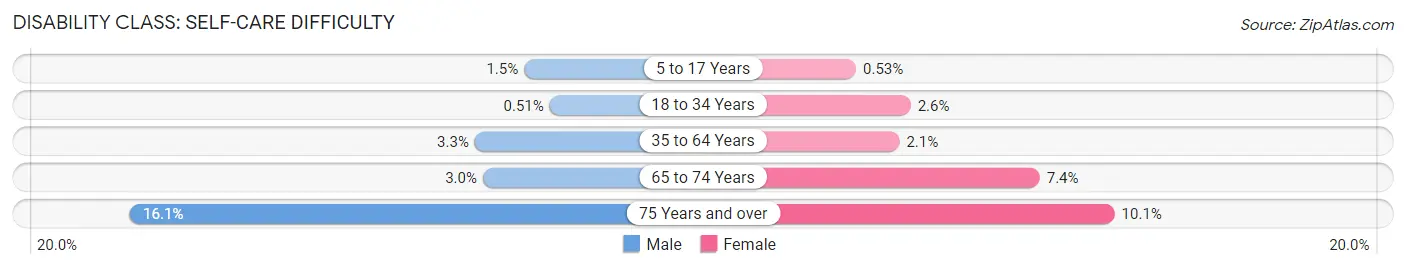
| Age Bracket | Male | Female |
| 5 to 17 Years | 135 (1.5%) | 47 (0.5%) |
| 18 to 34 Years | 50 (0.5%) | 261 (2.6%) |
| 35 to 64 Years | 525 (3.3%) | 327 (2.1%) |
| 65 to 74 Years | 117 (3.0%) | 323 (7.3%) |
| 75 Years and over | 411 (16.1%) | 332 (10.1%) |
Technology Access in Twin Falls County
Computing Device Access in Twin Falls County
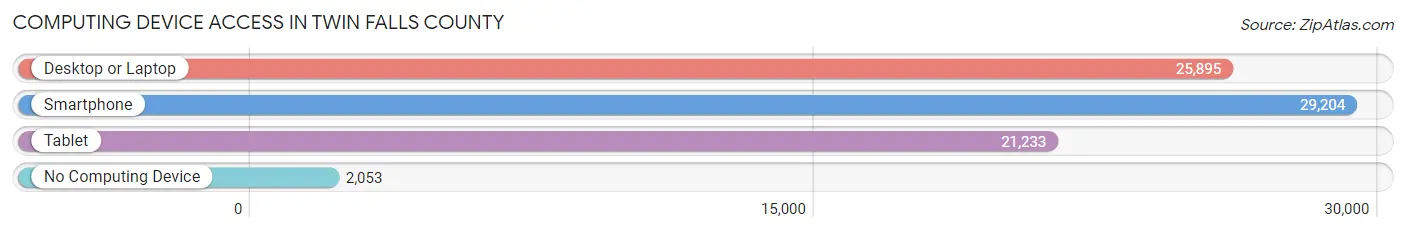
| Device Type | # Households | % Households |
| Desktop or Laptop | 25,895 | 77.6% |
| Smartphone | 29,204 | 87.5% |
| Tablet | 21,233 | 63.6% |
| No Computing Device | 2,053 | 6.1% |
| Total | 33,360 | 100.0% |
Internet Access in Twin Falls County
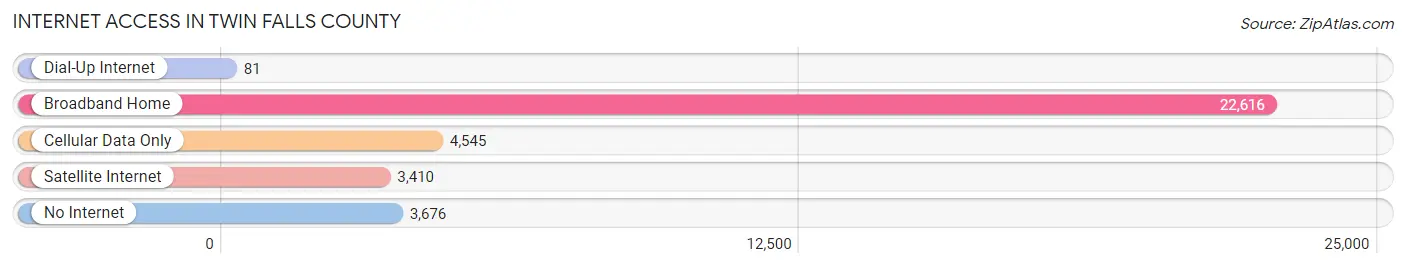
| Internet Type | # Households | % Households |
| Dial-Up Internet | 81 | 0.2% |
| Broadband Home | 22,616 | 67.8% |
| Cellular Data Only | 4,545 | 13.6% |
| Satellite Internet | 3,410 | 10.2% |
| No Internet | 3,676 | 11.0% |
| Total | 33,360 | 100.0% |
Twin Falls County Summary
Twin Falls County is located in the south-central region of the U.S. state of Idaho. It is bordered by Gooding County to the north, Jerome County to the east, Cassia County to the south, and Elmore County to the west. The county seat is the city of Twin Falls. As of the 2010 census, the population of Twin Falls County was 77,230, making it the third-most populous county in Idaho.
History
Twin Falls County was established in 1907, and was named for the two waterfalls located on the Snake River near the city of Twin Falls. The area had been inhabited by Native American tribes for centuries prior to the arrival of European settlers. The first permanent settlement in the county was established in 1864, when a group of Mormon pioneers established a settlement near the present-day city of Buhl.
The area was largely agricultural until the early 20th century, when the construction of the Twin Falls Canal began. The canal, which was completed in 1905, allowed for the irrigation of the area, and led to a boom in agricultural production. The area also became a popular tourist destination, as the Snake River Canyon and the nearby Shoshone Falls drew visitors from around the world.
Geography
Twin Falls County covers an area of 2,717 square miles, making it the fourth-largest county in Idaho. The county is located in the south-central region of the state, and is bordered by Gooding County to the north, Jerome County to the east, Cassia County to the south, and Elmore County to the west. The Snake River runs through the county, and is the source of much of the county's irrigation water.
The county is largely rural, with the majority of the population living in the cities of Twin Falls, Buhl, and Jerome. The county is home to several protected areas, including the Snake River Canyon National Recreation Area, the Thousand Springs State Park, and the Sawtooth National Forest.
Economy
Twin Falls County has a diverse economy, with agriculture, manufacturing, and tourism being the primary industries. Agriculture is the largest sector of the economy, with the county being one of the leading producers of potatoes, sugar beets, and alfalfa in the state. Manufacturing is also an important part of the economy, with several large companies having operations in the county. Tourism is also a major industry, with the Snake River Canyon and the nearby Shoshone Falls being popular destinations for visitors from around the world.
Demographics
As of the 2010 census, the population of Twin Falls County was 77,230, making it the third-most populous county in Idaho. The population is largely white (90.2%), with small percentages of Hispanic (4.7%), Asian (2.2%), and African American (1.2%) residents. The median household income in the county is $45,945, and the median home value is $164,400. The unemployment rate in the county is 4.2%.
Common Questions
What is the Total Population of Twin Falls County?
Total Population of Twin Falls County is 90,592.
What is the Total Male Population of Twin Falls County?
Total Male Population of Twin Falls County is 45,073.
What is the Total Female Population of Twin Falls County?
Total Female Population of Twin Falls County is 45,519.
What is the Ratio of Males per 100 Females in Twin Falls County?
There are 99.02 Males per 100 Females in Twin Falls County.
What is the Ratio of Females per 100 Males in Twin Falls County?
There are 100.99 Females per 100 Males in Twin Falls County.
What is the Median Population Age in Twin Falls County?
Median Population Age in Twin Falls County is 35.5 Years.
What is the Average Family Size in Twin Falls County
Average Family Size in Twin Falls County is 3.2 People.
What is the Average Household Size in Twin Falls County
Average Household Size in Twin Falls County is 2.7 People.
What is Per Capita Income in Twin Falls County?
Per Capita income in Twin Falls County is $32,393.
What is the Median Family Income in Twin Falls County?
Median Family Income in Twin Falls County is $73,929.
What is the Median Household income in Twin Falls County?
Median Household Income in Twin Falls County is $61,183.
What is Income or Wage Gap in Twin Falls County?
Income or Wage Gap in Twin Falls County is 41.1%.
Women in Twin Falls County earn 58.9 cents for every dollar earned by a man.
What is Family Income Deficit in Twin Falls County?
Family Income Deficit in Twin Falls County is $9,804.
Families that are below poverty line in Twin Falls County earn $9,804 less on average than the poverty threshold level.
What is Inequality or Gini Index in Twin Falls County?
Inequality or Gini Index in Twin Falls County is 0.45.
How Large is the Labor Force in Twin Falls County?
There are 43,734 People in the Labor Forcein in Twin Falls County.
What is the Percentage of People in the Labor Force in Twin Falls County?
63.3% of People are in the Labor Force in Twin Falls County.
What is the Unemployment Rate in Twin Falls County?
Unemployment Rate in Twin Falls County is 3.1%.