Teton County, ID
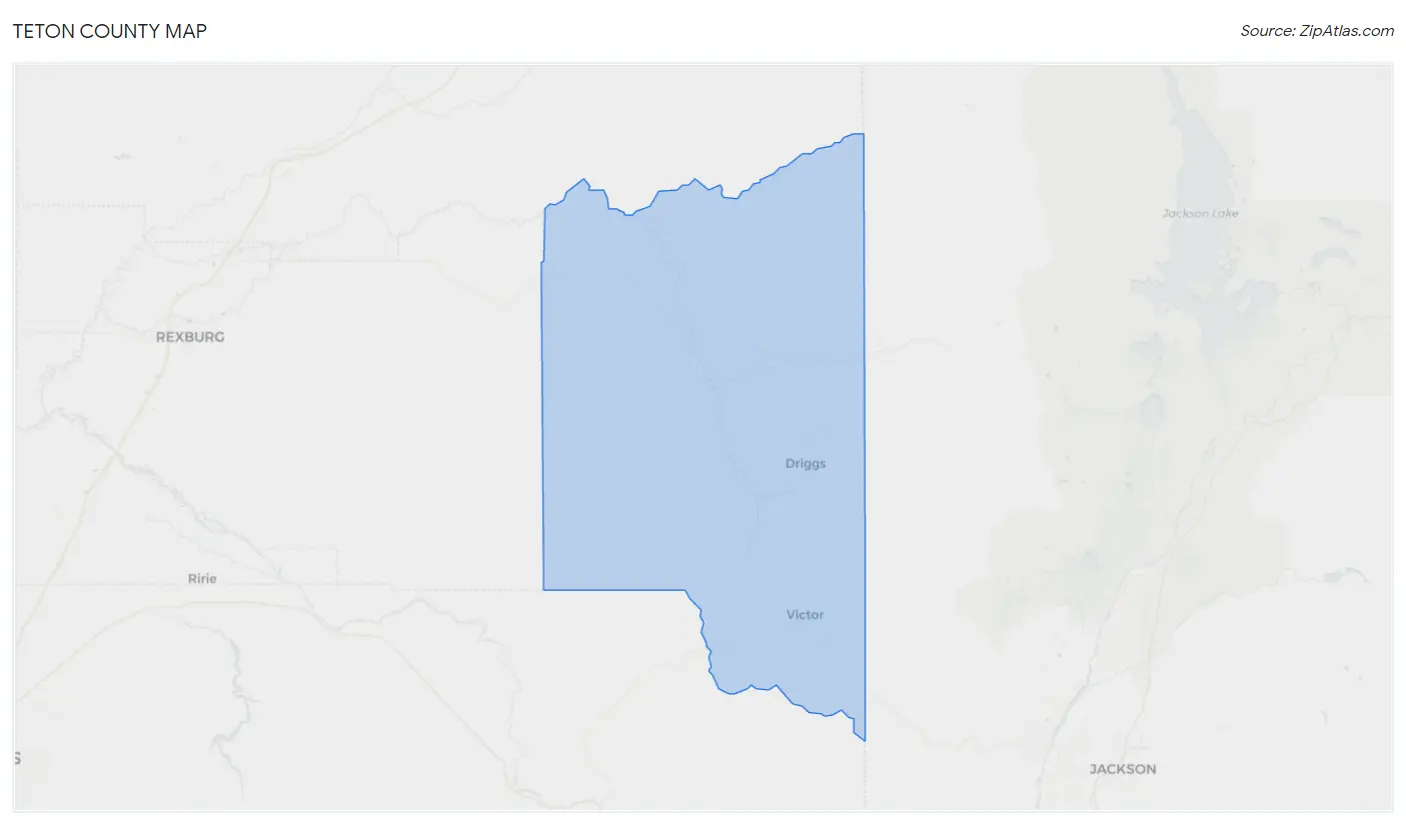
Teton County Map
Teton County Overview
11,813
TOTAL POPULATION
6,046
MALE POPULATION
5,767
FEMALE POPULATION
104.84
MALES / 100 FEMALES
95.39
FEMALES / 100 MALES
38.6
MEDIAN AGE
3.3
AVG FAMILY SIZE
2.7
AVG HOUSEHOLD SIZE
$43,396
PER CAPITA INCOME
$109,286
AVG FAMILY INCOME
$88,906
AVG HOUSEHOLD INCOME
26.4%
WAGE / INCOME GAP [ % ]
73.6¢/ $1
WAGE / INCOME GAP [ $ ]
$12,121
FAMILY INCOME DEFICIT
0.42
INEQUALITY / GINI INDEX
6,988
LABOR FORCE [ PEOPLE ]
74.3%
PERCENT IN LABOR FORCE
1.6%
UNEMPLOYMENT RATE
Teton County Area Codes
Race in Teton County
The most populous races in Teton County are White / Caucasian (9,911 | 83.9%), Hispanic or Latino (1,933 | 16.4%), and Some other Race (905 | 7.7%).
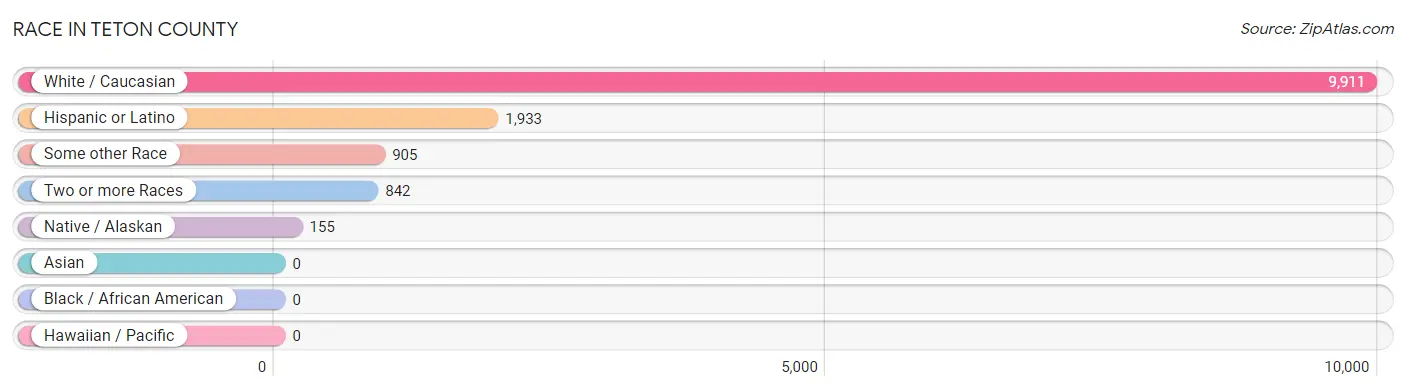
| Race | # Population | % Population |
| Asian | 0 | 0.0% |
| Black / African American | 0 | 0.0% |
| Hawaiian / Pacific | 0 | 0.0% |
| Hispanic or Latino | 1,933 | 16.4% |
| Native / Alaskan | 155 | 1.3% |
| White / Caucasian | 9,911 | 83.9% |
| Two or more Races | 842 | 7.1% |
| Some other Race | 905 | 7.7% |
| Total | 11,813 | 100.0% |
Ancestry in Teton County
The most populous ancestries reported in Teton County are English (1,970 | 16.7%), German (1,648 | 14.0%), Mexican (1,604 | 13.6%), Irish (995 | 8.4%), and Italian (643 | 5.4%), together accounting for 58.1% of all Teton County residents.
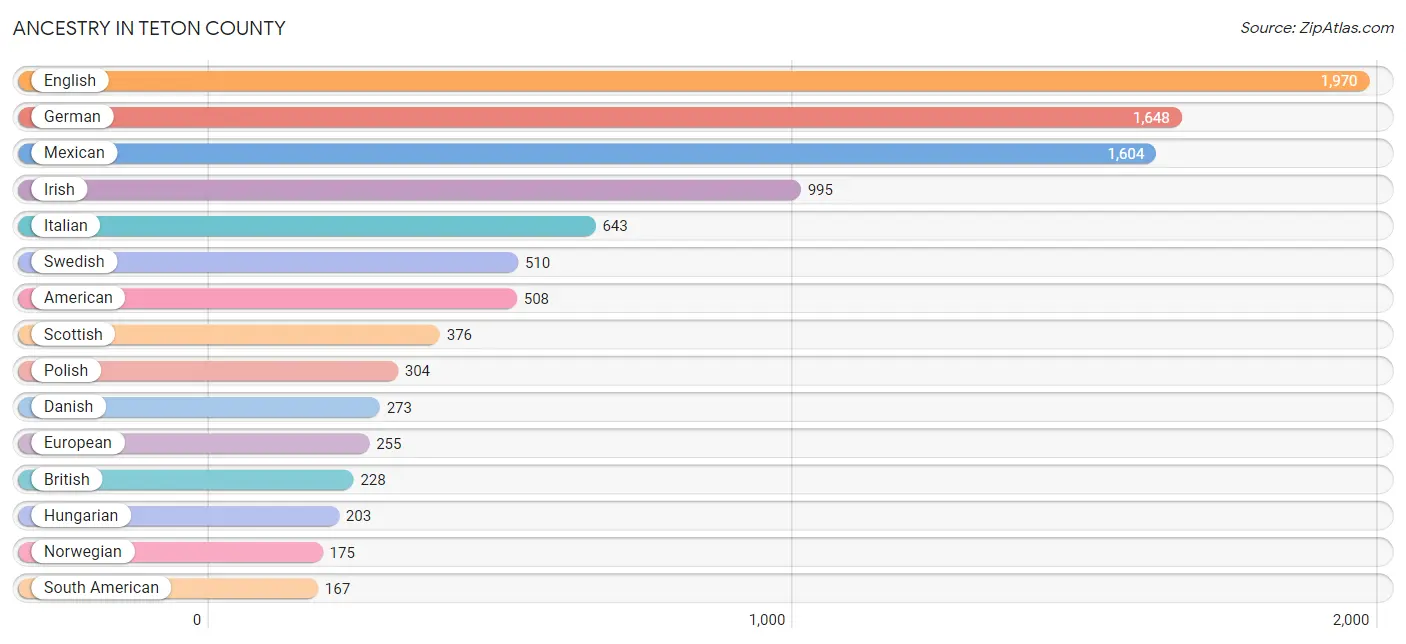
| Ancestry | # Population | % Population |
| American | 508 | 4.3% |
| Apache | 15 | 0.1% |
| Argentinean | 85 | 0.7% |
| Bhutanese | 29 | 0.3% |
| Blackfeet | 26 | 0.2% |
| British | 228 | 1.9% |
| Cajun | 5 | 0.0% |
| Celtic | 12 | 0.1% |
| Central American | 6 | 0.1% |
| Cherokee | 18 | 0.2% |
| Choctaw | 17 | 0.1% |
| Colombian | 14 | 0.1% |
| Czech | 50 | 0.4% |
| Czechoslovakian | 16 | 0.1% |
| Danish | 273 | 2.3% |
| Dutch | 137 | 1.2% |
| Eastern European | 22 | 0.2% |
| English | 1,970 | 16.7% |
| European | 255 | 2.2% |
| Finnish | 61 | 0.5% |
| French | 147 | 1.2% |
| French Canadian | 15 | 0.1% |
| German | 1,648 | 14.0% |
| Greek | 83 | 0.7% |
| Hungarian | 203 | 1.7% |
| Icelander | 23 | 0.2% |
| Inupiat | 75 | 0.6% |
| Irish | 995 | 8.4% |
| Italian | 643 | 5.4% |
| Latvian | 3 | 0.0% |
| Lithuanian | 10 | 0.1% |
| Maltese | 16 | 0.1% |
| Mexican | 1,604 | 13.6% |
| Mexican American Indian | 32 | 0.3% |
| Native Hawaiian | 49 | 0.4% |
| Northern European | 44 | 0.4% |
| Norwegian | 175 | 1.5% |
| Panamanian | 6 | 0.1% |
| Paraguayan | 66 | 0.6% |
| Peruvian | 2 | 0.0% |
| Polish | 304 | 2.6% |
| Portuguese | 24 | 0.2% |
| Puerto Rican | 57 | 0.5% |
| Romanian | 78 | 0.7% |
| Russian | 101 | 0.9% |
| Scandinavian | 94 | 0.8% |
| Scotch-Irish | 106 | 0.9% |
| Scottish | 376 | 3.2% |
| Slavic | 6 | 0.1% |
| Slovak | 12 | 0.1% |
| Slovene | 16 | 0.1% |
| South American | 167 | 1.4% |
| Spaniard | 11 | 0.1% |
| Spanish | 55 | 0.5% |
| Swedish | 510 | 4.3% |
| Swiss | 82 | 0.7% |
| Ukrainian | 13 | 0.1% |
| Welsh | 131 | 1.1% | View All 58 Rows |
Immigrants in Teton County
The most numerous immigrant groups reported in Teton County came from Latin America (899 | 7.6%), Central America (791 | 6.7%), Mexico (791 | 6.7%), Europe (132 | 1.1%), and South America (108 | 0.9%), together accounting for 23.0% of all Teton County residents.
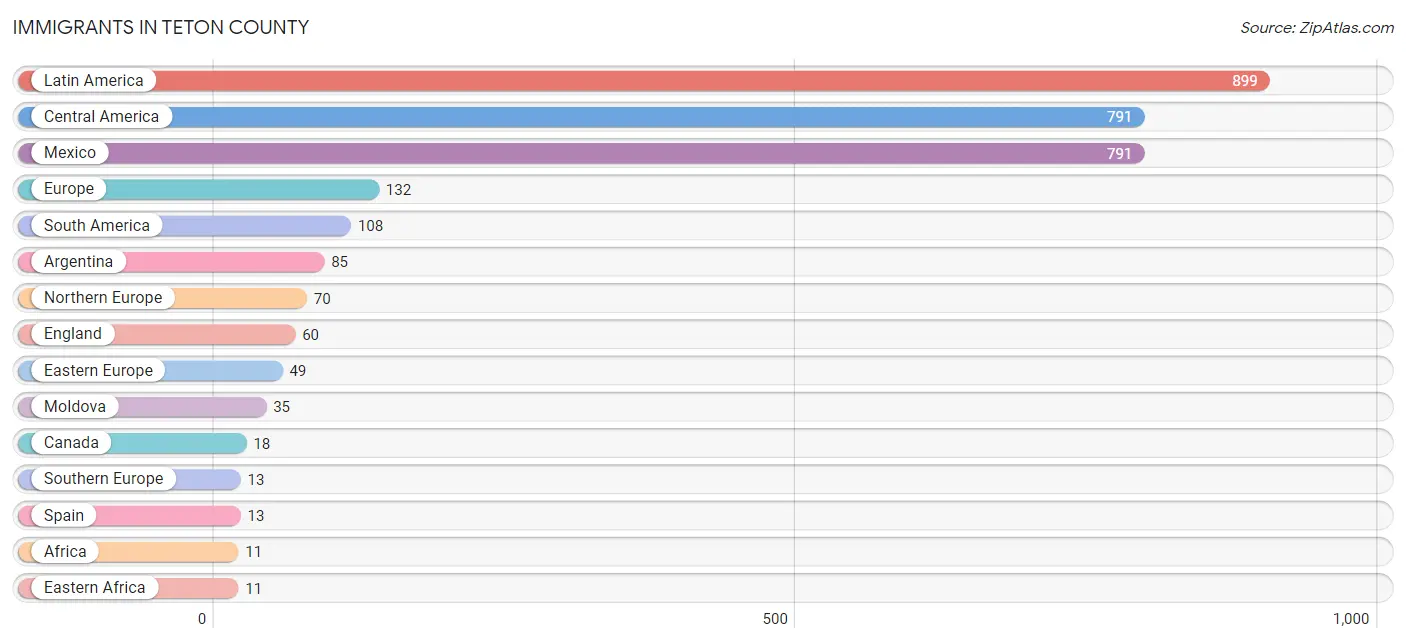
| Immigration Origin | # Population | % Population |
| Africa | 11 | 0.1% |
| Argentina | 85 | 0.7% |
| Canada | 18 | 0.2% |
| Central America | 791 | 6.7% |
| Eastern Africa | 11 | 0.1% |
| Eastern Europe | 49 | 0.4% |
| England | 60 | 0.5% |
| Europe | 132 | 1.1% |
| Latin America | 899 | 7.6% |
| Mexico | 791 | 6.7% |
| Moldova | 35 | 0.3% |
| Northern Europe | 70 | 0.6% |
| Peru | 2 | 0.0% |
| Poland | 9 | 0.1% |
| Russia | 5 | 0.0% |
| South America | 108 | 0.9% |
| Southern Europe | 13 | 0.1% |
| Spain | 13 | 0.1% |
| Zimbabwe | 11 | 0.1% | View All 19 Rows |
Sex and Age in Teton County
Sex and Age in Teton County
The most populous age groups in Teton County are 35 to 39 Years (598 | 9.9%) for men and 40 to 44 Years (550 | 9.5%) for women.
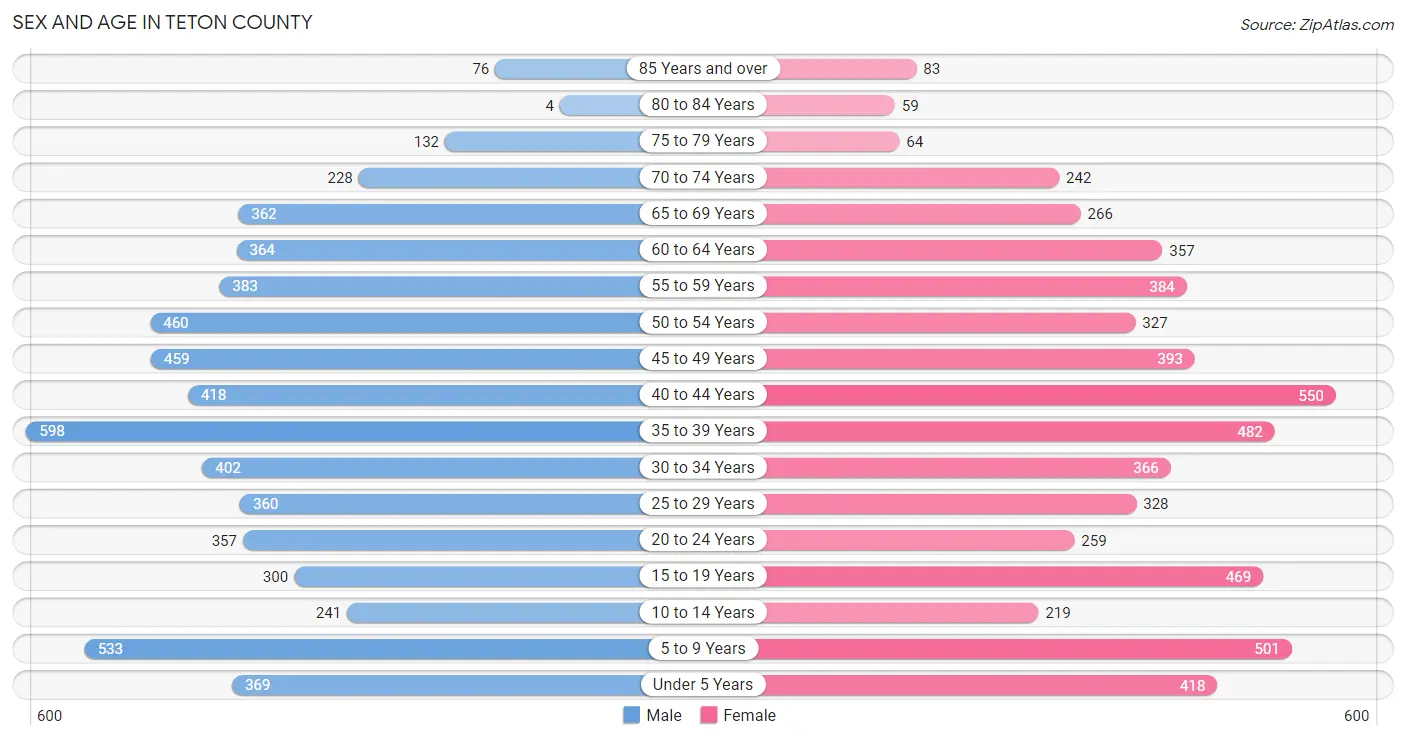
| Age Bracket | Male | Female |
| Under 5 Years | 369 (6.1%) | 418 (7.2%) |
| 5 to 9 Years | 533 (8.8%) | 501 (8.7%) |
| 10 to 14 Years | 241 (4.0%) | 219 (3.8%) |
| 15 to 19 Years | 300 (5.0%) | 469 (8.1%) |
| 20 to 24 Years | 357 (5.9%) | 259 (4.5%) |
| 25 to 29 Years | 360 (5.9%) | 328 (5.7%) |
| 30 to 34 Years | 402 (6.7%) | 366 (6.4%) |
| 35 to 39 Years | 598 (9.9%) | 482 (8.4%) |
| 40 to 44 Years | 418 (6.9%) | 550 (9.5%) |
| 45 to 49 Years | 459 (7.6%) | 393 (6.8%) |
| 50 to 54 Years | 460 (7.6%) | 327 (5.7%) |
| 55 to 59 Years | 383 (6.3%) | 384 (6.7%) |
| 60 to 64 Years | 364 (6.0%) | 357 (6.2%) |
| 65 to 69 Years | 362 (6.0%) | 266 (4.6%) |
| 70 to 74 Years | 228 (3.8%) | 242 (4.2%) |
| 75 to 79 Years | 132 (2.2%) | 64 (1.1%) |
| 80 to 84 Years | 4 (0.1%) | 59 (1.0%) |
| 85 Years and over | 76 (1.3%) | 83 (1.4%) |
| Total | 6,046 (100.0%) | 5,767 (100.0%) |
Families and Households in Teton County
Median Family Size in Teton County
The median family size in Teton County is 3.26 persons per family, with single female/mother families (304 | 11.0%) accounting for the largest median family size of 3.81 persons per family. On the other hand, single male/father families (117 | 4.2%) represent the smallest median family size with 2.12 persons per family.
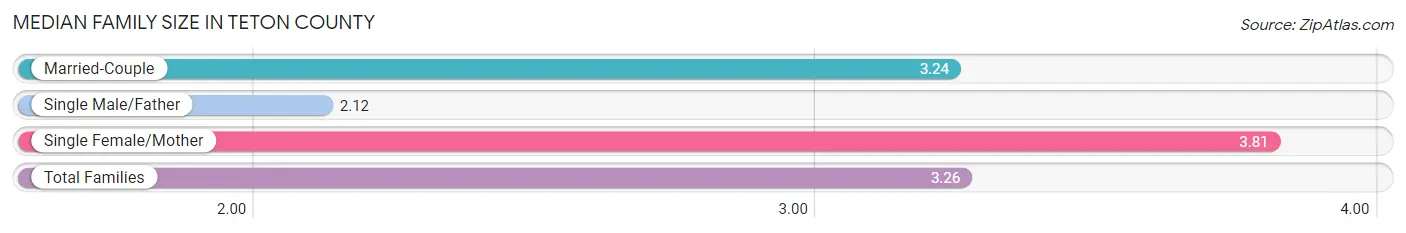
| Family Type | # Families | Family Size |
| Married-Couple | 2,337 (84.7%) | 3.24 |
| Single Male/Father | 117 (4.2%) | 2.12 |
| Single Female/Mother | 304 (11.0%) | 3.81 |
| Total Families | 2,758 (100.0%) | 3.26 |
Median Household Size in Teton County
The median household size in Teton County is 2.74 persons per household, with single female/mother households (304 | 7.0%) accounting for the largest median household size of 4.48 persons per household. non-family households (1,559 | 36.1%) represent the smallest median household size with 1.59 persons per household.
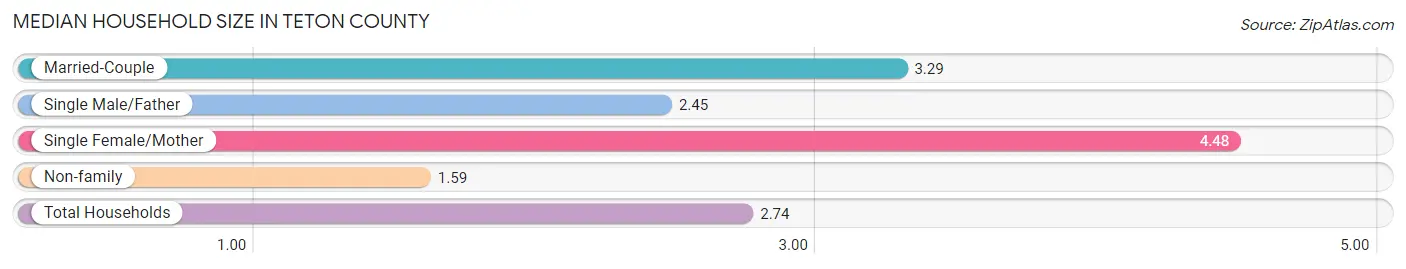
| Household Type | # Households | Household Size |
| Married-Couple | 2,337 (54.1%) | 3.29 |
| Single Male/Father | 117 (2.7%) | 2.45 |
| Single Female/Mother | 304 (7.0%) | 4.48 |
| Non-family | 1,559 (36.1%) | 1.59 |
| Total Households | 4,317 (100.0%) | 2.74 |
Household Size by Marriage Status in Teton County
Out of a total of 4,317 households in Teton County, 2,758 (63.9%) are family households, while 1,559 (36.1%) are nonfamily households. The most numerous type of family households are 2-person households, comprising 1,140, and the most common type of nonfamily households are 1-person households, comprising 990.
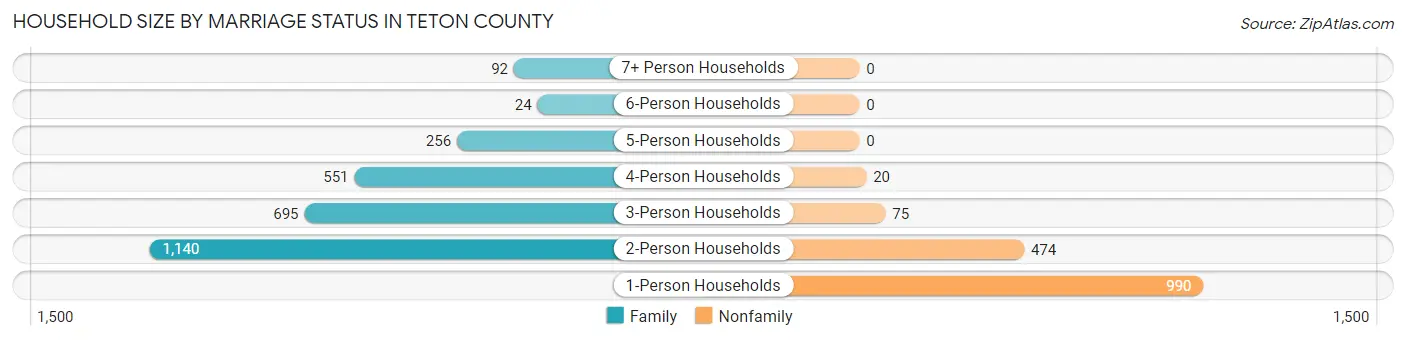
| Household Size | Family Households | Nonfamily Households |
| 1-Person Households | - | 990 (22.9%) |
| 2-Person Households | 1,140 (26.4%) | 474 (11.0%) |
| 3-Person Households | 695 (16.1%) | 75 (1.7%) |
| 4-Person Households | 551 (12.8%) | 20 (0.5%) |
| 5-Person Households | 256 (5.9%) | 0 (0.0%) |
| 6-Person Households | 24 (0.6%) | 0 (0.0%) |
| 7+ Person Households | 92 (2.1%) | 0 (0.0%) |
| Total | 2,758 (63.9%) | 1,559 (36.1%) |
Female Fertility in Teton County
Fertility by Age in Teton County
Average fertility rate in Teton County is 65.0 births per 1,000 women. Women in the age bracket of 35 to 50 years have the highest fertility rate with 88.0 births per 1,000 women. Women in the age bracket of 35 to 50 years acount for 68.3% of all women with births.
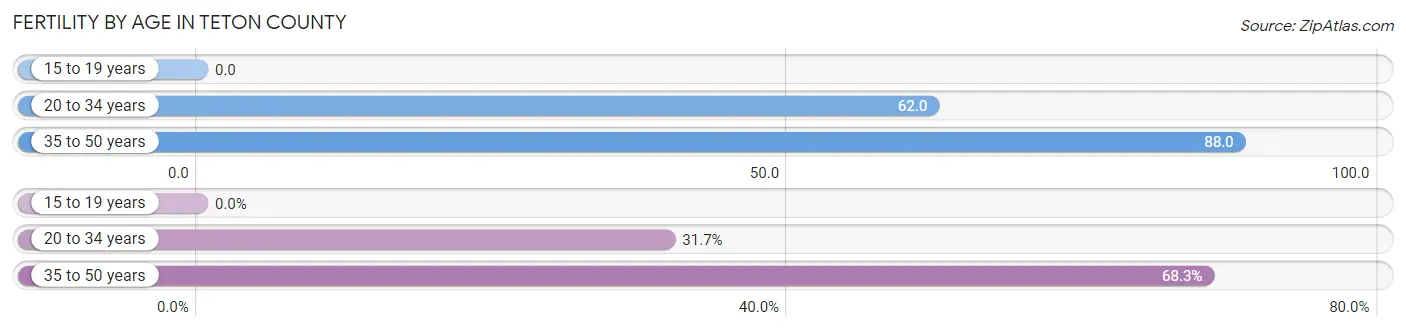
| Age Bracket | Women with Births | Births / 1,000 Women |
| 15 to 19 years | 0 (0.0%) | 0.0 |
| 20 to 34 years | 59 (31.7%) | 62.0 |
| 35 to 50 years | 127 (68.3%) | 88.0 |
| Total | 186 (100.0%) | 65.0 |
Fertility by Age by Marriage Status in Teton County
60.2% of women with births (186) in Teton County are married. The highest percentage of unmarried women with births falls into 35 to 50 years age bracket with 47.2% of them unmarried at the time of birth, while the lowest percentage of unmarried women with births belong to 20 to 34 years age bracket with 23.7% of them unmarried.
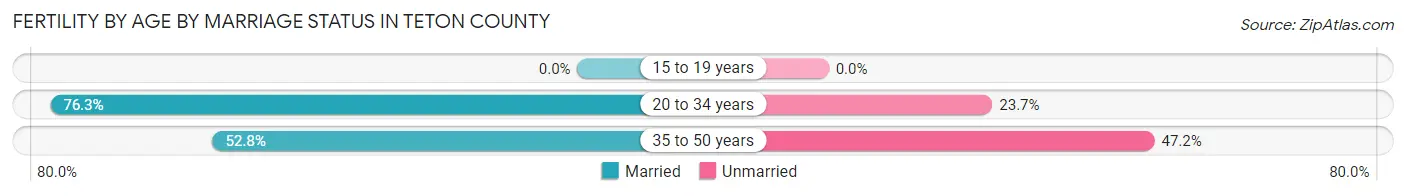
| Age Bracket | Married | Unmarried |
| 15 to 19 years | 0 (0.0%) | 0 (0.0%) |
| 20 to 34 years | 45 (76.3%) | 14 (23.7%) |
| 35 to 50 years | 67 (52.8%) | 60 (47.2%) |
| Total | 112 (60.2%) | 74 (39.8%) |
Fertility by Education in Teton County
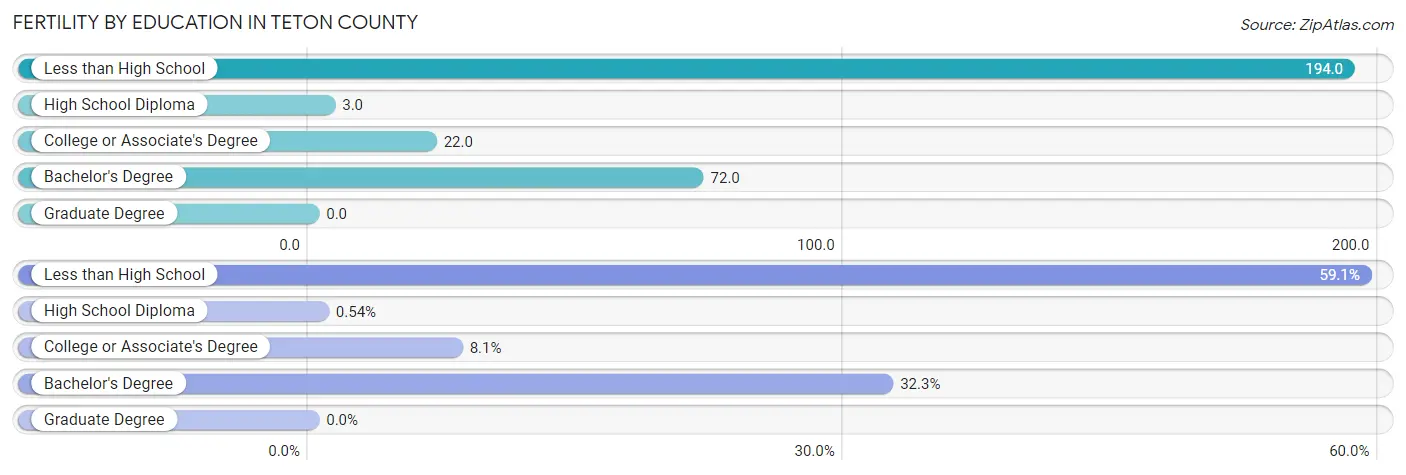
| Educational Attainment | Women with Births | Births / 1,000 Women |
| Less than High School | 110 (59.1%) | 194.0 |
| High School Diploma | 1 (0.5%) | 3.0 |
| College or Associate's Degree | 15 (8.1%) | 22.0 |
| Bachelor's Degree | 60 (32.3%) | 72.0 |
| Graduate Degree | 0 (0.0%) | 0.0 |
| Total | 186 (100.0%) | 65.0 |
Fertility by Education by Marriage Status in Teton County
39.8% of women with births in Teton County are unmarried. Women with the educational attainment of high school diploma are most likely to be married with 100.0% of them married at childbirth, while women with the educational attainment of less than high school are least likely to be married with 67.3% of them unmarried at childbirth.
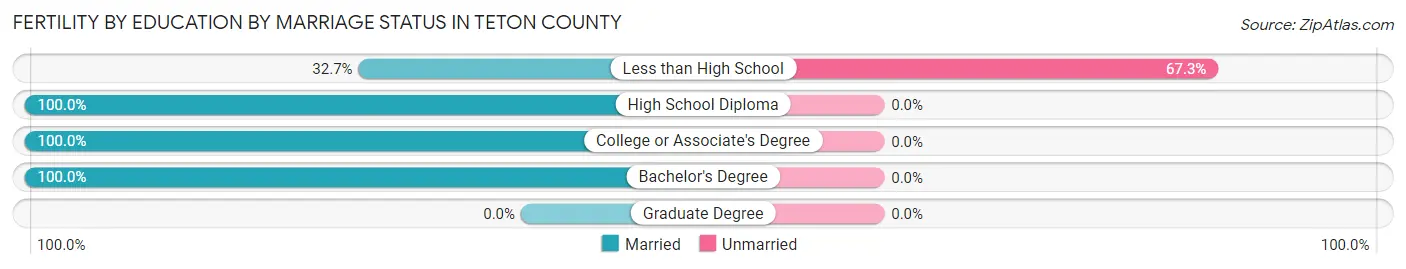
| Educational Attainment | Married | Unmarried |
| Less than High School | 36 (32.7%) | 74 (67.3%) |
| High School Diploma | 1 (100.0%) | 0 (0.0%) |
| College or Associate's Degree | 15 (100.0%) | 0 (0.0%) |
| Bachelor's Degree | 60 (100.0%) | 0 (0.0%) |
| Graduate Degree | 0 (0.0%) | 0 (0.0%) |
| Total | 112 (60.2%) | 74 (39.8%) |
Income in Teton County
Income Overview in Teton County
Per Capita Income in Teton County is $43,396, while median incomes of families and households are $109,286 and $88,906 respectively.
| Characteristic | Number | Measure |
| Per Capita Income | 11,813 | $43,396 |
| Median Family Income | 2,758 | $109,286 |
| Mean Family Income | 2,758 | $131,780 |
| Median Household Income | 4,317 | $88,906 |
| Mean Household Income | 4,317 | $115,438 |
| Income Deficit | 2,758 | $12,121 |
| Wage / Income Gap (%) | 11,813 | 26.41% |
| Wage / Income Gap ($) | 11,813 | 73.59¢ per $1 |
| Gini / Inequality Index | 11,813 | 0.42 |
Earnings by Sex in Teton County
Average Earnings in Teton County are $43,012, $47,056 for men and $34,629 for women, a difference of 26.4%.
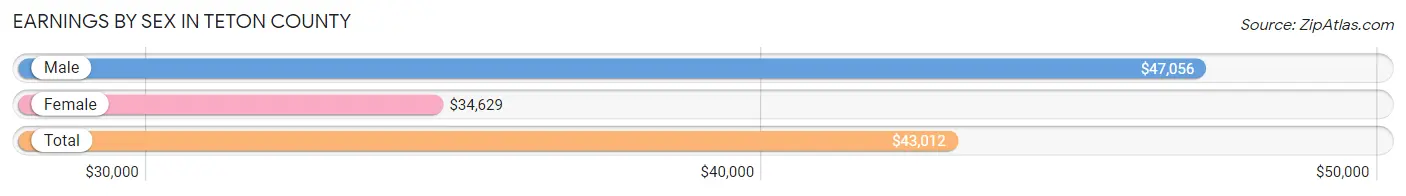
| Sex | Number | Average Earnings |
| Male | 4,146 (56.1%) | $47,056 |
| Female | 3,250 (43.9%) | $34,629 |
| Total | 7,396 (100.0%) | $43,012 |
Earnings by Sex by Income Bracket in Teton County
The most common earnings brackets in Teton County are $100,000+ for men (763 | 18.4%) and $100,000+ for women (389 | 12.0%).
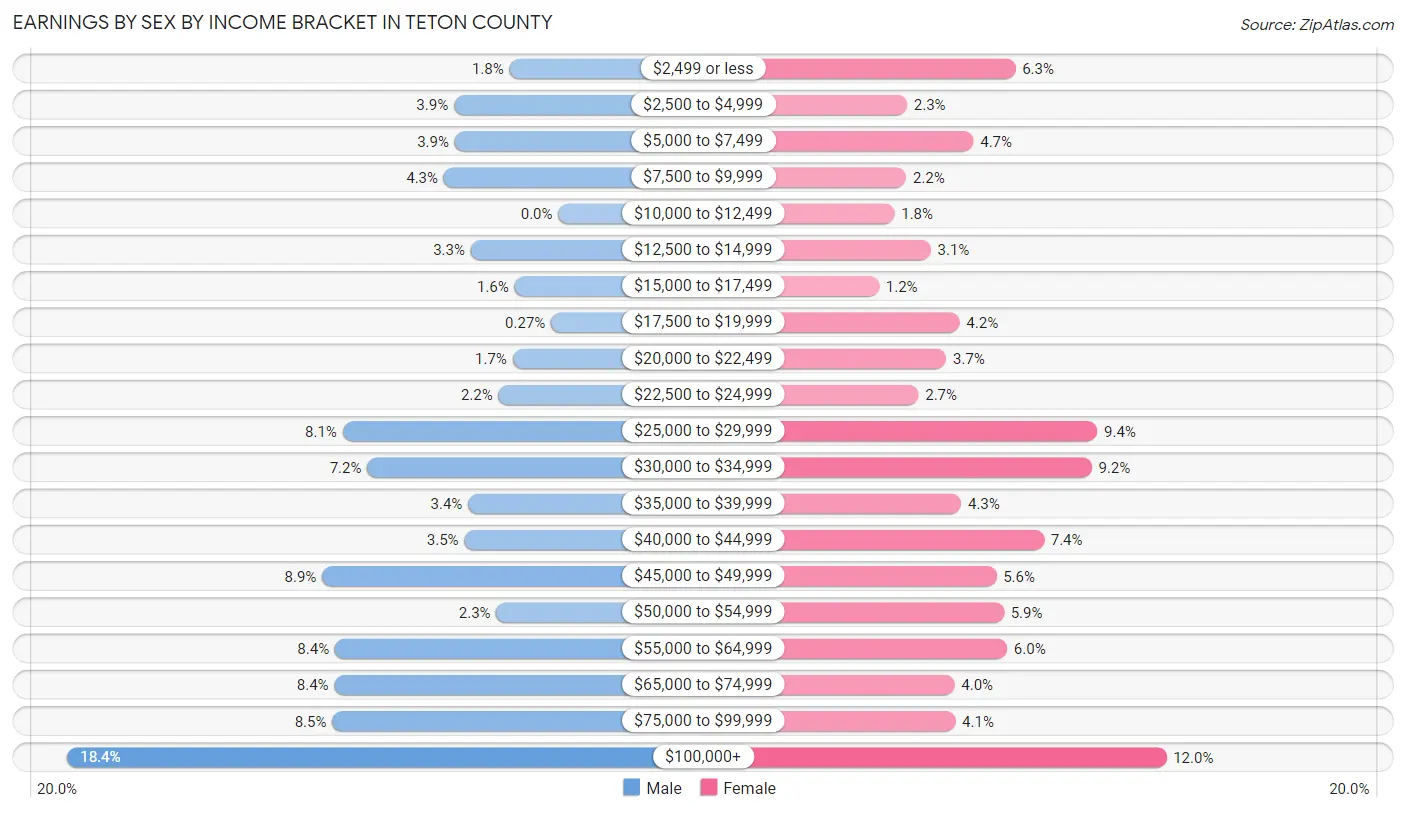
| Income | Male | Female |
| $2,499 or less | 76 (1.8%) | 205 (6.3%) |
| $2,500 to $4,999 | 162 (3.9%) | 73 (2.2%) |
| $5,000 to $7,499 | 161 (3.9%) | 154 (4.7%) |
| $7,500 to $9,999 | 178 (4.3%) | 72 (2.2%) |
| $10,000 to $12,499 | 0 (0.0%) | 58 (1.8%) |
| $12,500 to $14,999 | 136 (3.3%) | 102 (3.1%) |
| $15,000 to $17,499 | 68 (1.6%) | 39 (1.2%) |
| $17,500 to $19,999 | 11 (0.3%) | 137 (4.2%) |
| $20,000 to $22,499 | 71 (1.7%) | 121 (3.7%) |
| $22,500 to $24,999 | 93 (2.2%) | 87 (2.7%) |
| $25,000 to $29,999 | 335 (8.1%) | 305 (9.4%) |
| $30,000 to $34,999 | 297 (7.2%) | 298 (9.2%) |
| $35,000 to $39,999 | 140 (3.4%) | 139 (4.3%) |
| $40,000 to $44,999 | 146 (3.5%) | 240 (7.4%) |
| $45,000 to $49,999 | 367 (8.8%) | 182 (5.6%) |
| $50,000 to $54,999 | 96 (2.3%) | 191 (5.9%) |
| $55,000 to $64,999 | 347 (8.4%) | 195 (6.0%) |
| $65,000 to $74,999 | 348 (8.4%) | 131 (4.0%) |
| $75,000 to $99,999 | 351 (8.5%) | 132 (4.1%) |
| $100,000+ | 763 (18.4%) | 389 (12.0%) |
| Total | 4,146 (100.0%) | 3,250 (100.0%) |
Earnings by Sex by Educational Attainment in Teton County
Average earnings in Teton County are $53,594 for men and $39,375 for women, a difference of 26.5%. Men with an educational attainment of bachelor's degree enjoy the highest average annual earnings of $77,257, while those with less than high school education earn the least with $30,469. Women with an educational attainment of bachelor's degree earn the most with the average annual earnings of $44,554, while those with high school diploma education have the smallest earnings of $27,188.
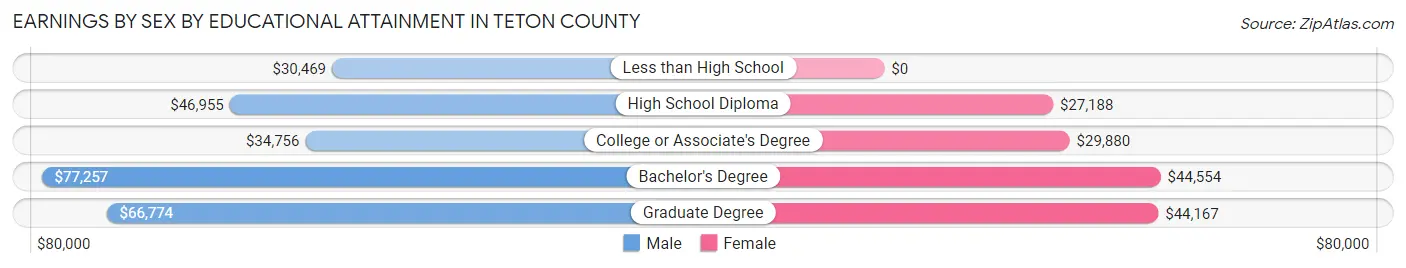
| Educational Attainment | Male Income | Female Income |
| Less than High School | $30,469 | $0 |
| High School Diploma | $46,955 | $27,188 |
| College or Associate's Degree | $34,756 | $29,880 |
| Bachelor's Degree | $77,257 | $44,554 |
| Graduate Degree | $66,774 | $44,167 |
| Total | $53,594 | $39,375 |
Family Income in Teton County
Family Income Brackets in Teton County
According to the Teton County family income data, there are 640 families falling into the $100,000 to $149,999 income range, which is the most common income bracket and makes up 23.2% of all families. Conversely, the less than $10,000 income bracket is the least frequent group with only 66 families (2.4%) belonging to this category.
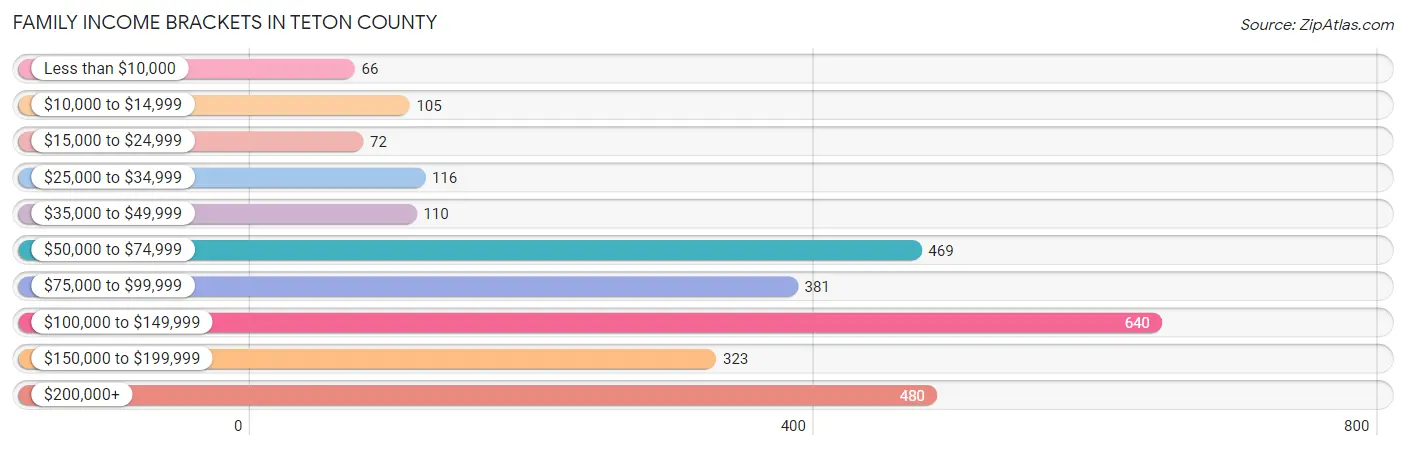
| Income Bracket | # Families | % Families |
| Less than $10,000 | 66 | 2.4% |
| $10,000 to $14,999 | 105 | 3.8% |
| $15,000 to $24,999 | 72 | 2.6% |
| $25,000 to $34,999 | 116 | 4.2% |
| $35,000 to $49,999 | 110 | 4.0% |
| $50,000 to $74,999 | 469 | 17.0% |
| $75,000 to $99,999 | 381 | 13.8% |
| $100,000 to $149,999 | 640 | 23.2% |
| $150,000 to $199,999 | 323 | 11.7% |
| $200,000+ | 480 | 17.4% |
Family Income by Famaliy Size in Teton County
5-person families (181 | 6.6%) account for the highest median family income in Teton County with $134,234 per family, while 2-person families (1,204 | 43.6%) have the highest median income of $45,692 per family member.
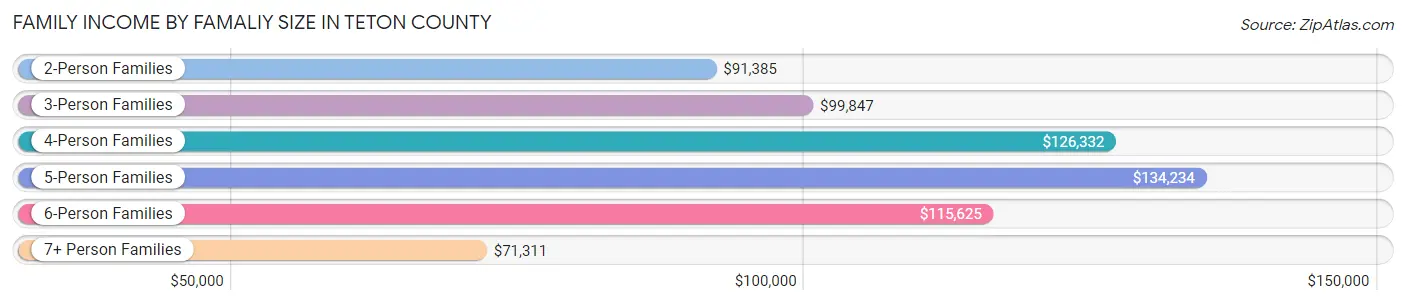
| Income Bracket | # Families | Median Income |
| 2-Person Families | 1,204 (43.6%) | $91,385 |
| 3-Person Families | 712 (25.8%) | $99,847 |
| 4-Person Families | 545 (19.8%) | $126,332 |
| 5-Person Families | 181 (6.6%) | $134,234 |
| 6-Person Families | 24 (0.9%) | $115,625 |
| 7+ Person Families | 92 (3.3%) | $71,311 |
| Total | 2,758 (100.0%) | $109,286 |
Family Income by Number of Earners in Teton County
The median family income in Teton County is $109,286, with families comprising 3+ earners (225) having the highest median family income of $137,679, while families with 1 earner (771) have the lowest median family income of $54,446, accounting for 8.2% and 28.0% of families, respectively.
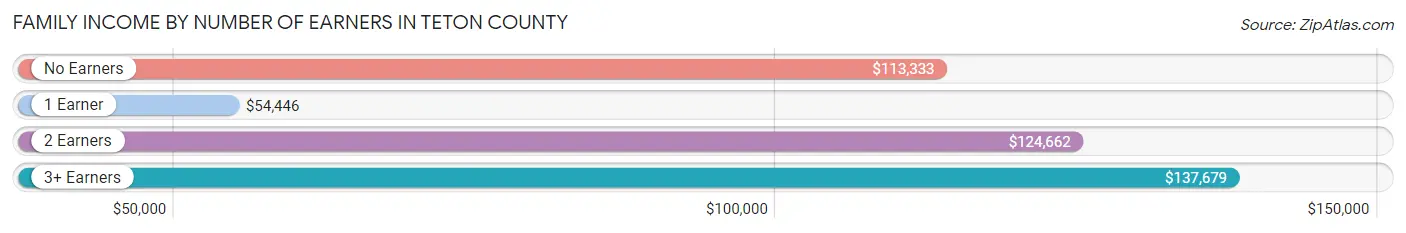
| Number of Earners | # Families | Median Income |
| No Earners | 186 (6.7%) | $113,333 |
| 1 Earner | 771 (28.0%) | $54,446 |
| 2 Earners | 1,576 (57.1%) | $124,662 |
| 3+ Earners | 225 (8.2%) | $137,679 |
| Total | 2,758 (100.0%) | $109,286 |
Household Income in Teton County
Household Income Brackets in Teton County
With 825 households falling in the category, the $100,000 to $149,999 income range is the most frequent in Teton County, accounting for 19.1% of all households. In contrast, only 130 households (3.0%) fall into the less than $10,000 income bracket, making it the least populous group.
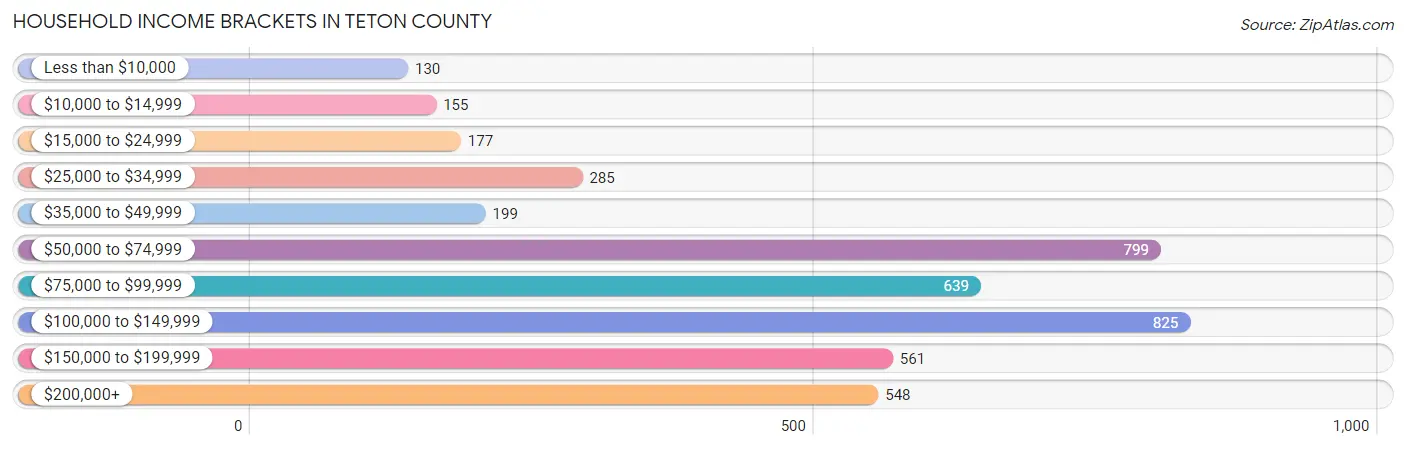
| Income Bracket | # Households | % Households |
| Less than $10,000 | 130 | 3.0% |
| $10,000 to $14,999 | 155 | 3.6% |
| $15,000 to $24,999 | 177 | 4.1% |
| $25,000 to $34,999 | 285 | 6.6% |
| $35,000 to $49,999 | 199 | 4.6% |
| $50,000 to $74,999 | 799 | 18.5% |
| $75,000 to $99,999 | 639 | 14.8% |
| $100,000 to $149,999 | 825 | 19.1% |
| $150,000 to $199,999 | 561 | 13.0% |
| $200,000+ | 548 | 12.7% |
Household Income by Householder Age in Teton County
The median household income in Teton County is $88,906, with the highest median household income of $120,096 found in the 45 to 64 years age bracket for the primary householder. A total of 1,819 households (42.1%) fall into this category. Meanwhile, the 15 to 24 years age bracket for the primary householder has the lowest median household income of $35,250, with 117 households (2.7%) in this group.
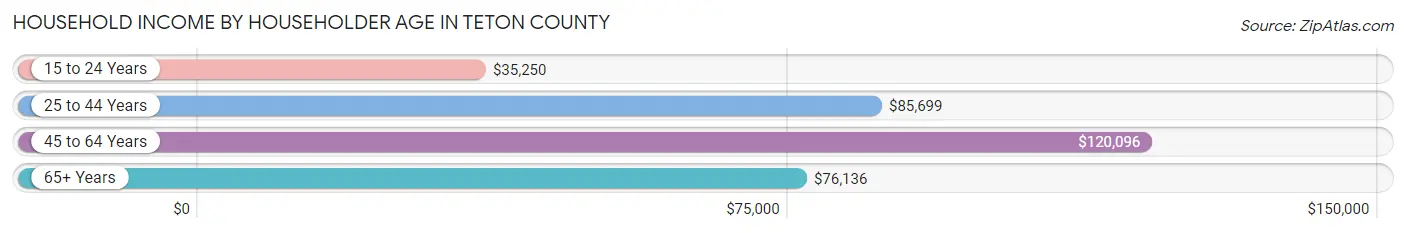
| Income Bracket | # Households | Median Income |
| 15 to 24 Years | 117 (2.7%) | $35,250 |
| 25 to 44 Years | 1,525 (35.3%) | $85,699 |
| 45 to 64 Years | 1,819 (42.1%) | $120,096 |
| 65+ Years | 856 (19.8%) | $76,136 |
| Total | 4,317 (100.0%) | $88,906 |
Poverty in Teton County
Income Below Poverty by Sex and Age in Teton County
With 7.3% poverty level for males and 12.8% for females among the residents of Teton County, 65 to 74 year old males and 12 to 14 year old females are the most vulnerable to poverty, with 163 males (27.6%) and 61 females (30.5%) in their respective age groups living below the poverty level.
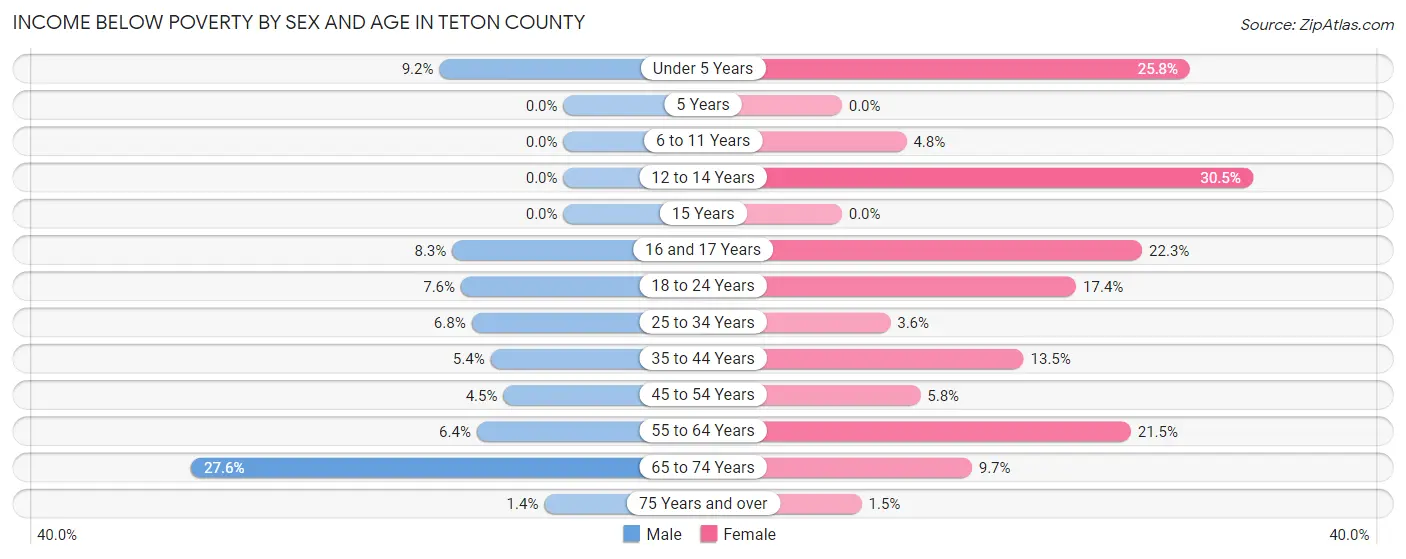
| Age Bracket | Male | Female |
| Under 5 Years | 34 (9.2%) | 108 (25.8%) |
| 5 Years | 0 (0.0%) | 0 (0.0%) |
| 6 to 11 Years | 0 (0.0%) | 20 (4.8%) |
| 12 to 14 Years | 0 (0.0%) | 61 (30.5%) |
| 15 Years | 0 (0.0%) | 0 (0.0%) |
| 16 and 17 Years | 10 (8.3%) | 60 (22.3%) |
| 18 to 24 Years | 35 (7.6%) | 71 (17.4%) |
| 25 to 34 Years | 52 (6.8%) | 25 (3.6%) |
| 35 to 44 Years | 55 (5.4%) | 139 (13.5%) |
| 45 to 54 Years | 41 (4.5%) | 42 (5.8%) |
| 55 to 64 Years | 48 (6.4%) | 159 (21.5%) |
| 65 to 74 Years | 163 (27.6%) | 49 (9.7%) |
| 75 Years and over | 3 (1.4%) | 3 (1.5%) |
| Total | 441 (7.3%) | 737 (12.8%) |
Income Above Poverty by Sex and Age in Teton County
According to the poverty statistics in Teton County, males aged 5 years and females aged 5 years are the age groups that are most secure financially, with 100.0% of males and 100.0% of females in these age groups living above the poverty line.
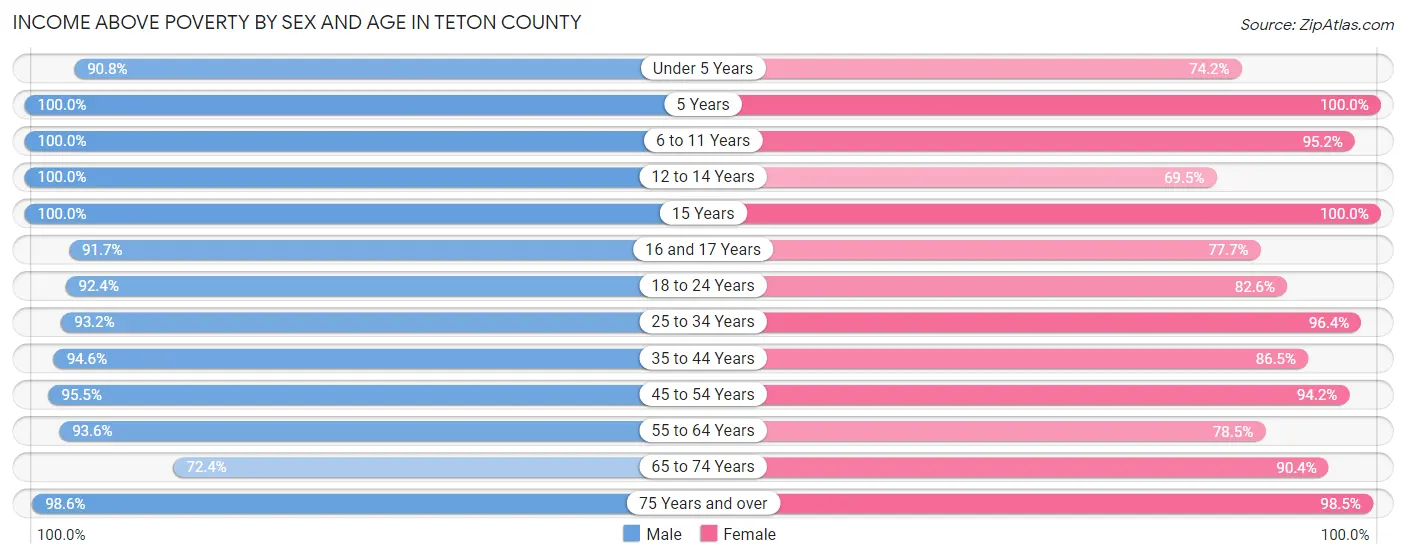
| Age Bracket | Male | Female |
| Under 5 Years | 335 (90.8%) | 310 (74.2%) |
| 5 Years | 187 (100.0%) | 103 (100.0%) |
| 6 to 11 Years | 443 (100.0%) | 397 (95.2%) |
| 12 to 14 Years | 144 (100.0%) | 139 (69.5%) |
| 15 Years | 76 (100.0%) | 51 (100.0%) |
| 16 and 17 Years | 111 (91.7%) | 209 (77.7%) |
| 18 to 24 Years | 425 (92.4%) | 337 (82.6%) |
| 25 to 34 Years | 710 (93.2%) | 669 (96.4%) |
| 35 to 44 Years | 961 (94.6%) | 891 (86.5%) |
| 45 to 54 Years | 878 (95.5%) | 678 (94.2%) |
| 55 to 64 Years | 699 (93.6%) | 582 (78.5%) |
| 65 to 74 Years | 427 (72.4%) | 459 (90.3%) |
| 75 Years and over | 209 (98.6%) | 201 (98.5%) |
| Total | 5,605 (92.7%) | 5,026 (87.2%) |
Income Below Poverty Among Married-Couple Families in Teton County
The poverty statistics for married-couple families in Teton County show that 4.8% or 112 of the total 2,337 families live below the poverty line. Families with no children have the highest poverty rate of 9.3%, comprising of 112 families. On the other hand, families with 1 or 2 children have the lowest poverty rate of 0.0%, which includes 0 families.
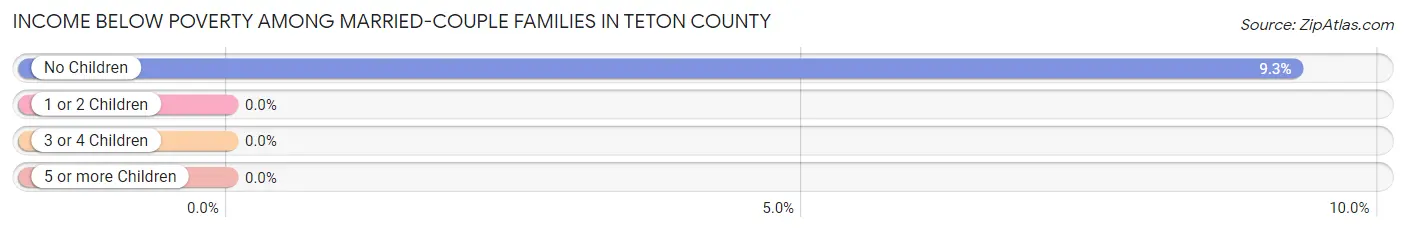
| Children | Above Poverty | Below Poverty |
| No Children | 1,096 (90.7%) | 112 (9.3%) |
| 1 or 2 Children | 932 (100.0%) | 0 (0.0%) |
| 3 or 4 Children | 109 (100.0%) | 0 (0.0%) |
| 5 or more Children | 88 (100.0%) | 0 (0.0%) |
| Total | 2,225 (95.2%) | 112 (4.8%) |
Income Below Poverty Among Single-Parent Households in Teton County
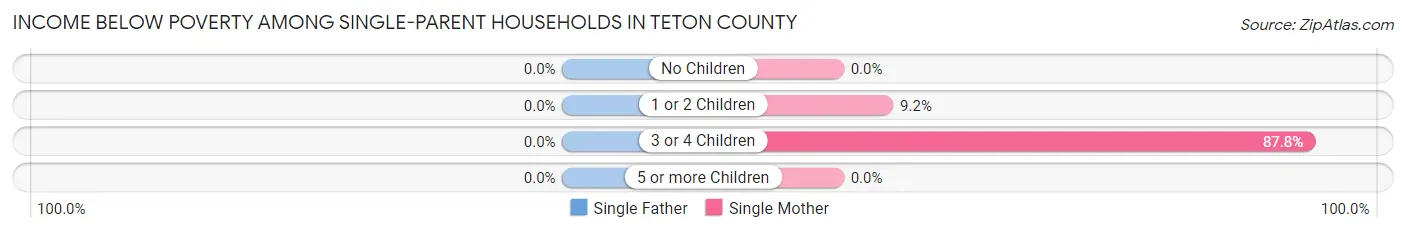
| Children | Single Father | Single Mother |
| No Children | 0 (0.0%) | 0 (0.0%) |
| 1 or 2 Children | 0 (0.0%) | 13 (9.2%) |
| 3 or 4 Children | 0 (0.0%) | 79 (87.8%) |
| 5 or more Children | 0 (0.0%) | 0 (0.0%) |
| Total | 0 (0.0%) | 92 (30.3%) |
Income Below Poverty Among Married-Couple vs Single-Parent Households in Teton County
The poverty data for Teton County shows that 112 of the married-couple family households (4.8%) and 92 of the single-parent households (21.8%) are living below the poverty level. Within the married-couple family households, those with no children have the highest poverty rate, with 112 households (9.3%) falling below the poverty line. Among the single-parent households, those with 3 or 4 children have the highest poverty rate, with 79 household (87.8%) living below poverty.
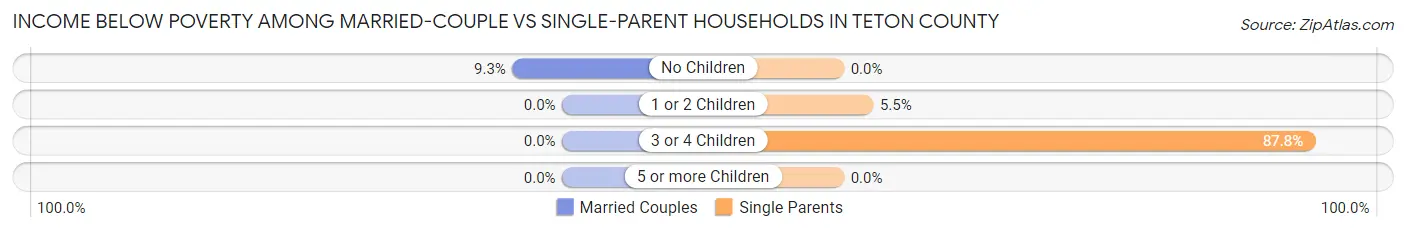
| Children | Married-Couple Families | Single-Parent Households |
| No Children | 112 (9.3%) | 0 (0.0%) |
| 1 or 2 Children | 0 (0.0%) | 13 (5.5%) |
| 3 or 4 Children | 0 (0.0%) | 79 (87.8%) |
| 5 or more Children | 0 (0.0%) | 0 (0.0%) |
| Total | 112 (4.8%) | 92 (21.8%) |
Employment Characteristics in Teton County
Employment by Class of Employer in Teton County
Among the 6,681 employed individuals in Teton County, private company employees (4,077 | 61.0%), self-employed (not incorporated) (1,050 | 15.7%), and not-for-profit organizations (489 | 7.3%) make up the most common classes of employment.
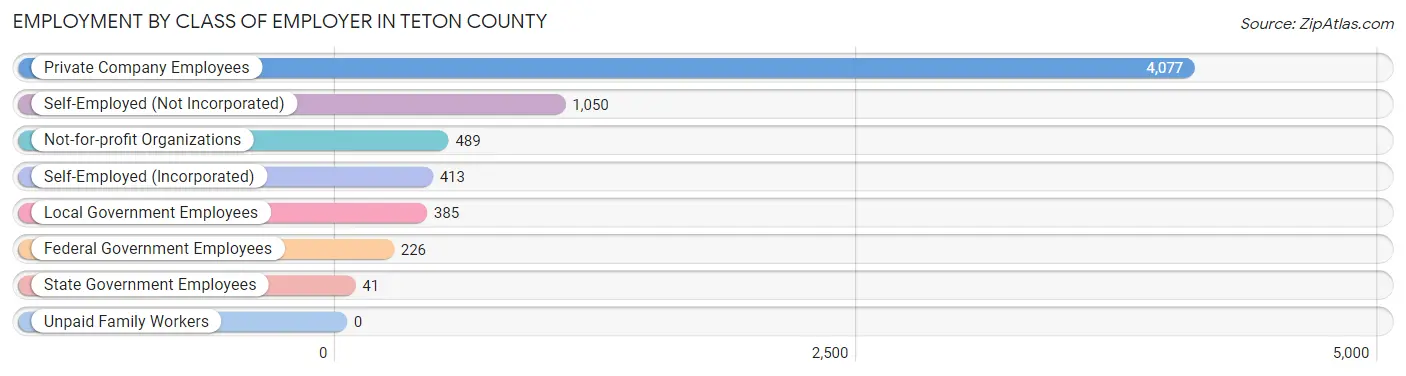
| Employer Class | # Employees | % Employees |
| Private Company Employees | 4,077 | 61.0% |
| Self-Employed (Incorporated) | 413 | 6.2% |
| Self-Employed (Not Incorporated) | 1,050 | 15.7% |
| Not-for-profit Organizations | 489 | 7.3% |
| Local Government Employees | 385 | 5.8% |
| State Government Employees | 41 | 0.6% |
| Federal Government Employees | 226 | 3.4% |
| Unpaid Family Workers | 0 | 0.0% |
| Total | 6,681 | 100.0% |
Employment Status by Age in Teton County
According to the labor force statistics for Teton County, out of the total population over 16 years of age (9,405), 74.3% or 6,988 individuals are in the labor force, with 1.6% or 112 of them unemployed. The age group with the highest labor force participation rate is 20 to 24 years, with 95.5% or 588 individuals in the labor force. Within the labor force, the 16 to 19 years age range has the highest percentage of unemployed individuals, with 10.0% or 24 of them being unemployed.
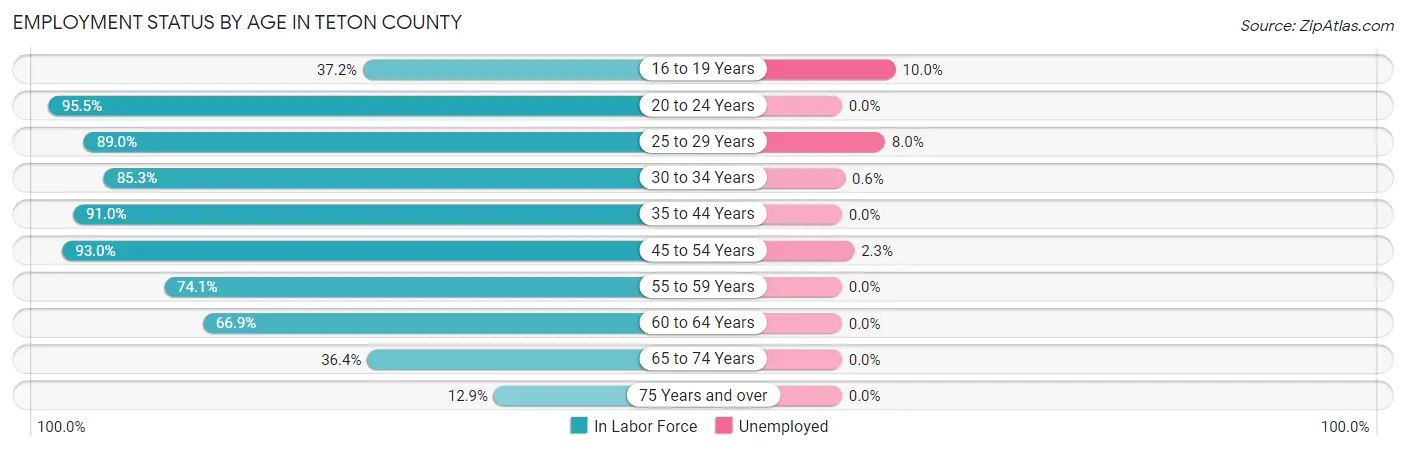
| Age Bracket | In Labor Force | Unemployed |
| 16 to 19 Years | 239 (37.2%) | 24 (10.0%) |
| 20 to 24 Years | 588 (95.5%) | 0 (0.0%) |
| 25 to 29 Years | 612 (89.0%) | 49 (8.0%) |
| 30 to 34 Years | 655 (85.3%) | 4 (0.6%) |
| 35 to 44 Years | 1,864 (91.0%) | 0 (0.0%) |
| 45 to 54 Years | 1,524 (93.0%) | 35 (2.3%) |
| 55 to 59 Years | 568 (74.1%) | 0 (0.0%) |
| 60 to 64 Years | 482 (66.9%) | 0 (0.0%) |
| 65 to 74 Years | 400 (36.4%) | 0 (0.0%) |
| 75 Years and over | 54 (12.9%) | 0 (0.0%) |
| Total | 6,988 (74.3%) | 112 (1.6%) |
Employment Status by Educational Attainment in Teton County
According to labor force statistics for Teton County, 86.1% of individuals (5,709) out of the total population between 25 and 64 years of age (6,631) are in the labor force, with 1.5% or 86 of them being unemployed. The group with the highest labor force participation rate are those with the educational attainment of bachelor's degree or higher, with 90.6% or 2,905 individuals in the labor force. Within the labor force, individuals with high school diploma education have the highest percentage of unemployment, with 5.5% or 49 of them being unemployed.
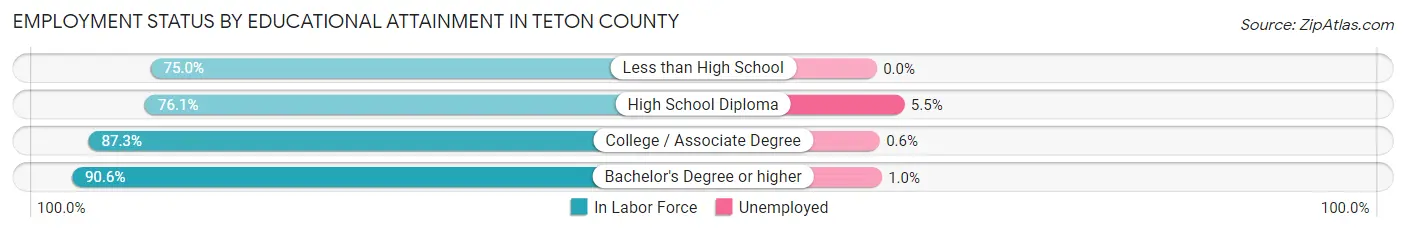
| Educational Attainment | In Labor Force | Unemployed |
| Less than High School | 357 (75.0%) | 0 (0.0%) |
| High School Diploma | 889 (76.1%) | 64 (5.5%) |
| College / Associate Degree | 1,555 (87.3%) | 11 (0.6%) |
| Bachelor's Degree or higher | 2,905 (90.6%) | 32 (1.0%) |
| Total | 5,709 (86.1%) | 99 (1.5%) |
Employment Occupations by Sex in Teton County
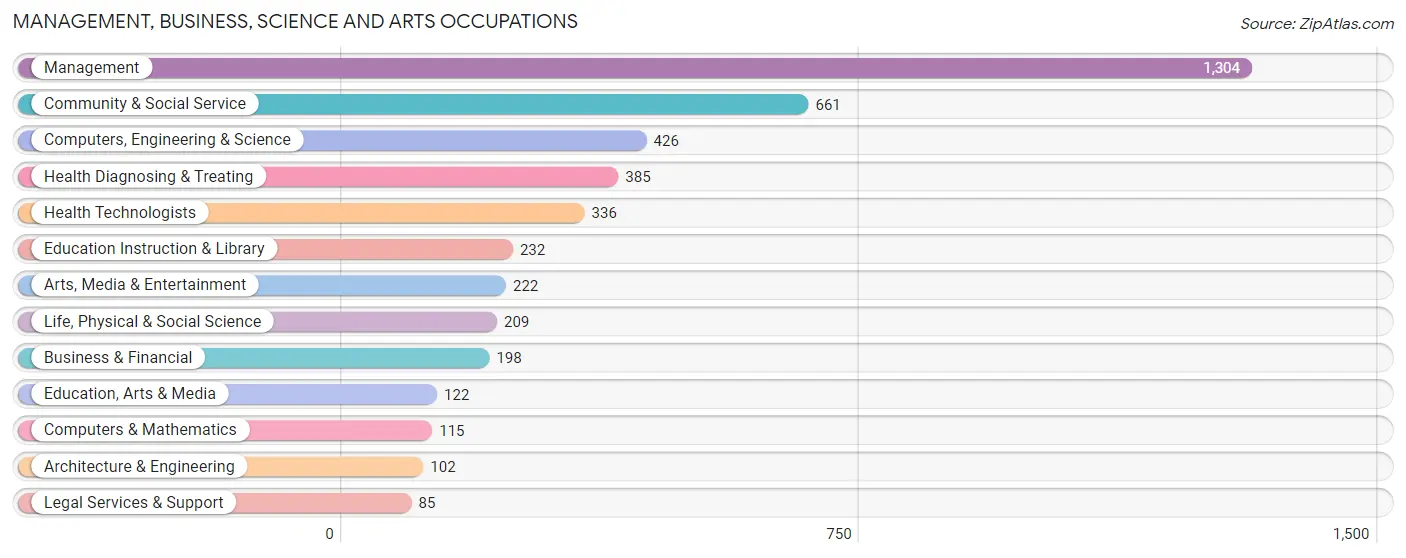
Management, Business, Science and Arts Occupations
The most common Management, Business, Science and Arts occupations in Teton County are Management (1,304 | 19.0%), Community & Social Service (661 | 9.6%), Computers, Engineering & Science (426 | 6.2%), Health Diagnosing & Treating (385 | 5.6%), and Health Technologists (336 | 4.9%).
Management, Business, Science and Arts Occupations by Sex
Within the Management, Business, Science and Arts occupations in Teton County, the most male-oriented occupations are Computers & Mathematics (98.3%), Architecture & Engineering (91.2%), and Management (80.7%), while the most female-oriented occupations are Health Diagnosing & Treating (92.2%), Health Technologists (91.1%), and Education Instruction & Library (82.8%).
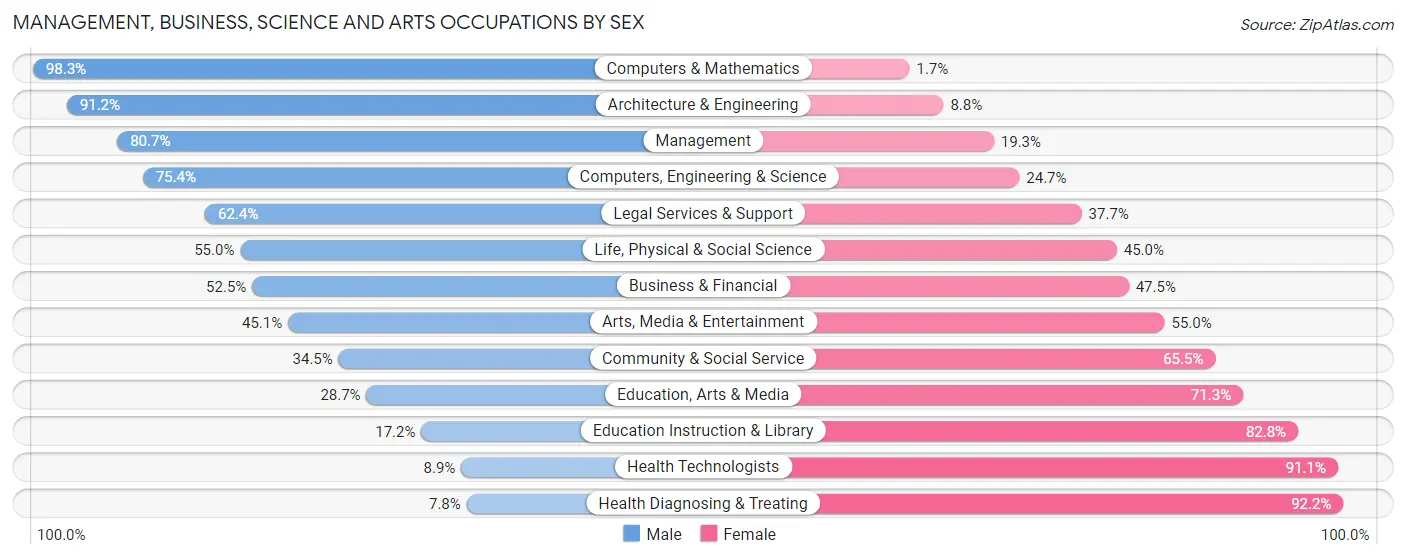
| Occupation | Male | Female |
| Management | 1,052 (80.7%) | 252 (19.3%) |
| Business & Financial | 104 (52.5%) | 94 (47.5%) |
| Computers, Engineering & Science | 321 (75.3%) | 105 (24.6%) |
| Computers & Mathematics | 113 (98.3%) | 2 (1.7%) |
| Architecture & Engineering | 93 (91.2%) | 9 (8.8%) |
| Life, Physical & Social Science | 115 (55.0%) | 94 (45.0%) |
| Community & Social Service | 228 (34.5%) | 433 (65.5%) |
| Education, Arts & Media | 35 (28.7%) | 87 (71.3%) |
| Legal Services & Support | 53 (62.4%) | 32 (37.7%) |
| Education Instruction & Library | 40 (17.2%) | 192 (82.8%) |
| Arts, Media & Entertainment | 100 (45.1%) | 122 (54.9%) |
| Health Diagnosing & Treating | 30 (7.8%) | 355 (92.2%) |
| Health Technologists | 30 (8.9%) | 306 (91.1%) |
| Total (Category) | 1,735 (58.3%) | 1,239 (41.7%) |
| Total (Overall) | 3,824 (55.6%) | 3,051 (44.4%) |
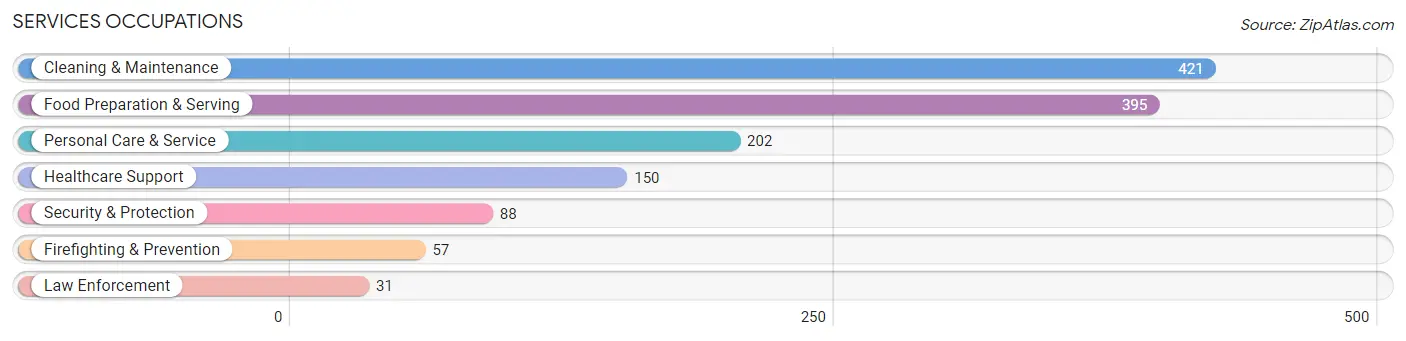
Services Occupations
The most common Services occupations in Teton County are Cleaning & Maintenance (421 | 6.1%), Food Preparation & Serving (395 | 5.8%), Personal Care & Service (202 | 2.9%), Healthcare Support (150 | 2.2%), and Security & Protection (88 | 1.3%).
Services Occupations by Sex
Within the Services occupations in Teton County, the most male-oriented occupations are Law Enforcement (80.6%), Security & Protection (70.5%), and Firefighting & Prevention (64.9%), while the most female-oriented occupations are Healthcare Support (100.0%), Personal Care & Service (73.8%), and Food Preparation & Serving (43.3%).
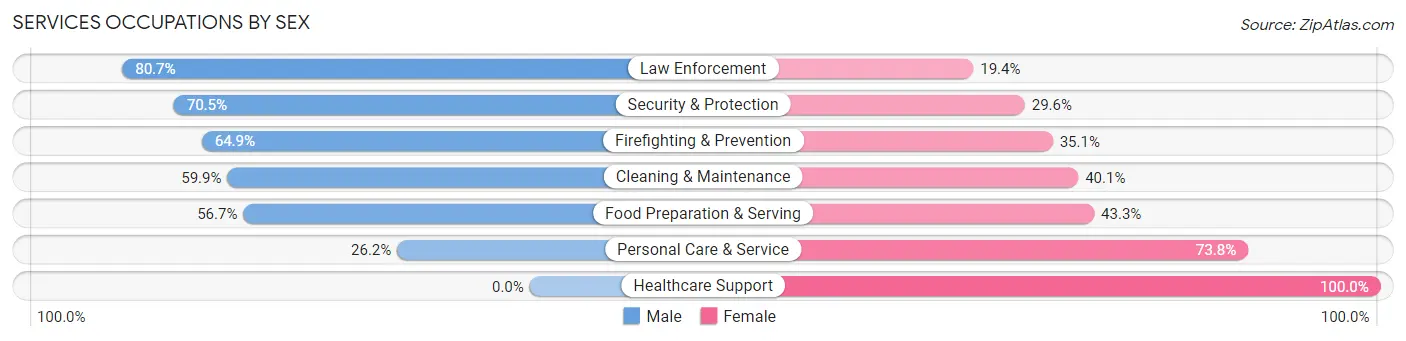
| Occupation | Male | Female |
| Healthcare Support | 0 (0.0%) | 150 (100.0%) |
| Security & Protection | 62 (70.5%) | 26 (29.5%) |
| Firefighting & Prevention | 37 (64.9%) | 20 (35.1%) |
| Law Enforcement | 25 (80.6%) | 6 (19.4%) |
| Food Preparation & Serving | 224 (56.7%) | 171 (43.3%) |
| Cleaning & Maintenance | 252 (59.9%) | 169 (40.1%) |
| Personal Care & Service | 53 (26.2%) | 149 (73.8%) |
| Total (Category) | 591 (47.0%) | 665 (52.9%) |
| Total (Overall) | 3,824 (55.6%) | 3,051 (44.4%) |
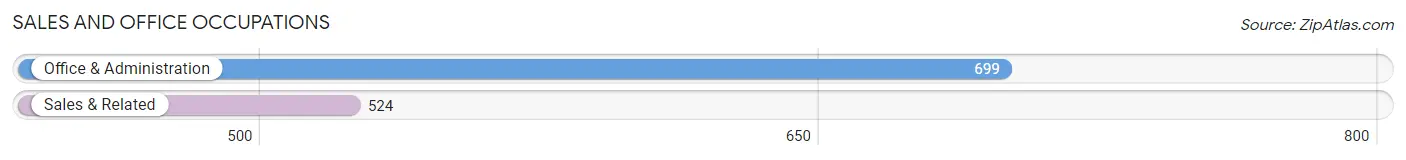
Sales and Office Occupations
The most common Sales and Office occupations in Teton County are Office & Administration (699 | 10.2%), and Sales & Related (524 | 7.6%).
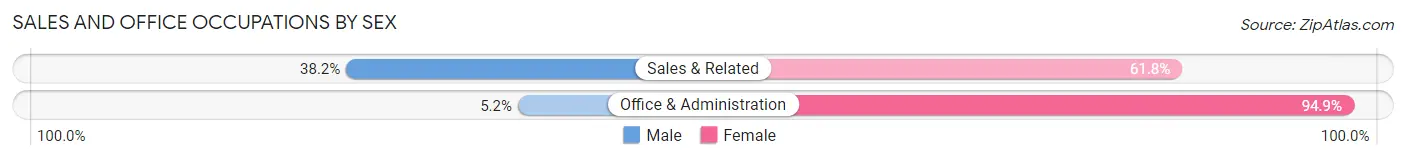
Sales and Office Occupations by Sex
| Occupation | Male | Female |
| Sales & Related | 200 (38.2%) | 324 (61.8%) |
| Office & Administration | 36 (5.1%) | 663 (94.9%) |
| Total (Category) | 236 (19.3%) | 987 (80.7%) |
| Total (Overall) | 3,824 (55.6%) | 3,051 (44.4%) |
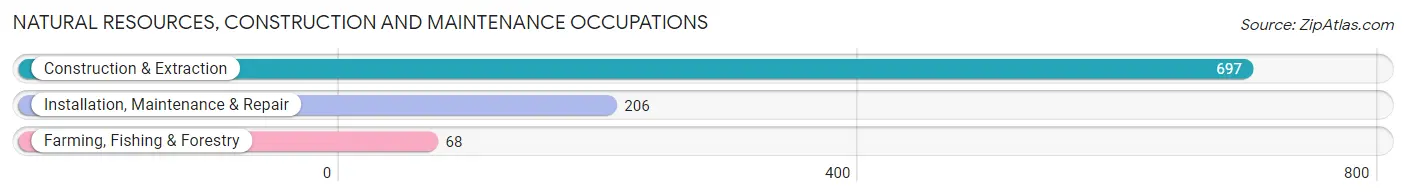
Natural Resources, Construction and Maintenance Occupations
The most common Natural Resources, Construction and Maintenance occupations in Teton County are Construction & Extraction (697 | 10.1%), Installation, Maintenance & Repair (206 | 3.0%), and Farming, Fishing & Forestry (68 | 1.0%).
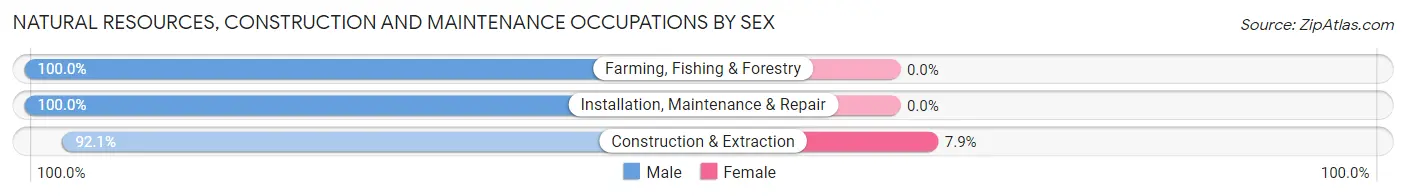
Natural Resources, Construction and Maintenance Occupations by Sex
| Occupation | Male | Female |
| Farming, Fishing & Forestry | 68 (100.0%) | 0 (0.0%) |
| Construction & Extraction | 642 (92.1%) | 55 (7.9%) |
| Installation, Maintenance & Repair | 206 (100.0%) | 0 (0.0%) |
| Total (Category) | 916 (94.3%) | 55 (5.7%) |
| Total (Overall) | 3,824 (55.6%) | 3,051 (44.4%) |
Production, Transportation and Moving Occupations
The most common Production, Transportation and Moving occupations in Teton County are Production (196 | 2.9%), Material Moving (157 | 2.3%), and Transportation (98 | 1.4%).
Production, Transportation and Moving Occupations by Sex
| Occupation | Male | Female |
| Production | 170 (86.7%) | 26 (13.3%) |
| Transportation | 92 (93.9%) | 6 (6.1%) |
| Material Moving | 84 (53.5%) | 73 (46.5%) |
| Total (Category) | 346 (76.7%) | 105 (23.3%) |
| Total (Overall) | 3,824 (55.6%) | 3,051 (44.4%) |
Employment Industries by Sex in Teton County
Employment Industries in Teton County
The major employment industries in Teton County include Construction (974 | 14.2%), Accommodation & Food Services (720 | 10.5%), Health Care & Social Assistance (719 | 10.5%), Retail Trade (618 | 9.0%), and Professional & Scientific (471 | 6.9%).
Employment Industries by Sex in Teton County
The Teton County industries that see more men than women are Utilities (100.0%), Agriculture, Fishing & Hunting (96.3%), and Construction (93.0%), whereas the industries that tend to have a higher number of women are Health Care & Social Assistance (89.1%), Educational Services (76.2%), and Information (75.0%).
| Industry | Male | Female |
| Agriculture, Fishing & Hunting | 338 (96.3%) | 13 (3.7%) |
| Mining, Quarrying, & Extraction | 0 (0.0%) | 0 (0.0%) |
| Construction | 906 (93.0%) | 68 (7.0%) |
| Manufacturing | 236 (69.2%) | 105 (30.8%) |
| Wholesale Trade | 15 (55.6%) | 12 (44.4%) |
| Retail Trade | 255 (41.3%) | 363 (58.7%) |
| Transportation & Warehousing | 118 (48.4%) | 126 (51.6%) |
| Utilities | 15 (100.0%) | 0 (0.0%) |
| Information | 24 (25.0%) | 72 (75.0%) |
| Finance & Insurance | 62 (63.3%) | 36 (36.7%) |
| Real Estate, Rental & Leasing | 250 (76.0%) | 79 (24.0%) |
| Professional & Scientific | 280 (59.5%) | 191 (40.6%) |
| Enterprise Management | 0 (0.0%) | 0 (0.0%) |
| Administrative & Support | 127 (41.4%) | 180 (58.6%) |
| Educational Services | 81 (23.7%) | 260 (76.2%) |
| Health Care & Social Assistance | 78 (10.8%) | 641 (89.1%) |
| Arts, Entertainment & Recreation | 216 (69.5%) | 95 (30.5%) |
| Accommodation & Food Services | 309 (42.9%) | 411 (57.1%) |
| Public Administration | 158 (41.0%) | 227 (59.0%) |
| Total | 3,824 (55.6%) | 3,051 (44.4%) |
Education in Teton County
School Enrollment in Teton County
The most common levels of schooling among the 2,366 students in Teton County are high school (601 | 25.4%), elementary school (596 | 25.2%), and middle school (331 | 14.0%).
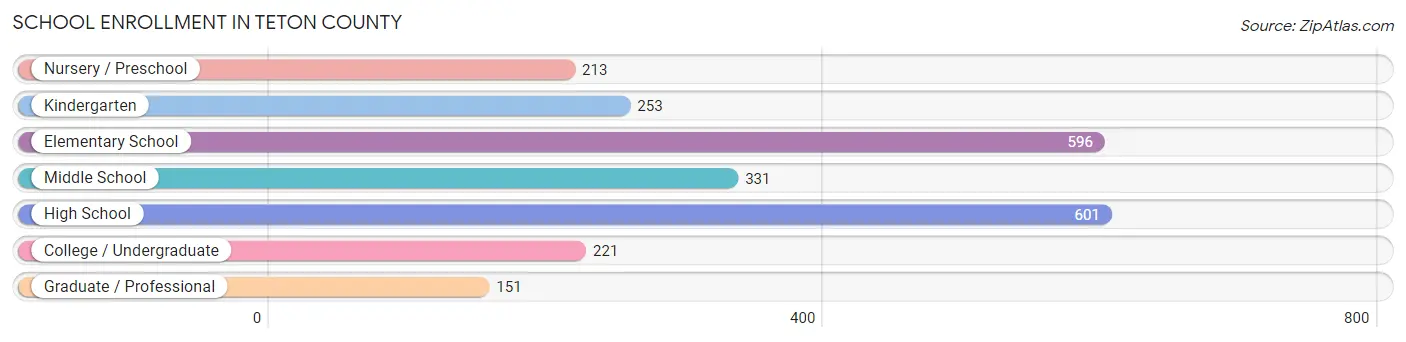
| School Level | # Students | % Students |
| Nursery / Preschool | 213 | 9.0% |
| Kindergarten | 253 | 10.7% |
| Elementary School | 596 | 25.2% |
| Middle School | 331 | 14.0% |
| High School | 601 | 25.4% |
| College / Undergraduate | 221 | 9.3% |
| Graduate / Professional | 151 | 6.4% |
| Total | 2,366 | 100.0% |
School Enrollment by Age by Funding Source in Teton County
Out of a total of 2,366 students who are enrolled in schools in Teton County, 584 (24.7%) attend a private institution, while the remaining 1,782 (75.3%) are enrolled in public schools. The age group of 3 to 4 year olds has the highest likelihood of being enrolled in private schools, with 70 (80.5% in the age bracket) enrolled. Conversely, the age group of 15 to 17 year olds has the lowest likelihood of being enrolled in a private school, with 481 (97.0% in the age bracket) attending a public institution.
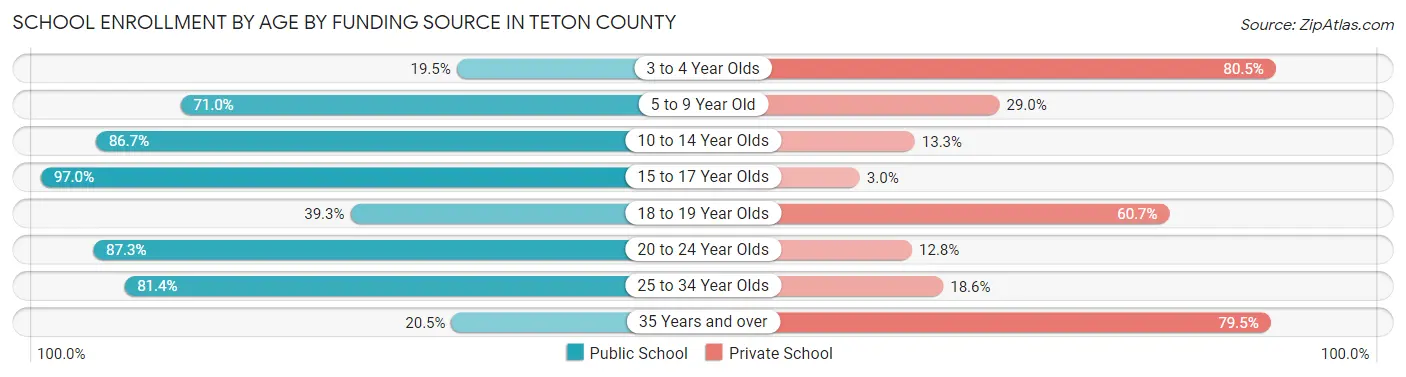
| Age Bracket | Public School | Private School |
| 3 to 4 Year Olds | 17 (19.5%) | 70 (80.5%) |
| 5 to 9 Year Old | 682 (71.0%) | 279 (29.0%) |
| 10 to 14 Year Olds | 386 (86.7%) | 59 (13.3%) |
| 15 to 17 Year Olds | 481 (97.0%) | 15 (3.0%) |
| 18 to 19 Year Olds | 24 (39.3%) | 37 (60.7%) |
| 20 to 24 Year Olds | 89 (87.3%) | 13 (12.8%) |
| 25 to 34 Year Olds | 79 (81.4%) | 18 (18.6%) |
| 35 Years and over | 24 (20.5%) | 93 (79.5%) |
| Total | 1,782 (75.3%) | 584 (24.7%) |
Educational Attainment by Field of Study in Teton County
Business (695 | 16.6%), bio, nature & agricultural (513 | 12.3%), social sciences (368 | 8.8%), education (346 | 8.3%), and arts & humanities (345 | 8.3%) are the most common fields of study among 4,178 individuals in Teton County who have obtained a bachelor's degree or higher.
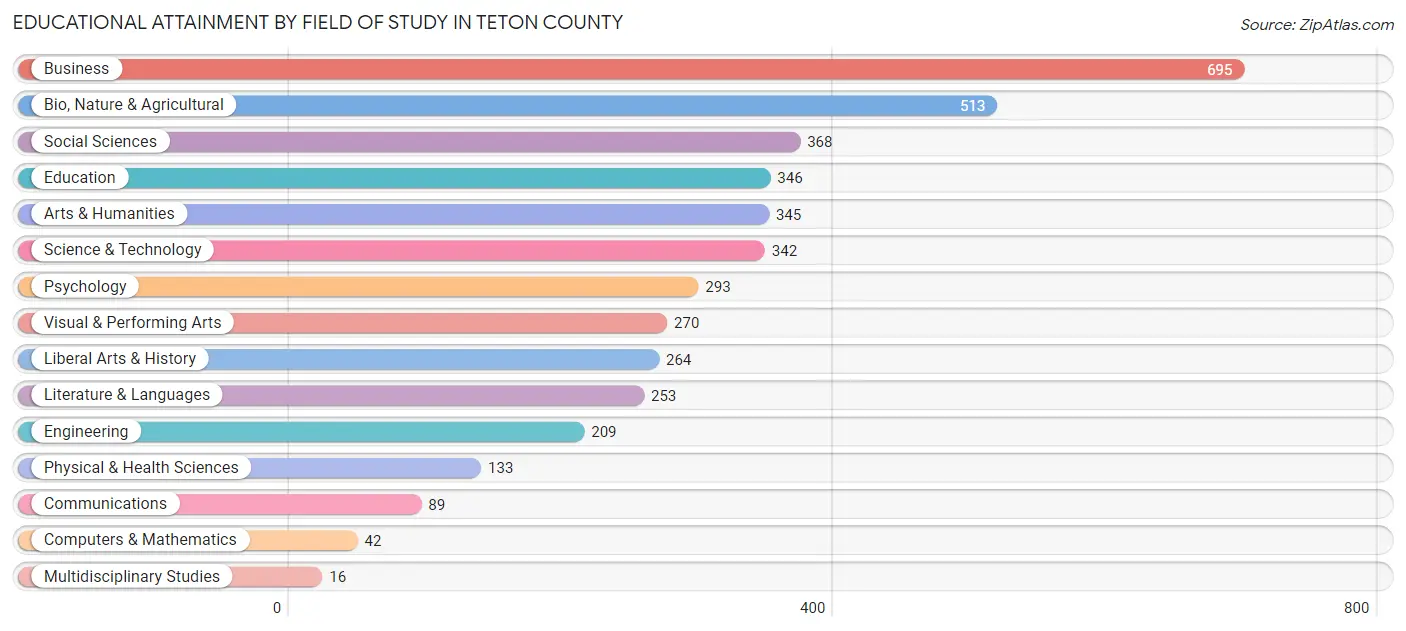
| Field of Study | # Graduates | % Graduates |
| Computers & Mathematics | 42 | 1.0% |
| Bio, Nature & Agricultural | 513 | 12.3% |
| Physical & Health Sciences | 133 | 3.2% |
| Psychology | 293 | 7.0% |
| Social Sciences | 368 | 8.8% |
| Engineering | 209 | 5.0% |
| Multidisciplinary Studies | 16 | 0.4% |
| Science & Technology | 342 | 8.2% |
| Business | 695 | 16.6% |
| Education | 346 | 8.3% |
| Literature & Languages | 253 | 6.1% |
| Liberal Arts & History | 264 | 6.3% |
| Visual & Performing Arts | 270 | 6.5% |
| Communications | 89 | 2.1% |
| Arts & Humanities | 345 | 8.3% |
| Total | 4,178 | 100.0% |
Transportation & Commute in Teton County
Vehicle Availability by Sex in Teton County
The most prevalent vehicle ownership categories in Teton County are males with 2 vehicles (1,457, accounting for 39.2%) and females with 2 vehicles (1,195, making up 49.2%).
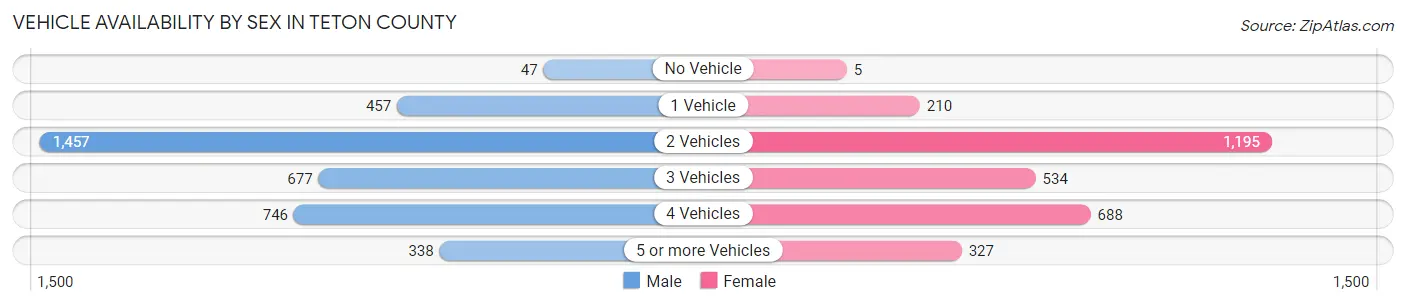
| Vehicles Available | Male | Female |
| No Vehicle | 47 (1.3%) | 5 (0.2%) |
| 1 Vehicle | 457 (12.3%) | 210 (7.1%) |
| 2 Vehicles | 1,457 (39.2%) | 1,195 (40.4%) |
| 3 Vehicles | 677 (18.2%) | 534 (18.0%) |
| 4 Vehicles | 746 (20.0%) | 688 (23.3%) |
| 5 or more Vehicles | 338 (9.1%) | 327 (11.1%) |
| Total | 3,722 (100.0%) | 2,959 (100.0%) |
Commute Time in Teton County
The most frequently occuring commute durations in Teton County are 5 to 9 minutes (963 commuters, 16.8%), 45 to 59 minutes (962 commuters, 16.8%), and 60 to 89 minutes (669 commuters, 11.7%).
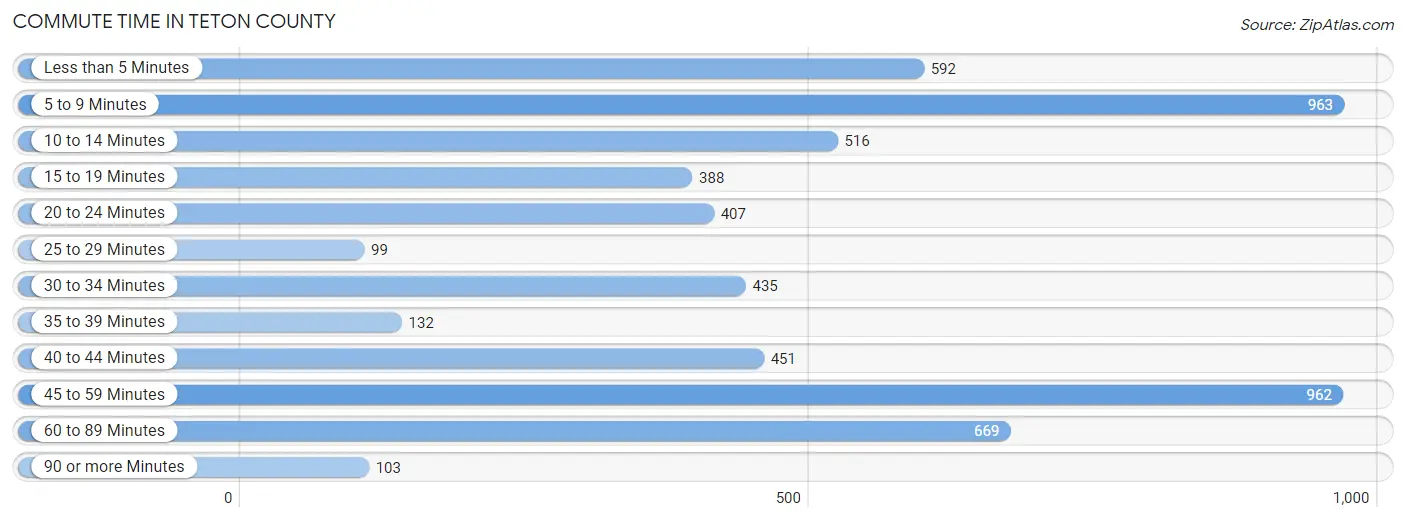
| Commute Time | # Commuters | % Commuters |
| Less than 5 Minutes | 592 | 10.4% |
| 5 to 9 Minutes | 963 | 16.8% |
| 10 to 14 Minutes | 516 | 9.0% |
| 15 to 19 Minutes | 388 | 6.8% |
| 20 to 24 Minutes | 407 | 7.1% |
| 25 to 29 Minutes | 99 | 1.7% |
| 30 to 34 Minutes | 435 | 7.6% |
| 35 to 39 Minutes | 132 | 2.3% |
| 40 to 44 Minutes | 451 | 7.9% |
| 45 to 59 Minutes | 962 | 16.8% |
| 60 to 89 Minutes | 669 | 11.7% |
| 90 or more Minutes | 103 | 1.8% |
Commute Time by Sex in Teton County
The most common commute times in Teton County are 45 to 59 minutes (658 commuters, 19.9%) for males and 5 to 9 minutes (645 commuters, 26.8%) for females.
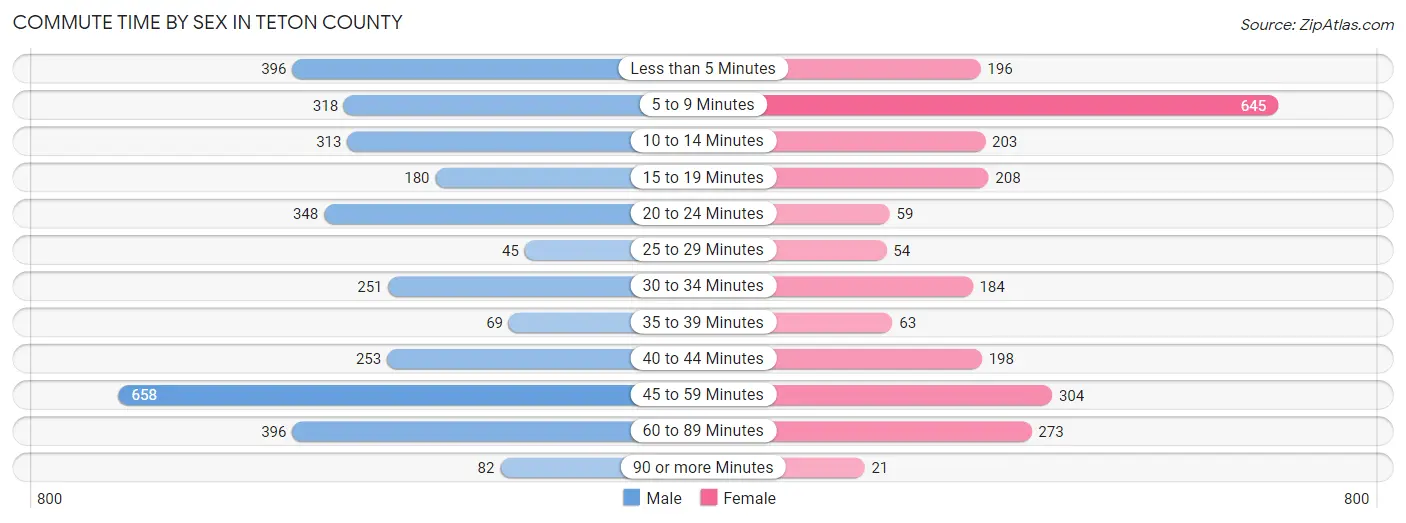
| Commute Time | Male | Female |
| Less than 5 Minutes | 396 (12.0%) | 196 (8.1%) |
| 5 to 9 Minutes | 318 (9.6%) | 645 (26.8%) |
| 10 to 14 Minutes | 313 (9.5%) | 203 (8.4%) |
| 15 to 19 Minutes | 180 (5.4%) | 208 (8.6%) |
| 20 to 24 Minutes | 348 (10.5%) | 59 (2.5%) |
| 25 to 29 Minutes | 45 (1.4%) | 54 (2.2%) |
| 30 to 34 Minutes | 251 (7.6%) | 184 (7.6%) |
| 35 to 39 Minutes | 69 (2.1%) | 63 (2.6%) |
| 40 to 44 Minutes | 253 (7.6%) | 198 (8.2%) |
| 45 to 59 Minutes | 658 (19.9%) | 304 (12.6%) |
| 60 to 89 Minutes | 396 (12.0%) | 273 (11.3%) |
| 90 or more Minutes | 82 (2.5%) | 21 (0.9%) |
Time of Departure to Work by Sex in Teton County
The most frequent times of departure to work in Teton County are 7:00 AM to 7:29 AM (715, 21.6%) for males and 7:00 AM to 7:29 AM (364, 15.1%) for females.
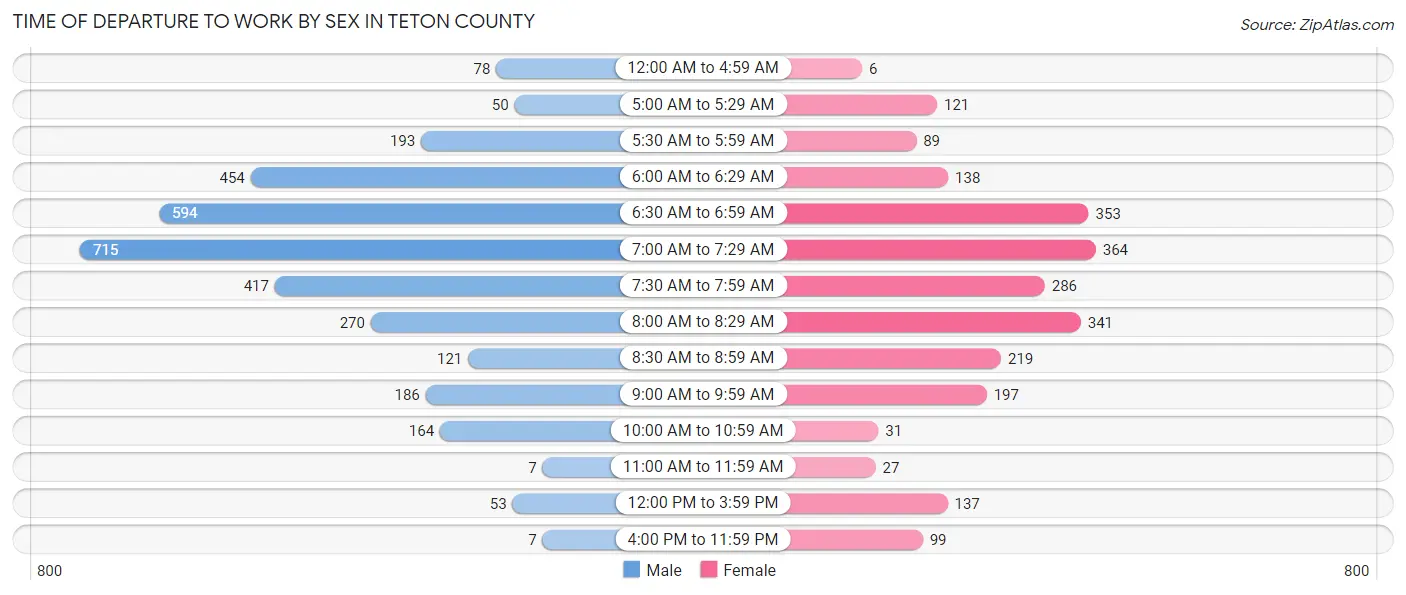
| Time of Departure | Male | Female |
| 12:00 AM to 4:59 AM | 78 (2.4%) | 6 (0.3%) |
| 5:00 AM to 5:29 AM | 50 (1.5%) | 121 (5.0%) |
| 5:30 AM to 5:59 AM | 193 (5.8%) | 89 (3.7%) |
| 6:00 AM to 6:29 AM | 454 (13.7%) | 138 (5.7%) |
| 6:30 AM to 6:59 AM | 594 (17.9%) | 353 (14.7%) |
| 7:00 AM to 7:29 AM | 715 (21.6%) | 364 (15.1%) |
| 7:30 AM to 7:59 AM | 417 (12.6%) | 286 (11.9%) |
| 8:00 AM to 8:29 AM | 270 (8.2%) | 341 (14.2%) |
| 8:30 AM to 8:59 AM | 121 (3.7%) | 219 (9.1%) |
| 9:00 AM to 9:59 AM | 186 (5.6%) | 197 (8.2%) |
| 10:00 AM to 10:59 AM | 164 (5.0%) | 31 (1.3%) |
| 11:00 AM to 11:59 AM | 7 (0.2%) | 27 (1.1%) |
| 12:00 PM to 3:59 PM | 53 (1.6%) | 137 (5.7%) |
| 4:00 PM to 11:59 PM | 7 (0.2%) | 99 (4.1%) |
| Total | 3,309 (100.0%) | 2,408 (100.0%) |
Housing Occupancy in Teton County
Occupancy by Ownership in Teton County
Of the total 4,317 dwellings in Teton County, owner-occupied units account for 3,384 (78.4%), while renter-occupied units make up 933 (21.6%).
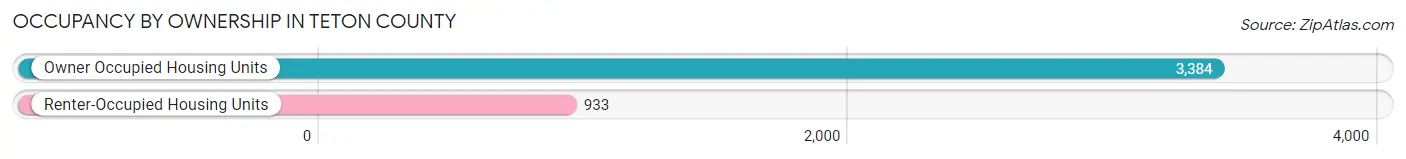
| Occupancy | # Housing Units | % Housing Units |
| Owner Occupied Housing Units | 3,384 | 78.4% |
| Renter-Occupied Housing Units | 933 | 21.6% |
| Total Occupied Housing Units | 4,317 | 100.0% |
Occupancy by Household Size in Teton County
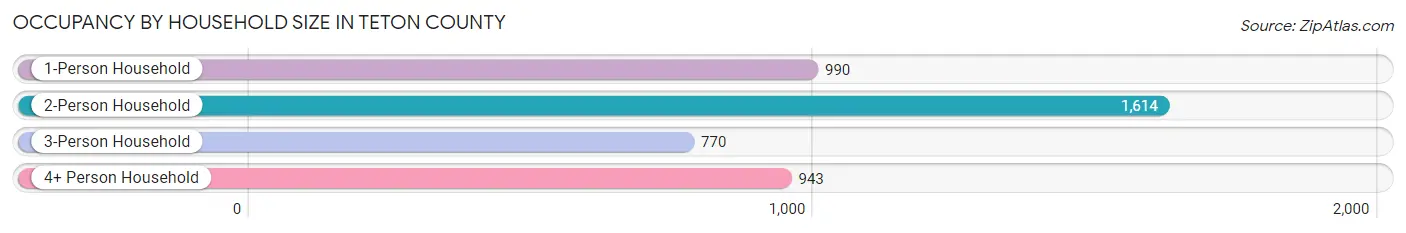
| Household Size | # Housing Units | % Housing Units |
| 1-Person Household | 990 | 22.9% |
| 2-Person Household | 1,614 | 37.4% |
| 3-Person Household | 770 | 17.8% |
| 4+ Person Household | 943 | 21.8% |
| Total Housing Units | 4,317 | 100.0% |
Occupancy by Ownership by Household Size in Teton County
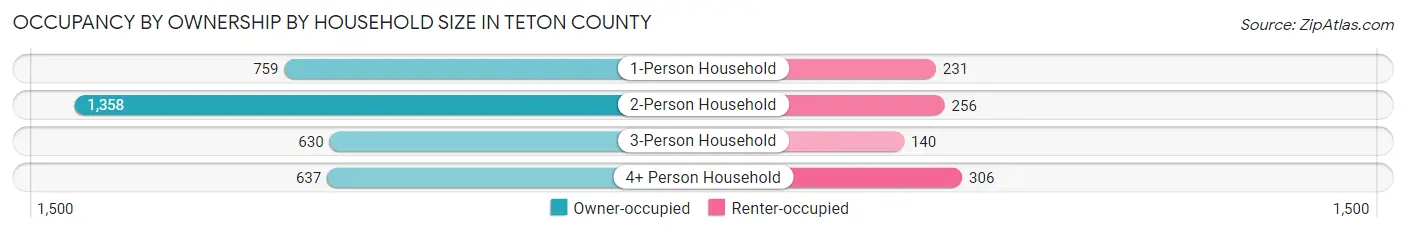
| Household Size | Owner-occupied | Renter-occupied |
| 1-Person Household | 759 (76.7%) | 231 (23.3%) |
| 2-Person Household | 1,358 (84.1%) | 256 (15.9%) |
| 3-Person Household | 630 (81.8%) | 140 (18.2%) |
| 4+ Person Household | 637 (67.5%) | 306 (32.5%) |
| Total Housing Units | 3,384 (78.4%) | 933 (21.6%) |
Occupancy by Educational Attainment in Teton County
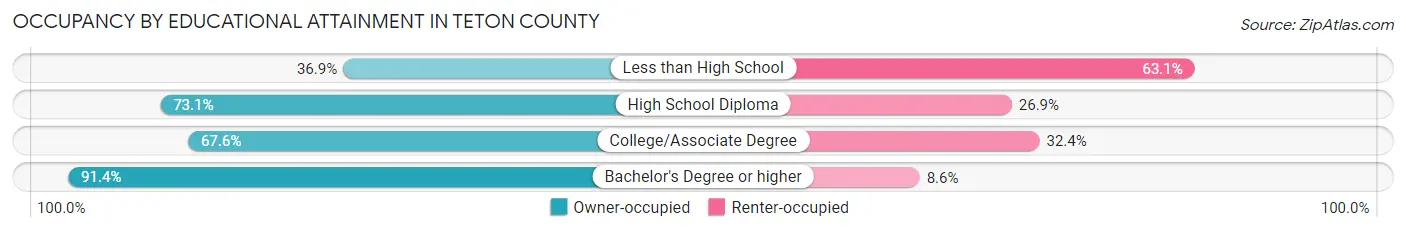
| Household Size | Owner-occupied | Renter-occupied |
| Less than High School | 97 (36.9%) | 166 (63.1%) |
| High School Diploma | 576 (73.1%) | 212 (26.9%) |
| College/Associate Degree | 776 (67.6%) | 372 (32.4%) |
| Bachelor's Degree or higher | 1,935 (91.4%) | 183 (8.6%) |
Occupancy by Age of Householder in Teton County
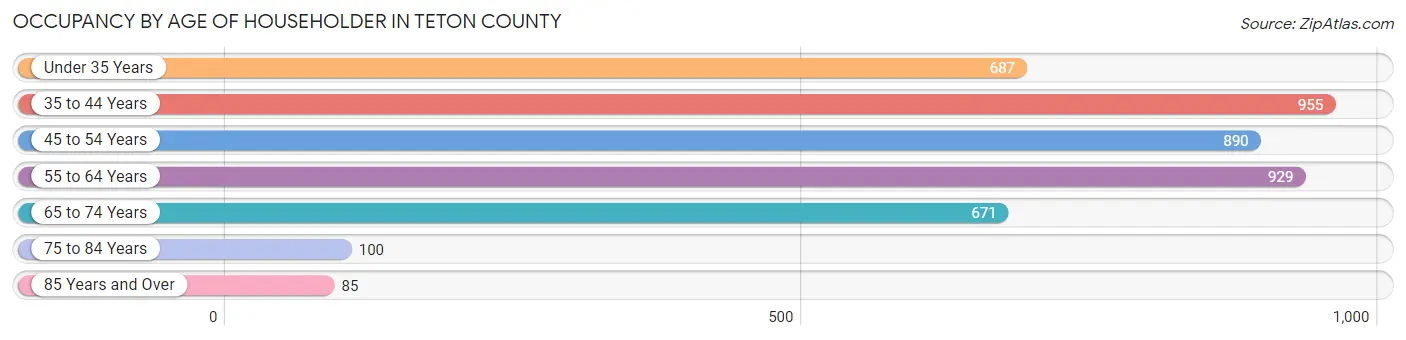
| Age Bracket | # Households | % Households |
| Under 35 Years | 687 | 15.9% |
| 35 to 44 Years | 955 | 22.1% |
| 45 to 54 Years | 890 | 20.6% |
| 55 to 64 Years | 929 | 21.5% |
| 65 to 74 Years | 671 | 15.5% |
| 75 to 84 Years | 100 | 2.3% |
| 85 Years and Over | 85 | 2.0% |
| Total | 4,317 | 100.0% |
Housing Finances in Teton County
Median Income by Occupancy in Teton County
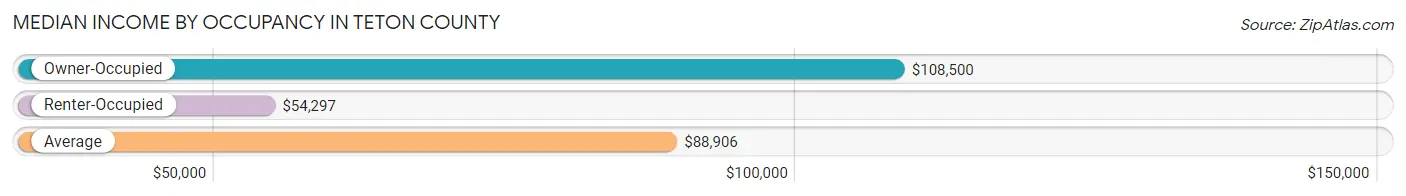
| Occupancy Type | # Households | Median Income |
| Owner-Occupied | 3,384 (78.4%) | $108,500 |
| Renter-Occupied | 933 (21.6%) | $54,297 |
| Average | 4,317 (100.0%) | $88,906 |
Occupancy by Householder Income Bracket in Teton County
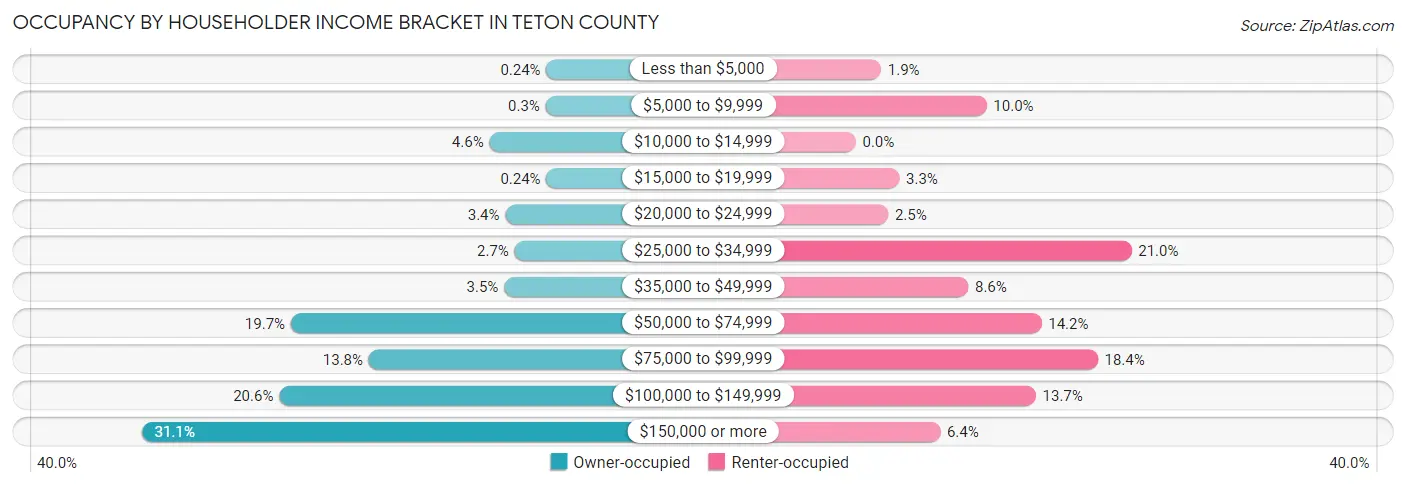
| Income Bracket | Owner-occupied | Renter-occupied |
| Less than $5,000 | 8 (0.2%) | 18 (1.9%) |
| $5,000 to $9,999 | 10 (0.3%) | 93 (10.0%) |
| $10,000 to $14,999 | 155 (4.6%) | 0 (0.0%) |
| $15,000 to $19,999 | 8 (0.2%) | 31 (3.3%) |
| $20,000 to $24,999 | 114 (3.4%) | 23 (2.5%) |
| $25,000 to $34,999 | 90 (2.7%) | 196 (21.0%) |
| $35,000 to $49,999 | 117 (3.5%) | 80 (8.6%) |
| $50,000 to $74,999 | 667 (19.7%) | 132 (14.1%) |
| $75,000 to $99,999 | 466 (13.8%) | 172 (18.4%) |
| $100,000 to $149,999 | 697 (20.6%) | 128 (13.7%) |
| $150,000 or more | 1,052 (31.1%) | 60 (6.4%) |
| Total | 3,384 (100.0%) | 933 (100.0%) |
Monthly Housing Cost Tiers in Teton County
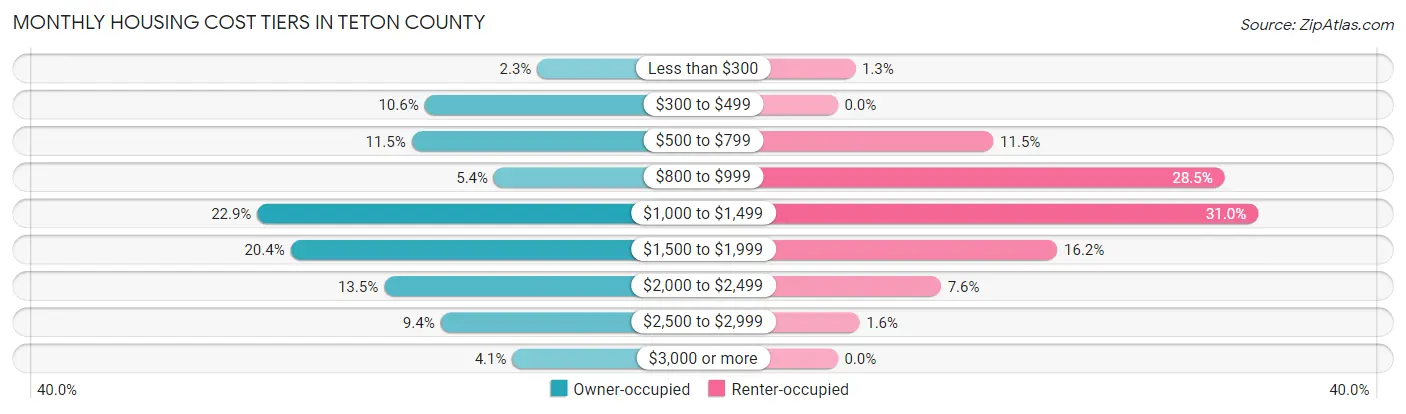
| Monthly Cost | Owner-occupied | Renter-occupied |
| Less than $300 | 76 (2.2%) | 12 (1.3%) |
| $300 to $499 | 357 (10.5%) | 0 (0.0%) |
| $500 to $799 | 389 (11.5%) | 107 (11.5%) |
| $800 to $999 | 184 (5.4%) | 266 (28.5%) |
| $1,000 to $1,499 | 774 (22.9%) | 289 (31.0%) |
| $1,500 to $1,999 | 691 (20.4%) | 151 (16.2%) |
| $2,000 to $2,499 | 458 (13.5%) | 71 (7.6%) |
| $2,500 to $2,999 | 317 (9.4%) | 15 (1.6%) |
| $3,000 or more | 138 (4.1%) | 0 (0.0%) |
| Total | 3,384 (100.0%) | 933 (100.0%) |
Physical Housing Characteristics in Teton County
Housing Structures in Teton County
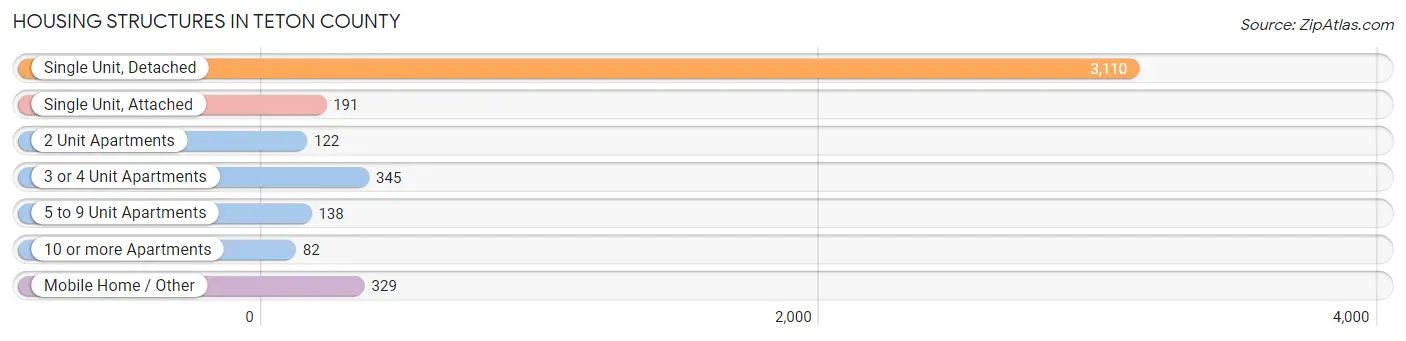
| Structure Type | # Housing Units | % Housing Units |
| Single Unit, Detached | 3,110 | 72.0% |
| Single Unit, Attached | 191 | 4.4% |
| 2 Unit Apartments | 122 | 2.8% |
| 3 or 4 Unit Apartments | 345 | 8.0% |
| 5 to 9 Unit Apartments | 138 | 3.2% |
| 10 or more Apartments | 82 | 1.9% |
| Mobile Home / Other | 329 | 7.6% |
| Total | 4,317 | 100.0% |
Housing Structures by Occupancy in Teton County
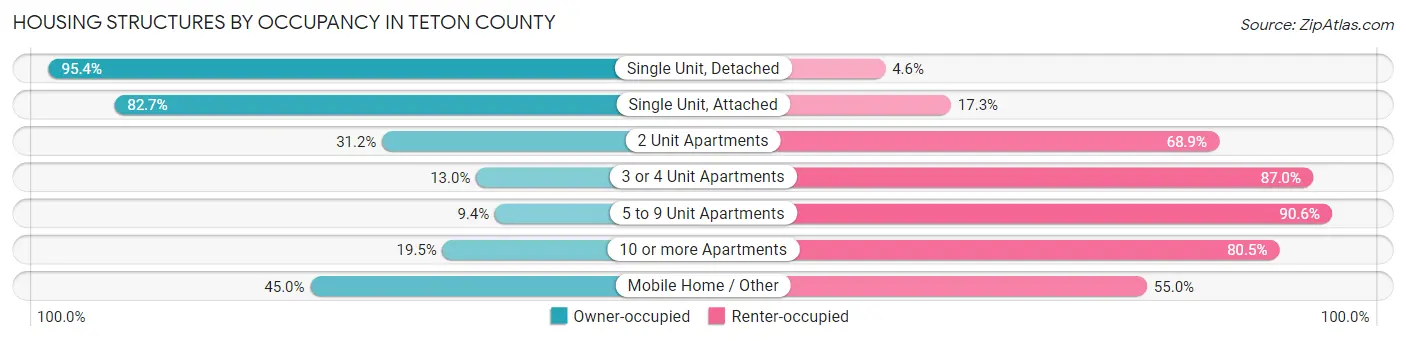
| Structure Type | Owner-occupied | Renter-occupied |
| Single Unit, Detached | 2,966 (95.4%) | 144 (4.6%) |
| Single Unit, Attached | 158 (82.7%) | 33 (17.3%) |
| 2 Unit Apartments | 38 (31.1%) | 84 (68.9%) |
| 3 or 4 Unit Apartments | 45 (13.0%) | 300 (87.0%) |
| 5 to 9 Unit Apartments | 13 (9.4%) | 125 (90.6%) |
| 10 or more Apartments | 16 (19.5%) | 66 (80.5%) |
| Mobile Home / Other | 148 (45.0%) | 181 (55.0%) |
| Total | 3,384 (78.4%) | 933 (21.6%) |
Housing Structures by Number of Rooms in Teton County
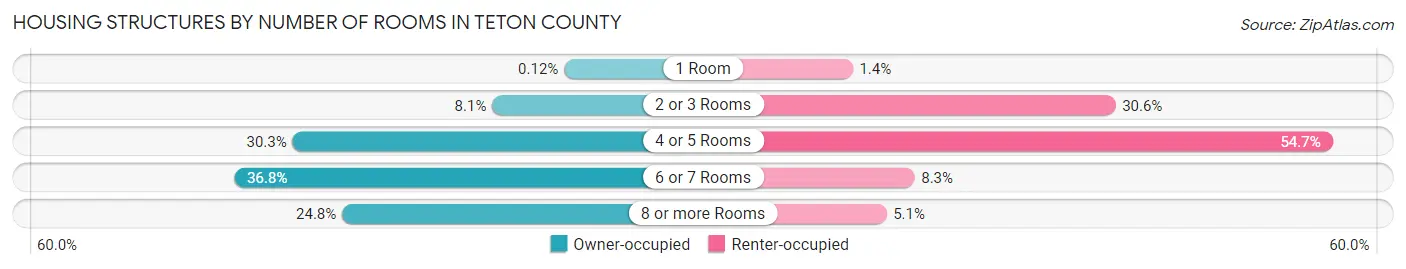
| Number of Rooms | Owner-occupied | Renter-occupied |
| 1 Room | 4 (0.1%) | 13 (1.4%) |
| 2 or 3 Rooms | 274 (8.1%) | 285 (30.5%) |
| 4 or 5 Rooms | 1,024 (30.3%) | 510 (54.7%) |
| 6 or 7 Rooms | 1,244 (36.8%) | 77 (8.3%) |
| 8 or more Rooms | 838 (24.8%) | 48 (5.1%) |
| Total | 3,384 (100.0%) | 933 (100.0%) |
Housing Structure by Heating Type in Teton County
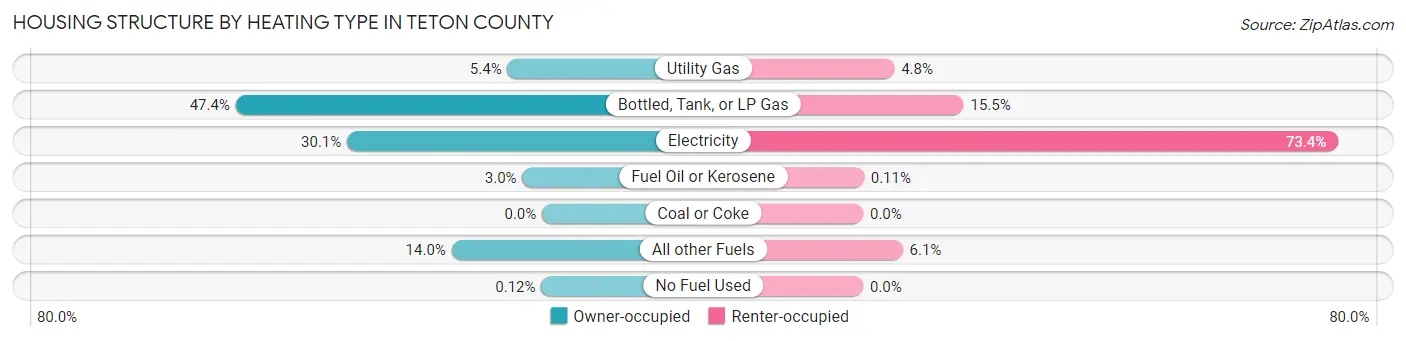
| Heating Type | Owner-occupied | Renter-occupied |
| Utility Gas | 181 (5.3%) | 45 (4.8%) |
| Bottled, Tank, or LP Gas | 1,603 (47.4%) | 145 (15.5%) |
| Electricity | 1,020 (30.1%) | 685 (73.4%) |
| Fuel Oil or Kerosene | 103 (3.0%) | 1 (0.1%) |
| Coal or Coke | 0 (0.0%) | 0 (0.0%) |
| All other Fuels | 473 (14.0%) | 57 (6.1%) |
| No Fuel Used | 4 (0.1%) | 0 (0.0%) |
| Total | 3,384 (100.0%) | 933 (100.0%) |
Household Vehicle Usage in Teton County
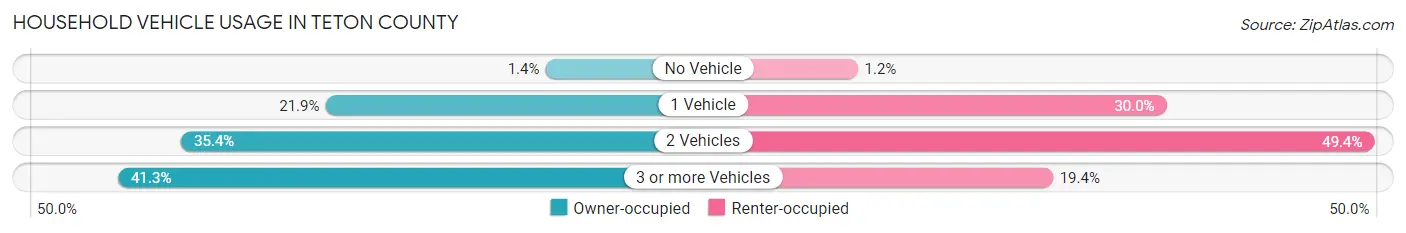
| Vehicles per Household | Owner-occupied | Renter-occupied |
| No Vehicle | 47 (1.4%) | 11 (1.2%) |
| 1 Vehicle | 742 (21.9%) | 280 (30.0%) |
| 2 Vehicles | 1,198 (35.4%) | 461 (49.4%) |
| 3 or more Vehicles | 1,397 (41.3%) | 181 (19.4%) |
| Total | 3,384 (100.0%) | 933 (100.0%) |
Real Estate & Mortgages in Teton County
Real Estate and Mortgage Overview in Teton County
| Characteristic | Without Mortgage | With Mortgage |
| Housing Units | 1,220 | 2,164 |
| Median Property Value | $493,500 | $473,800 |
| Median Household Income | $84,853 | $605 |
| Monthly Housing Costs | $639 | $138 |
| Real Estate Taxes | $1,962 | $45 |
Property Value by Mortgage Status in Teton County
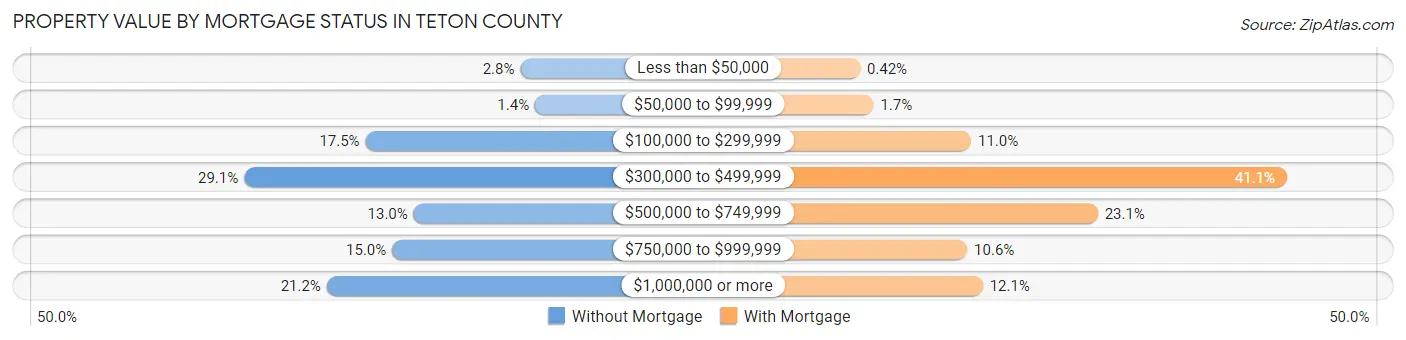
| Property Value | Without Mortgage | With Mortgage |
| Less than $50,000 | 34 (2.8%) | 9 (0.4%) |
| $50,000 to $99,999 | 17 (1.4%) | 37 (1.7%) |
| $100,000 to $299,999 | 214 (17.5%) | 238 (11.0%) |
| $300,000 to $499,999 | 355 (29.1%) | 889 (41.1%) |
| $500,000 to $749,999 | 158 (13.0%) | 499 (23.1%) |
| $750,000 to $999,999 | 183 (15.0%) | 230 (10.6%) |
| $1,000,000 or more | 259 (21.2%) | 262 (12.1%) |
| Total | 1,220 (100.0%) | 2,164 (100.0%) |
Household Income by Mortgage Status in Teton County
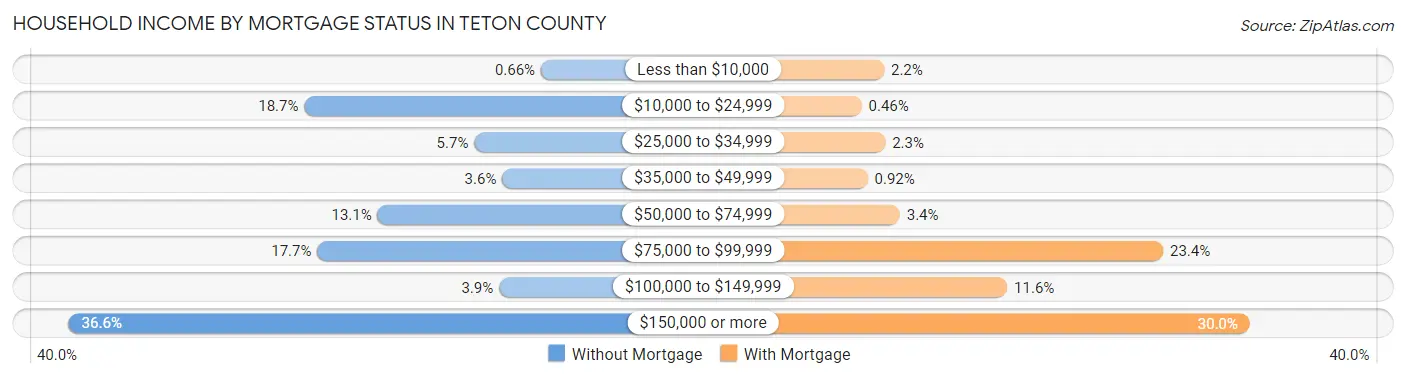
| Household Income | Without Mortgage | With Mortgage |
| Less than $10,000 | 8 (0.7%) | 47 (2.2%) |
| $10,000 to $24,999 | 228 (18.7%) | 10 (0.5%) |
| $25,000 to $34,999 | 70 (5.7%) | 49 (2.3%) |
| $35,000 to $49,999 | 44 (3.6%) | 20 (0.9%) |
| $50,000 to $74,999 | 160 (13.1%) | 73 (3.4%) |
| $75,000 to $99,999 | 216 (17.7%) | 507 (23.4%) |
| $100,000 to $149,999 | 47 (3.8%) | 250 (11.6%) |
| $150,000 or more | 447 (36.6%) | 650 (30.0%) |
| Total | 1,220 (100.0%) | 2,164 (100.0%) |
Property Value to Household Income Ratio in Teton County
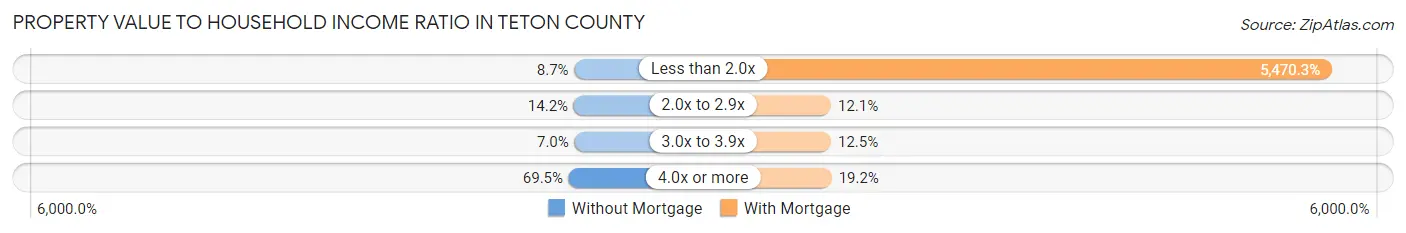
| Value-to-Income Ratio | Without Mortgage | With Mortgage |
| Less than 2.0x | 106 (8.7%) | 118,377 (5,470.3%) |
| 2.0x to 2.9x | 173 (14.2%) | 262 (12.1%) |
| 3.0x to 3.9x | 85 (7.0%) | 270 (12.5%) |
| 4.0x or more | 848 (69.5%) | 415 (19.2%) |
| Total | 1,220 (100.0%) | 2,164 (100.0%) |
Real Estate Taxes by Mortgage Status in Teton County
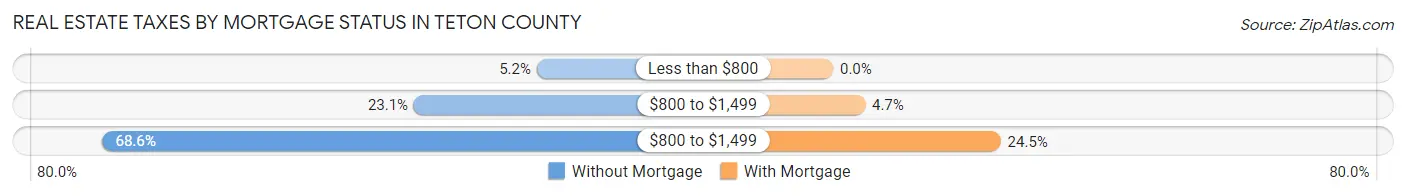
| Property Taxes | Without Mortgage | With Mortgage |
| Less than $800 | 63 (5.2%) | 0 (0.0%) |
| $800 to $1,499 | 282 (23.1%) | 101 (4.7%) |
| $800 to $1,499 | 837 (68.6%) | 530 (24.5%) |
| Total | 1,220 (100.0%) | 2,164 (100.0%) |
Health & Disability in Teton County
Health Insurance Coverage by Age in Teton County
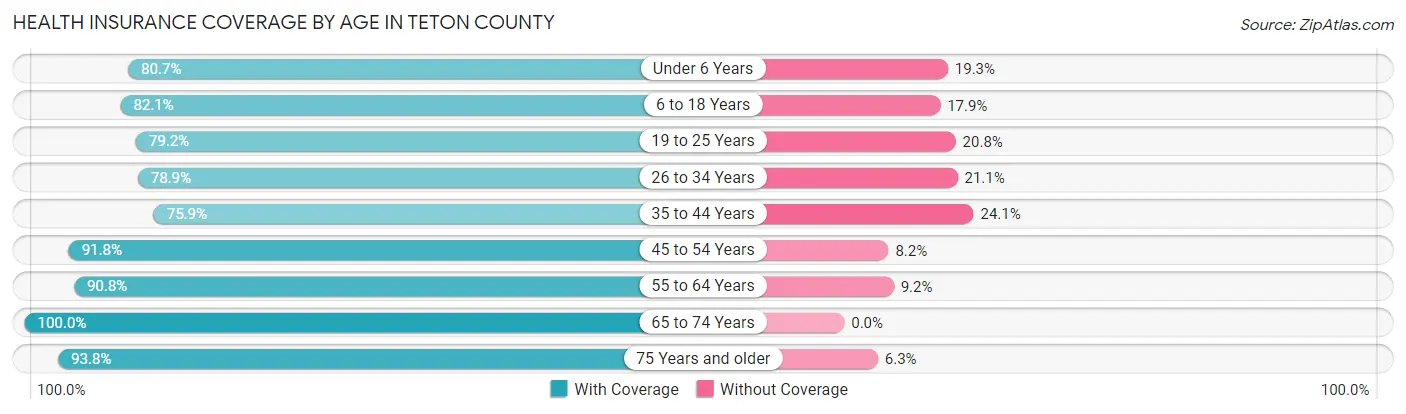
| Age Bracket | With Coverage | Without Coverage |
| Under 6 Years | 869 (80.7%) | 208 (19.3%) |
| 6 to 18 Years | 1,502 (82.1%) | 327 (17.9%) |
| 19 to 25 Years | 698 (79.2%) | 183 (20.8%) |
| 26 to 34 Years | 1,053 (78.9%) | 282 (21.1%) |
| 35 to 44 Years | 1,553 (75.9%) | 493 (24.1%) |
| 45 to 54 Years | 1,504 (91.8%) | 135 (8.2%) |
| 55 to 64 Years | 1,351 (90.8%) | 137 (9.2%) |
| 65 to 74 Years | 1,098 (100.0%) | 0 (0.0%) |
| 75 Years and older | 390 (93.8%) | 26 (6.2%) |
| Total | 10,018 (84.8%) | 1,791 (15.2%) |
Health Insurance Coverage by Citizenship Status in Teton County
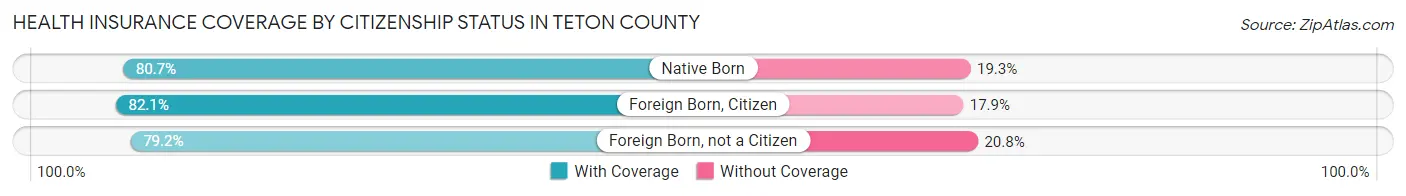
| Citizenship Status | With Coverage | Without Coverage |
| Native Born | 869 (80.7%) | 208 (19.3%) |
| Foreign Born, Citizen | 1,502 (82.1%) | 327 (17.9%) |
| Foreign Born, not a Citizen | 698 (79.2%) | 183 (20.8%) |
Health Insurance Coverage by Household Income in Teton County
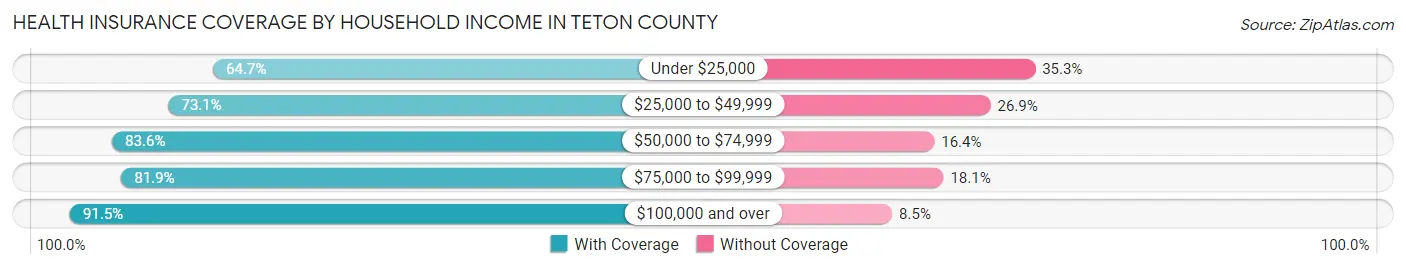
| Household Income | With Coverage | Without Coverage |
| Under $25,000 | 592 (64.7%) | 323 (35.3%) |
| $25,000 to $49,999 | 711 (73.1%) | 262 (26.9%) |
| $50,000 to $74,999 | 1,999 (83.6%) | 392 (16.4%) |
| $75,000 to $99,999 | 1,482 (81.9%) | 328 (18.1%) |
| $100,000 and over | 5,234 (91.5%) | 486 (8.5%) |
Public vs Private Health Insurance Coverage by Age in Teton County
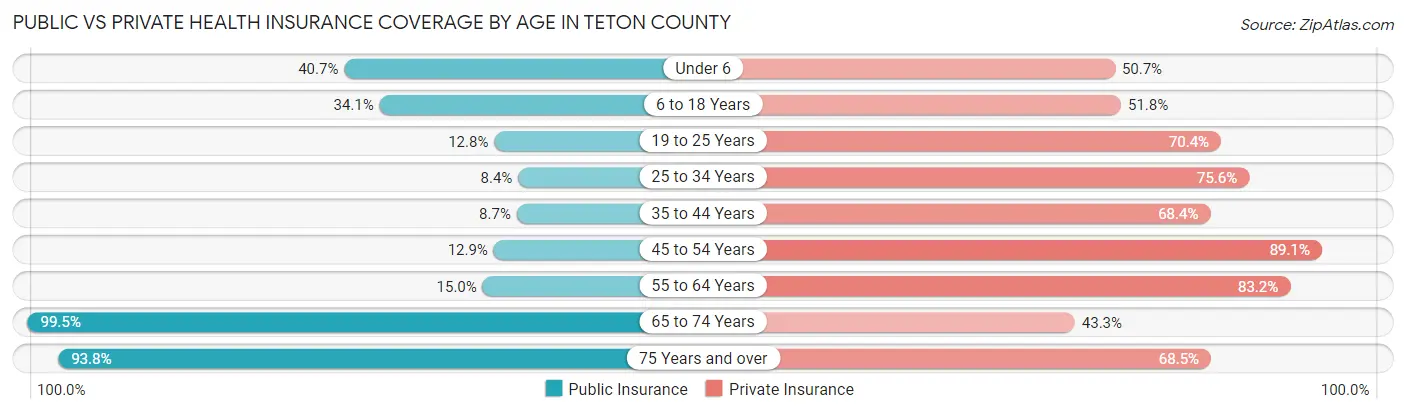
| Age Bracket | Public Insurance | Private Insurance |
| Under 6 | 438 (40.7%) | 546 (50.7%) |
| 6 to 18 Years | 624 (34.1%) | 948 (51.8%) |
| 19 to 25 Years | 113 (12.8%) | 620 (70.4%) |
| 25 to 34 Years | 112 (8.4%) | 1,009 (75.6%) |
| 35 to 44 Years | 177 (8.6%) | 1,399 (68.4%) |
| 45 to 54 Years | 212 (12.9%) | 1,460 (89.1%) |
| 55 to 64 Years | 223 (15.0%) | 1,238 (83.2%) |
| 65 to 74 Years | 1,092 (99.5%) | 475 (43.3%) |
| 75 Years and over | 390 (93.8%) | 285 (68.5%) |
| Total | 3,381 (28.6%) | 7,980 (67.6%) |
Disability Status by Sex by Age in Teton County
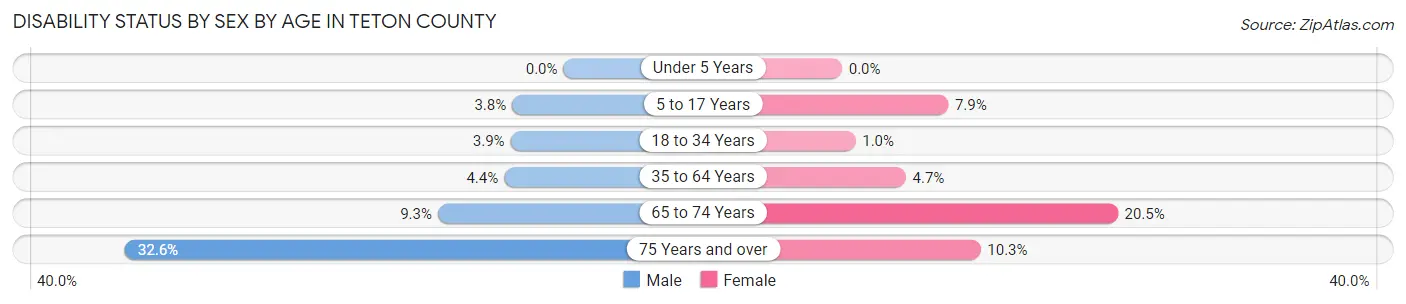
| Age Bracket | Male | Female |
| Under 5 Years | 0 (0.0%) | 0 (0.0%) |
| 5 to 17 Years | 37 (3.8%) | 82 (7.9%) |
| 18 to 34 Years | 48 (3.9%) | 11 (1.0%) |
| 35 to 64 Years | 118 (4.4%) | 118 (4.7%) |
| 65 to 74 Years | 55 (9.3%) | 104 (20.5%) |
| 75 Years and over | 69 (32.6%) | 21 (10.3%) |
Disability Class by Sex by Age in Teton County
Disability Class: Hearing Difficulty
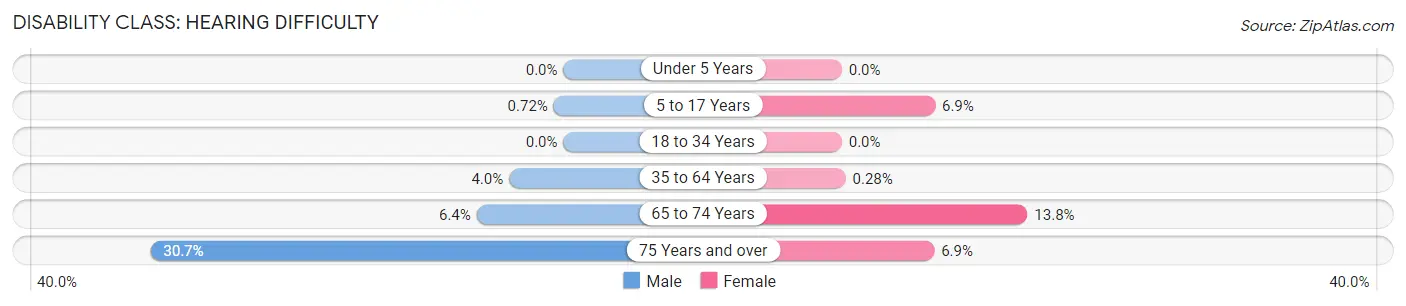
| Age Bracket | Male | Female |
| Under 5 Years | 0 (0.0%) | 0 (0.0%) |
| 5 to 17 Years | 7 (0.7%) | 72 (6.9%) |
| 18 to 34 Years | 0 (0.0%) | 0 (0.0%) |
| 35 to 64 Years | 108 (4.0%) | 7 (0.3%) |
| 65 to 74 Years | 38 (6.4%) | 70 (13.8%) |
| 75 Years and over | 65 (30.7%) | 14 (6.9%) |
Disability Class: Vision Difficulty
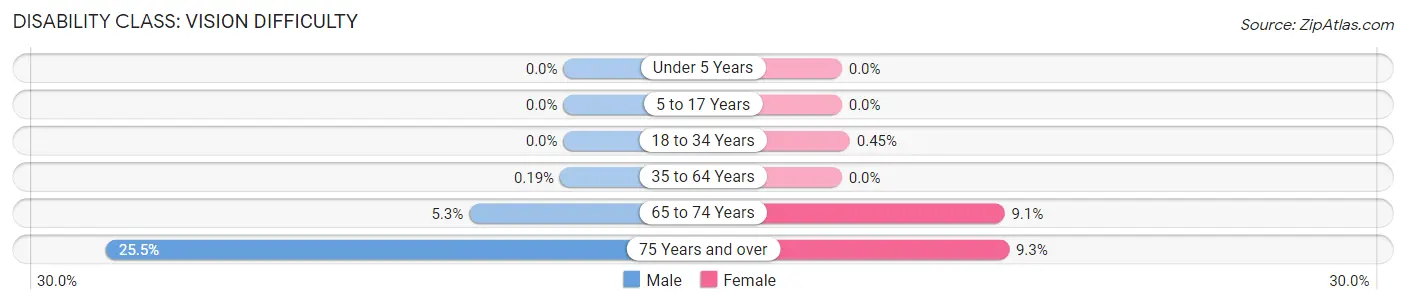
| Age Bracket | Male | Female |
| Under 5 Years | 0 (0.0%) | 0 (0.0%) |
| 5 to 17 Years | 0 (0.0%) | 0 (0.0%) |
| 18 to 34 Years | 0 (0.0%) | 5 (0.4%) |
| 35 to 64 Years | 5 (0.2%) | 0 (0.0%) |
| 65 to 74 Years | 31 (5.2%) | 46 (9.1%) |
| 75 Years and over | 54 (25.5%) | 19 (9.3%) |
Disability Class: Cognitive Difficulty
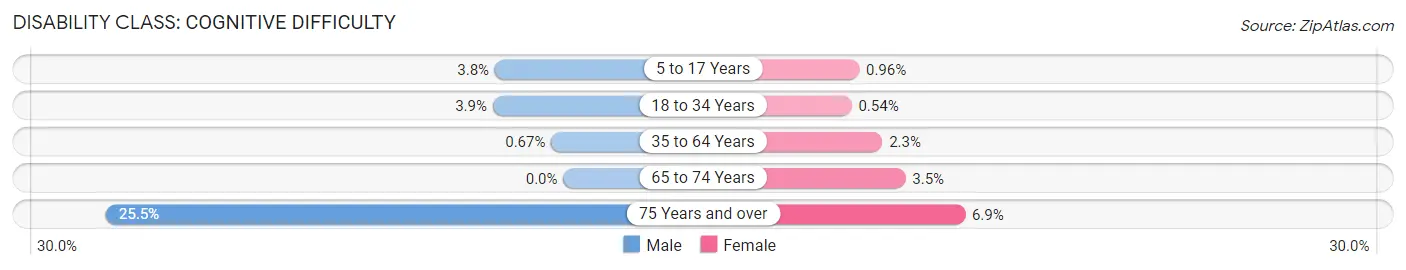
| Age Bracket | Male | Female |
| 5 to 17 Years | 37 (3.8%) | 10 (1.0%) |
| 18 to 34 Years | 48 (3.9%) | 6 (0.5%) |
| 35 to 64 Years | 18 (0.7%) | 56 (2.2%) |
| 65 to 74 Years | 0 (0.0%) | 18 (3.5%) |
| 75 Years and over | 54 (25.5%) | 14 (6.9%) |
Disability Class: Ambulatory Difficulty
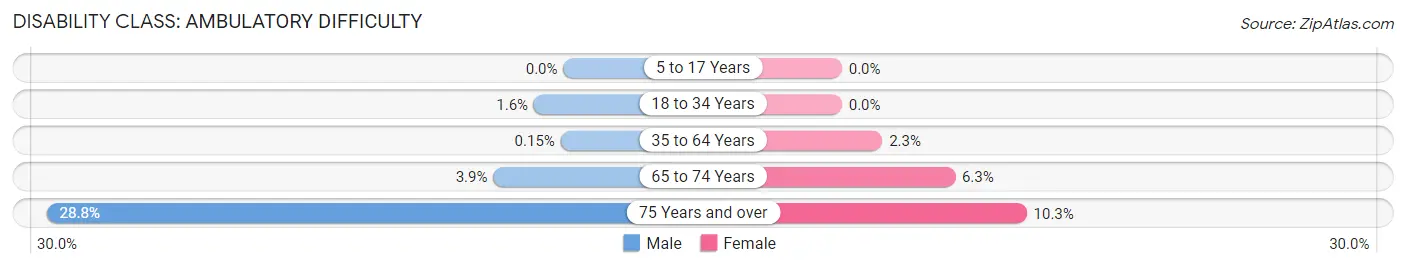
| Age Bracket | Male | Female |
| 5 to 17 Years | 0 (0.0%) | 0 (0.0%) |
| 18 to 34 Years | 20 (1.6%) | 0 (0.0%) |
| 35 to 64 Years | 4 (0.2%) | 56 (2.2%) |
| 65 to 74 Years | 23 (3.9%) | 32 (6.3%) |
| 75 Years and over | 61 (28.8%) | 21 (10.3%) |
Disability Class: Self-Care Difficulty
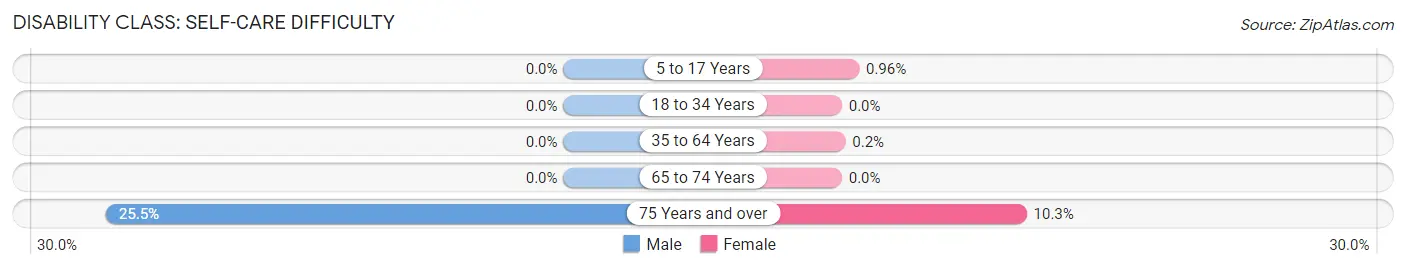
| Age Bracket | Male | Female |
| 5 to 17 Years | 0 (0.0%) | 10 (1.0%) |
| 18 to 34 Years | 0 (0.0%) | 0 (0.0%) |
| 35 to 64 Years | 0 (0.0%) | 5 (0.2%) |
| 65 to 74 Years | 0 (0.0%) | 0 (0.0%) |
| 75 Years and over | 54 (25.5%) | 21 (10.3%) |
Technology Access in Teton County
Computing Device Access in Teton County
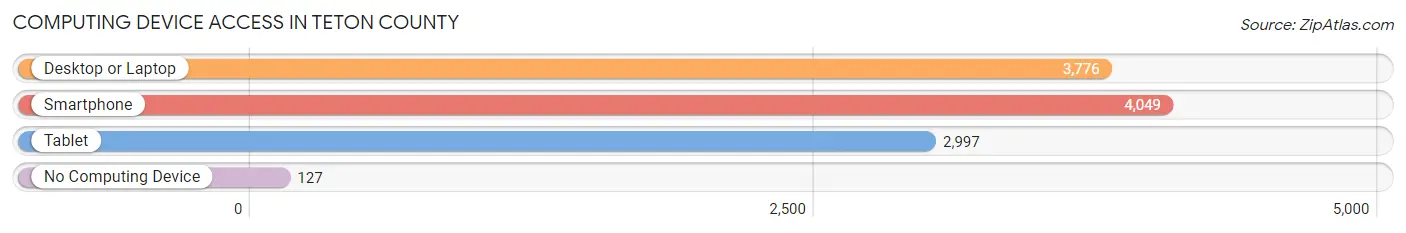
| Device Type | # Households | % Households |
| Desktop or Laptop | 3,776 | 87.5% |
| Smartphone | 4,049 | 93.8% |
| Tablet | 2,997 | 69.4% |
| No Computing Device | 127 | 2.9% |
| Total | 4,317 | 100.0% |
Internet Access in Teton County
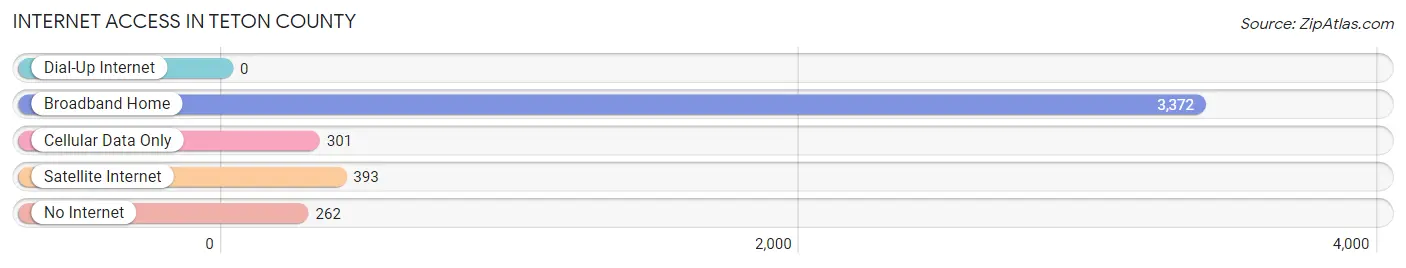
| Internet Type | # Households | % Households |
| Dial-Up Internet | 0 | 0.0% |
| Broadband Home | 3,372 | 78.1% |
| Cellular Data Only | 301 | 7.0% |
| Satellite Internet | 393 | 9.1% |
| No Internet | 262 | 6.1% |
| Total | 4,317 | 100.0% |
Teton County Summary
Teton County, Idaho is located in the southeastern corner of the state, bordering Wyoming and Montana. It is part of the Snake River Plain, a region of flat terrain and rolling hills. The county seat is Driggs, and the largest city is Victor. The county was established in 1919 and named after the Teton Range of the Rocky Mountains.
Geography
Teton County covers an area of 1,717 square miles, making it the fourth largest county in Idaho. It is bordered by Fremont County to the north, Madison County to the east, Bonneville County to the south, and Teton County, Wyoming to the west. The county is located in the Snake River Plain, a region of flat terrain and rolling hills. The highest point in the county is Mount Holmes, which has an elevation of 8,945 feet. The county is home to several rivers, including the Teton River, the Snake River, and the Henrys Fork.
The county is home to several protected areas, including the Caribou-Targhee National Forest, the Teton Wilderness, and the Jedediah Smith Wilderness. The county is also home to several ski resorts, including Grand Targhee Resort and Jackson Hole Mountain Resort.
Demographics
As of the 2010 census, Teton County had a population of 21,294. The racial makeup of the county was 94.3% White, 0.3% African American, 0.7% Native American, 0.7% Asian, 0.1% Pacific Islander, 2.2% from other races, and 1.9% from two or more races. Hispanic or Latino of any race were 5.2% of the population.
The median income for a household in the county was $45,945, and the median income for a family was $51,945. The per capita income for the county was $25,945. About 8.2% of families and 11.2% of the population were below the poverty line, including 14.2% of those under age 18 and 6.2% of those age 65 or over.
Economy
Teton County is largely rural and agricultural. The county is home to several farms and ranches, as well as several small businesses. The county is also home to several ski resorts, which provide jobs and attract tourists to the area.
The county is home to several manufacturing companies, including a wood products plant, a plastics plant, and a metal fabrication plant. The county is also home to several technology companies, including a software development company and a telecommunications company.
The county is home to several educational institutions, including the University of Idaho Teton County Extension, Teton Valley Community College, and Teton High School.
Conclusion
Teton County, Idaho is a rural county located in the southeastern corner of the state. It is home to several protected areas, ski resorts, and small businesses. The county has a population of 21,294 and a median income of $45,945. The economy of the county is largely agricultural, but it is also home to several manufacturing companies and technology companies. The county is also home to several educational institutions.
Common Questions
What is the Total Population of Teton County?
Total Population of Teton County is 11,813.
What is the Total Male Population of Teton County?
Total Male Population of Teton County is 6,046.
What is the Total Female Population of Teton County?
Total Female Population of Teton County is 5,767.
What is the Ratio of Males per 100 Females in Teton County?
There are 104.84 Males per 100 Females in Teton County.
What is the Ratio of Females per 100 Males in Teton County?
There are 95.39 Females per 100 Males in Teton County.
What is the Median Population Age in Teton County?
Median Population Age in Teton County is 38.6 Years.
What is the Average Family Size in Teton County
Average Family Size in Teton County is 3.3 People.
What is the Average Household Size in Teton County
Average Household Size in Teton County is 2.7 People.
What is Per Capita Income in Teton County?
Per Capita income in Teton County is $43,396.
What is the Median Family Income in Teton County?
Median Family Income in Teton County is $109,286.
What is the Median Household income in Teton County?
Median Household Income in Teton County is $88,906.
What is Income or Wage Gap in Teton County?
Income or Wage Gap in Teton County is 26.4%.
Women in Teton County earn 73.6 cents for every dollar earned by a man.
What is Family Income Deficit in Teton County?
Family Income Deficit in Teton County is $12,121.
Families that are below poverty line in Teton County earn $12,121 less on average than the poverty threshold level.
What is Inequality or Gini Index in Teton County?
Inequality or Gini Index in Teton County is 0.42.
How Large is the Labor Force in Teton County?
There are 6,988 People in the Labor Forcein in Teton County.
What is the Percentage of People in the Labor Force in Teton County?
74.3% of People are in the Labor Force in Teton County.
What is the Unemployment Rate in Teton County?
Unemployment Rate in Teton County is 1.6%.