Power County, ID
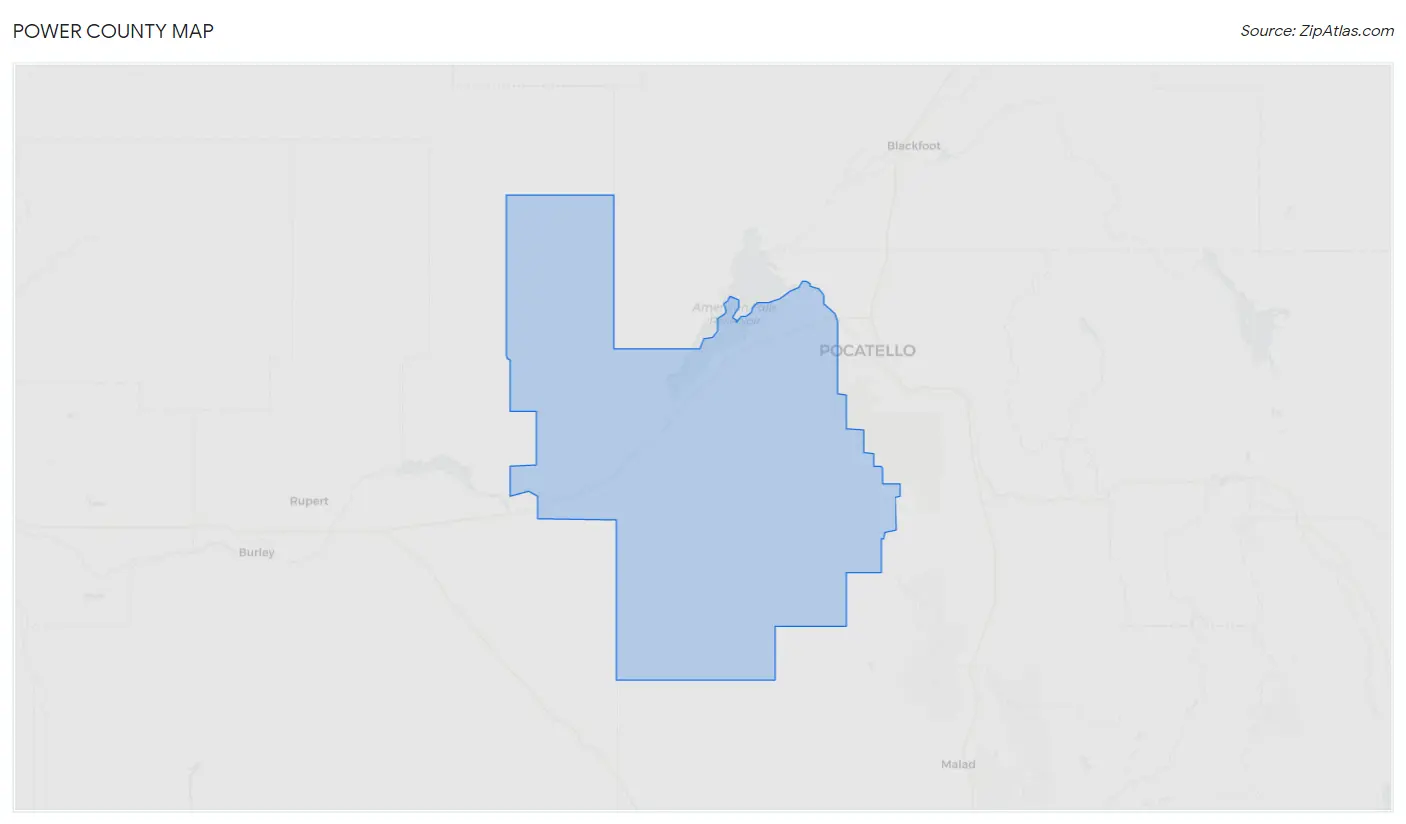
Power County Map
Power County Overview
7,918
TOTAL POPULATION
3,982
MALE POPULATION
3,936
FEMALE POPULATION
101.17
MALES / 100 FEMALES
98.84
FEMALES / 100 MALES
35.3
MEDIAN AGE
3.6
AVG FAMILY SIZE
2.9
AVG HOUSEHOLD SIZE
$24,069
PER CAPITA INCOME
$67,330
AVG FAMILY INCOME
$56,671
AVG HOUSEHOLD INCOME
36.4%
WAGE / INCOME GAP [ % ]
63.6¢/ $1
WAGE / INCOME GAP [ $ ]
0.37
INEQUALITY / GINI INDEX
3,908
LABOR FORCE [ PEOPLE ]
68.1%
PERCENT IN LABOR FORCE
7.5%
UNEMPLOYMENT RATE
Power County Area Codes
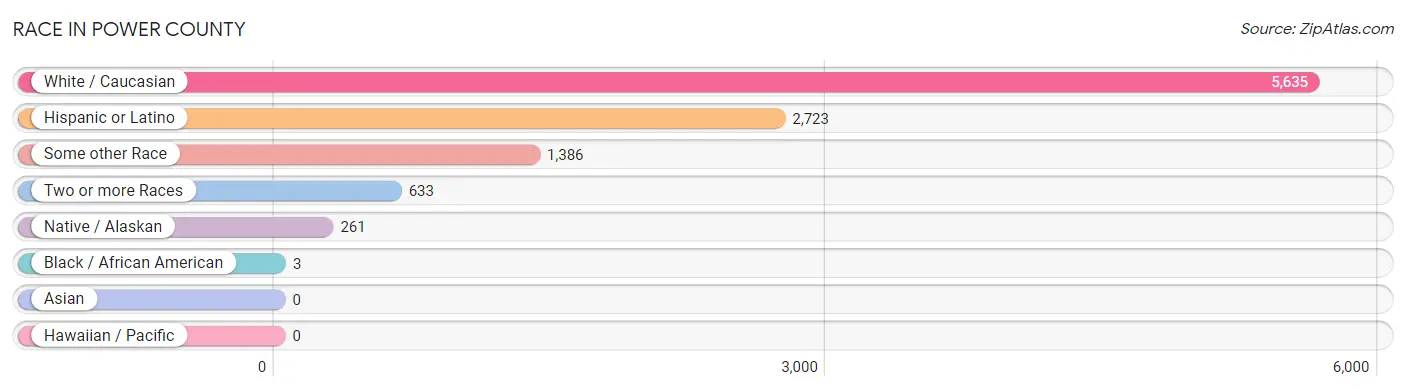
Race in Power County
The most populous races in Power County are White / Caucasian (5,635 | 71.2%), Hispanic or Latino (2,723 | 34.4%), and Some other Race (1,386 | 17.5%).
| Race | # Population | % Population |
| Asian | 0 | 0.0% |
| Black / African American | 3 | 0.0% |
| Hawaiian / Pacific | 0 | 0.0% |
| Hispanic or Latino | 2,723 | 34.4% |
| Native / Alaskan | 261 | 3.3% |
| White / Caucasian | 5,635 | 71.2% |
| Two or more Races | 633 | 8.0% |
| Some other Race | 1,386 | 17.5% |
| Total | 7,918 | 100.0% |
Ancestry in Power County
The most populous ancestries reported in Power County are Mexican (2,408 | 30.4%), English (1,672 | 21.1%), Irish (717 | 9.1%), German (686 | 8.7%), and American (552 | 7.0%), together accounting for 76.2% of all Power County residents.

| Ancestry | # Population | % Population |
| African | 2 | 0.0% |
| American | 552 | 7.0% |
| Apache | 48 | 0.6% |
| Austrian | 3 | 0.0% |
| Basque | 17 | 0.2% |
| Bhutanese | 7 | 0.1% |
| Blackfeet | 3 | 0.0% |
| British | 11 | 0.1% |
| Cherokee | 132 | 1.7% |
| Creek | 26 | 0.3% |
| Czech | 51 | 0.6% |
| Danish | 108 | 1.4% |
| Dutch | 123 | 1.5% |
| Eastern European | 29 | 0.4% |
| English | 1,672 | 21.1% |
| European | 149 | 1.9% |
| French | 71 | 0.9% |
| French Canadian | 63 | 0.8% |
| German | 686 | 8.7% |
| Irish | 717 | 9.1% |
| Italian | 317 | 4.0% |
| Mexican | 2,408 | 30.4% |
| Norwegian | 109 | 1.4% |
| Osage | 3 | 0.0% |
| Polish | 107 | 1.3% |
| Puerto Rican | 3 | 0.0% |
| Russian | 131 | 1.7% |
| Scandinavian | 24 | 0.3% |
| Scottish | 163 | 2.1% |
| Spaniard | 64 | 0.8% |
| Spanish American Indian | 98 | 1.2% |
| Subsaharan African | 2 | 0.0% |
| Swedish | 292 | 3.7% |
| Swiss | 51 | 0.6% |
| Welsh | 108 | 1.4% | View All 35 Rows |
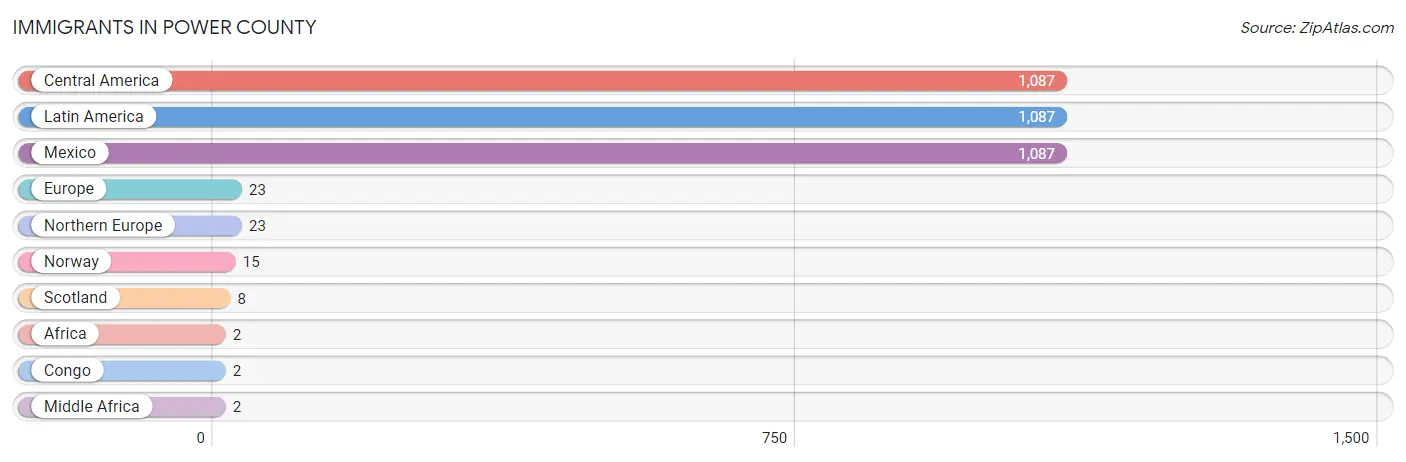
Immigrants in Power County
The most numerous immigrant groups reported in Power County came from Central America (1,087 | 13.7%), Latin America (1,087 | 13.7%), Mexico (1,087 | 13.7%), Europe (23 | 0.3%), and Northern Europe (23 | 0.3%), together accounting for 41.8% of all Power County residents.
| Immigration Origin | # Population | % Population |
| Africa | 2 | 0.0% |
| Central America | 1,087 | 13.7% |
| Congo | 2 | 0.0% |
| Europe | 23 | 0.3% |
| Latin America | 1,087 | 13.7% |
| Mexico | 1,087 | 13.7% |
| Middle Africa | 2 | 0.0% |
| Northern Europe | 23 | 0.3% |
| Norway | 15 | 0.2% |
| Scotland | 8 | 0.1% | View All 10 Rows |
Sex and Age in Power County
Sex and Age in Power County
The most populous age groups in Power County are 10 to 14 Years (468 | 11.7%) for men and Under 5 Years (413 | 10.5%) for women.
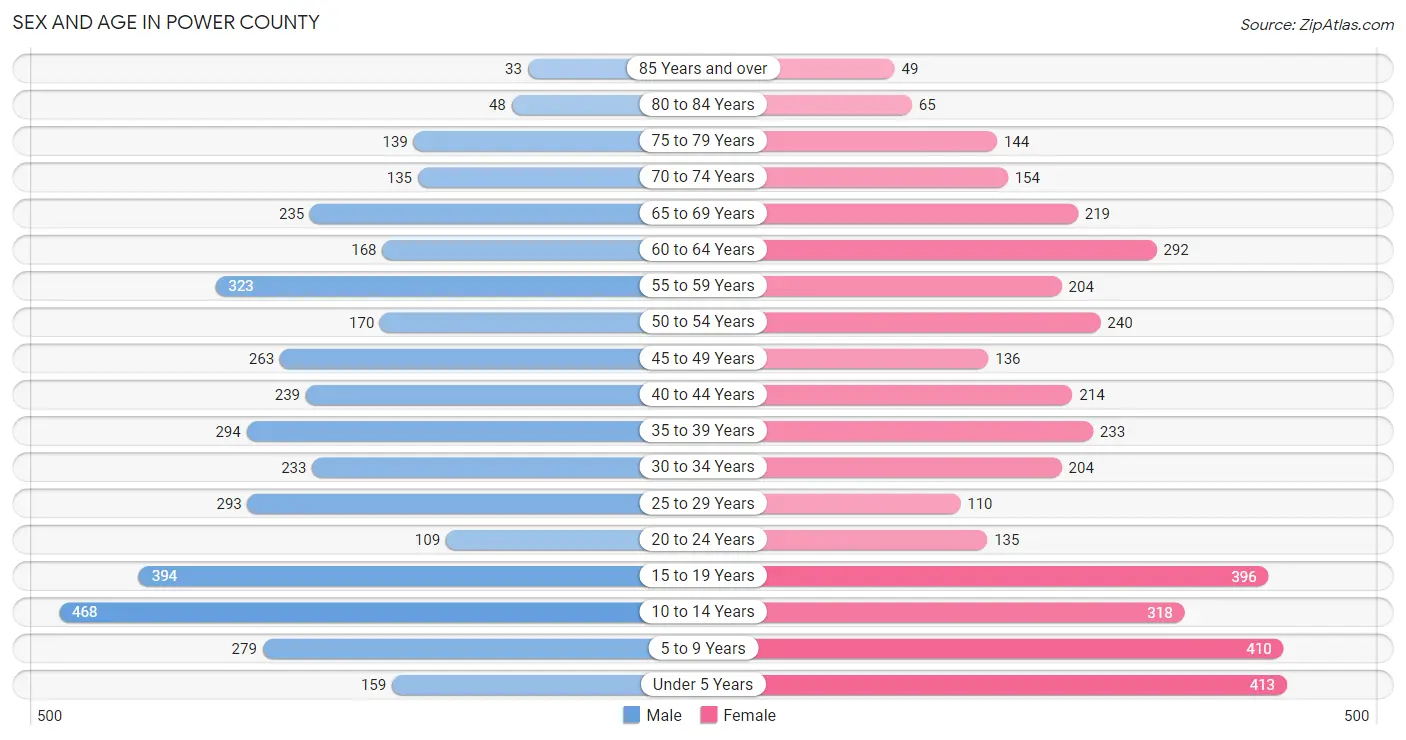
| Age Bracket | Male | Female |
| Under 5 Years | 159 (4.0%) | 413 (10.5%) |
| 5 to 9 Years | 279 (7.0%) | 410 (10.4%) |
| 10 to 14 Years | 468 (11.7%) | 318 (8.1%) |
| 15 to 19 Years | 394 (9.9%) | 396 (10.1%) |
| 20 to 24 Years | 109 (2.7%) | 135 (3.4%) |
| 25 to 29 Years | 293 (7.4%) | 110 (2.8%) |
| 30 to 34 Years | 233 (5.9%) | 204 (5.2%) |
| 35 to 39 Years | 294 (7.4%) | 233 (5.9%) |
| 40 to 44 Years | 239 (6.0%) | 214 (5.4%) |
| 45 to 49 Years | 263 (6.6%) | 136 (3.5%) |
| 50 to 54 Years | 170 (4.3%) | 240 (6.1%) |
| 55 to 59 Years | 323 (8.1%) | 204 (5.2%) |
| 60 to 64 Years | 168 (4.2%) | 292 (7.4%) |
| 65 to 69 Years | 235 (5.9%) | 219 (5.6%) |
| 70 to 74 Years | 135 (3.4%) | 154 (3.9%) |
| 75 to 79 Years | 139 (3.5%) | 144 (3.7%) |
| 80 to 84 Years | 48 (1.2%) | 65 (1.7%) |
| 85 Years and over | 33 (0.8%) | 49 (1.2%) |
| Total | 3,982 (100.0%) | 3,936 (100.0%) |
Families and Households in Power County
Median Family Size in Power County
The median family size in Power County is 3.65 persons per family, with single female/mother families (207 | 11.2%) accounting for the largest median family size of 4.17 persons per family. On the other hand, single male/father families (178 | 9.6%) represent the smallest median family size with 2.13 persons per family.
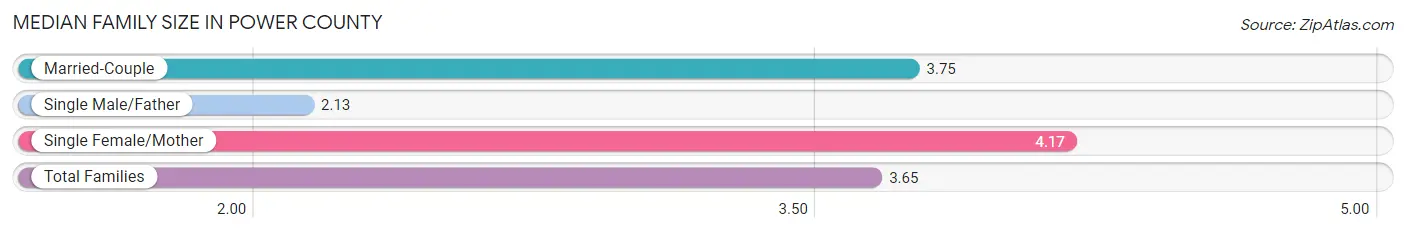
| Family Type | # Families | Family Size |
| Married-Couple | 1,470 (79.2%) | 3.75 |
| Single Male/Father | 178 (9.6%) | 2.13 |
| Single Female/Mother | 207 (11.2%) | 4.17 |
| Total Families | 1,855 (100.0%) | 3.65 |
Median Household Size in Power County
The median household size in Power County is 2.93 persons per household, with single female/mother households (207 | 7.7%) accounting for the largest median household size of 4.45 persons per household. non-family households (816 | 30.5%) represent the smallest median household size with 1.14 persons per household.
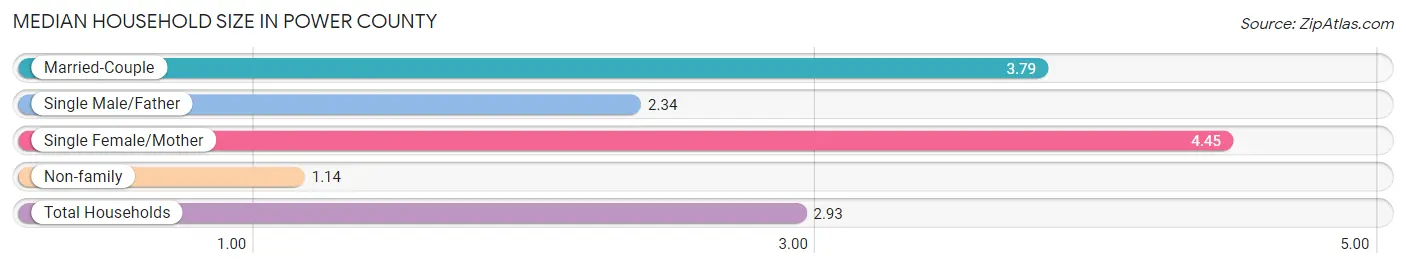
| Household Type | # Households | Household Size |
| Married-Couple | 1,470 (55.0%) | 3.79 |
| Single Male/Father | 178 (6.7%) | 2.34 |
| Single Female/Mother | 207 (7.7%) | 4.45 |
| Non-family | 816 (30.5%) | 1.14 |
| Total Households | 2,671 (100.0%) | 2.93 |
Household Size by Marriage Status in Power County
Out of a total of 2,671 households in Power County, 1,855 (69.5%) are family households, while 816 (30.5%) are nonfamily households. The most numerous type of family households are 2-person households, comprising 907, and the most common type of nonfamily households are 1-person households, comprising 738.
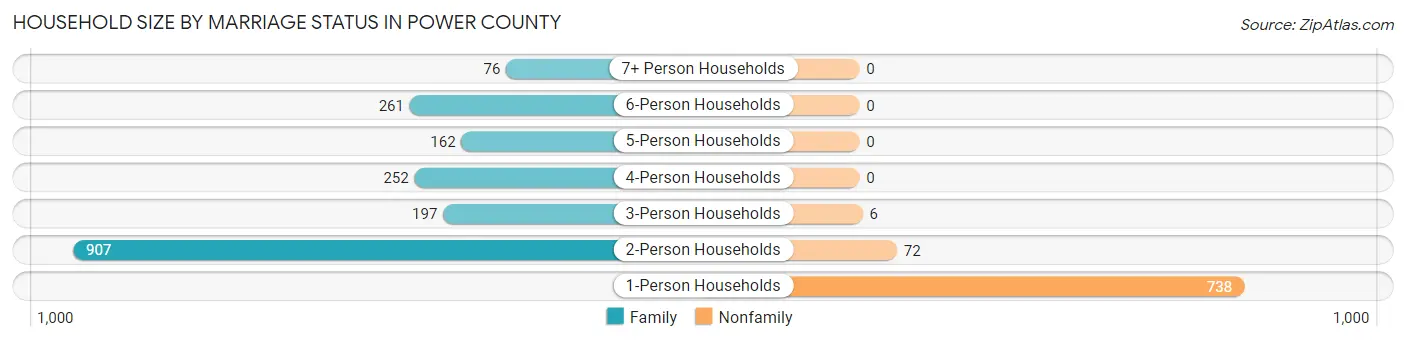
| Household Size | Family Households | Nonfamily Households |
| 1-Person Households | - | 738 (27.6%) |
| 2-Person Households | 907 (34.0%) | 72 (2.7%) |
| 3-Person Households | 197 (7.4%) | 6 (0.2%) |
| 4-Person Households | 252 (9.4%) | 0 (0.0%) |
| 5-Person Households | 162 (6.1%) | 0 (0.0%) |
| 6-Person Households | 261 (9.8%) | 0 (0.0%) |
| 7+ Person Households | 76 (2.9%) | 0 (0.0%) |
| Total | 1,855 (69.5%) | 816 (30.5%) |
Female Fertility in Power County
Fertility by Age in Power County
Average fertility rate in Power County is 43.0 births per 1,000 women. Women in the age bracket of 20 to 34 years have the highest fertility rate with 102.0 births per 1,000 women. Women in the age bracket of 20 to 34 years acount for 71.9% of all women with births.
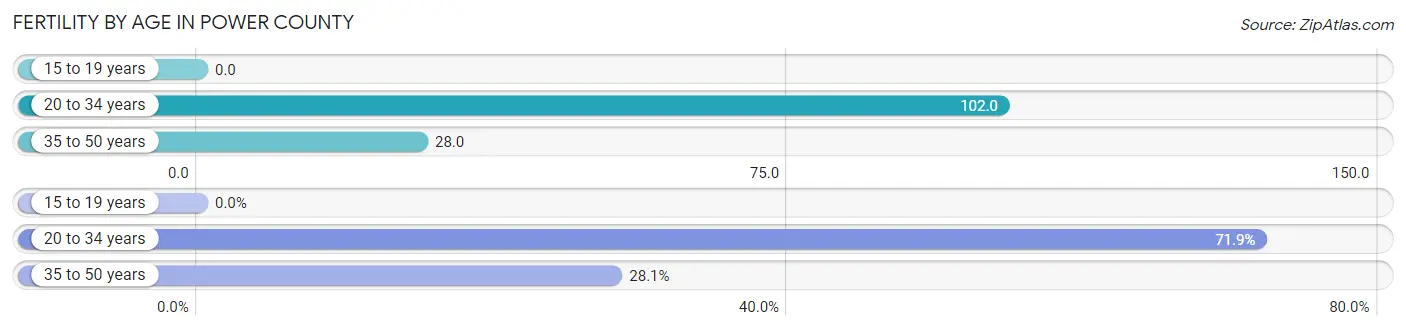
| Age Bracket | Women with Births | Births / 1,000 Women |
| 15 to 19 years | 0 (0.0%) | 0.0 |
| 20 to 34 years | 46 (71.9%) | 102.0 |
| 35 to 50 years | 18 (28.1%) | 28.0 |
| Total | 64 (100.0%) | 43.0 |
Fertility by Age by Marriage Status in Power County
53.1% of women with births (64) in Power County are married. The highest percentage of unmarried women with births falls into 35 to 50 years age bracket with 55.6% of them unmarried at the time of birth, while the lowest percentage of unmarried women with births belong to 20 to 34 years age bracket with 43.5% of them unmarried.
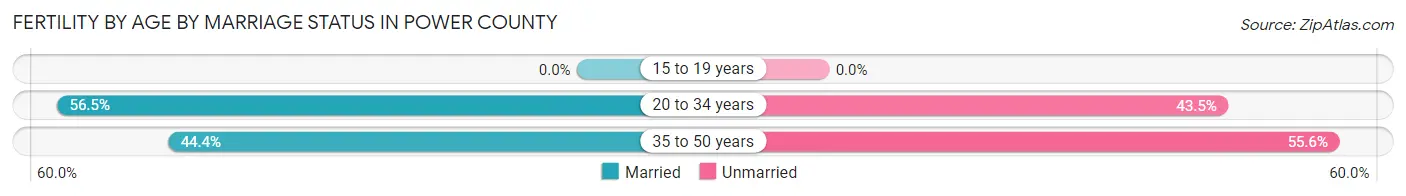
| Age Bracket | Married | Unmarried |
| 15 to 19 years | 0 (0.0%) | 0 (0.0%) |
| 20 to 34 years | 26 (56.5%) | 20 (43.5%) |
| 35 to 50 years | 8 (44.4%) | 10 (55.6%) |
| Total | 34 (53.1%) | 30 (46.9%) |
Fertility by Education in Power County
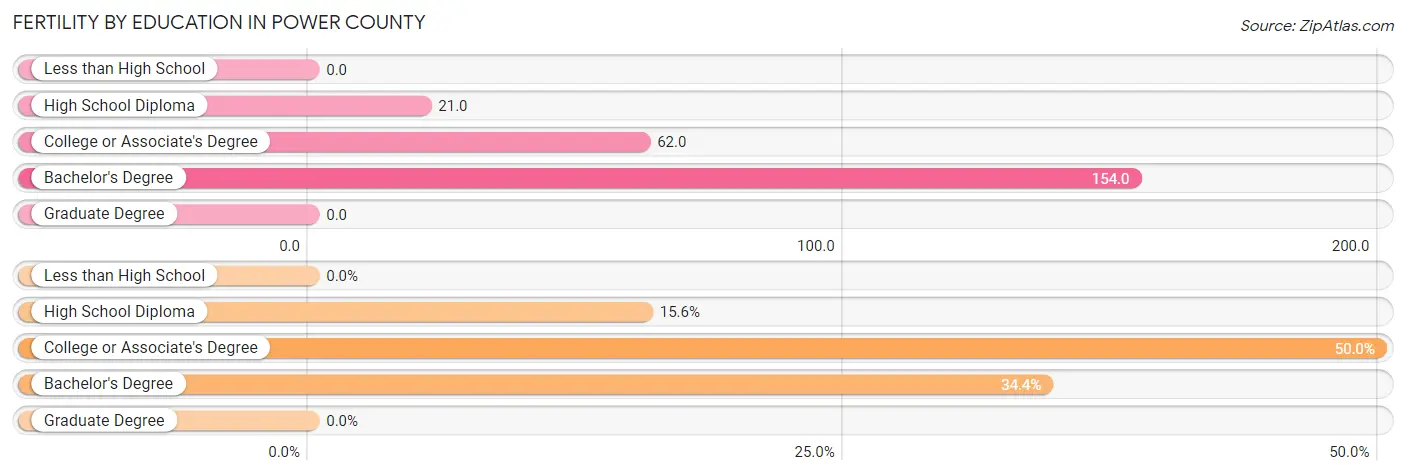
| Educational Attainment | Women with Births | Births / 1,000 Women |
| Less than High School | 0 (0.0%) | 0.0 |
| High School Diploma | 10 (15.6%) | 21.0 |
| College or Associate's Degree | 32 (50.0%) | 62.0 |
| Bachelor's Degree | 22 (34.4%) | 154.0 |
| Graduate Degree | 0 (0.0%) | 0.0 |
| Total | 64 (100.0%) | 43.0 |
Fertility by Education by Marriage Status in Power County
46.9% of women with births in Power County are unmarried. Women with the educational attainment of bachelor's degree are most likely to be married with 100.0% of them married at childbirth, while women with the educational attainment of high school diploma are least likely to be married with 100.0% of them unmarried at childbirth.
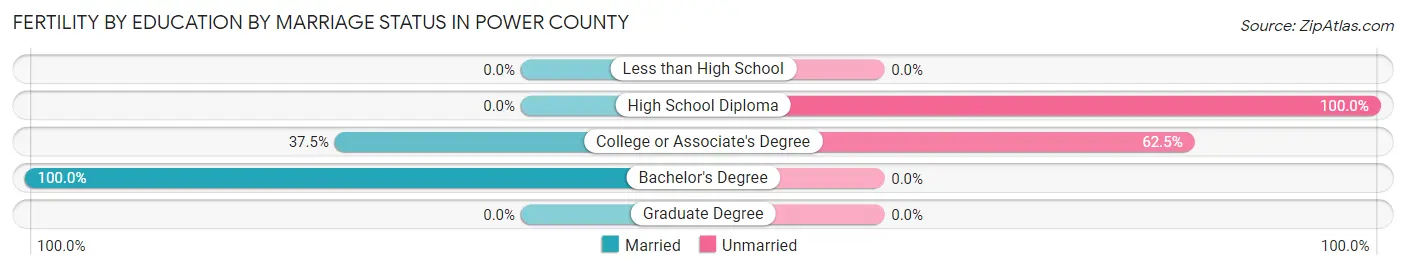
| Educational Attainment | Married | Unmarried |
| Less than High School | 0 (0.0%) | 0 (0.0%) |
| High School Diploma | 0 (0.0%) | 10 (100.0%) |
| College or Associate's Degree | 12 (37.5%) | 20 (62.5%) |
| Bachelor's Degree | 22 (100.0%) | 0 (0.0%) |
| Graduate Degree | 0 (0.0%) | 0 (0.0%) |
| Total | 34 (53.1%) | 30 (46.9%) |
Income in Power County
Income Overview in Power County
Per Capita Income in Power County is $24,069, while median incomes of families and households are $67,330 and $56,671 respectively.
| Characteristic | Number | Measure |
| Per Capita Income | 7,918 | $24,069 |
| Median Family Income | 1,855 | $67,330 |
| Mean Family Income | 1,855 | $78,556 |
| Median Household Income | 2,671 | $56,671 |
| Mean Household Income | 2,671 | $68,466 |
| Income Deficit | 1,855 | $0 |
| Wage / Income Gap (%) | 7,918 | 36.35% |
| Wage / Income Gap ($) | 7,918 | 63.65¢ per $1 |
| Gini / Inequality Index | 7,918 | 0.37 |
Earnings by Sex in Power County
Average Earnings in Power County are $33,045, $38,098 for men and $24,249 for women, a difference of 36.3%.
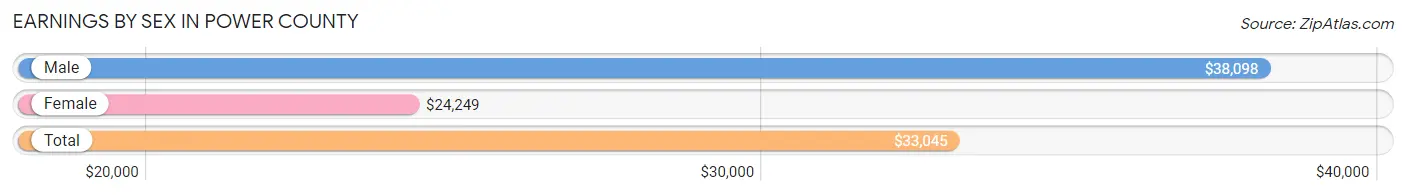
| Sex | Number | Average Earnings |
| Male | 2,418 (58.0%) | $38,098 |
| Female | 1,750 (42.0%) | $24,249 |
| Total | 4,168 (100.0%) | $33,045 |
Earnings by Sex by Income Bracket in Power County
The most common earnings brackets in Power County are $45,000 to $49,999 for men (314 | 13.0%) and $5,000 to $7,499 for women (238 | 13.6%).
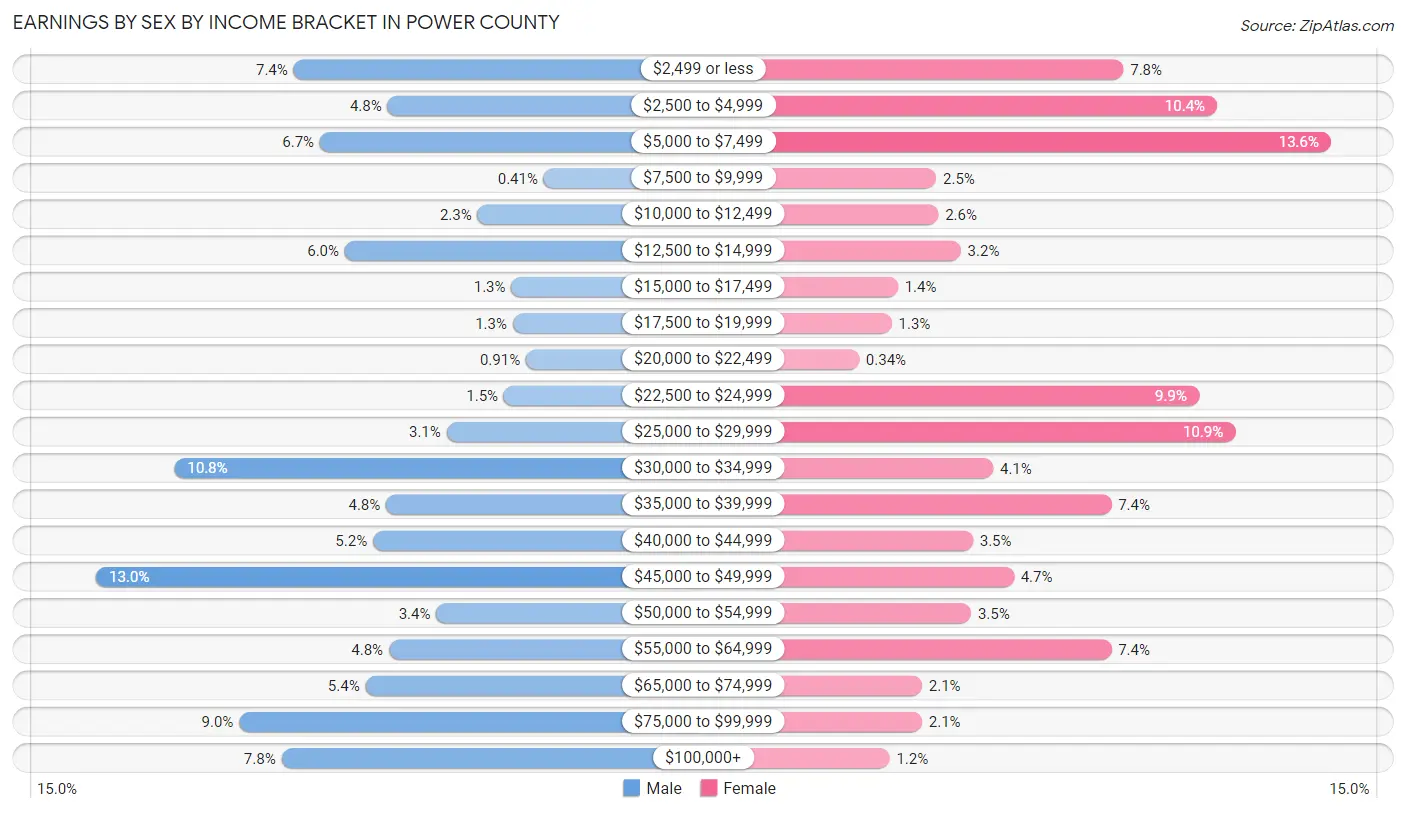
| Income | Male | Female |
| $2,499 or less | 180 (7.4%) | 136 (7.8%) |
| $2,500 to $4,999 | 116 (4.8%) | 182 (10.4%) |
| $5,000 to $7,499 | 162 (6.7%) | 238 (13.6%) |
| $7,500 to $9,999 | 10 (0.4%) | 44 (2.5%) |
| $10,000 to $12,499 | 55 (2.3%) | 45 (2.6%) |
| $12,500 to $14,999 | 145 (6.0%) | 56 (3.2%) |
| $15,000 to $17,499 | 32 (1.3%) | 25 (1.4%) |
| $17,500 to $19,999 | 31 (1.3%) | 22 (1.3%) |
| $20,000 to $22,499 | 22 (0.9%) | 6 (0.3%) |
| $22,500 to $24,999 | 37 (1.5%) | 173 (9.9%) |
| $25,000 to $29,999 | 76 (3.1%) | 191 (10.9%) |
| $30,000 to $34,999 | 261 (10.8%) | 72 (4.1%) |
| $35,000 to $39,999 | 117 (4.8%) | 130 (7.4%) |
| $40,000 to $44,999 | 126 (5.2%) | 62 (3.5%) |
| $45,000 to $49,999 | 314 (13.0%) | 82 (4.7%) |
| $50,000 to $54,999 | 83 (3.4%) | 61 (3.5%) |
| $55,000 to $64,999 | 115 (4.8%) | 130 (7.4%) |
| $65,000 to $74,999 | 131 (5.4%) | 37 (2.1%) |
| $75,000 to $99,999 | 217 (9.0%) | 37 (2.1%) |
| $100,000+ | 188 (7.8%) | 21 (1.2%) |
| Total | 2,418 (100.0%) | 1,750 (100.0%) |
Earnings by Sex by Educational Attainment in Power County
Average earnings in Power County are $42,946 for men and $28,695 for women, a difference of 33.2%. Men with an educational attainment of graduate degree enjoy the highest average annual earnings of $101,250, while those with high school diploma education earn the least with $33,256. Women with an educational attainment of graduate degree earn the most with the average annual earnings of $47,857, while those with college or associate's degree education have the smallest earnings of $23,929.
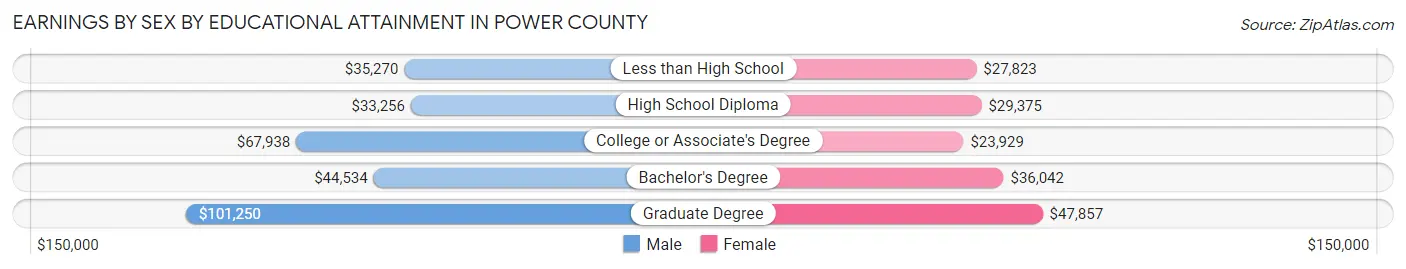
| Educational Attainment | Male Income | Female Income |
| Less than High School | $35,270 | $27,823 |
| High School Diploma | $33,256 | $29,375 |
| College or Associate's Degree | $67,938 | $23,929 |
| Bachelor's Degree | $44,534 | $36,042 |
| Graduate Degree | $101,250 | $47,857 |
| Total | $42,946 | $28,695 |
Family Income in Power County
Family Income Brackets in Power County
According to the Power County family income data, there are 456 families falling into the $100,000 to $149,999 income range, which is the most common income bracket and makes up 24.6% of all families.
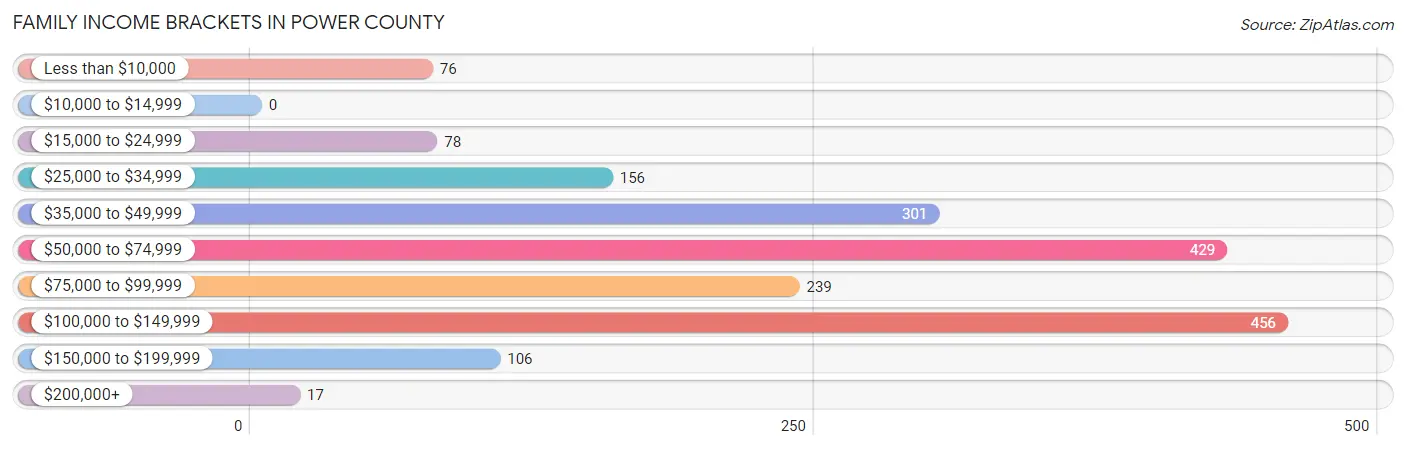
| Income Bracket | # Families | % Families |
| Less than $10,000 | 76 | 4.1% |
| $10,000 to $14,999 | 0 | 0.0% |
| $15,000 to $24,999 | 78 | 4.2% |
| $25,000 to $34,999 | 156 | 8.4% |
| $35,000 to $49,999 | 301 | 16.2% |
| $50,000 to $74,999 | 429 | 23.1% |
| $75,000 to $99,999 | 239 | 12.9% |
| $100,000 to $149,999 | 456 | 24.6% |
| $150,000 to $199,999 | 106 | 5.7% |
| $200,000+ | 17 | 0.9% |
Family Income by Famaliy Size in Power County
4-person families (246 | 13.3%) account for the highest median family income in Power County with $135,588 per family, while 4-person families (246 | 13.3%) have the highest median income of $33,897 per family member.
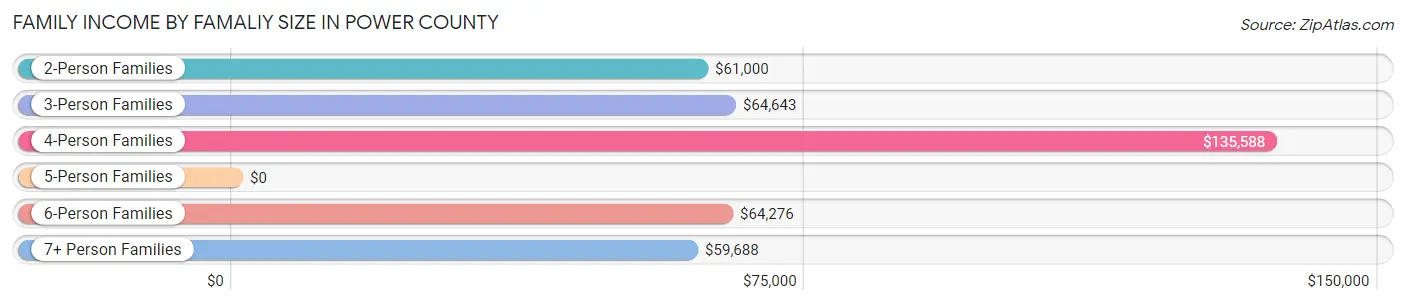
| Income Bracket | # Families | Median Income |
| 2-Person Families | 918 (49.5%) | $61,000 |
| 3-Person Families | 214 (11.5%) | $64,643 |
| 4-Person Families | 246 (13.3%) | $135,588 |
| 5-Person Families | 146 (7.9%) | $0 |
| 6-Person Families | 261 (14.1%) | $64,276 |
| 7+ Person Families | 70 (3.8%) | $59,688 |
| Total | 1,855 (100.0%) | $67,330 |
Family Income by Number of Earners in Power County
The median family income in Power County is $67,330, with families comprising 3+ earners (300) having the highest median family income of $127,917, while families with no earners (257) have the lowest median family income of $45,417, accounting for 16.2% and 13.9% of families, respectively.
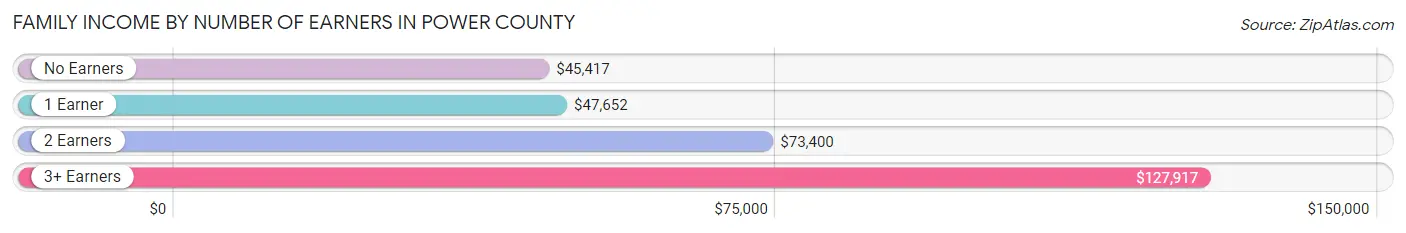
| Number of Earners | # Families | Median Income |
| No Earners | 257 (13.9%) | $45,417 |
| 1 Earner | 472 (25.4%) | $47,652 |
| 2 Earners | 826 (44.5%) | $73,400 |
| 3+ Earners | 300 (16.2%) | $127,917 |
| Total | 1,855 (100.0%) | $67,330 |
Household Income in Power County
Household Income Brackets in Power County
With 526 households falling in the category, the $50,000 to $74,999 income range is the most frequent in Power County, accounting for 19.7% of all households. In contrast, only 19 households (0.7%) fall into the $200,000+ income bracket, making it the least populous group.
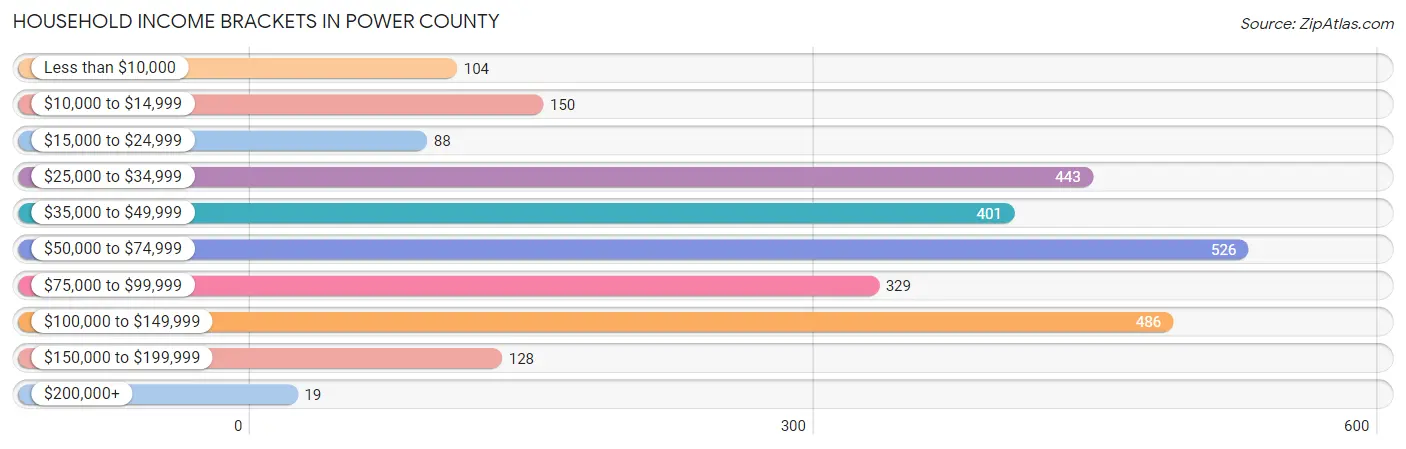
| Income Bracket | # Households | % Households |
| Less than $10,000 | 104 | 3.9% |
| $10,000 to $14,999 | 150 | 5.6% |
| $15,000 to $24,999 | 88 | 3.3% |
| $25,000 to $34,999 | 443 | 16.6% |
| $35,000 to $49,999 | 401 | 15.0% |
| $50,000 to $74,999 | 526 | 19.7% |
| $75,000 to $99,999 | 329 | 12.3% |
| $100,000 to $149,999 | 486 | 18.2% |
| $150,000 to $199,999 | 128 | 4.8% |
| $200,000+ | 19 | 0.7% |
Household Income by Householder Age in Power County
The median household income in Power County is $56,671, with the highest median household income of $63,355 found in the 25 to 44 years age bracket for the primary householder. A total of 963 households (36.0%) fall into this category. Meanwhile, the 15 to 24 years age bracket for the primary householder has the lowest median household income of $28,700, with 60 households (2.2%) in this group.
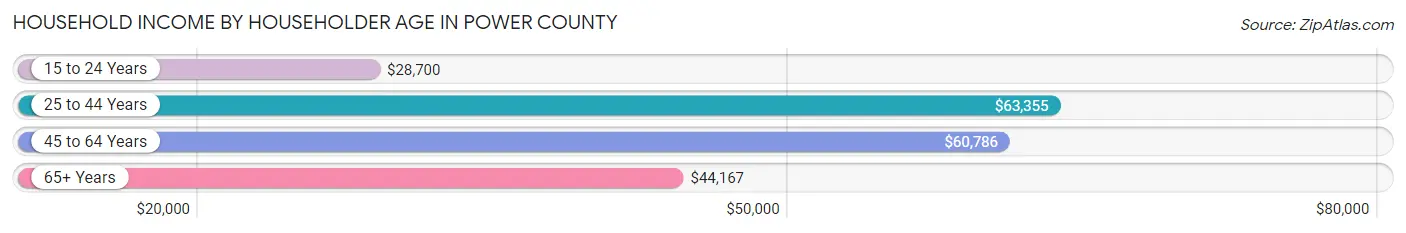
| Income Bracket | # Households | Median Income |
| 15 to 24 Years | 60 (2.2%) | $28,700 |
| 25 to 44 Years | 963 (36.0%) | $63,355 |
| 45 to 64 Years | 884 (33.1%) | $60,786 |
| 65+ Years | 764 (28.6%) | $44,167 |
| Total | 2,671 (100.0%) | $56,671 |
Poverty in Power County
Income Below Poverty by Sex and Age in Power County
With 10.7% poverty level for males and 11.6% for females among the residents of Power County, 15 year old males and 5 year old females are the most vulnerable to poverty, with 24 males (55.8%) and 23 females (95.8%) in their respective age groups living below the poverty level.
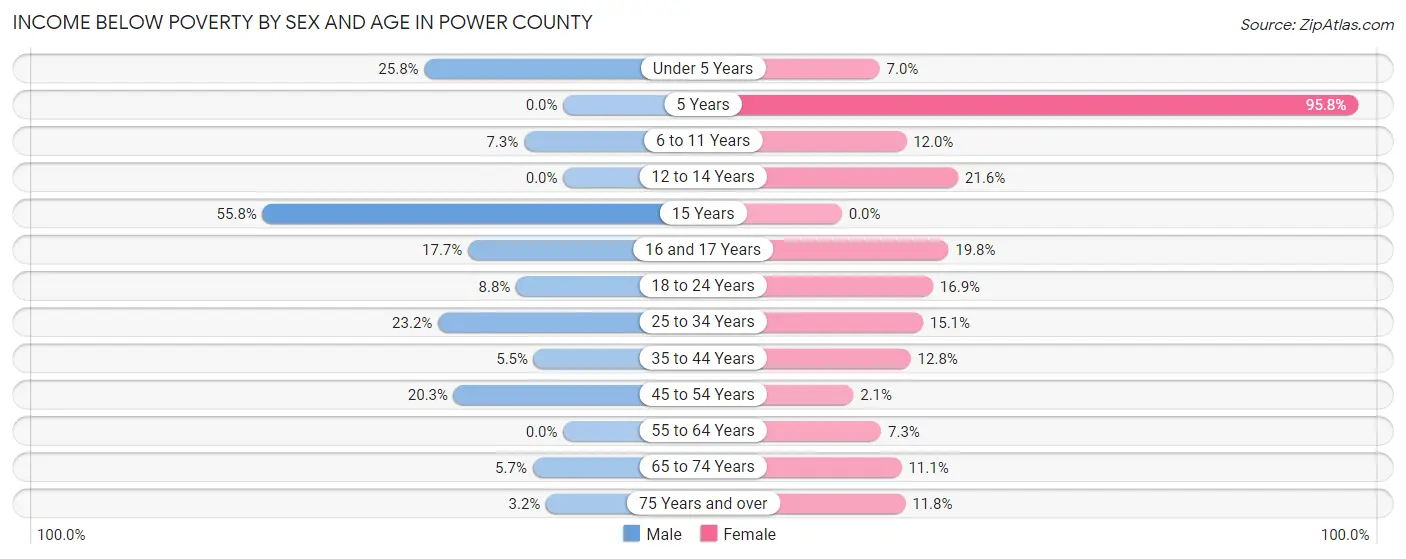
| Age Bracket | Male | Female |
| Under 5 Years | 41 (25.8%) | 29 (7.0%) |
| 5 Years | 0 (0.0%) | 23 (95.8%) |
| 6 to 11 Years | 37 (7.3%) | 57 (11.9%) |
| 12 to 14 Years | 0 (0.0%) | 49 (21.6%) |
| 15 Years | 24 (55.8%) | 0 (0.0%) |
| 16 and 17 Years | 35 (17.7%) | 18 (19.8%) |
| 18 to 24 Years | 22 (8.8%) | 59 (16.9%) |
| 25 to 34 Years | 122 (23.2%) | 45 (15.0%) |
| 35 to 44 Years | 29 (5.5%) | 57 (12.8%) |
| 45 to 54 Years | 88 (20.3%) | 8 (2.1%) |
| 55 to 64 Years | 0 (0.0%) | 36 (7.3%) |
| 65 to 74 Years | 21 (5.7%) | 41 (11.1%) |
| 75 Years and over | 7 (3.2%) | 27 (11.8%) |
| Total | 426 (10.7%) | 449 (11.6%) |
Income Above Poverty by Sex and Age in Power County
According to the poverty statistics in Power County, males aged 12 to 14 years and females aged 15 years are the age groups that are most secure financially, with 100.0% of males and 100.0% of females in these age groups living above the poverty line.
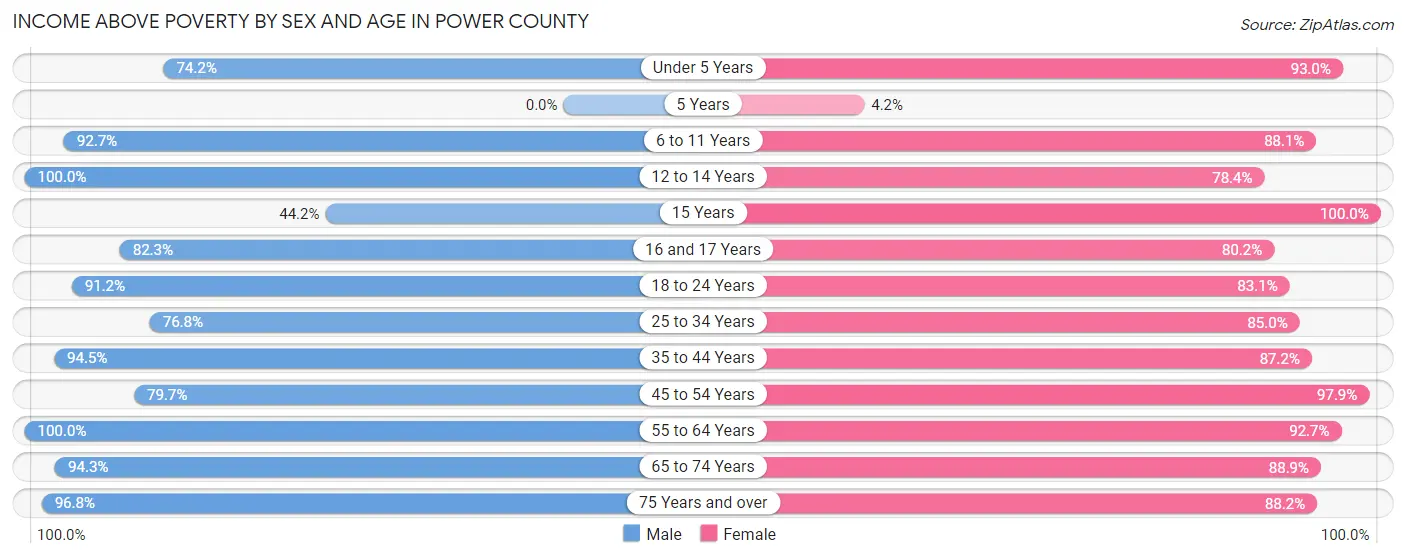
| Age Bracket | Male | Female |
| Under 5 Years | 118 (74.2%) | 384 (93.0%) |
| 5 Years | 0 (0.0%) | 1 (4.2%) |
| 6 to 11 Years | 470 (92.7%) | 420 (88.0%) |
| 12 to 14 Years | 240 (100.0%) | 178 (78.4%) |
| 15 Years | 19 (44.2%) | 90 (100.0%) |
| 16 and 17 Years | 163 (82.3%) | 73 (80.2%) |
| 18 to 24 Years | 229 (91.2%) | 290 (83.1%) |
| 25 to 34 Years | 403 (76.8%) | 254 (85.0%) |
| 35 to 44 Years | 501 (94.5%) | 389 (87.2%) |
| 45 to 54 Years | 345 (79.7%) | 368 (97.9%) |
| 55 to 64 Years | 488 (100.0%) | 458 (92.7%) |
| 65 to 74 Years | 349 (94.3%) | 329 (88.9%) |
| 75 Years and over | 213 (96.8%) | 202 (88.2%) |
| Total | 3,538 (89.2%) | 3,436 (88.4%) |
Income Below Poverty Among Married-Couple Families in Power County
The poverty statistics for married-couple families in Power County show that 4.2% or 61 of the total 1,470 families live below the poverty line. Families with 5 or more children have the highest poverty rate of 75.7%, comprising of 28 families. On the other hand, families with 3 or 4 children have the lowest poverty rate of 0.0%, which includes 0 families.
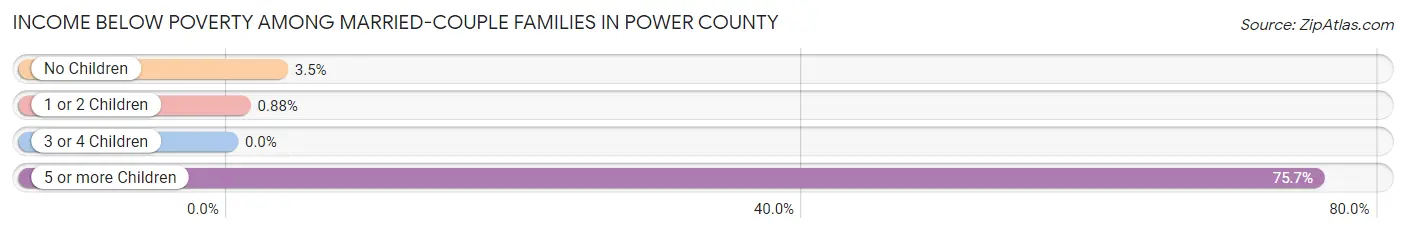
| Children | Above Poverty | Below Poverty |
| No Children | 863 (96.5%) | 31 (3.5%) |
| 1 or 2 Children | 226 (99.1%) | 2 (0.9%) |
| 3 or 4 Children | 311 (100.0%) | 0 (0.0%) |
| 5 or more Children | 9 (24.3%) | 28 (75.7%) |
| Total | 1,409 (95.9%) | 61 (4.2%) |
Income Below Poverty Among Single-Parent Households in Power County
According to the poverty data in Power County, 33.7% or 60 single-father households and 12.1% or 25 single-mother households are living below the poverty line. Among single-father households, those with 1 or 2 children have the highest poverty rate, with 60 households (68.2%) experiencing poverty. Likewise, among single-mother households, those with 1 or 2 children have the highest poverty rate, with 17 households (15.0%) falling below the poverty line.
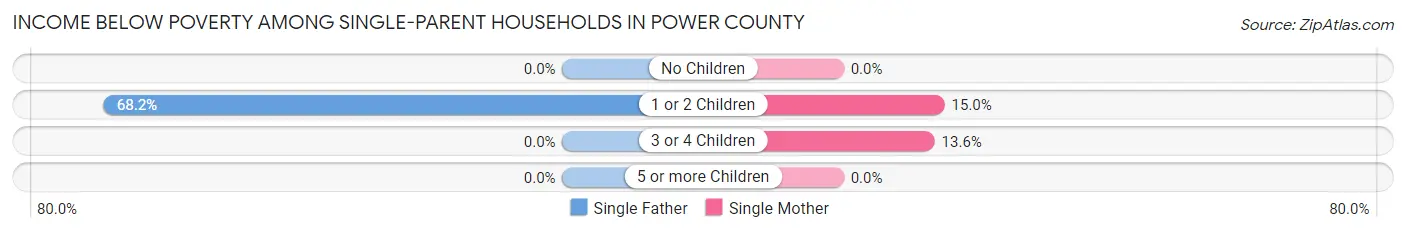
| Children | Single Father | Single Mother |
| No Children | 0 (0.0%) | 0 (0.0%) |
| 1 or 2 Children | 60 (68.2%) | 17 (15.0%) |
| 3 or 4 Children | 0 (0.0%) | 8 (13.6%) |
| 5 or more Children | 0 (0.0%) | 0 (0.0%) |
| Total | 60 (33.7%) | 25 (12.1%) |
Income Below Poverty Among Married-Couple vs Single-Parent Households in Power County
The poverty data for Power County shows that 61 of the married-couple family households (4.2%) and 85 of the single-parent households (22.1%) are living below the poverty level. Within the married-couple family households, those with 5 or more children have the highest poverty rate, with 28 households (75.7%) falling below the poverty line. Among the single-parent households, those with 1 or 2 children have the highest poverty rate, with 77 household (38.3%) living below poverty.
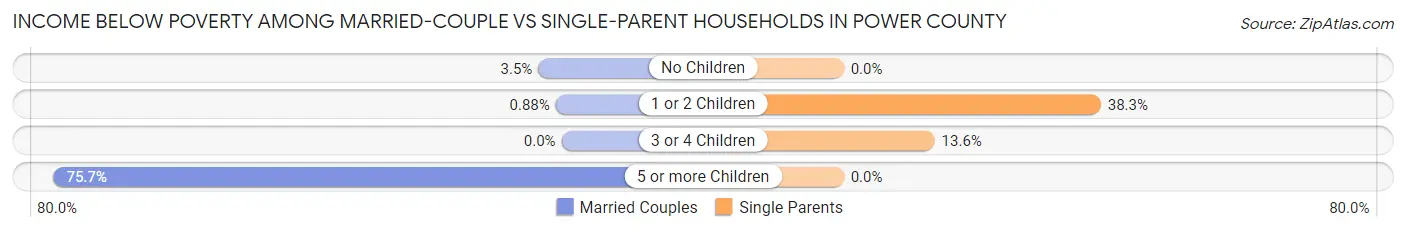
| Children | Married-Couple Families | Single-Parent Households |
| No Children | 31 (3.5%) | 0 (0.0%) |
| 1 or 2 Children | 2 (0.9%) | 77 (38.3%) |
| 3 or 4 Children | 0 (0.0%) | 8 (13.6%) |
| 5 or more Children | 28 (75.7%) | 0 (0.0%) |
| Total | 61 (4.2%) | 85 (22.1%) |
Employment Characteristics in Power County
Employment by Class of Employer in Power County
Among the 3,530 employed individuals in Power County, private company employees (2,188 | 62.0%), local government employees (385 | 10.9%), and self-employed (not incorporated) (330 | 9.3%) make up the most common classes of employment.
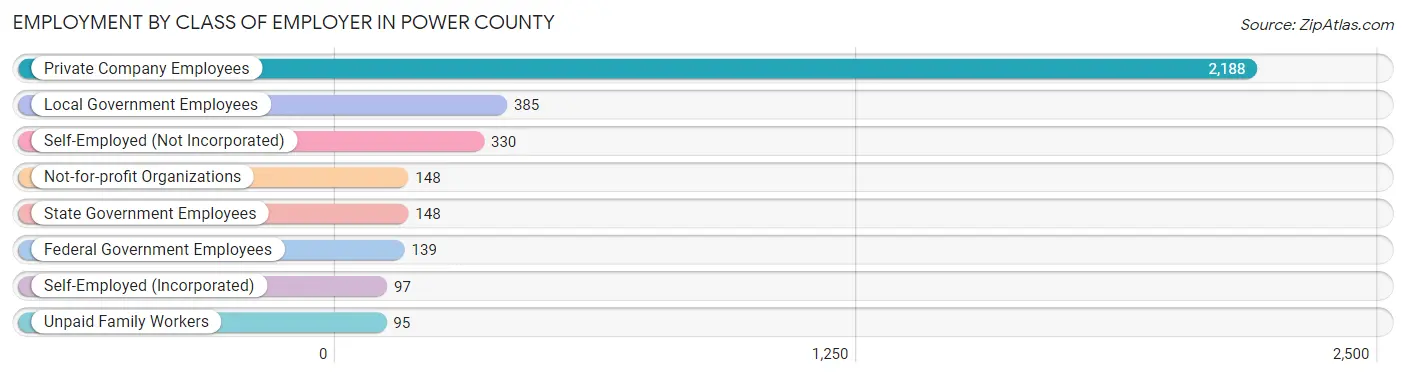
| Employer Class | # Employees | % Employees |
| Private Company Employees | 2,188 | 62.0% |
| Self-Employed (Incorporated) | 97 | 2.8% |
| Self-Employed (Not Incorporated) | 330 | 9.3% |
| Not-for-profit Organizations | 148 | 4.2% |
| Local Government Employees | 385 | 10.9% |
| State Government Employees | 148 | 4.2% |
| Federal Government Employees | 139 | 3.9% |
| Unpaid Family Workers | 95 | 2.7% |
| Total | 3,530 | 100.0% |
Employment Status by Age in Power County
According to the labor force statistics for Power County, out of the total population over 16 years of age (5,738), 68.1% or 3,908 individuals are in the labor force, with 7.5% or 293 of them unemployed. The age group with the highest labor force participation rate is 35 to 44 years, with 92.7% or 908 individuals in the labor force. Within the labor force, the 16 to 19 years age range has the highest percentage of unemployed individuals, with 49.3% or 179 of them being unemployed.
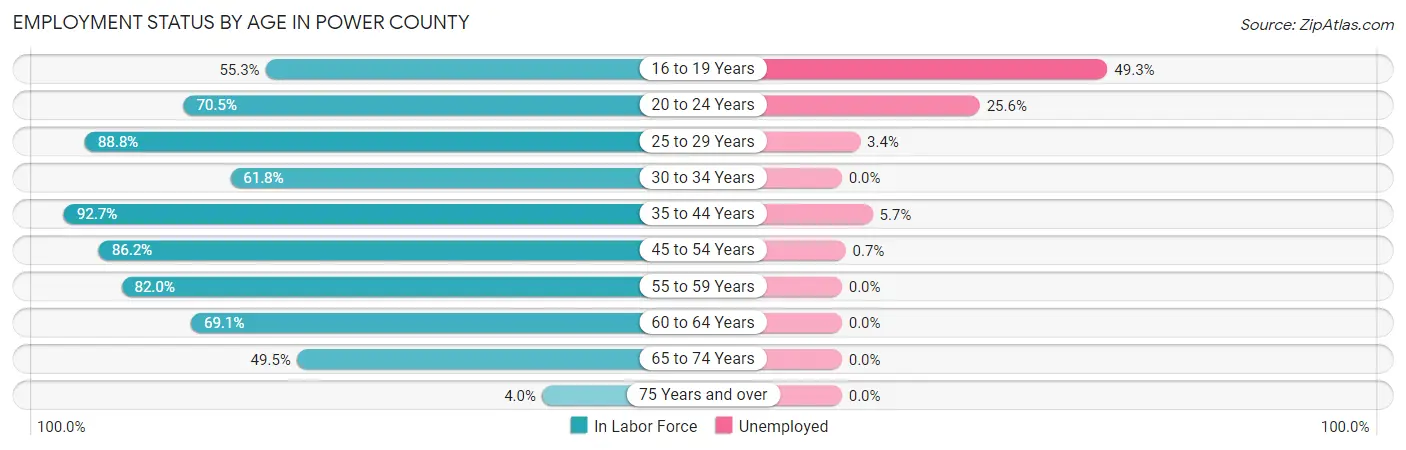
| Age Bracket | In Labor Force | Unemployed |
| 16 to 19 Years | 363 (55.3%) | 179 (49.3%) |
| 20 to 24 Years | 172 (70.5%) | 44 (25.6%) |
| 25 to 29 Years | 358 (88.8%) | 12 (3.4%) |
| 30 to 34 Years | 270 (61.8%) | 0 (0.0%) |
| 35 to 44 Years | 908 (92.7%) | 52 (5.7%) |
| 45 to 54 Years | 697 (86.2%) | 5 (0.7%) |
| 55 to 59 Years | 432 (82.0%) | 0 (0.0%) |
| 60 to 64 Years | 318 (69.1%) | 0 (0.0%) |
| 65 to 74 Years | 368 (49.5%) | 0 (0.0%) |
| 75 Years and over | 19 (4.0%) | 0 (0.0%) |
| Total | 3,908 (68.1%) | 293 (7.5%) |
Employment Status by Educational Attainment in Power County
According to labor force statistics for Power County, 82.5% of individuals (2,983) out of the total population between 25 and 64 years of age (3,616) are in the labor force, with 2.3% or 69 of them being unemployed. The group with the highest labor force participation rate are those with the educational attainment of bachelor's degree or higher, with 93.1% or 394 individuals in the labor force. Within the labor force, individuals with less than high school education have the highest percentage of unemployment, with 5.6% or 26 of them being unemployed.
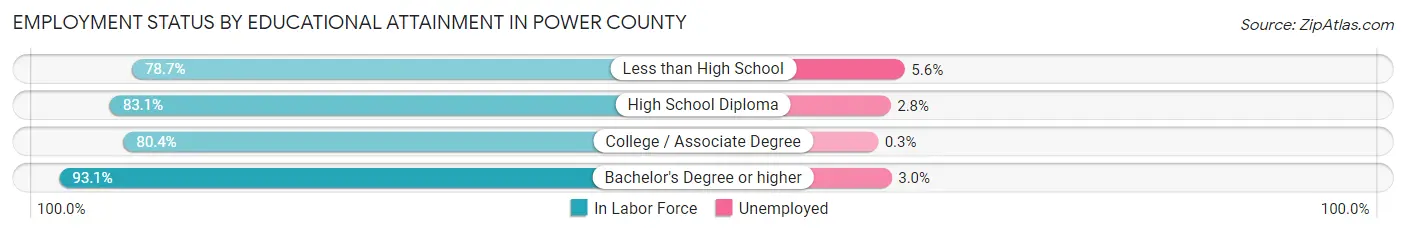
| Educational Attainment | In Labor Force | Unemployed |
| Less than High School | 466 (78.7%) | 33 (5.6%) |
| High School Diploma | 955 (83.1%) | 32 (2.8%) |
| College / Associate Degree | 1,167 (80.4%) | 4 (0.3%) |
| Bachelor's Degree or higher | 394 (93.1%) | 13 (3.0%) |
| Total | 2,983 (82.5%) | 83 (2.3%) |
Employment Occupations by Sex in Power County
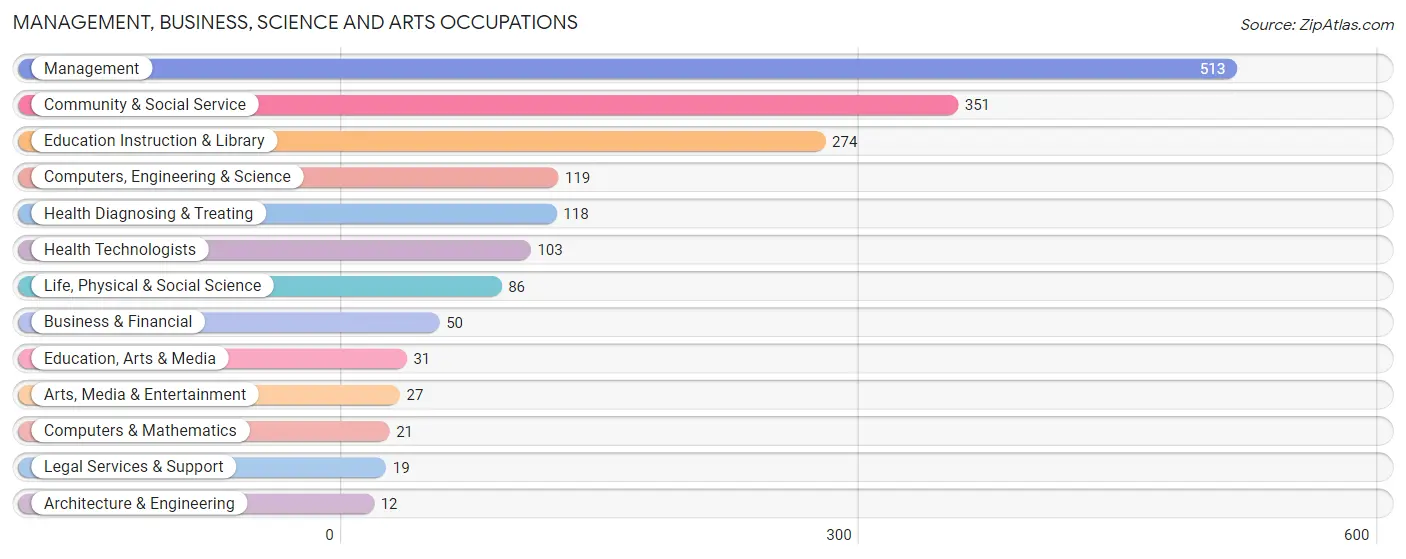
Management, Business, Science and Arts Occupations
The most common Management, Business, Science and Arts occupations in Power County are Management (513 | 14.2%), Community & Social Service (351 | 9.7%), Education Instruction & Library (274 | 7.6%), Computers, Engineering & Science (119 | 3.3%), and Health Diagnosing & Treating (118 | 3.3%).
Management, Business, Science and Arts Occupations by Sex
Within the Management, Business, Science and Arts occupations in Power County, the most male-oriented occupations are Architecture & Engineering (100.0%), Legal Services & Support (94.7%), and Management (89.1%), while the most female-oriented occupations are Education Instruction & Library (97.8%), Health Diagnosing & Treating (94.9%), and Health Technologists (94.2%).
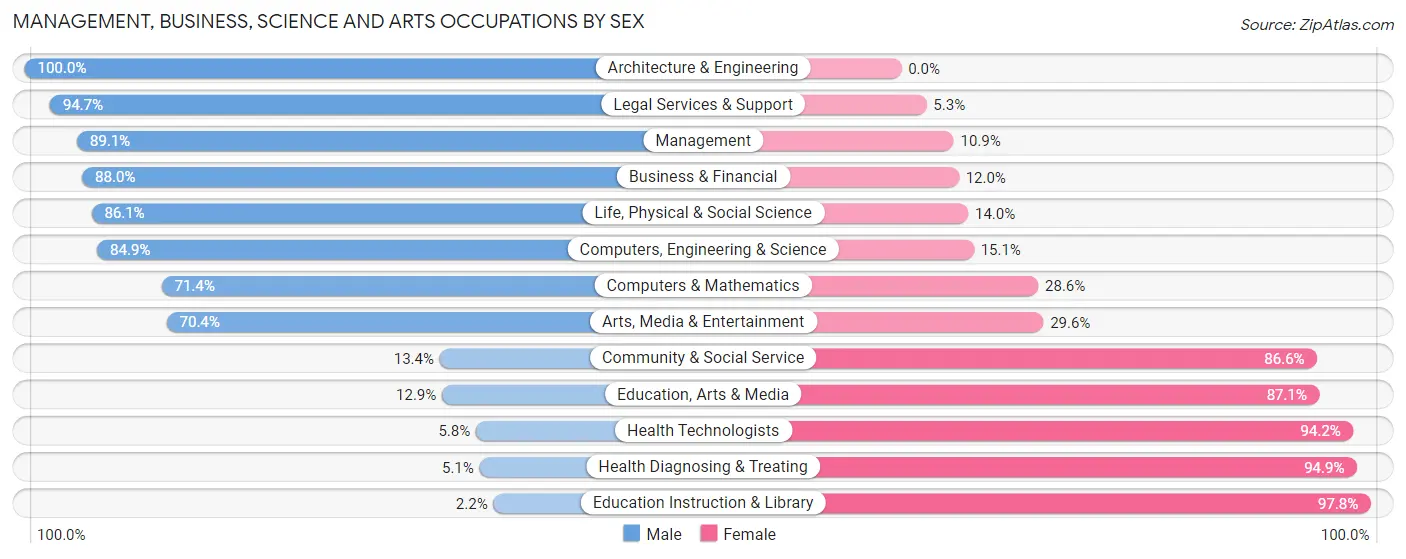
| Occupation | Male | Female |
| Management | 457 (89.1%) | 56 (10.9%) |
| Business & Financial | 44 (88.0%) | 6 (12.0%) |
| Computers, Engineering & Science | 101 (84.9%) | 18 (15.1%) |
| Computers & Mathematics | 15 (71.4%) | 6 (28.6%) |
| Architecture & Engineering | 12 (100.0%) | 0 (0.0%) |
| Life, Physical & Social Science | 74 (86.1%) | 12 (14.0%) |
| Community & Social Service | 47 (13.4%) | 304 (86.6%) |
| Education, Arts & Media | 4 (12.9%) | 27 (87.1%) |
| Legal Services & Support | 18 (94.7%) | 1 (5.3%) |
| Education Instruction & Library | 6 (2.2%) | 268 (97.8%) |
| Arts, Media & Entertainment | 19 (70.4%) | 8 (29.6%) |
| Health Diagnosing & Treating | 6 (5.1%) | 112 (94.9%) |
| Health Technologists | 6 (5.8%) | 97 (94.2%) |
| Total (Category) | 655 (56.9%) | 496 (43.1%) |
| Total (Overall) | 2,253 (62.4%) | 1,360 (37.6%) |
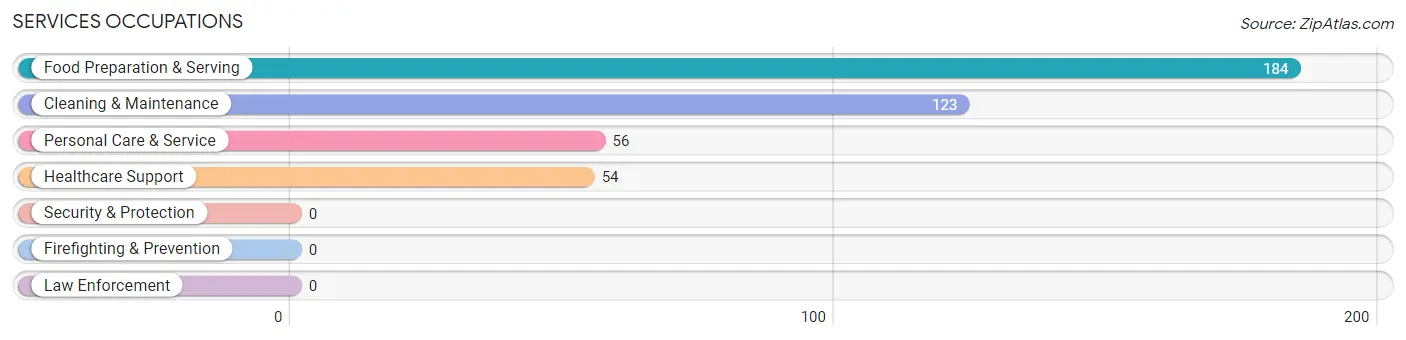
Services Occupations
The most common Services occupations in Power County are Food Preparation & Serving (184 | 5.1%), Cleaning & Maintenance (123 | 3.4%), Personal Care & Service (56 | 1.5%), and Healthcare Support (54 | 1.5%).
Services Occupations by Sex
Within the Services occupations in Power County, the most male-oriented occupations are Cleaning & Maintenance (97.6%), Healthcare Support (33.3%), and Food Preparation & Serving (19.0%), while the most female-oriented occupations are Personal Care & Service (82.1%), Food Preparation & Serving (81.0%), and Healthcare Support (66.7%).
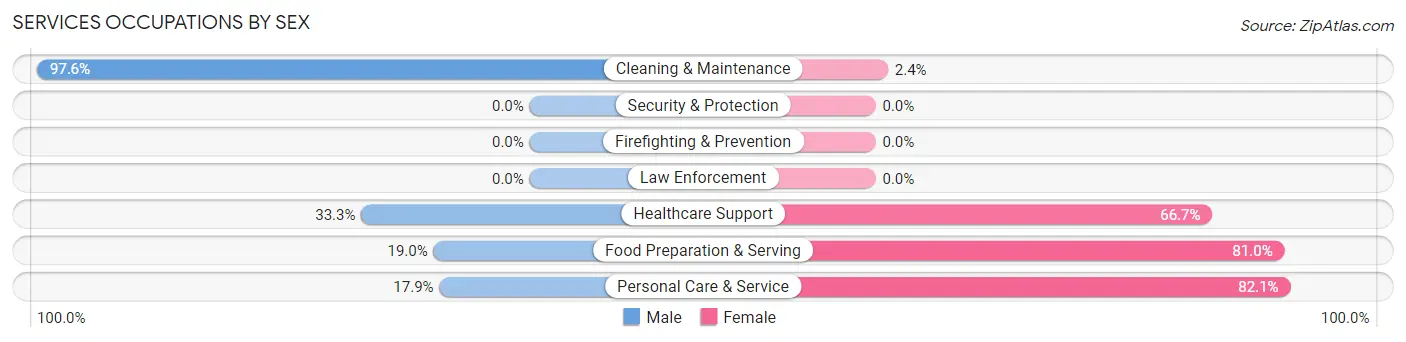
| Occupation | Male | Female |
| Healthcare Support | 18 (33.3%) | 36 (66.7%) |
| Security & Protection | 0 (0.0%) | 0 (0.0%) |
| Firefighting & Prevention | 0 (0.0%) | 0 (0.0%) |
| Law Enforcement | 0 (0.0%) | 0 (0.0%) |
| Food Preparation & Serving | 35 (19.0%) | 149 (81.0%) |
| Cleaning & Maintenance | 120 (97.6%) | 3 (2.4%) |
| Personal Care & Service | 10 (17.9%) | 46 (82.1%) |
| Total (Category) | 183 (43.9%) | 234 (56.1%) |
| Total (Overall) | 2,253 (62.4%) | 1,360 (37.6%) |
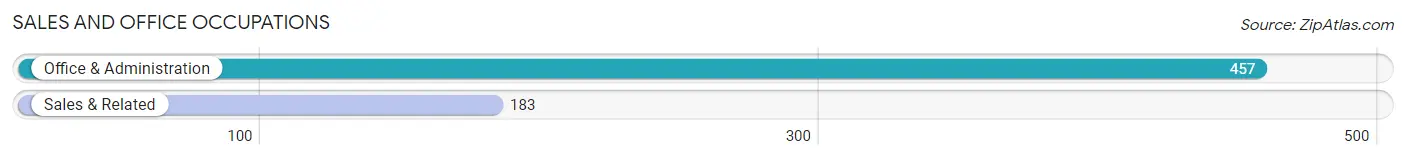
Sales and Office Occupations
The most common Sales and Office occupations in Power County are Office & Administration (457 | 12.7%), and Sales & Related (183 | 5.1%).
Sales and Office Occupations by Sex
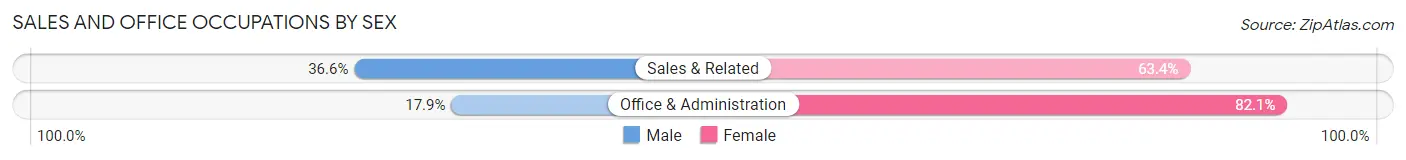
| Occupation | Male | Female |
| Sales & Related | 67 (36.6%) | 116 (63.4%) |
| Office & Administration | 82 (17.9%) | 375 (82.1%) |
| Total (Category) | 149 (23.3%) | 491 (76.7%) |
| Total (Overall) | 2,253 (62.4%) | 1,360 (37.6%) |
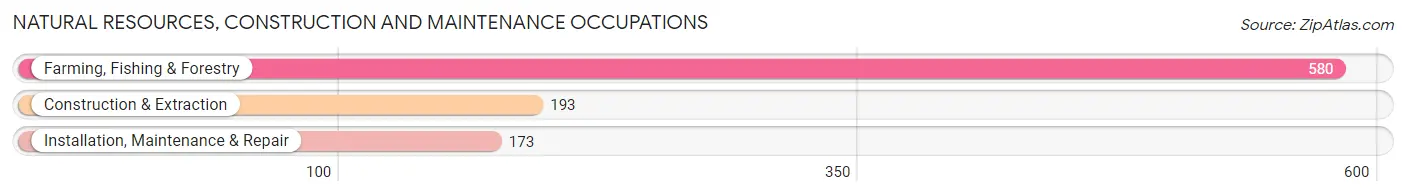
Natural Resources, Construction and Maintenance Occupations
The most common Natural Resources, Construction and Maintenance occupations in Power County are Farming, Fishing & Forestry (580 | 16.1%), Construction & Extraction (193 | 5.3%), and Installation, Maintenance & Repair (173 | 4.8%).
Natural Resources, Construction and Maintenance Occupations by Sex
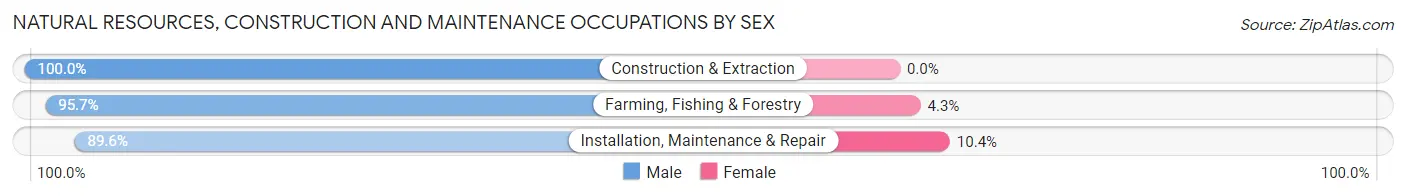
| Occupation | Male | Female |
| Farming, Fishing & Forestry | 555 (95.7%) | 25 (4.3%) |
| Construction & Extraction | 193 (100.0%) | 0 (0.0%) |
| Installation, Maintenance & Repair | 155 (89.6%) | 18 (10.4%) |
| Total (Category) | 903 (95.5%) | 43 (4.5%) |
| Total (Overall) | 2,253 (62.4%) | 1,360 (37.6%) |
Production, Transportation and Moving Occupations
The most common Production, Transportation and Moving occupations in Power County are Production (243 | 6.7%), Transportation (195 | 5.4%), and Material Moving (21 | 0.6%).

Production, Transportation and Moving Occupations by Sex
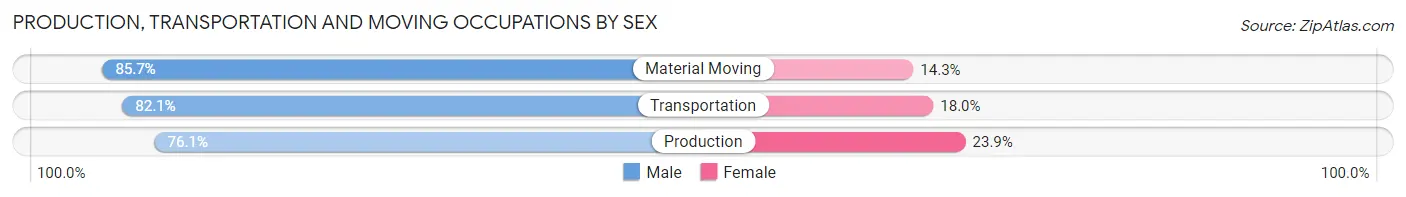
| Occupation | Male | Female |
| Production | 185 (76.1%) | 58 (23.9%) |
| Transportation | 160 (82.1%) | 35 (17.9%) |
| Material Moving | 18 (85.7%) | 3 (14.3%) |
| Total (Category) | 363 (79.1%) | 96 (20.9%) |
| Total (Overall) | 2,253 (62.4%) | 1,360 (37.6%) |
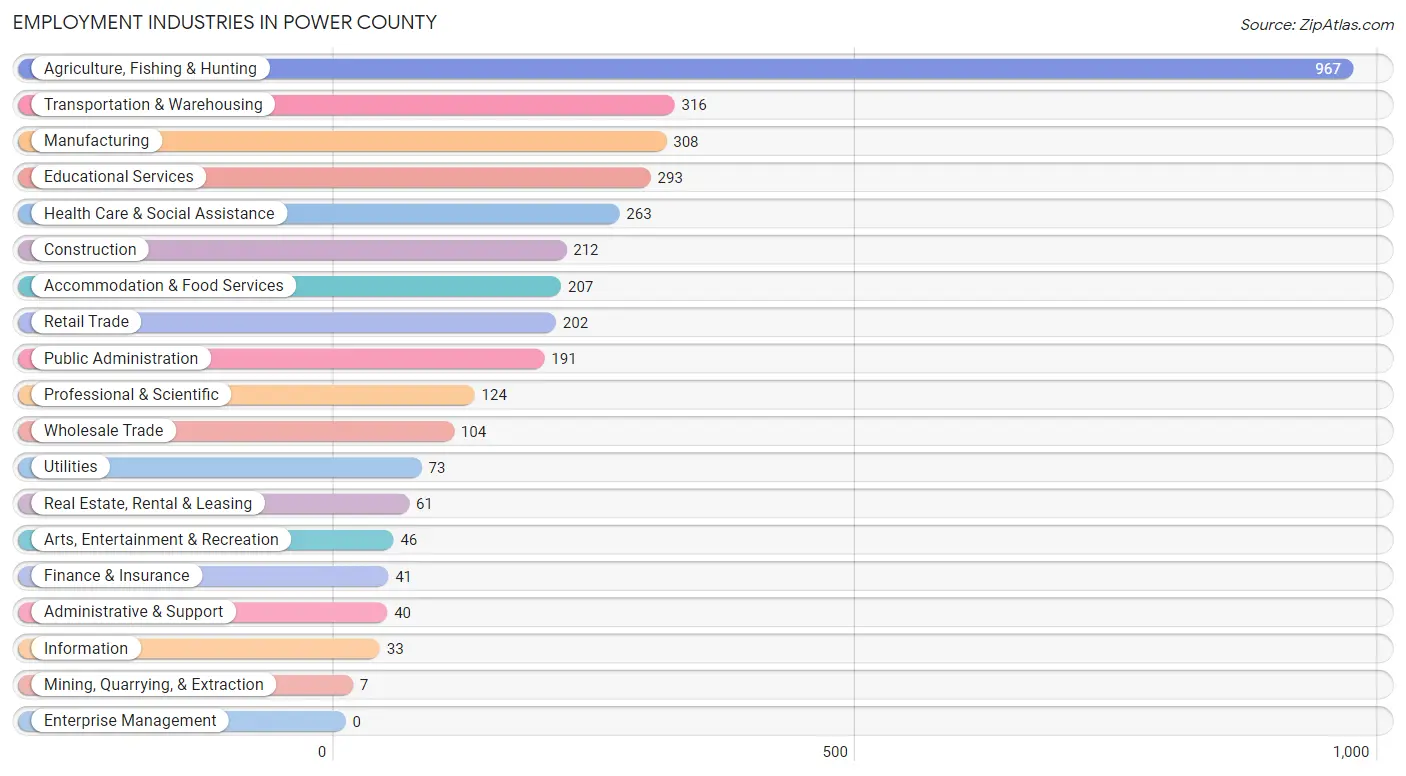
Employment Industries by Sex in Power County
Employment Industries in Power County
The major employment industries in Power County include Agriculture, Fishing & Hunting (967 | 26.8%), Transportation & Warehousing (316 | 8.7%), Manufacturing (308 | 8.5%), Educational Services (293 | 8.1%), and Health Care & Social Assistance (263 | 7.3%).
Employment Industries by Sex in Power County
The Power County industries that see more men than women are Construction (100.0%), Wholesale Trade (100.0%), and Utilities (100.0%), whereas the industries that tend to have a higher number of women are Finance & Insurance (100.0%), Health Care & Social Assistance (91.6%), and Educational Services (86.4%).
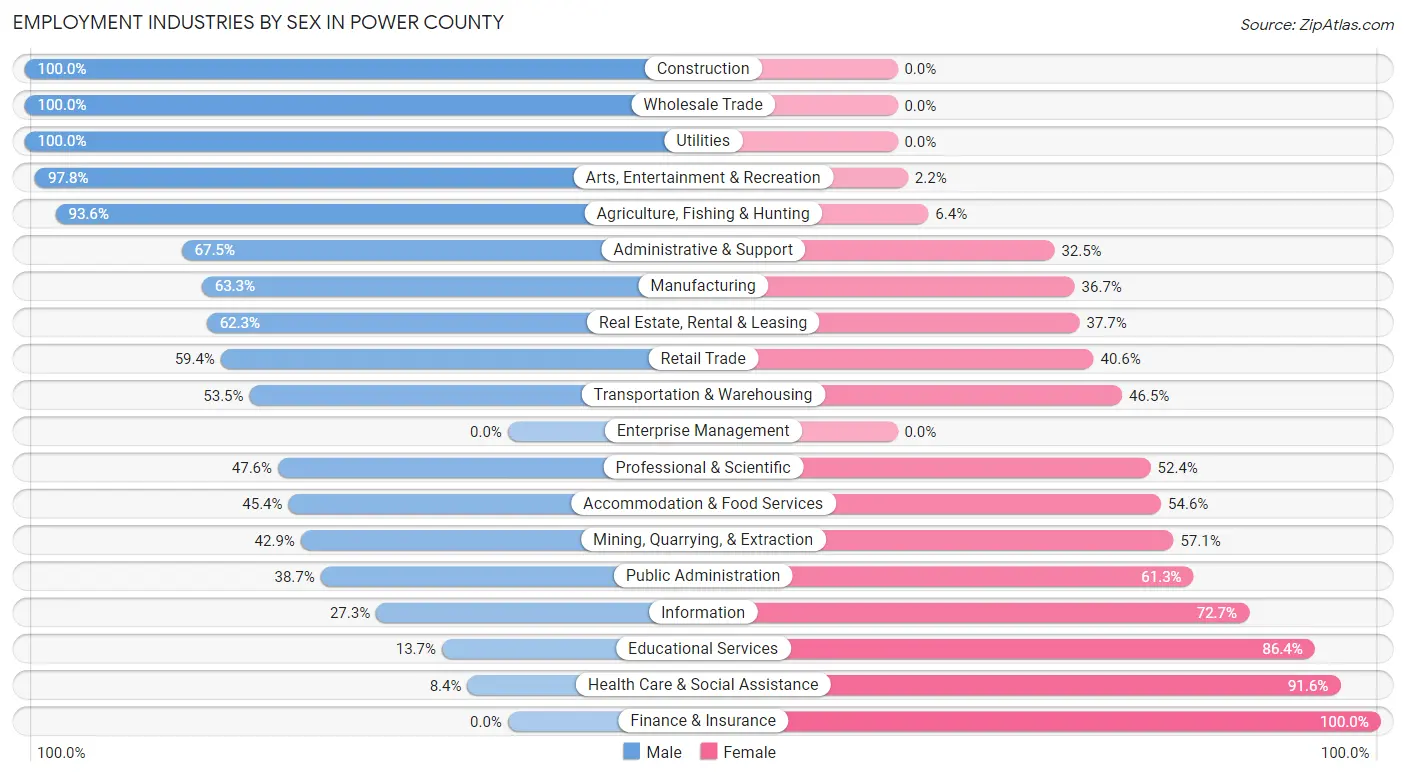
| Industry | Male | Female |
| Agriculture, Fishing & Hunting | 905 (93.6%) | 62 (6.4%) |
| Mining, Quarrying, & Extraction | 3 (42.9%) | 4 (57.1%) |
| Construction | 212 (100.0%) | 0 (0.0%) |
| Manufacturing | 195 (63.3%) | 113 (36.7%) |
| Wholesale Trade | 104 (100.0%) | 0 (0.0%) |
| Retail Trade | 120 (59.4%) | 82 (40.6%) |
| Transportation & Warehousing | 169 (53.5%) | 147 (46.5%) |
| Utilities | 73 (100.0%) | 0 (0.0%) |
| Information | 9 (27.3%) | 24 (72.7%) |
| Finance & Insurance | 0 (0.0%) | 41 (100.0%) |
| Real Estate, Rental & Leasing | 38 (62.3%) | 23 (37.7%) |
| Professional & Scientific | 59 (47.6%) | 65 (52.4%) |
| Enterprise Management | 0 (0.0%) | 0 (0.0%) |
| Administrative & Support | 27 (67.5%) | 13 (32.5%) |
| Educational Services | 40 (13.7%) | 253 (86.4%) |
| Health Care & Social Assistance | 22 (8.4%) | 241 (91.6%) |
| Arts, Entertainment & Recreation | 45 (97.8%) | 1 (2.2%) |
| Accommodation & Food Services | 94 (45.4%) | 113 (54.6%) |
| Public Administration | 74 (38.7%) | 117 (61.3%) |
| Total | 2,253 (62.4%) | 1,360 (37.6%) |
Education in Power County
School Enrollment in Power County
The most common levels of schooling among the 2,364 students in Power County are elementary school (685 | 29.0%), middle school (609 | 25.8%), and high school (495 | 20.9%).
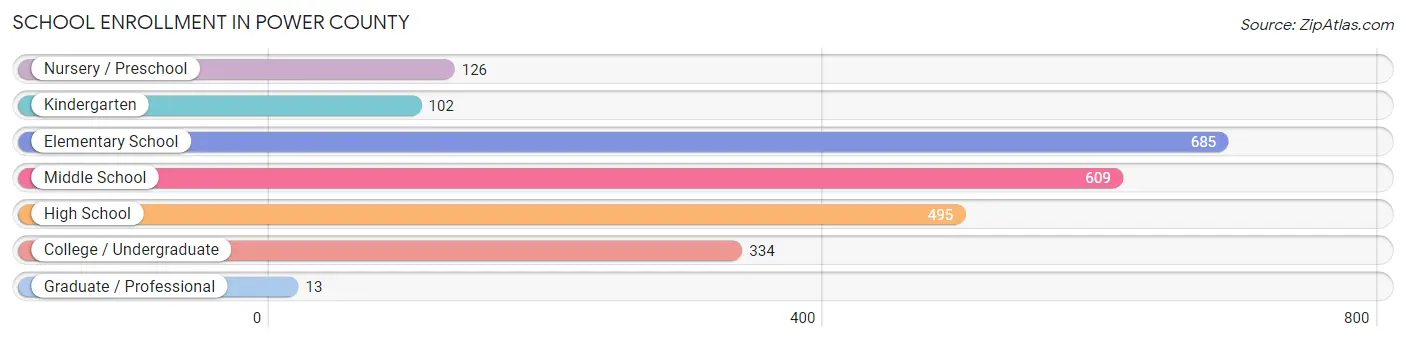
| School Level | # Students | % Students |
| Nursery / Preschool | 126 | 5.3% |
| Kindergarten | 102 | 4.3% |
| Elementary School | 685 | 29.0% |
| Middle School | 609 | 25.8% |
| High School | 495 | 20.9% |
| College / Undergraduate | 334 | 14.1% |
| Graduate / Professional | 13 | 0.5% |
| Total | 2,364 | 100.0% |
School Enrollment by Age by Funding Source in Power County
Out of a total of 2,364 students who are enrolled in schools in Power County, 61 (2.6%) attend a private institution, while the remaining 2,303 (97.4%) are enrolled in public schools. The age group of 25 to 34 year olds has the highest likelihood of being enrolled in private schools, with 4 (40.0% in the age bracket) enrolled. Conversely, the age group of 3 to 4 year olds has the lowest likelihood of being enrolled in a private school, with 126 (100.0% in the age bracket) attending a public institution.
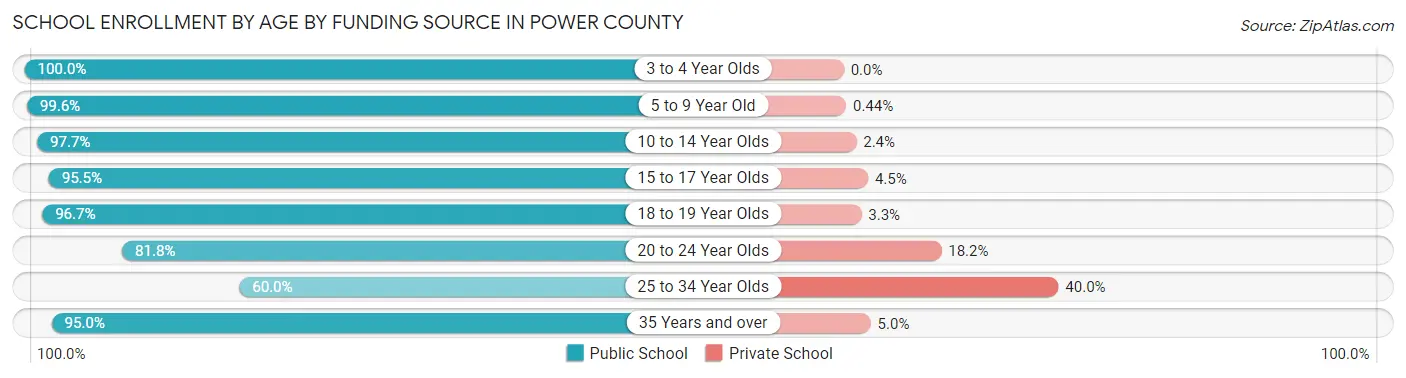
| Age Bracket | Public School | Private School |
| 3 to 4 Year Olds | 126 (100.0%) | 0 (0.0%) |
| 5 to 9 Year Old | 672 (99.6%) | 3 (0.4%) |
| 10 to 14 Year Olds | 705 (97.7%) | 17 (2.4%) |
| 15 to 17 Year Olds | 380 (95.5%) | 18 (4.5%) |
| 18 to 19 Year Olds | 235 (96.7%) | 8 (3.3%) |
| 20 to 24 Year Olds | 9 (81.8%) | 2 (18.2%) |
| 25 to 34 Year Olds | 6 (60.0%) | 4 (40.0%) |
| 35 Years and over | 170 (95.0%) | 9 (5.0%) |
| Total | 2,303 (97.4%) | 61 (2.6%) |
Educational Attainment by Field of Study in Power County
Education (184 | 25.4%), bio, nature & agricultural (107 | 14.8%), business (95 | 13.1%), science & technology (83 | 11.5%), and arts & humanities (63 | 8.7%) are the most common fields of study among 724 individuals in Power County who have obtained a bachelor's degree or higher.
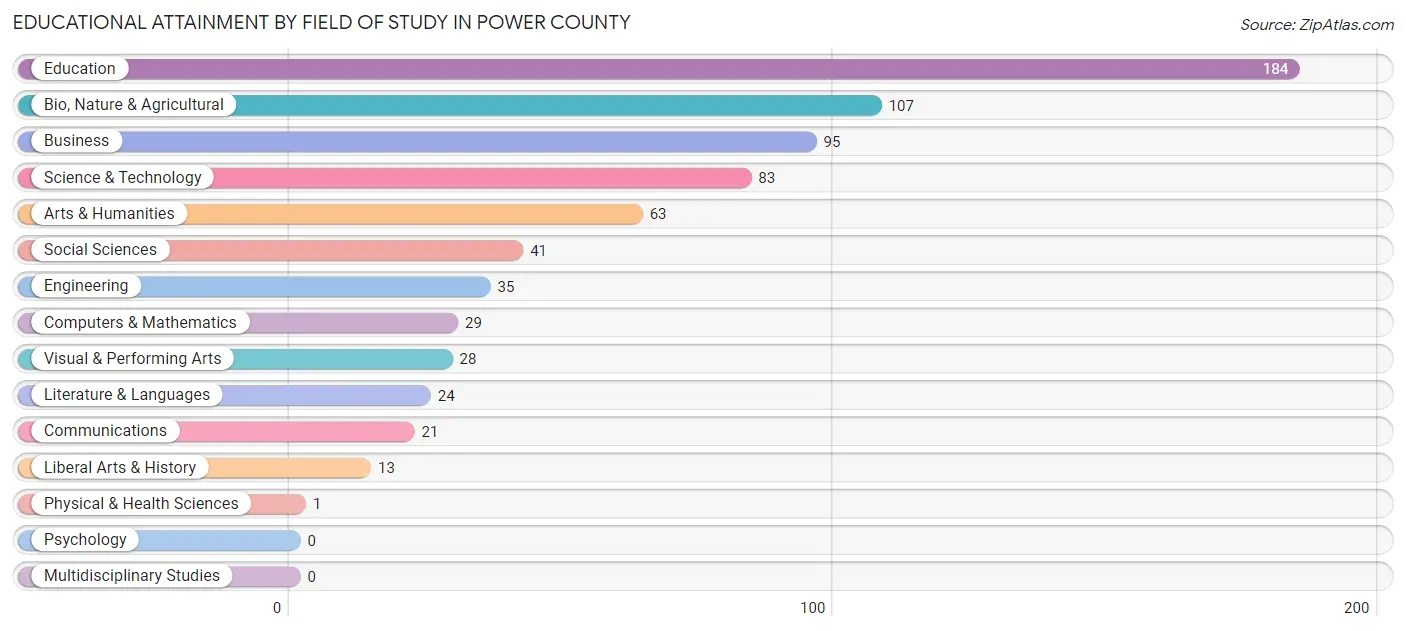
| Field of Study | # Graduates | % Graduates |
| Computers & Mathematics | 29 | 4.0% |
| Bio, Nature & Agricultural | 107 | 14.8% |
| Physical & Health Sciences | 1 | 0.1% |
| Psychology | 0 | 0.0% |
| Social Sciences | 41 | 5.7% |
| Engineering | 35 | 4.8% |
| Multidisciplinary Studies | 0 | 0.0% |
| Science & Technology | 83 | 11.5% |
| Business | 95 | 13.1% |
| Education | 184 | 25.4% |
| Literature & Languages | 24 | 3.3% |
| Liberal Arts & History | 13 | 1.8% |
| Visual & Performing Arts | 28 | 3.9% |
| Communications | 21 | 2.9% |
| Arts & Humanities | 63 | 8.7% |
| Total | 724 | 100.0% |
Transportation & Commute in Power County
Vehicle Availability by Sex in Power County
The most prevalent vehicle ownership categories in Power County are males with 3 vehicles (698, accounting for 31.2%) and females with 3 vehicles (358, making up 54.1%).
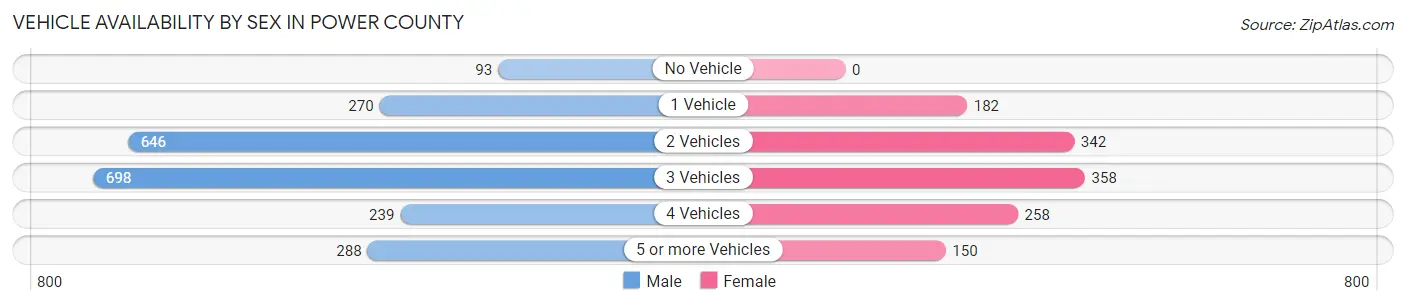
| Vehicles Available | Male | Female |
| No Vehicle | 93 (4.2%) | 0 (0.0%) |
| 1 Vehicle | 270 (12.1%) | 182 (14.1%) |
| 2 Vehicles | 646 (28.9%) | 342 (26.5%) |
| 3 Vehicles | 698 (31.2%) | 358 (27.8%) |
| 4 Vehicles | 239 (10.7%) | 258 (20.0%) |
| 5 or more Vehicles | 288 (12.9%) | 150 (11.6%) |
| Total | 2,234 (100.0%) | 1,290 (100.0%) |
Commute Time in Power County
The most frequently occuring commute durations in Power County are 5 to 9 minutes (692 commuters, 21.2%), 10 to 14 minutes (549 commuters, 16.8%), and 30 to 34 minutes (418 commuters, 12.8%).
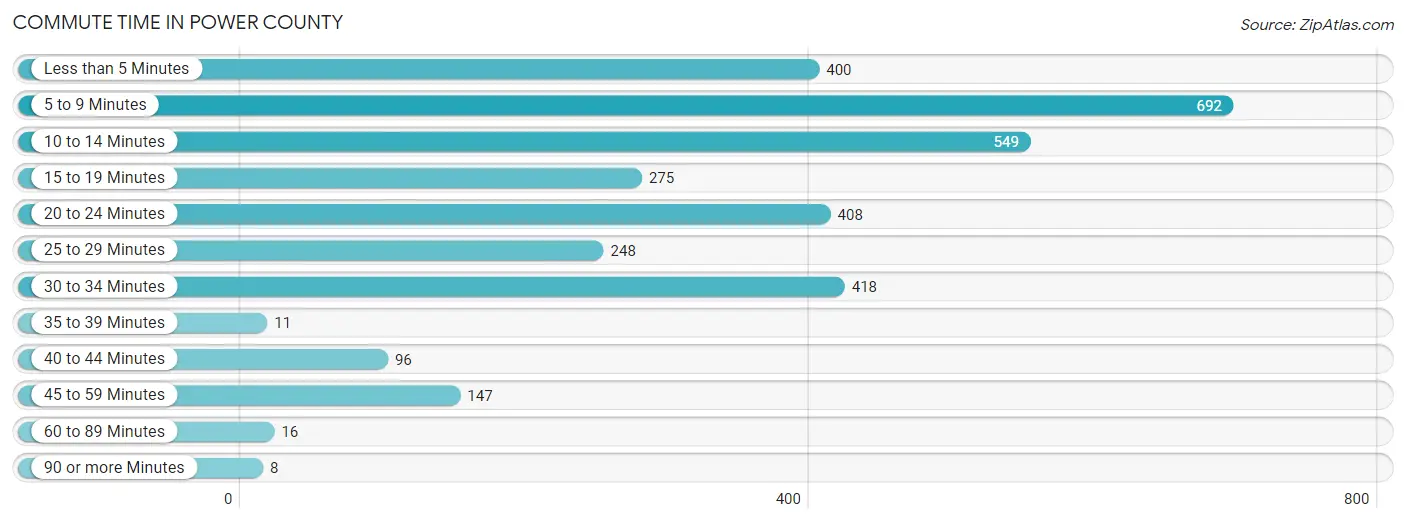
| Commute Time | # Commuters | % Commuters |
| Less than 5 Minutes | 400 | 12.2% |
| 5 to 9 Minutes | 692 | 21.2% |
| 10 to 14 Minutes | 549 | 16.8% |
| 15 to 19 Minutes | 275 | 8.4% |
| 20 to 24 Minutes | 408 | 12.5% |
| 25 to 29 Minutes | 248 | 7.6% |
| 30 to 34 Minutes | 418 | 12.8% |
| 35 to 39 Minutes | 11 | 0.3% |
| 40 to 44 Minutes | 96 | 2.9% |
| 45 to 59 Minutes | 147 | 4.5% |
| 60 to 89 Minutes | 16 | 0.5% |
| 90 or more Minutes | 8 | 0.2% |
Commute Time by Sex in Power County
The most common commute times in Power County are 5 to 9 minutes (392 commuters, 18.9%) for males and 5 to 9 minutes (300 commuters, 25.3%) for females.
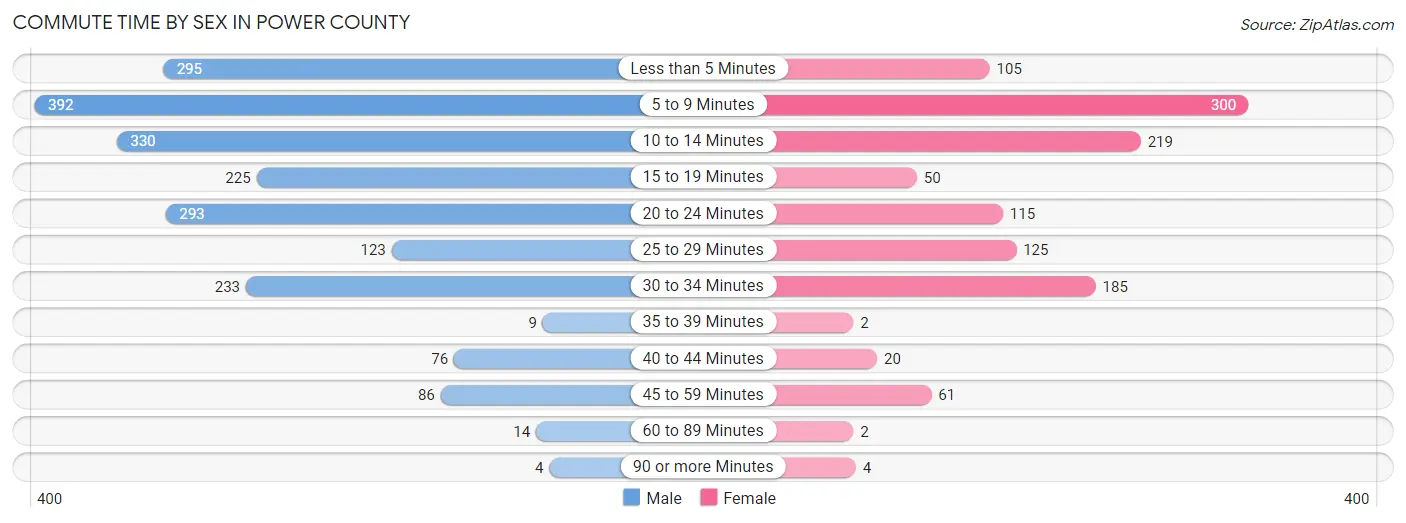
| Commute Time | Male | Female |
| Less than 5 Minutes | 295 (14.2%) | 105 (8.8%) |
| 5 to 9 Minutes | 392 (18.9%) | 300 (25.3%) |
| 10 to 14 Minutes | 330 (15.9%) | 219 (18.4%) |
| 15 to 19 Minutes | 225 (10.8%) | 50 (4.2%) |
| 20 to 24 Minutes | 293 (14.1%) | 115 (9.7%) |
| 25 to 29 Minutes | 123 (5.9%) | 125 (10.5%) |
| 30 to 34 Minutes | 233 (11.2%) | 185 (15.6%) |
| 35 to 39 Minutes | 9 (0.4%) | 2 (0.2%) |
| 40 to 44 Minutes | 76 (3.6%) | 20 (1.7%) |
| 45 to 59 Minutes | 86 (4.1%) | 61 (5.1%) |
| 60 to 89 Minutes | 14 (0.7%) | 2 (0.2%) |
| 90 or more Minutes | 4 (0.2%) | 4 (0.3%) |
Time of Departure to Work by Sex in Power County
The most frequent times of departure to work in Power County are 7:00 AM to 7:29 AM (413, 19.9%) for males and 8:00 AM to 8:29 AM (218, 18.3%) for females.
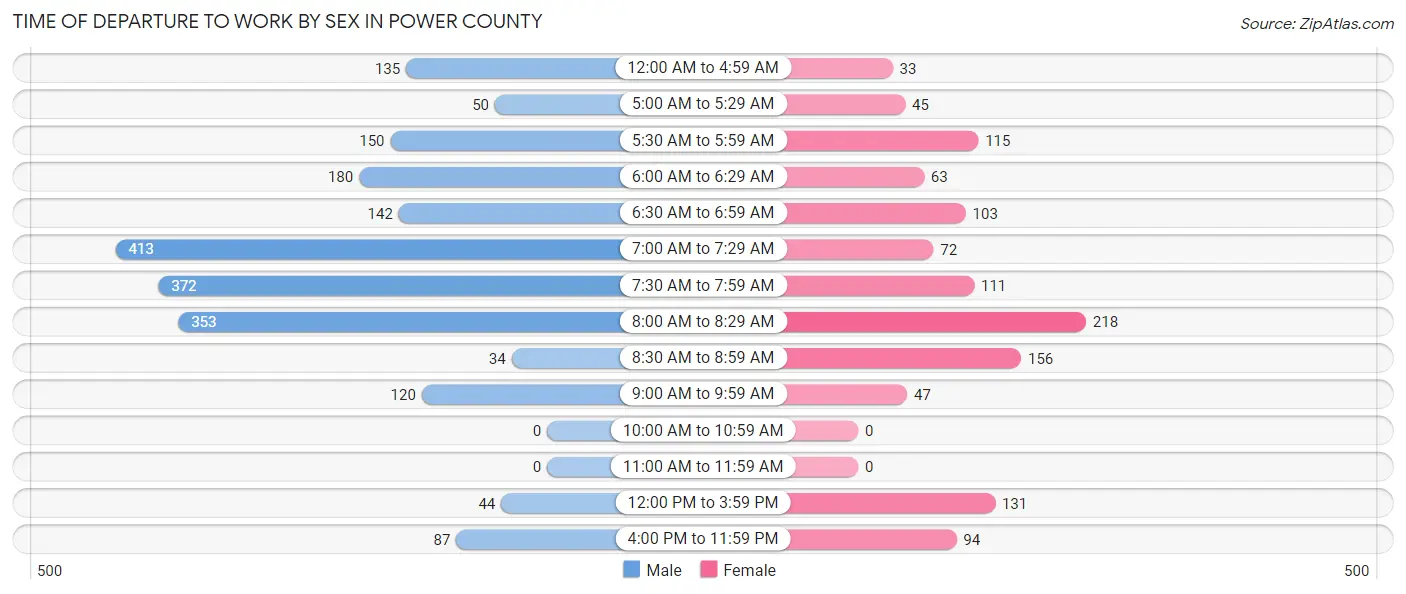
| Time of Departure | Male | Female |
| 12:00 AM to 4:59 AM | 135 (6.5%) | 33 (2.8%) |
| 5:00 AM to 5:29 AM | 50 (2.4%) | 45 (3.8%) |
| 5:30 AM to 5:59 AM | 150 (7.2%) | 115 (9.7%) |
| 6:00 AM to 6:29 AM | 180 (8.6%) | 63 (5.3%) |
| 6:30 AM to 6:59 AM | 142 (6.8%) | 103 (8.7%) |
| 7:00 AM to 7:29 AM | 413 (19.9%) | 72 (6.1%) |
| 7:30 AM to 7:59 AM | 372 (17.9%) | 111 (9.3%) |
| 8:00 AM to 8:29 AM | 353 (17.0%) | 218 (18.3%) |
| 8:30 AM to 8:59 AM | 34 (1.6%) | 156 (13.1%) |
| 9:00 AM to 9:59 AM | 120 (5.8%) | 47 (4.0%) |
| 10:00 AM to 10:59 AM | 0 (0.0%) | 0 (0.0%) |
| 11:00 AM to 11:59 AM | 0 (0.0%) | 0 (0.0%) |
| 12:00 PM to 3:59 PM | 44 (2.1%) | 131 (11.0%) |
| 4:00 PM to 11:59 PM | 87 (4.2%) | 94 (7.9%) |
| Total | 2,080 (100.0%) | 1,188 (100.0%) |
Housing Occupancy in Power County
Occupancy by Ownership in Power County
Of the total 2,671 dwellings in Power County, owner-occupied units account for 1,898 (71.1%), while renter-occupied units make up 773 (28.9%).
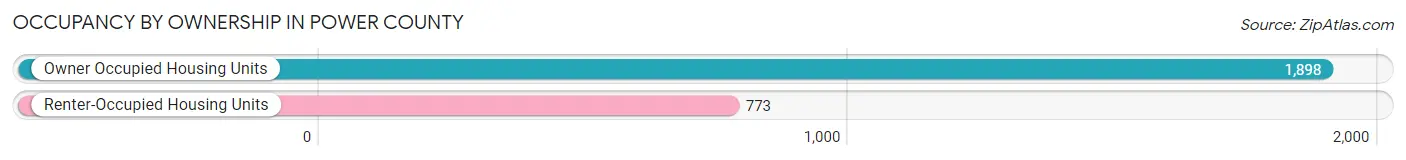
| Occupancy | # Housing Units | % Housing Units |
| Owner Occupied Housing Units | 1,898 | 71.1% |
| Renter-Occupied Housing Units | 773 | 28.9% |
| Total Occupied Housing Units | 2,671 | 100.0% |
Occupancy by Household Size in Power County
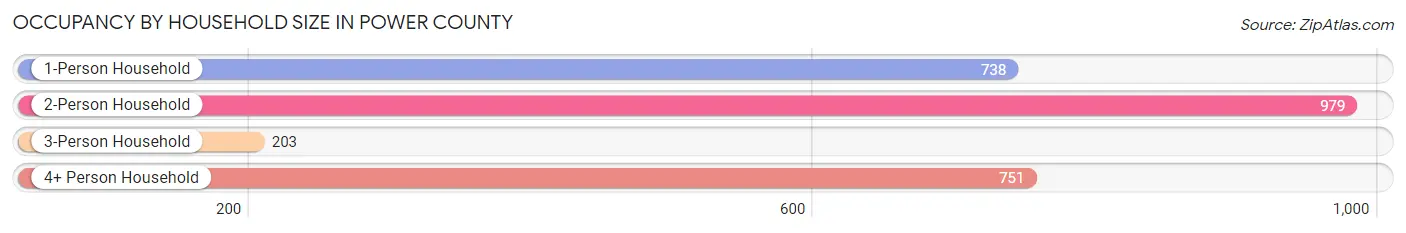
| Household Size | # Housing Units | % Housing Units |
| 1-Person Household | 738 | 27.6% |
| 2-Person Household | 979 | 36.6% |
| 3-Person Household | 203 | 7.6% |
| 4+ Person Household | 751 | 28.1% |
| Total Housing Units | 2,671 | 100.0% |
Occupancy by Ownership by Household Size in Power County

| Household Size | Owner-occupied | Renter-occupied |
| 1-Person Household | 365 (49.5%) | 373 (50.5%) |
| 2-Person Household | 775 (79.2%) | 204 (20.8%) |
| 3-Person Household | 133 (65.5%) | 70 (34.5%) |
| 4+ Person Household | 625 (83.2%) | 126 (16.8%) |
| Total Housing Units | 1,898 (71.1%) | 773 (28.9%) |
Occupancy by Educational Attainment in Power County
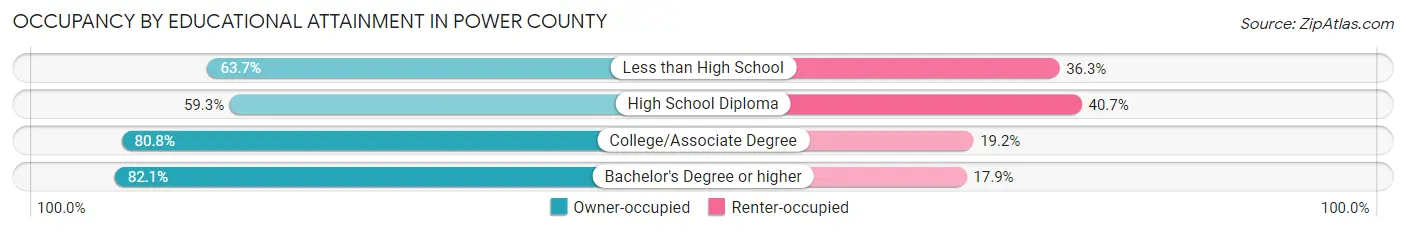
| Household Size | Owner-occupied | Renter-occupied |
| Less than High School | 230 (63.7%) | 131 (36.3%) |
| High School Diploma | 559 (59.3%) | 384 (40.7%) |
| College/Associate Degree | 806 (80.8%) | 192 (19.2%) |
| Bachelor's Degree or higher | 303 (82.1%) | 66 (17.9%) |
Occupancy by Age of Householder in Power County
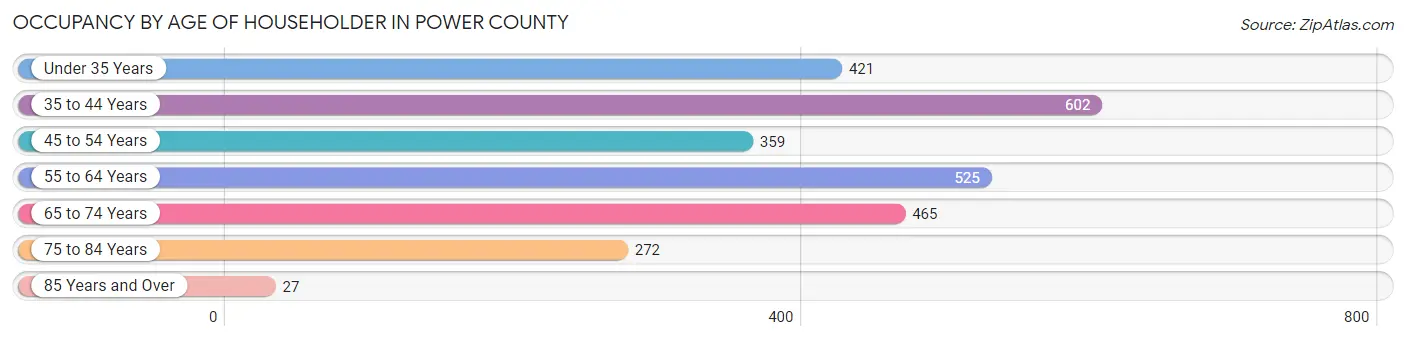
| Age Bracket | # Households | % Households |
| Under 35 Years | 421 | 15.8% |
| 35 to 44 Years | 602 | 22.5% |
| 45 to 54 Years | 359 | 13.4% |
| 55 to 64 Years | 525 | 19.7% |
| 65 to 74 Years | 465 | 17.4% |
| 75 to 84 Years | 272 | 10.2% |
| 85 Years and Over | 27 | 1.0% |
| Total | 2,671 | 100.0% |
Housing Finances in Power County
Median Income by Occupancy in Power County
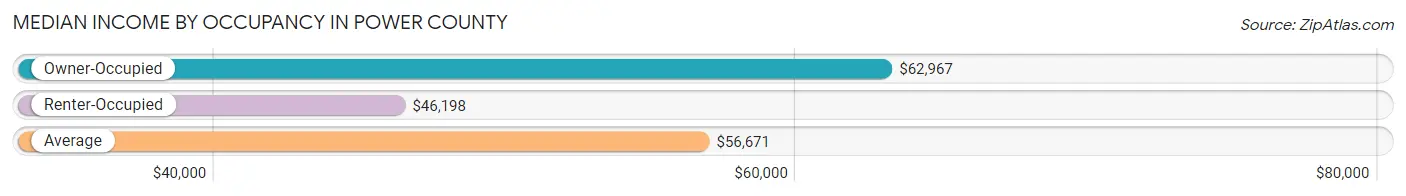
| Occupancy Type | # Households | Median Income |
| Owner-Occupied | 1,898 (71.1%) | $62,967 |
| Renter-Occupied | 773 (28.9%) | $46,198 |
| Average | 2,671 (100.0%) | $56,671 |
Occupancy by Householder Income Bracket in Power County
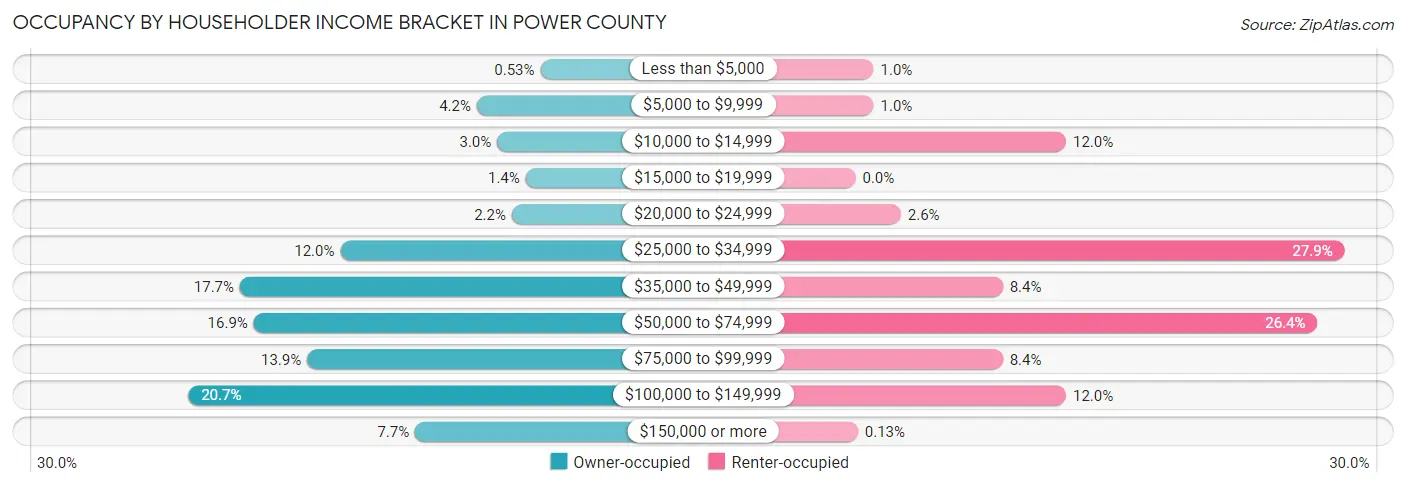
| Income Bracket | Owner-occupied | Renter-occupied |
| Less than $5,000 | 10 (0.5%) | 8 (1.0%) |
| $5,000 to $9,999 | 79 (4.2%) | 8 (1.0%) |
| $10,000 to $14,999 | 57 (3.0%) | 93 (12.0%) |
| $15,000 to $19,999 | 26 (1.4%) | 0 (0.0%) |
| $20,000 to $24,999 | 41 (2.2%) | 20 (2.6%) |
| $25,000 to $34,999 | 227 (12.0%) | 216 (27.9%) |
| $35,000 to $49,999 | 336 (17.7%) | 65 (8.4%) |
| $50,000 to $74,999 | 321 (16.9%) | 204 (26.4%) |
| $75,000 to $99,999 | 263 (13.9%) | 65 (8.4%) |
| $100,000 to $149,999 | 392 (20.6%) | 93 (12.0%) |
| $150,000 or more | 146 (7.7%) | 1 (0.1%) |
| Total | 1,898 (100.0%) | 773 (100.0%) |
Monthly Housing Cost Tiers in Power County
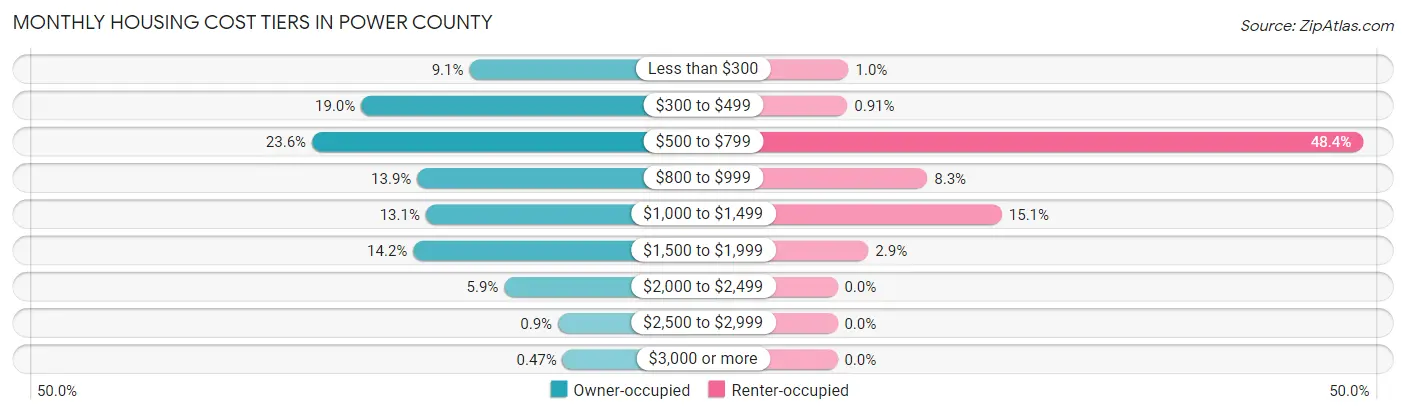
| Monthly Cost | Owner-occupied | Renter-occupied |
| Less than $300 | 172 (9.1%) | 8 (1.0%) |
| $300 to $499 | 361 (19.0%) | 7 (0.9%) |
| $500 to $799 | 447 (23.5%) | 374 (48.4%) |
| $800 to $999 | 263 (13.9%) | 64 (8.3%) |
| $1,000 to $1,499 | 248 (13.1%) | 117 (15.1%) |
| $1,500 to $1,999 | 270 (14.2%) | 22 (2.9%) |
| $2,000 to $2,499 | 111 (5.9%) | 0 (0.0%) |
| $2,500 to $2,999 | 17 (0.9%) | 0 (0.0%) |
| $3,000 or more | 9 (0.5%) | 0 (0.0%) |
| Total | 1,898 (100.0%) | 773 (100.0%) |
Physical Housing Characteristics in Power County
Housing Structures in Power County
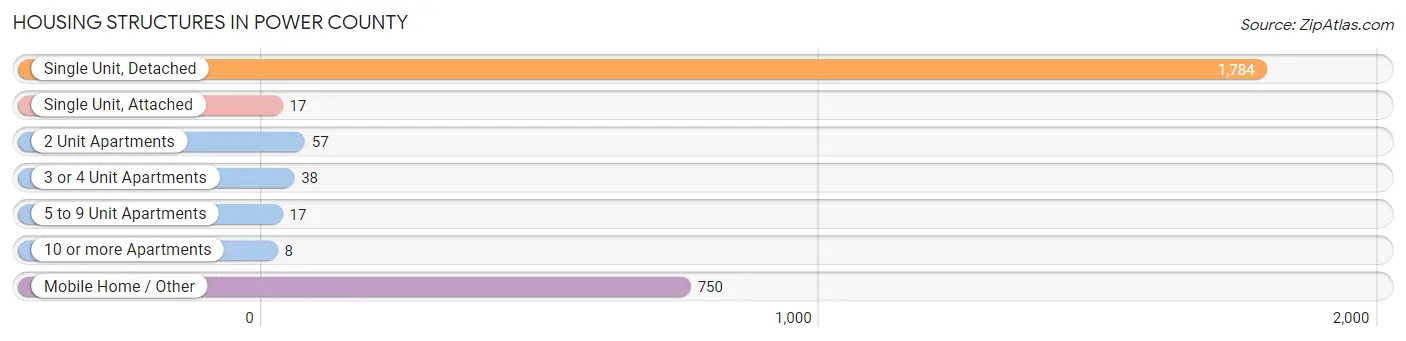
| Structure Type | # Housing Units | % Housing Units |
| Single Unit, Detached | 1,784 | 66.8% |
| Single Unit, Attached | 17 | 0.6% |
| 2 Unit Apartments | 57 | 2.1% |
| 3 or 4 Unit Apartments | 38 | 1.4% |
| 5 to 9 Unit Apartments | 17 | 0.6% |
| 10 or more Apartments | 8 | 0.3% |
| Mobile Home / Other | 750 | 28.1% |
| Total | 2,671 | 100.0% |
Housing Structures by Occupancy in Power County
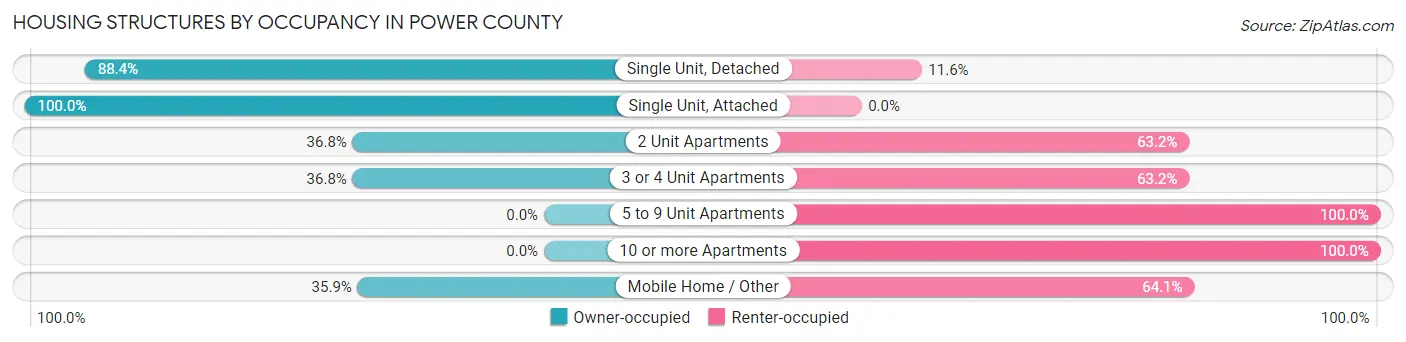
| Structure Type | Owner-occupied | Renter-occupied |
| Single Unit, Detached | 1,577 (88.4%) | 207 (11.6%) |
| Single Unit, Attached | 17 (100.0%) | 0 (0.0%) |
| 2 Unit Apartments | 21 (36.8%) | 36 (63.2%) |
| 3 or 4 Unit Apartments | 14 (36.8%) | 24 (63.2%) |
| 5 to 9 Unit Apartments | 0 (0.0%) | 17 (100.0%) |
| 10 or more Apartments | 0 (0.0%) | 8 (100.0%) |
| Mobile Home / Other | 269 (35.9%) | 481 (64.1%) |
| Total | 1,898 (71.1%) | 773 (28.9%) |
Housing Structures by Number of Rooms in Power County
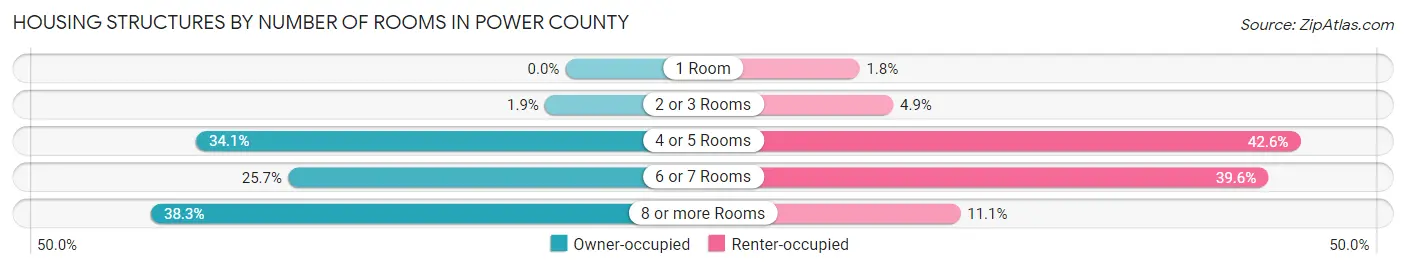
| Number of Rooms | Owner-occupied | Renter-occupied |
| 1 Room | 0 (0.0%) | 14 (1.8%) |
| 2 or 3 Rooms | 36 (1.9%) | 38 (4.9%) |
| 4 or 5 Rooms | 648 (34.1%) | 329 (42.6%) |
| 6 or 7 Rooms | 487 (25.7%) | 306 (39.6%) |
| 8 or more Rooms | 727 (38.3%) | 86 (11.1%) |
| Total | 1,898 (100.0%) | 773 (100.0%) |
Housing Structure by Heating Type in Power County
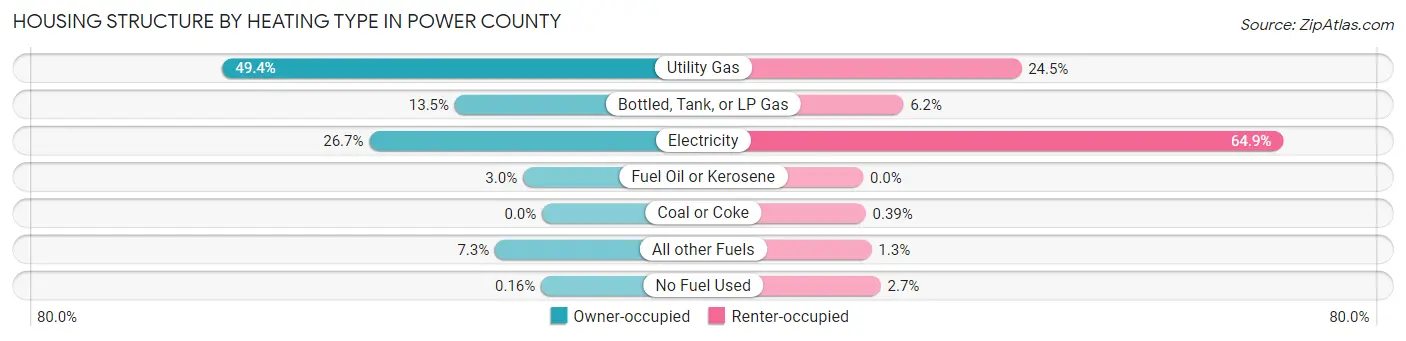
| Heating Type | Owner-occupied | Renter-occupied |
| Utility Gas | 938 (49.4%) | 189 (24.4%) |
| Bottled, Tank, or LP Gas | 256 (13.5%) | 48 (6.2%) |
| Electricity | 507 (26.7%) | 502 (64.9%) |
| Fuel Oil or Kerosene | 56 (2.9%) | 0 (0.0%) |
| Coal or Coke | 0 (0.0%) | 3 (0.4%) |
| All other Fuels | 138 (7.3%) | 10 (1.3%) |
| No Fuel Used | 3 (0.2%) | 21 (2.7%) |
| Total | 1,898 (100.0%) | 773 (100.0%) |
Household Vehicle Usage in Power County
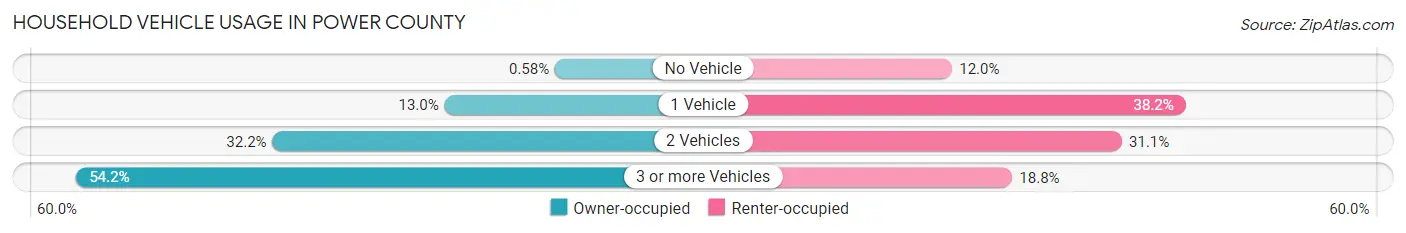
| Vehicles per Household | Owner-occupied | Renter-occupied |
| No Vehicle | 11 (0.6%) | 93 (12.0%) |
| 1 Vehicle | 246 (13.0%) | 295 (38.2%) |
| 2 Vehicles | 612 (32.2%) | 240 (31.0%) |
| 3 or more Vehicles | 1,029 (54.2%) | 145 (18.8%) |
| Total | 1,898 (100.0%) | 773 (100.0%) |
Real Estate & Mortgages in Power County
Real Estate and Mortgage Overview in Power County
| Characteristic | Without Mortgage | With Mortgage |
| Housing Units | 845 | 1,053 |
| Median Property Value | $144,500 | $206,600 |
| Median Household Income | $51,321 | $104 |
| Monthly Housing Costs | $431 | $7 |
| Real Estate Taxes | $1,512 | $7 |
Property Value by Mortgage Status in Power County
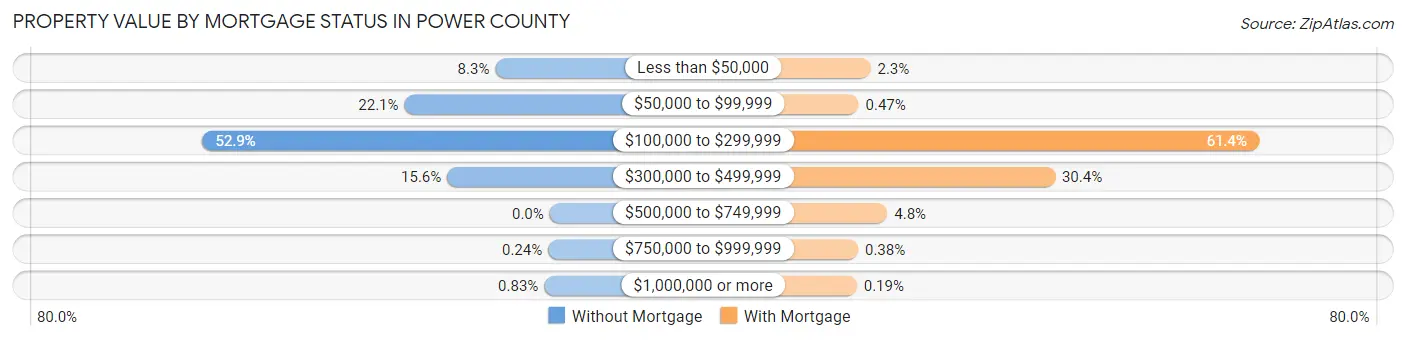
| Property Value | Without Mortgage | With Mortgage |
| Less than $50,000 | 70 (8.3%) | 24 (2.3%) |
| $50,000 to $99,999 | 187 (22.1%) | 5 (0.5%) |
| $100,000 to $299,999 | 447 (52.9%) | 647 (61.4%) |
| $300,000 to $499,999 | 132 (15.6%) | 320 (30.4%) |
| $500,000 to $749,999 | 0 (0.0%) | 51 (4.8%) |
| $750,000 to $999,999 | 2 (0.2%) | 4 (0.4%) |
| $1,000,000 or more | 7 (0.8%) | 2 (0.2%) |
| Total | 845 (100.0%) | 1,053 (100.0%) |
Household Income by Mortgage Status in Power County
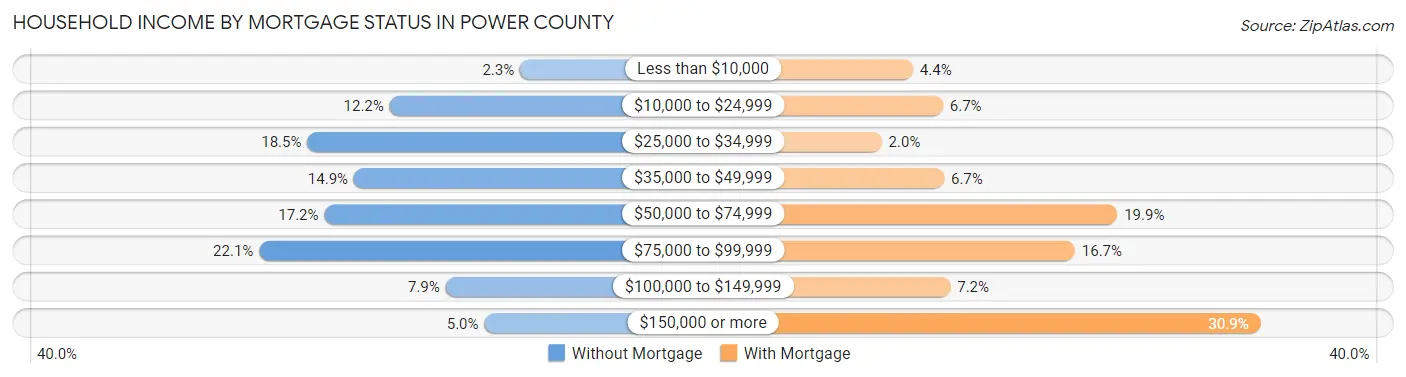
| Household Income | Without Mortgage | With Mortgage |
| Less than $10,000 | 19 (2.2%) | 46 (4.4%) |
| $10,000 to $24,999 | 103 (12.2%) | 70 (6.7%) |
| $25,000 to $34,999 | 156 (18.5%) | 21 (2.0%) |
| $35,000 to $49,999 | 126 (14.9%) | 71 (6.7%) |
| $50,000 to $74,999 | 145 (17.2%) | 210 (19.9%) |
| $75,000 to $99,999 | 187 (22.1%) | 176 (16.7%) |
| $100,000 to $149,999 | 67 (7.9%) | 76 (7.2%) |
| $150,000 or more | 42 (5.0%) | 325 (30.9%) |
| Total | 845 (100.0%) | 1,053 (100.0%) |
Property Value to Household Income Ratio in Power County
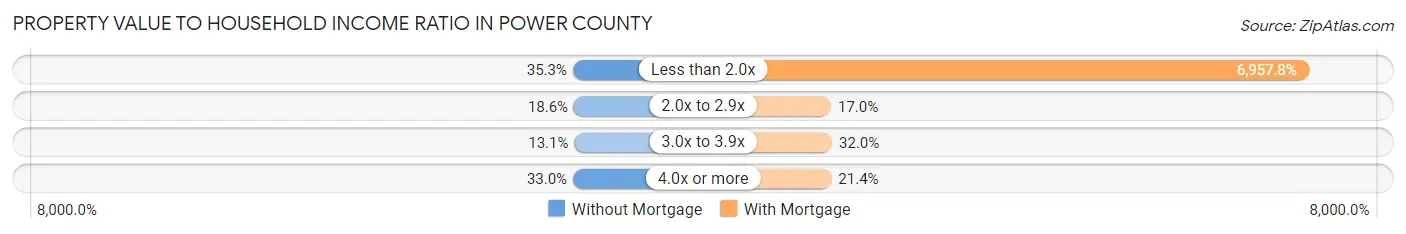
| Value-to-Income Ratio | Without Mortgage | With Mortgage |
| Less than 2.0x | 298 (35.3%) | 73,266 (6,957.8%) |
| 2.0x to 2.9x | 157 (18.6%) | 179 (17.0%) |
| 3.0x to 3.9x | 111 (13.1%) | 337 (32.0%) |
| 4.0x or more | 279 (33.0%) | 225 (21.4%) |
| Total | 845 (100.0%) | 1,053 (100.0%) |
Real Estate Taxes by Mortgage Status in Power County
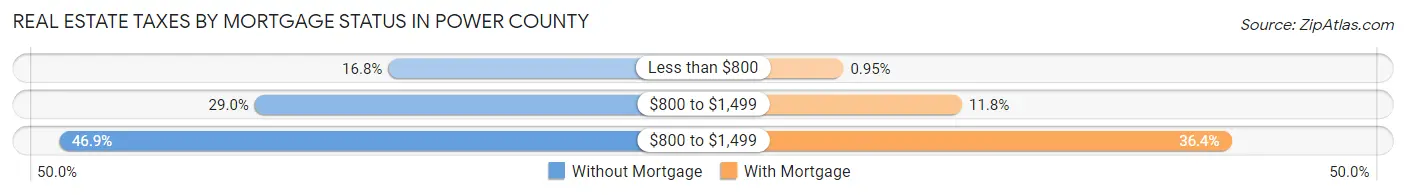
| Property Taxes | Without Mortgage | With Mortgage |
| Less than $800 | 142 (16.8%) | 10 (0.9%) |
| $800 to $1,499 | 245 (29.0%) | 124 (11.8%) |
| $800 to $1,499 | 396 (46.9%) | 383 (36.4%) |
| Total | 845 (100.0%) | 1,053 (100.0%) |
Health & Disability in Power County
Health Insurance Coverage by Age in Power County

| Age Bracket | With Coverage | Without Coverage |
| Under 6 Years | 579 (97.2%) | 17 (2.9%) |
| 6 to 18 Years | 1,713 (83.3%) | 344 (16.7%) |
| 19 to 25 Years | 385 (77.1%) | 114 (22.9%) |
| 26 to 34 Years | 539 (72.7%) | 202 (27.3%) |
| 35 to 44 Years | 806 (82.6%) | 170 (17.4%) |
| 45 to 54 Years | 715 (88.4%) | 94 (11.6%) |
| 55 to 64 Years | 783 (79.7%) | 199 (20.3%) |
| 65 to 74 Years | 740 (100.0%) | 0 (0.0%) |
| 75 Years and older | 449 (100.0%) | 0 (0.0%) |
| Total | 6,709 (85.5%) | 1,140 (14.5%) |
Health Insurance Coverage by Citizenship Status in Power County
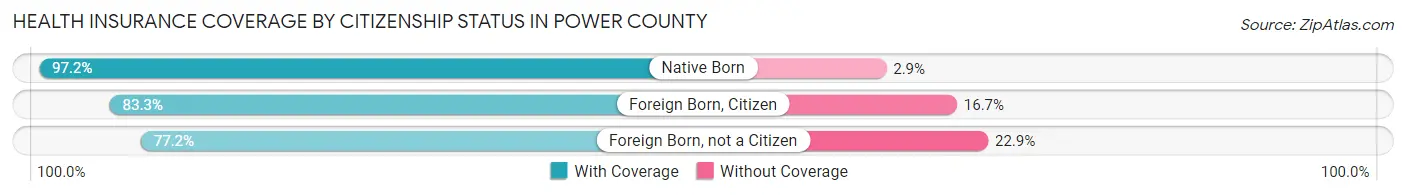
| Citizenship Status | With Coverage | Without Coverage |
| Native Born | 579 (97.2%) | 17 (2.9%) |
| Foreign Born, Citizen | 1,713 (83.3%) | 344 (16.7%) |
| Foreign Born, not a Citizen | 385 (77.1%) | 114 (22.9%) |
Health Insurance Coverage by Household Income in Power County
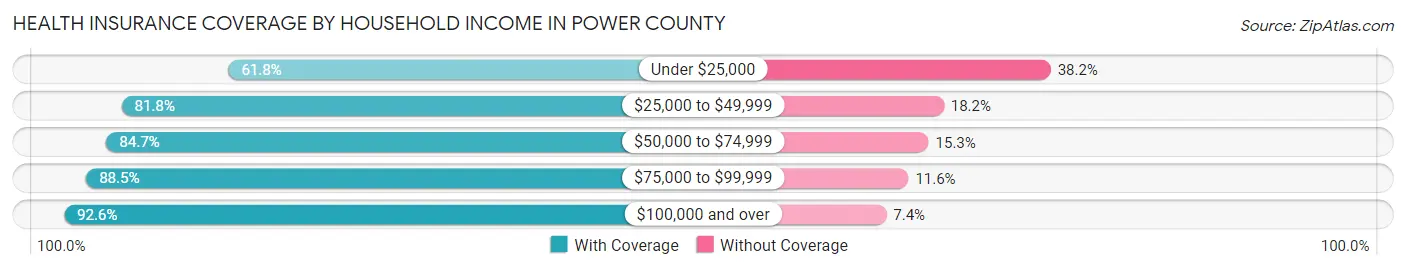
| Household Income | With Coverage | Without Coverage |
| Under $25,000 | 322 (61.8%) | 199 (38.2%) |
| $25,000 to $49,999 | 1,563 (81.8%) | 347 (18.2%) |
| $50,000 to $74,999 | 1,596 (84.7%) | 289 (15.3%) |
| $75,000 to $99,999 | 881 (88.4%) | 115 (11.6%) |
| $100,000 and over | 2,338 (92.6%) | 187 (7.4%) |
Public vs Private Health Insurance Coverage by Age in Power County
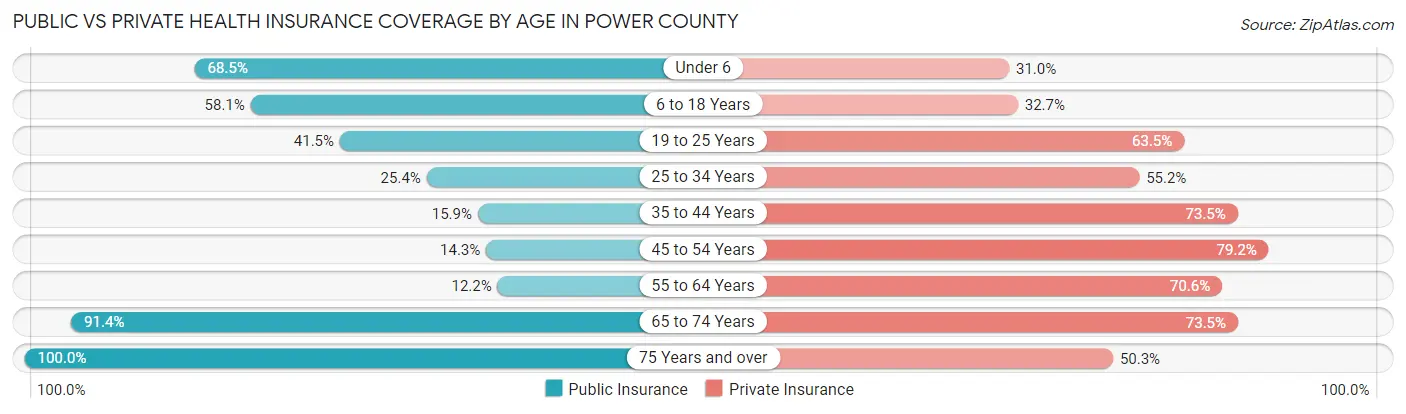
| Age Bracket | Public Insurance | Private Insurance |
| Under 6 | 408 (68.5%) | 185 (31.0%) |
| 6 to 18 Years | 1,194 (58.1%) | 672 (32.7%) |
| 19 to 25 Years | 207 (41.5%) | 317 (63.5%) |
| 25 to 34 Years | 188 (25.4%) | 409 (55.2%) |
| 35 to 44 Years | 155 (15.9%) | 717 (73.5%) |
| 45 to 54 Years | 116 (14.3%) | 641 (79.2%) |
| 55 to 64 Years | 120 (12.2%) | 693 (70.6%) |
| 65 to 74 Years | 676 (91.3%) | 544 (73.5%) |
| 75 Years and over | 449 (100.0%) | 226 (50.3%) |
| Total | 3,513 (44.8%) | 4,404 (56.1%) |
Disability Status by Sex by Age in Power County
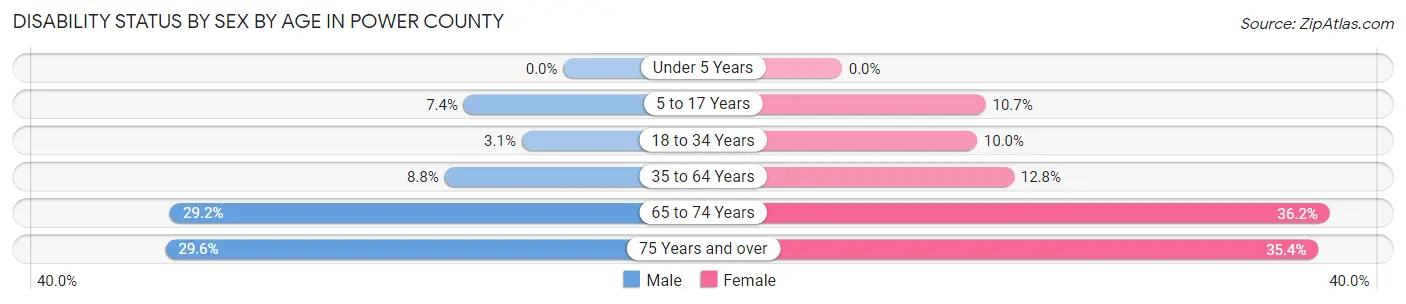
| Age Bracket | Male | Female |
| Under 5 Years | 0 (0.0%) | 0 (0.0%) |
| 5 to 17 Years | 73 (7.4%) | 97 (10.7%) |
| 18 to 34 Years | 24 (3.1%) | 65 (10.0%) |
| 35 to 64 Years | 128 (8.8%) | 168 (12.8%) |
| 65 to 74 Years | 108 (29.2%) | 134 (36.2%) |
| 75 Years and over | 65 (29.5%) | 81 (35.4%) |
Disability Class by Sex by Age in Power County
Disability Class: Hearing Difficulty
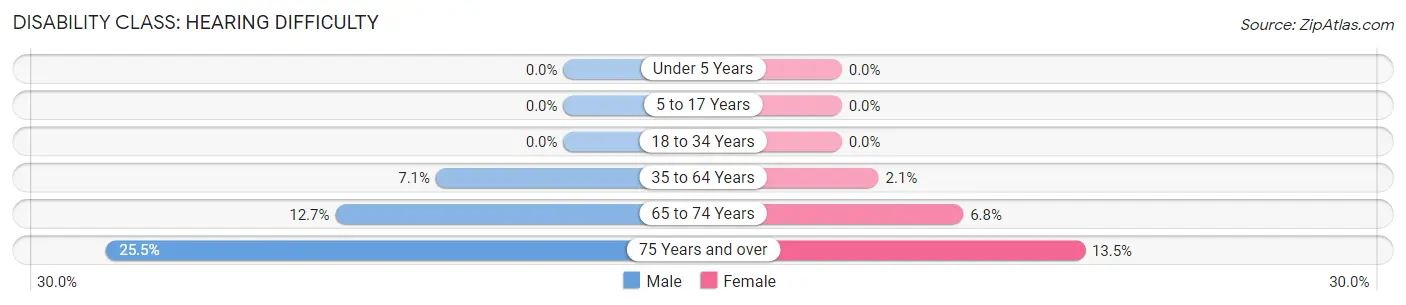
| Age Bracket | Male | Female |
| Under 5 Years | 0 (0.0%) | 0 (0.0%) |
| 5 to 17 Years | 0 (0.0%) | 0 (0.0%) |
| 18 to 34 Years | 0 (0.0%) | 0 (0.0%) |
| 35 to 64 Years | 103 (7.1%) | 27 (2.1%) |
| 65 to 74 Years | 47 (12.7%) | 25 (6.8%) |
| 75 Years and over | 56 (25.5%) | 31 (13.5%) |
Disability Class: Vision Difficulty
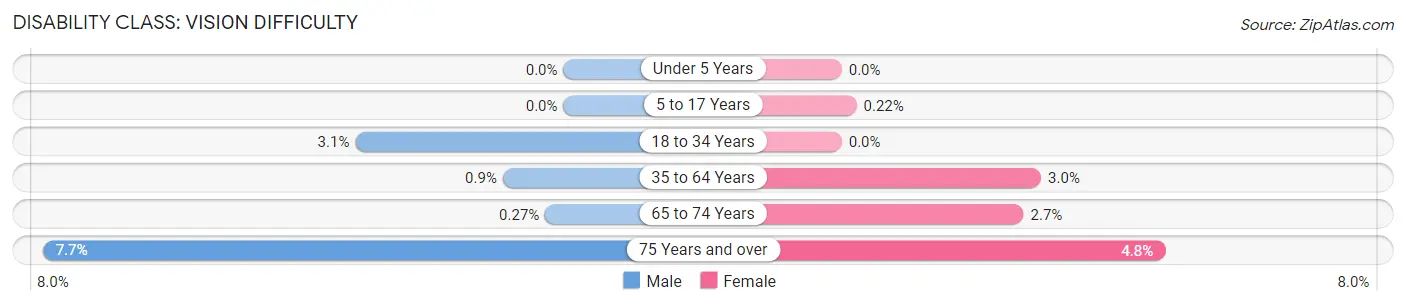
| Age Bracket | Male | Female |
| Under 5 Years | 0 (0.0%) | 0 (0.0%) |
| 5 to 17 Years | 0 (0.0%) | 2 (0.2%) |
| 18 to 34 Years | 24 (3.1%) | 0 (0.0%) |
| 35 to 64 Years | 13 (0.9%) | 39 (3.0%) |
| 65 to 74 Years | 1 (0.3%) | 10 (2.7%) |
| 75 Years and over | 17 (7.7%) | 11 (4.8%) |
Disability Class: Cognitive Difficulty
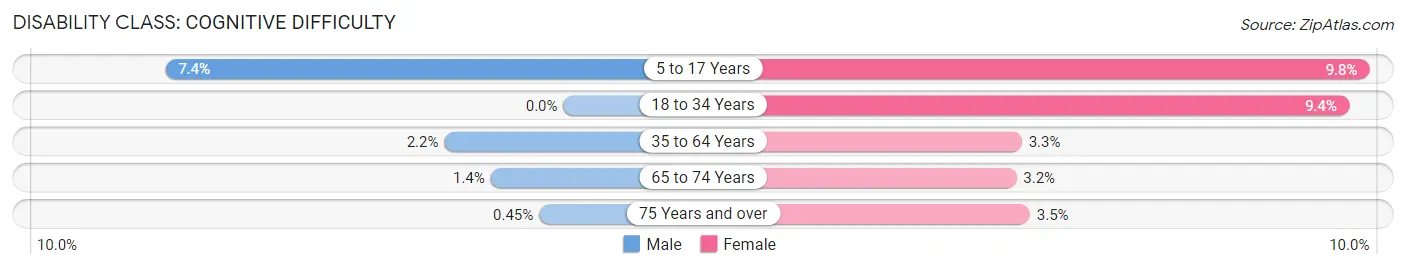
| Age Bracket | Male | Female |
| 5 to 17 Years | 73 (7.4%) | 89 (9.8%) |
| 18 to 34 Years | 0 (0.0%) | 61 (9.4%) |
| 35 to 64 Years | 32 (2.2%) | 44 (3.3%) |
| 65 to 74 Years | 5 (1.3%) | 12 (3.2%) |
| 75 Years and over | 1 (0.4%) | 8 (3.5%) |
Disability Class: Ambulatory Difficulty
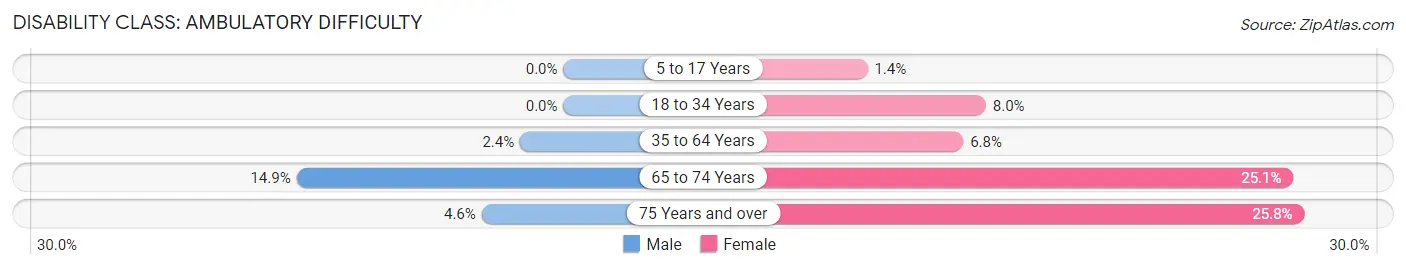
| Age Bracket | Male | Female |
| 5 to 17 Years | 0 (0.0%) | 13 (1.4%) |
| 18 to 34 Years | 0 (0.0%) | 52 (8.0%) |
| 35 to 64 Years | 35 (2.4%) | 89 (6.8%) |
| 65 to 74 Years | 55 (14.9%) | 93 (25.1%) |
| 75 Years and over | 10 (4.5%) | 59 (25.8%) |
Disability Class: Self-Care Difficulty
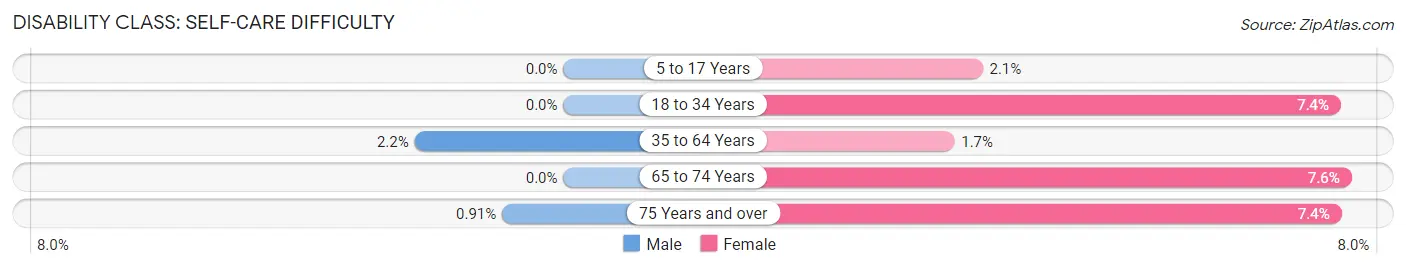
| Age Bracket | Male | Female |
| 5 to 17 Years | 0 (0.0%) | 19 (2.1%) |
| 18 to 34 Years | 0 (0.0%) | 48 (7.4%) |
| 35 to 64 Years | 32 (2.2%) | 22 (1.7%) |
| 65 to 74 Years | 0 (0.0%) | 28 (7.6%) |
| 75 Years and over | 2 (0.9%) | 17 (7.4%) |
Technology Access in Power County
Computing Device Access in Power County
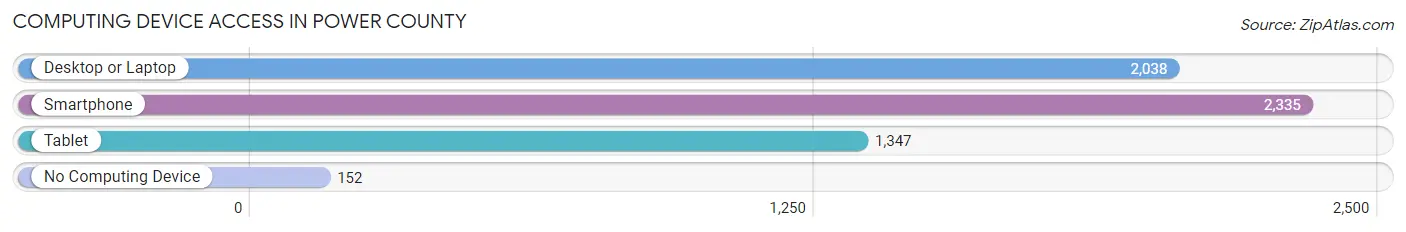
| Device Type | # Households | % Households |
| Desktop or Laptop | 2,038 | 76.3% |
| Smartphone | 2,335 | 87.4% |
| Tablet | 1,347 | 50.4% |
| No Computing Device | 152 | 5.7% |
| Total | 2,671 | 100.0% |
Internet Access in Power County
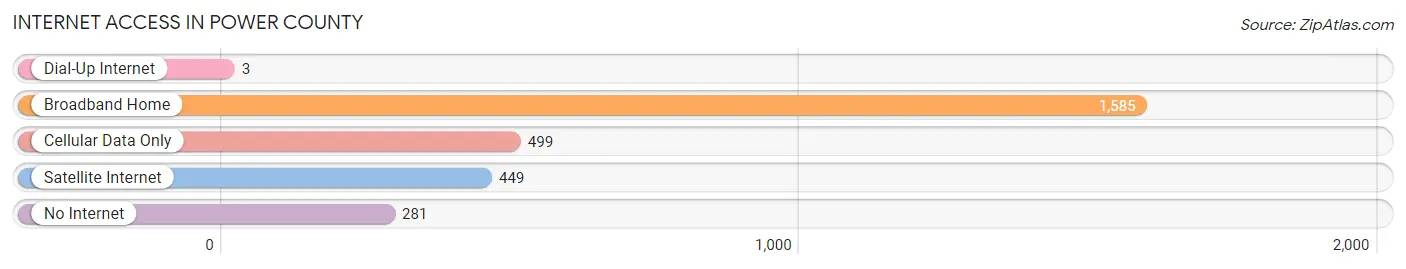
| Internet Type | # Households | % Households |
| Dial-Up Internet | 3 | 0.1% |
| Broadband Home | 1,585 | 59.3% |
| Cellular Data Only | 499 | 18.7% |
| Satellite Internet | 449 | 16.8% |
| No Internet | 281 | 10.5% |
| Total | 2,671 | 100.0% |
Power County Summary
Power County is located in the southeastern corner of Idaho, and is bordered by Bannock County to the north, Caribou County to the east, and Oneida County to the south. The county seat is American Falls, and the county has a total area of 1,845 square miles. Power County is part of the Snake River Plain, and is home to the Snake River, which flows through the county.
Geography
Power County is located in the southeastern corner of Idaho, and is bordered by Bannock County to the north, Caribou County to the east, and Oneida County to the south. The county seat is American Falls, and the county has a total area of 1,845 square miles. Power County is part of the Snake River Plain, and is home to the Snake River, which flows through the county. The county is mostly flat, with some rolling hills in the northern part of the county. The highest point in the county is the summit of the Snake River Plain, which is located in the northern part of the county and has an elevation of 5,945 feet.
The climate of Power County is semi-arid, with hot summers and cold winters. The average annual precipitation is around 11 inches, with most of the precipitation occurring in the spring and early summer. The average temperature in the county is around 40 degrees Fahrenheit.
Economy
Power County has a diverse economy, with agriculture, manufacturing, and tourism being the main industries. Agriculture is the largest industry in the county, with the main crops being potatoes, wheat, barley, and alfalfa. Manufacturing is also an important part of the economy, with the main industries being food processing, wood products, and metal fabrication. Tourism is also an important part of the economy, with the main attractions being the Snake River, the American Falls Reservoir, and the nearby Craters of the Moon National Monument.
Demographics
As of the 2010 census, Power County had a population of 7,818. The population is mostly white (94.3%), with small percentages of Native American (2.2%), Hispanic (1.7%), and Asian (0.7%) populations. The median household income in the county is $41,945, and the median age is 38.7 years.
Power County is a rural county, with most of the population living in small towns and rural areas. The largest city in the county is American Falls, which has a population of 3,717. Other cities in the county include Rockland, Arbon Valley, and Aberdeen.
Conclusion
Power County is a rural county located in the southeastern corner of Idaho. The county is home to the Snake River, and has a diverse economy that is based on agriculture, manufacturing, and tourism. The population of the county is mostly white, with small percentages of Native American, Hispanic, and Asian populations. Power County is a great place to live, work, and visit, and is a great example of the beauty and diversity of Idaho.
Common Questions
What is the Total Population of Power County?
Total Population of Power County is 7,918.
What is the Total Male Population of Power County?
Total Male Population of Power County is 3,982.
What is the Total Female Population of Power County?
Total Female Population of Power County is 3,936.
What is the Ratio of Males per 100 Females in Power County?
There are 101.17 Males per 100 Females in Power County.
What is the Ratio of Females per 100 Males in Power County?
There are 98.84 Females per 100 Males in Power County.
What is the Median Population Age in Power County?
Median Population Age in Power County is 35.3 Years.
What is the Average Family Size in Power County
Average Family Size in Power County is 3.6 People.
What is the Average Household Size in Power County
Average Household Size in Power County is 2.9 People.
What is Per Capita Income in Power County?
Per Capita income in Power County is $24,069.
What is the Median Family Income in Power County?
Median Family Income in Power County is $67,330.
What is the Median Household income in Power County?
Median Household Income in Power County is $56,671.
What is Income or Wage Gap in Power County?
Income or Wage Gap in Power County is 36.4%.
Women in Power County earn 63.6 cents for every dollar earned by a man.
What is Inequality or Gini Index in Power County?
Inequality or Gini Index in Power County is 0.37.
How Large is the Labor Force in Power County?
There are 3,908 People in the Labor Forcein in Power County.
What is the Percentage of People in the Labor Force in Power County?
68.1% of People are in the Labor Force in Power County.
What is the Unemployment Rate in Power County?
Unemployment Rate in Power County is 7.5%.