Payette County, ID
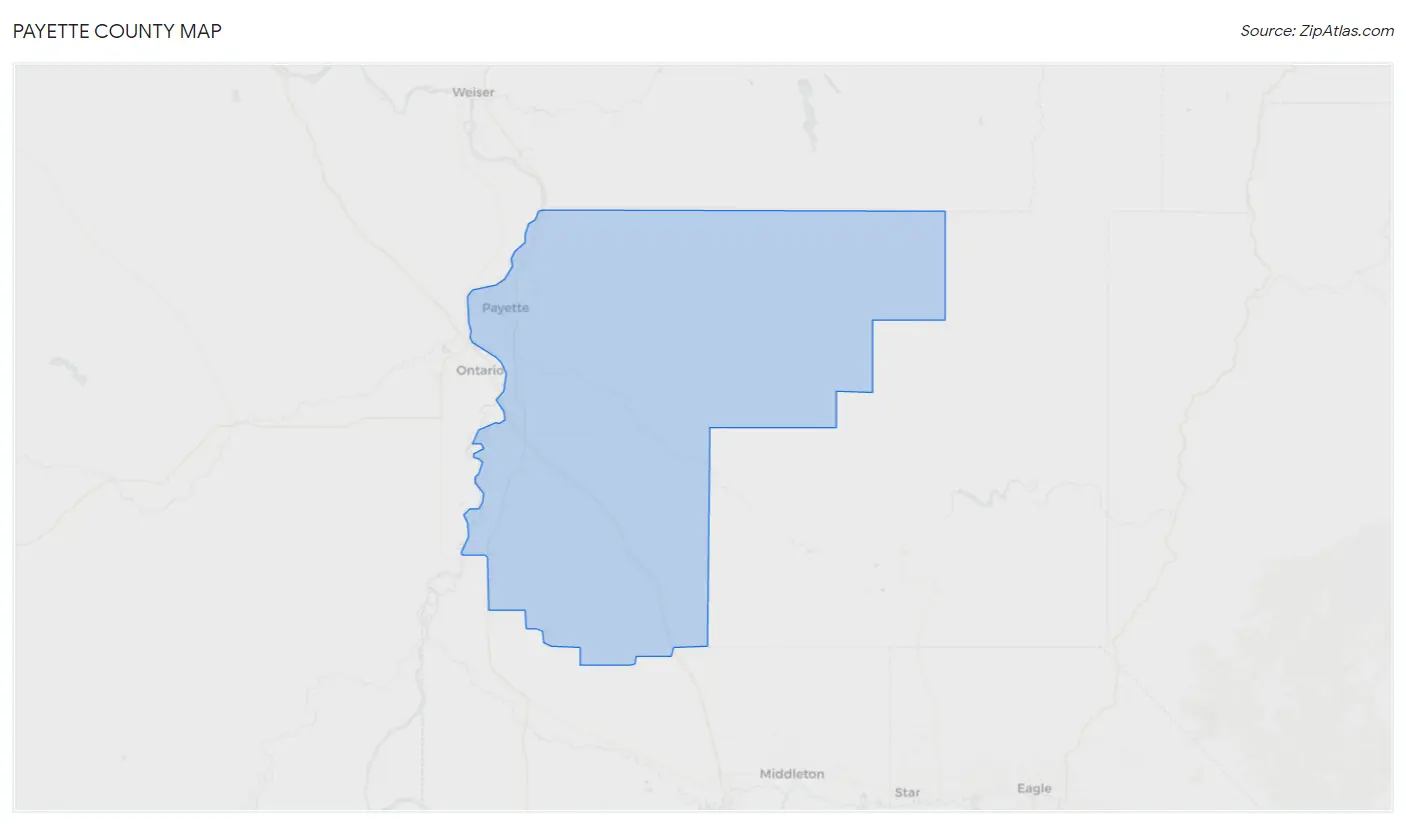
Payette County Map
Payette County Overview
25,571
TOTAL POPULATION
12,729
MALE POPULATION
12,842
FEMALE POPULATION
99.12
MALES / 100 FEMALES
100.89
FEMALES / 100 MALES
40.0
MEDIAN AGE
3.2
AVG FAMILY SIZE
2.7
AVG HOUSEHOLD SIZE
$30,102
PER CAPITA INCOME
$71,946
AVG FAMILY INCOME
$62,721
AVG HOUSEHOLD INCOME
30.8%
WAGE / INCOME GAP [ % ]
69.2¢/ $1
WAGE / INCOME GAP [ $ ]
$9,424
FAMILY INCOME DEFICIT
0.42
INEQUALITY / GINI INDEX
11,283
LABOR FORCE [ PEOPLE ]
57.5%
PERCENT IN LABOR FORCE
4.4%
UNEMPLOYMENT RATE
Payette County Area Codes
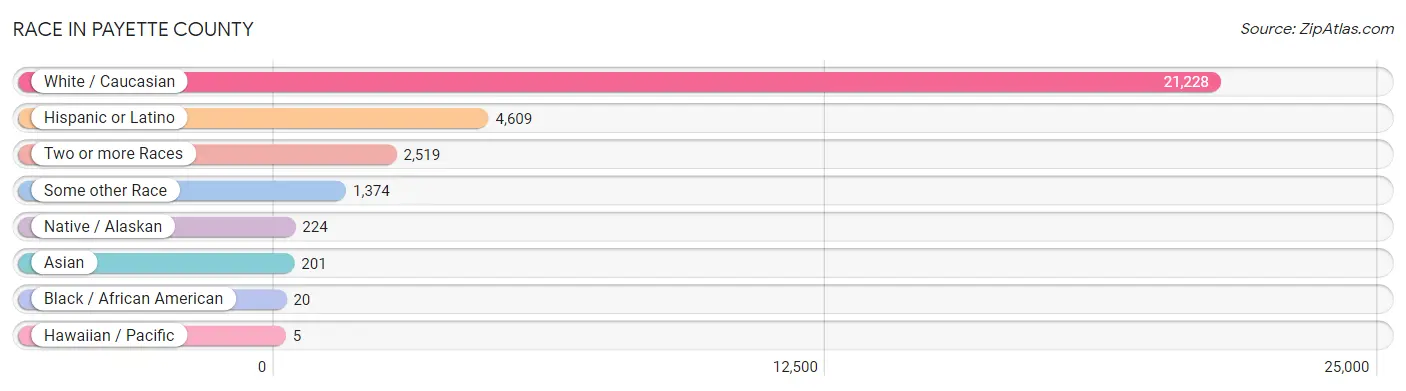
Race in Payette County
The most populous races in Payette County are White / Caucasian (21,228 | 83.0%), Hispanic or Latino (4,609 | 18.0%), and Two or more Races (2,519 | 9.9%).
| Race | # Population | % Population |
| Asian | 201 | 0.8% |
| Black / African American | 20 | 0.1% |
| Hawaiian / Pacific | 5 | 0.0% |
| Hispanic or Latino | 4,609 | 18.0% |
| Native / Alaskan | 224 | 0.9% |
| White / Caucasian | 21,228 | 83.0% |
| Two or more Races | 2,519 | 9.9% |
| Some other Race | 1,374 | 5.4% |
| Total | 25,571 | 100.0% |
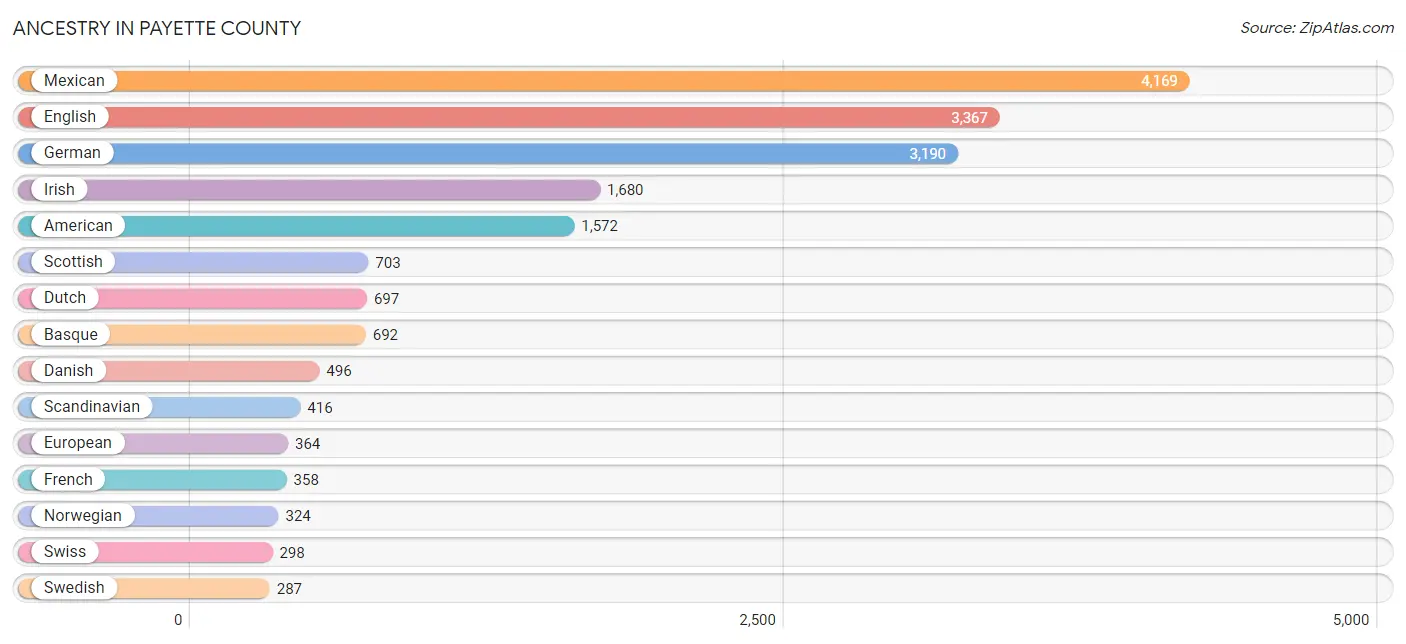
Ancestry in Payette County
The most populous ancestries reported in Payette County are Mexican (4,169 | 16.3%), English (3,367 | 13.2%), German (3,190 | 12.5%), Irish (1,680 | 6.6%), and American (1,572 | 6.1%), together accounting for 54.7% of all Payette County residents.
| Ancestry | # Population | % Population |
| American | 1,572 | 6.1% |
| Apache | 36 | 0.1% |
| Austrian | 75 | 0.3% |
| Basque | 692 | 2.7% |
| Belgian | 13 | 0.1% |
| Bhutanese | 222 | 0.9% |
| British | 33 | 0.1% |
| Burmese | 129 | 0.5% |
| Canadian | 36 | 0.1% |
| Celtic | 15 | 0.1% |
| Central American | 163 | 0.6% |
| Central American Indian | 66 | 0.3% |
| Cherokee | 169 | 0.7% |
| Cheyenne | 14 | 0.1% |
| Chickasaw | 31 | 0.1% |
| Chippewa | 22 | 0.1% |
| Choctaw | 18 | 0.1% |
| Colombian | 7 | 0.0% |
| Costa Rican | 13 | 0.1% |
| Cree | 22 | 0.1% |
| Croatian | 12 | 0.1% |
| Czech | 65 | 0.3% |
| Czechoslovakian | 36 | 0.1% |
| Danish | 496 | 1.9% |
| Dutch | 697 | 2.7% |
| Dutch West Indian | 4 | 0.0% |
| English | 3,367 | 13.2% |
| European | 364 | 1.4% |
| Finnish | 22 | 0.1% |
| French | 358 | 1.4% |
| French Canadian | 91 | 0.4% |
| German | 3,190 | 12.5% |
| Greek | 26 | 0.1% |
| Hungarian | 19 | 0.1% |
| Icelander | 1 | 0.0% |
| Indian (Asian) | 142 | 0.6% |
| Irish | 1,680 | 6.6% |
| Italian | 233 | 0.9% |
| Jamaican | 8 | 0.0% |
| Korean | 52 | 0.2% |
| Laotian | 3 | 0.0% |
| Lithuanian | 28 | 0.1% |
| Mexican | 4,169 | 16.3% |
| Mexican American Indian | 13 | 0.1% |
| Native Hawaiian | 5 | 0.0% |
| Navajo | 10 | 0.0% |
| Nigerian | 99 | 0.4% |
| Northern European | 9 | 0.0% |
| Norwegian | 324 | 1.3% |
| Osage | 12 | 0.1% |
| Paiute | 55 | 0.2% |
| Polish | 150 | 0.6% |
| Portuguese | 105 | 0.4% |
| Pueblo | 5 | 0.0% |
| Romanian | 2 | 0.0% |
| Russian | 37 | 0.1% |
| Salvadoran | 150 | 0.6% |
| Scandinavian | 416 | 1.6% |
| Scotch-Irish | 208 | 0.8% |
| Scottish | 703 | 2.8% |
| Seminole | 27 | 0.1% |
| Sioux | 108 | 0.4% |
| Slavic | 23 | 0.1% |
| South American | 7 | 0.0% |
| Spaniard | 114 | 0.4% |
| Spanish | 47 | 0.2% |
| Spanish American | 40 | 0.2% |
| Subsaharan African | 99 | 0.4% |
| Swedish | 287 | 1.1% |
| Swiss | 298 | 1.2% |
| Thai | 16 | 0.1% |
| Tlingit-Haida | 3 | 0.0% |
| Ukrainian | 1 | 0.0% |
| Welsh | 148 | 0.6% |
| Yaqui | 7 | 0.0% | View All 75 Rows |
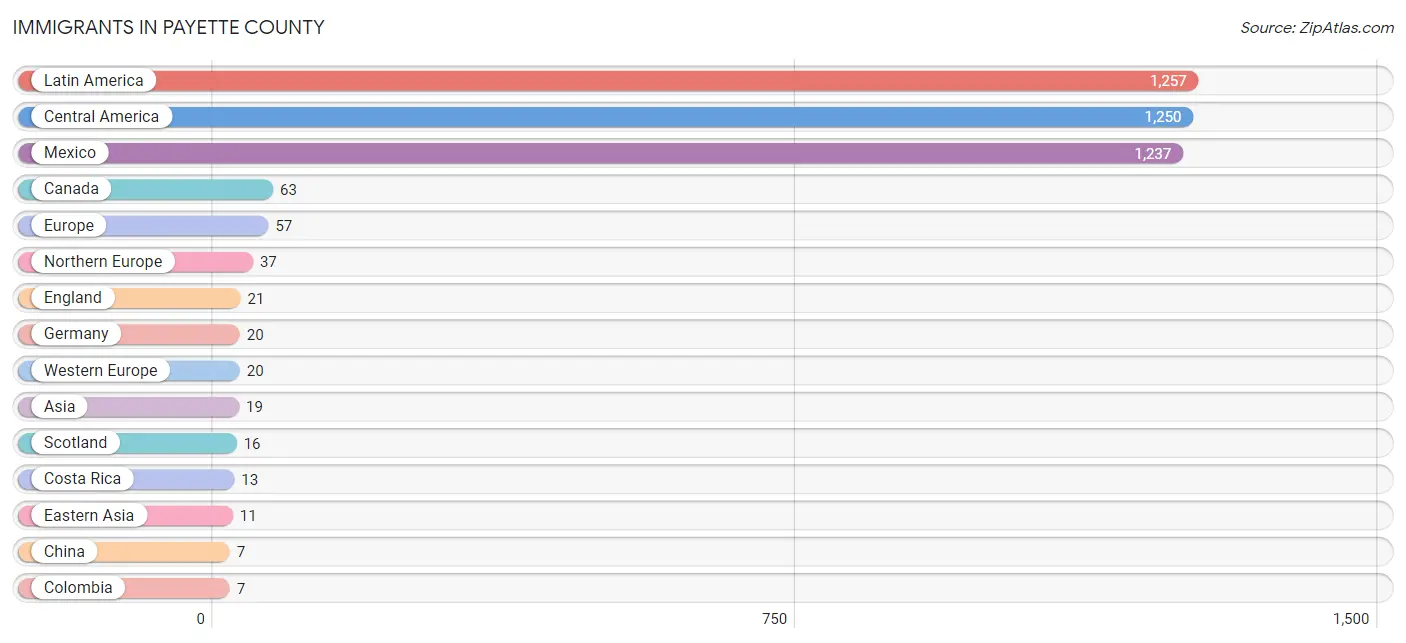
Immigrants in Payette County
The most numerous immigrant groups reported in Payette County came from Latin America (1,257 | 4.9%), Central America (1,250 | 4.9%), Mexico (1,237 | 4.8%), Canada (63 | 0.3%), and Europe (57 | 0.2%), together accounting for 15.1% of all Payette County residents.
| Immigration Origin | # Population | % Population |
| Asia | 19 | 0.1% |
| Canada | 63 | 0.3% |
| Central America | 1,250 | 4.9% |
| China | 7 | 0.0% |
| Colombia | 7 | 0.0% |
| Costa Rica | 13 | 0.1% |
| Eastern Asia | 11 | 0.0% |
| England | 21 | 0.1% |
| Europe | 57 | 0.2% |
| Germany | 20 | 0.1% |
| India | 6 | 0.0% |
| Japan | 4 | 0.0% |
| Latin America | 1,257 | 4.9% |
| Mexico | 1,237 | 4.8% |
| Northern Europe | 37 | 0.1% |
| Philippines | 2 | 0.0% |
| Scotland | 16 | 0.1% |
| South America | 7 | 0.0% |
| South Central Asia | 6 | 0.0% |
| South Eastern Asia | 2 | 0.0% |
| Western Europe | 20 | 0.1% | View All 21 Rows |
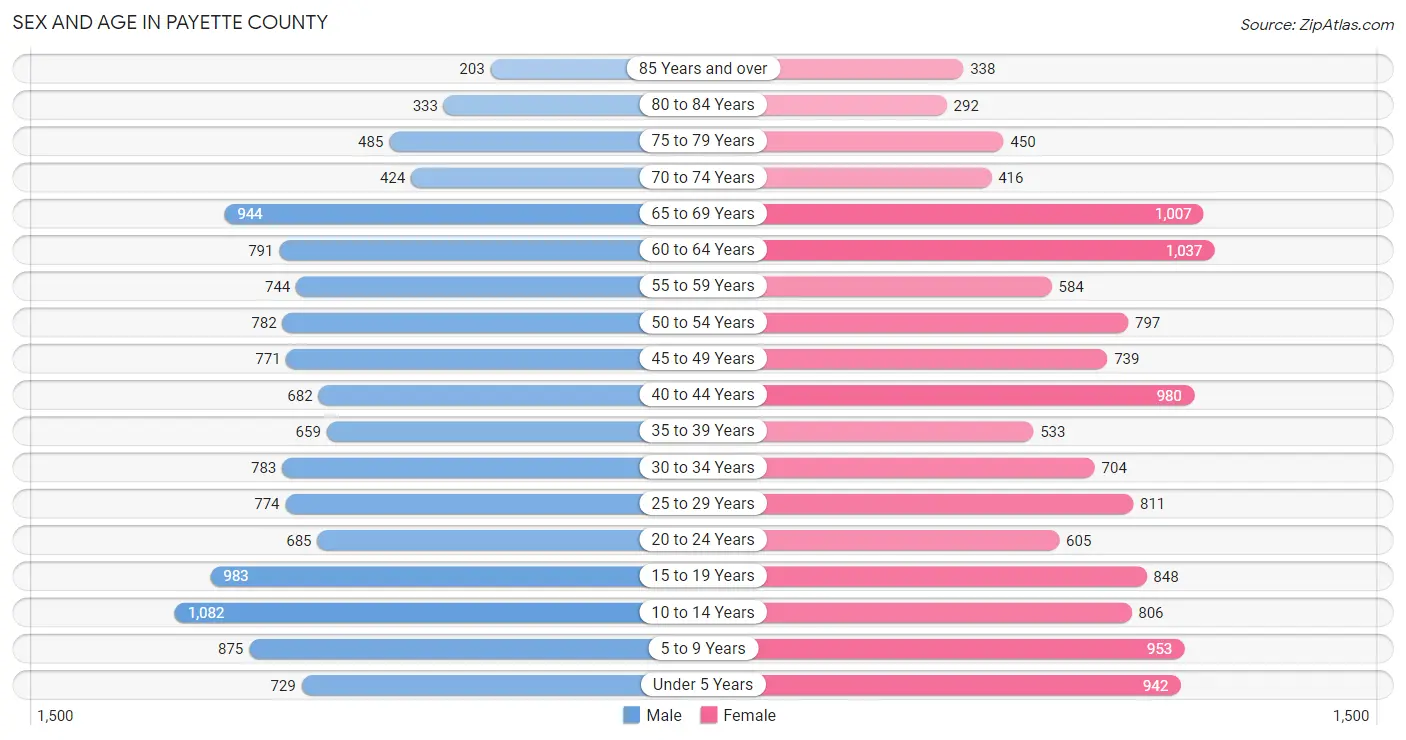
Sex and Age in Payette County
Sex and Age in Payette County
The most populous age groups in Payette County are 10 to 14 Years (1,082 | 8.5%) for men and 60 to 64 Years (1,037 | 8.1%) for women.
| Age Bracket | Male | Female |
| Under 5 Years | 729 (5.7%) | 942 (7.3%) |
| 5 to 9 Years | 875 (6.9%) | 953 (7.4%) |
| 10 to 14 Years | 1,082 (8.5%) | 806 (6.3%) |
| 15 to 19 Years | 983 (7.7%) | 848 (6.6%) |
| 20 to 24 Years | 685 (5.4%) | 605 (4.7%) |
| 25 to 29 Years | 774 (6.1%) | 811 (6.3%) |
| 30 to 34 Years | 783 (6.1%) | 704 (5.5%) |
| 35 to 39 Years | 659 (5.2%) | 533 (4.2%) |
| 40 to 44 Years | 682 (5.4%) | 980 (7.6%) |
| 45 to 49 Years | 771 (6.1%) | 739 (5.8%) |
| 50 to 54 Years | 782 (6.1%) | 797 (6.2%) |
| 55 to 59 Years | 744 (5.8%) | 584 (4.5%) |
| 60 to 64 Years | 791 (6.2%) | 1,037 (8.1%) |
| 65 to 69 Years | 944 (7.4%) | 1,007 (7.8%) |
| 70 to 74 Years | 424 (3.3%) | 416 (3.2%) |
| 75 to 79 Years | 485 (3.8%) | 450 (3.5%) |
| 80 to 84 Years | 333 (2.6%) | 292 (2.3%) |
| 85 Years and over | 203 (1.6%) | 338 (2.6%) |
| Total | 12,729 (100.0%) | 12,842 (100.0%) |
Families and Households in Payette County
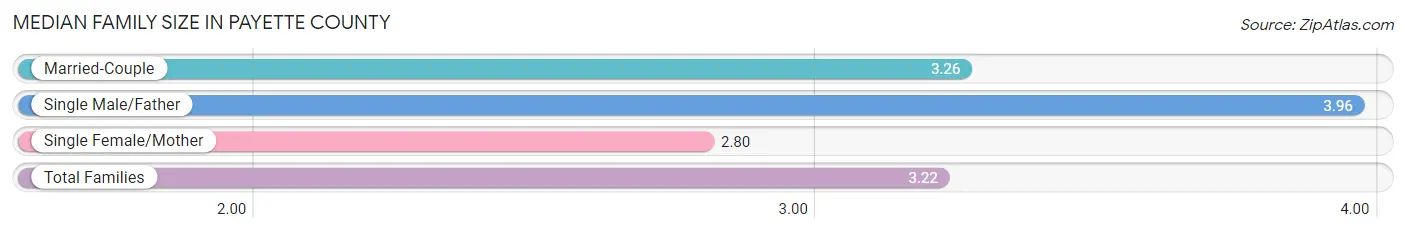
Median Family Size in Payette County
The median family size in Payette County is 3.22 persons per family, with single male/father families (206 | 3.2%) accounting for the largest median family size of 3.96 persons per family. On the other hand, single female/mother families (952 | 14.5%) represent the smallest median family size with 2.80 persons per family.
| Family Type | # Families | Family Size |
| Married-Couple | 5,387 (82.3%) | 3.26 |
| Single Male/Father | 206 (3.2%) | 3.96 |
| Single Female/Mother | 952 (14.5%) | 2.80 |
| Total Families | 6,545 (100.0%) | 3.22 |
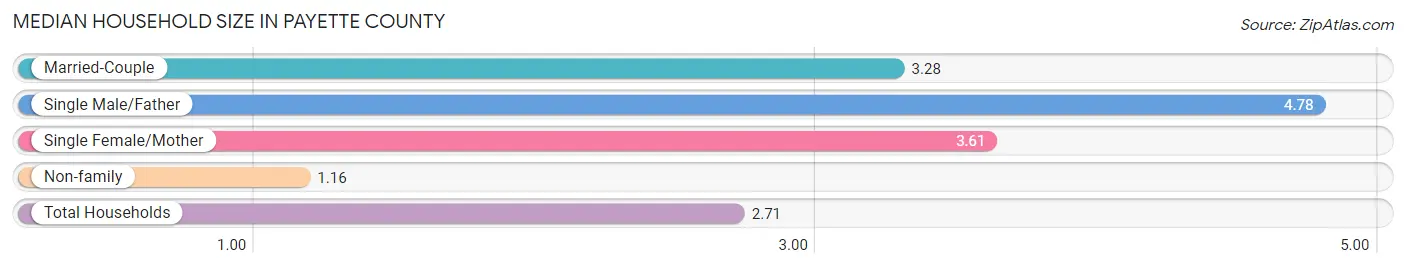
Median Household Size in Payette County
The median household size in Payette County is 2.71 persons per household, with single male/father households (206 | 2.2%) accounting for the largest median household size of 4.78 persons per household. non-family households (2,807 | 30.0%) represent the smallest median household size with 1.16 persons per household.
| Household Type | # Households | Household Size |
| Married-Couple | 5,387 (57.6%) | 3.28 |
| Single Male/Father | 206 (2.2%) | 4.78 |
| Single Female/Mother | 952 (10.2%) | 3.61 |
| Non-family | 2,807 (30.0%) | 1.16 |
| Total Households | 9,352 (100.0%) | 2.71 |
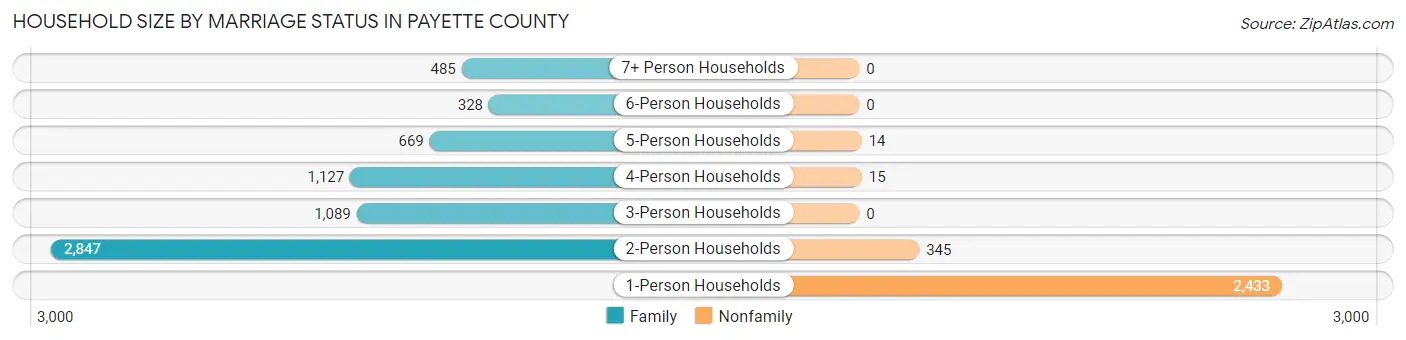
Household Size by Marriage Status in Payette County
Out of a total of 9,352 households in Payette County, 6,545 (70.0%) are family households, while 2,807 (30.0%) are nonfamily households. The most numerous type of family households are 2-person households, comprising 2,847, and the most common type of nonfamily households are 1-person households, comprising 2,433.
| Household Size | Family Households | Nonfamily Households |
| 1-Person Households | - | 2,433 (26.0%) |
| 2-Person Households | 2,847 (30.4%) | 345 (3.7%) |
| 3-Person Households | 1,089 (11.6%) | 0 (0.0%) |
| 4-Person Households | 1,127 (12.0%) | 15 (0.2%) |
| 5-Person Households | 669 (7.1%) | 14 (0.2%) |
| 6-Person Households | 328 (3.5%) | 0 (0.0%) |
| 7+ Person Households | 485 (5.2%) | 0 (0.0%) |
| Total | 6,545 (70.0%) | 2,807 (30.0%) |
Female Fertility in Payette County
Fertility by Age in Payette County
Average fertility rate in Payette County is 64.0 births per 1,000 women. Women in the age bracket of 20 to 34 years have the highest fertility rate with 99.0 births per 1,000 women. Women in the age bracket of 20 to 34 years acount for 61.8% of all women with births.
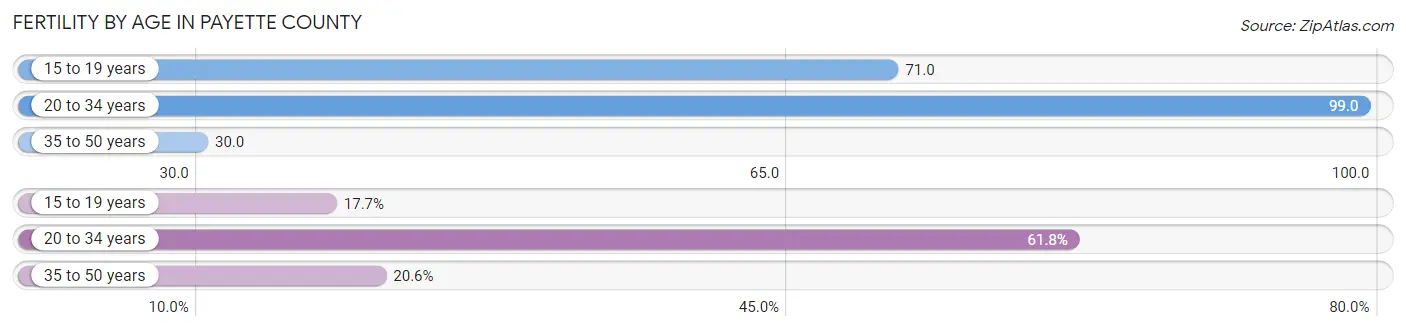
| Age Bracket | Women with Births | Births / 1,000 Women |
| 15 to 19 years | 60 (17.6%) | 71.0 |
| 20 to 34 years | 210 (61.8%) | 99.0 |
| 35 to 50 years | 70 (20.6%) | 30.0 |
| Total | 340 (100.0%) | 64.0 |
Fertility by Age by Marriage Status in Payette County
70.3% of women with births (340) in Payette County are married. The highest percentage of unmarried women with births falls into 15 to 19 years age bracket with 100.0% of them unmarried at the time of birth, while the lowest percentage of unmarried women with births belong to 35 to 50 years age bracket with 0.0% of them unmarried.
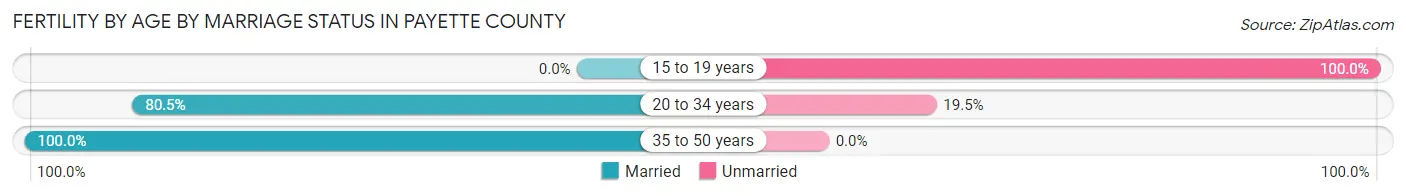
| Age Bracket | Married | Unmarried |
| 15 to 19 years | 0 (0.0%) | 60 (100.0%) |
| 20 to 34 years | 169 (80.5%) | 41 (19.5%) |
| 35 to 50 years | 70 (100.0%) | 0 (0.0%) |
| Total | 239 (70.3%) | 101 (29.7%) |
Fertility by Education in Payette County
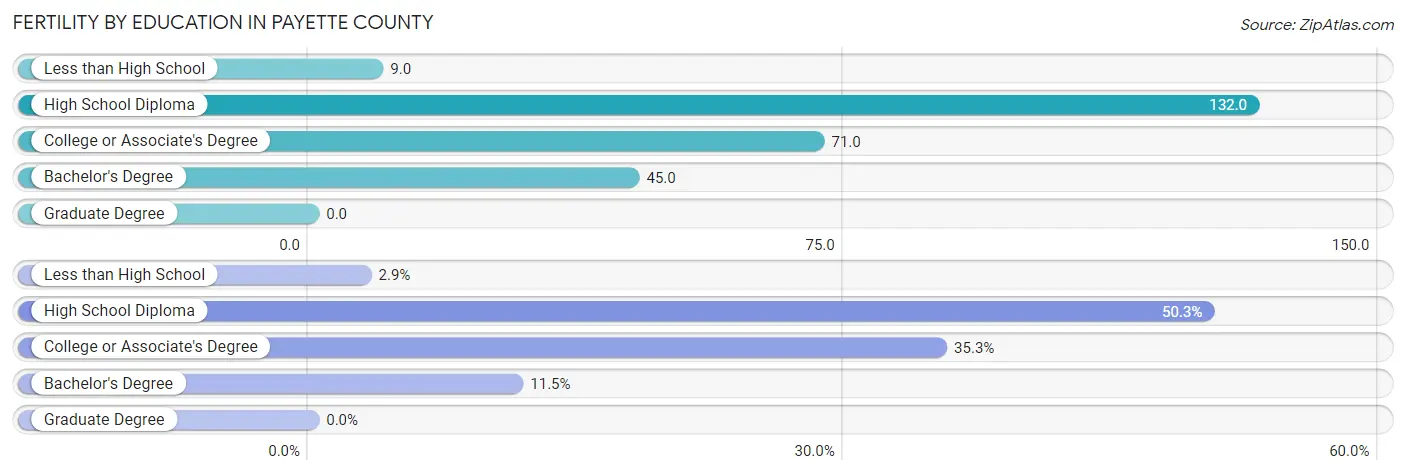
| Educational Attainment | Women with Births | Births / 1,000 Women |
| Less than High School | 10 (2.9%) | 9.0 |
| High School Diploma | 171 (50.3%) | 132.0 |
| College or Associate's Degree | 120 (35.3%) | 71.0 |
| Bachelor's Degree | 39 (11.5%) | 45.0 |
| Graduate Degree | 0 (0.0%) | 0.0 |
| Total | 340 (100.0%) | 64.0 |
Fertility by Education by Marriage Status in Payette County
29.7% of women with births in Payette County are unmarried. Women with the educational attainment of less than high school are most likely to be married with 100.0% of them married at childbirth, while women with the educational attainment of high school diploma are least likely to be married with 57.3% of them unmarried at childbirth.
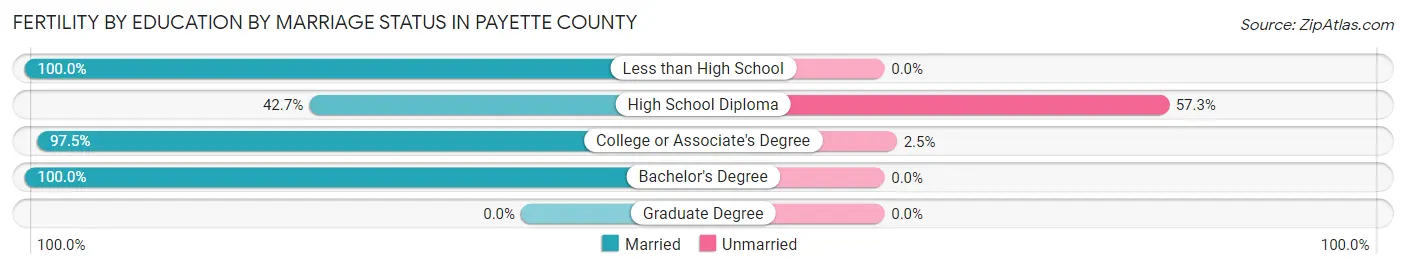
| Educational Attainment | Married | Unmarried |
| Less than High School | 10 (100.0%) | 0 (0.0%) |
| High School Diploma | 73 (42.7%) | 98 (57.3%) |
| College or Associate's Degree | 117 (97.5%) | 3 (2.5%) |
| Bachelor's Degree | 39 (100.0%) | 0 (0.0%) |
| Graduate Degree | 0 (0.0%) | 0 (0.0%) |
| Total | 239 (70.3%) | 101 (29.7%) |
Income in Payette County
Income Overview in Payette County
Per Capita Income in Payette County is $30,102, while median incomes of families and households are $71,946 and $62,721 respectively.
| Characteristic | Number | Measure |
| Per Capita Income | 25,571 | $30,102 |
| Median Family Income | 6,545 | $71,946 |
| Mean Family Income | 6,545 | $94,728 |
| Median Household Income | 9,352 | $62,721 |
| Mean Household Income | 9,352 | $81,772 |
| Income Deficit | 6,545 | $9,424 |
| Wage / Income Gap (%) | 25,571 | 30.77% |
| Wage / Income Gap ($) | 25,571 | 69.23¢ per $1 |
| Gini / Inequality Index | 25,571 | 0.42 |
Earnings by Sex in Payette County
Average Earnings in Payette County are $37,085, $42,550 for men and $29,456 for women, a difference of 30.8%.
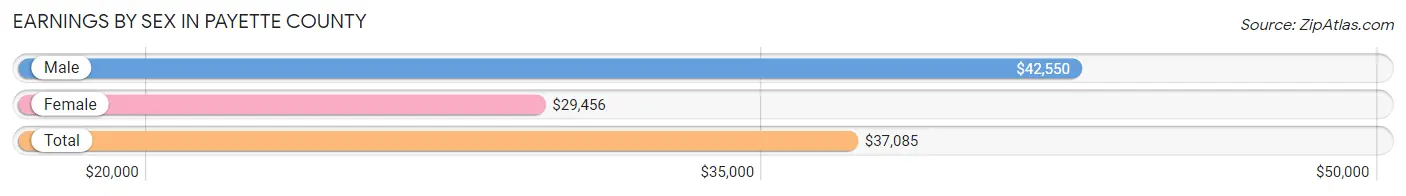
| Sex | Number | Average Earnings |
| Male | 6,932 (55.0%) | $42,550 |
| Female | 5,681 (45.0%) | $29,456 |
| Total | 12,613 (100.0%) | $37,085 |
Earnings by Sex by Income Bracket in Payette County
The most common earnings brackets in Payette County are $100,000+ for men (711 | 10.3%) and $2,499 or less for women (722 | 12.7%).
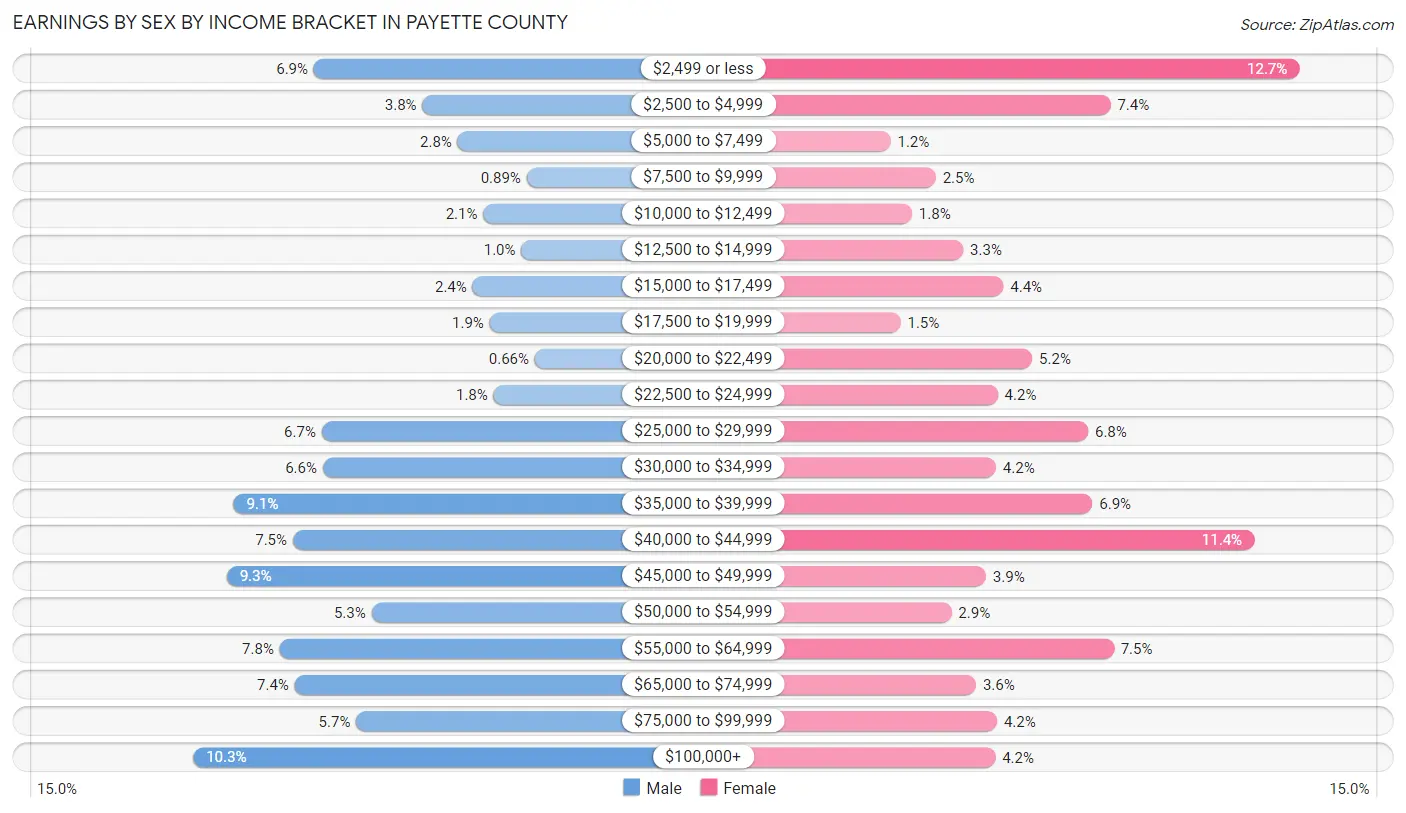
| Income | Male | Female |
| $2,499 or less | 476 (6.9%) | 722 (12.7%) |
| $2,500 to $4,999 | 265 (3.8%) | 421 (7.4%) |
| $5,000 to $7,499 | 196 (2.8%) | 70 (1.2%) |
| $7,500 to $9,999 | 62 (0.9%) | 142 (2.5%) |
| $10,000 to $12,499 | 146 (2.1%) | 104 (1.8%) |
| $12,500 to $14,999 | 72 (1.0%) | 186 (3.3%) |
| $15,000 to $17,499 | 167 (2.4%) | 250 (4.4%) |
| $17,500 to $19,999 | 134 (1.9%) | 86 (1.5%) |
| $20,000 to $22,499 | 46 (0.7%) | 296 (5.2%) |
| $22,500 to $24,999 | 126 (1.8%) | 241 (4.2%) |
| $25,000 to $29,999 | 461 (6.7%) | 385 (6.8%) |
| $30,000 to $34,999 | 459 (6.6%) | 238 (4.2%) |
| $35,000 to $39,999 | 633 (9.1%) | 392 (6.9%) |
| $40,000 to $44,999 | 517 (7.5%) | 650 (11.4%) |
| $45,000 to $49,999 | 646 (9.3%) | 222 (3.9%) |
| $50,000 to $54,999 | 364 (5.2%) | 167 (2.9%) |
| $55,000 to $64,999 | 543 (7.8%) | 426 (7.5%) |
| $65,000 to $74,999 | 514 (7.4%) | 206 (3.6%) |
| $75,000 to $99,999 | 394 (5.7%) | 240 (4.2%) |
| $100,000+ | 711 (10.3%) | 237 (4.2%) |
| Total | 6,932 (100.0%) | 5,681 (100.0%) |
Earnings by Sex by Educational Attainment in Payette County
Average earnings in Payette County are $45,933 for men and $35,596 for women, a difference of 22.5%. Men with an educational attainment of graduate degree enjoy the highest average annual earnings of $70,455, while those with less than high school education earn the least with $39,417. Women with an educational attainment of graduate degree earn the most with the average annual earnings of $66,111, while those with high school diploma education have the smallest earnings of $27,898.
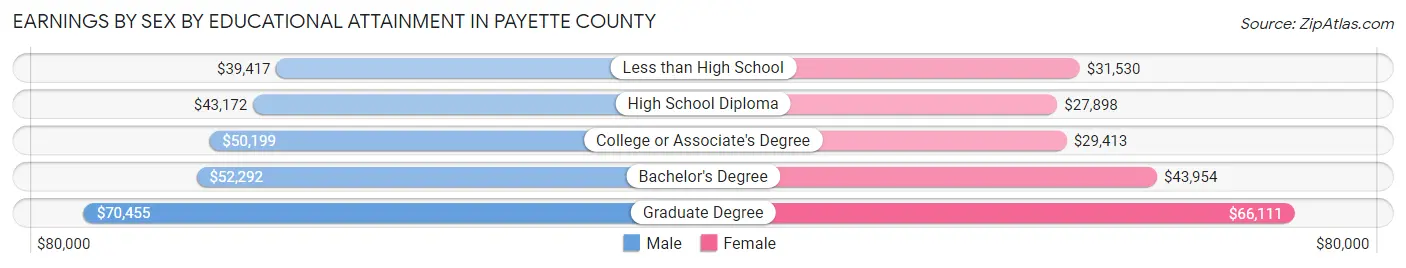
| Educational Attainment | Male Income | Female Income |
| Less than High School | $39,417 | $31,530 |
| High School Diploma | $43,172 | $27,898 |
| College or Associate's Degree | $50,199 | $29,413 |
| Bachelor's Degree | $52,292 | $43,954 |
| Graduate Degree | $70,455 | $66,111 |
| Total | $45,933 | $35,596 |
Family Income in Payette County
Family Income Brackets in Payette County
According to the Payette County family income data, there are 1,662 families falling into the $50,000 to $74,999 income range, which is the most common income bracket and makes up 25.4% of all families. Conversely, the $10,000 to $14,999 income bracket is the least frequent group with only 85 families (1.3%) belonging to this category.
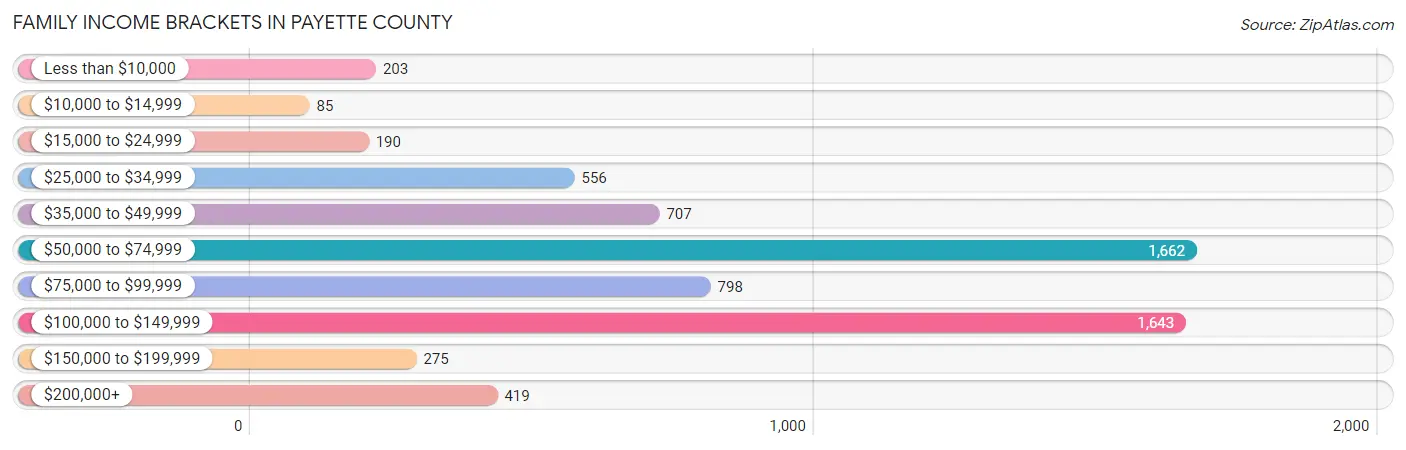
| Income Bracket | # Families | % Families |
| Less than $10,000 | 203 | 3.1% |
| $10,000 to $14,999 | 85 | 1.3% |
| $15,000 to $24,999 | 190 | 2.9% |
| $25,000 to $34,999 | 556 | 8.5% |
| $35,000 to $49,999 | 707 | 10.8% |
| $50,000 to $74,999 | 1,662 | 25.4% |
| $75,000 to $99,999 | 798 | 12.2% |
| $100,000 to $149,999 | 1,643 | 25.1% |
| $150,000 to $199,999 | 275 | 4.2% |
| $200,000+ | 419 | 6.4% |
Family Income by Famaliy Size in Payette County
5-person families (542 | 8.3%) account for the highest median family income in Payette County with $123,360 per family, while 2-person families (3,012 | 46.0%) have the highest median income of $33,584 per family member.
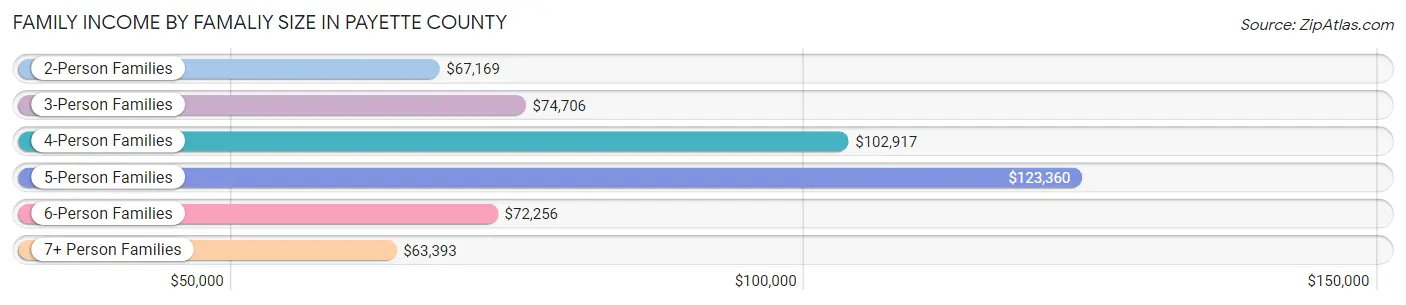
| Income Bracket | # Families | Median Income |
| 2-Person Families | 3,012 (46.0%) | $67,169 |
| 3-Person Families | 1,190 (18.2%) | $74,706 |
| 4-Person Families | 1,013 (15.5%) | $102,917 |
| 5-Person Families | 542 (8.3%) | $123,360 |
| 6-Person Families | 344 (5.3%) | $72,256 |
| 7+ Person Families | 444 (6.8%) | $63,393 |
| Total | 6,545 (100.0%) | $71,946 |
Family Income by Number of Earners in Payette County
The median family income in Payette County is $71,946, with families comprising 3+ earners (1,121) having the highest median family income of $124,277, while families with no earners (909) have the lowest median family income of $49,105, accounting for 17.1% and 13.9% of families, respectively.
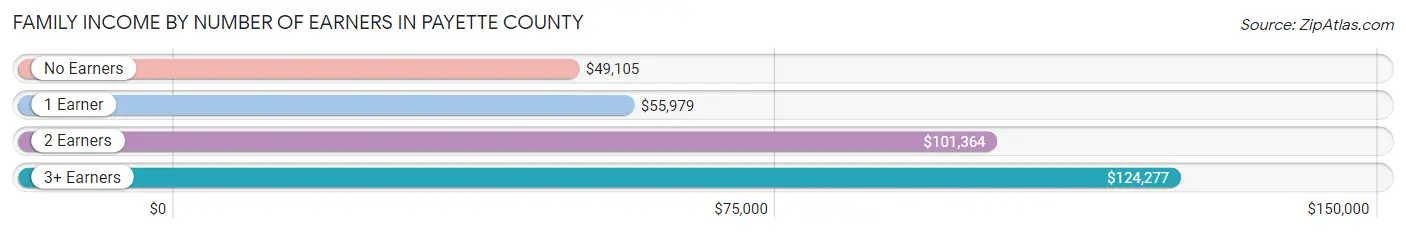
| Number of Earners | # Families | Median Income |
| No Earners | 909 (13.9%) | $49,105 |
| 1 Earner | 2,615 (40.0%) | $55,979 |
| 2 Earners | 1,900 (29.0%) | $101,364 |
| 3+ Earners | 1,121 (17.1%) | $124,277 |
| Total | 6,545 (100.0%) | $71,946 |
Household Income in Payette County
Household Income Brackets in Payette County
With 2,188 households falling in the category, the $50,000 to $74,999 income range is the most frequent in Payette County, accounting for 23.4% of all households. In contrast, only 243 households (2.6%) fall into the $10,000 to $14,999 income bracket, making it the least populous group.
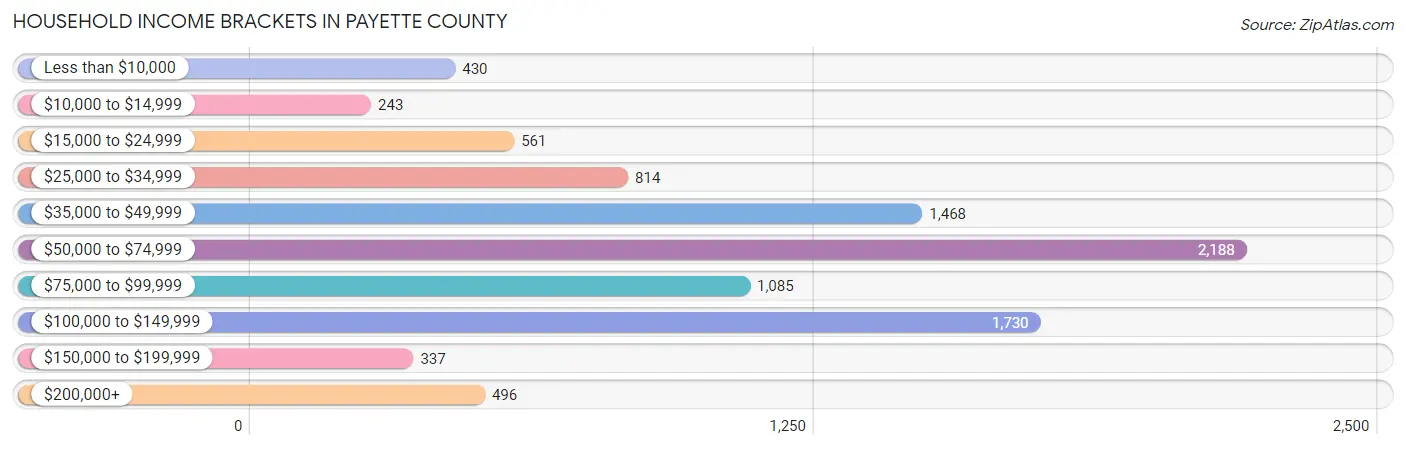
| Income Bracket | # Households | % Households |
| Less than $10,000 | 430 | 4.6% |
| $10,000 to $14,999 | 243 | 2.6% |
| $15,000 to $24,999 | 561 | 6.0% |
| $25,000 to $34,999 | 814 | 8.7% |
| $35,000 to $49,999 | 1,468 | 15.7% |
| $50,000 to $74,999 | 2,188 | 23.4% |
| $75,000 to $99,999 | 1,085 | 11.6% |
| $100,000 to $149,999 | 1,730 | 18.5% |
| $150,000 to $199,999 | 337 | 3.6% |
| $200,000+ | 496 | 5.3% |
Household Income by Householder Age in Payette County
The median household income in Payette County is $62,721, with the highest median household income of $73,333 found in the 25 to 44 years age bracket for the primary householder. A total of 2,668 households (28.5%) fall into this category. Meanwhile, the 15 to 24 years age bracket for the primary householder has the lowest median household income of $44,459, with 515 households (5.5%) in this group.
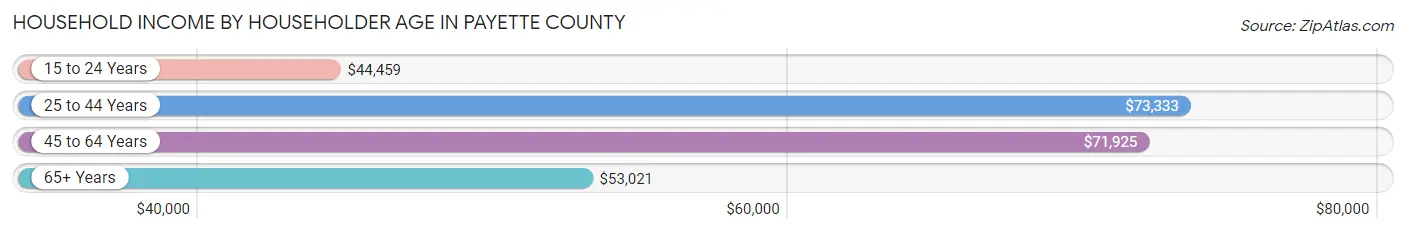
| Income Bracket | # Households | Median Income |
| 15 to 24 Years | 515 (5.5%) | $44,459 |
| 25 to 44 Years | 2,668 (28.5%) | $73,333 |
| 45 to 64 Years | 3,115 (33.3%) | $71,925 |
| 65+ Years | 3,054 (32.7%) | $53,021 |
| Total | 9,352 (100.0%) | $62,721 |
Poverty in Payette County
Income Below Poverty by Sex and Age in Payette County
With 9.1% poverty level for males and 12.0% for females among the residents of Payette County, 6 to 11 year old males and 5 year old females are the most vulnerable to poverty, with 229 males (20.8%) and 21 females (26.3%) in their respective age groups living below the poverty level.
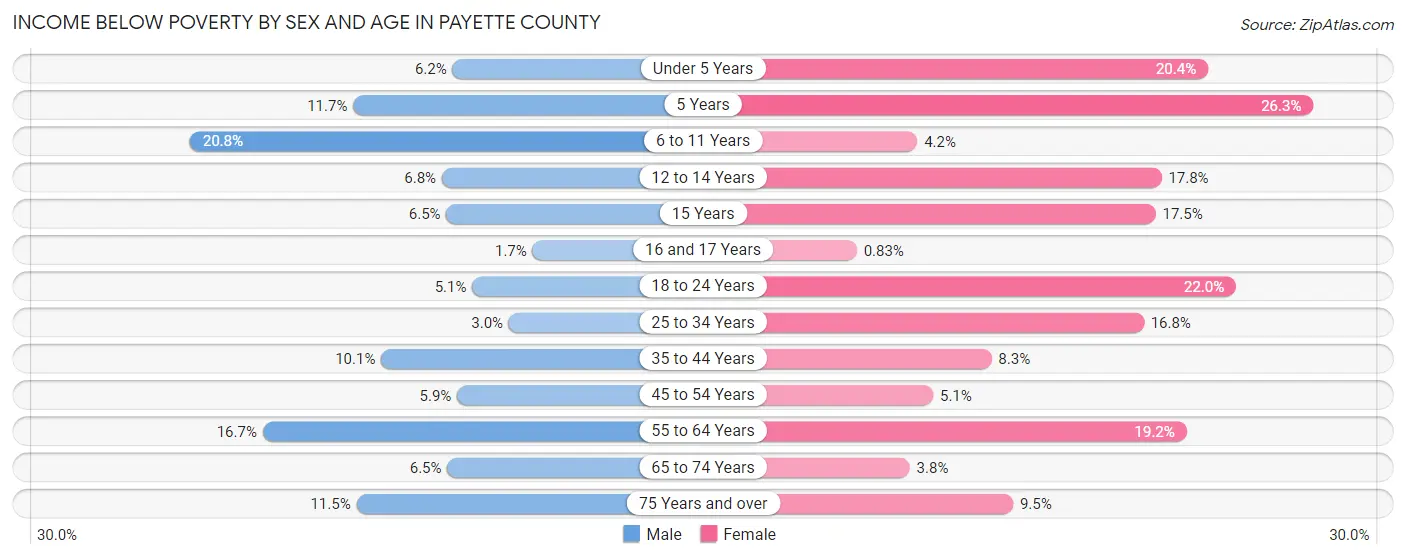
| Age Bracket | Male | Female |
| Under 5 Years | 45 (6.2%) | 187 (20.4%) |
| 5 Years | 20 (11.7%) | 21 (26.3%) |
| 6 to 11 Years | 229 (20.8%) | 46 (4.2%) |
| 12 to 14 Years | 43 (6.8%) | 94 (17.8%) |
| 15 Years | 19 (6.5%) | 47 (17.5%) |
| 16 and 17 Years | 6 (1.7%) | 2 (0.8%) |
| 18 to 24 Years | 52 (5.1%) | 207 (22.0%) |
| 25 to 34 Years | 47 (3.0%) | 252 (16.8%) |
| 35 to 44 Years | 136 (10.1%) | 126 (8.3%) |
| 45 to 54 Years | 90 (5.9%) | 78 (5.1%) |
| 55 to 64 Years | 257 (16.7%) | 308 (19.2%) |
| 65 to 74 Years | 87 (6.5%) | 53 (3.8%) |
| 75 Years and over | 114 (11.5%) | 97 (9.5%) |
| Total | 1,145 (9.1%) | 1,518 (12.0%) |
Income Above Poverty by Sex and Age in Payette County
According to the poverty statistics in Payette County, males aged 16 and 17 years and females aged 16 and 17 years are the age groups that are most secure financially, with 98.3% of males and 99.2% of females in these age groups living above the poverty line.
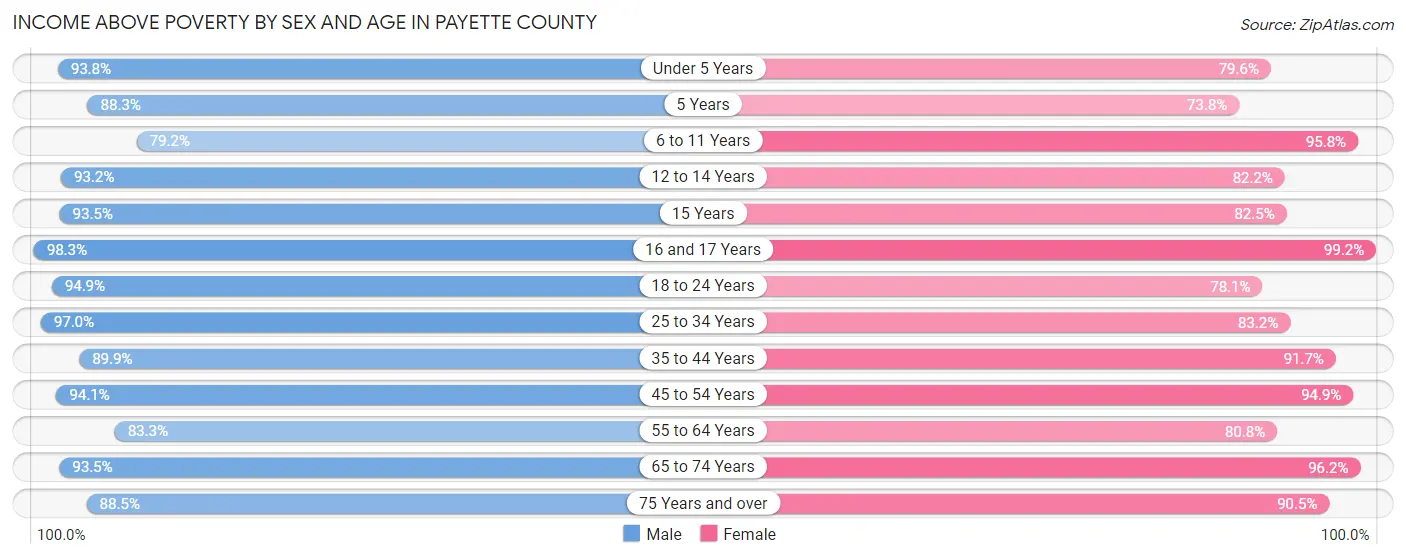
| Age Bracket | Male | Female |
| Under 5 Years | 684 (93.8%) | 730 (79.6%) |
| 5 Years | 151 (88.3%) | 59 (73.8%) |
| 6 to 11 Years | 872 (79.2%) | 1,048 (95.8%) |
| 12 to 14 Years | 593 (93.2%) | 434 (82.2%) |
| 15 Years | 273 (93.5%) | 222 (82.5%) |
| 16 and 17 Years | 344 (98.3%) | 238 (99.2%) |
| 18 to 24 Years | 974 (94.9%) | 736 (78.0%) |
| 25 to 34 Years | 1,503 (97.0%) | 1,247 (83.2%) |
| 35 to 44 Years | 1,205 (89.9%) | 1,387 (91.7%) |
| 45 to 54 Years | 1,434 (94.1%) | 1,458 (94.9%) |
| 55 to 64 Years | 1,278 (83.3%) | 1,296 (80.8%) |
| 65 to 74 Years | 1,259 (93.5%) | 1,348 (96.2%) |
| 75 Years and over | 876 (88.5%) | 921 (90.5%) |
| Total | 11,446 (90.9%) | 11,124 (88.0%) |
Income Below Poverty Among Married-Couple Families in Payette County
The poverty statistics for married-couple families in Payette County show that 2.7% or 147 of the total 5,387 families live below the poverty line. Families with 5 or more children have the highest poverty rate of 9.3%, comprising of 26 families. On the other hand, families with 1 or 2 children have the lowest poverty rate of 1.2%, which includes 18 families.
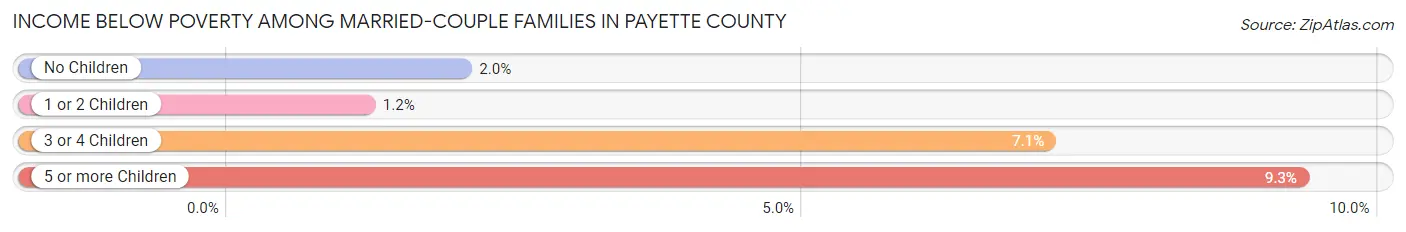
| Children | Above Poverty | Below Poverty |
| No Children | 2,974 (98.0%) | 62 (2.0%) |
| 1 or 2 Children | 1,478 (98.8%) | 18 (1.2%) |
| 3 or 4 Children | 535 (92.9%) | 41 (7.1%) |
| 5 or more Children | 253 (90.7%) | 26 (9.3%) |
| Total | 5,240 (97.3%) | 147 (2.7%) |
Income Below Poverty Among Single-Parent Households in Payette County
According to the poverty data in Payette County, 6.8% or 14 single-father households and 39.4% or 375 single-mother households are living below the poverty line. Among single-father households, those with no children have the highest poverty rate, with 7 households (14.3%) experiencing poverty. Likewise, among single-mother households, those with 1 or 2 children have the highest poverty rate, with 303 households (48.4%) falling below the poverty line.
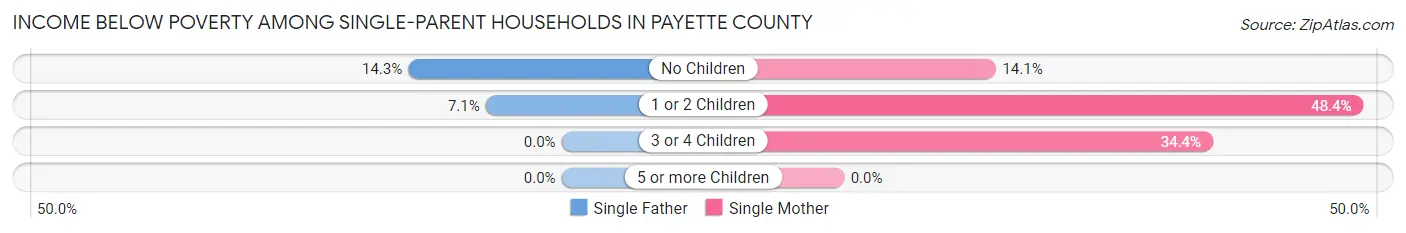
| Children | Single Father | Single Mother |
| No Children | 7 (14.3%) | 28 (14.1%) |
| 1 or 2 Children | 7 (7.1%) | 303 (48.4%) |
| 3 or 4 Children | 0 (0.0%) | 44 (34.4%) |
| 5 or more Children | 0 (0.0%) | 0 (0.0%) |
| Total | 14 (6.8%) | 375 (39.4%) |
Income Below Poverty Among Married-Couple vs Single-Parent Households in Payette County
The poverty data for Payette County shows that 147 of the married-couple family households (2.7%) and 389 of the single-parent households (33.6%) are living below the poverty level. Within the married-couple family households, those with 5 or more children have the highest poverty rate, with 26 households (9.3%) falling below the poverty line. Among the single-parent households, those with 1 or 2 children have the highest poverty rate, with 310 household (42.8%) living below poverty.
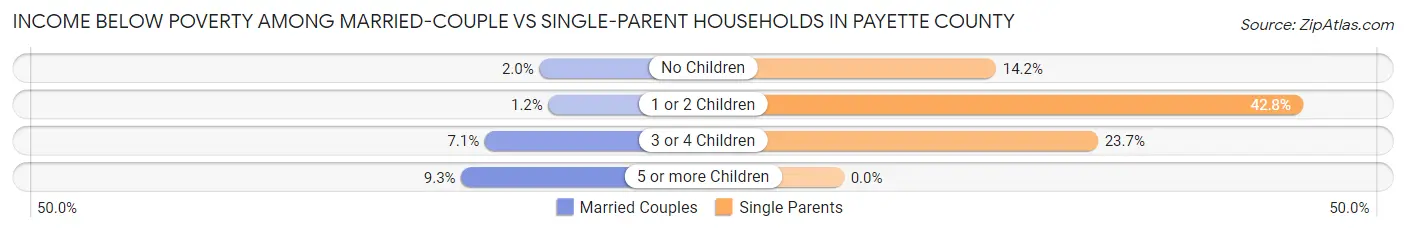
| Children | Married-Couple Families | Single-Parent Households |
| No Children | 62 (2.0%) | 35 (14.2%) |
| 1 or 2 Children | 18 (1.2%) | 310 (42.8%) |
| 3 or 4 Children | 41 (7.1%) | 44 (23.7%) |
| 5 or more Children | 26 (9.3%) | 0 (0.0%) |
| Total | 147 (2.7%) | 389 (33.6%) |
Employment Characteristics in Payette County
Employment by Class of Employer in Payette County
Among the 10,627 employed individuals in Payette County, private company employees (6,588 | 62.0%), not-for-profit organizations (946 | 8.9%), and local government employees (874 | 8.2%) make up the most common classes of employment.
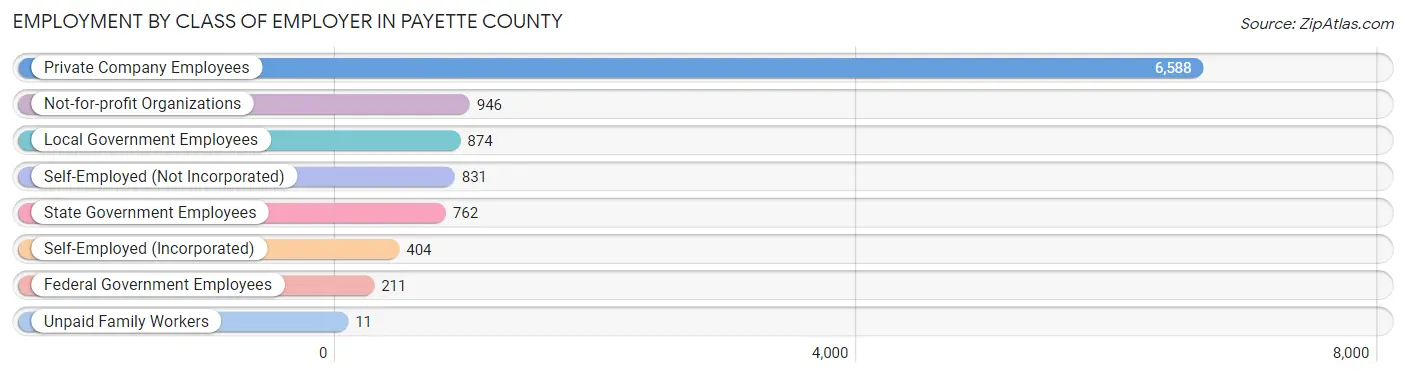
| Employer Class | # Employees | % Employees |
| Private Company Employees | 6,588 | 62.0% |
| Self-Employed (Incorporated) | 404 | 3.8% |
| Self-Employed (Not Incorporated) | 831 | 7.8% |
| Not-for-profit Organizations | 946 | 8.9% |
| Local Government Employees | 874 | 8.2% |
| State Government Employees | 762 | 7.2% |
| Federal Government Employees | 211 | 2.0% |
| Unpaid Family Workers | 11 | 0.1% |
| Total | 10,627 | 100.0% |
Employment Status by Age in Payette County
According to the labor force statistics for Payette County, out of the total population over 16 years of age (19,623), 57.5% or 11,283 individuals are in the labor force, with 4.4% or 496 of them unemployed. The age group with the highest labor force participation rate is 45 to 54 years, with 83.7% or 2,585 individuals in the labor force. Within the labor force, the 65 to 74 years age range has the highest percentage of unemployed individuals, with 13.3% or 113 of them being unemployed.
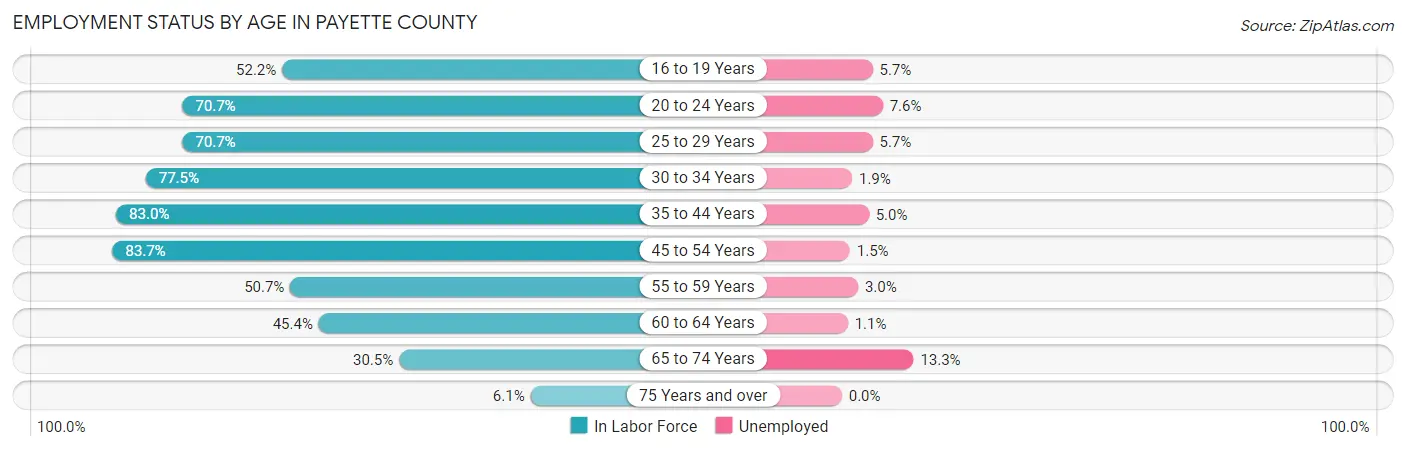
| Age Bracket | In Labor Force | Unemployed |
| 16 to 19 Years | 663 (52.2%) | 38 (5.7%) |
| 20 to 24 Years | 912 (70.7%) | 69 (7.6%) |
| 25 to 29 Years | 1,121 (70.7%) | 64 (5.7%) |
| 30 to 34 Years | 1,152 (77.5%) | 22 (1.9%) |
| 35 to 44 Years | 2,369 (83.0%) | 118 (5.0%) |
| 45 to 54 Years | 2,585 (83.7%) | 39 (1.5%) |
| 55 to 59 Years | 673 (50.7%) | 20 (3.0%) |
| 60 to 64 Years | 830 (45.4%) | 9 (1.1%) |
| 65 to 74 Years | 851 (30.5%) | 113 (13.3%) |
| 75 Years and over | 128 (6.1%) | 0 (0.0%) |
| Total | 11,283 (57.5%) | 496 (4.4%) |
Employment Status by Educational Attainment in Payette County
According to labor force statistics for Payette County, 71.7% of individuals (8,727) out of the total population between 25 and 64 years of age (12,171) are in the labor force, with 3.1% or 271 of them being unemployed. The group with the highest labor force participation rate are those with the educational attainment of bachelor's degree or higher, with 81.8% or 2,195 individuals in the labor force. Within the labor force, individuals with college / associate degree education have the highest percentage of unemployment, with 4.3% or 113 of them being unemployed.
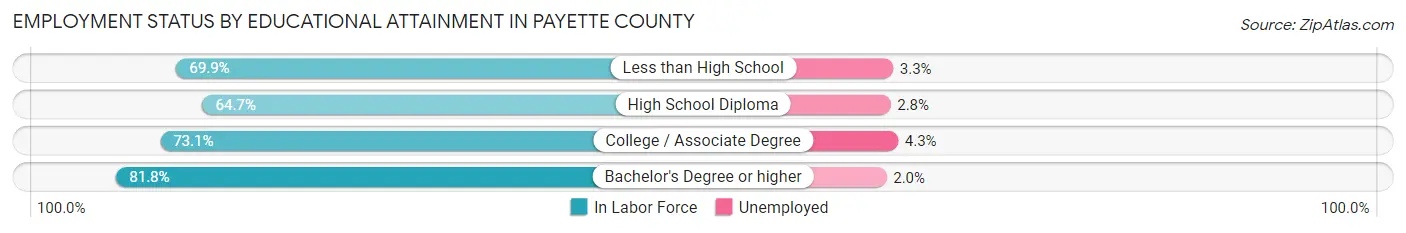
| Educational Attainment | In Labor Force | Unemployed |
| Less than High School | 1,323 (69.9%) | 62 (3.3%) |
| High School Diploma | 2,593 (64.7%) | 112 (2.8%) |
| College / Associate Degree | 2,623 (73.1%) | 154 (4.3%) |
| Bachelor's Degree or higher | 2,195 (81.8%) | 54 (2.0%) |
| Total | 8,727 (71.7%) | 377 (3.1%) |
Employment Occupations by Sex in Payette County
Management, Business, Science and Arts Occupations
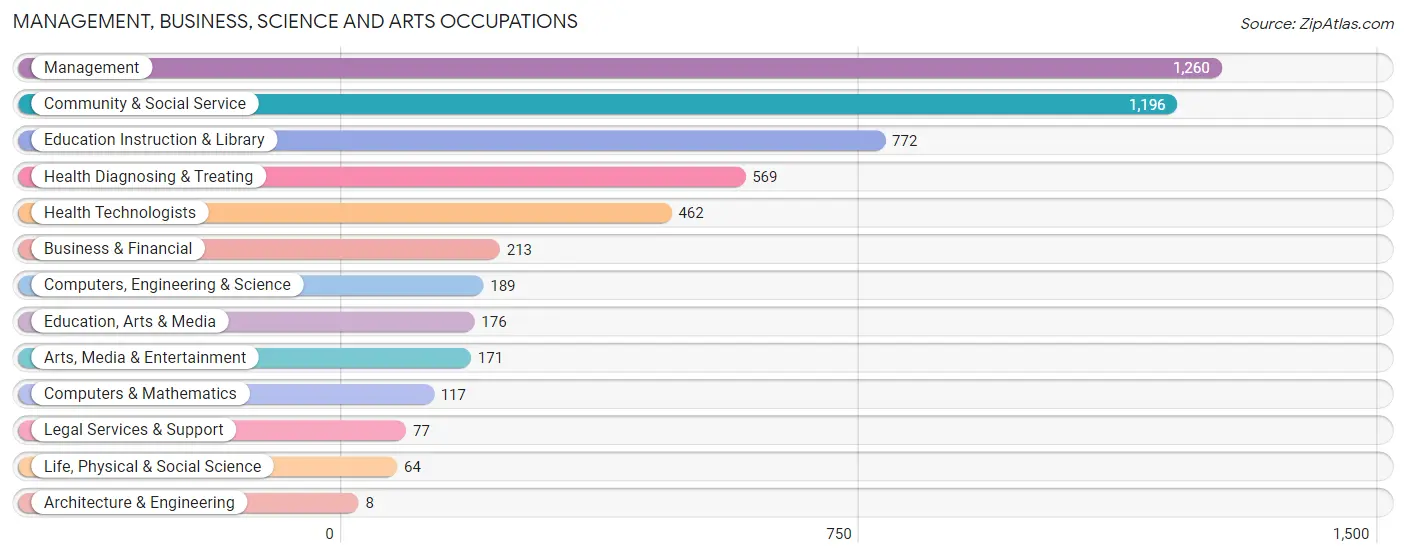
The most common Management, Business, Science and Arts occupations in Payette County are Management (1,260 | 11.7%), Community & Social Service (1,196 | 11.1%), Education Instruction & Library (772 | 7.2%), Health Diagnosing & Treating (569 | 5.3%), and Health Technologists (462 | 4.3%).
Management, Business, Science and Arts Occupations by Sex
Within the Management, Business, Science and Arts occupations in Payette County, the most male-oriented occupations are Life, Physical & Social Science (100.0%), Computers, Engineering & Science (95.2%), and Computers & Mathematics (93.2%), while the most female-oriented occupations are Education Instruction & Library (87.3%), Education, Arts & Media (85.8%), and Health Diagnosing & Treating (83.3%).
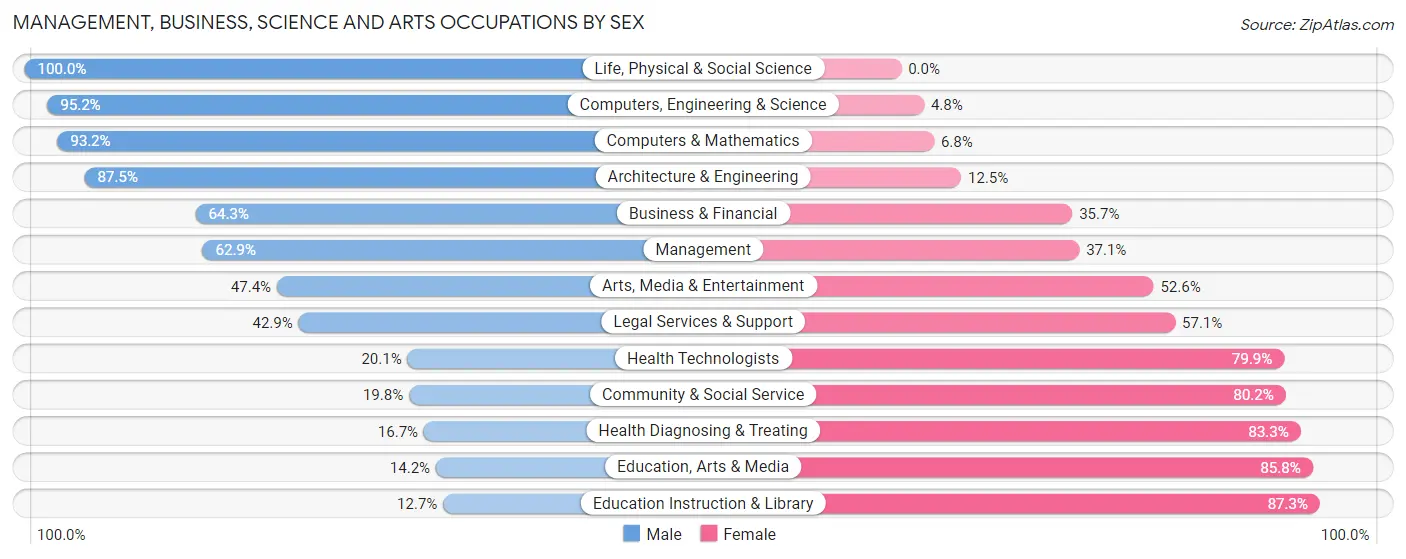
| Occupation | Male | Female |
| Management | 792 (62.9%) | 468 (37.1%) |
| Business & Financial | 137 (64.3%) | 76 (35.7%) |
| Computers, Engineering & Science | 180 (95.2%) | 9 (4.8%) |
| Computers & Mathematics | 109 (93.2%) | 8 (6.8%) |
| Architecture & Engineering | 7 (87.5%) | 1 (12.5%) |
| Life, Physical & Social Science | 64 (100.0%) | 0 (0.0%) |
| Community & Social Service | 237 (19.8%) | 959 (80.2%) |
| Education, Arts & Media | 25 (14.2%) | 151 (85.8%) |
| Legal Services & Support | 33 (42.9%) | 44 (57.1%) |
| Education Instruction & Library | 98 (12.7%) | 674 (87.3%) |
| Arts, Media & Entertainment | 81 (47.4%) | 90 (52.6%) |
| Health Diagnosing & Treating | 95 (16.7%) | 474 (83.3%) |
| Health Technologists | 93 (20.1%) | 369 (79.9%) |
| Total (Category) | 1,441 (42.0%) | 1,986 (58.0%) |
| Total (Overall) | 5,849 (54.2%) | 4,932 (45.8%) |
Services Occupations
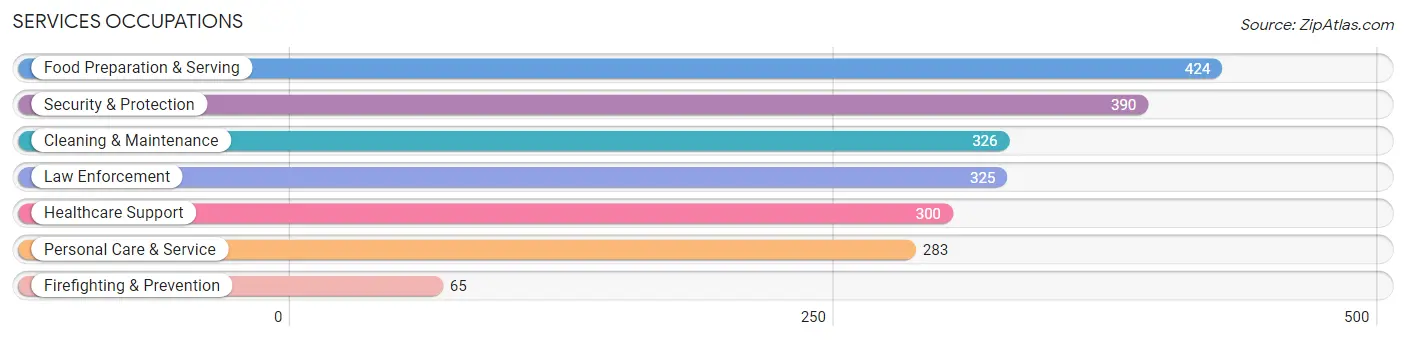
The most common Services occupations in Payette County are Food Preparation & Serving (424 | 3.9%), Security & Protection (390 | 3.6%), Cleaning & Maintenance (326 | 3.0%), Law Enforcement (325 | 3.0%), and Healthcare Support (300 | 2.8%).
Services Occupations by Sex
Within the Services occupations in Payette County, the most male-oriented occupations are Firefighting & Prevention (86.2%), Security & Protection (78.2%), and Law Enforcement (76.6%), while the most female-oriented occupations are Healthcare Support (83.7%), Food Preparation & Serving (75.5%), and Personal Care & Service (65.0%).
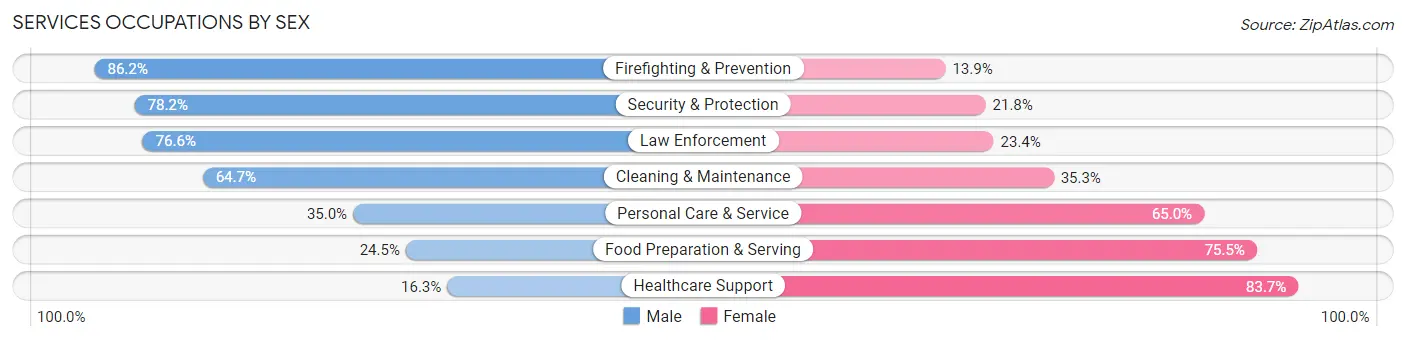
| Occupation | Male | Female |
| Healthcare Support | 49 (16.3%) | 251 (83.7%) |
| Security & Protection | 305 (78.2%) | 85 (21.8%) |
| Firefighting & Prevention | 56 (86.2%) | 9 (13.9%) |
| Law Enforcement | 249 (76.6%) | 76 (23.4%) |
| Food Preparation & Serving | 104 (24.5%) | 320 (75.5%) |
| Cleaning & Maintenance | 211 (64.7%) | 115 (35.3%) |
| Personal Care & Service | 99 (35.0%) | 184 (65.0%) |
| Total (Category) | 768 (44.6%) | 955 (55.4%) |
| Total (Overall) | 5,849 (54.2%) | 4,932 (45.8%) |
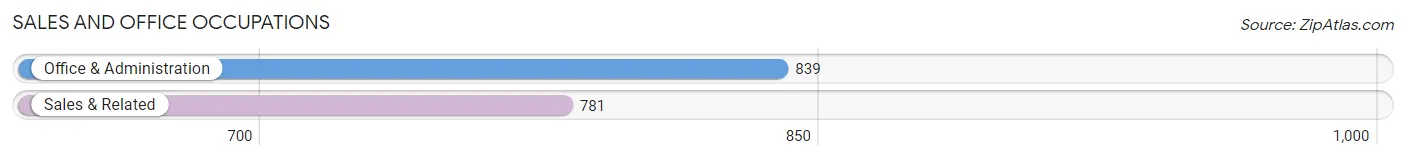
Sales and Office Occupations
The most common Sales and Office occupations in Payette County are Office & Administration (839 | 7.8%), and Sales & Related (781 | 7.2%).
Sales and Office Occupations by Sex
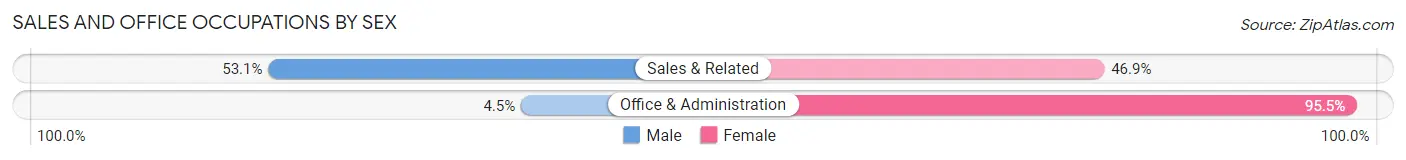
| Occupation | Male | Female |
| Sales & Related | 415 (53.1%) | 366 (46.9%) |
| Office & Administration | 38 (4.5%) | 801 (95.5%) |
| Total (Category) | 453 (28.0%) | 1,167 (72.0%) |
| Total (Overall) | 5,849 (54.2%) | 4,932 (45.8%) |
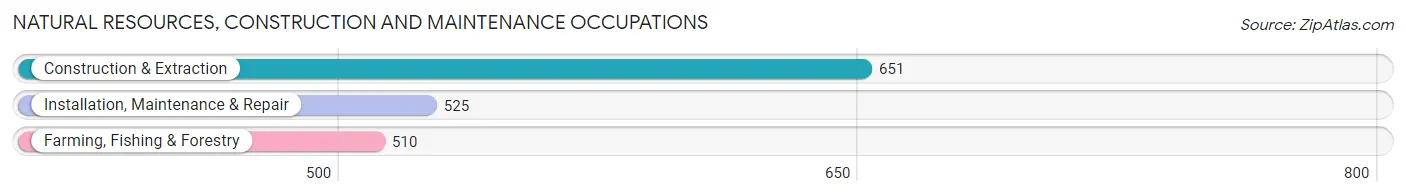
Natural Resources, Construction and Maintenance Occupations
The most common Natural Resources, Construction and Maintenance occupations in Payette County are Construction & Extraction (651 | 6.0%), Installation, Maintenance & Repair (525 | 4.9%), and Farming, Fishing & Forestry (510 | 4.7%).
Natural Resources, Construction and Maintenance Occupations by Sex
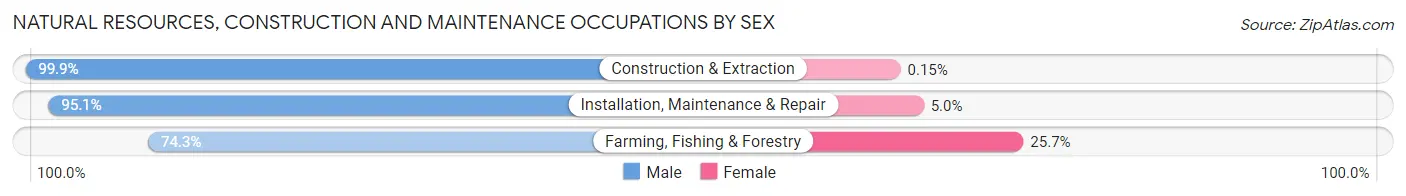
| Occupation | Male | Female |
| Farming, Fishing & Forestry | 379 (74.3%) | 131 (25.7%) |
| Construction & Extraction | 650 (99.9%) | 1 (0.2%) |
| Installation, Maintenance & Repair | 499 (95.1%) | 26 (5.0%) |
| Total (Category) | 1,528 (90.6%) | 158 (9.4%) |
| Total (Overall) | 5,849 (54.2%) | 4,932 (45.8%) |
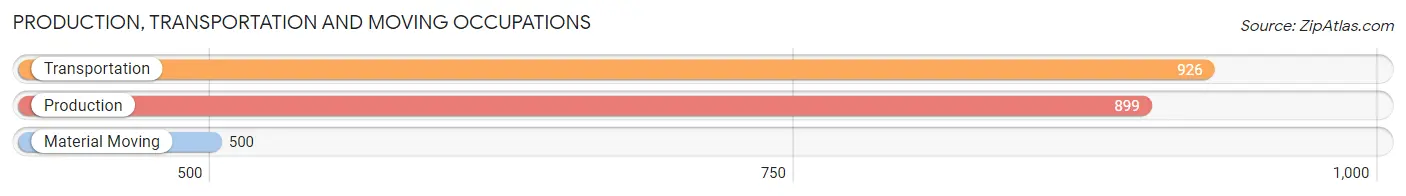
Production, Transportation and Moving Occupations
The most common Production, Transportation and Moving occupations in Payette County are Transportation (926 | 8.6%), Production (899 | 8.3%), and Material Moving (500 | 4.6%).
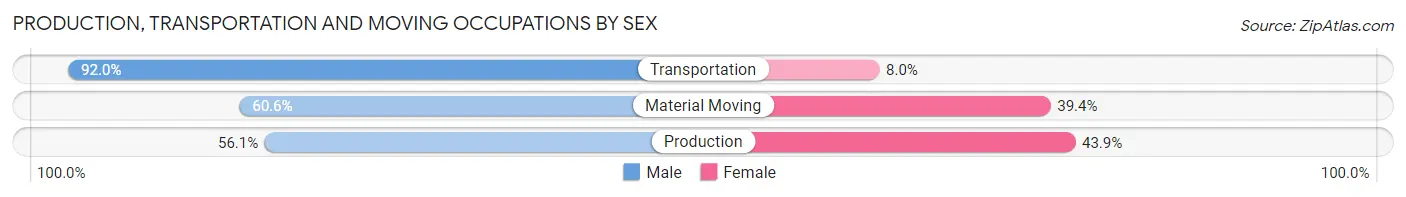
Production, Transportation and Moving Occupations by Sex
| Occupation | Male | Female |
| Production | 504 (56.1%) | 395 (43.9%) |
| Transportation | 852 (92.0%) | 74 (8.0%) |
| Material Moving | 303 (60.6%) | 197 (39.4%) |
| Total (Category) | 1,659 (71.4%) | 666 (28.6%) |
| Total (Overall) | 5,849 (54.2%) | 4,932 (45.8%) |
Employment Industries by Sex in Payette County
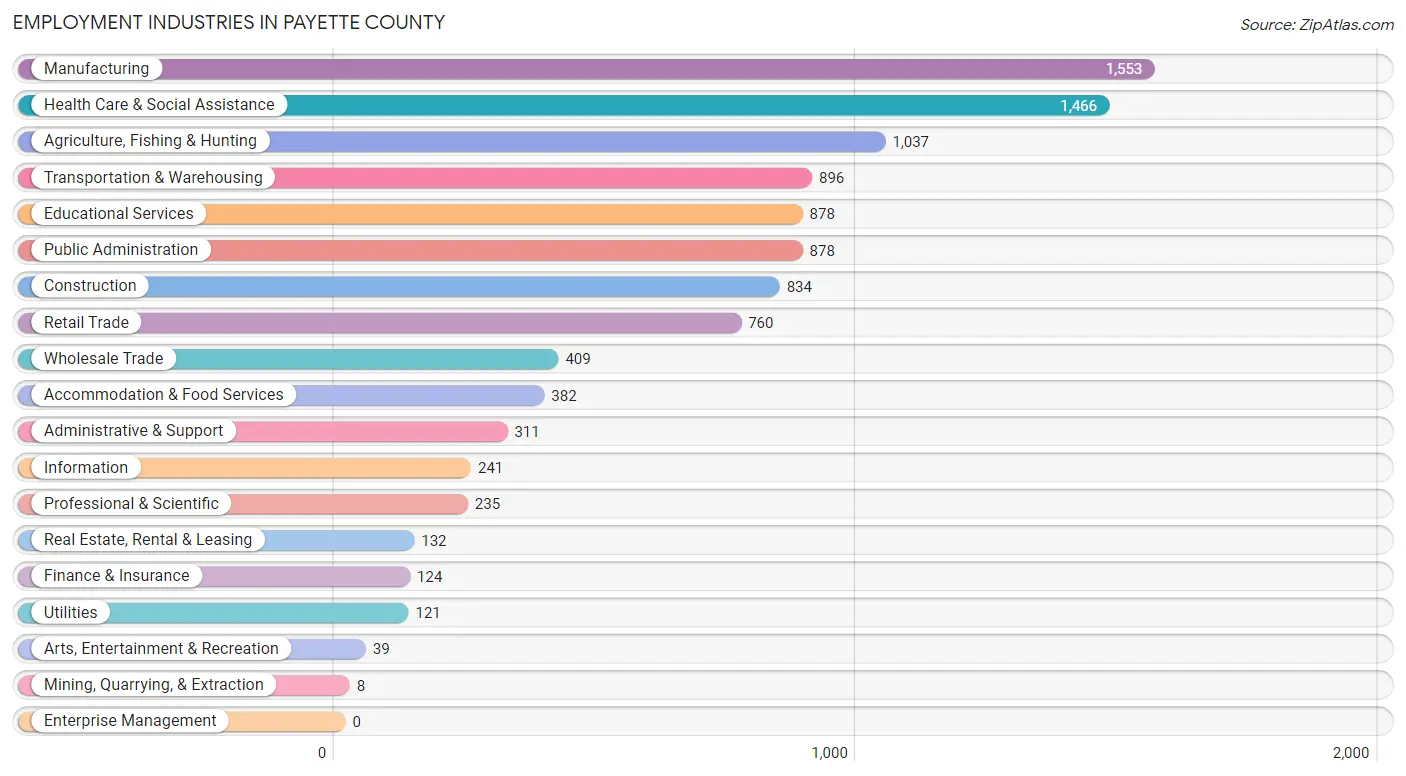
Employment Industries in Payette County
The major employment industries in Payette County include Manufacturing (1,553 | 14.4%), Health Care & Social Assistance (1,466 | 13.6%), Agriculture, Fishing & Hunting (1,037 | 9.6%), Transportation & Warehousing (896 | 8.3%), and Educational Services (878 | 8.1%).
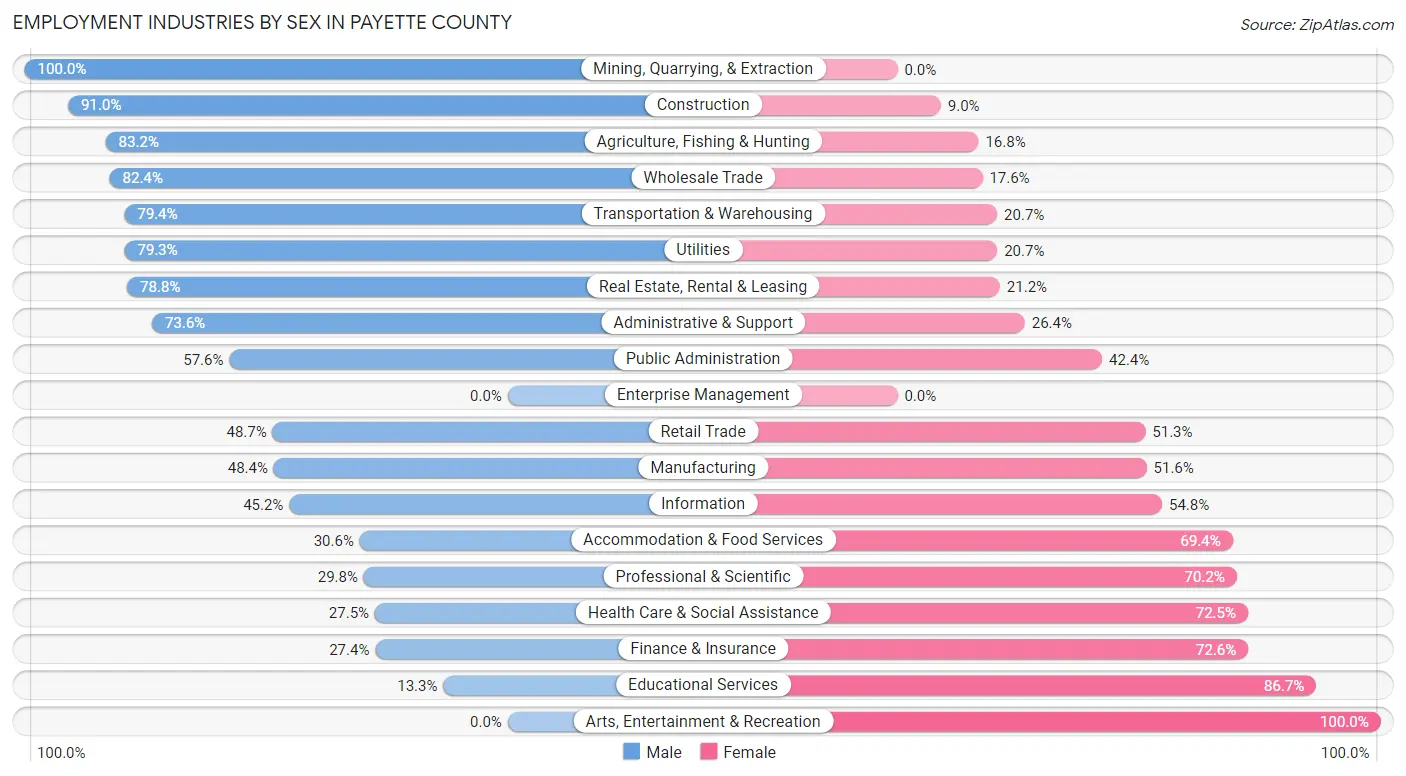
Employment Industries by Sex in Payette County
The Payette County industries that see more men than women are Mining, Quarrying, & Extraction (100.0%), Construction (91.0%), and Agriculture, Fishing & Hunting (83.2%), whereas the industries that tend to have a higher number of women are Arts, Entertainment & Recreation (100.0%), Educational Services (86.7%), and Finance & Insurance (72.6%).
| Industry | Male | Female |
| Agriculture, Fishing & Hunting | 863 (83.2%) | 174 (16.8%) |
| Mining, Quarrying, & Extraction | 8 (100.0%) | 0 (0.0%) |
| Construction | 759 (91.0%) | 75 (9.0%) |
| Manufacturing | 752 (48.4%) | 801 (51.6%) |
| Wholesale Trade | 337 (82.4%) | 72 (17.6%) |
| Retail Trade | 370 (48.7%) | 390 (51.3%) |
| Transportation & Warehousing | 711 (79.3%) | 185 (20.6%) |
| Utilities | 96 (79.3%) | 25 (20.7%) |
| Information | 109 (45.2%) | 132 (54.8%) |
| Finance & Insurance | 34 (27.4%) | 90 (72.6%) |
| Real Estate, Rental & Leasing | 104 (78.8%) | 28 (21.2%) |
| Professional & Scientific | 70 (29.8%) | 165 (70.2%) |
| Enterprise Management | 0 (0.0%) | 0 (0.0%) |
| Administrative & Support | 229 (73.6%) | 82 (26.4%) |
| Educational Services | 117 (13.3%) | 761 (86.7%) |
| Health Care & Social Assistance | 403 (27.5%) | 1,063 (72.5%) |
| Arts, Entertainment & Recreation | 0 (0.0%) | 39 (100.0%) |
| Accommodation & Food Services | 117 (30.6%) | 265 (69.4%) |
| Public Administration | 506 (57.6%) | 372 (42.4%) |
| Total | 5,849 (54.2%) | 4,932 (45.8%) |
Education in Payette County
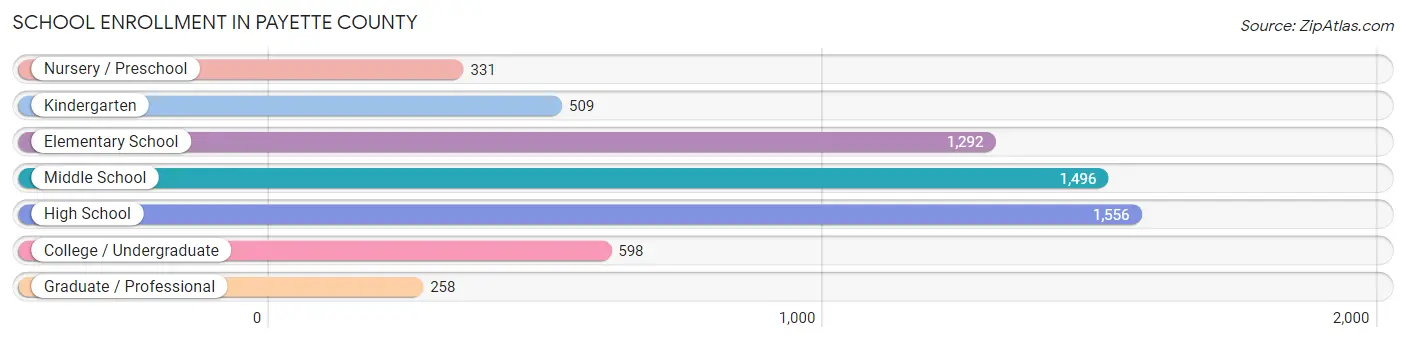
School Enrollment in Payette County
The most common levels of schooling among the 6,040 students in Payette County are high school (1,556 | 25.8%), middle school (1,496 | 24.8%), and elementary school (1,292 | 21.4%).
| School Level | # Students | % Students |
| Nursery / Preschool | 331 | 5.5% |
| Kindergarten | 509 | 8.4% |
| Elementary School | 1,292 | 21.4% |
| Middle School | 1,496 | 24.8% |
| High School | 1,556 | 25.8% |
| College / Undergraduate | 598 | 9.9% |
| Graduate / Professional | 258 | 4.3% |
| Total | 6,040 | 100.0% |
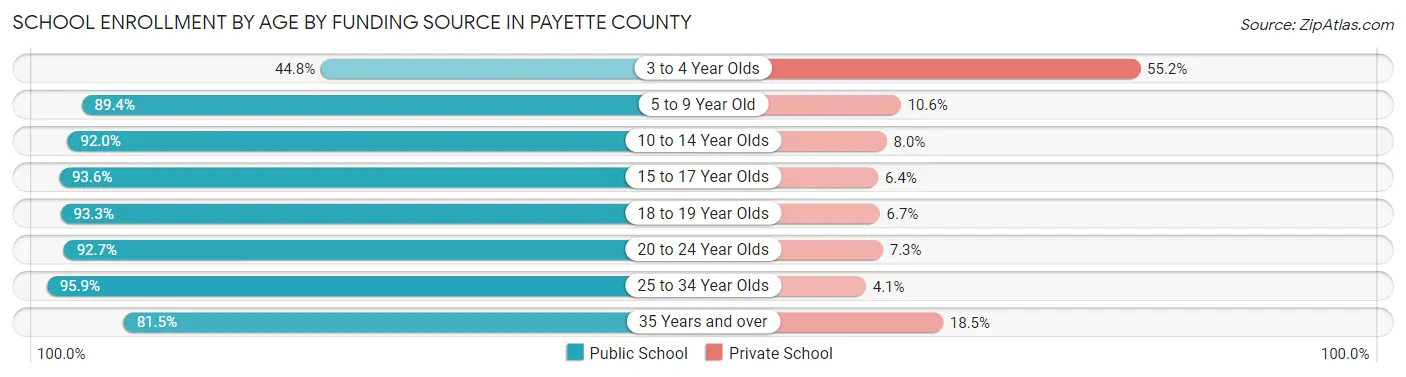
School Enrollment by Age by Funding Source in Payette County
Out of a total of 6,040 students who are enrolled in schools in Payette County, 640 (10.6%) attend a private institution, while the remaining 5,400 (89.4%) are enrolled in public schools. The age group of 3 to 4 year olds has the highest likelihood of being enrolled in private schools, with 127 (55.2% in the age bracket) enrolled. Conversely, the age group of 25 to 34 year olds has the lowest likelihood of being enrolled in a private school, with 256 (95.9% in the age bracket) attending a public institution.
| Age Bracket | Public School | Private School |
| 3 to 4 Year Olds | 103 (44.8%) | 127 (55.2%) |
| 5 to 9 Year Old | 1,549 (89.4%) | 184 (10.6%) |
| 10 to 14 Year Olds | 1,737 (92.0%) | 151 (8.0%) |
| 15 to 17 Year Olds | 1,066 (93.6%) | 73 (6.4%) |
| 18 to 19 Year Olds | 223 (93.3%) | 16 (6.7%) |
| 20 to 24 Year Olds | 178 (92.7%) | 14 (7.3%) |
| 25 to 34 Year Olds | 256 (95.9%) | 11 (4.1%) |
| 35 Years and over | 287 (81.5%) | 65 (18.5%) |
| Total | 5,400 (89.4%) | 640 (10.6%) |
Educational Attainment by Field of Study in Payette County
Education (822 | 23.0%), science & technology (619 | 17.3%), business (394 | 11.0%), bio, nature & agricultural (377 | 10.6%), and arts & humanities (308 | 8.6%) are the most common fields of study among 3,569 individuals in Payette County who have obtained a bachelor's degree or higher.
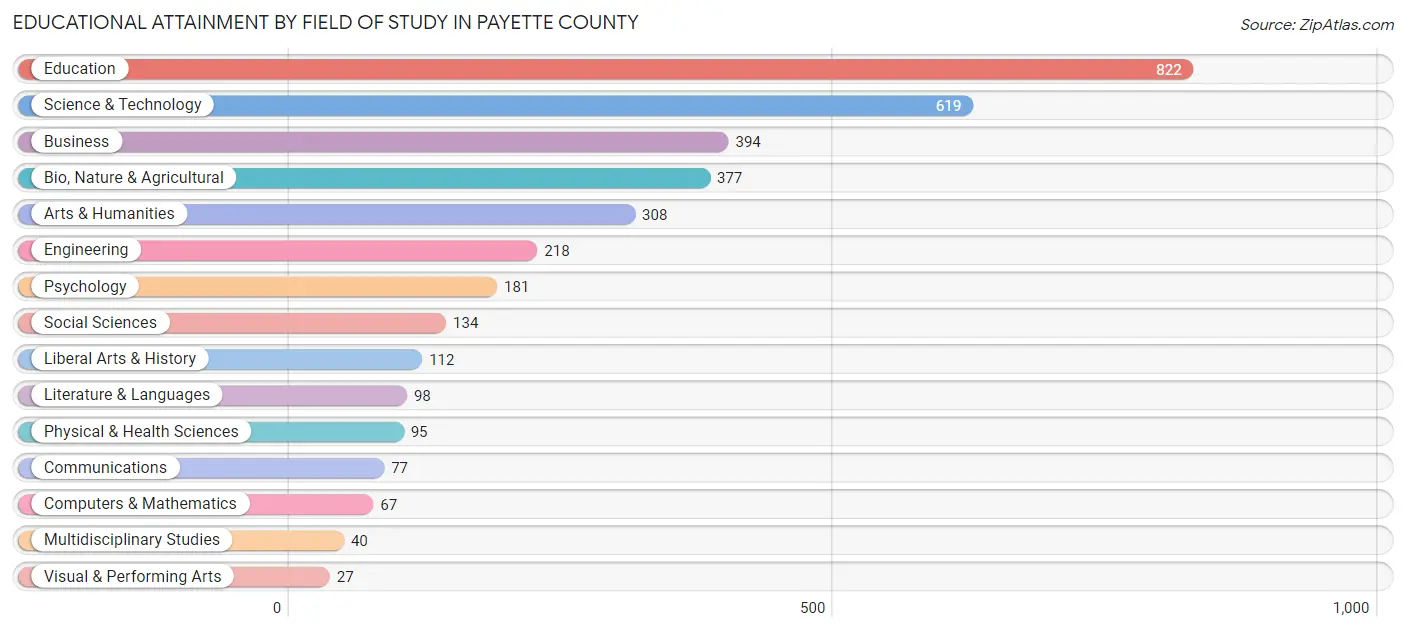
| Field of Study | # Graduates | % Graduates |
| Computers & Mathematics | 67 | 1.9% |
| Bio, Nature & Agricultural | 377 | 10.6% |
| Physical & Health Sciences | 95 | 2.7% |
| Psychology | 181 | 5.1% |
| Social Sciences | 134 | 3.7% |
| Engineering | 218 | 6.1% |
| Multidisciplinary Studies | 40 | 1.1% |
| Science & Technology | 619 | 17.3% |
| Business | 394 | 11.0% |
| Education | 822 | 23.0% |
| Literature & Languages | 98 | 2.8% |
| Liberal Arts & History | 112 | 3.1% |
| Visual & Performing Arts | 27 | 0.8% |
| Communications | 77 | 2.2% |
| Arts & Humanities | 308 | 8.6% |
| Total | 3,569 | 100.0% |
Transportation & Commute in Payette County
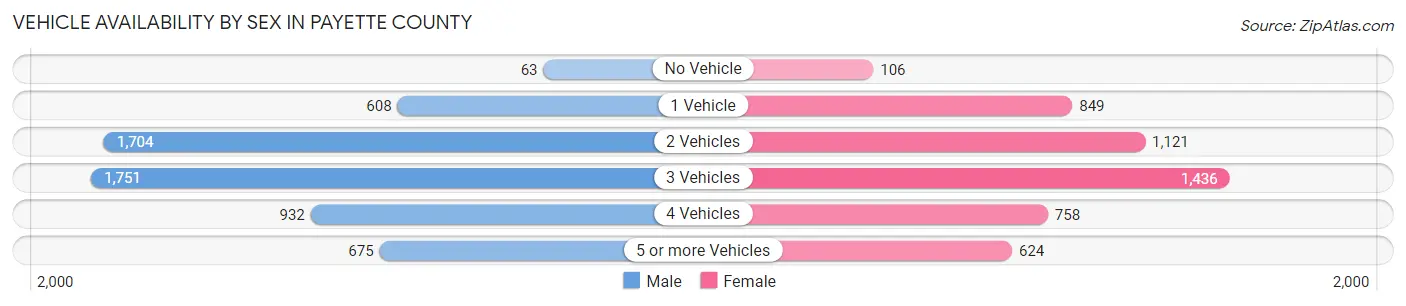
Vehicle Availability by Sex in Payette County
The most prevalent vehicle ownership categories in Payette County are males with 3 vehicles (1,751, accounting for 30.5%) and females with 3 vehicles (1,436, making up 35.8%).
| Vehicles Available | Male | Female |
| No Vehicle | 63 (1.1%) | 106 (2.2%) |
| 1 Vehicle | 608 (10.6%) | 849 (17.3%) |
| 2 Vehicles | 1,704 (29.7%) | 1,121 (22.9%) |
| 3 Vehicles | 1,751 (30.5%) | 1,436 (29.3%) |
| 4 Vehicles | 932 (16.3%) | 758 (15.5%) |
| 5 or more Vehicles | 675 (11.8%) | 624 (12.8%) |
| Total | 5,733 (100.0%) | 4,894 (100.0%) |
Commute Time in Payette County
The most frequently occuring commute durations in Payette County are 15 to 19 minutes (2,007 commuters, 19.7%), 10 to 14 minutes (1,914 commuters, 18.8%), and 20 to 24 minutes (1,372 commuters, 13.5%).
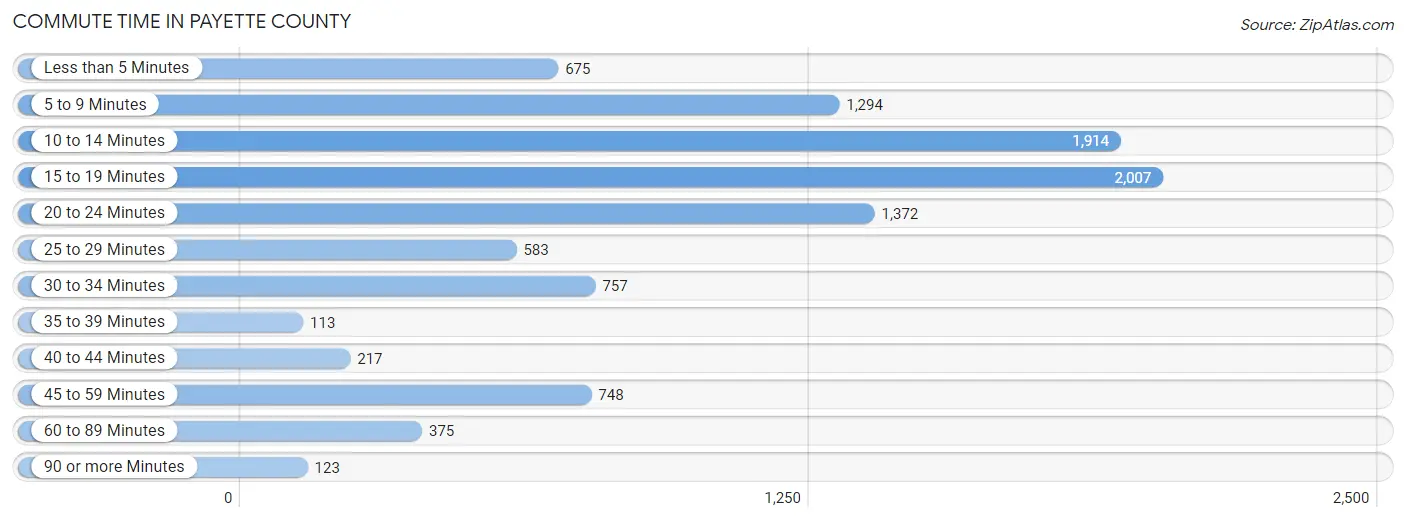
| Commute Time | # Commuters | % Commuters |
| Less than 5 Minutes | 675 | 6.6% |
| 5 to 9 Minutes | 1,294 | 12.7% |
| 10 to 14 Minutes | 1,914 | 18.8% |
| 15 to 19 Minutes | 2,007 | 19.7% |
| 20 to 24 Minutes | 1,372 | 13.5% |
| 25 to 29 Minutes | 583 | 5.7% |
| 30 to 34 Minutes | 757 | 7.4% |
| 35 to 39 Minutes | 113 | 1.1% |
| 40 to 44 Minutes | 217 | 2.1% |
| 45 to 59 Minutes | 748 | 7.3% |
| 60 to 89 Minutes | 375 | 3.7% |
| 90 or more Minutes | 123 | 1.2% |
Commute Time by Sex in Payette County
The most common commute times in Payette County are 15 to 19 minutes (884 commuters, 15.9%) for males and 10 to 14 minutes (1,162 commuters, 25.2%) for females.
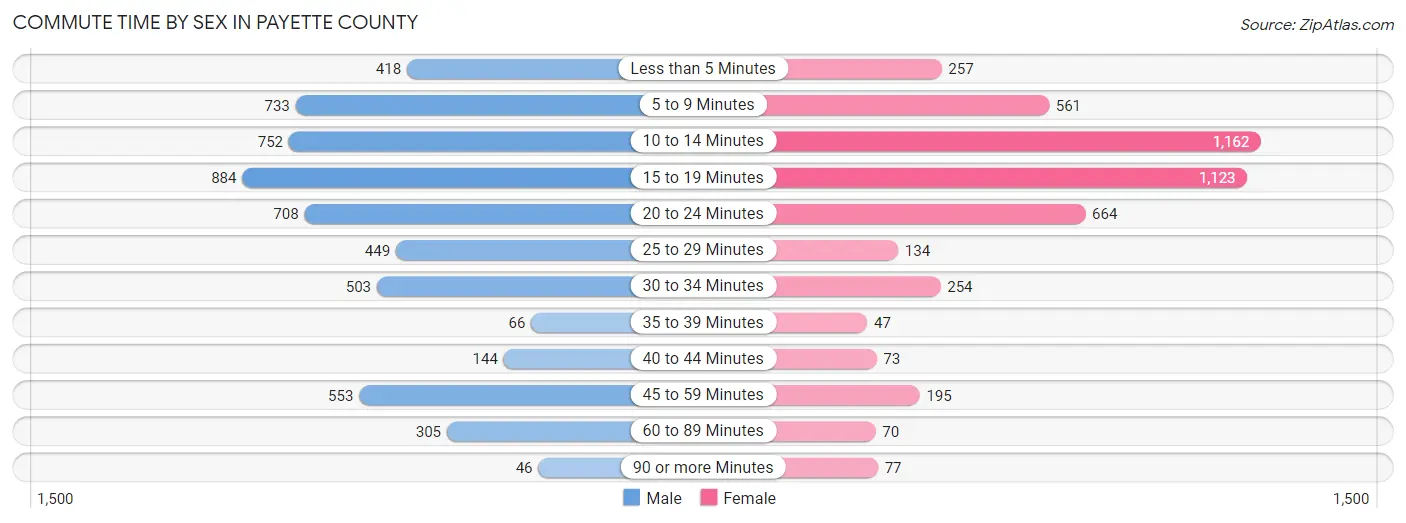
| Commute Time | Male | Female |
| Less than 5 Minutes | 418 (7.5%) | 257 (5.6%) |
| 5 to 9 Minutes | 733 (13.2%) | 561 (12.1%) |
| 10 to 14 Minutes | 752 (13.5%) | 1,162 (25.2%) |
| 15 to 19 Minutes | 884 (15.9%) | 1,123 (24.3%) |
| 20 to 24 Minutes | 708 (12.7%) | 664 (14.4%) |
| 25 to 29 Minutes | 449 (8.1%) | 134 (2.9%) |
| 30 to 34 Minutes | 503 (9.0%) | 254 (5.5%) |
| 35 to 39 Minutes | 66 (1.2%) | 47 (1.0%) |
| 40 to 44 Minutes | 144 (2.6%) | 73 (1.6%) |
| 45 to 59 Minutes | 553 (9.9%) | 195 (4.2%) |
| 60 to 89 Minutes | 305 (5.5%) | 70 (1.5%) |
| 90 or more Minutes | 46 (0.8%) | 77 (1.7%) |
Time of Departure to Work by Sex in Payette County
The most frequent times of departure to work in Payette County are 7:30 AM to 7:59 AM (959, 17.2%) for males and 7:30 AM to 7:59 AM (943, 20.4%) for females.
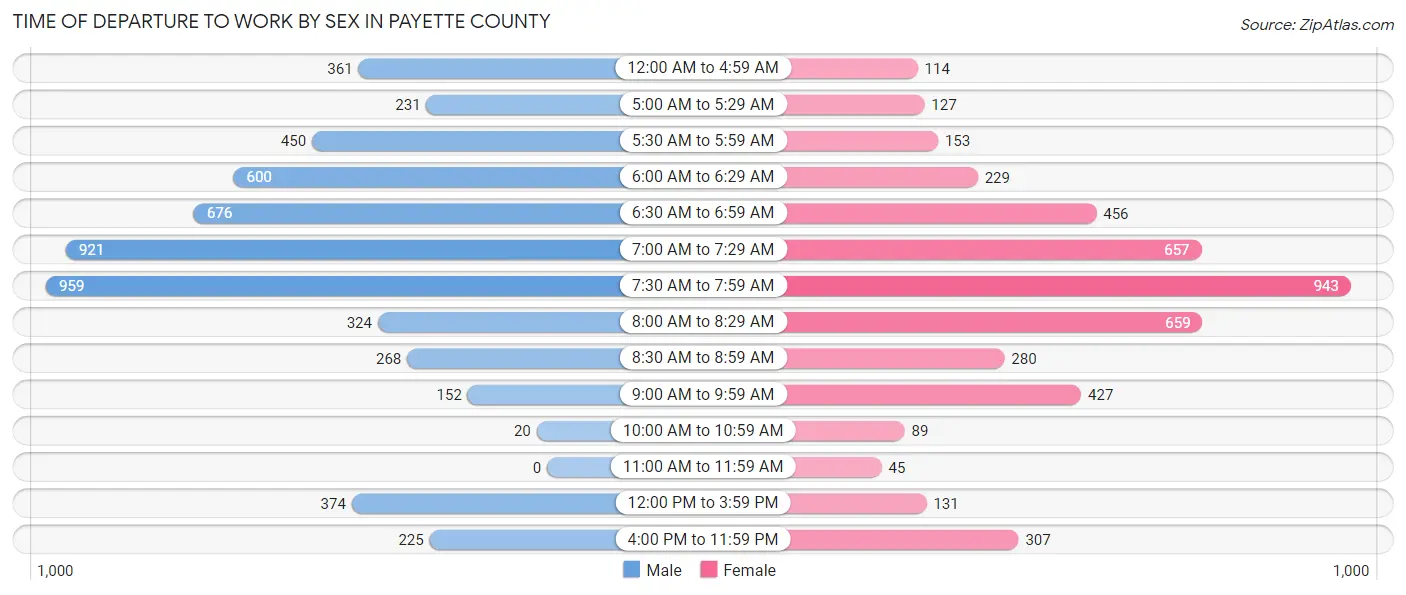
| Time of Departure | Male | Female |
| 12:00 AM to 4:59 AM | 361 (6.5%) | 114 (2.5%) |
| 5:00 AM to 5:29 AM | 231 (4.2%) | 127 (2.8%) |
| 5:30 AM to 5:59 AM | 450 (8.1%) | 153 (3.3%) |
| 6:00 AM to 6:29 AM | 600 (10.8%) | 229 (5.0%) |
| 6:30 AM to 6:59 AM | 676 (12.2%) | 456 (9.9%) |
| 7:00 AM to 7:29 AM | 921 (16.6%) | 657 (14.2%) |
| 7:30 AM to 7:59 AM | 959 (17.2%) | 943 (20.4%) |
| 8:00 AM to 8:29 AM | 324 (5.8%) | 659 (14.3%) |
| 8:30 AM to 8:59 AM | 268 (4.8%) | 280 (6.1%) |
| 9:00 AM to 9:59 AM | 152 (2.7%) | 427 (9.2%) |
| 10:00 AM to 10:59 AM | 20 (0.4%) | 89 (1.9%) |
| 11:00 AM to 11:59 AM | 0 (0.0%) | 45 (1.0%) |
| 12:00 PM to 3:59 PM | 374 (6.7%) | 131 (2.8%) |
| 4:00 PM to 11:59 PM | 225 (4.1%) | 307 (6.7%) |
| Total | 5,561 (100.0%) | 4,617 (100.0%) |
Housing Occupancy in Payette County
Occupancy by Ownership in Payette County
Of the total 9,352 dwellings in Payette County, owner-occupied units account for 6,625 (70.8%), while renter-occupied units make up 2,727 (29.2%).
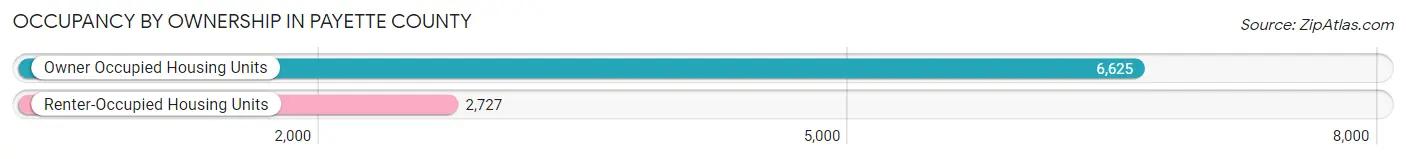
| Occupancy | # Housing Units | % Housing Units |
| Owner Occupied Housing Units | 6,625 | 70.8% |
| Renter-Occupied Housing Units | 2,727 | 29.2% |
| Total Occupied Housing Units | 9,352 | 100.0% |
Occupancy by Household Size in Payette County
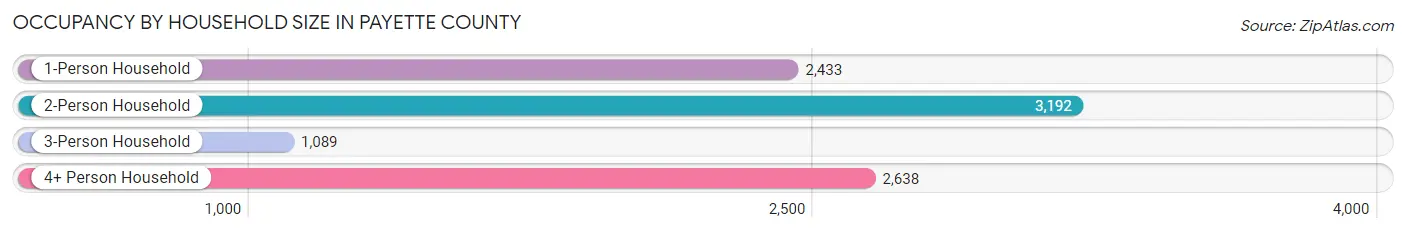
| Household Size | # Housing Units | % Housing Units |
| 1-Person Household | 2,433 | 26.0% |
| 2-Person Household | 3,192 | 34.1% |
| 3-Person Household | 1,089 | 11.6% |
| 4+ Person Household | 2,638 | 28.2% |
| Total Housing Units | 9,352 | 100.0% |
Occupancy by Ownership by Household Size in Payette County
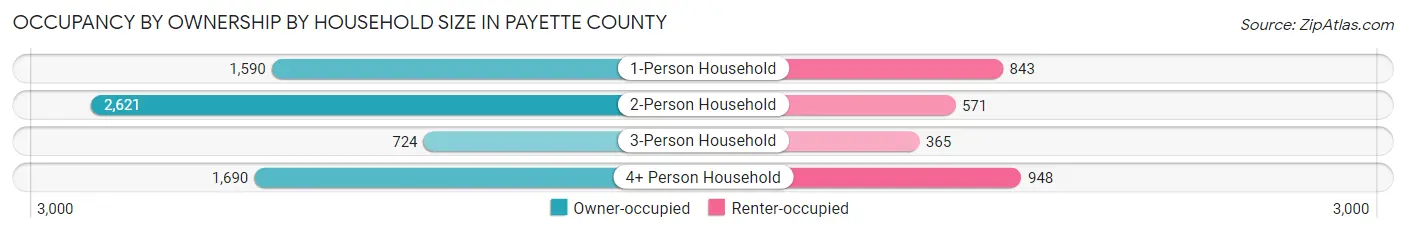
| Household Size | Owner-occupied | Renter-occupied |
| 1-Person Household | 1,590 (65.3%) | 843 (34.6%) |
| 2-Person Household | 2,621 (82.1%) | 571 (17.9%) |
| 3-Person Household | 724 (66.5%) | 365 (33.5%) |
| 4+ Person Household | 1,690 (64.1%) | 948 (35.9%) |
| Total Housing Units | 6,625 (70.8%) | 2,727 (29.2%) |
Occupancy by Educational Attainment in Payette County
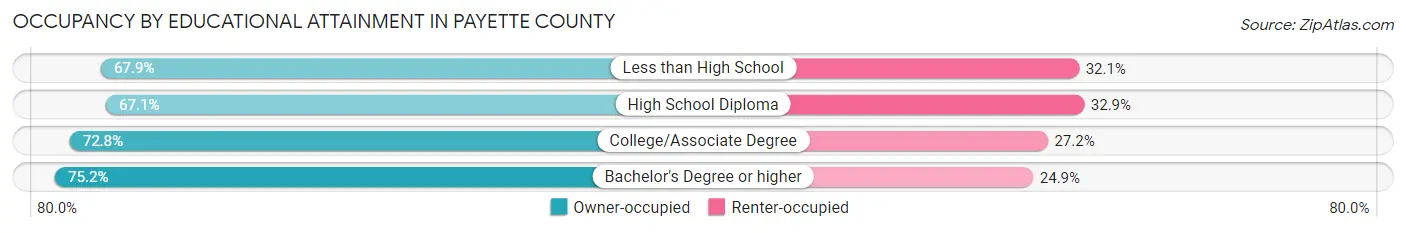
| Household Size | Owner-occupied | Renter-occupied |
| Less than High School | 672 (67.9%) | 318 (32.1%) |
| High School Diploma | 2,119 (67.1%) | 1,041 (32.9%) |
| College/Associate Degree | 2,364 (72.8%) | 882 (27.2%) |
| Bachelor's Degree or higher | 1,470 (75.1%) | 486 (24.8%) |
Occupancy by Age of Householder in Payette County
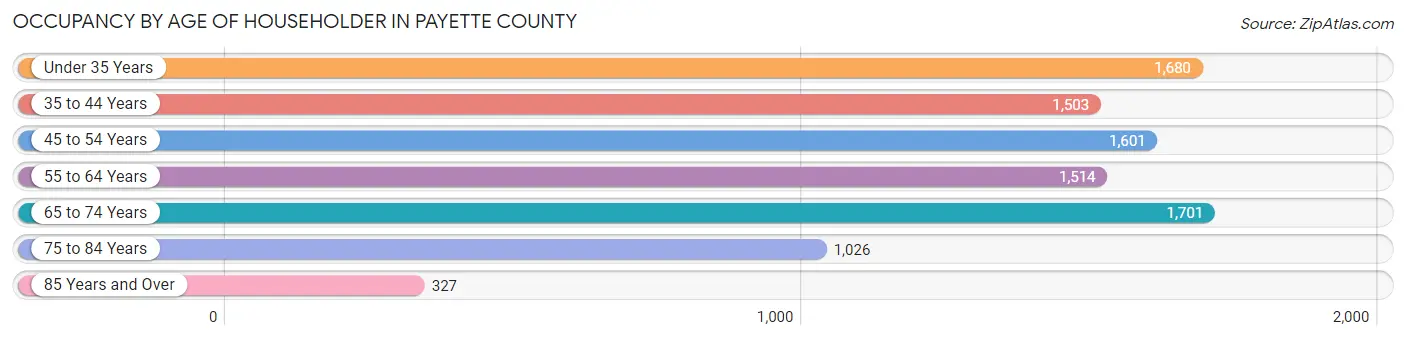
| Age Bracket | # Households | % Households |
| Under 35 Years | 1,680 | 18.0% |
| 35 to 44 Years | 1,503 | 16.1% |
| 45 to 54 Years | 1,601 | 17.1% |
| 55 to 64 Years | 1,514 | 16.2% |
| 65 to 74 Years | 1,701 | 18.2% |
| 75 to 84 Years | 1,026 | 11.0% |
| 85 Years and Over | 327 | 3.5% |
| Total | 9,352 | 100.0% |
Housing Finances in Payette County
Median Income by Occupancy in Payette County
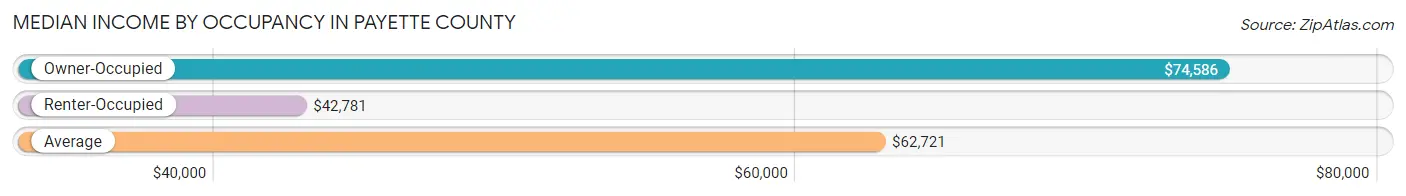
| Occupancy Type | # Households | Median Income |
| Owner-Occupied | 6,625 (70.8%) | $74,586 |
| Renter-Occupied | 2,727 (29.2%) | $42,781 |
| Average | 9,352 (100.0%) | $62,721 |
Occupancy by Householder Income Bracket in Payette County
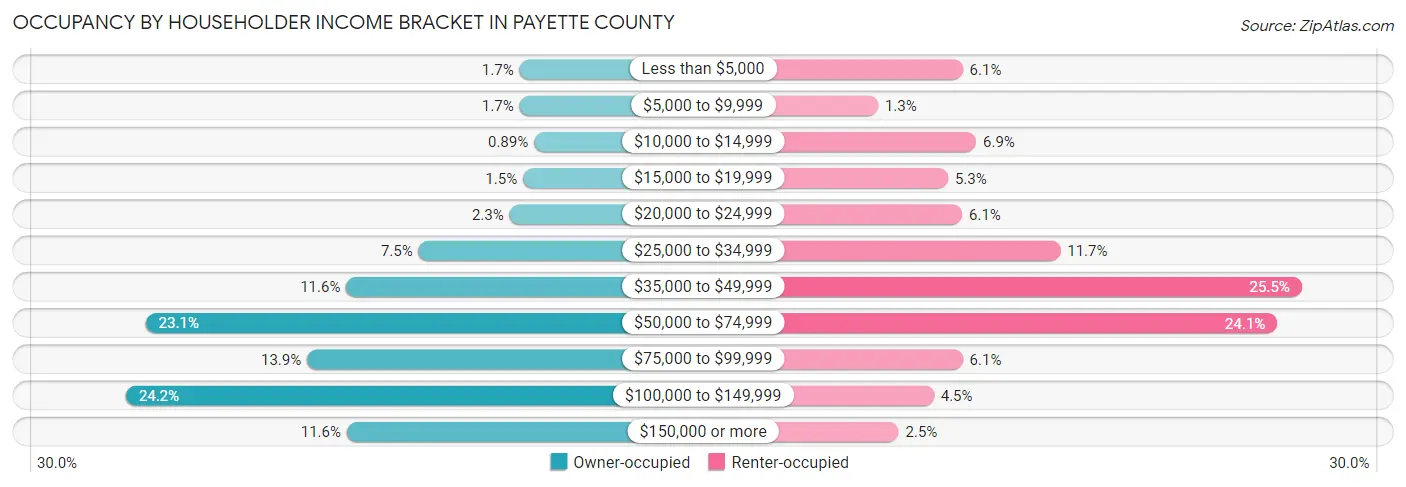
| Income Bracket | Owner-occupied | Renter-occupied |
| Less than $5,000 | 114 (1.7%) | 167 (6.1%) |
| $5,000 to $9,999 | 114 (1.7%) | 35 (1.3%) |
| $10,000 to $14,999 | 59 (0.9%) | 188 (6.9%) |
| $15,000 to $19,999 | 101 (1.5%) | 144 (5.3%) |
| $20,000 to $24,999 | 152 (2.3%) | 166 (6.1%) |
| $25,000 to $34,999 | 496 (7.5%) | 319 (11.7%) |
| $35,000 to $49,999 | 770 (11.6%) | 695 (25.5%) |
| $50,000 to $74,999 | 1,529 (23.1%) | 657 (24.1%) |
| $75,000 to $99,999 | 918 (13.9%) | 167 (6.1%) |
| $100,000 to $149,999 | 1,604 (24.2%) | 122 (4.5%) |
| $150,000 or more | 768 (11.6%) | 67 (2.5%) |
| Total | 6,625 (100.0%) | 2,727 (100.0%) |
Monthly Housing Cost Tiers in Payette County
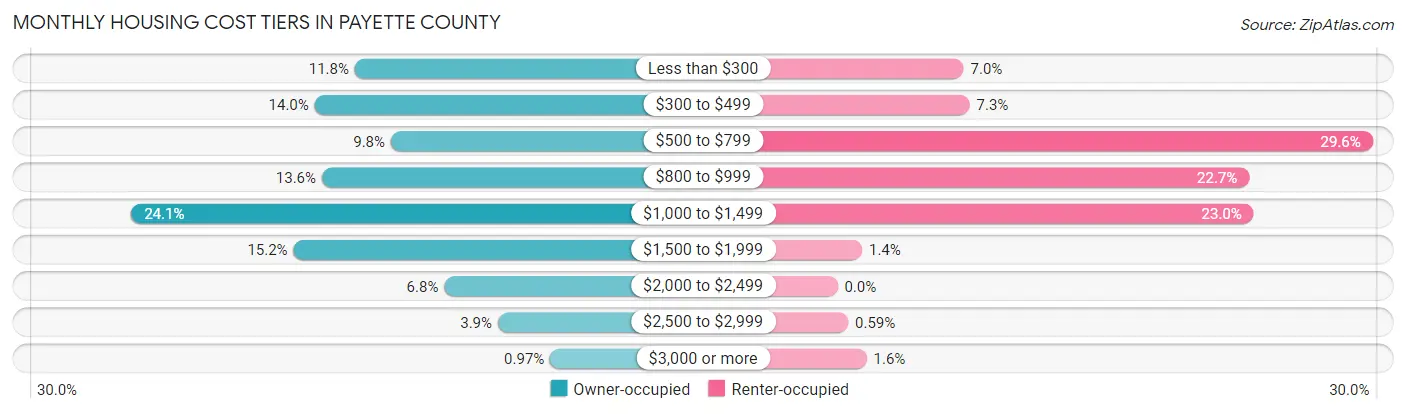
| Monthly Cost | Owner-occupied | Renter-occupied |
| Less than $300 | 779 (11.8%) | 190 (7.0%) |
| $300 to $499 | 926 (14.0%) | 199 (7.3%) |
| $500 to $799 | 647 (9.8%) | 806 (29.6%) |
| $800 to $999 | 900 (13.6%) | 620 (22.7%) |
| $1,000 to $1,499 | 1,597 (24.1%) | 627 (23.0%) |
| $1,500 to $1,999 | 1,004 (15.1%) | 37 (1.4%) |
| $2,000 to $2,499 | 452 (6.8%) | 0 (0.0%) |
| $2,500 to $2,999 | 256 (3.9%) | 16 (0.6%) |
| $3,000 or more | 64 (1.0%) | 44 (1.6%) |
| Total | 6,625 (100.0%) | 2,727 (100.0%) |
Physical Housing Characteristics in Payette County
Housing Structures in Payette County
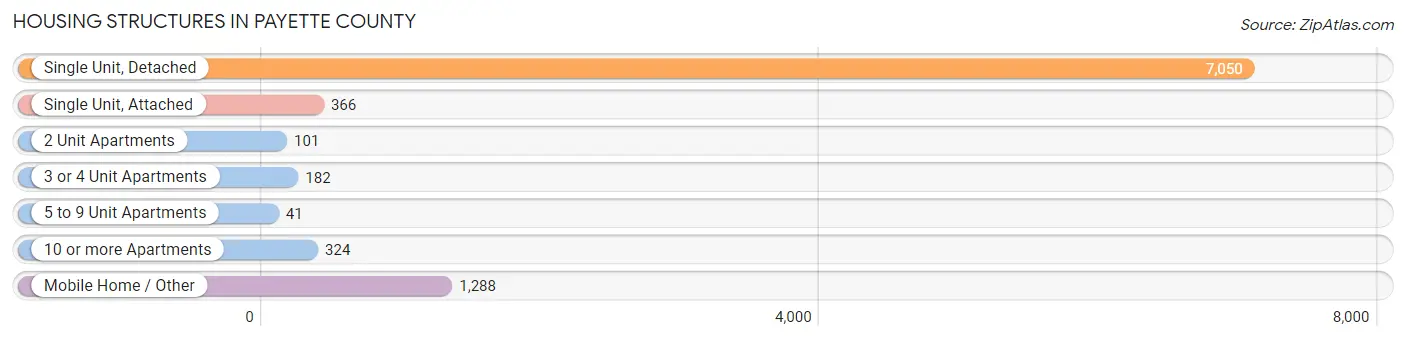
| Structure Type | # Housing Units | % Housing Units |
| Single Unit, Detached | 7,050 | 75.4% |
| Single Unit, Attached | 366 | 3.9% |
| 2 Unit Apartments | 101 | 1.1% |
| 3 or 4 Unit Apartments | 182 | 1.9% |
| 5 to 9 Unit Apartments | 41 | 0.4% |
| 10 or more Apartments | 324 | 3.5% |
| Mobile Home / Other | 1,288 | 13.8% |
| Total | 9,352 | 100.0% |
Housing Structures by Occupancy in Payette County
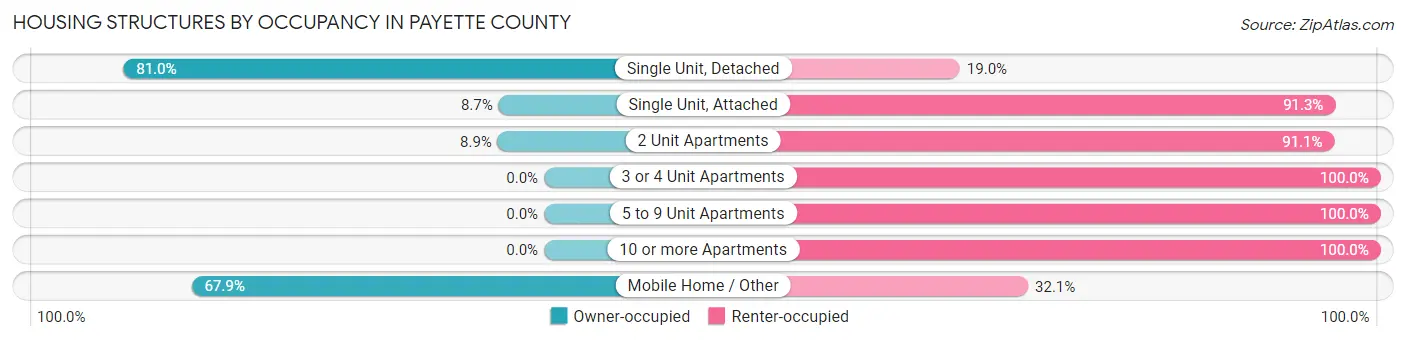
| Structure Type | Owner-occupied | Renter-occupied |
| Single Unit, Detached | 5,710 (81.0%) | 1,340 (19.0%) |
| Single Unit, Attached | 32 (8.7%) | 334 (91.3%) |
| 2 Unit Apartments | 9 (8.9%) | 92 (91.1%) |
| 3 or 4 Unit Apartments | 0 (0.0%) | 182 (100.0%) |
| 5 to 9 Unit Apartments | 0 (0.0%) | 41 (100.0%) |
| 10 or more Apartments | 0 (0.0%) | 324 (100.0%) |
| Mobile Home / Other | 874 (67.9%) | 414 (32.1%) |
| Total | 6,625 (70.8%) | 2,727 (29.2%) |
Housing Structures by Number of Rooms in Payette County
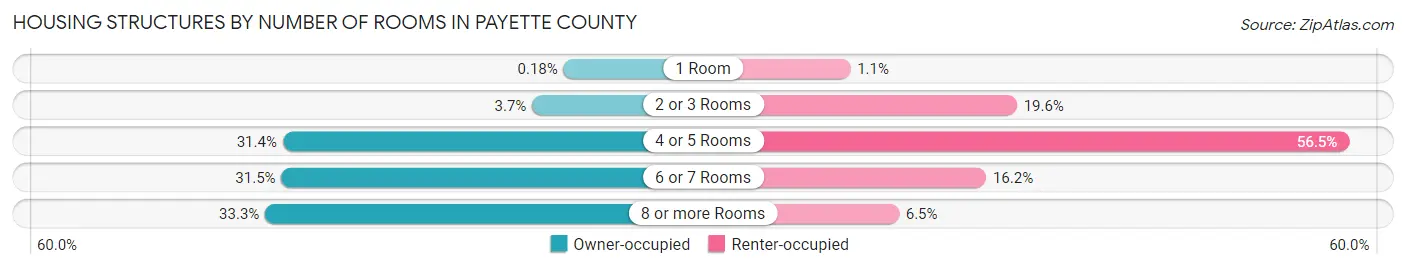
| Number of Rooms | Owner-occupied | Renter-occupied |
| 1 Room | 12 (0.2%) | 31 (1.1%) |
| 2 or 3 Rooms | 243 (3.7%) | 535 (19.6%) |
| 4 or 5 Rooms | 2,077 (31.4%) | 1,541 (56.5%) |
| 6 or 7 Rooms | 2,087 (31.5%) | 442 (16.2%) |
| 8 or more Rooms | 2,206 (33.3%) | 178 (6.5%) |
| Total | 6,625 (100.0%) | 2,727 (100.0%) |
Housing Structure by Heating Type in Payette County
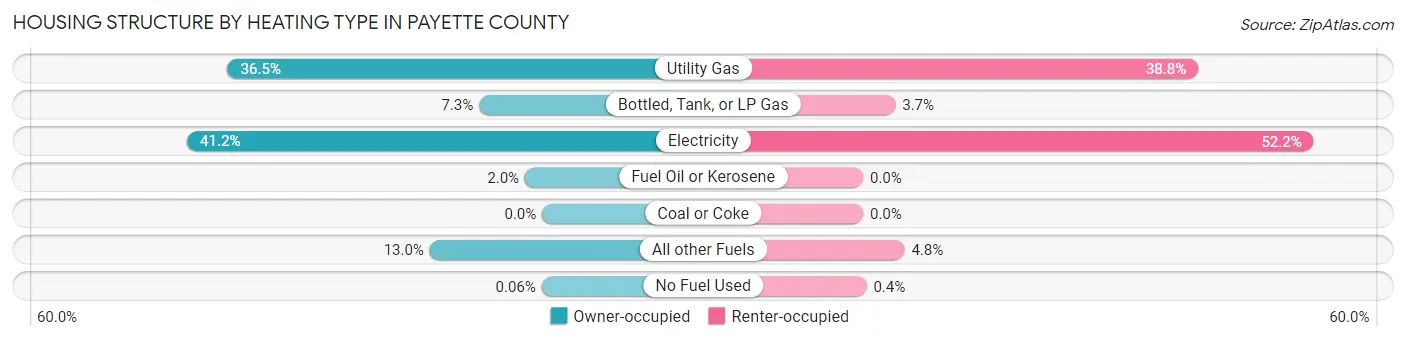
| Heating Type | Owner-occupied | Renter-occupied |
| Utility Gas | 2,416 (36.5%) | 1,059 (38.8%) |
| Bottled, Tank, or LP Gas | 484 (7.3%) | 102 (3.7%) |
| Electricity | 2,726 (41.1%) | 1,424 (52.2%) |
| Fuel Oil or Kerosene | 132 (2.0%) | 0 (0.0%) |
| Coal or Coke | 0 (0.0%) | 0 (0.0%) |
| All other Fuels | 863 (13.0%) | 131 (4.8%) |
| No Fuel Used | 4 (0.1%) | 11 (0.4%) |
| Total | 6,625 (100.0%) | 2,727 (100.0%) |
Household Vehicle Usage in Payette County
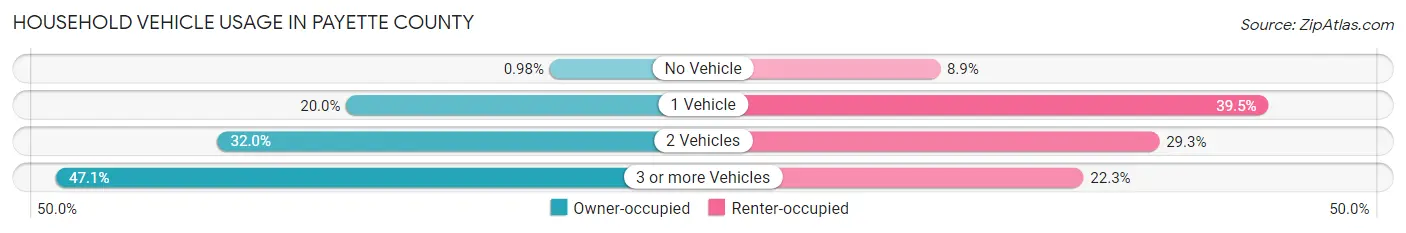
| Vehicles per Household | Owner-occupied | Renter-occupied |
| No Vehicle | 65 (1.0%) | 242 (8.9%) |
| 1 Vehicle | 1,323 (20.0%) | 1,078 (39.5%) |
| 2 Vehicles | 2,119 (32.0%) | 800 (29.3%) |
| 3 or more Vehicles | 3,118 (47.1%) | 607 (22.3%) |
| Total | 6,625 (100.0%) | 2,727 (100.0%) |
Real Estate & Mortgages in Payette County
Real Estate and Mortgage Overview in Payette County
| Characteristic | Without Mortgage | With Mortgage |
| Housing Units | 2,215 | 4,410 |
| Median Property Value | $212,900 | $287,500 |
| Median Household Income | $62,297 | $612 |
| Monthly Housing Costs | $375 | $52 |
| Real Estate Taxes | $1,146 | $97 |
Property Value by Mortgage Status in Payette County
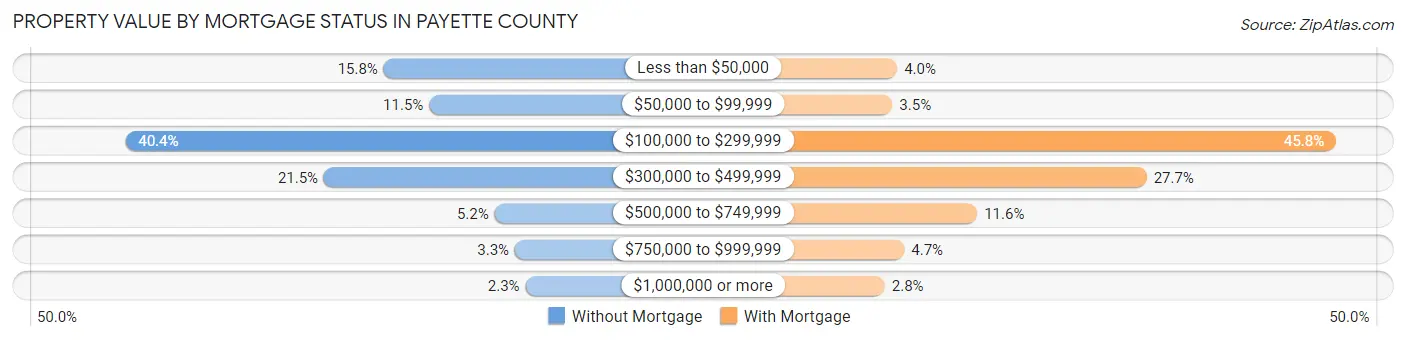
| Property Value | Without Mortgage | With Mortgage |
| Less than $50,000 | 350 (15.8%) | 175 (4.0%) |
| $50,000 to $99,999 | 254 (11.5%) | 155 (3.5%) |
| $100,000 to $299,999 | 895 (40.4%) | 2,018 (45.8%) |
| $300,000 to $499,999 | 476 (21.5%) | 1,223 (27.7%) |
| $500,000 to $749,999 | 116 (5.2%) | 511 (11.6%) |
| $750,000 to $999,999 | 73 (3.3%) | 205 (4.6%) |
| $1,000,000 or more | 51 (2.3%) | 123 (2.8%) |
| Total | 2,215 (100.0%) | 4,410 (100.0%) |
Household Income by Mortgage Status in Payette County
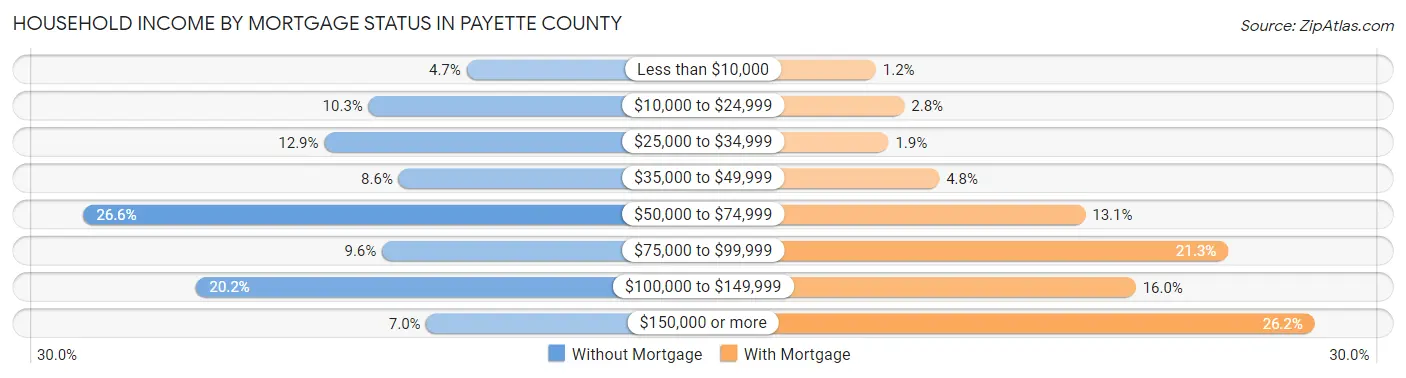
| Household Income | Without Mortgage | With Mortgage |
| Less than $10,000 | 105 (4.7%) | 51 (1.2%) |
| $10,000 to $24,999 | 229 (10.3%) | 123 (2.8%) |
| $25,000 to $34,999 | 285 (12.9%) | 83 (1.9%) |
| $35,000 to $49,999 | 191 (8.6%) | 211 (4.8%) |
| $50,000 to $74,999 | 590 (26.6%) | 579 (13.1%) |
| $75,000 to $99,999 | 212 (9.6%) | 939 (21.3%) |
| $100,000 to $149,999 | 447 (20.2%) | 706 (16.0%) |
| $150,000 or more | 156 (7.0%) | 1,157 (26.2%) |
| Total | 2,215 (100.0%) | 4,410 (100.0%) |
Property Value to Household Income Ratio in Payette County
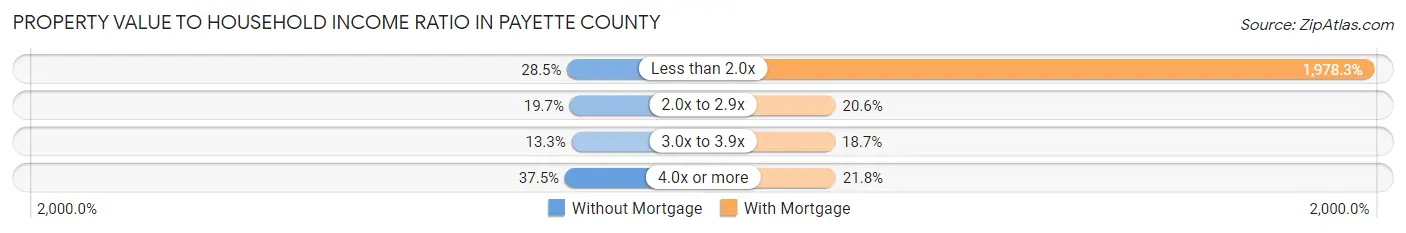
| Value-to-Income Ratio | Without Mortgage | With Mortgage |
| Less than 2.0x | 632 (28.5%) | 87,241 (1,978.2%) |
| 2.0x to 2.9x | 437 (19.7%) | 907 (20.6%) |
| 3.0x to 3.9x | 294 (13.3%) | 823 (18.7%) |
| 4.0x or more | 830 (37.5%) | 962 (21.8%) |
| Total | 2,215 (100.0%) | 4,410 (100.0%) |
Real Estate Taxes by Mortgage Status in Payette County
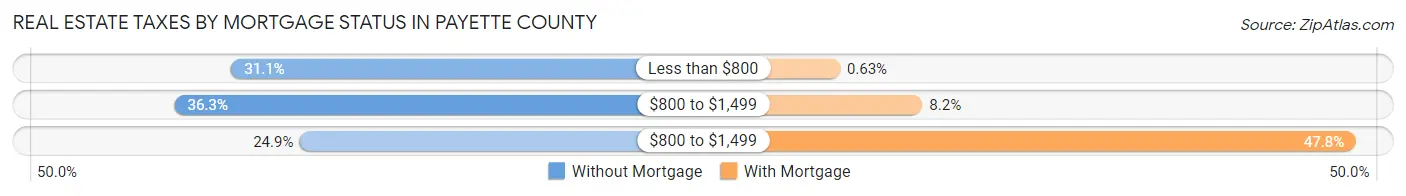
| Property Taxes | Without Mortgage | With Mortgage |
| Less than $800 | 689 (31.1%) | 28 (0.6%) |
| $800 to $1,499 | 804 (36.3%) | 360 (8.2%) |
| $800 to $1,499 | 552 (24.9%) | 2,106 (47.8%) |
| Total | 2,215 (100.0%) | 4,410 (100.0%) |
Health & Disability in Payette County
Health Insurance Coverage by Age in Payette County
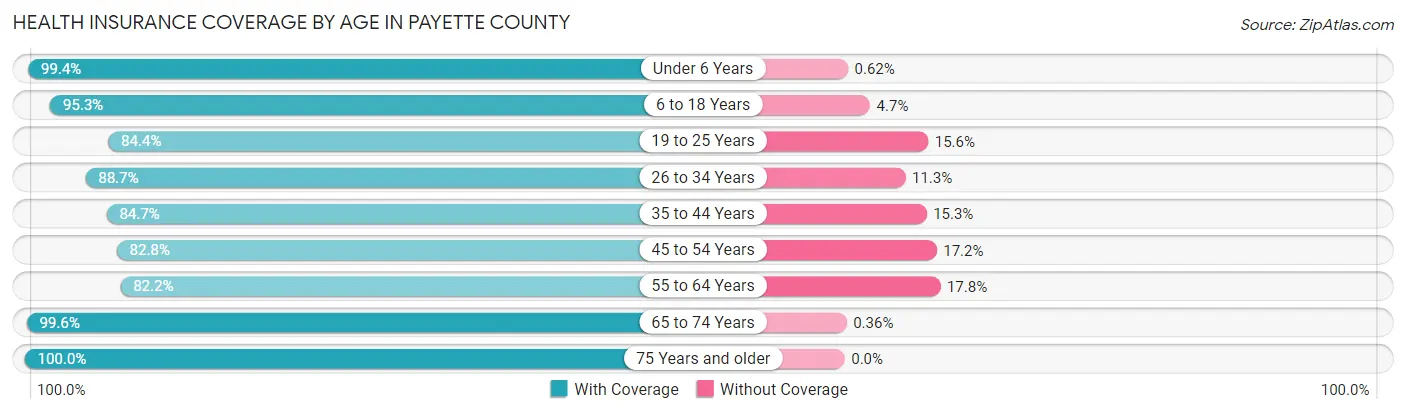
| Age Bracket | With Coverage | Without Coverage |
| Under 6 Years | 1,928 (99.4%) | 12 (0.6%) |
| 6 to 18 Years | 4,776 (95.3%) | 237 (4.7%) |
| 19 to 25 Years | 1,573 (84.4%) | 290 (15.6%) |
| 26 to 34 Years | 2,426 (88.7%) | 310 (11.3%) |
| 35 to 44 Years | 2,408 (84.7%) | 434 (15.3%) |
| 45 to 54 Years | 2,535 (82.8%) | 525 (17.2%) |
| 55 to 64 Years | 2,579 (82.2%) | 560 (17.8%) |
| 65 to 74 Years | 2,737 (99.6%) | 10 (0.4%) |
| 75 Years and older | 2,008 (100.0%) | 0 (0.0%) |
| Total | 22,970 (90.6%) | 2,378 (9.4%) |
Health Insurance Coverage by Citizenship Status in Payette County
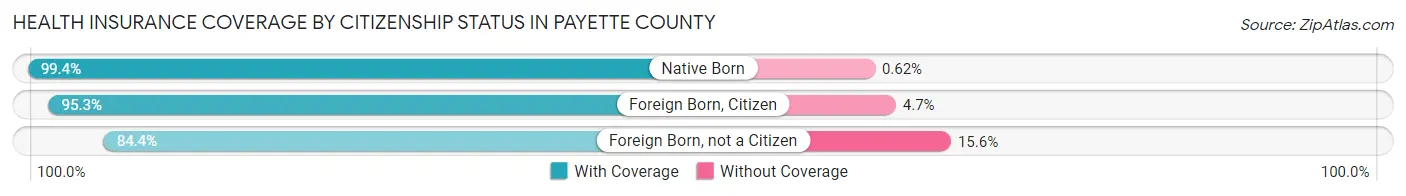
| Citizenship Status | With Coverage | Without Coverage |
| Native Born | 1,928 (99.4%) | 12 (0.6%) |
| Foreign Born, Citizen | 4,776 (95.3%) | 237 (4.7%) |
| Foreign Born, not a Citizen | 1,573 (84.4%) | 290 (15.6%) |
Health Insurance Coverage by Household Income in Payette County
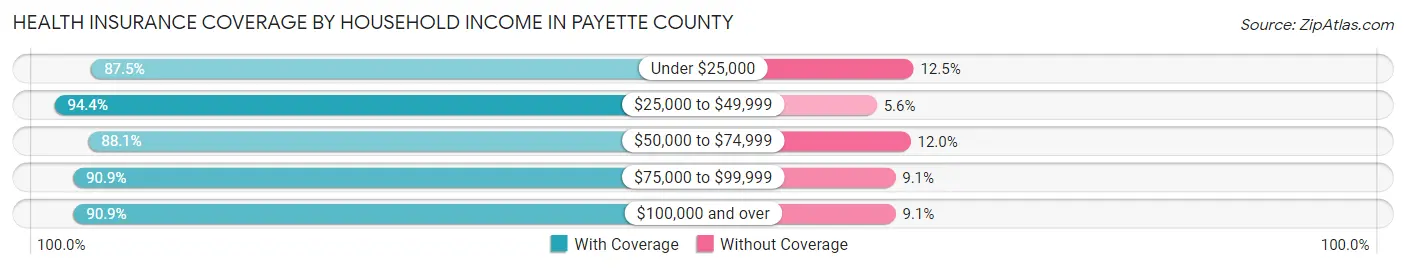
| Household Income | With Coverage | Without Coverage |
| Under $25,000 | 1,604 (87.5%) | 229 (12.5%) |
| $25,000 to $49,999 | 4,626 (94.4%) | 275 (5.6%) |
| $50,000 to $74,999 | 5,490 (88.0%) | 745 (11.9%) |
| $75,000 to $99,999 | 2,723 (90.9%) | 272 (9.1%) |
| $100,000 and over | 8,517 (90.9%) | 857 (9.1%) |
Public vs Private Health Insurance Coverage by Age in Payette County
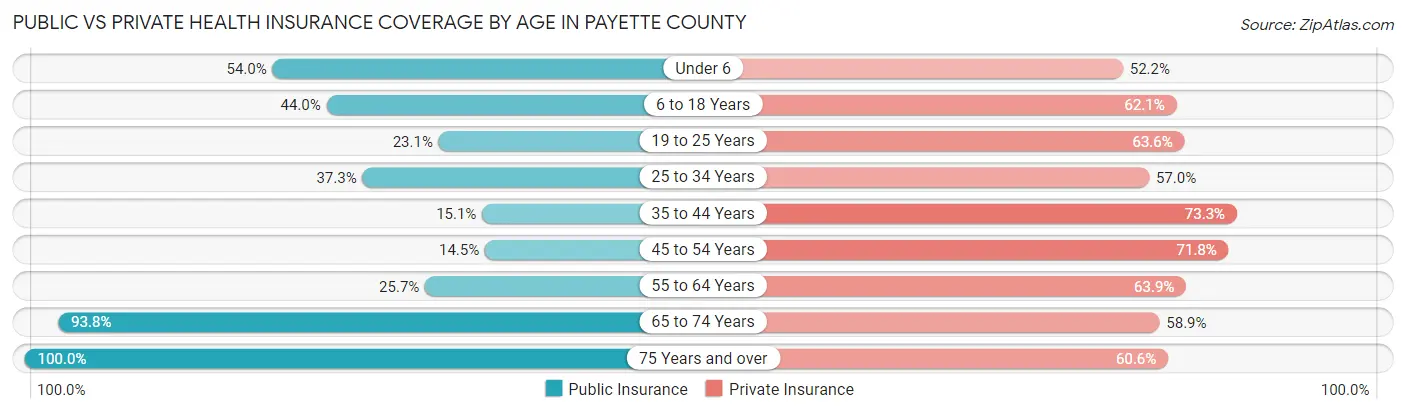
| Age Bracket | Public Insurance | Private Insurance |
| Under 6 | 1,047 (54.0%) | 1,012 (52.2%) |
| 6 to 18 Years | 2,203 (44.0%) | 3,115 (62.1%) |
| 19 to 25 Years | 431 (23.1%) | 1,185 (63.6%) |
| 25 to 34 Years | 1,020 (37.3%) | 1,560 (57.0%) |
| 35 to 44 Years | 428 (15.1%) | 2,084 (73.3%) |
| 45 to 54 Years | 445 (14.5%) | 2,197 (71.8%) |
| 55 to 64 Years | 805 (25.7%) | 2,006 (63.9%) |
| 65 to 74 Years | 2,576 (93.8%) | 1,619 (58.9%) |
| 75 Years and over | 2,008 (100.0%) | 1,216 (60.6%) |
| Total | 10,963 (43.2%) | 15,994 (63.1%) |
Disability Status by Sex by Age in Payette County
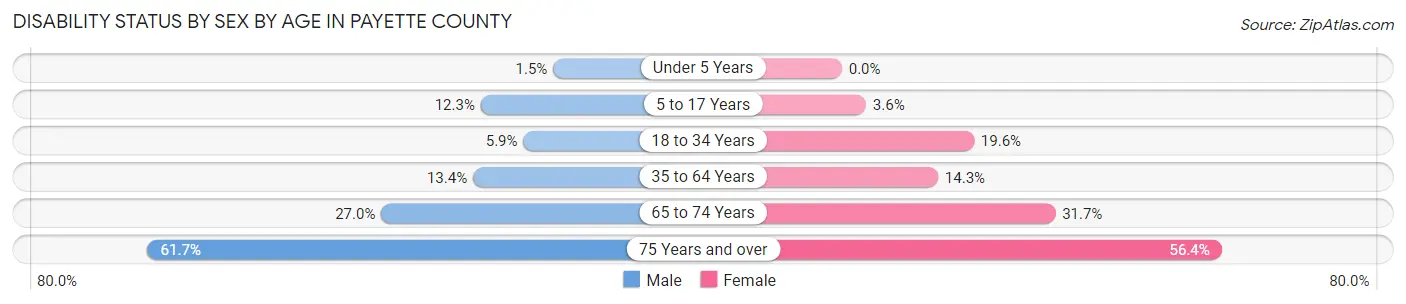
| Age Bracket | Male | Female |
| Under 5 Years | 11 (1.5%) | 0 (0.0%) |
| 5 to 17 Years | 319 (12.3%) | 81 (3.6%) |
| 18 to 34 Years | 153 (5.9%) | 479 (19.6%) |
| 35 to 64 Years | 589 (13.4%) | 664 (14.3%) |
| 65 to 74 Years | 364 (27.0%) | 444 (31.7%) |
| 75 Years and over | 611 (61.7%) | 574 (56.4%) |
Disability Class by Sex by Age in Payette County
Disability Class: Hearing Difficulty
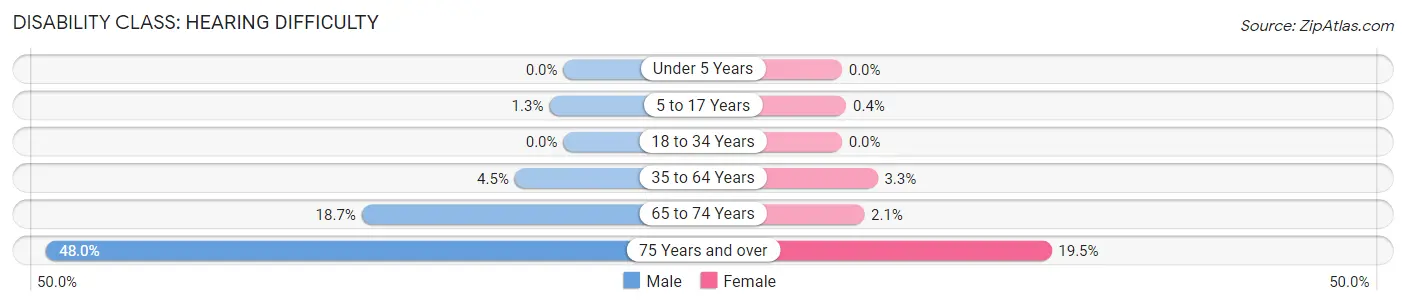
| Age Bracket | Male | Female |
| Under 5 Years | 0 (0.0%) | 0 (0.0%) |
| 5 to 17 Years | 34 (1.3%) | 9 (0.4%) |
| 18 to 34 Years | 0 (0.0%) | 0 (0.0%) |
| 35 to 64 Years | 198 (4.5%) | 154 (3.3%) |
| 65 to 74 Years | 252 (18.7%) | 29 (2.1%) |
| 75 Years and over | 475 (48.0%) | 198 (19.5%) |
Disability Class: Vision Difficulty
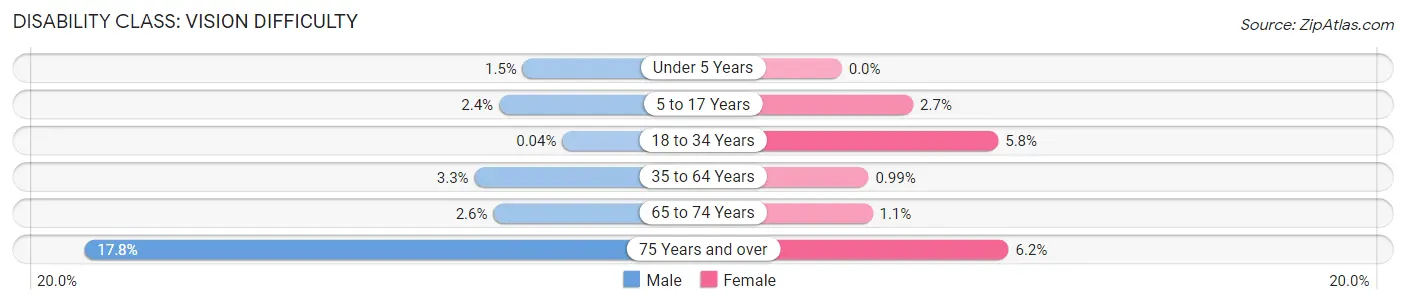
| Age Bracket | Male | Female |
| Under 5 Years | 11 (1.5%) | 0 (0.0%) |
| 5 to 17 Years | 62 (2.4%) | 60 (2.6%) |
| 18 to 34 Years | 1 (0.0%) | 142 (5.8%) |
| 35 to 64 Years | 145 (3.3%) | 46 (1.0%) |
| 65 to 74 Years | 35 (2.6%) | 16 (1.1%) |
| 75 Years and over | 176 (17.8%) | 63 (6.2%) |
Disability Class: Cognitive Difficulty
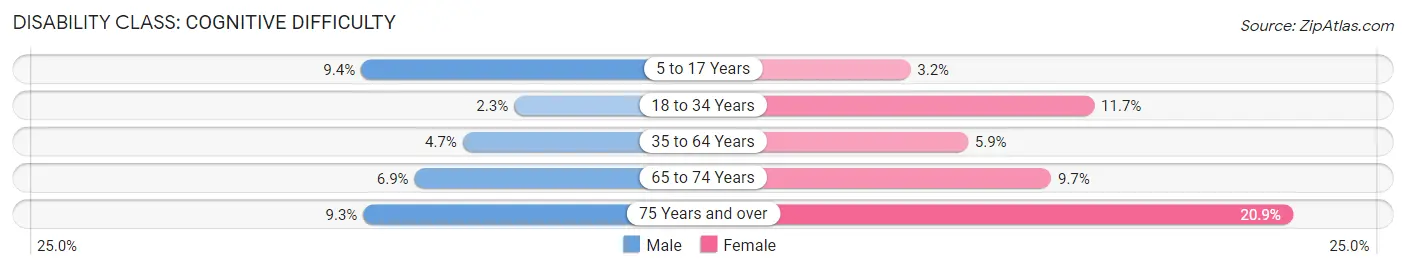
| Age Bracket | Male | Female |
| 5 to 17 Years | 244 (9.4%) | 72 (3.2%) |
| 18 to 34 Years | 59 (2.3%) | 286 (11.7%) |
| 35 to 64 Years | 205 (4.7%) | 272 (5.9%) |
| 65 to 74 Years | 93 (6.9%) | 136 (9.7%) |
| 75 Years and over | 92 (9.3%) | 213 (20.9%) |
Disability Class: Ambulatory Difficulty
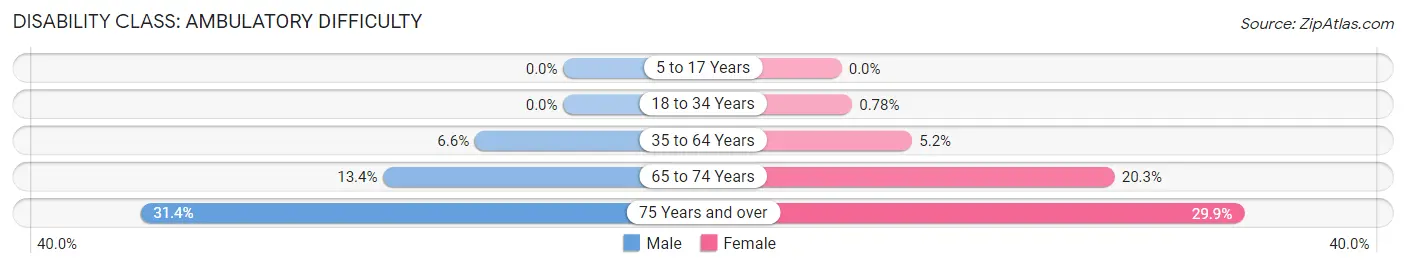
| Age Bracket | Male | Female |
| 5 to 17 Years | 0 (0.0%) | 0 (0.0%) |
| 18 to 34 Years | 0 (0.0%) | 19 (0.8%) |
| 35 to 64 Years | 288 (6.6%) | 244 (5.2%) |
| 65 to 74 Years | 180 (13.4%) | 284 (20.3%) |
| 75 Years and over | 311 (31.4%) | 304 (29.9%) |
Disability Class: Self-Care Difficulty
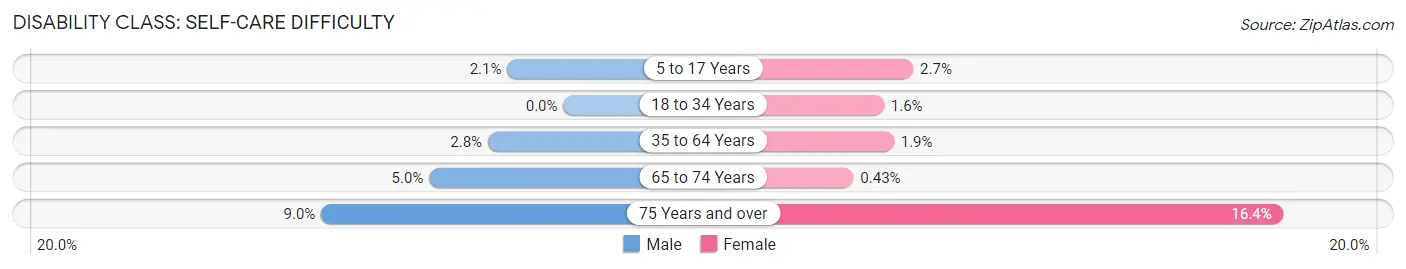
| Age Bracket | Male | Female |
| 5 to 17 Years | 54 (2.1%) | 60 (2.6%) |
| 18 to 34 Years | 0 (0.0%) | 38 (1.6%) |
| 35 to 64 Years | 123 (2.8%) | 90 (1.9%) |
| 65 to 74 Years | 67 (5.0%) | 6 (0.4%) |
| 75 Years and over | 89 (9.0%) | 167 (16.4%) |
Technology Access in Payette County
Computing Device Access in Payette County
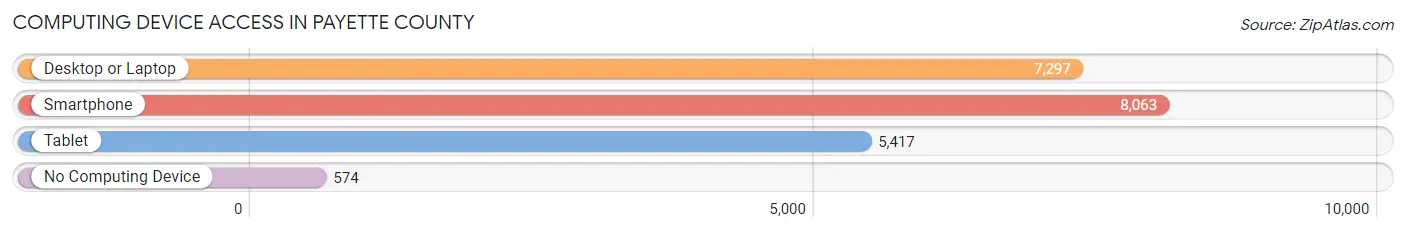
| Device Type | # Households | % Households |
| Desktop or Laptop | 7,297 | 78.0% |
| Smartphone | 8,063 | 86.2% |
| Tablet | 5,417 | 57.9% |
| No Computing Device | 574 | 6.1% |
| Total | 9,352 | 100.0% |
Internet Access in Payette County
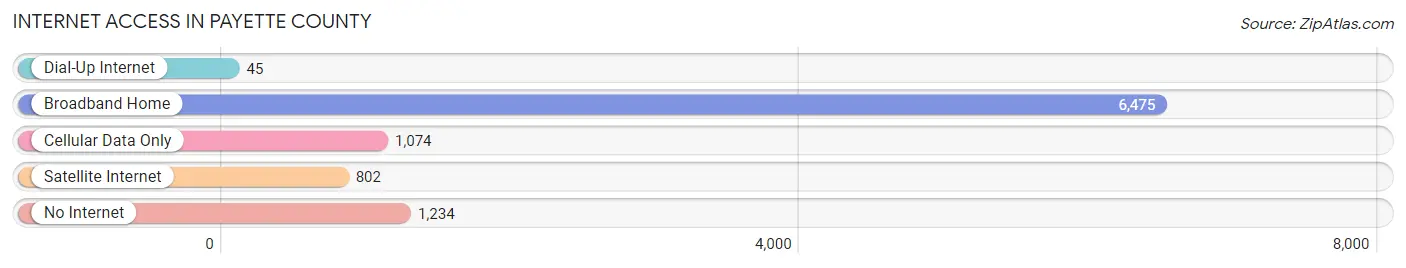
| Internet Type | # Households | % Households |
| Dial-Up Internet | 45 | 0.5% |
| Broadband Home | 6,475 | 69.2% |
| Cellular Data Only | 1,074 | 11.5% |
| Satellite Internet | 802 | 8.6% |
| No Internet | 1,234 | 13.2% |
| Total | 9,352 | 100.0% |
Payette County Summary
Payette County is located in the southwestern corner of Idaho, and is bordered by Washington, Oregon, and Adams County. It is part of the Treasure Valley region, and is the second-smallest county in the state. The county seat is Payette, and the largest city is Fruitland. The county was established in 1917, and was named after Francois Payette, a French-Canadian fur trapper who explored the area in the early 1800s.
Geography
Payette County covers an area of 1,072 square miles, and is located in the Snake River Plain region of Idaho. The terrain is mostly flat, with some rolling hills in the northern part of the county. The Snake River forms the western border of the county, and the Payette River runs through the center. The county is home to several lakes, including Lake Lowell, Lake Cascade, and Lake Walcott. The climate is semi-arid, with hot summers and cold winters.
Demographics
As of the 2010 census, Payette County had a population of 22,623. The population density was 21.2 people per square mile. The racial makeup of the county was 90.2% White, 0.5% African American, 0.7% Native American, 0.5% Asian, 0.1% Pacific Islander, 6.2% from other races, and 1.8% from two or more races. Hispanic or Latino of any race were 11.3% of the population.
Economy
Agriculture is the main economic activity in Payette County. The county is home to several large farms, and the main crops are potatoes, onions, corn, and wheat. Livestock production is also important, and the county is home to several large dairy farms. Manufacturing is also an important part of the economy, and the county is home to several food processing plants. The county is also home to several retail stores, restaurants, and other businesses.
History
Payette County was first settled by Native Americans, and was part of the Nez Perce Reservation until the late 1800s. The area was explored by fur trappers in the early 1800s, and the first permanent settlers arrived in the 1860s. The county was officially established in 1917, and the county seat was established in Payette. The county experienced rapid growth in the early 1900s, and the population continued to grow throughout the 20th century. Today, Payette County is a thriving agricultural and manufacturing center, and is home to a diverse population.
Common Questions
What is the Total Population of Payette County?
Total Population of Payette County is 25,571.
What is the Total Male Population of Payette County?
Total Male Population of Payette County is 12,729.
What is the Total Female Population of Payette County?
Total Female Population of Payette County is 12,842.
What is the Ratio of Males per 100 Females in Payette County?
There are 99.12 Males per 100 Females in Payette County.
What is the Ratio of Females per 100 Males in Payette County?
There are 100.89 Females per 100 Males in Payette County.
What is the Median Population Age in Payette County?
Median Population Age in Payette County is 40.0 Years.
What is the Average Family Size in Payette County
Average Family Size in Payette County is 3.2 People.
What is the Average Household Size in Payette County
Average Household Size in Payette County is 2.7 People.
What is Per Capita Income in Payette County?
Per Capita income in Payette County is $30,102.
What is the Median Family Income in Payette County?
Median Family Income in Payette County is $71,946.
What is the Median Household income in Payette County?
Median Household Income in Payette County is $62,721.
What is Income or Wage Gap in Payette County?
Income or Wage Gap in Payette County is 30.8%.
Women in Payette County earn 69.2 cents for every dollar earned by a man.
What is Family Income Deficit in Payette County?
Family Income Deficit in Payette County is $9,424.
Families that are below poverty line in Payette County earn $9,424 less on average than the poverty threshold level.
What is Inequality or Gini Index in Payette County?
Inequality or Gini Index in Payette County is 0.42.
How Large is the Labor Force in Payette County?
There are 11,283 People in the Labor Forcein in Payette County.
What is the Percentage of People in the Labor Force in Payette County?
57.5% of People are in the Labor Force in Payette County.
What is the Unemployment Rate in Payette County?
Unemployment Rate in Payette County is 4.4%.