Oneida County, ID
Oneida County Map
Oneida County Overview
4,572
TOTAL POPULATION
2,315
MALE POPULATION
2,257
FEMALE POPULATION
102.57
MALES / 100 FEMALES
97.49
FEMALES / 100 MALES
39.7
MEDIAN AGE
3.1
AVG FAMILY SIZE
2.5
AVG HOUSEHOLD SIZE
$28,592
PER CAPITA INCOME
$78,478
AVG FAMILY INCOME
$67,383
AVG HOUSEHOLD INCOME
56.8%
WAGE / INCOME GAP [ % ]
43.2¢/ $1
WAGE / INCOME GAP [ $ ]
$12,930
FAMILY INCOME DEFICIT
0.41
INEQUALITY / GINI INDEX
2,159
LABOR FORCE [ PEOPLE ]
62.1%
PERCENT IN LABOR FORCE
0.7%
UNEMPLOYMENT RATE
Oneida County Area Codes
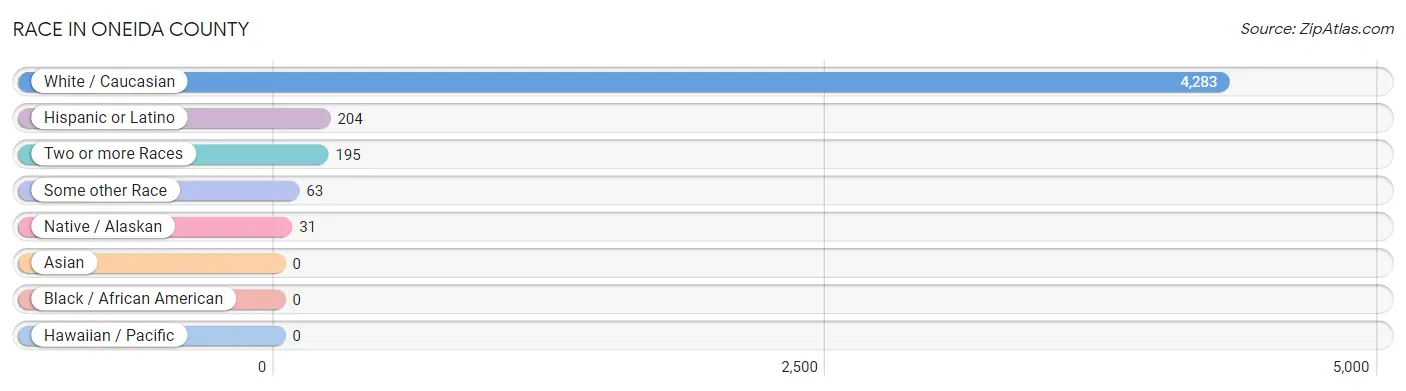
Race in Oneida County
The most populous races in Oneida County are White / Caucasian (4,283 | 93.7%), Hispanic or Latino (204 | 4.5%), and Two or more Races (195 | 4.3%).
| Race | # Population | % Population |
| Asian | 0 | 0.0% |
| Black / African American | 0 | 0.0% |
| Hawaiian / Pacific | 0 | 0.0% |
| Hispanic or Latino | 204 | 4.5% |
| Native / Alaskan | 31 | 0.7% |
| White / Caucasian | 4,283 | 93.7% |
| Two or more Races | 195 | 4.3% |
| Some other Race | 63 | 1.4% |
| Total | 4,572 | 100.0% |
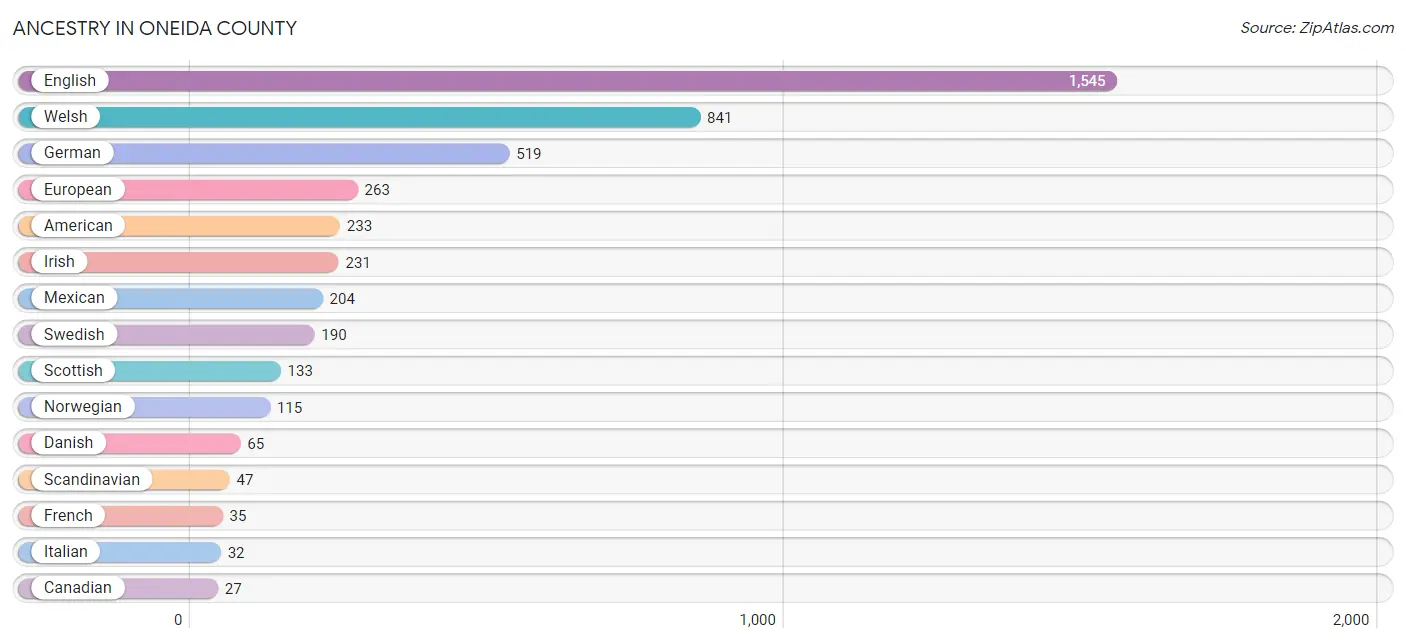
Ancestry in Oneida County
The most populous ancestries reported in Oneida County are English (1,545 | 33.8%), Welsh (841 | 18.4%), German (519 | 11.4%), European (263 | 5.8%), and American (233 | 5.1%), together accounting for 74.4% of all Oneida County residents.
| Ancestry | # Population | % Population |
| American | 233 | 5.1% |
| Blackfeet | 17 | 0.4% |
| British | 10 | 0.2% |
| Canadian | 27 | 0.6% |
| Cherokee | 23 | 0.5% |
| Choctaw | 14 | 0.3% |
| Danish | 65 | 1.4% |
| Dutch | 10 | 0.2% |
| English | 1,545 | 33.8% |
| European | 263 | 5.8% |
| French | 35 | 0.8% |
| German | 519 | 11.4% |
| Hungarian | 4 | 0.1% |
| Irish | 231 | 5.1% |
| Italian | 32 | 0.7% |
| Mexican | 204 | 4.5% |
| Norwegian | 115 | 2.5% |
| Polish | 13 | 0.3% |
| Puget Sound Salish | 21 | 0.5% |
| Scandinavian | 47 | 1.0% |
| Scotch-Irish | 7 | 0.2% |
| Scottish | 133 | 2.9% |
| Swedish | 190 | 4.2% |
| Swiss | 12 | 0.3% |
| Welsh | 841 | 18.4% | View All 25 Rows |
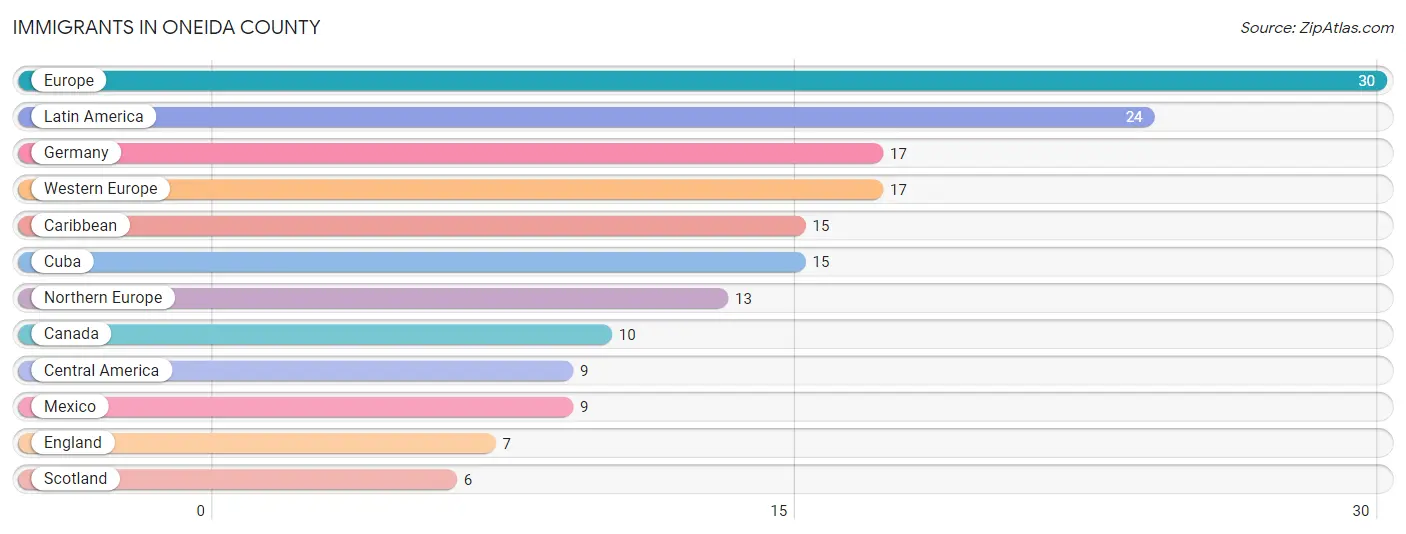
Immigrants in Oneida County
The most numerous immigrant groups reported in Oneida County came from Europe (30 | 0.7%), Latin America (24 | 0.5%), Germany (17 | 0.4%), Western Europe (17 | 0.4%), and Caribbean (15 | 0.3%), together accounting for 2.3% of all Oneida County residents.
| Immigration Origin | # Population | % Population |
| Canada | 10 | 0.2% |
| Caribbean | 15 | 0.3% |
| Central America | 9 | 0.2% |
| Cuba | 15 | 0.3% |
| England | 7 | 0.2% |
| Europe | 30 | 0.7% |
| Germany | 17 | 0.4% |
| Latin America | 24 | 0.5% |
| Mexico | 9 | 0.2% |
| Northern Europe | 13 | 0.3% |
| Scotland | 6 | 0.1% |
| Western Europe | 17 | 0.4% | View All 12 Rows |
Sex and Age in Oneida County
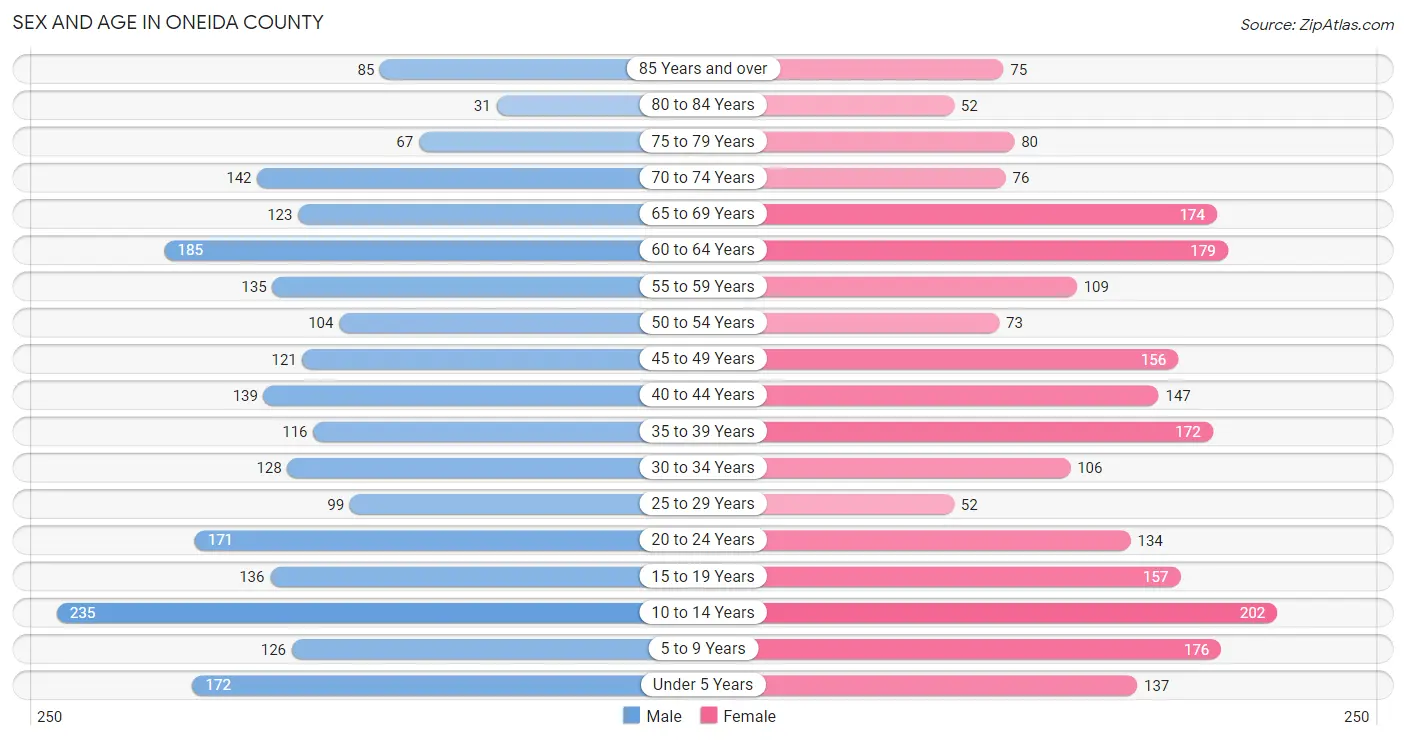
Sex and Age in Oneida County
The most populous age groups in Oneida County are 10 to 14 Years (235 | 10.2%) for men and 10 to 14 Years (202 | 8.9%) for women.
| Age Bracket | Male | Female |
| Under 5 Years | 172 (7.4%) | 137 (6.1%) |
| 5 to 9 Years | 126 (5.4%) | 176 (7.8%) |
| 10 to 14 Years | 235 (10.2%) | 202 (8.9%) |
| 15 to 19 Years | 136 (5.9%) | 157 (7.0%) |
| 20 to 24 Years | 171 (7.4%) | 134 (5.9%) |
| 25 to 29 Years | 99 (4.3%) | 52 (2.3%) |
| 30 to 34 Years | 128 (5.5%) | 106 (4.7%) |
| 35 to 39 Years | 116 (5.0%) | 172 (7.6%) |
| 40 to 44 Years | 139 (6.0%) | 147 (6.5%) |
| 45 to 49 Years | 121 (5.2%) | 156 (6.9%) |
| 50 to 54 Years | 104 (4.5%) | 73 (3.2%) |
| 55 to 59 Years | 135 (5.8%) | 109 (4.8%) |
| 60 to 64 Years | 185 (8.0%) | 179 (7.9%) |
| 65 to 69 Years | 123 (5.3%) | 174 (7.7%) |
| 70 to 74 Years | 142 (6.1%) | 76 (3.4%) |
| 75 to 79 Years | 67 (2.9%) | 80 (3.5%) |
| 80 to 84 Years | 31 (1.3%) | 52 (2.3%) |
| 85 Years and over | 85 (3.7%) | 75 (3.3%) |
| Total | 2,315 (100.0%) | 2,257 (100.0%) |
Families and Households in Oneida County
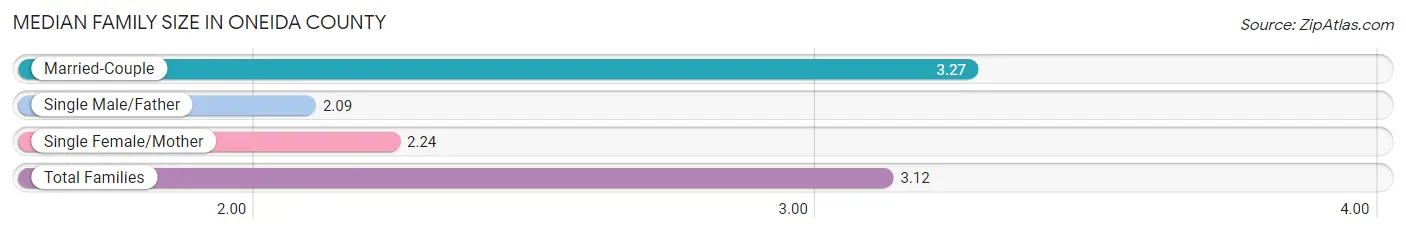
Median Family Size in Oneida County
The median family size in Oneida County is 3.12 persons per family, with married-couple families (1,060 | 85.9%) accounting for the largest median family size of 3.27 persons per family. On the other hand, single male/father families (43 | 3.5%) represent the smallest median family size with 2.09 persons per family.
| Family Type | # Families | Family Size |
| Married-Couple | 1,060 (85.9%) | 3.27 |
| Single Male/Father | 43 (3.5%) | 2.09 |
| Single Female/Mother | 131 (10.6%) | 2.24 |
| Total Families | 1,234 (100.0%) | 3.12 |
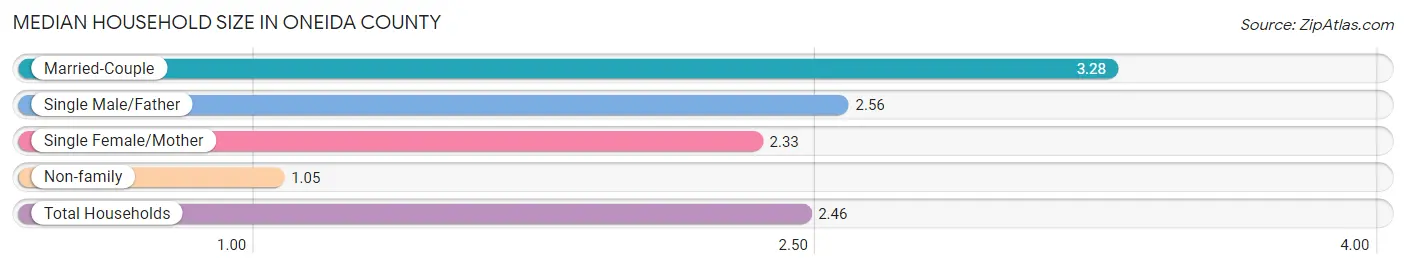
Median Household Size in Oneida County
The median household size in Oneida County is 2.46 persons per household, with married-couple households (1,060 | 57.6%) accounting for the largest median household size of 3.28 persons per household. non-family households (607 | 33.0%) represent the smallest median household size with 1.05 persons per household.
| Household Type | # Households | Household Size |
| Married-Couple | 1,060 (57.6%) | 3.28 |
| Single Male/Father | 43 (2.3%) | 2.56 |
| Single Female/Mother | 131 (7.1%) | 2.33 |
| Non-family | 607 (33.0%) | 1.05 |
| Total Households | 1,841 (100.0%) | 2.46 |
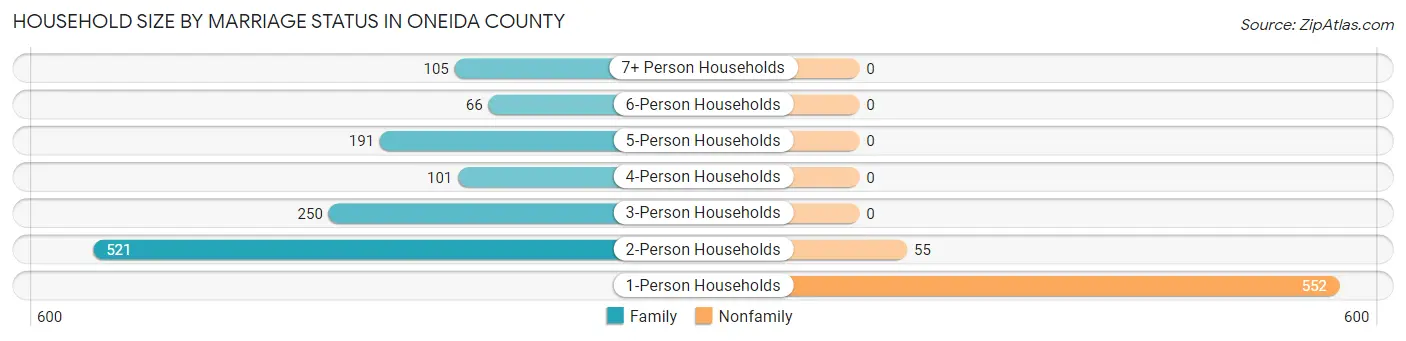
Household Size by Marriage Status in Oneida County
Out of a total of 1,841 households in Oneida County, 1,234 (67.0%) are family households, while 607 (33.0%) are nonfamily households. The most numerous type of family households are 2-person households, comprising 521, and the most common type of nonfamily households are 1-person households, comprising 552.
| Household Size | Family Households | Nonfamily Households |
| 1-Person Households | - | 552 (30.0%) |
| 2-Person Households | 521 (28.3%) | 55 (3.0%) |
| 3-Person Households | 250 (13.6%) | 0 (0.0%) |
| 4-Person Households | 101 (5.5%) | 0 (0.0%) |
| 5-Person Households | 191 (10.4%) | 0 (0.0%) |
| 6-Person Households | 66 (3.6%) | 0 (0.0%) |
| 7+ Person Households | 105 (5.7%) | 0 (0.0%) |
| Total | 1,234 (67.0%) | 607 (33.0%) |
Female Fertility in Oneida County
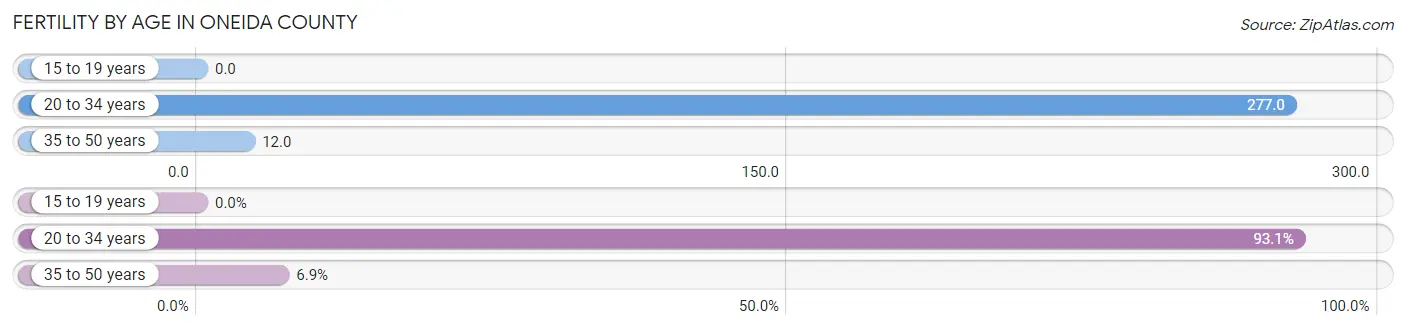
Fertility by Age in Oneida County
Average fertility rate in Oneida County is 93.0 births per 1,000 women. Women in the age bracket of 20 to 34 years have the highest fertility rate with 277.0 births per 1,000 women. Women in the age bracket of 20 to 34 years acount for 93.1% of all women with births.
| Age Bracket | Women with Births | Births / 1,000 Women |
| 15 to 19 years | 0 (0.0%) | 0.0 |
| 20 to 34 years | 81 (93.1%) | 277.0 |
| 35 to 50 years | 6 (6.9%) | 12.0 |
| Total | 87 (100.0%) | 93.0 |
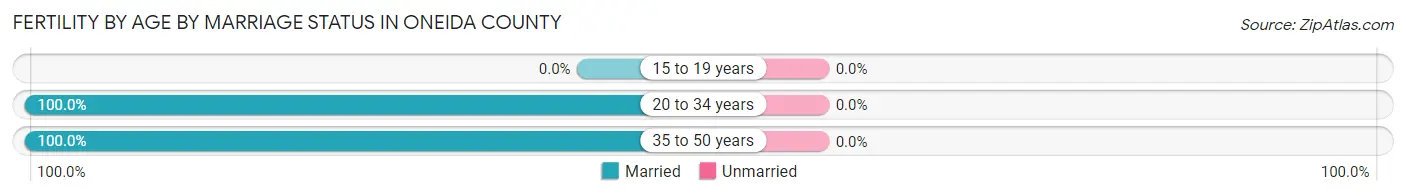
Fertility by Age by Marriage Status in Oneida County
| Age Bracket | Married | Unmarried |
| 15 to 19 years | 0 (0.0%) | 0 (0.0%) |
| 20 to 34 years | 81 (100.0%) | 0 (0.0%) |
| 35 to 50 years | 6 (100.0%) | 0 (0.0%) |
| Total | 87 (100.0%) | 0 (0.0%) |
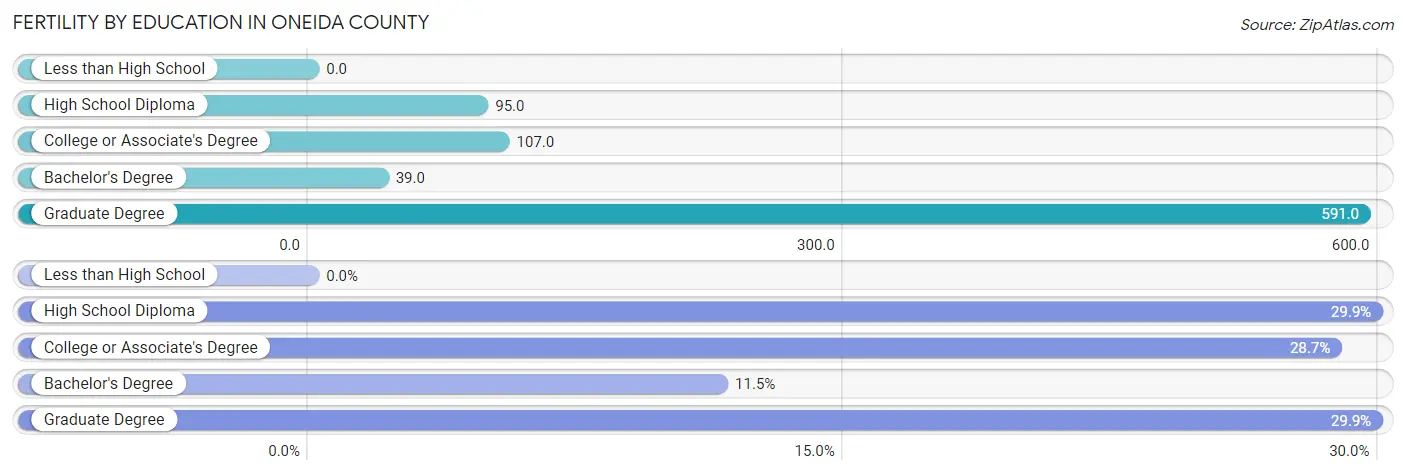
Fertility by Education in Oneida County
| Educational Attainment | Women with Births | Births / 1,000 Women |
| Less than High School | 0 (0.0%) | 0.0 |
| High School Diploma | 26 (29.9%) | 95.0 |
| College or Associate's Degree | 25 (28.7%) | 107.0 |
| Bachelor's Degree | 10 (11.5%) | 39.0 |
| Graduate Degree | 26 (29.9%) | 591.0 |
| Total | 87 (100.0%) | 93.0 |
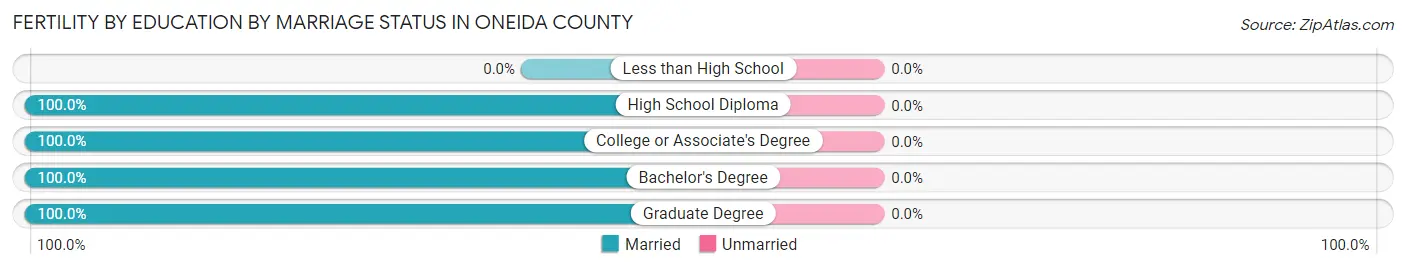
Fertility by Education by Marriage Status in Oneida County
| Educational Attainment | Married | Unmarried |
| Less than High School | 0 (0.0%) | 0 (0.0%) |
| High School Diploma | 26 (100.0%) | 0 (0.0%) |
| College or Associate's Degree | 25 (100.0%) | 0 (0.0%) |
| Bachelor's Degree | 10 (100.0%) | 0 (0.0%) |
| Graduate Degree | 26 (100.0%) | 0 (0.0%) |
| Total | 87 (100.0%) | 0 (0.0%) |
Income in Oneida County
Income Overview in Oneida County
Per Capita Income in Oneida County is $28,592, while median incomes of families and households are $78,478 and $67,383 respectively.
| Characteristic | Number | Measure |
| Per Capita Income | 4,572 | $28,592 |
| Median Family Income | 1,234 | $78,478 |
| Mean Family Income | 1,234 | $85,579 |
| Median Household Income | 1,841 | $67,383 |
| Mean Household Income | 1,841 | $74,086 |
| Income Deficit | 1,234 | $12,930 |
| Wage / Income Gap (%) | 4,572 | 56.85% |
| Wage / Income Gap ($) | 4,572 | 43.15¢ per $1 |
| Gini / Inequality Index | 4,572 | 0.41 |
Earnings by Sex in Oneida County
Average Earnings in Oneida County are $34,294, $54,435 for men and $23,491 for women, a difference of 56.9%.
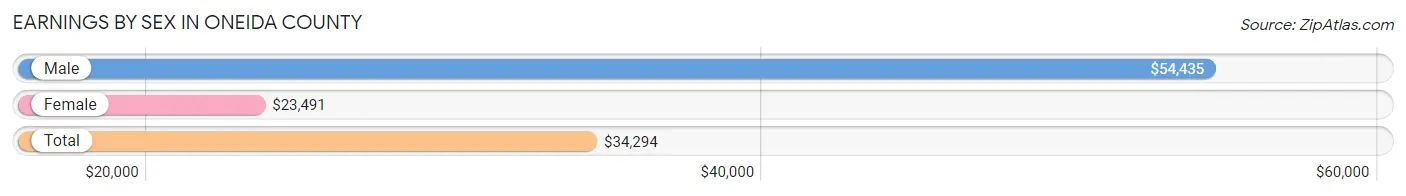
| Sex | Number | Average Earnings |
| Male | 1,202 (51.6%) | $54,435 |
| Female | 1,126 (48.4%) | $23,491 |
| Total | 2,328 (100.0%) | $34,294 |
Earnings by Sex by Income Bracket in Oneida County
The most common earnings brackets in Oneida County are $55,000 to $64,999 for men (214 | 17.8%) and $2,499 or less for women (141 | 12.5%).
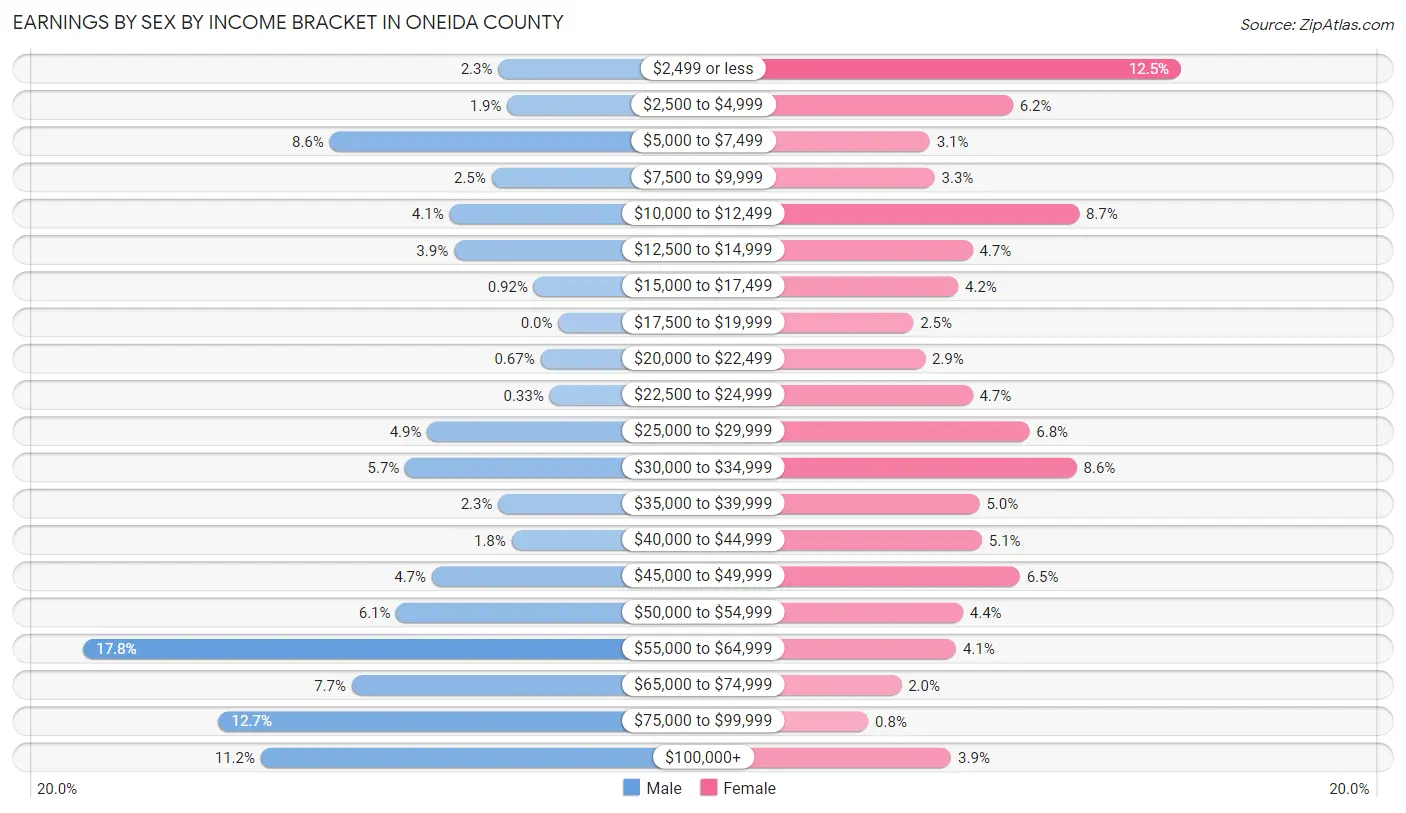
| Income | Male | Female |
| $2,499 or less | 27 (2.2%) | 141 (12.5%) |
| $2,500 to $4,999 | 23 (1.9%) | 70 (6.2%) |
| $5,000 to $7,499 | 103 (8.6%) | 35 (3.1%) |
| $7,500 to $9,999 | 30 (2.5%) | 37 (3.3%) |
| $10,000 to $12,499 | 49 (4.1%) | 98 (8.7%) |
| $12,500 to $14,999 | 47 (3.9%) | 53 (4.7%) |
| $15,000 to $17,499 | 11 (0.9%) | 47 (4.2%) |
| $17,500 to $19,999 | 0 (0.0%) | 28 (2.5%) |
| $20,000 to $22,499 | 8 (0.7%) | 33 (2.9%) |
| $22,500 to $24,999 | 4 (0.3%) | 53 (4.7%) |
| $25,000 to $29,999 | 59 (4.9%) | 77 (6.8%) |
| $30,000 to $34,999 | 69 (5.7%) | 97 (8.6%) |
| $35,000 to $39,999 | 27 (2.2%) | 56 (5.0%) |
| $40,000 to $44,999 | 21 (1.8%) | 57 (5.1%) |
| $45,000 to $49,999 | 57 (4.7%) | 73 (6.5%) |
| $50,000 to $54,999 | 73 (6.1%) | 49 (4.3%) |
| $55,000 to $64,999 | 214 (17.8%) | 46 (4.1%) |
| $65,000 to $74,999 | 93 (7.7%) | 23 (2.0%) |
| $75,000 to $99,999 | 153 (12.7%) | 9 (0.8%) |
| $100,000+ | 134 (11.2%) | 44 (3.9%) |
| Total | 1,202 (100.0%) | 1,126 (100.0%) |
Earnings by Sex by Educational Attainment in Oneida County
Average earnings in Oneida County are $59,706 for men and $26,875 for women, a difference of 55.0%. Men with an educational attainment of bachelor's degree enjoy the highest average annual earnings of $86,736, while those with college or associate's degree education earn the least with $51,667. Women with an educational attainment of college or associate's degree earn the most with the average annual earnings of $33,438, while those with graduate degree education have the smallest earnings of $14,712.
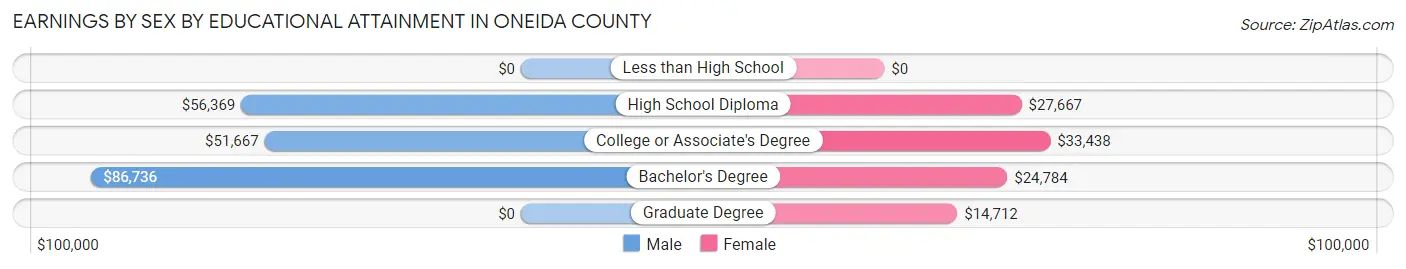
| Educational Attainment | Male Income | Female Income |
| Less than High School | - | - |
| High School Diploma | $56,369 | $27,667 |
| College or Associate's Degree | $51,667 | $33,438 |
| Bachelor's Degree | $86,736 | $24,784 |
| Graduate Degree | - | - |
| Total | $59,706 | $26,875 |
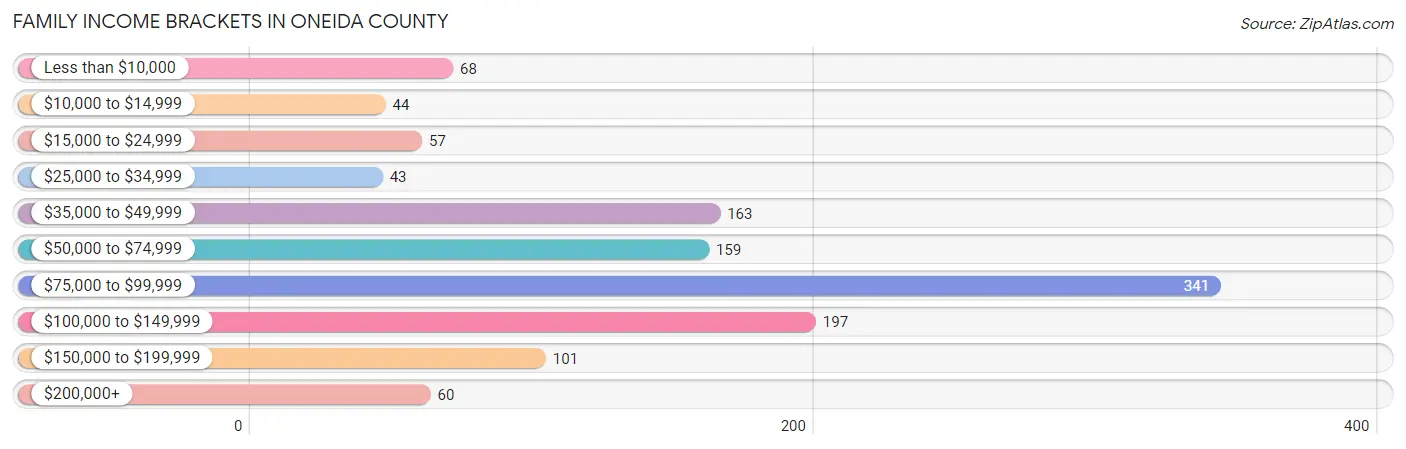
Family Income in Oneida County
Family Income Brackets in Oneida County
According to the Oneida County family income data, there are 341 families falling into the $75,000 to $99,999 income range, which is the most common income bracket and makes up 27.6% of all families. Conversely, the $25,000 to $34,999 income bracket is the least frequent group with only 43 families (3.5%) belonging to this category.
| Income Bracket | # Families | % Families |
| Less than $10,000 | 68 | 5.5% |
| $10,000 to $14,999 | 44 | 3.6% |
| $15,000 to $24,999 | 57 | 4.6% |
| $25,000 to $34,999 | 43 | 3.5% |
| $35,000 to $49,999 | 163 | 13.2% |
| $50,000 to $74,999 | 159 | 12.9% |
| $75,000 to $99,999 | 341 | 27.6% |
| $100,000 to $149,999 | 197 | 16.0% |
| $150,000 to $199,999 | 101 | 8.2% |
| $200,000+ | 60 | 4.9% |
Family Income by Famaliy Size in Oneida County
7+ person families (97 | 7.9%) account for the highest median family income in Oneida County with $138,750 per family, while 2-person families (546 | 44.3%) have the highest median income of $30,469 per family member.
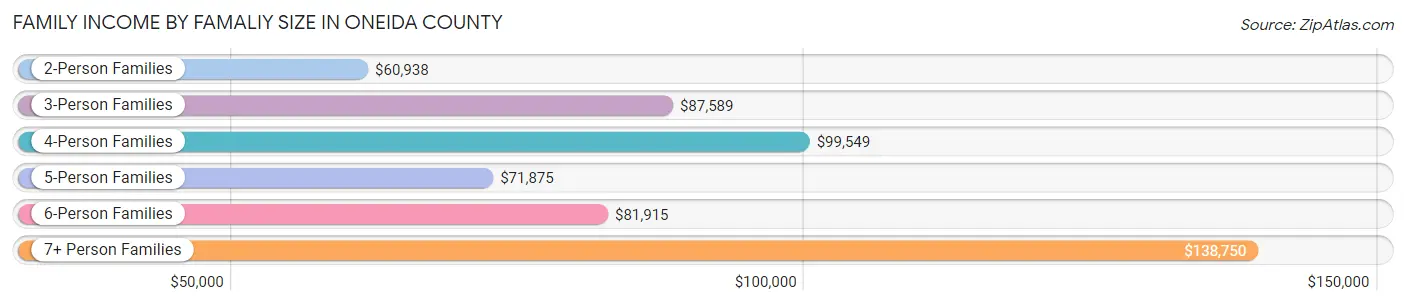
| Income Bracket | # Families | Median Income |
| 2-Person Families | 546 (44.3%) | $60,938 |
| 3-Person Families | 229 (18.6%) | $87,589 |
| 4-Person Families | 101 (8.2%) | $99,549 |
| 5-Person Families | 189 (15.3%) | $71,875 |
| 6-Person Families | 72 (5.8%) | $81,915 |
| 7+ Person Families | 97 (7.9%) | $138,750 |
| Total | 1,234 (100.0%) | $78,478 |
Family Income by Number of Earners in Oneida County
The median family income in Oneida County is $78,478, with families comprising 3+ earners (265) having the highest median family income of $106,771, while families with no earners (219) have the lowest median family income of $41,058, accounting for 21.5% and 17.7% of families, respectively.
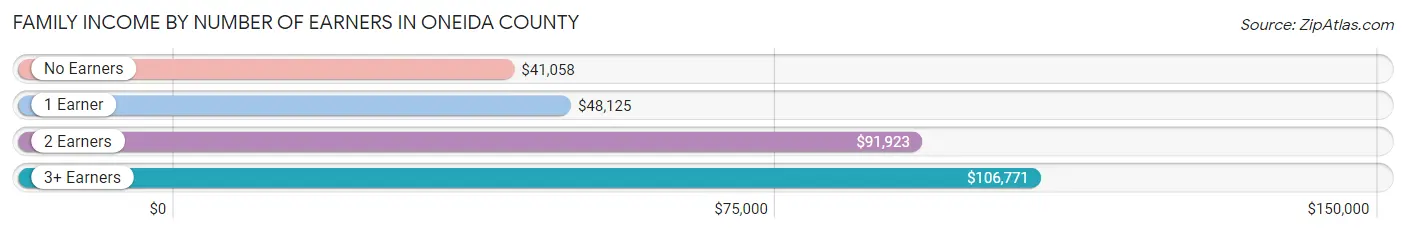
| Number of Earners | # Families | Median Income |
| No Earners | 219 (17.7%) | $41,058 |
| 1 Earner | 270 (21.9%) | $48,125 |
| 2 Earners | 480 (38.9%) | $91,923 |
| 3+ Earners | 265 (21.5%) | $106,771 |
| Total | 1,234 (100.0%) | $78,478 |
Household Income in Oneida County
Household Income Brackets in Oneida County
With 392 households falling in the category, the $75,000 to $99,999 income range is the most frequent in Oneida County, accounting for 21.3% of all households. In contrast, only 61 households (3.3%) fall into the $200,000+ income bracket, making it the least populous group.
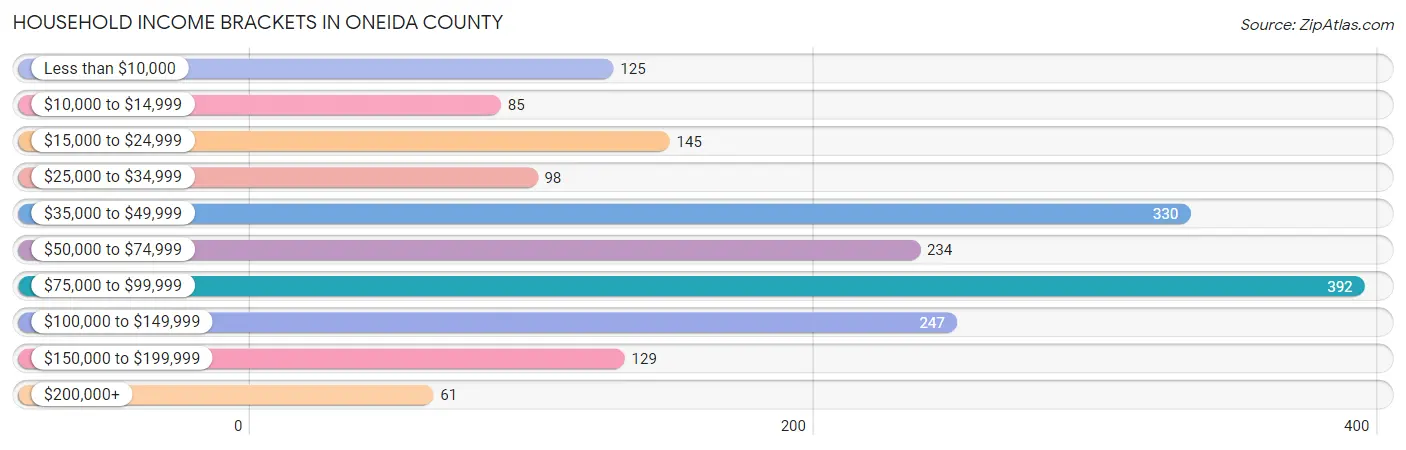
| Income Bracket | # Households | % Households |
| Less than $10,000 | 125 | 6.8% |
| $10,000 to $14,999 | 85 | 4.6% |
| $15,000 to $24,999 | 145 | 7.9% |
| $25,000 to $34,999 | 98 | 5.3% |
| $35,000 to $49,999 | 330 | 17.9% |
| $50,000 to $74,999 | 234 | 12.7% |
| $75,000 to $99,999 | 392 | 21.3% |
| $100,000 to $149,999 | 247 | 13.4% |
| $150,000 to $199,999 | 129 | 7.0% |
| $200,000+ | 61 | 3.3% |
Household Income by Householder Age in Oneida County
The median household income in Oneida County is $67,383, with the highest median household income of $82,500 found in the 25 to 44 years age bracket for the primary householder. A total of 490 households (26.6%) fall into this category. Meanwhile, the 15 to 24 years age bracket for the primary householder has the lowest median household income of $0, with 121 households (6.6%) in this group.
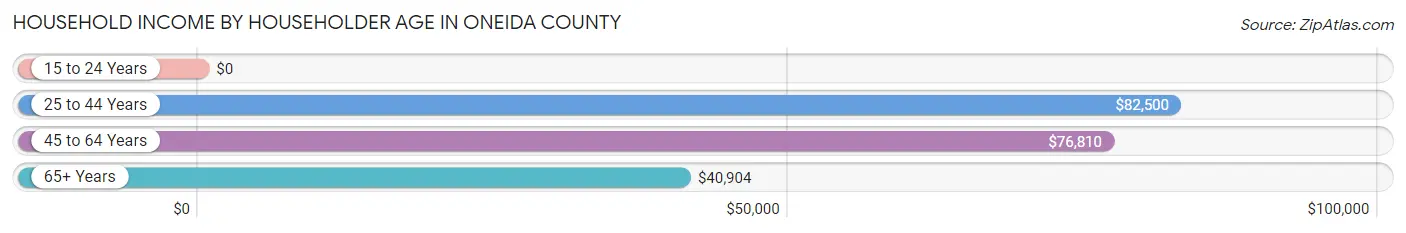
| Income Bracket | # Households | Median Income |
| 15 to 24 Years | 121 (6.6%) | $0 |
| 25 to 44 Years | 490 (26.6%) | $82,500 |
| 45 to 64 Years | 588 (31.9%) | $76,810 |
| 65+ Years | 642 (34.9%) | $40,904 |
| Total | 1,841 (100.0%) | $67,383 |
Poverty in Oneida County
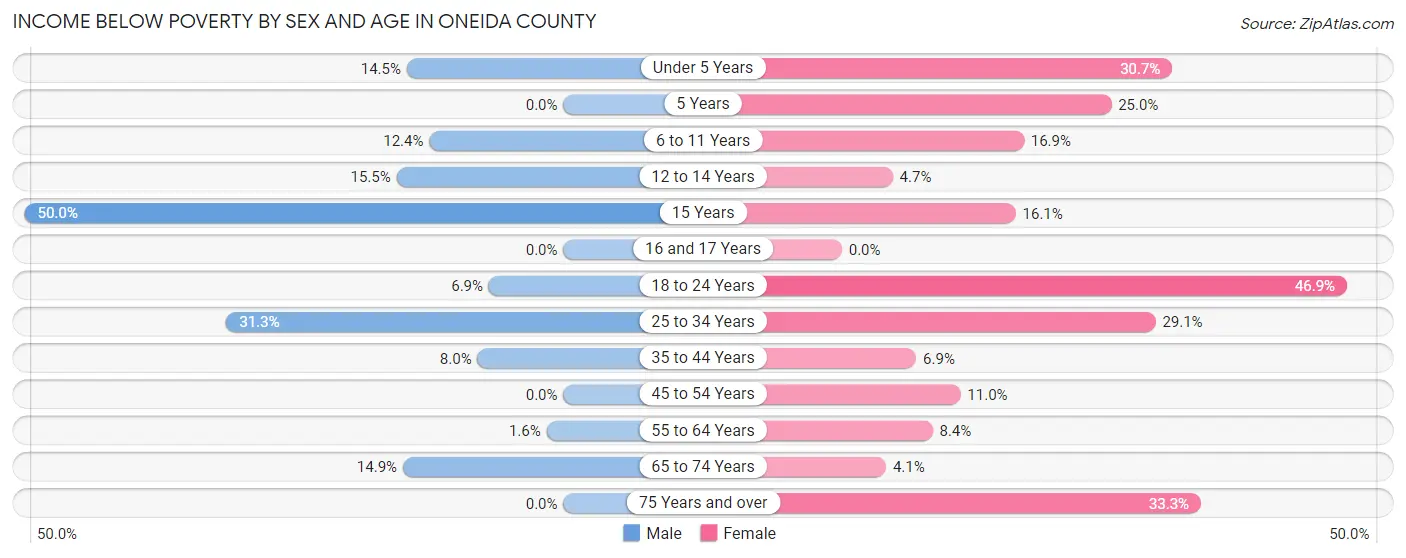
Income Below Poverty by Sex and Age in Oneida County
With 10.0% poverty level for males and 17.1% for females among the residents of Oneida County, 15 year old males and 18 to 24 year old females are the most vulnerable to poverty, with 8 males (50.0%) and 90 females (46.9%) in their respective age groups living below the poverty level.
| Age Bracket | Male | Female |
| Under 5 Years | 25 (14.5%) | 42 (30.7%) |
| 5 Years | 0 (0.0%) | 8 (25.0%) |
| 6 to 11 Years | 24 (12.4%) | 37 (16.9%) |
| 12 to 14 Years | 24 (15.5%) | 6 (4.7%) |
| 15 Years | 8 (50.0%) | 5 (16.1%) |
| 16 and 17 Years | 0 (0.0%) | 0 (0.0%) |
| 18 to 24 Years | 13 (6.9%) | 90 (46.9%) |
| 25 to 34 Years | 71 (31.3%) | 46 (29.1%) |
| 35 to 44 Years | 20 (8.0%) | 22 (6.9%) |
| 45 to 54 Years | 0 (0.0%) | 25 (11.0%) |
| 55 to 64 Years | 5 (1.6%) | 24 (8.4%) |
| 65 to 74 Years | 39 (14.9%) | 10 (4.1%) |
| 75 Years and over | 0 (0.0%) | 67 (33.3%) |
| Total | 229 (10.0%) | 382 (17.1%) |
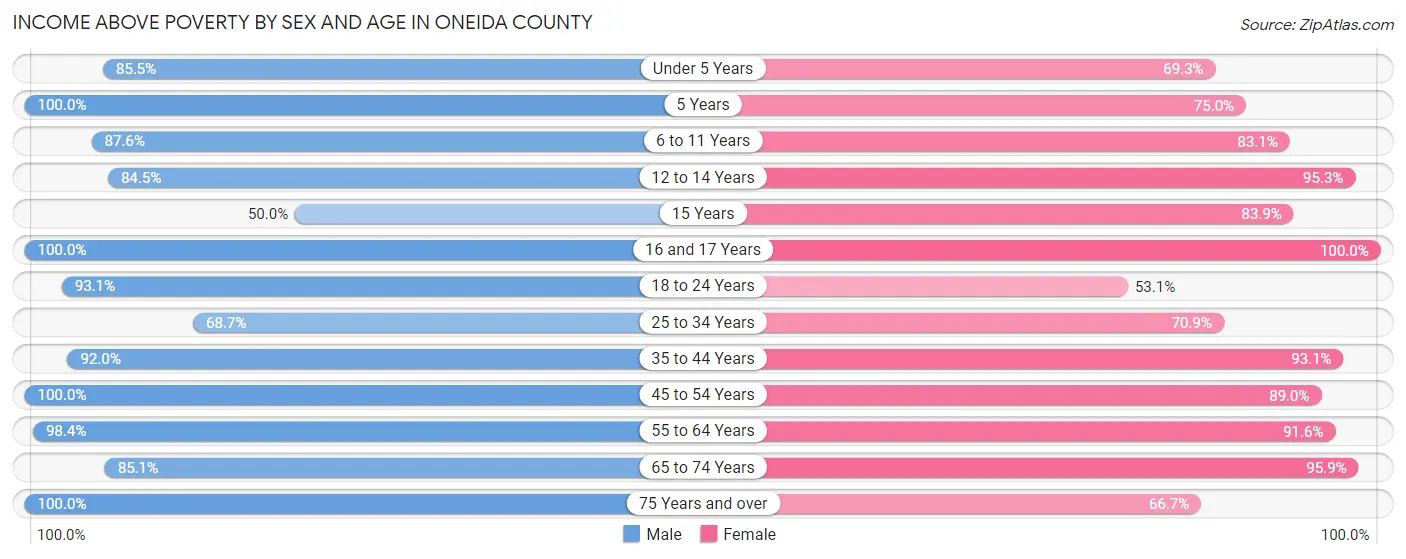
Income Above Poverty by Sex and Age in Oneida County
According to the poverty statistics in Oneida County, males aged 5 years and females aged 16 and 17 years are the age groups that are most secure financially, with 100.0% of males and 100.0% of females in these age groups living above the poverty line.
| Age Bracket | Male | Female |
| Under 5 Years | 147 (85.5%) | 95 (69.3%) |
| 5 Years | 13 (100.0%) | 24 (75.0%) |
| 6 to 11 Years | 169 (87.6%) | 182 (83.1%) |
| 12 to 14 Years | 131 (84.5%) | 121 (95.3%) |
| 15 Years | 8 (50.0%) | 26 (83.9%) |
| 16 and 17 Years | 103 (100.0%) | 68 (100.0%) |
| 18 to 24 Years | 175 (93.1%) | 102 (53.1%) |
| 25 to 34 Years | 156 (68.7%) | 112 (70.9%) |
| 35 to 44 Years | 231 (92.0%) | 297 (93.1%) |
| 45 to 54 Years | 225 (100.0%) | 202 (89.0%) |
| 55 to 64 Years | 315 (98.4%) | 261 (91.6%) |
| 65 to 74 Years | 223 (85.1%) | 234 (95.9%) |
| 75 Years and over | 164 (100.0%) | 134 (66.7%) |
| Total | 2,060 (90.0%) | 1,858 (83.0%) |
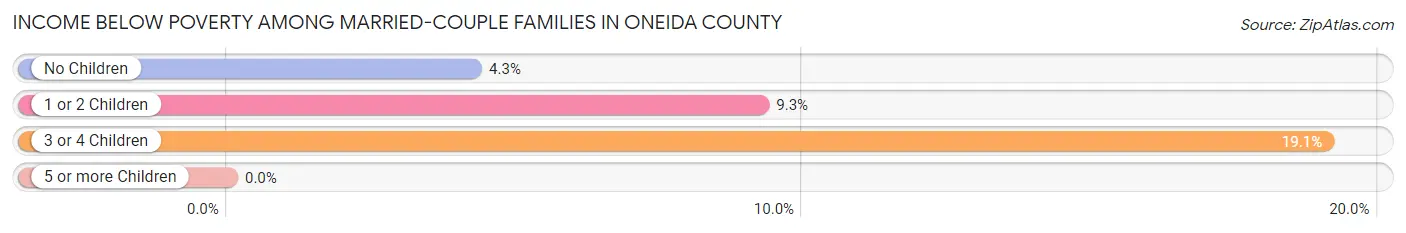
Income Below Poverty Among Married-Couple Families in Oneida County
The poverty statistics for married-couple families in Oneida County show that 9.1% or 96 of the total 1,060 families live below the poverty line. Families with 3 or 4 children have the highest poverty rate of 19.1%, comprising of 50 families. On the other hand, families with 5 or more children have the lowest poverty rate of 0.0%, which includes 0 families.
| Children | Above Poverty | Below Poverty |
| No Children | 451 (95.8%) | 20 (4.3%) |
| 1 or 2 Children | 255 (90.7%) | 26 (9.2%) |
| 3 or 4 Children | 212 (80.9%) | 50 (19.1%) |
| 5 or more Children | 46 (100.0%) | 0 (0.0%) |
| Total | 964 (90.9%) | 96 (9.1%) |
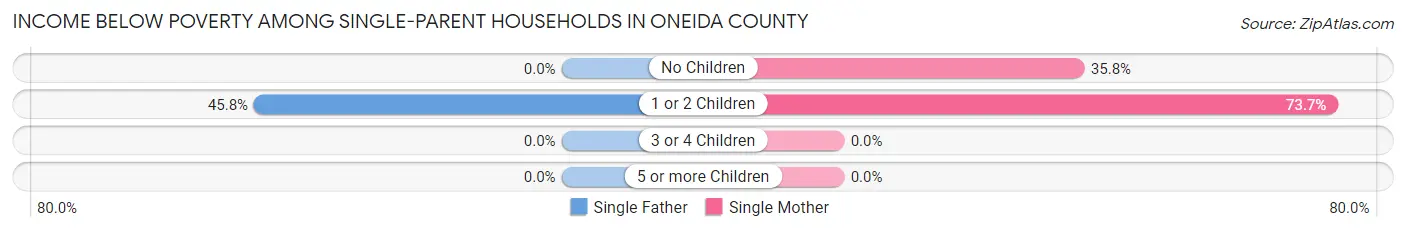
Income Below Poverty Among Single-Parent Households in Oneida County
According to the poverty data in Oneida County, 25.6% or 11 single-father households and 43.5% or 57 single-mother households are living below the poverty line. Among single-father households, those with 1 or 2 children have the highest poverty rate, with 11 households (45.8%) experiencing poverty. Likewise, among single-mother households, those with 1 or 2 children have the highest poverty rate, with 28 households (73.7%) falling below the poverty line.
| Children | Single Father | Single Mother |
| No Children | 0 (0.0%) | 29 (35.8%) |
| 1 or 2 Children | 11 (45.8%) | 28 (73.7%) |
| 3 or 4 Children | 0 (0.0%) | 0 (0.0%) |
| 5 or more Children | 0 (0.0%) | 0 (0.0%) |
| Total | 11 (25.6%) | 57 (43.5%) |
Income Below Poverty Among Married-Couple vs Single-Parent Households in Oneida County
The poverty data for Oneida County shows that 96 of the married-couple family households (9.1%) and 68 of the single-parent households (39.1%) are living below the poverty level. Within the married-couple family households, those with 3 or 4 children have the highest poverty rate, with 50 households (19.1%) falling below the poverty line. Among the single-parent households, those with 1 or 2 children have the highest poverty rate, with 39 household (62.9%) living below poverty.
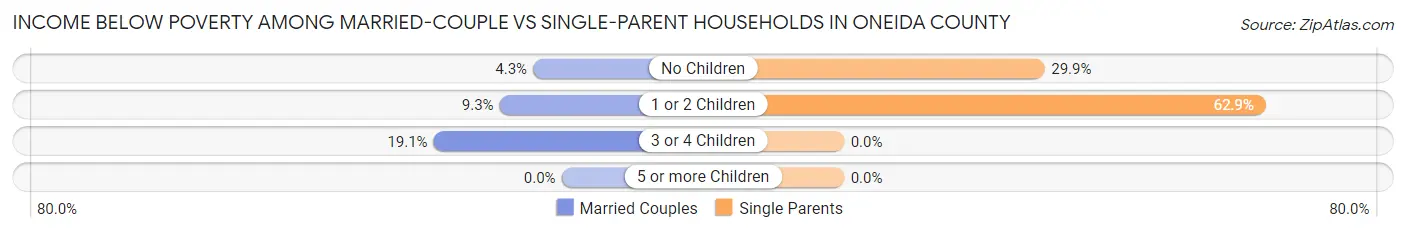
| Children | Married-Couple Families | Single-Parent Households |
| No Children | 20 (4.3%) | 29 (29.9%) |
| 1 or 2 Children | 26 (9.2%) | 39 (62.9%) |
| 3 or 4 Children | 50 (19.1%) | 0 (0.0%) |
| 5 or more Children | 0 (0.0%) | 0 (0.0%) |
| Total | 96 (9.1%) | 68 (39.1%) |
Employment Characteristics in Oneida County
Employment by Class of Employer in Oneida County
Among the 2,145 employed individuals in Oneida County, private company employees (1,274 | 59.4%), local government employees (270 | 12.6%), and self-employed (not incorporated) (184 | 8.6%) make up the most common classes of employment.
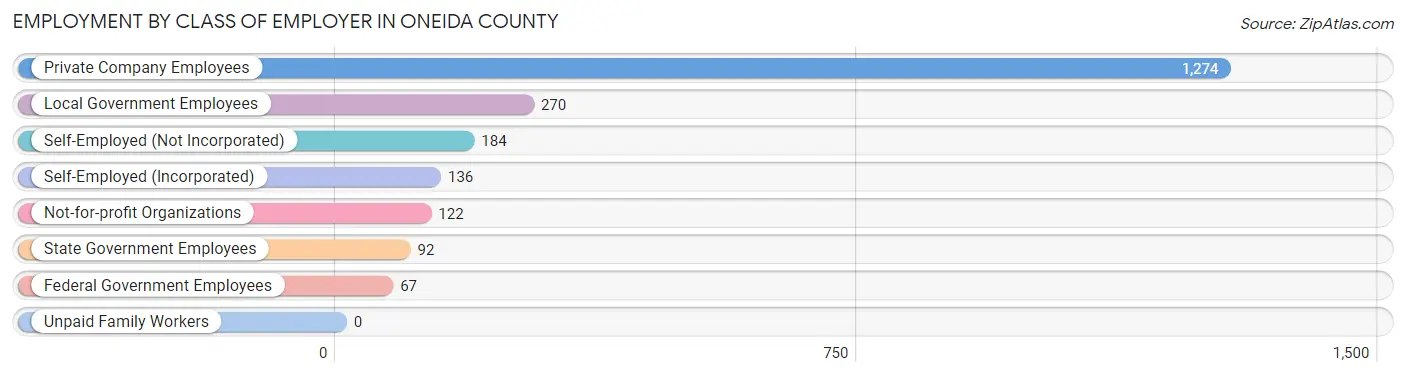
| Employer Class | # Employees | % Employees |
| Private Company Employees | 1,274 | 59.4% |
| Self-Employed (Incorporated) | 136 | 6.3% |
| Self-Employed (Not Incorporated) | 184 | 8.6% |
| Not-for-profit Organizations | 122 | 5.7% |
| Local Government Employees | 270 | 12.6% |
| State Government Employees | 92 | 4.3% |
| Federal Government Employees | 67 | 3.1% |
| Unpaid Family Workers | 0 | 0.0% |
| Total | 2,145 | 100.0% |
Employment Status by Age in Oneida County
According to the labor force statistics for Oneida County, out of the total population over 16 years of age (3,477), 62.1% or 2,159 individuals are in the labor force, with 0.7% or 15 of them unemployed. The age group with the highest labor force participation rate is 25 to 29 years, with 100.0% or 151 individuals in the labor force. Within the labor force, the 45 to 54 years age range has the highest percentage of unemployed individuals, with 2.4% or 10 of them being unemployed.
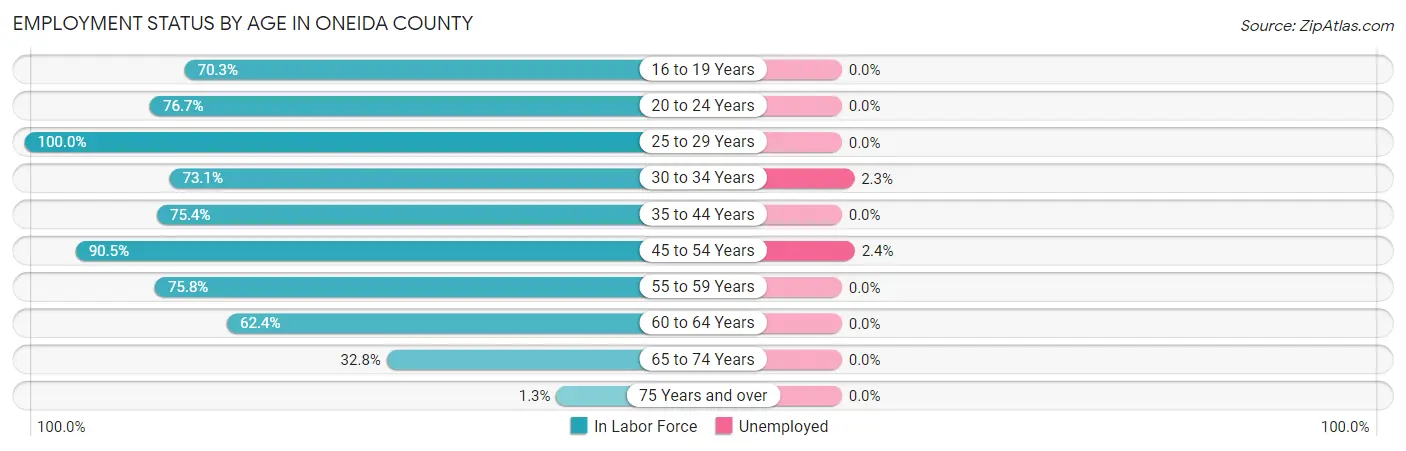
| Age Bracket | In Labor Force | Unemployed |
| 16 to 19 Years | 173 (70.3%) | 0 (0.0%) |
| 20 to 24 Years | 234 (76.7%) | 0 (0.0%) |
| 25 to 29 Years | 151 (100.0%) | 0 (0.0%) |
| 30 to 34 Years | 171 (73.1%) | 4 (2.3%) |
| 35 to 44 Years | 433 (75.4%) | 0 (0.0%) |
| 45 to 54 Years | 411 (90.5%) | 10 (2.4%) |
| 55 to 59 Years | 185 (75.8%) | 0 (0.0%) |
| 60 to 64 Years | 227 (62.4%) | 0 (0.0%) |
| 65 to 74 Years | 169 (32.8%) | 0 (0.0%) |
| 75 Years and over | 5 (1.3%) | 0 (0.0%) |
| Total | 2,159 (62.1%) | 15 (0.7%) |
Employment Status by Educational Attainment in Oneida County
According to labor force statistics for Oneida County, 78.1% of individuals (1,578) out of the total population between 25 and 64 years of age (2,021) are in the labor force, with 0.9% or 14 of them being unemployed. The group with the highest labor force participation rate are those with the educational attainment of bachelor's degree or higher, with 90.2% or 506 individuals in the labor force. Within the labor force, individuals with high school diploma education have the highest percentage of unemployment, with 1.6% or 10 of them being unemployed.
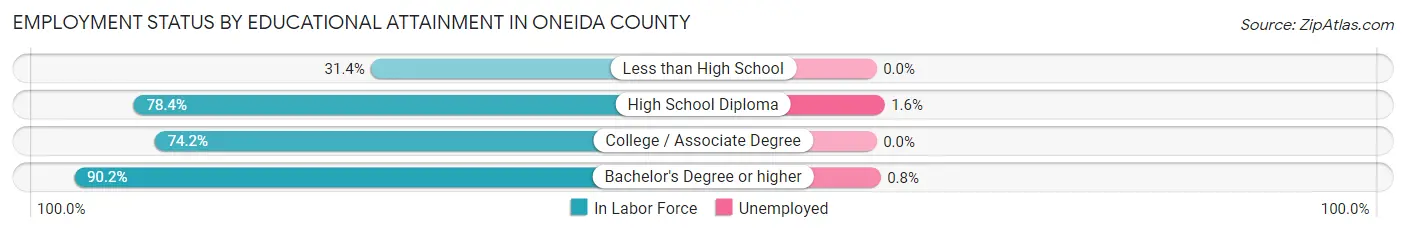
| Educational Attainment | In Labor Force | Unemployed |
| Less than High School | 33 (31.4%) | 0 (0.0%) |
| High School Diploma | 625 (78.4%) | 13 (1.6%) |
| College / Associate Degree | 414 (74.2%) | 0 (0.0%) |
| Bachelor's Degree or higher | 506 (90.2%) | 4 (0.8%) |
| Total | 1,578 (78.1%) | 18 (0.9%) |
Employment Occupations by Sex in Oneida County
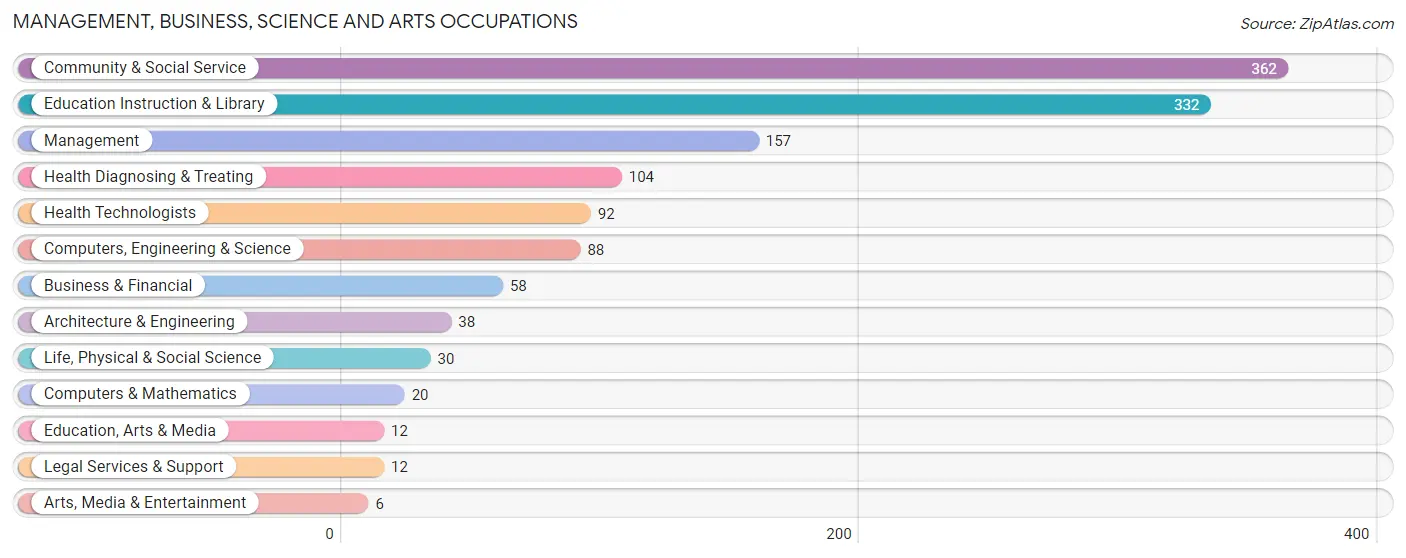
Management, Business, Science and Arts Occupations
The most common Management, Business, Science and Arts occupations in Oneida County are Community & Social Service (362 | 16.9%), Education Instruction & Library (332 | 15.5%), Management (157 | 7.3%), Health Diagnosing & Treating (104 | 4.9%), and Health Technologists (92 | 4.3%).
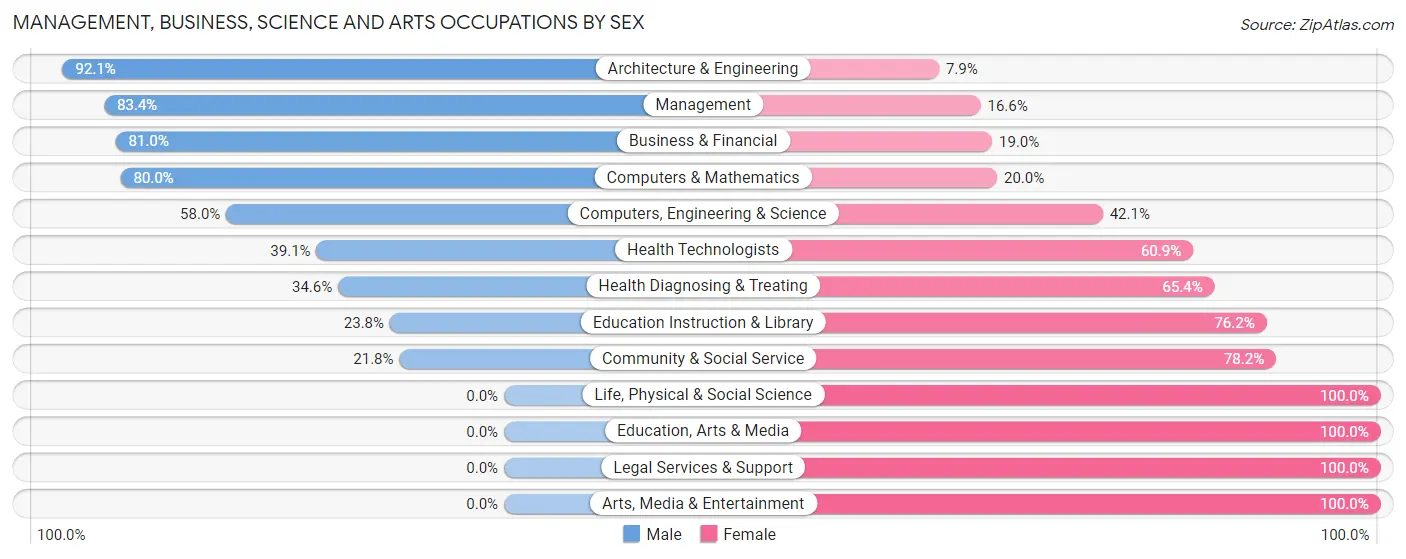
Management, Business, Science and Arts Occupations by Sex
Within the Management, Business, Science and Arts occupations in Oneida County, the most male-oriented occupations are Architecture & Engineering (92.1%), Management (83.4%), and Business & Financial (81.0%), while the most female-oriented occupations are Life, Physical & Social Science (100.0%), Education, Arts & Media (100.0%), and Legal Services & Support (100.0%).
| Occupation | Male | Female |
| Management | 131 (83.4%) | 26 (16.6%) |
| Business & Financial | 47 (81.0%) | 11 (19.0%) |
| Computers, Engineering & Science | 51 (58.0%) | 37 (42.0%) |
| Computers & Mathematics | 16 (80.0%) | 4 (20.0%) |
| Architecture & Engineering | 35 (92.1%) | 3 (7.9%) |
| Life, Physical & Social Science | 0 (0.0%) | 30 (100.0%) |
| Community & Social Service | 79 (21.8%) | 283 (78.2%) |
| Education, Arts & Media | 0 (0.0%) | 12 (100.0%) |
| Legal Services & Support | 0 (0.0%) | 12 (100.0%) |
| Education Instruction & Library | 79 (23.8%) | 253 (76.2%) |
| Arts, Media & Entertainment | 0 (0.0%) | 6 (100.0%) |
| Health Diagnosing & Treating | 36 (34.6%) | 68 (65.4%) |
| Health Technologists | 36 (39.1%) | 56 (60.9%) |
| Total (Category) | 344 (44.7%) | 425 (55.3%) |
| Total (Overall) | 1,125 (52.6%) | 1,013 (47.4%) |
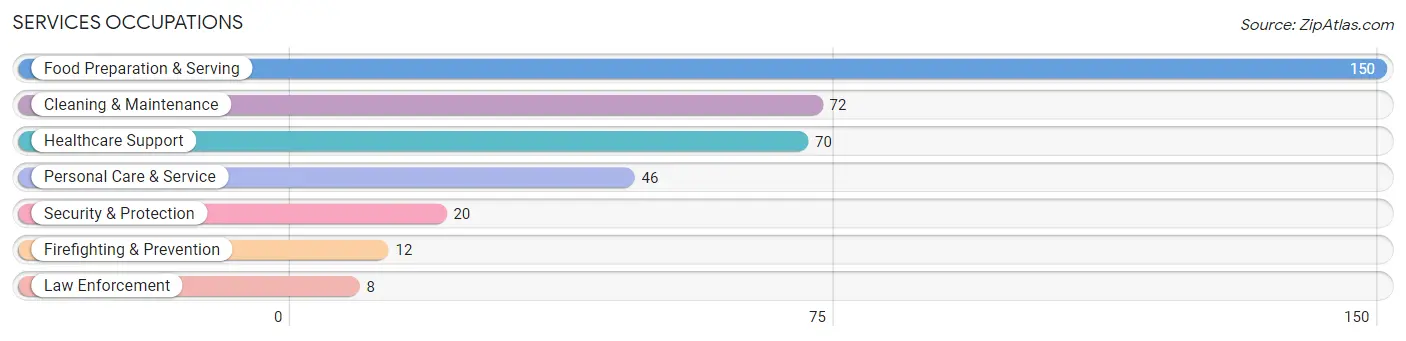
Services Occupations
The most common Services occupations in Oneida County are Food Preparation & Serving (150 | 7.0%), Cleaning & Maintenance (72 | 3.4%), Healthcare Support (70 | 3.3%), Personal Care & Service (46 | 2.1%), and Security & Protection (20 | 0.9%).
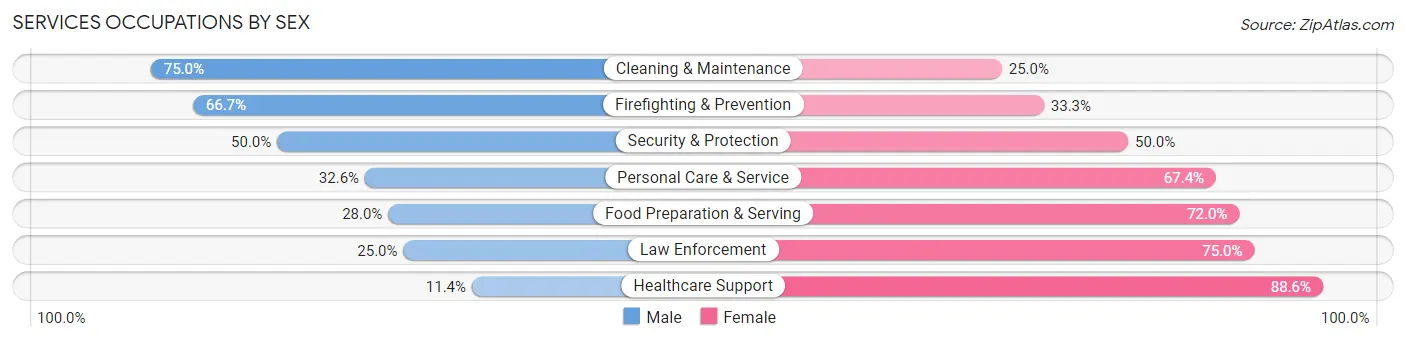
Services Occupations by Sex
Within the Services occupations in Oneida County, the most male-oriented occupations are Cleaning & Maintenance (75.0%), Firefighting & Prevention (66.7%), and Security & Protection (50.0%), while the most female-oriented occupations are Healthcare Support (88.6%), Law Enforcement (75.0%), and Food Preparation & Serving (72.0%).
| Occupation | Male | Female |
| Healthcare Support | 8 (11.4%) | 62 (88.6%) |
| Security & Protection | 10 (50.0%) | 10 (50.0%) |
| Firefighting & Prevention | 8 (66.7%) | 4 (33.3%) |
| Law Enforcement | 2 (25.0%) | 6 (75.0%) |
| Food Preparation & Serving | 42 (28.0%) | 108 (72.0%) |
| Cleaning & Maintenance | 54 (75.0%) | 18 (25.0%) |
| Personal Care & Service | 15 (32.6%) | 31 (67.4%) |
| Total (Category) | 129 (36.0%) | 229 (64.0%) |
| Total (Overall) | 1,125 (52.6%) | 1,013 (47.4%) |
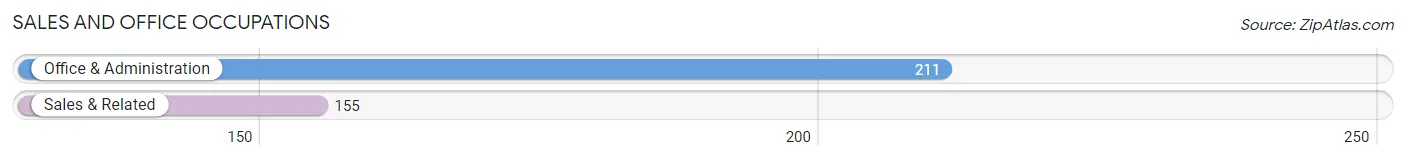
Sales and Office Occupations
The most common Sales and Office occupations in Oneida County are Office & Administration (211 | 9.9%), and Sales & Related (155 | 7.2%).
Sales and Office Occupations by Sex
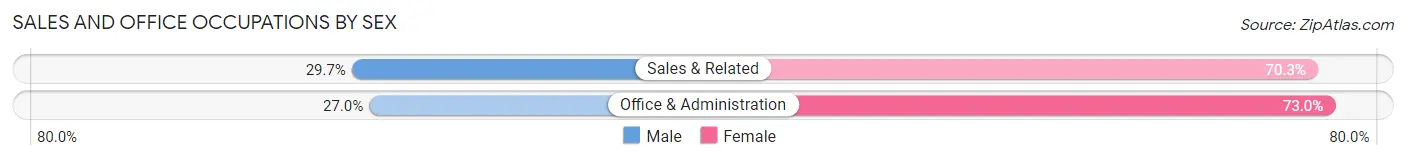
| Occupation | Male | Female |
| Sales & Related | 46 (29.7%) | 109 (70.3%) |
| Office & Administration | 57 (27.0%) | 154 (73.0%) |
| Total (Category) | 103 (28.1%) | 263 (71.9%) |
| Total (Overall) | 1,125 (52.6%) | 1,013 (47.4%) |
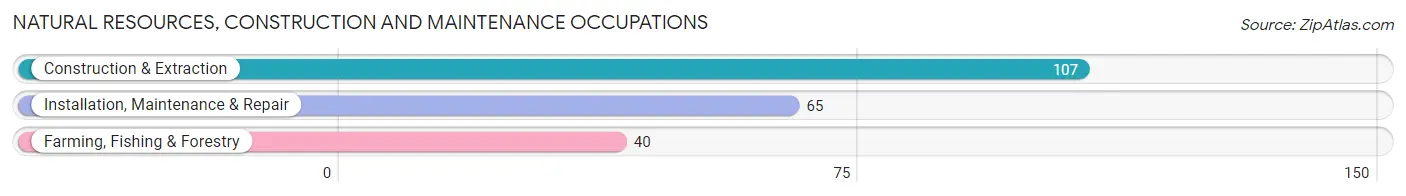
Natural Resources, Construction and Maintenance Occupations
The most common Natural Resources, Construction and Maintenance occupations in Oneida County are Construction & Extraction (107 | 5.0%), Installation, Maintenance & Repair (65 | 3.0%), and Farming, Fishing & Forestry (40 | 1.9%).
Natural Resources, Construction and Maintenance Occupations by Sex
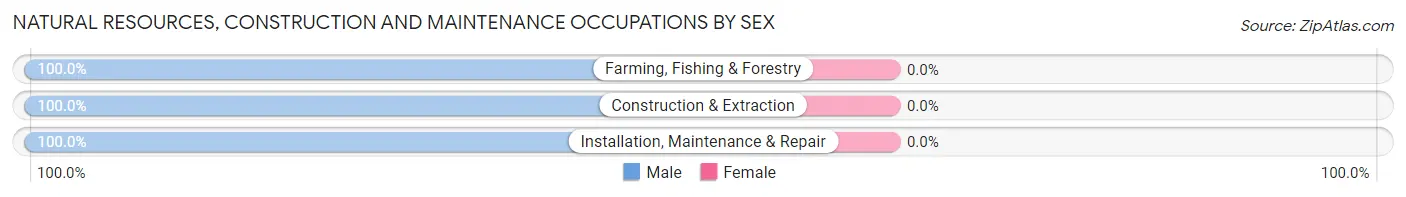
| Occupation | Male | Female |
| Farming, Fishing & Forestry | 40 (100.0%) | 0 (0.0%) |
| Construction & Extraction | 107 (100.0%) | 0 (0.0%) |
| Installation, Maintenance & Repair | 65 (100.0%) | 0 (0.0%) |
| Total (Category) | 212 (100.0%) | 0 (0.0%) |
| Total (Overall) | 1,125 (52.6%) | 1,013 (47.4%) |
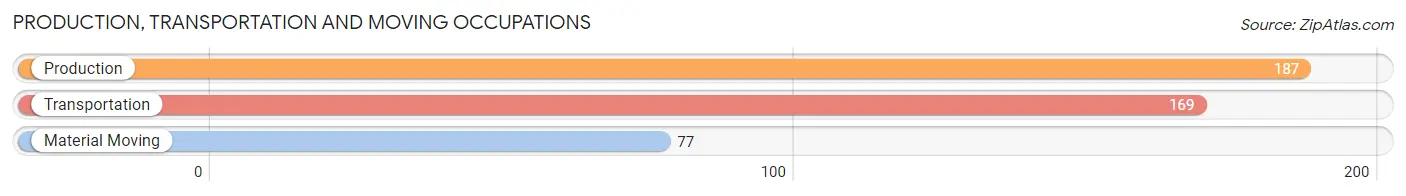
Production, Transportation and Moving Occupations
The most common Production, Transportation and Moving occupations in Oneida County are Production (187 | 8.7%), Transportation (169 | 7.9%), and Material Moving (77 | 3.6%).
Production, Transportation and Moving Occupations by Sex
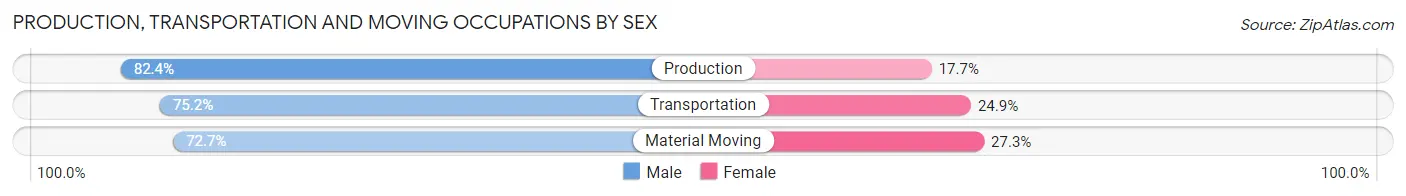
| Occupation | Male | Female |
| Production | 154 (82.4%) | 33 (17.6%) |
| Transportation | 127 (75.1%) | 42 (24.8%) |
| Material Moving | 56 (72.7%) | 21 (27.3%) |
| Total (Category) | 337 (77.8%) | 96 (22.2%) |
| Total (Overall) | 1,125 (52.6%) | 1,013 (47.4%) |
Employment Industries by Sex in Oneida County
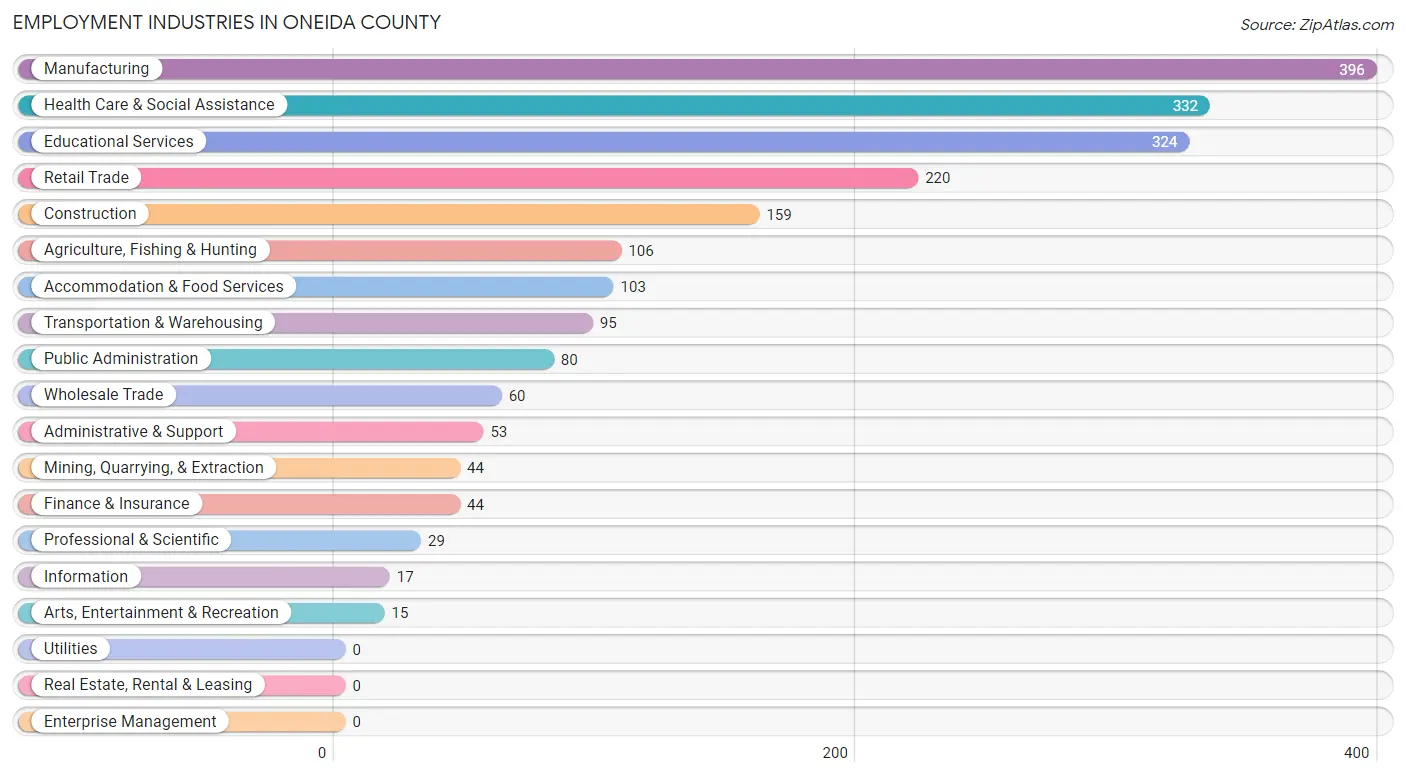
Employment Industries in Oneida County
The major employment industries in Oneida County include Manufacturing (396 | 18.5%), Health Care & Social Assistance (332 | 15.5%), Educational Services (324 | 15.1%), Retail Trade (220 | 10.3%), and Construction (159 | 7.4%).
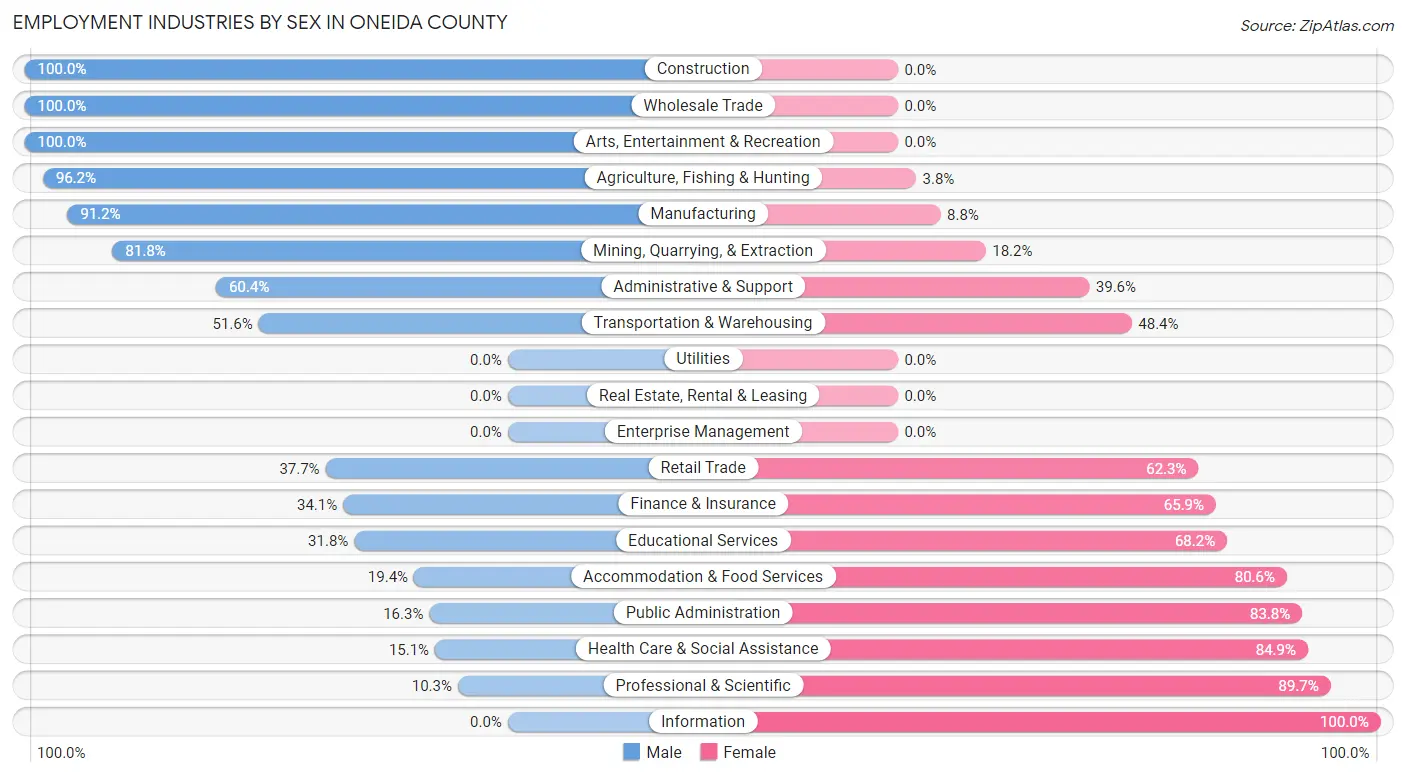
Employment Industries by Sex in Oneida County
The Oneida County industries that see more men than women are Construction (100.0%), Wholesale Trade (100.0%), and Arts, Entertainment & Recreation (100.0%), whereas the industries that tend to have a higher number of women are Information (100.0%), Professional & Scientific (89.7%), and Health Care & Social Assistance (84.9%).
| Industry | Male | Female |
| Agriculture, Fishing & Hunting | 102 (96.2%) | 4 (3.8%) |
| Mining, Quarrying, & Extraction | 36 (81.8%) | 8 (18.2%) |
| Construction | 159 (100.0%) | 0 (0.0%) |
| Manufacturing | 361 (91.2%) | 35 (8.8%) |
| Wholesale Trade | 60 (100.0%) | 0 (0.0%) |
| Retail Trade | 83 (37.7%) | 137 (62.3%) |
| Transportation & Warehousing | 49 (51.6%) | 46 (48.4%) |
| Utilities | 0 (0.0%) | 0 (0.0%) |
| Information | 0 (0.0%) | 17 (100.0%) |
| Finance & Insurance | 15 (34.1%) | 29 (65.9%) |
| Real Estate, Rental & Leasing | 0 (0.0%) | 0 (0.0%) |
| Professional & Scientific | 3 (10.3%) | 26 (89.7%) |
| Enterprise Management | 0 (0.0%) | 0 (0.0%) |
| Administrative & Support | 32 (60.4%) | 21 (39.6%) |
| Educational Services | 103 (31.8%) | 221 (68.2%) |
| Health Care & Social Assistance | 50 (15.1%) | 282 (84.9%) |
| Arts, Entertainment & Recreation | 15 (100.0%) | 0 (0.0%) |
| Accommodation & Food Services | 20 (19.4%) | 83 (80.6%) |
| Public Administration | 13 (16.3%) | 67 (83.8%) |
| Total | 1,125 (52.6%) | 1,013 (47.4%) |
Education in Oneida County
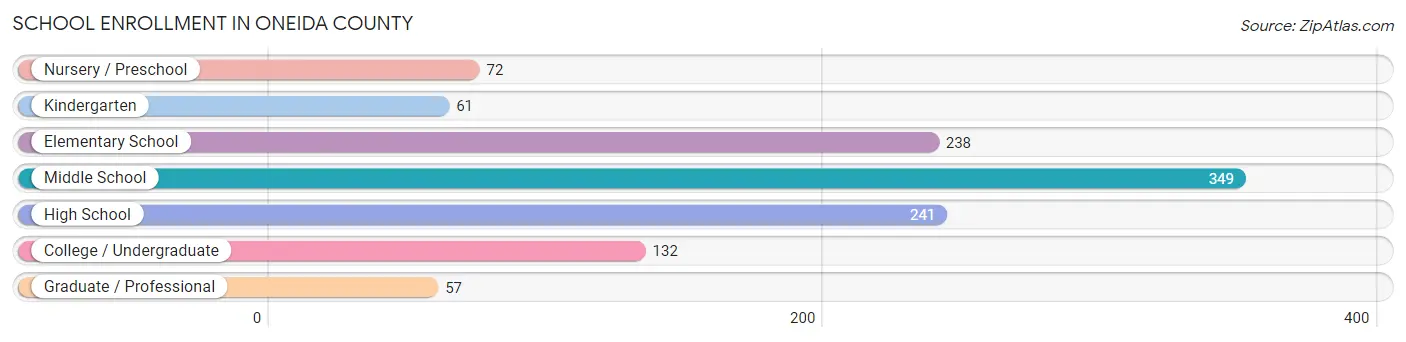
School Enrollment in Oneida County
The most common levels of schooling among the 1,150 students in Oneida County are middle school (349 | 30.3%), high school (241 | 21.0%), and elementary school (238 | 20.7%).
| School Level | # Students | % Students |
| Nursery / Preschool | 72 | 6.3% |
| Kindergarten | 61 | 5.3% |
| Elementary School | 238 | 20.7% |
| Middle School | 349 | 30.3% |
| High School | 241 | 21.0% |
| College / Undergraduate | 132 | 11.5% |
| Graduate / Professional | 57 | 5.0% |
| Total | 1,150 | 100.0% |
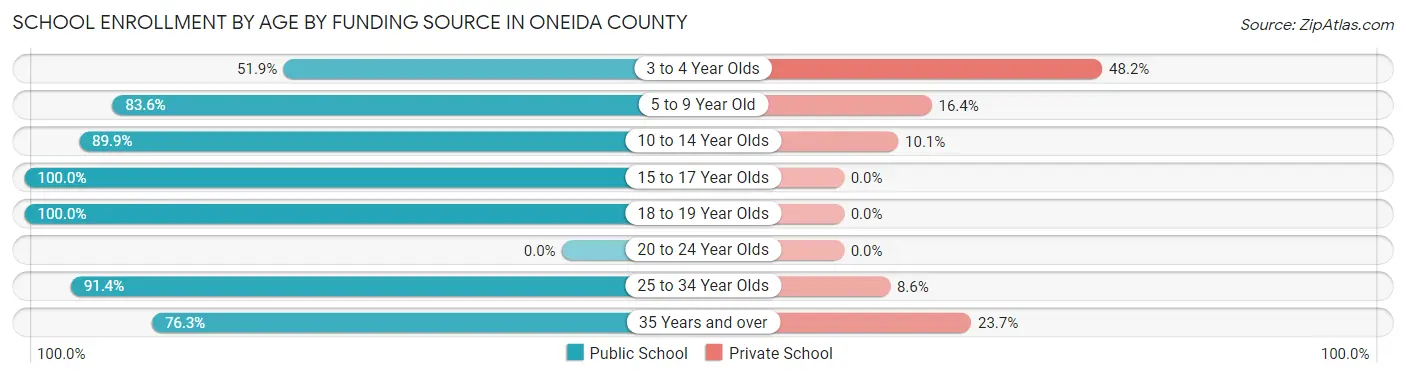
School Enrollment by Age by Funding Source in Oneida County
Out of a total of 1,150 students who are enrolled in schools in Oneida County, 147 (12.8%) attend a private institution, while the remaining 1,003 (87.2%) are enrolled in public schools. The age group of 3 to 4 year olds has the highest likelihood of being enrolled in private schools, with 26 (48.1% in the age bracket) enrolled. Conversely, the age group of 15 to 17 year olds has the lowest likelihood of being enrolled in a private school, with 184 (100.0% in the age bracket) attending a public institution.
| Age Bracket | Public School | Private School |
| 3 to 4 Year Olds | 28 (51.8%) | 26 (48.1%) |
| 5 to 9 Year Old | 230 (83.6%) | 45 (16.4%) |
| 10 to 14 Year Olds | 381 (89.9%) | 43 (10.1%) |
| 15 to 17 Year Olds | 184 (100.0%) | 0 (0.0%) |
| 18 to 19 Year Olds | 37 (100.0%) | 0 (0.0%) |
| 20 to 24 Year Olds | 0 (0.0%) | 0 (0.0%) |
| 25 to 34 Year Olds | 53 (91.4%) | 5 (8.6%) |
| 35 Years and over | 90 (76.3%) | 28 (23.7%) |
| Total | 1,003 (87.2%) | 147 (12.8%) |
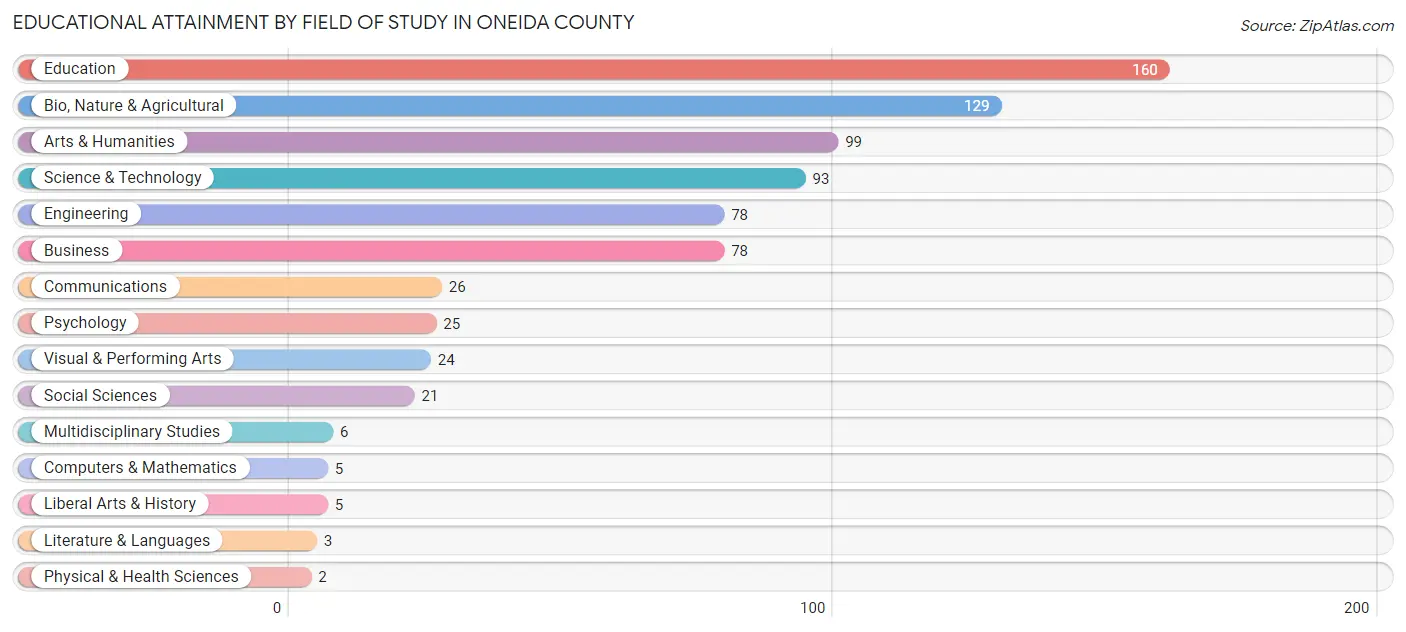
Educational Attainment by Field of Study in Oneida County
Education (160 | 21.2%), bio, nature & agricultural (129 | 17.1%), arts & humanities (99 | 13.1%), science & technology (93 | 12.3%), and engineering (78 | 10.3%) are the most common fields of study among 754 individuals in Oneida County who have obtained a bachelor's degree or higher.
| Field of Study | # Graduates | % Graduates |
| Computers & Mathematics | 5 | 0.7% |
| Bio, Nature & Agricultural | 129 | 17.1% |
| Physical & Health Sciences | 2 | 0.3% |
| Psychology | 25 | 3.3% |
| Social Sciences | 21 | 2.8% |
| Engineering | 78 | 10.3% |
| Multidisciplinary Studies | 6 | 0.8% |
| Science & Technology | 93 | 12.3% |
| Business | 78 | 10.3% |
| Education | 160 | 21.2% |
| Literature & Languages | 3 | 0.4% |
| Liberal Arts & History | 5 | 0.7% |
| Visual & Performing Arts | 24 | 3.2% |
| Communications | 26 | 3.5% |
| Arts & Humanities | 99 | 13.1% |
| Total | 754 | 100.0% |
Transportation & Commute in Oneida County
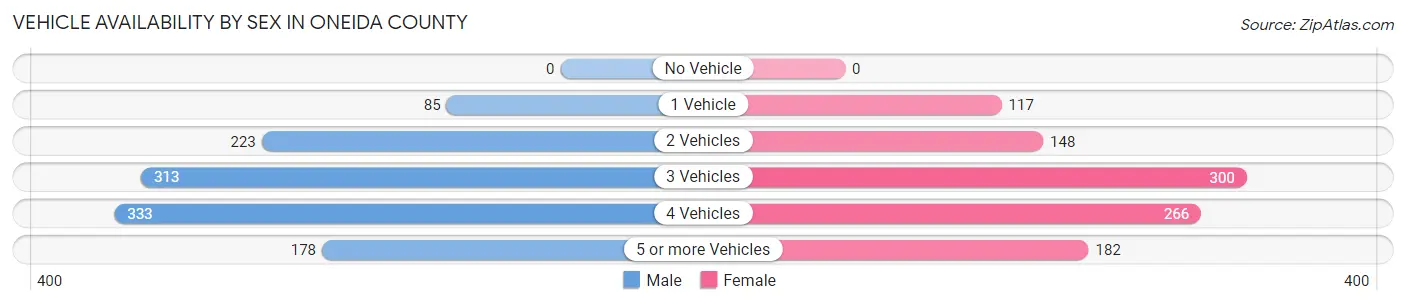
Vehicle Availability by Sex in Oneida County
The most prevalent vehicle ownership categories in Oneida County are males with 4 vehicles (333, accounting for 29.4%) and females with 4 vehicles (266, making up 32.9%).
| Vehicles Available | Male | Female |
| No Vehicle | 0 (0.0%) | 0 (0.0%) |
| 1 Vehicle | 85 (7.5%) | 117 (11.6%) |
| 2 Vehicles | 223 (19.7%) | 148 (14.6%) |
| 3 Vehicles | 313 (27.7%) | 300 (29.6%) |
| 4 Vehicles | 333 (29.4%) | 266 (26.3%) |
| 5 or more Vehicles | 178 (15.7%) | 182 (18.0%) |
| Total | 1,132 (100.0%) | 1,013 (100.0%) |
Commute Time in Oneida County
The most frequently occuring commute durations in Oneida County are 5 to 9 minutes (366 commuters, 19.3%), less than 5 minutes (277 commuters, 14.6%), and 60 to 89 minutes (259 commuters, 13.6%).
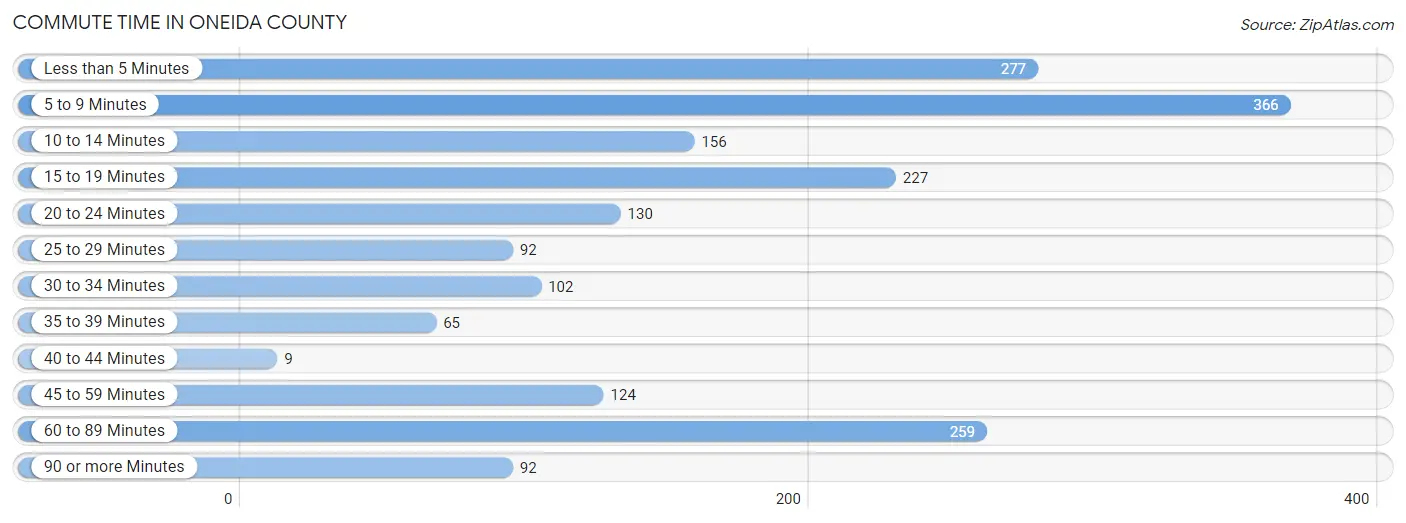
| Commute Time | # Commuters | % Commuters |
| Less than 5 Minutes | 277 | 14.6% |
| 5 to 9 Minutes | 366 | 19.3% |
| 10 to 14 Minutes | 156 | 8.2% |
| 15 to 19 Minutes | 227 | 11.9% |
| 20 to 24 Minutes | 130 | 6.9% |
| 25 to 29 Minutes | 92 | 4.8% |
| 30 to 34 Minutes | 102 | 5.4% |
| 35 to 39 Minutes | 65 | 3.4% |
| 40 to 44 Minutes | 9 | 0.5% |
| 45 to 59 Minutes | 124 | 6.5% |
| 60 to 89 Minutes | 259 | 13.6% |
| 90 or more Minutes | 92 | 4.8% |
Commute Time by Sex in Oneida County
The most common commute times in Oneida County are 60 to 89 minutes (249 commuters, 23.4%) for males and 5 to 9 minutes (201 commuters, 24.1%) for females.
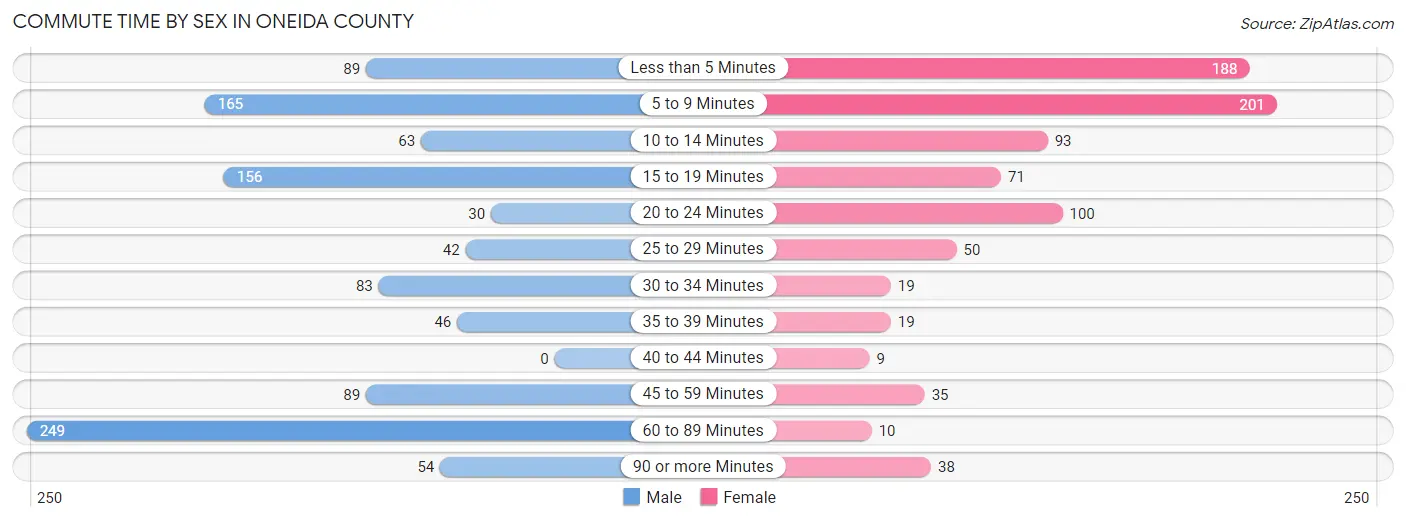
| Commute Time | Male | Female |
| Less than 5 Minutes | 89 (8.4%) | 188 (22.6%) |
| 5 to 9 Minutes | 165 (15.5%) | 201 (24.1%) |
| 10 to 14 Minutes | 63 (5.9%) | 93 (11.2%) |
| 15 to 19 Minutes | 156 (14.6%) | 71 (8.5%) |
| 20 to 24 Minutes | 30 (2.8%) | 100 (12.0%) |
| 25 to 29 Minutes | 42 (3.9%) | 50 (6.0%) |
| 30 to 34 Minutes | 83 (7.8%) | 19 (2.3%) |
| 35 to 39 Minutes | 46 (4.3%) | 19 (2.3%) |
| 40 to 44 Minutes | 0 (0.0%) | 9 (1.1%) |
| 45 to 59 Minutes | 89 (8.4%) | 35 (4.2%) |
| 60 to 89 Minutes | 249 (23.4%) | 10 (1.2%) |
| 90 or more Minutes | 54 (5.1%) | 38 (4.6%) |
Time of Departure to Work by Sex in Oneida County
The most frequent times of departure to work in Oneida County are 12:00 AM to 4:59 AM (215, 20.2%) for males and 7:00 AM to 7:29 AM (120, 14.4%) for females.
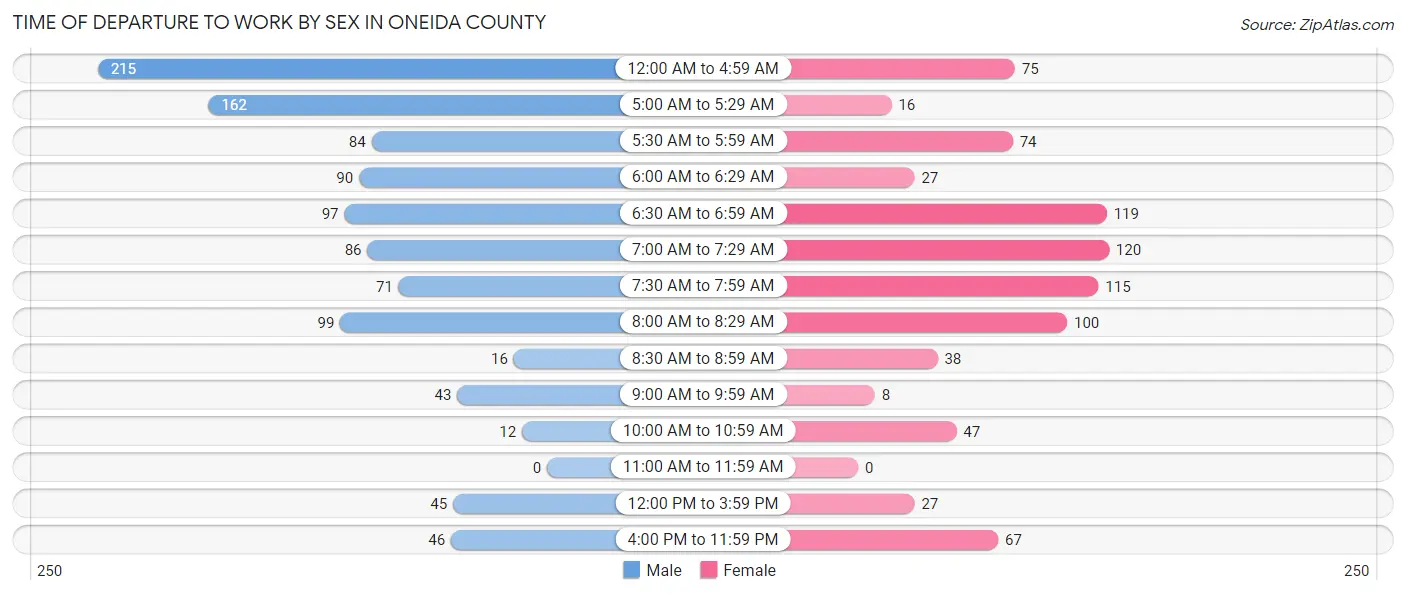
| Time of Departure | Male | Female |
| 12:00 AM to 4:59 AM | 215 (20.2%) | 75 (9.0%) |
| 5:00 AM to 5:29 AM | 162 (15.2%) | 16 (1.9%) |
| 5:30 AM to 5:59 AM | 84 (7.9%) | 74 (8.9%) |
| 6:00 AM to 6:29 AM | 90 (8.4%) | 27 (3.2%) |
| 6:30 AM to 6:59 AM | 97 (9.1%) | 119 (14.3%) |
| 7:00 AM to 7:29 AM | 86 (8.1%) | 120 (14.4%) |
| 7:30 AM to 7:59 AM | 71 (6.7%) | 115 (13.8%) |
| 8:00 AM to 8:29 AM | 99 (9.3%) | 100 (12.0%) |
| 8:30 AM to 8:59 AM | 16 (1.5%) | 38 (4.6%) |
| 9:00 AM to 9:59 AM | 43 (4.0%) | 8 (1.0%) |
| 10:00 AM to 10:59 AM | 12 (1.1%) | 47 (5.6%) |
| 11:00 AM to 11:59 AM | 0 (0.0%) | 0 (0.0%) |
| 12:00 PM to 3:59 PM | 45 (4.2%) | 27 (3.2%) |
| 4:00 PM to 11:59 PM | 46 (4.3%) | 67 (8.0%) |
| Total | 1,066 (100.0%) | 833 (100.0%) |
Housing Occupancy in Oneida County
Occupancy by Ownership in Oneida County
Of the total 1,841 dwellings in Oneida County, owner-occupied units account for 1,623 (88.2%), while renter-occupied units make up 218 (11.8%).
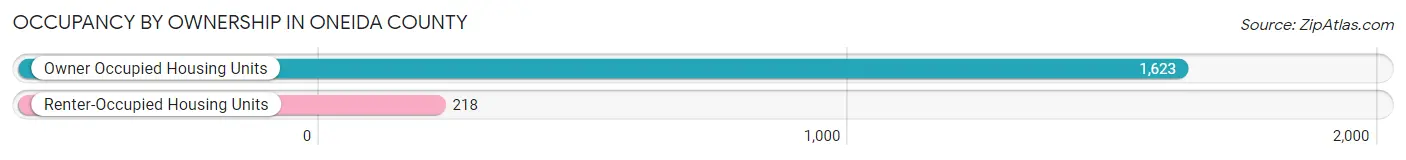
| Occupancy | # Housing Units | % Housing Units |
| Owner Occupied Housing Units | 1,623 | 88.2% |
| Renter-Occupied Housing Units | 218 | 11.8% |
| Total Occupied Housing Units | 1,841 | 100.0% |
Occupancy by Household Size in Oneida County
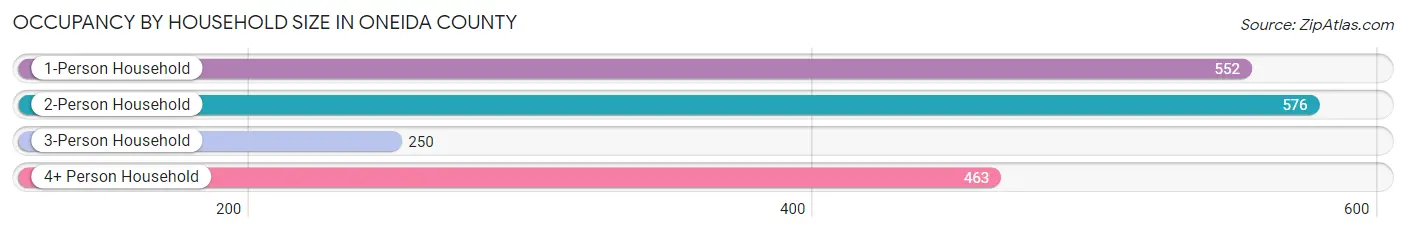
| Household Size | # Housing Units | % Housing Units |
| 1-Person Household | 552 | 30.0% |
| 2-Person Household | 576 | 31.3% |
| 3-Person Household | 250 | 13.6% |
| 4+ Person Household | 463 | 25.2% |
| Total Housing Units | 1,841 | 100.0% |
Occupancy by Ownership by Household Size in Oneida County
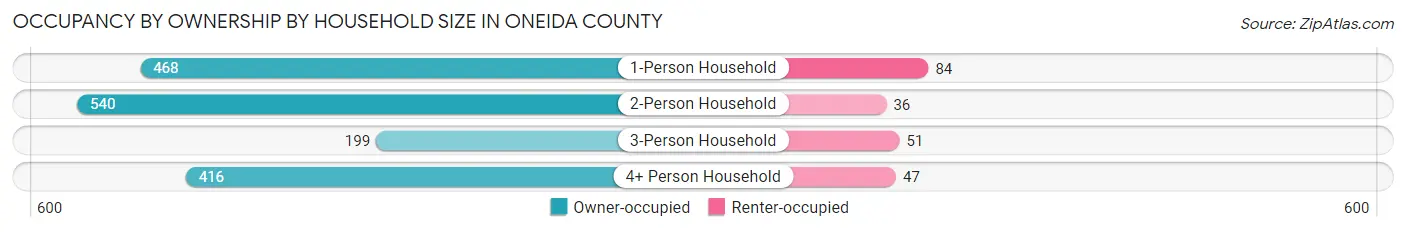
| Household Size | Owner-occupied | Renter-occupied |
| 1-Person Household | 468 (84.8%) | 84 (15.2%) |
| 2-Person Household | 540 (93.8%) | 36 (6.2%) |
| 3-Person Household | 199 (79.6%) | 51 (20.4%) |
| 4+ Person Household | 416 (89.8%) | 47 (10.2%) |
| Total Housing Units | 1,623 (88.2%) | 218 (11.8%) |
Occupancy by Educational Attainment in Oneida County
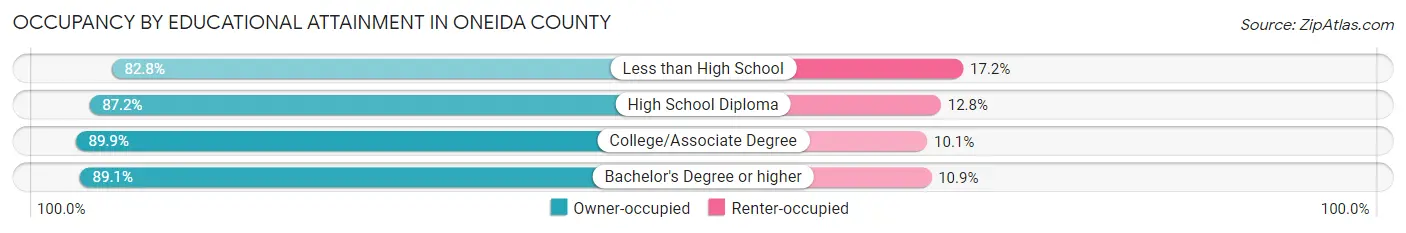
| Household Size | Owner-occupied | Renter-occupied |
| Less than High School | 120 (82.8%) | 25 (17.2%) |
| High School Diploma | 592 (87.2%) | 87 (12.8%) |
| College/Associate Degree | 552 (89.9%) | 62 (10.1%) |
| Bachelor's Degree or higher | 359 (89.1%) | 44 (10.9%) |
Occupancy by Age of Householder in Oneida County
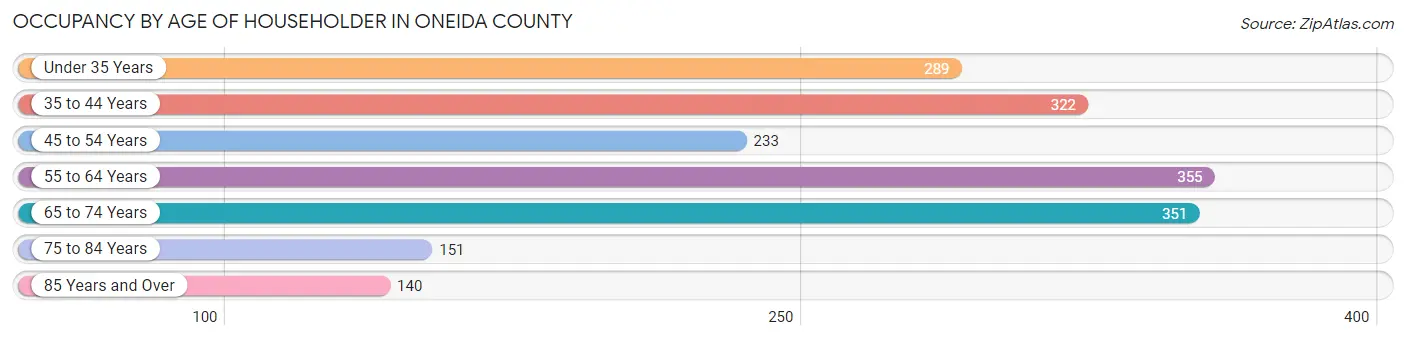
| Age Bracket | # Households | % Households |
| Under 35 Years | 289 | 15.7% |
| 35 to 44 Years | 322 | 17.5% |
| 45 to 54 Years | 233 | 12.7% |
| 55 to 64 Years | 355 | 19.3% |
| 65 to 74 Years | 351 | 19.1% |
| 75 to 84 Years | 151 | 8.2% |
| 85 Years and Over | 140 | 7.6% |
| Total | 1,841 | 100.0% |
Housing Finances in Oneida County
Median Income by Occupancy in Oneida County
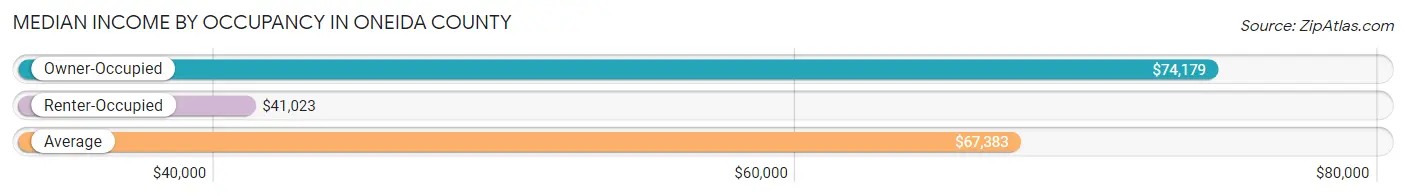
| Occupancy Type | # Households | Median Income |
| Owner-Occupied | 1,623 (88.2%) | $74,179 |
| Renter-Occupied | 218 (11.8%) | $41,023 |
| Average | 1,841 (100.0%) | $67,383 |
Occupancy by Householder Income Bracket in Oneida County
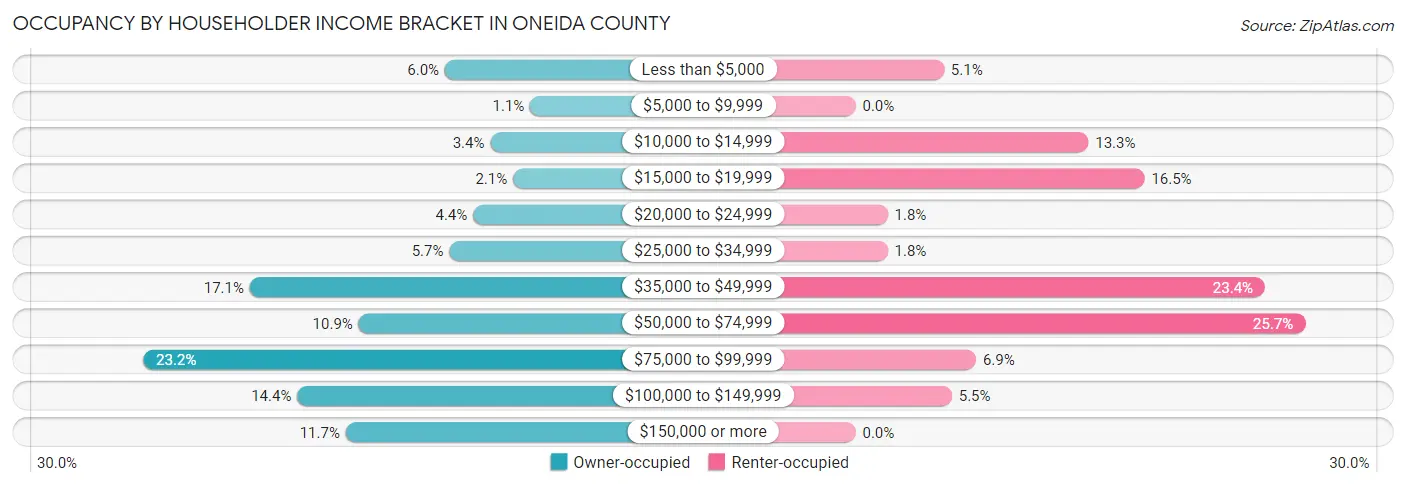
| Income Bracket | Owner-occupied | Renter-occupied |
| Less than $5,000 | 97 (6.0%) | 11 (5.1%) |
| $5,000 to $9,999 | 18 (1.1%) | 0 (0.0%) |
| $10,000 to $14,999 | 55 (3.4%) | 29 (13.3%) |
| $15,000 to $19,999 | 34 (2.1%) | 36 (16.5%) |
| $20,000 to $24,999 | 71 (4.4%) | 4 (1.8%) |
| $25,000 to $34,999 | 93 (5.7%) | 4 (1.8%) |
| $35,000 to $49,999 | 278 (17.1%) | 51 (23.4%) |
| $50,000 to $74,999 | 177 (10.9%) | 56 (25.7%) |
| $75,000 to $99,999 | 377 (23.2%) | 15 (6.9%) |
| $100,000 to $149,999 | 234 (14.4%) | 12 (5.5%) |
| $150,000 or more | 189 (11.7%) | 0 (0.0%) |
| Total | 1,623 (100.0%) | 218 (100.0%) |
Monthly Housing Cost Tiers in Oneida County
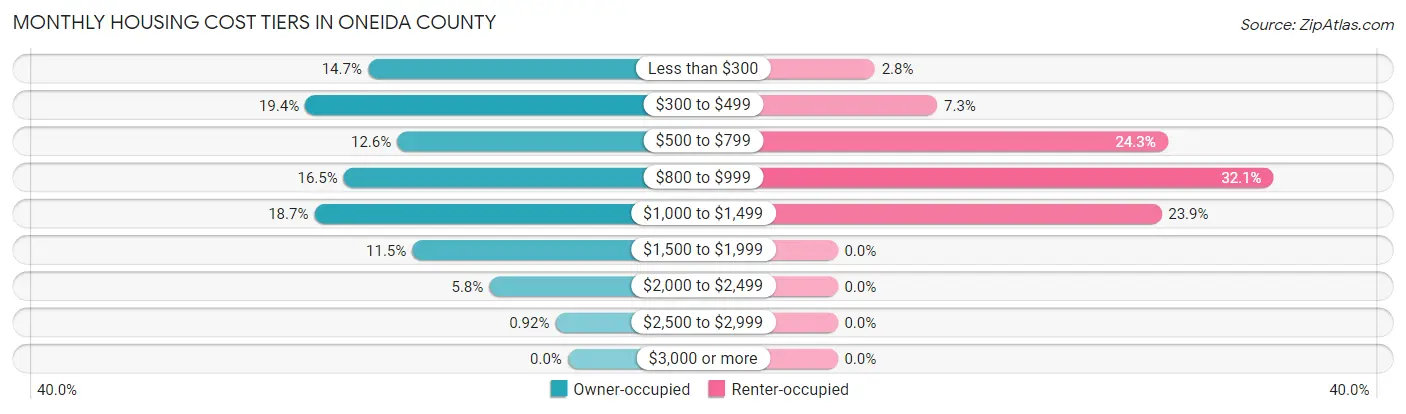
| Monthly Cost | Owner-occupied | Renter-occupied |
| Less than $300 | 239 (14.7%) | 6 (2.8%) |
| $300 to $499 | 314 (19.4%) | 16 (7.3%) |
| $500 to $799 | 204 (12.6%) | 53 (24.3%) |
| $800 to $999 | 268 (16.5%) | 70 (32.1%) |
| $1,000 to $1,499 | 303 (18.7%) | 52 (23.8%) |
| $1,500 to $1,999 | 186 (11.5%) | 0 (0.0%) |
| $2,000 to $2,499 | 94 (5.8%) | 0 (0.0%) |
| $2,500 to $2,999 | 15 (0.9%) | 0 (0.0%) |
| $3,000 or more | 0 (0.0%) | 0 (0.0%) |
| Total | 1,623 (100.0%) | 218 (100.0%) |
Physical Housing Characteristics in Oneida County
Housing Structures in Oneida County
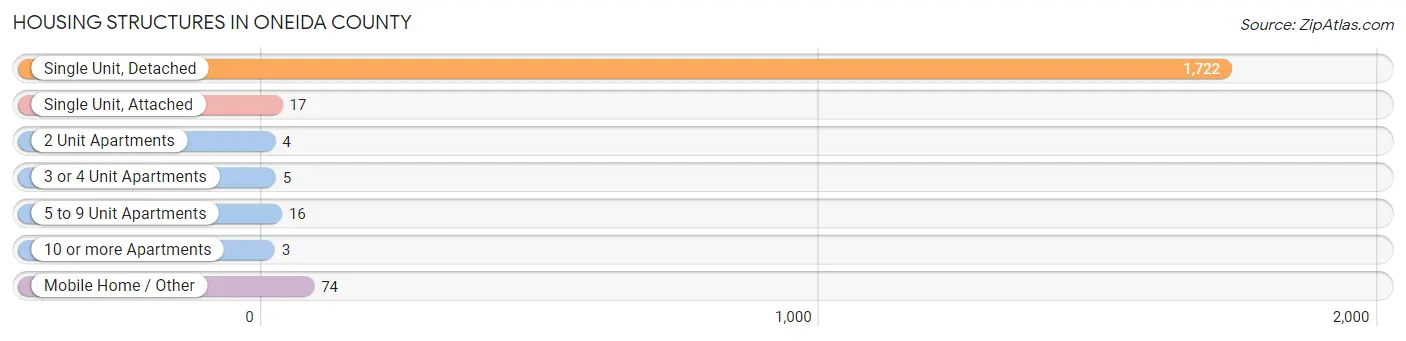
| Structure Type | # Housing Units | % Housing Units |
| Single Unit, Detached | 1,722 | 93.5% |
| Single Unit, Attached | 17 | 0.9% |
| 2 Unit Apartments | 4 | 0.2% |
| 3 or 4 Unit Apartments | 5 | 0.3% |
| 5 to 9 Unit Apartments | 16 | 0.9% |
| 10 or more Apartments | 3 | 0.2% |
| Mobile Home / Other | 74 | 4.0% |
| Total | 1,841 | 100.0% |
Housing Structures by Occupancy in Oneida County
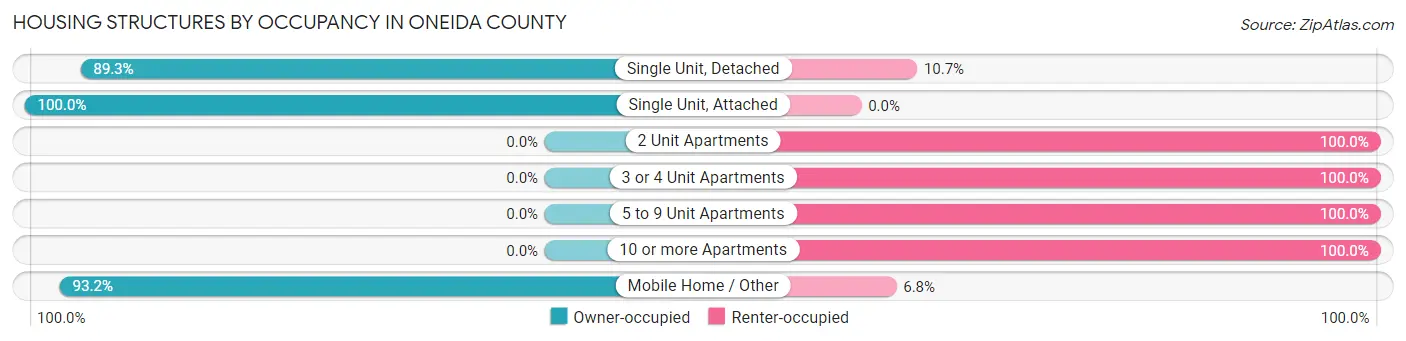
| Structure Type | Owner-occupied | Renter-occupied |
| Single Unit, Detached | 1,537 (89.3%) | 185 (10.7%) |
| Single Unit, Attached | 17 (100.0%) | 0 (0.0%) |
| 2 Unit Apartments | 0 (0.0%) | 4 (100.0%) |
| 3 or 4 Unit Apartments | 0 (0.0%) | 5 (100.0%) |
| 5 to 9 Unit Apartments | 0 (0.0%) | 16 (100.0%) |
| 10 or more Apartments | 0 (0.0%) | 3 (100.0%) |
| Mobile Home / Other | 69 (93.2%) | 5 (6.8%) |
| Total | 1,623 (88.2%) | 218 (11.8%) |
Housing Structures by Number of Rooms in Oneida County
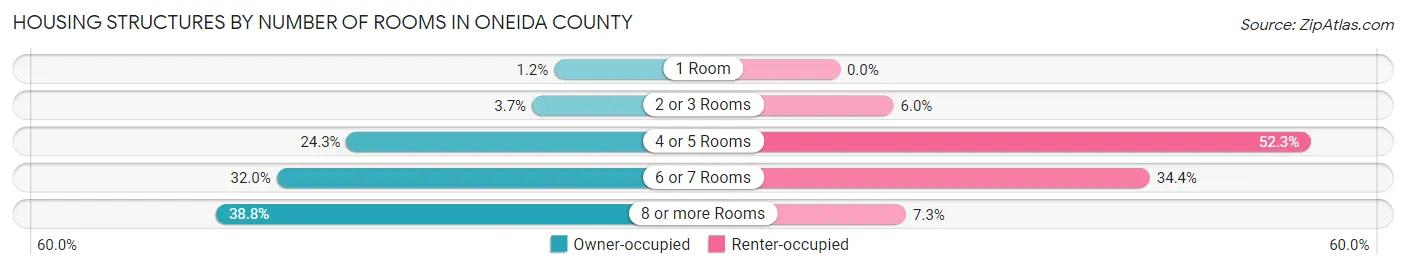
| Number of Rooms | Owner-occupied | Renter-occupied |
| 1 Room | 20 (1.2%) | 0 (0.0%) |
| 2 or 3 Rooms | 60 (3.7%) | 13 (6.0%) |
| 4 or 5 Rooms | 394 (24.3%) | 114 (52.3%) |
| 6 or 7 Rooms | 520 (32.0%) | 75 (34.4%) |
| 8 or more Rooms | 629 (38.8%) | 16 (7.3%) |
| Total | 1,623 (100.0%) | 218 (100.0%) |
Housing Structure by Heating Type in Oneida County
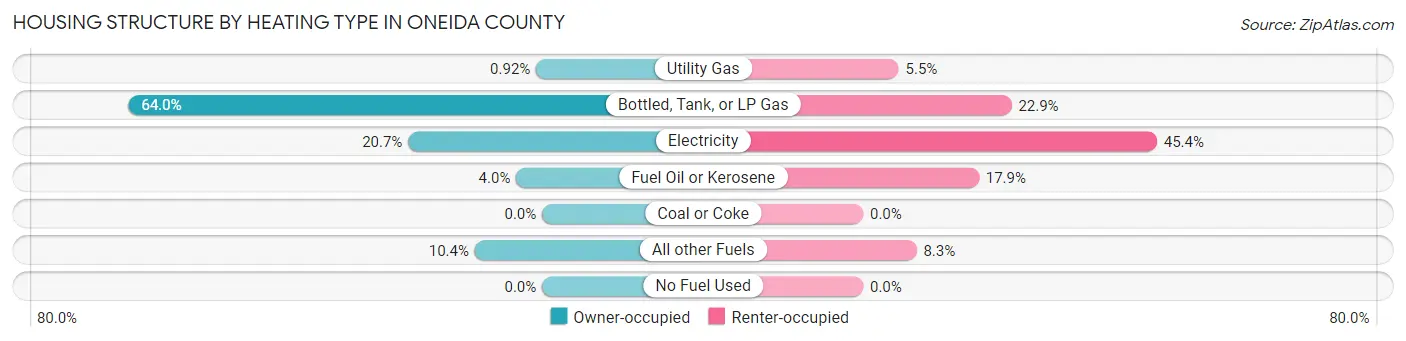
| Heating Type | Owner-occupied | Renter-occupied |
| Utility Gas | 15 (0.9%) | 12 (5.5%) |
| Bottled, Tank, or LP Gas | 1,038 (64.0%) | 50 (22.9%) |
| Electricity | 336 (20.7%) | 99 (45.4%) |
| Fuel Oil or Kerosene | 65 (4.0%) | 39 (17.9%) |
| Coal or Coke | 0 (0.0%) | 0 (0.0%) |
| All other Fuels | 169 (10.4%) | 18 (8.3%) |
| No Fuel Used | 0 (0.0%) | 0 (0.0%) |
| Total | 1,623 (100.0%) | 218 (100.0%) |
Household Vehicle Usage in Oneida County
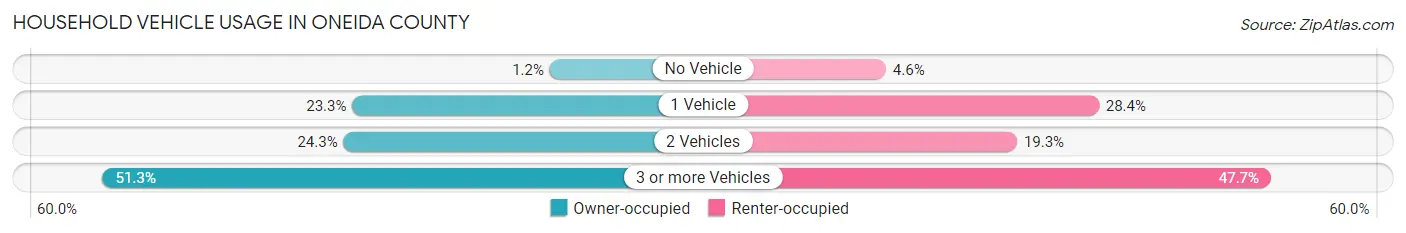
| Vehicles per Household | Owner-occupied | Renter-occupied |
| No Vehicle | 19 (1.2%) | 10 (4.6%) |
| 1 Vehicle | 378 (23.3%) | 62 (28.4%) |
| 2 Vehicles | 394 (24.3%) | 42 (19.3%) |
| 3 or more Vehicles | 832 (51.3%) | 104 (47.7%) |
| Total | 1,623 (100.0%) | 218 (100.0%) |
Real Estate & Mortgages in Oneida County
Real Estate and Mortgage Overview in Oneida County
| Characteristic | Without Mortgage | With Mortgage |
| Housing Units | 693 | 930 |
| Median Property Value | $219,900 | $232,400 |
| Median Household Income | $43,542 | $143 |
| Monthly Housing Costs | $362 | $0 |
| Real Estate Taxes | $1,124 | $53 |
Property Value by Mortgage Status in Oneida County
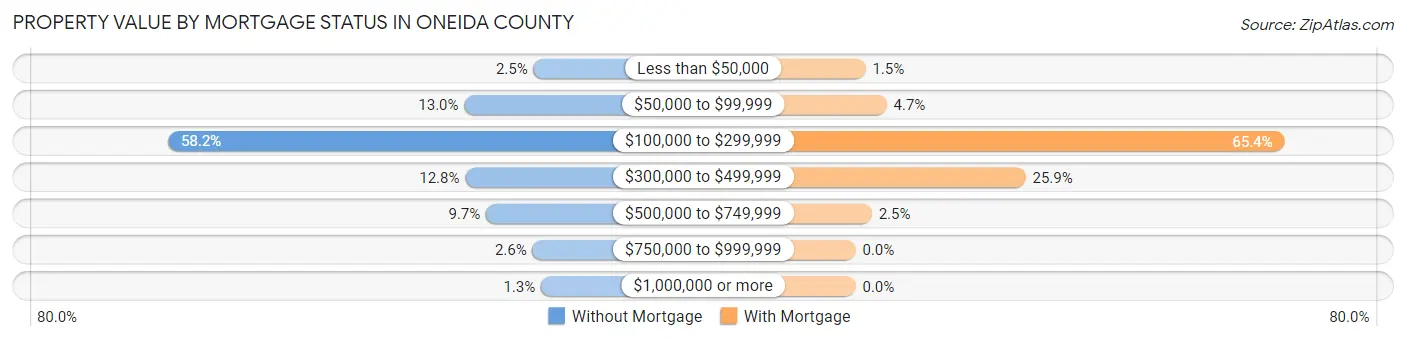
| Property Value | Without Mortgage | With Mortgage |
| Less than $50,000 | 17 (2.5%) | 14 (1.5%) |
| $50,000 to $99,999 | 90 (13.0%) | 44 (4.7%) |
| $100,000 to $299,999 | 403 (58.2%) | 608 (65.4%) |
| $300,000 to $499,999 | 89 (12.8%) | 241 (25.9%) |
| $500,000 to $749,999 | 67 (9.7%) | 23 (2.5%) |
| $750,000 to $999,999 | 18 (2.6%) | 0 (0.0%) |
| $1,000,000 or more | 9 (1.3%) | 0 (0.0%) |
| Total | 693 (100.0%) | 930 (100.0%) |
Household Income by Mortgage Status in Oneida County
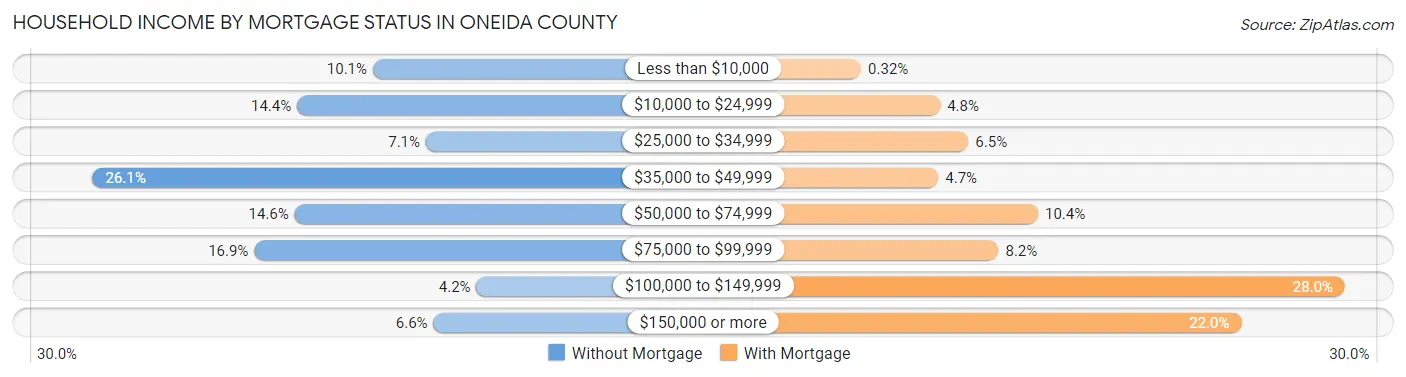
| Household Income | Without Mortgage | With Mortgage |
| Less than $10,000 | 70 (10.1%) | 3 (0.3%) |
| $10,000 to $24,999 | 100 (14.4%) | 45 (4.8%) |
| $25,000 to $34,999 | 49 (7.1%) | 60 (6.5%) |
| $35,000 to $49,999 | 181 (26.1%) | 44 (4.7%) |
| $50,000 to $74,999 | 101 (14.6%) | 97 (10.4%) |
| $75,000 to $99,999 | 117 (16.9%) | 76 (8.2%) |
| $100,000 to $149,999 | 29 (4.2%) | 260 (28.0%) |
| $150,000 or more | 46 (6.6%) | 205 (22.0%) |
| Total | 693 (100.0%) | 930 (100.0%) |
Property Value to Household Income Ratio in Oneida County
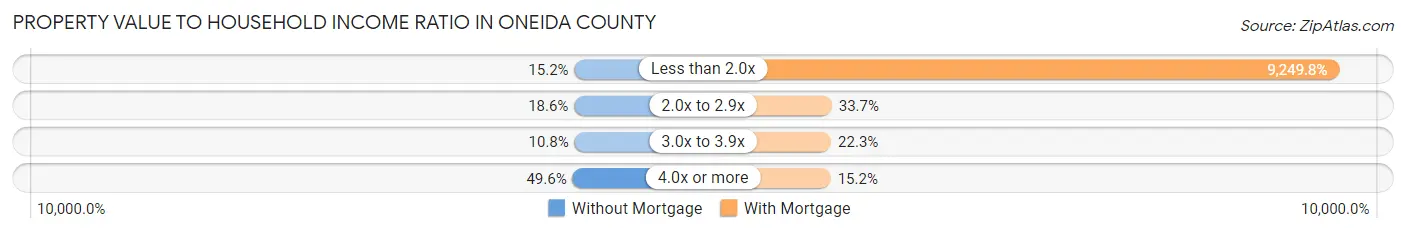
| Value-to-Income Ratio | Without Mortgage | With Mortgage |
| Less than 2.0x | 105 (15.1%) | 86,023 (9,249.8%) |
| 2.0x to 2.9x | 129 (18.6%) | 313 (33.7%) |
| 3.0x to 3.9x | 75 (10.8%) | 207 (22.3%) |
| 4.0x or more | 344 (49.6%) | 141 (15.2%) |
| Total | 693 (100.0%) | 930 (100.0%) |
Real Estate Taxes by Mortgage Status in Oneida County
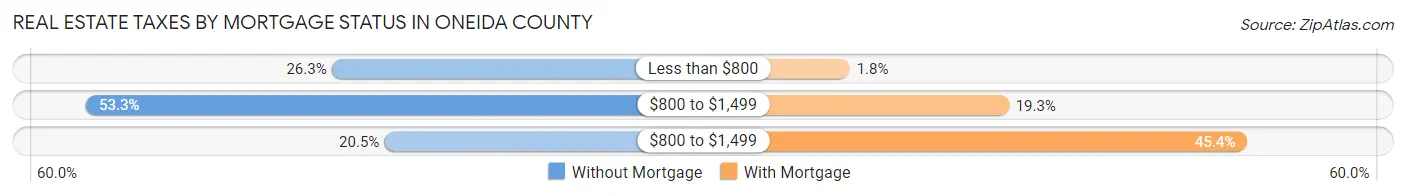
| Property Taxes | Without Mortgage | With Mortgage |
| Less than $800 | 182 (26.3%) | 17 (1.8%) |
| $800 to $1,499 | 369 (53.2%) | 179 (19.3%) |
| $800 to $1,499 | 142 (20.5%) | 422 (45.4%) |
| Total | 693 (100.0%) | 930 (100.0%) |
Health & Disability in Oneida County
Health Insurance Coverage by Age in Oneida County
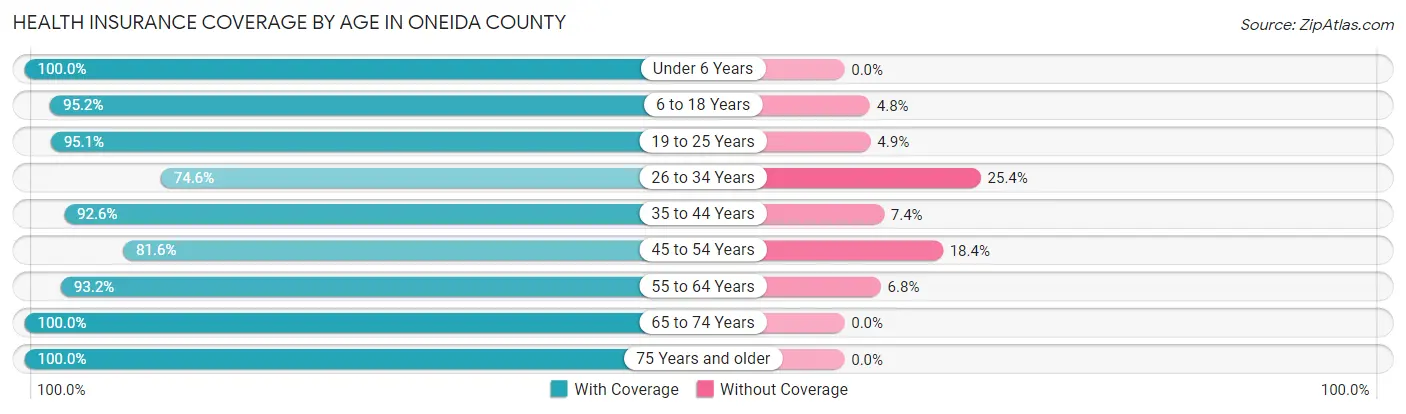
| Age Bracket | With Coverage | Without Coverage |
| Under 6 Years | 354 (100.0%) | 0 (0.0%) |
| 6 to 18 Years | 921 (95.2%) | 46 (4.8%) |
| 19 to 25 Years | 332 (95.1%) | 17 (4.9%) |
| 26 to 34 Years | 264 (74.6%) | 90 (25.4%) |
| 35 to 44 Years | 528 (92.6%) | 42 (7.4%) |
| 45 to 54 Years | 369 (81.6%) | 83 (18.4%) |
| 55 to 64 Years | 564 (93.2%) | 41 (6.8%) |
| 65 to 74 Years | 506 (100.0%) | 0 (0.0%) |
| 75 Years and older | 365 (100.0%) | 0 (0.0%) |
| Total | 4,203 (92.9%) | 319 (7.0%) |
Health Insurance Coverage by Citizenship Status in Oneida County
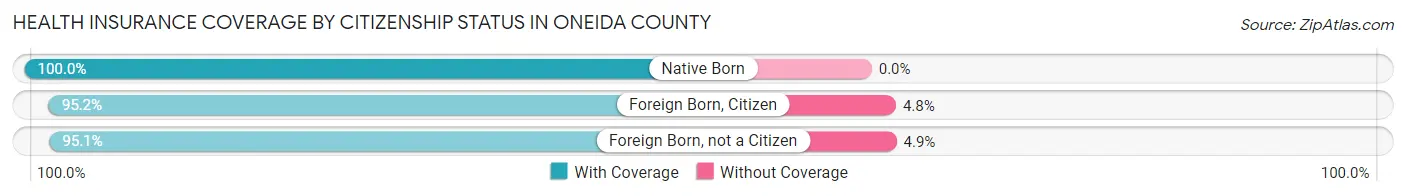
| Citizenship Status | With Coverage | Without Coverage |
| Native Born | 354 (100.0%) | 0 (0.0%) |
| Foreign Born, Citizen | 921 (95.2%) | 46 (4.8%) |
| Foreign Born, not a Citizen | 332 (95.1%) | 17 (4.9%) |
Health Insurance Coverage by Household Income in Oneida County
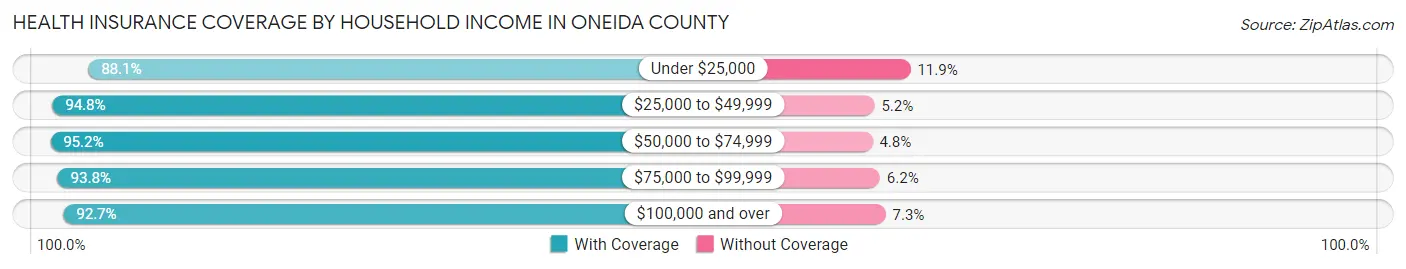
| Household Income | With Coverage | Without Coverage |
| Under $25,000 | 576 (88.1%) | 78 (11.9%) |
| $25,000 to $49,999 | 694 (94.8%) | 38 (5.2%) |
| $50,000 to $74,999 | 475 (95.2%) | 24 (4.8%) |
| $75,000 to $99,999 | 1,119 (93.8%) | 74 (6.2%) |
| $100,000 and over | 1,339 (92.7%) | 105 (7.3%) |
Public vs Private Health Insurance Coverage by Age in Oneida County
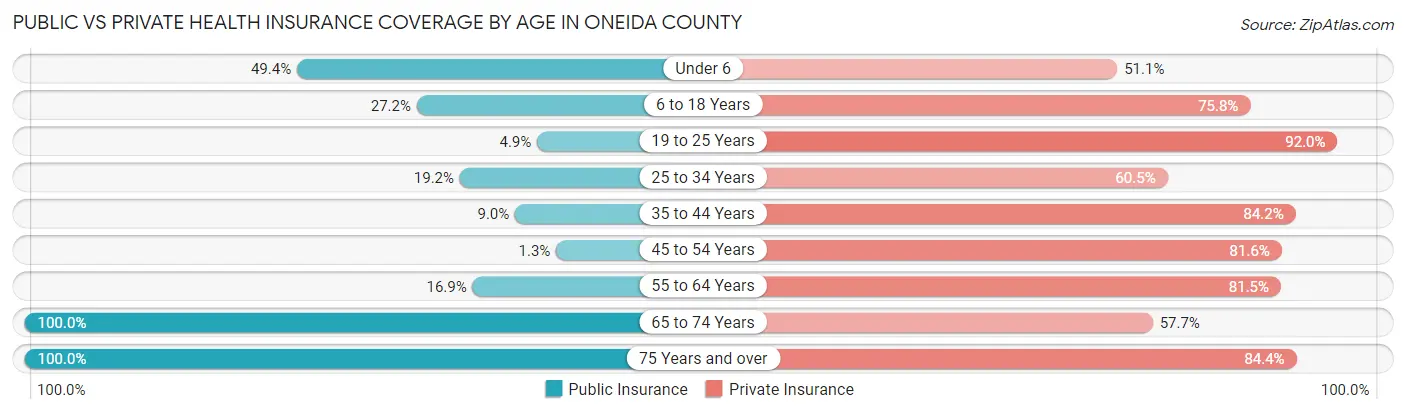
| Age Bracket | Public Insurance | Private Insurance |
| Under 6 | 175 (49.4%) | 181 (51.1%) |
| 6 to 18 Years | 263 (27.2%) | 733 (75.8%) |
| 19 to 25 Years | 17 (4.9%) | 321 (92.0%) |
| 25 to 34 Years | 68 (19.2%) | 214 (60.5%) |
| 35 to 44 Years | 51 (8.9%) | 480 (84.2%) |
| 45 to 54 Years | 6 (1.3%) | 369 (81.6%) |
| 55 to 64 Years | 102 (16.9%) | 493 (81.5%) |
| 65 to 74 Years | 506 (100.0%) | 292 (57.7%) |
| 75 Years and over | 365 (100.0%) | 308 (84.4%) |
| Total | 1,553 (34.3%) | 3,391 (75.0%) |
Disability Status by Sex by Age in Oneida County
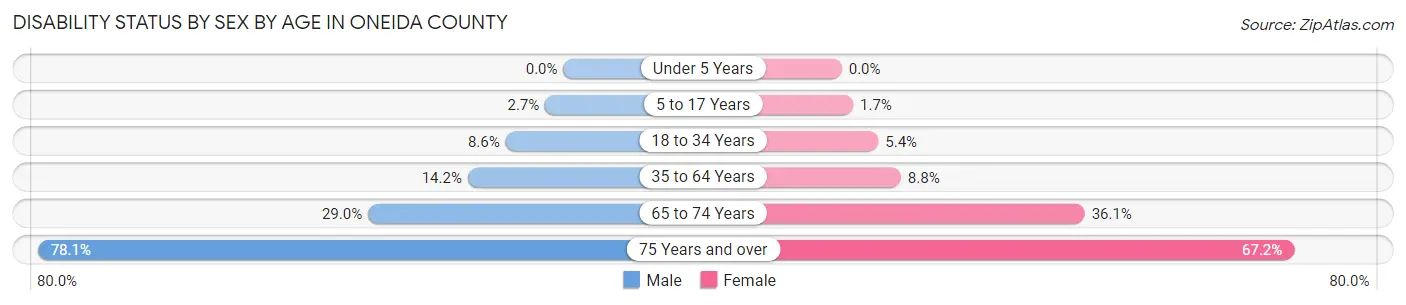
| Age Bracket | Male | Female |
| Under 5 Years | 0 (0.0%) | 0 (0.0%) |
| 5 to 17 Years | 13 (2.7%) | 8 (1.7%) |
| 18 to 34 Years | 35 (8.6%) | 19 (5.4%) |
| 35 to 64 Years | 113 (14.2%) | 73 (8.8%) |
| 65 to 74 Years | 76 (29.0%) | 88 (36.1%) |
| 75 Years and over | 128 (78.0%) | 135 (67.2%) |
Disability Class by Sex by Age in Oneida County
Disability Class: Hearing Difficulty
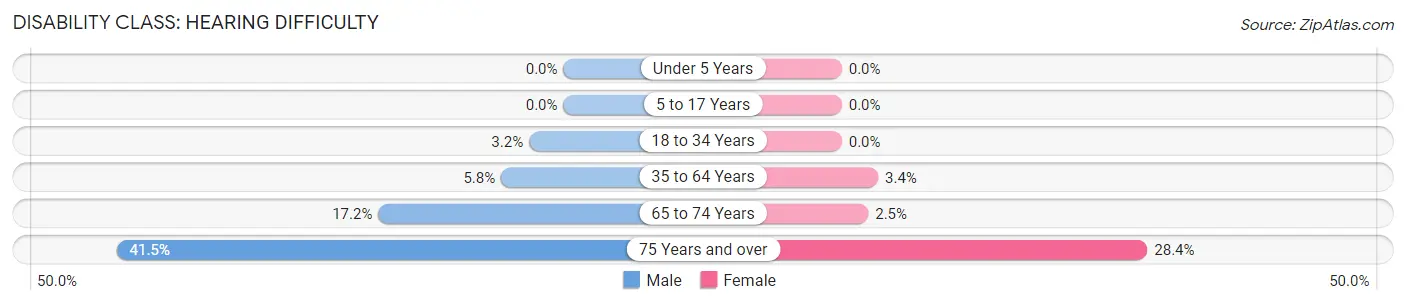
| Age Bracket | Male | Female |
| Under 5 Years | 0 (0.0%) | 0 (0.0%) |
| 5 to 17 Years | 0 (0.0%) | 0 (0.0%) |
| 18 to 34 Years | 13 (3.2%) | 0 (0.0%) |
| 35 to 64 Years | 46 (5.8%) | 28 (3.4%) |
| 65 to 74 Years | 45 (17.2%) | 6 (2.5%) |
| 75 Years and over | 68 (41.5%) | 57 (28.4%) |
Disability Class: Vision Difficulty
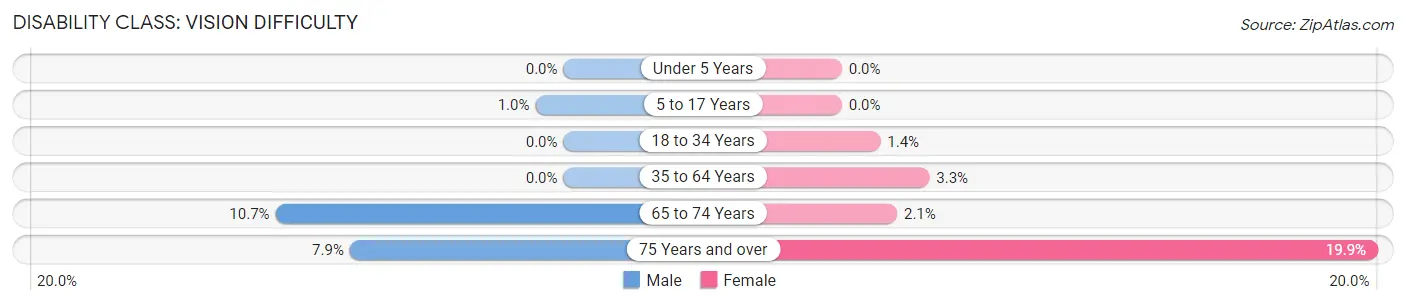
| Age Bracket | Male | Female |
| Under 5 Years | 0 (0.0%) | 0 (0.0%) |
| 5 to 17 Years | 5 (1.0%) | 0 (0.0%) |
| 18 to 34 Years | 0 (0.0%) | 5 (1.4%) |
| 35 to 64 Years | 0 (0.0%) | 27 (3.3%) |
| 65 to 74 Years | 28 (10.7%) | 5 (2.1%) |
| 75 Years and over | 13 (7.9%) | 40 (19.9%) |
Disability Class: Cognitive Difficulty
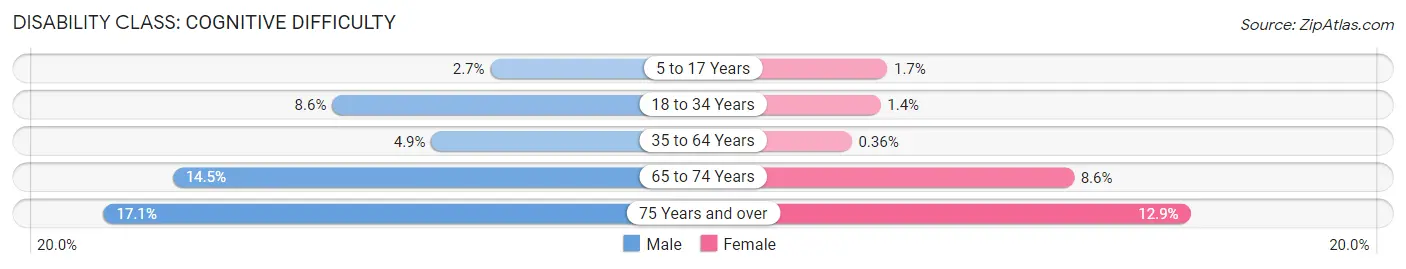
| Age Bracket | Male | Female |
| 5 to 17 Years | 13 (2.7%) | 8 (1.7%) |
| 18 to 34 Years | 35 (8.6%) | 5 (1.4%) |
| 35 to 64 Years | 39 (4.9%) | 3 (0.4%) |
| 65 to 74 Years | 38 (14.5%) | 21 (8.6%) |
| 75 Years and over | 28 (17.1%) | 26 (12.9%) |
Disability Class: Ambulatory Difficulty
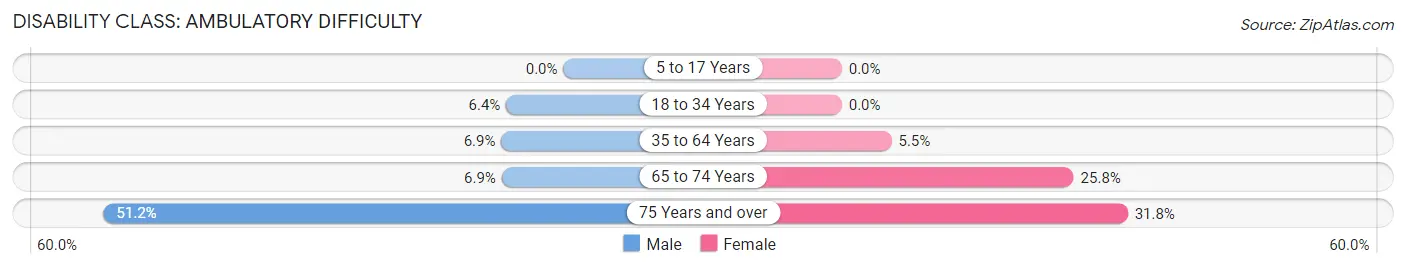
| Age Bracket | Male | Female |
| 5 to 17 Years | 0 (0.0%) | 0 (0.0%) |
| 18 to 34 Years | 26 (6.4%) | 0 (0.0%) |
| 35 to 64 Years | 55 (6.9%) | 46 (5.5%) |
| 65 to 74 Years | 18 (6.9%) | 63 (25.8%) |
| 75 Years and over | 84 (51.2%) | 64 (31.8%) |
Disability Class: Self-Care Difficulty
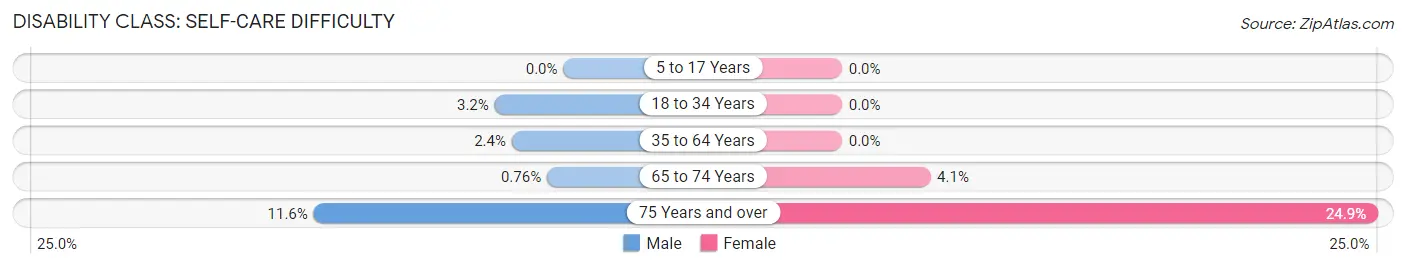
| Age Bracket | Male | Female |
| 5 to 17 Years | 0 (0.0%) | 0 (0.0%) |
| 18 to 34 Years | 13 (3.2%) | 0 (0.0%) |
| 35 to 64 Years | 19 (2.4%) | 0 (0.0%) |
| 65 to 74 Years | 2 (0.8%) | 10 (4.1%) |
| 75 Years and over | 19 (11.6%) | 50 (24.9%) |
Technology Access in Oneida County
Computing Device Access in Oneida County
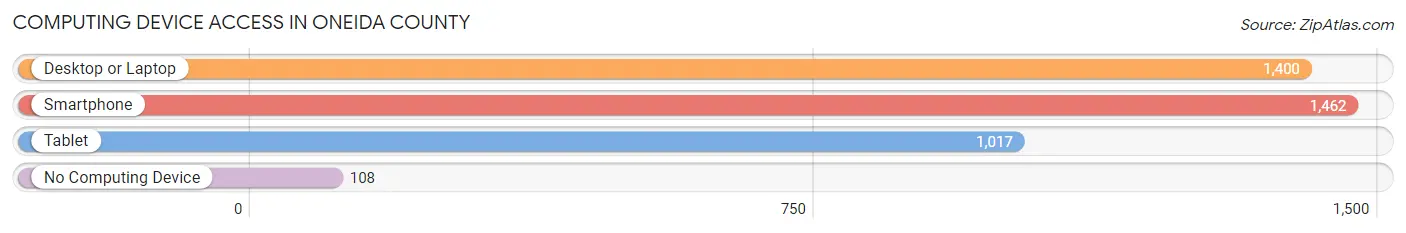
| Device Type | # Households | % Households |
| Desktop or Laptop | 1,400 | 76.0% |
| Smartphone | 1,462 | 79.4% |
| Tablet | 1,017 | 55.2% |
| No Computing Device | 108 | 5.9% |
| Total | 1,841 | 100.0% |
Internet Access in Oneida County
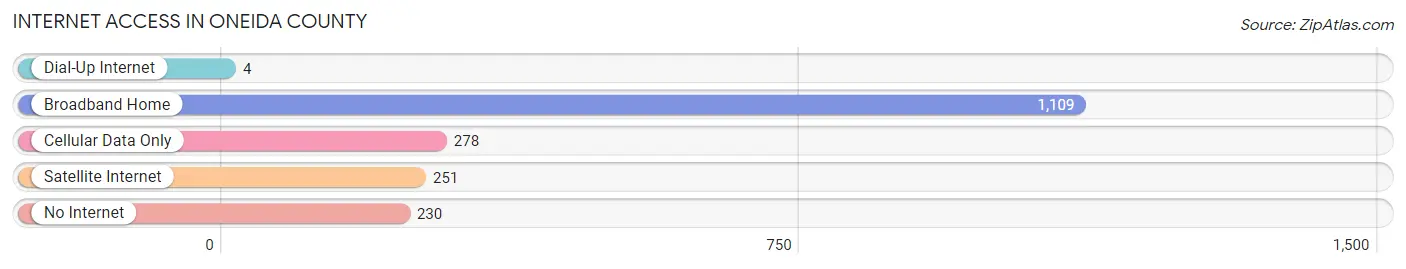
| Internet Type | # Households | % Households |
| Dial-Up Internet | 4 | 0.2% |
| Broadband Home | 1,109 | 60.2% |
| Cellular Data Only | 278 | 15.1% |
| Satellite Internet | 251 | 13.6% |
| No Internet | 230 | 12.5% |
| Total | 1,841 | 100.0% |
Oneida County Summary
Oneida County is located in the southeastern corner of Idaho, and is bordered by the states of Utah and Wyoming. It is the second-largest county in the state, with an area of 5,945 square miles. The county seat is Malad City, and the largest city is Preston. As of the 2010 census, the population was 4,286.
Oneida County was established in 1864, and was named after the Oneida tribe of Native Americans who lived in the area. The county was originally part of Bingham County, but was split off in 1864. The county was originally populated by Mormon settlers, and the county seat was originally located in Franklin. In 1872, the county seat was moved to Malad City.
The geography of Oneida County is mostly mountainous, with the Bear River Mountains to the north and the Raft River Mountains to the south. The county is home to several lakes, including Bear Lake, which is the largest natural freshwater lake in the state. The county is also home to several rivers, including the Bear River, which is the largest river in the county.
The economy of Oneida County is largely based on agriculture, with the main crops being potatoes, hay, and wheat. The county is also home to several small businesses, including a few restaurants, a few retail stores, and a few manufacturing companies.
The demographics of Oneida County are mostly white, with a small percentage of Native Americans, Hispanics, and African Americans. The median household income is $37,845, and the median home value is $117,400. The unemployment rate is 4.2%, and the poverty rate is 11.2%.
Oneida County is a rural county, and is home to several small towns and communities. The county is home to several parks and recreational areas, including Bear Lake State Park, which is a popular destination for camping, fishing, and boating. The county is also home to several historical sites, including the Oneida County Courthouse, which was built in 1872.
Oneida County is a great place to live, work, and play. It is a rural county with a strong agricultural base, and is home to several small towns and communities. The county is home to several parks and recreational areas, and is a great place to explore the outdoors. The county is also home to several historical sites, and is a great place to learn about the history of the area.
Common Questions
What is the Total Population of Oneida County?
Total Population of Oneida County is 4,572.
What is the Total Male Population of Oneida County?
Total Male Population of Oneida County is 2,315.
What is the Total Female Population of Oneida County?
Total Female Population of Oneida County is 2,257.
What is the Ratio of Males per 100 Females in Oneida County?
There are 102.57 Males per 100 Females in Oneida County.
What is the Ratio of Females per 100 Males in Oneida County?
There are 97.49 Females per 100 Males in Oneida County.
What is the Median Population Age in Oneida County?
Median Population Age in Oneida County is 39.7 Years.
What is the Average Family Size in Oneida County
Average Family Size in Oneida County is 3.1 People.
What is the Average Household Size in Oneida County
Average Household Size in Oneida County is 2.5 People.
What is Per Capita Income in Oneida County?
Per Capita income in Oneida County is $28,592.
What is the Median Family Income in Oneida County?
Median Family Income in Oneida County is $78,478.
What is the Median Household income in Oneida County?
Median Household Income in Oneida County is $67,383.
What is Income or Wage Gap in Oneida County?
Income or Wage Gap in Oneida County is 56.8%.
Women in Oneida County earn 43.2 cents for every dollar earned by a man.
What is Family Income Deficit in Oneida County?
Family Income Deficit in Oneida County is $12,930.
Families that are below poverty line in Oneida County earn $12,930 less on average than the poverty threshold level.
What is Inequality or Gini Index in Oneida County?
Inequality or Gini Index in Oneida County is 0.41.
How Large is the Labor Force in Oneida County?
There are 2,159 People in the Labor Forcein in Oneida County.
What is the Percentage of People in the Labor Force in Oneida County?
62.1% of People are in the Labor Force in Oneida County.
What is the Unemployment Rate in Oneida County?
Unemployment Rate in Oneida County is 0.7%.