Nez Perce County, ID
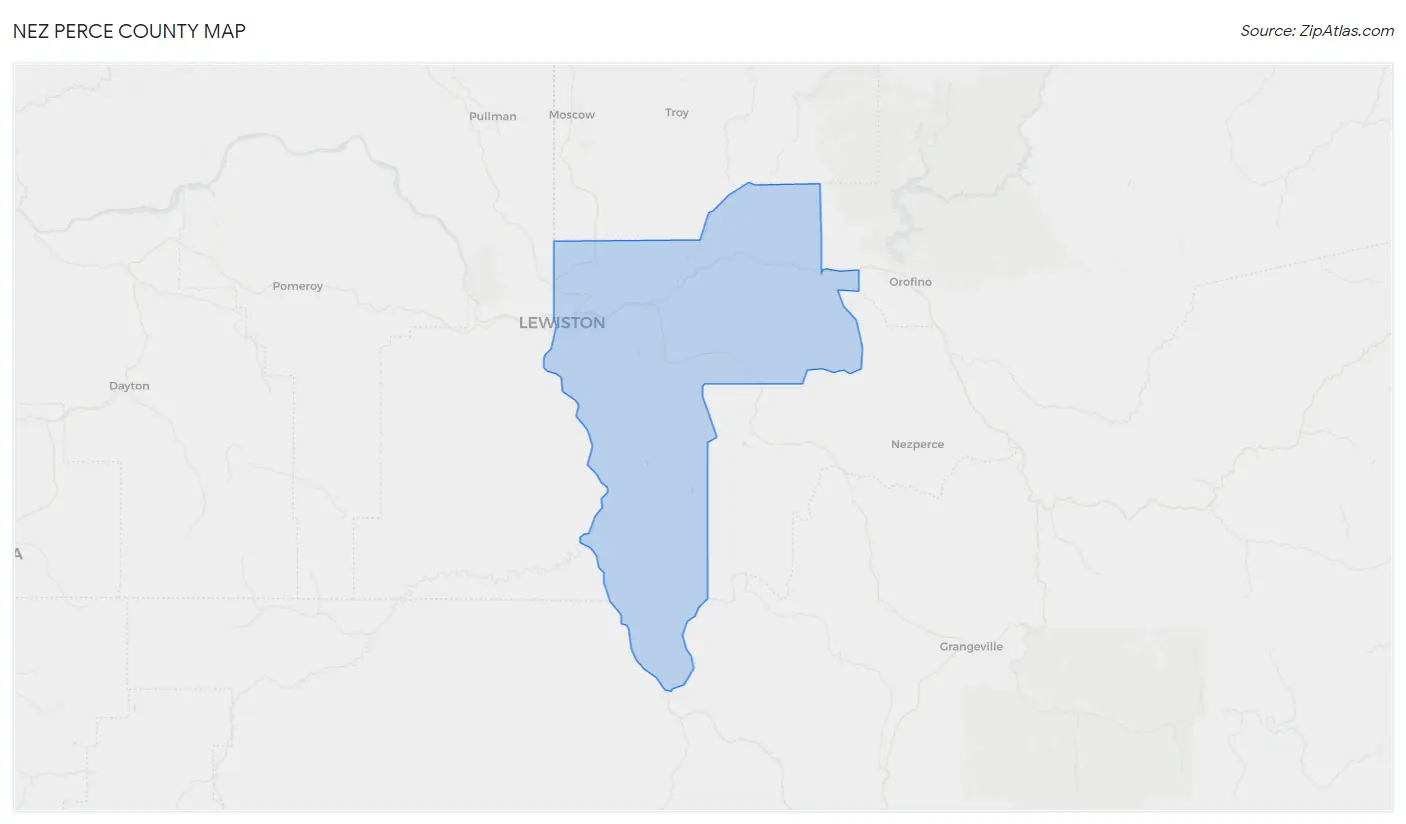
Nez Perce County Map
Nez Perce County Overview
42,200
TOTAL POPULATION
21,000
MALE POPULATION
21,200
FEMALE POPULATION
99.06
MALES / 100 FEMALES
100.95
FEMALES / 100 MALES
40.7
MEDIAN AGE
2.9
AVG FAMILY SIZE
2.4
AVG HOUSEHOLD SIZE
$35,387
PER CAPITA INCOME
$88,522
AVG FAMILY INCOME
$65,023
AVG HOUSEHOLD INCOME
30.4%
WAGE / INCOME GAP [ % ]
69.6¢/ $1
WAGE / INCOME GAP [ $ ]
$11,598
FAMILY INCOME DEFICIT
0.46
INEQUALITY / GINI INDEX
20,570
LABOR FORCE [ PEOPLE ]
60.3%
PERCENT IN LABOR FORCE
3.2%
UNEMPLOYMENT RATE
Nez Perce County Area Codes
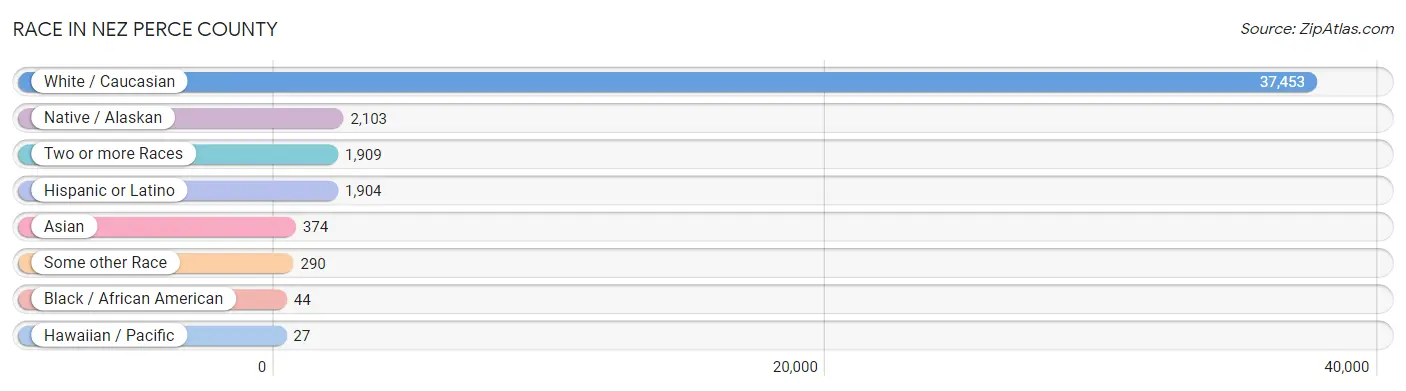
Race in Nez Perce County
The most populous races in Nez Perce County are White / Caucasian (37,453 | 88.7%), Native / Alaskan (2,103 | 5.0%), and Two or more Races (1,909 | 4.5%).
| Race | # Population | % Population |
| Asian | 374 | 0.9% |
| Black / African American | 44 | 0.1% |
| Hawaiian / Pacific | 27 | 0.1% |
| Hispanic or Latino | 1,904 | 4.5% |
| Native / Alaskan | 2,103 | 5.0% |
| White / Caucasian | 37,453 | 88.7% |
| Two or more Races | 1,909 | 4.5% |
| Some other Race | 290 | 0.7% |
| Total | 42,200 | 100.0% |
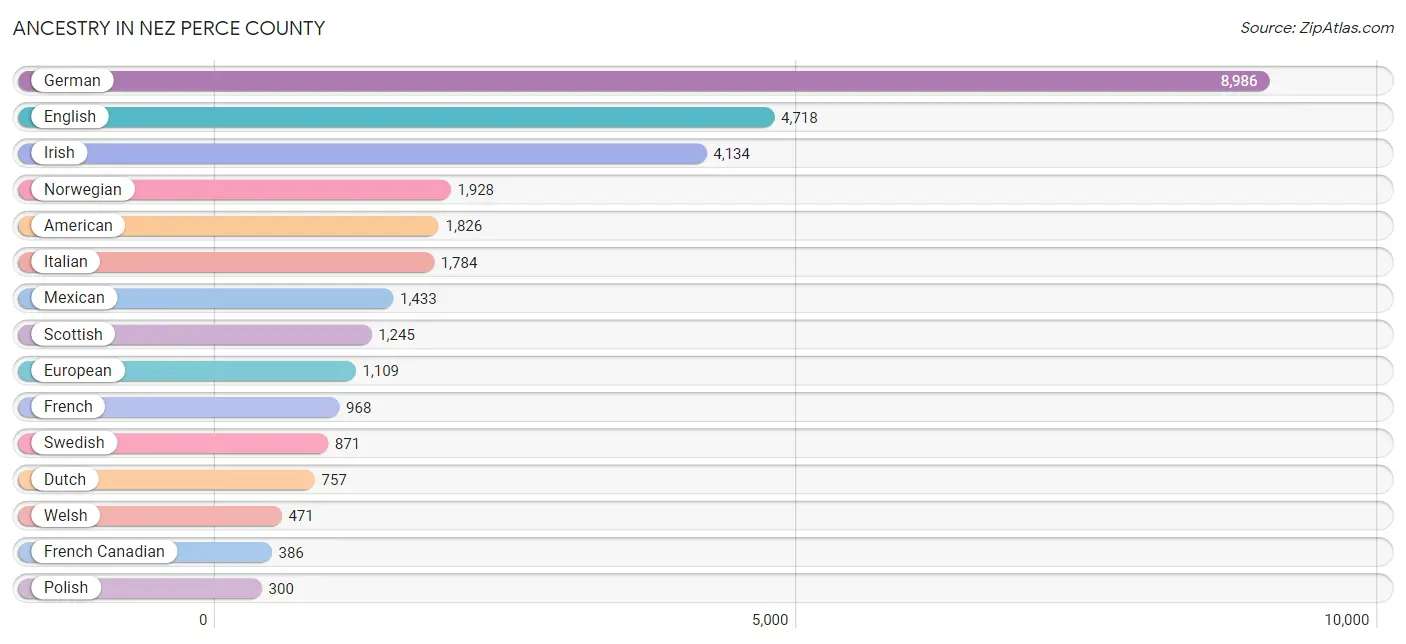
Ancestry in Nez Perce County
The most populous ancestries reported in Nez Perce County are German (8,986 | 21.3%), English (4,718 | 11.2%), Irish (4,134 | 9.8%), Norwegian (1,928 | 4.6%), and American (1,826 | 4.3%), together accounting for 51.2% of all Nez Perce County residents.
| Ancestry | # Population | % Population |
| Afghan | 12 | 0.0% |
| Albanian | 12 | 0.0% |
| American | 1,826 | 4.3% |
| Apache | 5 | 0.0% |
| Arab | 50 | 0.1% |
| Australian | 9 | 0.0% |
| Austrian | 46 | 0.1% |
| Basque | 35 | 0.1% |
| Belgian | 133 | 0.3% |
| Bhutanese | 17 | 0.0% |
| Blackfeet | 18 | 0.0% |
| British | 194 | 0.5% |
| Burmese | 36 | 0.1% |
| Canadian | 258 | 0.6% |
| Celtic | 2 | 0.0% |
| Central American | 114 | 0.3% |
| Cherokee | 241 | 0.6% |
| Cheyenne | 1 | 0.0% |
| Chippewa | 44 | 0.1% |
| Choctaw | 14 | 0.0% |
| Colville | 53 | 0.1% |
| Comanche | 3 | 0.0% |
| Costa Rican | 4 | 0.0% |
| Cree | 6 | 0.0% |
| Creek | 10 | 0.0% |
| Croatian | 16 | 0.0% |
| Crow | 10 | 0.0% |
| Cuban | 22 | 0.1% |
| Czech | 105 | 0.3% |
| Czechoslovakian | 15 | 0.0% |
| Danish | 224 | 0.5% |
| Dominican | 16 | 0.0% |
| Dutch | 757 | 1.8% |
| Eastern European | 11 | 0.0% |
| Egyptian | 40 | 0.1% |
| English | 4,718 | 11.2% |
| European | 1,109 | 2.6% |
| Finnish | 183 | 0.4% |
| French | 968 | 2.3% |
| French American Indian | 23 | 0.1% |
| French Canadian | 386 | 0.9% |
| German | 8,986 | 21.3% |
| Greek | 252 | 0.6% |
| Guatemalan | 72 | 0.2% |
| Honduran | 38 | 0.1% |
| Hungarian | 166 | 0.4% |
| Indian (Asian) | 55 | 0.1% |
| Inupiat | 27 | 0.1% |
| Iranian | 40 | 0.1% |
| Irish | 4,134 | 9.8% |
| Iroquois | 31 | 0.1% |
| Italian | 1,784 | 4.2% |
| Kiowa | 5 | 0.0% |
| Korean | 210 | 0.5% |
| Lebanese | 10 | 0.0% |
| Lithuanian | 23 | 0.1% |
| Luxembourger | 2 | 0.0% |
| Macedonian | 55 | 0.1% |
| Mexican | 1,433 | 3.4% |
| Native Hawaiian | 35 | 0.1% |
| Navajo | 10 | 0.0% |
| Northern European | 59 | 0.1% |
| Norwegian | 1,928 | 4.6% |
| Paiute | 4 | 0.0% |
| Pennsylvania German | 19 | 0.1% |
| Polish | 300 | 0.7% |
| Portuguese | 30 | 0.1% |
| Puerto Rican | 119 | 0.3% |
| Puget Sound Salish | 14 | 0.0% |
| Romanian | 42 | 0.1% |
| Russian | 101 | 0.2% |
| Samoan | 27 | 0.1% |
| Scandinavian | 250 | 0.6% |
| Scotch-Irish | 219 | 0.5% |
| Scottish | 1,245 | 2.9% |
| Seminole | 4 | 0.0% |
| Shoshone | 3 | 0.0% |
| Sioux | 45 | 0.1% |
| Slovak | 6 | 0.0% |
| Slovene | 18 | 0.0% |
| South American | 31 | 0.1% |
| Spaniard | 80 | 0.2% |
| Spanish | 76 | 0.2% |
| Spanish American Indian | 2 | 0.0% |
| Sri Lankan | 32 | 0.1% |
| Swedish | 871 | 2.1% |
| Swiss | 135 | 0.3% |
| Thai | 129 | 0.3% |
| Tlingit-Haida | 25 | 0.1% |
| Tongan | 32 | 0.1% |
| Ukrainian | 12 | 0.0% |
| Venezuelan | 31 | 0.1% |
| Welsh | 471 | 1.1% |
| Yakama | 116 | 0.3% |
| Yugoslavian | 17 | 0.0% | View All 95 Rows |
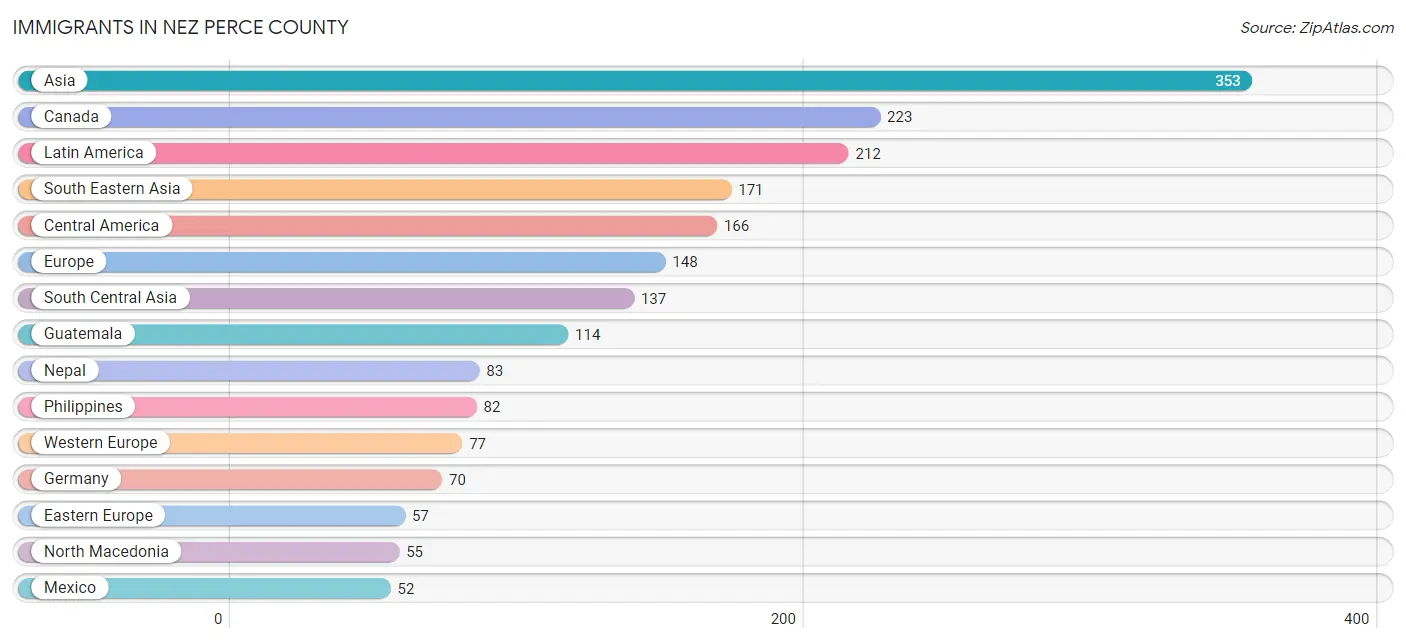
Immigrants in Nez Perce County
The most numerous immigrant groups reported in Nez Perce County came from Asia (353 | 0.8%), Canada (223 | 0.5%), Latin America (212 | 0.5%), South Eastern Asia (171 | 0.4%), and Central America (166 | 0.4%), together accounting for 2.7% of all Nez Perce County residents.
| Immigration Origin | # Population | % Population |
| Afghanistan | 12 | 0.0% |
| Africa | 14 | 0.0% |
| Asia | 353 | 0.8% |
| Canada | 223 | 0.5% |
| Caribbean | 15 | 0.0% |
| Central America | 166 | 0.4% |
| China | 5 | 0.0% |
| Cuba | 15 | 0.0% |
| Czechoslovakia | 2 | 0.0% |
| Eastern Asia | 45 | 0.1% |
| Eastern Europe | 57 | 0.1% |
| England | 4 | 0.0% |
| Europe | 148 | 0.4% |
| Germany | 70 | 0.2% |
| Guatemala | 114 | 0.3% |
| Indonesia | 3 | 0.0% |
| Kazakhstan | 42 | 0.1% |
| Korea | 40 | 0.1% |
| Latin America | 212 | 0.5% |
| Malaysia | 23 | 0.1% |
| Mexico | 52 | 0.1% |
| Nepal | 83 | 0.2% |
| Netherlands | 2 | 0.0% |
| North Macedonia | 55 | 0.1% |
| Northern Europe | 14 | 0.0% |
| Oceania | 20 | 0.1% |
| Philippines | 82 | 0.2% |
| Scotland | 2 | 0.0% |
| South Africa | 14 | 0.0% |
| South America | 31 | 0.1% |
| South Central Asia | 137 | 0.3% |
| South Eastern Asia | 171 | 0.4% |
| Switzerland | 5 | 0.0% |
| Thailand | 50 | 0.1% |
| Venezuela | 31 | 0.1% |
| Vietnam | 13 | 0.0% |
| Western Europe | 77 | 0.2% | View All 37 Rows |
Sex and Age in Nez Perce County
Sex and Age in Nez Perce County
The most populous age groups in Nez Perce County are 55 to 59 Years (1,512 | 7.2%) for men and 55 to 59 Years (1,465 | 6.9%) for women.

| Age Bracket | Male | Female |
| Under 5 Years | 1,048 (5.0%) | 1,250 (5.9%) |
| 5 to 9 Years | 1,438 (6.9%) | 1,289 (6.1%) |
| 10 to 14 Years | 1,230 (5.9%) | 1,171 (5.5%) |
| 15 to 19 Years | 1,499 (7.1%) | 1,243 (5.9%) |
| 20 to 24 Years | 1,302 (6.2%) | 1,245 (5.9%) |
| 25 to 29 Years | 1,300 (6.2%) | 1,240 (5.9%) |
| 30 to 34 Years | 1,340 (6.4%) | 1,408 (6.6%) |
| 35 to 39 Years | 1,510 (7.2%) | 1,303 (6.1%) |
| 40 to 44 Years | 1,078 (5.1%) | 1,083 (5.1%) |
| 45 to 49 Years | 1,215 (5.8%) | 1,181 (5.6%) |
| 50 to 54 Years | 1,260 (6.0%) | 1,284 (6.1%) |
| 55 to 59 Years | 1,512 (7.2%) | 1,465 (6.9%) |
| 60 to 64 Years | 1,333 (6.4%) | 1,405 (6.6%) |
| 65 to 69 Years | 1,432 (6.8%) | 1,360 (6.4%) |
| 70 to 74 Years | 925 (4.4%) | 1,065 (5.0%) |
| 75 to 79 Years | 783 (3.7%) | 816 (3.8%) |
| 80 to 84 Years | 461 (2.2%) | 506 (2.4%) |
| 85 Years and over | 334 (1.6%) | 886 (4.2%) |
| Total | 21,000 (100.0%) | 21,200 (100.0%) |
Families and Households in Nez Perce County
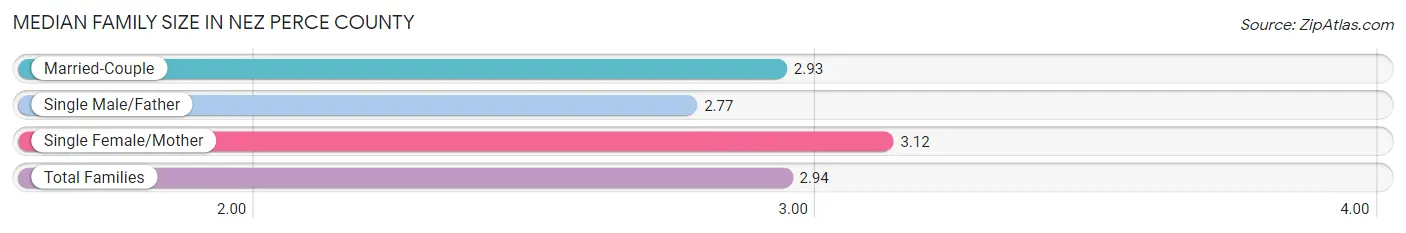
Median Family Size in Nez Perce County
The median family size in Nez Perce County is 2.94 persons per family, with single female/mother families (1,526 | 14.3%) accounting for the largest median family size of 3.12 persons per family. On the other hand, single male/father families (1,088 | 10.2%) represent the smallest median family size with 2.77 persons per family.
| Family Type | # Families | Family Size |
| Married-Couple | 8,042 (75.5%) | 2.93 |
| Single Male/Father | 1,088 (10.2%) | 2.77 |
| Single Female/Mother | 1,526 (14.3%) | 3.12 |
| Total Families | 10,656 (100.0%) | 2.94 |
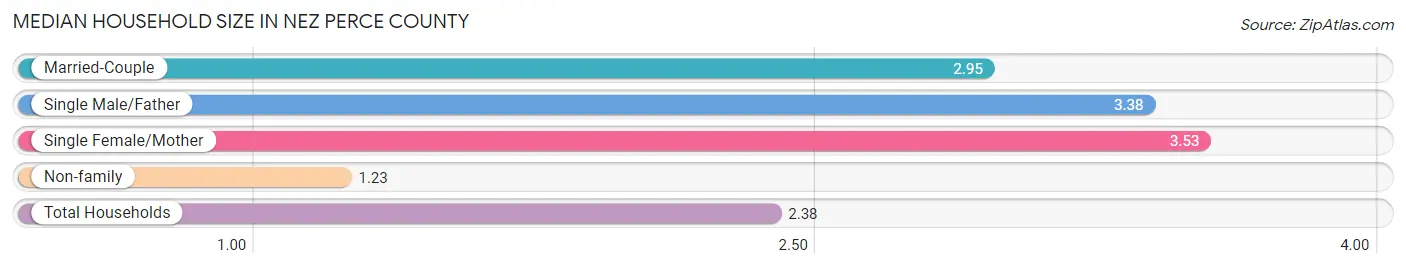
Median Household Size in Nez Perce County
The median household size in Nez Perce County is 2.38 persons per household, with single female/mother households (1,526 | 8.9%) accounting for the largest median household size of 3.53 persons per household. non-family households (6,468 | 37.8%) represent the smallest median household size with 1.23 persons per household.
| Household Type | # Households | Household Size |
| Married-Couple | 8,042 (47.0%) | 2.95 |
| Single Male/Father | 1,088 (6.4%) | 3.38 |
| Single Female/Mother | 1,526 (8.9%) | 3.53 |
| Non-family | 6,468 (37.8%) | 1.23 |
| Total Households | 17,124 (100.0%) | 2.38 |
Household Size by Marriage Status in Nez Perce County
Out of a total of 17,124 households in Nez Perce County, 10,656 (62.2%) are family households, while 6,468 (37.8%) are nonfamily households. The most numerous type of family households are 2-person households, comprising 4,978, and the most common type of nonfamily households are 1-person households, comprising 5,435.

| Household Size | Family Households | Nonfamily Households |
| 1-Person Households | - | 5,435 (31.7%) |
| 2-Person Households | 4,978 (29.1%) | 796 (4.6%) |
| 3-Person Households | 2,179 (12.7%) | 158 (0.9%) |
| 4-Person Households | 2,165 (12.6%) | 40 (0.2%) |
| 5-Person Households | 885 (5.2%) | 39 (0.2%) |
| 6-Person Households | 211 (1.2%) | 0 (0.0%) |
| 7+ Person Households | 238 (1.4%) | 0 (0.0%) |
| Total | 10,656 (62.2%) | 6,468 (37.8%) |
Female Fertility in Nez Perce County
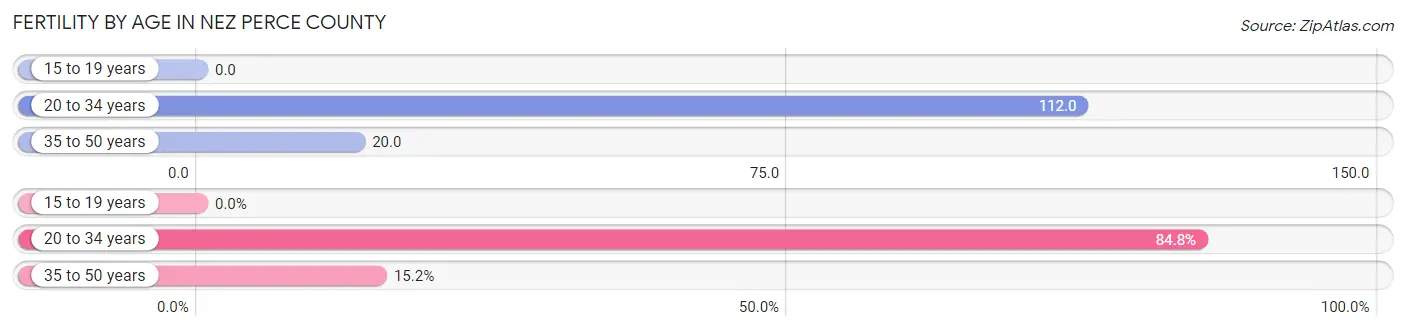
Fertility by Age in Nez Perce County
Average fertility rate in Nez Perce County is 57.0 births per 1,000 women. Women in the age bracket of 20 to 34 years have the highest fertility rate with 112.0 births per 1,000 women. Women in the age bracket of 20 to 34 years acount for 84.8% of all women with births.
| Age Bracket | Women with Births | Births / 1,000 Women |
| 15 to 19 years | 0 (0.0%) | 0.0 |
| 20 to 34 years | 436 (84.8%) | 112.0 |
| 35 to 50 years | 78 (15.2%) | 20.0 |
| Total | 514 (100.0%) | 57.0 |
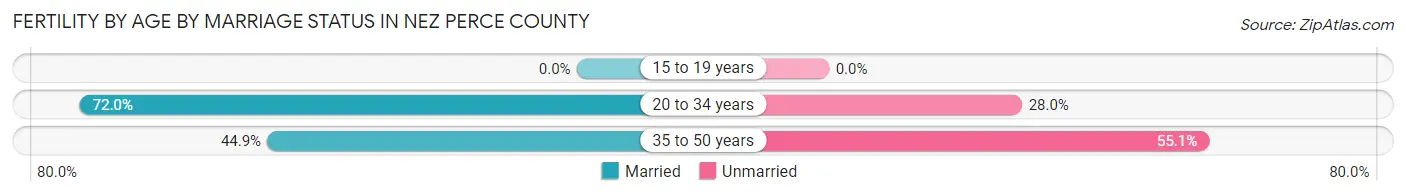
Fertility by Age by Marriage Status in Nez Perce County
67.9% of women with births (514) in Nez Perce County are married. The highest percentage of unmarried women with births falls into 35 to 50 years age bracket with 55.1% of them unmarried at the time of birth, while the lowest percentage of unmarried women with births belong to 20 to 34 years age bracket with 28.0% of them unmarried.
| Age Bracket | Married | Unmarried |
| 15 to 19 years | 0 (0.0%) | 0 (0.0%) |
| 20 to 34 years | 314 (72.0%) | 122 (28.0%) |
| 35 to 50 years | 35 (44.9%) | 43 (55.1%) |
| Total | 349 (67.9%) | 165 (32.1%) |
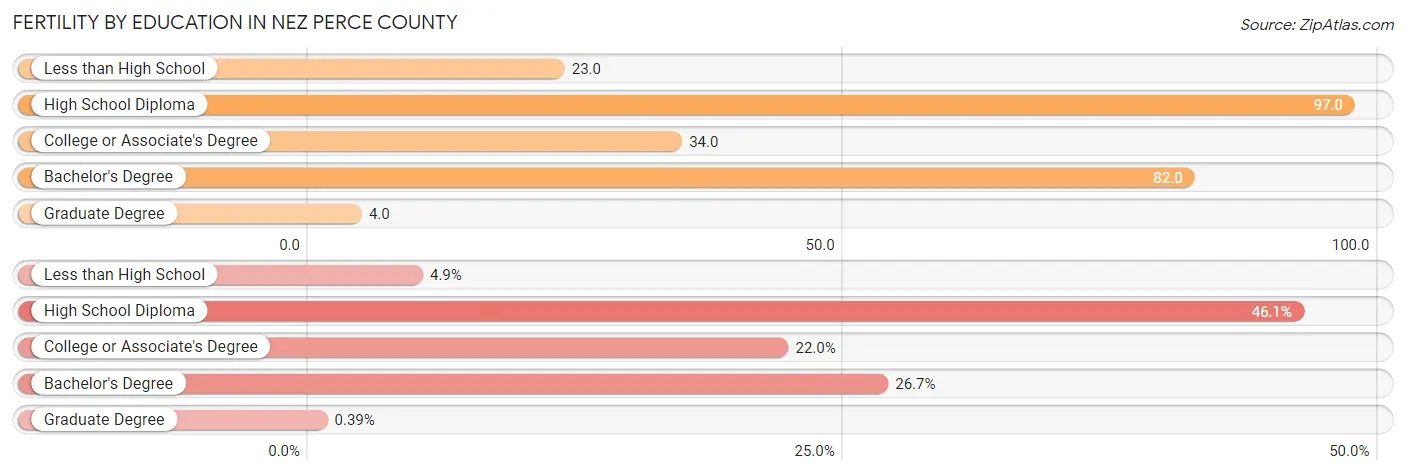
Fertility by Education in Nez Perce County
Average fertility rate in Nez Perce County is 57.0 births per 1,000 women. Women with the education attainment of high school diploma have the highest fertility rate of 97.0 births per 1,000 women, while women with the education attainment of graduate degree have the lowest fertility at 4.0 births per 1,000 women. Women with the education attainment of high school diploma represent 46.1% of all women with births.
| Educational Attainment | Women with Births | Births / 1,000 Women |
| Less than High School | 25 (4.9%) | 23.0 |
| High School Diploma | 237 (46.1%) | 97.0 |
| College or Associate's Degree | 113 (22.0%) | 34.0 |
| Bachelor's Degree | 137 (26.7%) | 82.0 |
| Graduate Degree | 2 (0.4%) | 4.0 |
| Total | 514 (100.0%) | 57.0 |
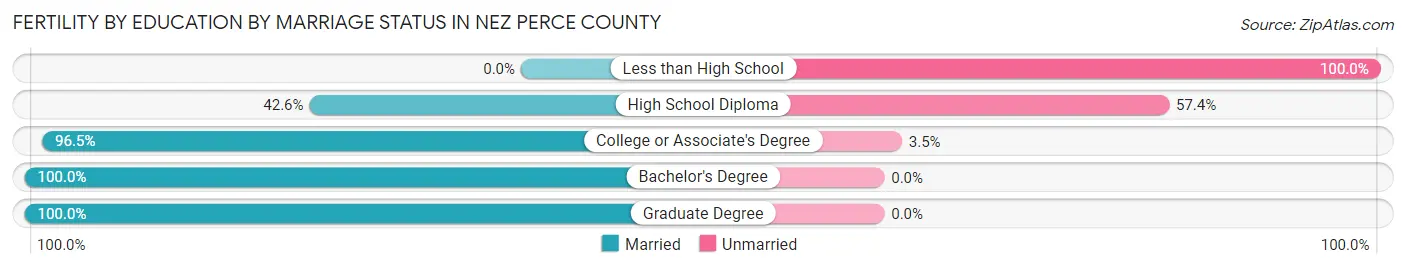
Fertility by Education by Marriage Status in Nez Perce County
32.1% of women with births in Nez Perce County are unmarried. Women with the educational attainment of bachelor's degree are most likely to be married with 100.0% of them married at childbirth, while women with the educational attainment of less than high school are least likely to be married with 100.0% of them unmarried at childbirth.
| Educational Attainment | Married | Unmarried |
| Less than High School | 0 (0.0%) | 25 (100.0%) |
| High School Diploma | 101 (42.6%) | 136 (57.4%) |
| College or Associate's Degree | 109 (96.5%) | 4 (3.5%) |
| Bachelor's Degree | 137 (100.0%) | 0 (0.0%) |
| Graduate Degree | 2 (100.0%) | 0 (0.0%) |
| Total | 349 (67.9%) | 165 (32.1%) |
Income in Nez Perce County
Income Overview in Nez Perce County
Per Capita Income in Nez Perce County is $35,387, while median incomes of families and households are $88,522 and $65,023 respectively.
| Characteristic | Number | Measure |
| Per Capita Income | 42,200 | $35,387 |
| Median Family Income | 10,656 | $88,522 |
| Mean Family Income | 10,656 | $102,518 |
| Median Household Income | 17,124 | $65,023 |
| Mean Household Income | 17,124 | $84,952 |
| Income Deficit | 10,656 | $11,598 |
| Wage / Income Gap (%) | 42,200 | 30.40% |
| Wage / Income Gap ($) | 42,200 | 69.60¢ per $1 |
| Gini / Inequality Index | 42,200 | 0.46 |
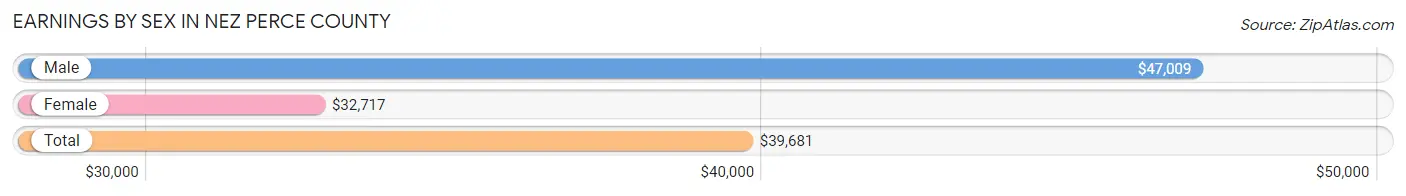
Earnings by Sex in Nez Perce County
Average Earnings in Nez Perce County are $39,681, $47,009 for men and $32,717 for women, a difference of 30.4%.
| Sex | Number | Average Earnings |
| Male | 11,787 (52.8%) | $47,009 |
| Female | 10,519 (47.2%) | $32,717 |
| Total | 22,306 (100.0%) | $39,681 |
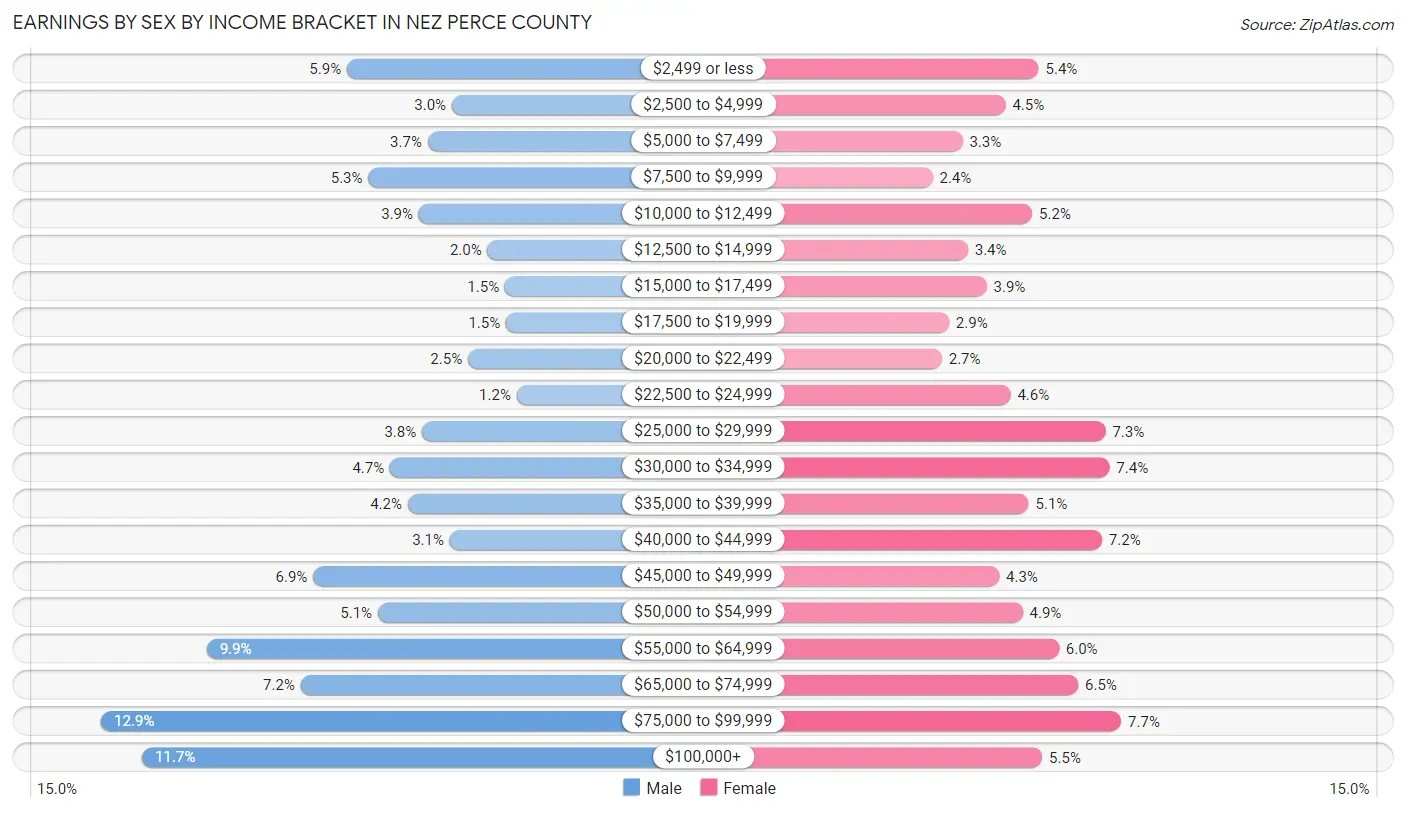
Earnings by Sex by Income Bracket in Nez Perce County
The most common earnings brackets in Nez Perce County are $75,000 to $99,999 for men (1,515 | 12.9%) and $75,000 to $99,999 for women (811 | 7.7%).
| Income | Male | Female |
| $2,499 or less | 700 (5.9%) | 567 (5.4%) |
| $2,500 to $4,999 | 353 (3.0%) | 469 (4.5%) |
| $5,000 to $7,499 | 432 (3.7%) | 342 (3.3%) |
| $7,500 to $9,999 | 629 (5.3%) | 254 (2.4%) |
| $10,000 to $12,499 | 462 (3.9%) | 548 (5.2%) |
| $12,500 to $14,999 | 235 (2.0%) | 358 (3.4%) |
| $15,000 to $17,499 | 177 (1.5%) | 413 (3.9%) |
| $17,500 to $19,999 | 173 (1.5%) | 302 (2.9%) |
| $20,000 to $22,499 | 299 (2.5%) | 281 (2.7%) |
| $22,500 to $24,999 | 138 (1.2%) | 484 (4.6%) |
| $25,000 to $29,999 | 452 (3.8%) | 765 (7.3%) |
| $30,000 to $34,999 | 557 (4.7%) | 776 (7.4%) |
| $35,000 to $39,999 | 499 (4.2%) | 537 (5.1%) |
| $40,000 to $44,999 | 360 (3.0%) | 754 (7.2%) |
| $45,000 to $49,999 | 812 (6.9%) | 450 (4.3%) |
| $50,000 to $54,999 | 598 (5.1%) | 520 (4.9%) |
| $55,000 to $64,999 | 1,164 (9.9%) | 627 (6.0%) |
| $65,000 to $74,999 | 853 (7.2%) | 684 (6.5%) |
| $75,000 to $99,999 | 1,515 (12.9%) | 811 (7.7%) |
| $100,000+ | 1,379 (11.7%) | 577 (5.5%) |
| Total | 11,787 (100.0%) | 10,519 (100.0%) |
Earnings by Sex by Educational Attainment in Nez Perce County
Average earnings in Nez Perce County are $52,673 for men and $38,535 for women, a difference of 26.8%. Men with an educational attainment of graduate degree enjoy the highest average annual earnings of $74,118, while those with less than high school education earn the least with $21,840. Women with an educational attainment of graduate degree earn the most with the average annual earnings of $67,278, while those with less than high school education have the smallest earnings of $26,083.

| Educational Attainment | Male Income | Female Income |
| Less than High School | $21,840 | $26,083 |
| High School Diploma | $46,981 | $30,724 |
| College or Associate's Degree | $53,083 | $33,750 |
| Bachelor's Degree | $57,260 | $49,104 |
| Graduate Degree | $74,118 | $67,278 |
| Total | $52,673 | $38,535 |
Family Income in Nez Perce County
Family Income Brackets in Nez Perce County
According to the Nez Perce County family income data, there are 2,611 families falling into the $100,000 to $149,999 income range, which is the most common income bracket and makes up 24.5% of all families. Conversely, the $10,000 to $14,999 income bracket is the least frequent group with only 139 families (1.3%) belonging to this category.

| Income Bracket | # Families | % Families |
| Less than $10,000 | 426 | 4.0% |
| $10,000 to $14,999 | 139 | 1.3% |
| $15,000 to $24,999 | 511 | 4.8% |
| $25,000 to $34,999 | 948 | 8.9% |
| $35,000 to $49,999 | 789 | 7.4% |
| $50,000 to $74,999 | 1,534 | 14.4% |
| $75,000 to $99,999 | 1,886 | 17.7% |
| $100,000 to $149,999 | 2,611 | 24.5% |
| $150,000 to $199,999 | 1,119 | 10.5% |
| $200,000+ | 703 | 6.6% |
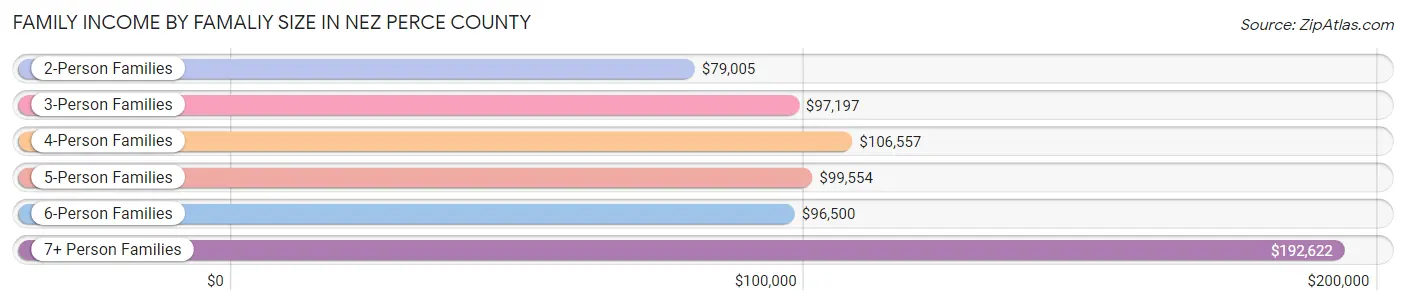
Family Income by Famaliy Size in Nez Perce County
7+ person families (151 | 1.4%) account for the highest median family income in Nez Perce County with $192,622 per family, while 2-person families (5,190 | 48.7%) have the highest median income of $39,502 per family member.
| Income Bracket | # Families | Median Income |
| 2-Person Families | 5,190 (48.7%) | $79,005 |
| 3-Person Families | 2,570 (24.1%) | $97,197 |
| 4-Person Families | 1,765 (16.6%) | $106,557 |
| 5-Person Families | 784 (7.4%) | $99,554 |
| 6-Person Families | 196 (1.8%) | $96,500 |
| 7+ Person Families | 151 (1.4%) | $192,622 |
| Total | 10,656 (100.0%) | $88,522 |
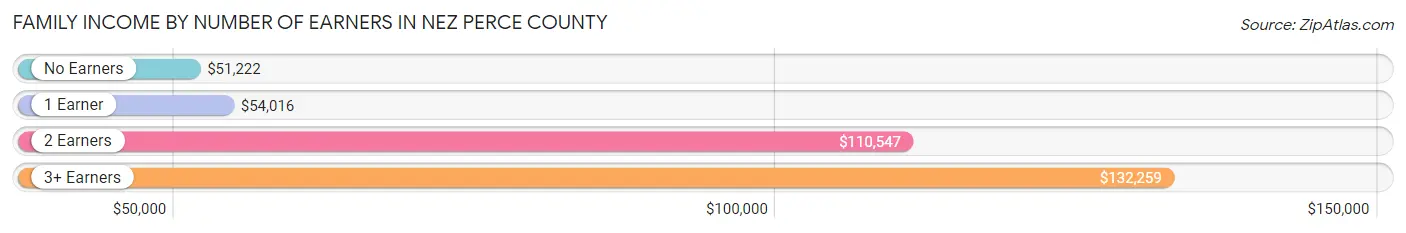
Family Income by Number of Earners in Nez Perce County
The median family income in Nez Perce County is $88,522, with families comprising 3+ earners (1,171) having the highest median family income of $132,259, while families with no earners (1,834) have the lowest median family income of $51,222, accounting for 11.0% and 17.2% of families, respectively.
| Number of Earners | # Families | Median Income |
| No Earners | 1,834 (17.2%) | $51,222 |
| 1 Earner | 3,296 (30.9%) | $54,016 |
| 2 Earners | 4,355 (40.9%) | $110,547 |
| 3+ Earners | 1,171 (11.0%) | $132,259 |
| Total | 10,656 (100.0%) | $88,522 |
Household Income in Nez Perce County
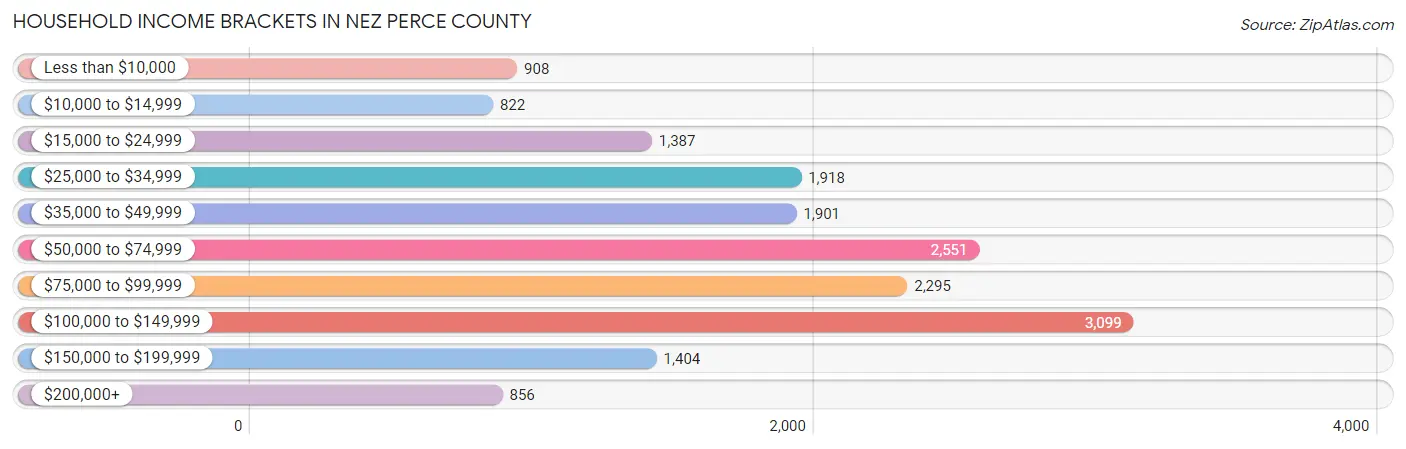
Household Income Brackets in Nez Perce County
With 3,099 households falling in the category, the $100,000 to $149,999 income range is the most frequent in Nez Perce County, accounting for 18.1% of all households. In contrast, only 822 households (4.8%) fall into the $10,000 to $14,999 income bracket, making it the least populous group.
| Income Bracket | # Households | % Households |
| Less than $10,000 | 908 | 5.3% |
| $10,000 to $14,999 | 822 | 4.8% |
| $15,000 to $24,999 | 1,387 | 8.1% |
| $25,000 to $34,999 | 1,918 | 11.2% |
| $35,000 to $49,999 | 1,901 | 11.1% |
| $50,000 to $74,999 | 2,551 | 14.9% |
| $75,000 to $99,999 | 2,295 | 13.4% |
| $100,000 to $149,999 | 3,099 | 18.1% |
| $150,000 to $199,999 | 1,404 | 8.2% |
| $200,000+ | 856 | 5.0% |
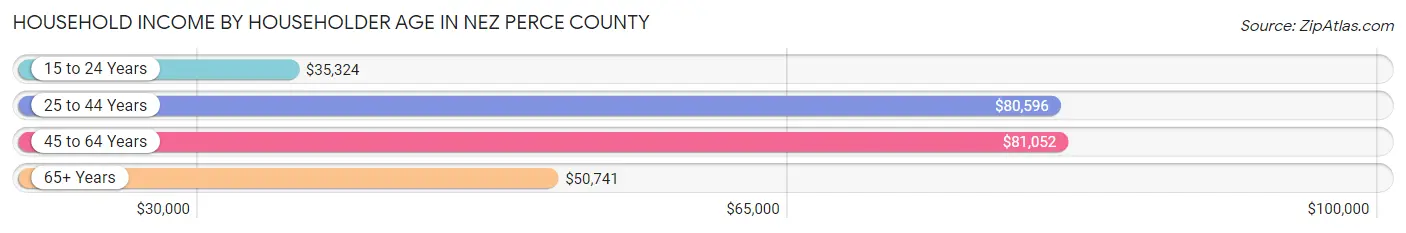
Household Income by Householder Age in Nez Perce County
The median household income in Nez Perce County is $65,023, with the highest median household income of $81,052 found in the 45 to 64 years age bracket for the primary householder. A total of 6,182 households (36.1%) fall into this category. Meanwhile, the 15 to 24 years age bracket for the primary householder has the lowest median household income of $35,324, with 797 households (4.6%) in this group.
| Income Bracket | # Households | Median Income |
| 15 to 24 Years | 797 (4.6%) | $35,324 |
| 25 to 44 Years | 4,757 (27.8%) | $80,596 |
| 45 to 64 Years | 6,182 (36.1%) | $81,052 |
| 65+ Years | 5,388 (31.5%) | $50,741 |
| Total | 17,124 (100.0%) | $65,023 |
Poverty in Nez Perce County
Income Below Poverty by Sex and Age in Nez Perce County
With 12.8% poverty level for males and 15.4% for females among the residents of Nez Perce County, under 5 year old males and 18 to 24 year old females are the most vulnerable to poverty, with 325 males (31.4%) and 404 females (29.2%) in their respective age groups living below the poverty level.
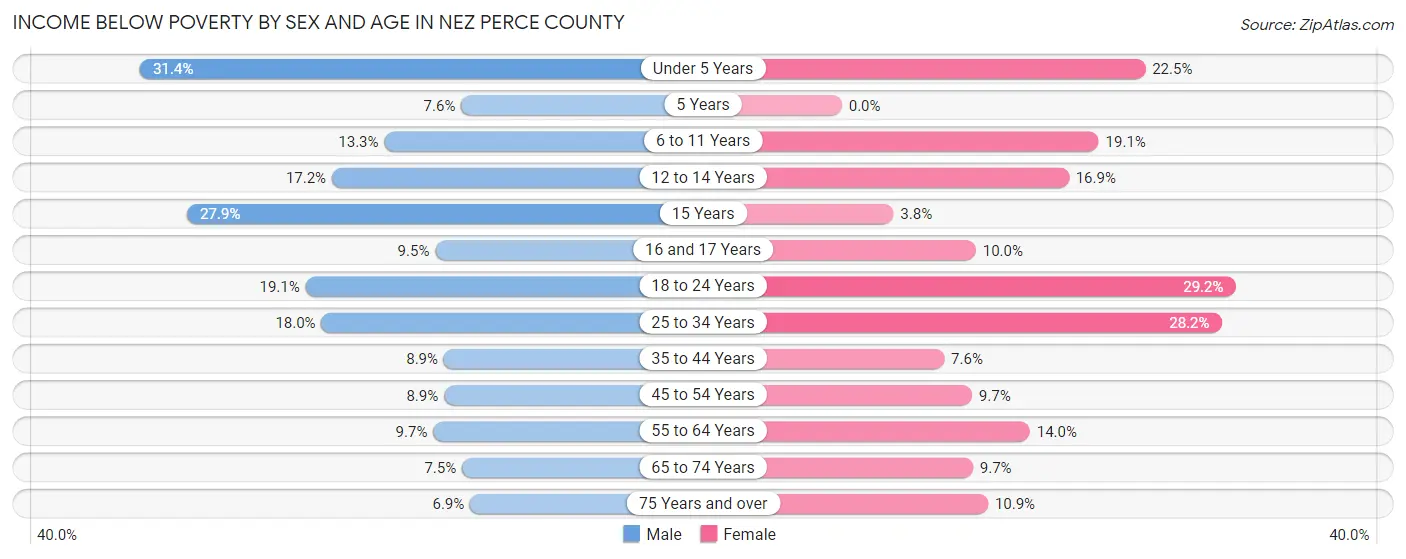
| Age Bracket | Male | Female |
| Under 5 Years | 325 (31.4%) | 280 (22.5%) |
| 5 Years | 21 (7.6%) | 0 (0.0%) |
| 6 to 11 Years | 190 (13.3%) | 287 (19.1%) |
| 12 to 14 Years | 139 (17.2%) | 123 (16.9%) |
| 15 Years | 95 (27.9%) | 12 (3.8%) |
| 16 and 17 Years | 43 (9.5%) | 38 (10.0%) |
| 18 to 24 Years | 332 (19.1%) | 404 (29.2%) |
| 25 to 34 Years | 469 (18.0%) | 745 (28.2%) |
| 35 to 44 Years | 228 (8.9%) | 181 (7.6%) |
| 45 to 54 Years | 217 (8.9%) | 238 (9.7%) |
| 55 to 64 Years | 270 (9.7%) | 399 (14.0%) |
| 65 to 74 Years | 176 (7.5%) | 214 (9.7%) |
| 75 Years and over | 102 (6.9%) | 221 (10.8%) |
| Total | 2,607 (12.8%) | 3,142 (15.4%) |
Income Above Poverty by Sex and Age in Nez Perce County
According to the poverty statistics in Nez Perce County, males aged 75 years and over and females aged 5 years are the age groups that are most secure financially, with 93.1% of males and 100.0% of females in these age groups living above the poverty line.
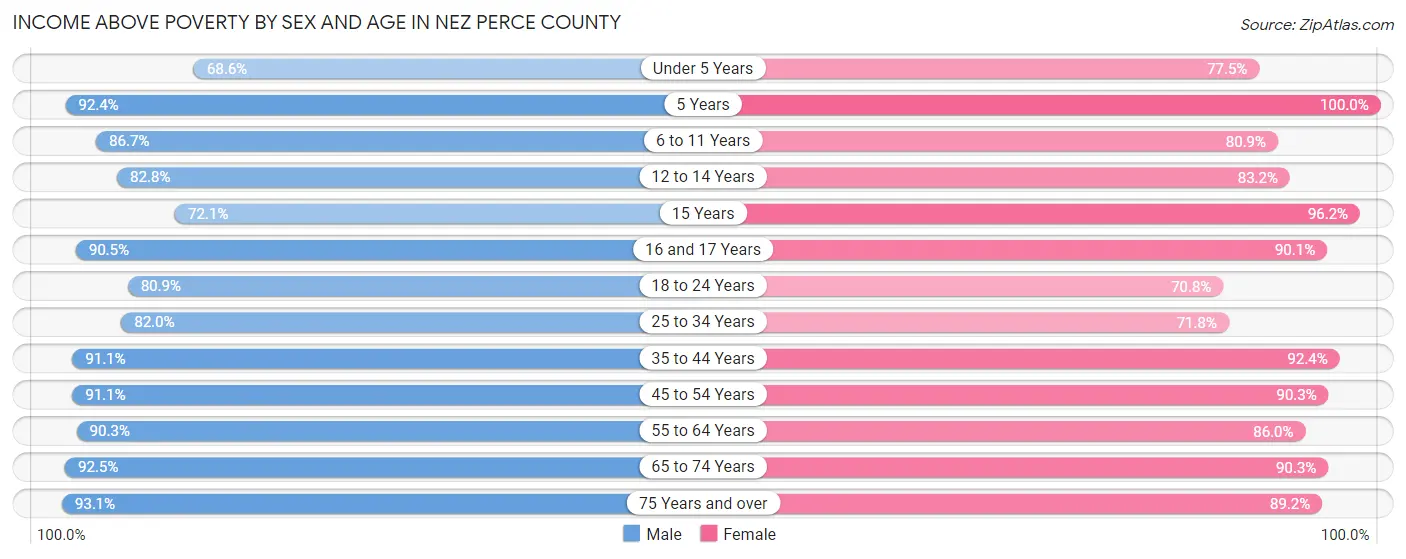
| Age Bracket | Male | Female |
| Under 5 Years | 709 (68.6%) | 963 (77.5%) |
| 5 Years | 256 (92.4%) | 200 (100.0%) |
| 6 to 11 Years | 1,240 (86.7%) | 1,218 (80.9%) |
| 12 to 14 Years | 670 (82.8%) | 607 (83.2%) |
| 15 Years | 245 (72.1%) | 301 (96.2%) |
| 16 and 17 Years | 409 (90.5%) | 344 (90.0%) |
| 18 to 24 Years | 1,403 (80.9%) | 979 (70.8%) |
| 25 to 34 Years | 2,142 (82.0%) | 1,899 (71.8%) |
| 35 to 44 Years | 2,342 (91.1%) | 2,202 (92.4%) |
| 45 to 54 Years | 2,231 (91.1%) | 2,227 (90.3%) |
| 55 to 64 Years | 2,524 (90.3%) | 2,459 (86.0%) |
| 65 to 74 Years | 2,165 (92.5%) | 1,985 (90.3%) |
| 75 Years and over | 1,373 (93.1%) | 1,815 (89.1%) |
| Total | 17,709 (87.2%) | 17,199 (84.6%) |
Income Below Poverty Among Married-Couple Families in Nez Perce County
The poverty statistics for married-couple families in Nez Perce County show that 6.0% or 483 of the total 8,042 families live below the poverty line. Families with 5 or more children have the highest poverty rate of 57.9%, comprising of 33 families. On the other hand, families with no children have the lowest poverty rate of 3.5%, which includes 172 families.
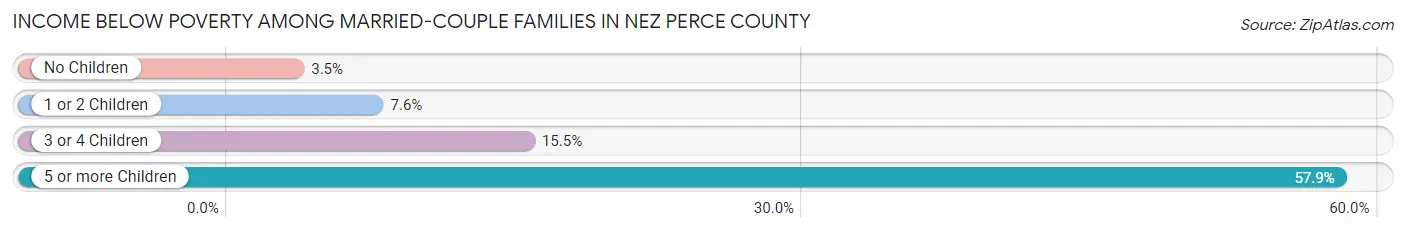
| Children | Above Poverty | Below Poverty |
| No Children | 4,800 (96.5%) | 172 (3.5%) |
| 1 or 2 Children | 2,212 (92.4%) | 182 (7.6%) |
| 3 or 4 Children | 523 (84.5%) | 96 (15.5%) |
| 5 or more Children | 24 (42.1%) | 33 (57.9%) |
| Total | 7,559 (94.0%) | 483 (6.0%) |
Income Below Poverty Among Single-Parent Households in Nez Perce County
According to the poverty data in Nez Perce County, 11.7% or 127 single-father households and 26.5% or 405 single-mother households are living below the poverty line. Among single-father households, those with 1 or 2 children have the highest poverty rate, with 107 households (14.4%) experiencing poverty. Likewise, among single-mother households, those with 1 or 2 children have the highest poverty rate, with 334 households (36.0%) falling below the poverty line.
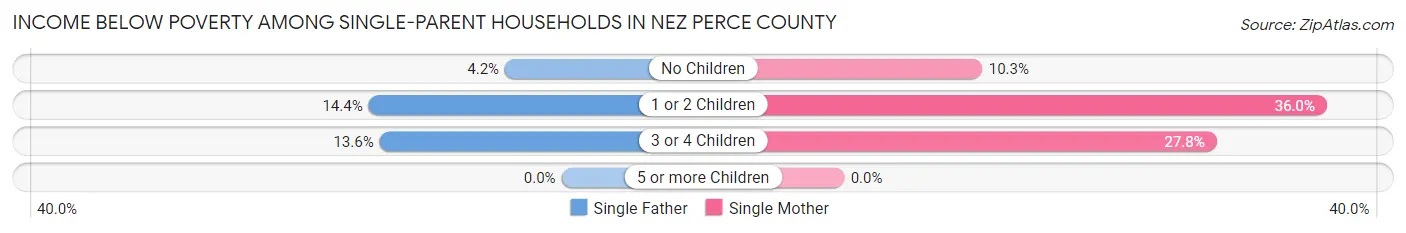
| Children | Single Father | Single Mother |
| No Children | 12 (4.2%) | 56 (10.3%) |
| 1 or 2 Children | 107 (14.4%) | 334 (36.0%) |
| 3 or 4 Children | 8 (13.6%) | 15 (27.8%) |
| 5 or more Children | 0 (0.0%) | 0 (0.0%) |
| Total | 127 (11.7%) | 405 (26.5%) |
Income Below Poverty Among Married-Couple vs Single-Parent Households in Nez Perce County
The poverty data for Nez Perce County shows that 483 of the married-couple family households (6.0%) and 532 of the single-parent households (20.3%) are living below the poverty level. Within the married-couple family households, those with 5 or more children have the highest poverty rate, with 33 households (57.9%) falling below the poverty line. Among the single-parent households, those with 1 or 2 children have the highest poverty rate, with 441 household (26.4%) living below poverty.
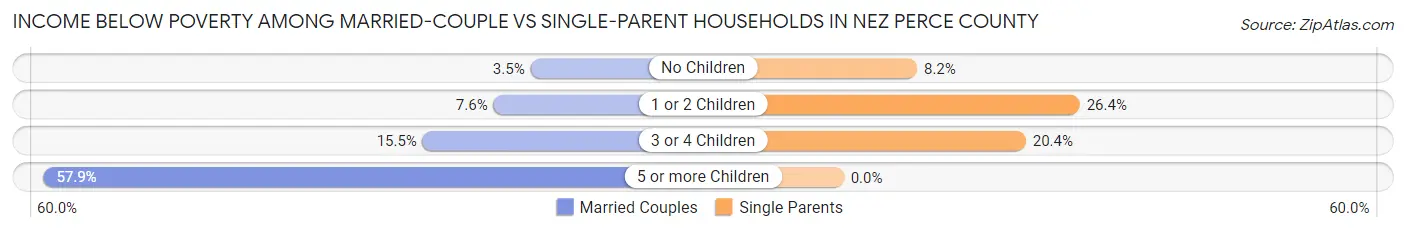
| Children | Married-Couple Families | Single-Parent Households |
| No Children | 172 (3.5%) | 68 (8.2%) |
| 1 or 2 Children | 182 (7.6%) | 441 (26.4%) |
| 3 or 4 Children | 96 (15.5%) | 23 (20.3%) |
| 5 or more Children | 33 (57.9%) | 0 (0.0%) |
| Total | 483 (6.0%) | 532 (20.3%) |
Employment Characteristics in Nez Perce County
Employment by Class of Employer in Nez Perce County
Among the 19,581 employed individuals in Nez Perce County, private company employees (12,598 | 64.3%), local government employees (2,045 | 10.4%), and state government employees (1,258 | 6.4%) make up the most common classes of employment.
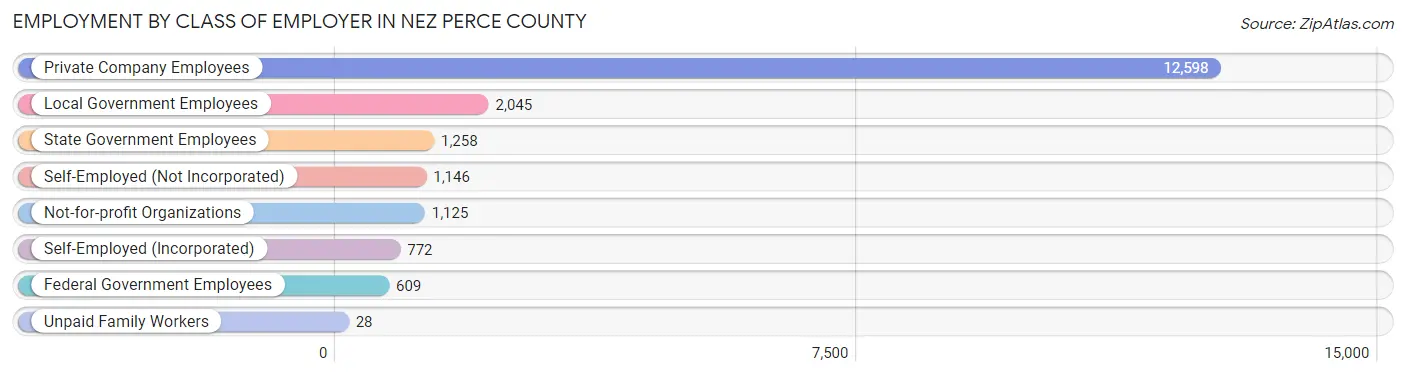
| Employer Class | # Employees | % Employees |
| Private Company Employees | 12,598 | 64.3% |
| Self-Employed (Incorporated) | 772 | 3.9% |
| Self-Employed (Not Incorporated) | 1,146 | 5.9% |
| Not-for-profit Organizations | 1,125 | 5.8% |
| Local Government Employees | 2,045 | 10.4% |
| State Government Employees | 1,258 | 6.4% |
| Federal Government Employees | 609 | 3.1% |
| Unpaid Family Workers | 28 | 0.1% |
| Total | 19,581 | 100.0% |
Employment Status by Age in Nez Perce County
According to the labor force statistics for Nez Perce County, out of the total population over 16 years of age (34,113), 60.3% or 20,570 individuals are in the labor force, with 3.2% or 658 of them unemployed. The age group with the highest labor force participation rate is 30 to 34 years, with 87.1% or 2,394 individuals in the labor force. Within the labor force, the 16 to 19 years age range has the highest percentage of unemployed individuals, with 11.9% or 126 of them being unemployed.
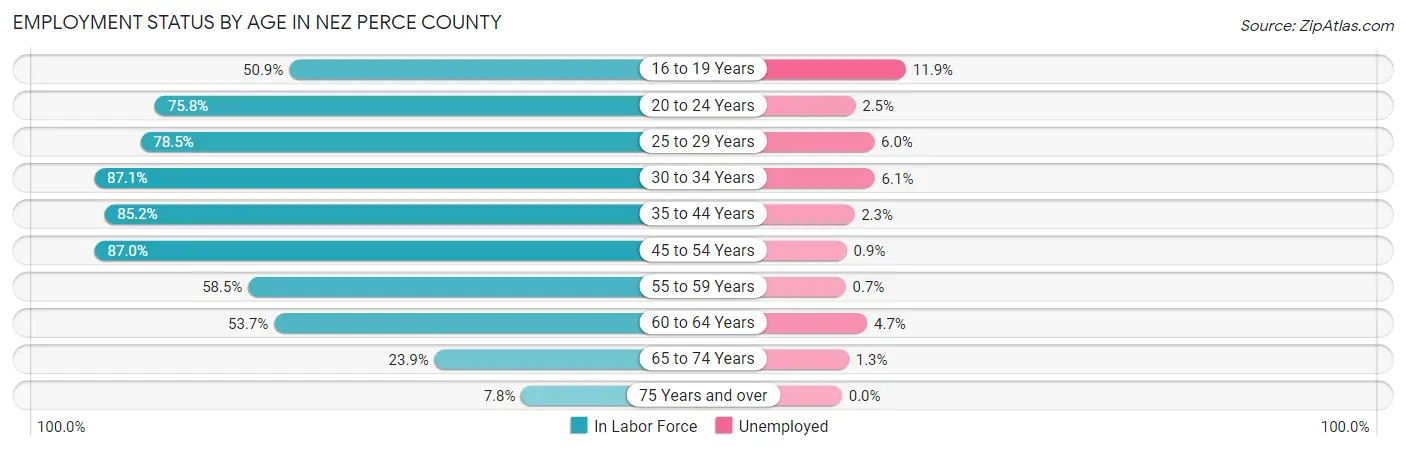
| Age Bracket | In Labor Force | Unemployed |
| 16 to 19 Years | 1,059 (50.9%) | 126 (11.9%) |
| 20 to 24 Years | 1,931 (75.8%) | 48 (2.5%) |
| 25 to 29 Years | 1,994 (78.5%) | 120 (6.0%) |
| 30 to 34 Years | 2,394 (87.1%) | 146 (6.1%) |
| 35 to 44 Years | 4,238 (85.2%) | 97 (2.3%) |
| 45 to 54 Years | 4,298 (87.0%) | 39 (0.9%) |
| 55 to 59 Years | 1,742 (58.5%) | 12 (0.7%) |
| 60 to 64 Years | 1,470 (53.7%) | 69 (4.7%) |
| 65 to 74 Years | 1,143 (23.9%) | 15 (1.3%) |
| 75 Years and over | 295 (7.8%) | 0 (0.0%) |
| Total | 20,570 (60.3%) | 658 (3.2%) |
Employment Status by Educational Attainment in Nez Perce County
According to labor force statistics for Nez Perce County, 77.2% of individuals (16,148) out of the total population between 25 and 64 years of age (20,917) are in the labor force, with 3.0% or 484 of them being unemployed. The group with the highest labor force participation rate are those with the educational attainment of bachelor's degree or higher, with 86.2% or 4,794 individuals in the labor force. Within the labor force, individuals with high school diploma education have the highest percentage of unemployment, with 4.2% or 178 of them being unemployed.
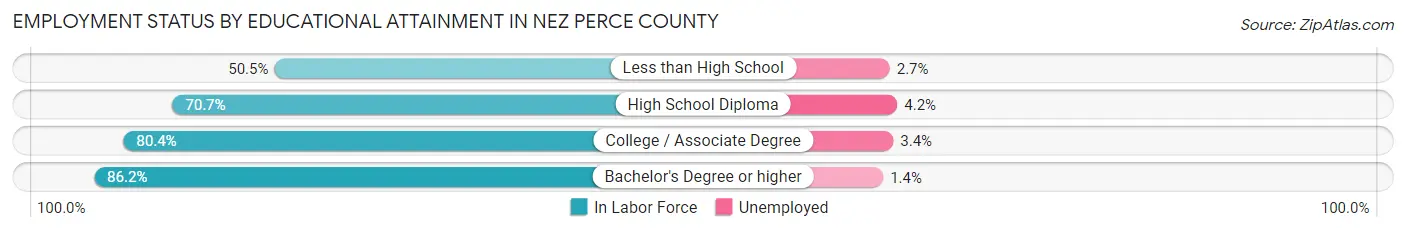
| Educational Attainment | In Labor Force | Unemployed |
| Less than High School | 714 (50.5%) | 38 (2.7%) |
| High School Diploma | 4,234 (70.7%) | 251 (4.2%) |
| College / Associate Degree | 6,394 (80.4%) | 270 (3.4%) |
| Bachelor's Degree or higher | 4,794 (86.2%) | 78 (1.4%) |
| Total | 16,148 (77.2%) | 628 (3.0%) |
Employment Occupations by Sex in Nez Perce County
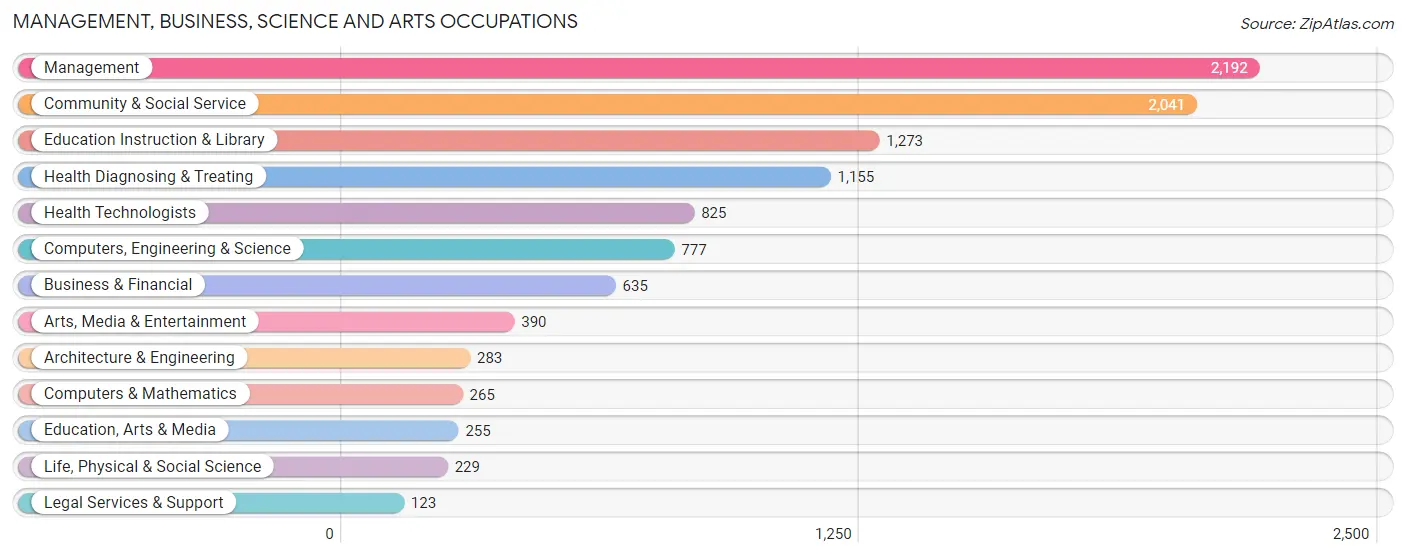
Management, Business, Science and Arts Occupations
The most common Management, Business, Science and Arts occupations in Nez Perce County are Management (2,192 | 11.1%), Community & Social Service (2,041 | 10.3%), Education Instruction & Library (1,273 | 6.4%), Health Diagnosing & Treating (1,155 | 5.8%), and Health Technologists (825 | 4.2%).
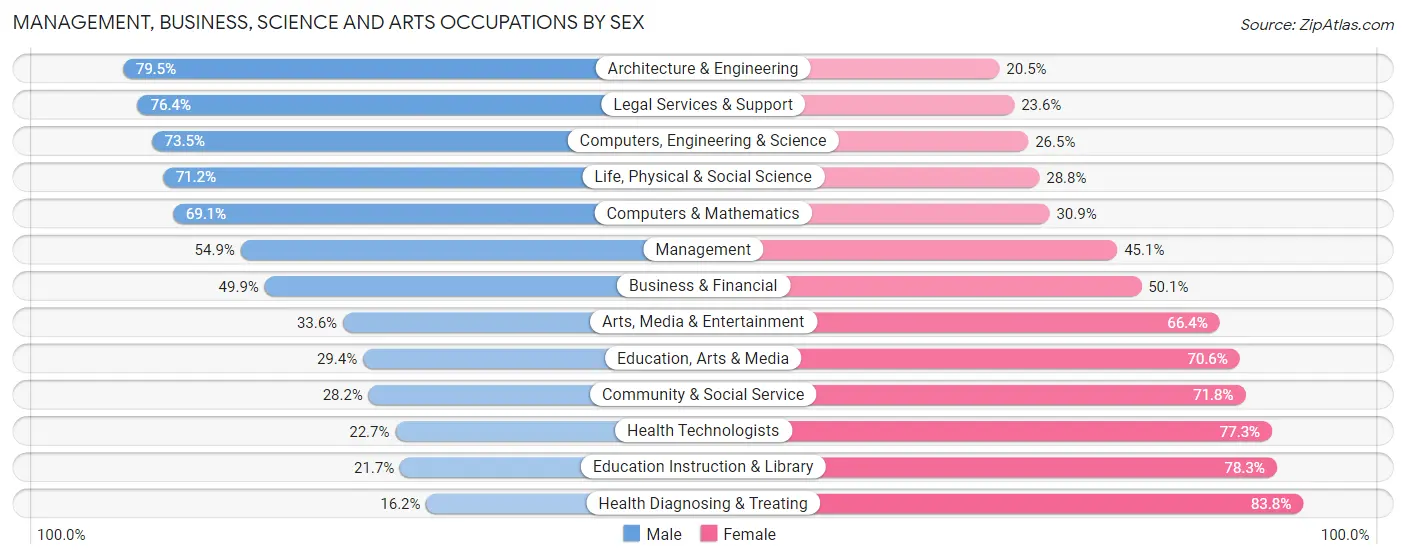
Management, Business, Science and Arts Occupations by Sex
Within the Management, Business, Science and Arts occupations in Nez Perce County, the most male-oriented occupations are Architecture & Engineering (79.5%), Legal Services & Support (76.4%), and Computers, Engineering & Science (73.5%), while the most female-oriented occupations are Health Diagnosing & Treating (83.8%), Education Instruction & Library (78.3%), and Health Technologists (77.3%).
| Occupation | Male | Female |
| Management | 1,204 (54.9%) | 988 (45.1%) |
| Business & Financial | 317 (49.9%) | 318 (50.1%) |
| Computers, Engineering & Science | 571 (73.5%) | 206 (26.5%) |
| Computers & Mathematics | 183 (69.1%) | 82 (30.9%) |
| Architecture & Engineering | 225 (79.5%) | 58 (20.5%) |
| Life, Physical & Social Science | 163 (71.2%) | 66 (28.8%) |
| Community & Social Service | 576 (28.2%) | 1,465 (71.8%) |
| Education, Arts & Media | 75 (29.4%) | 180 (70.6%) |
| Legal Services & Support | 94 (76.4%) | 29 (23.6%) |
| Education Instruction & Library | 276 (21.7%) | 997 (78.3%) |
| Arts, Media & Entertainment | 131 (33.6%) | 259 (66.4%) |
| Health Diagnosing & Treating | 187 (16.2%) | 968 (83.8%) |
| Health Technologists | 187 (22.7%) | 638 (77.3%) |
| Total (Category) | 2,855 (42.0%) | 3,945 (58.0%) |
| Total (Overall) | 10,278 (51.9%) | 9,534 (48.1%) |
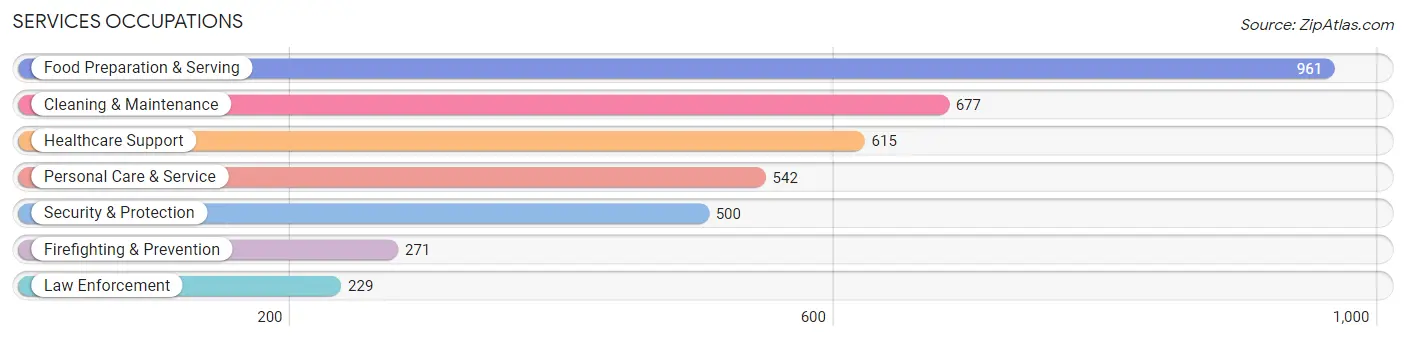
Services Occupations
The most common Services occupations in Nez Perce County are Food Preparation & Serving (961 | 4.9%), Cleaning & Maintenance (677 | 3.4%), Healthcare Support (615 | 3.1%), Personal Care & Service (542 | 2.7%), and Security & Protection (500 | 2.5%).
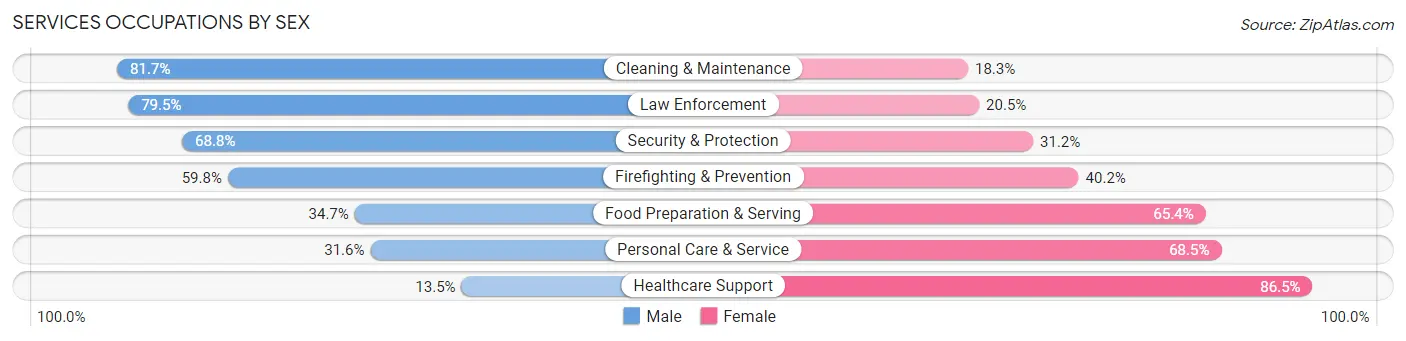
Services Occupations by Sex
Within the Services occupations in Nez Perce County, the most male-oriented occupations are Cleaning & Maintenance (81.7%), Law Enforcement (79.5%), and Security & Protection (68.8%), while the most female-oriented occupations are Healthcare Support (86.5%), Personal Care & Service (68.4%), and Food Preparation & Serving (65.3%).
| Occupation | Male | Female |
| Healthcare Support | 83 (13.5%) | 532 (86.5%) |
| Security & Protection | 344 (68.8%) | 156 (31.2%) |
| Firefighting & Prevention | 162 (59.8%) | 109 (40.2%) |
| Law Enforcement | 182 (79.5%) | 47 (20.5%) |
| Food Preparation & Serving | 333 (34.6%) | 628 (65.3%) |
| Cleaning & Maintenance | 553 (81.7%) | 124 (18.3%) |
| Personal Care & Service | 171 (31.6%) | 371 (68.4%) |
| Total (Category) | 1,484 (45.0%) | 1,811 (55.0%) |
| Total (Overall) | 10,278 (51.9%) | 9,534 (48.1%) |
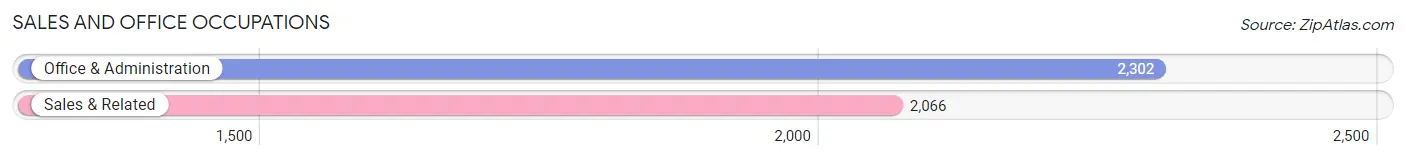
Sales and Office Occupations
The most common Sales and Office occupations in Nez Perce County are Office & Administration (2,302 | 11.6%), and Sales & Related (2,066 | 10.4%).
Sales and Office Occupations by Sex
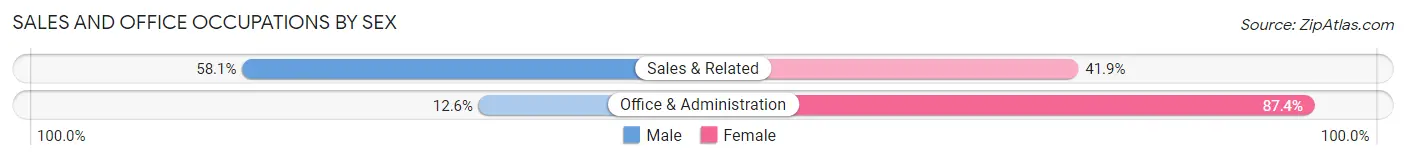
| Occupation | Male | Female |
| Sales & Related | 1,201 (58.1%) | 865 (41.9%) |
| Office & Administration | 291 (12.6%) | 2,011 (87.4%) |
| Total (Category) | 1,492 (34.2%) | 2,876 (65.8%) |
| Total (Overall) | 10,278 (51.9%) | 9,534 (48.1%) |
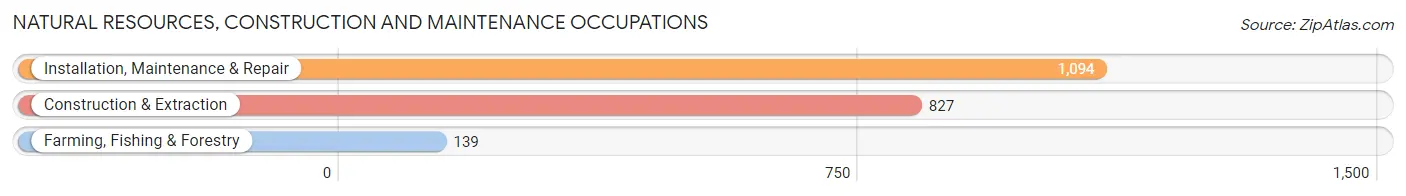
Natural Resources, Construction and Maintenance Occupations
The most common Natural Resources, Construction and Maintenance occupations in Nez Perce County are Installation, Maintenance & Repair (1,094 | 5.5%), Construction & Extraction (827 | 4.2%), and Farming, Fishing & Forestry (139 | 0.7%).
Natural Resources, Construction and Maintenance Occupations by Sex
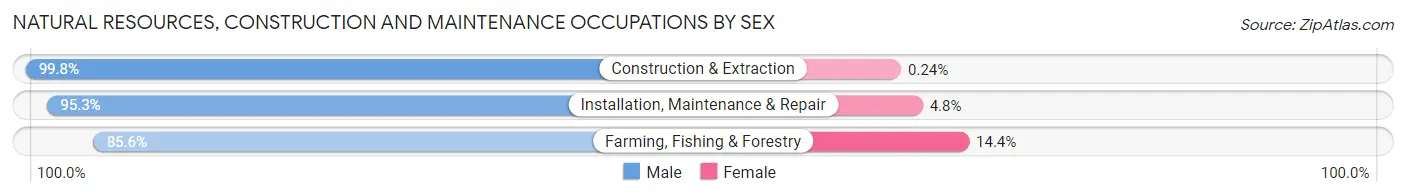
| Occupation | Male | Female |
| Farming, Fishing & Forestry | 119 (85.6%) | 20 (14.4%) |
| Construction & Extraction | 825 (99.8%) | 2 (0.2%) |
| Installation, Maintenance & Repair | 1,042 (95.3%) | 52 (4.8%) |
| Total (Category) | 1,986 (96.4%) | 74 (3.6%) |
| Total (Overall) | 10,278 (51.9%) | 9,534 (48.1%) |
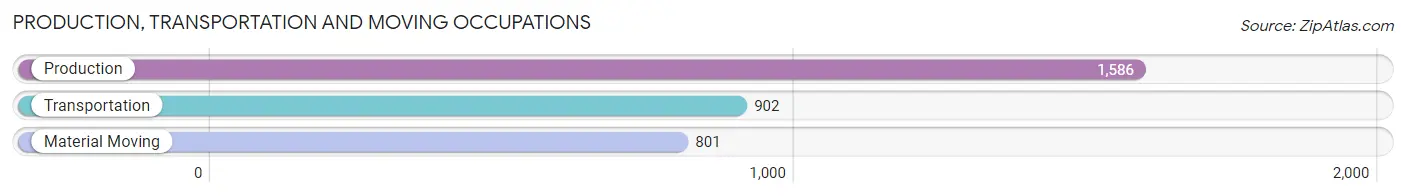
Production, Transportation and Moving Occupations
The most common Production, Transportation and Moving occupations in Nez Perce County are Production (1,586 | 8.0%), Transportation (902 | 4.5%), and Material Moving (801 | 4.0%).
Production, Transportation and Moving Occupations by Sex
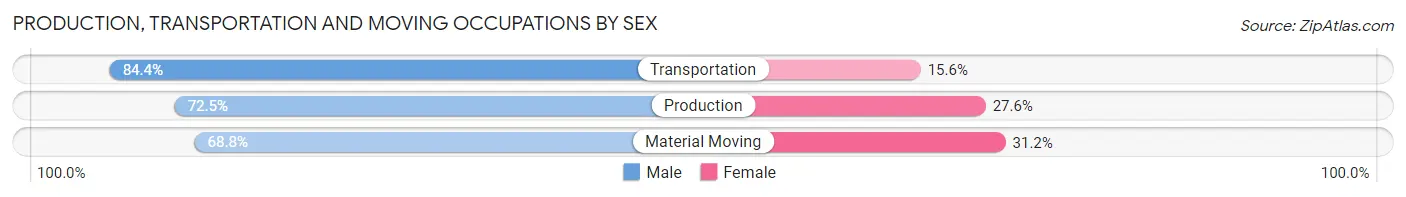
| Occupation | Male | Female |
| Production | 1,149 (72.5%) | 437 (27.6%) |
| Transportation | 761 (84.4%) | 141 (15.6%) |
| Material Moving | 551 (68.8%) | 250 (31.2%) |
| Total (Category) | 2,461 (74.8%) | 828 (25.2%) |
| Total (Overall) | 10,278 (51.9%) | 9,534 (48.1%) |
Employment Industries by Sex in Nez Perce County
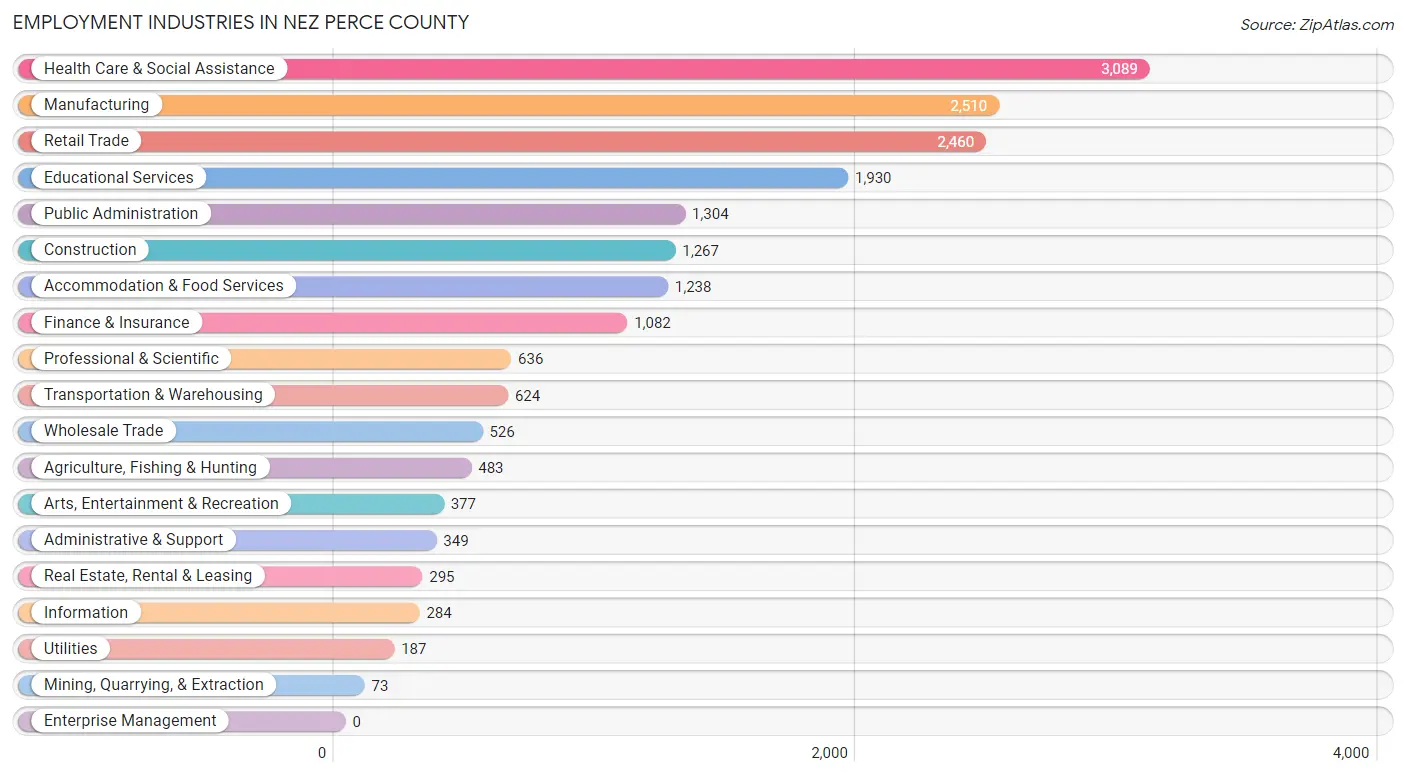
Employment Industries in Nez Perce County
The major employment industries in Nez Perce County include Health Care & Social Assistance (3,089 | 15.6%), Manufacturing (2,510 | 12.7%), Retail Trade (2,460 | 12.4%), Educational Services (1,930 | 9.7%), and Public Administration (1,304 | 6.6%).
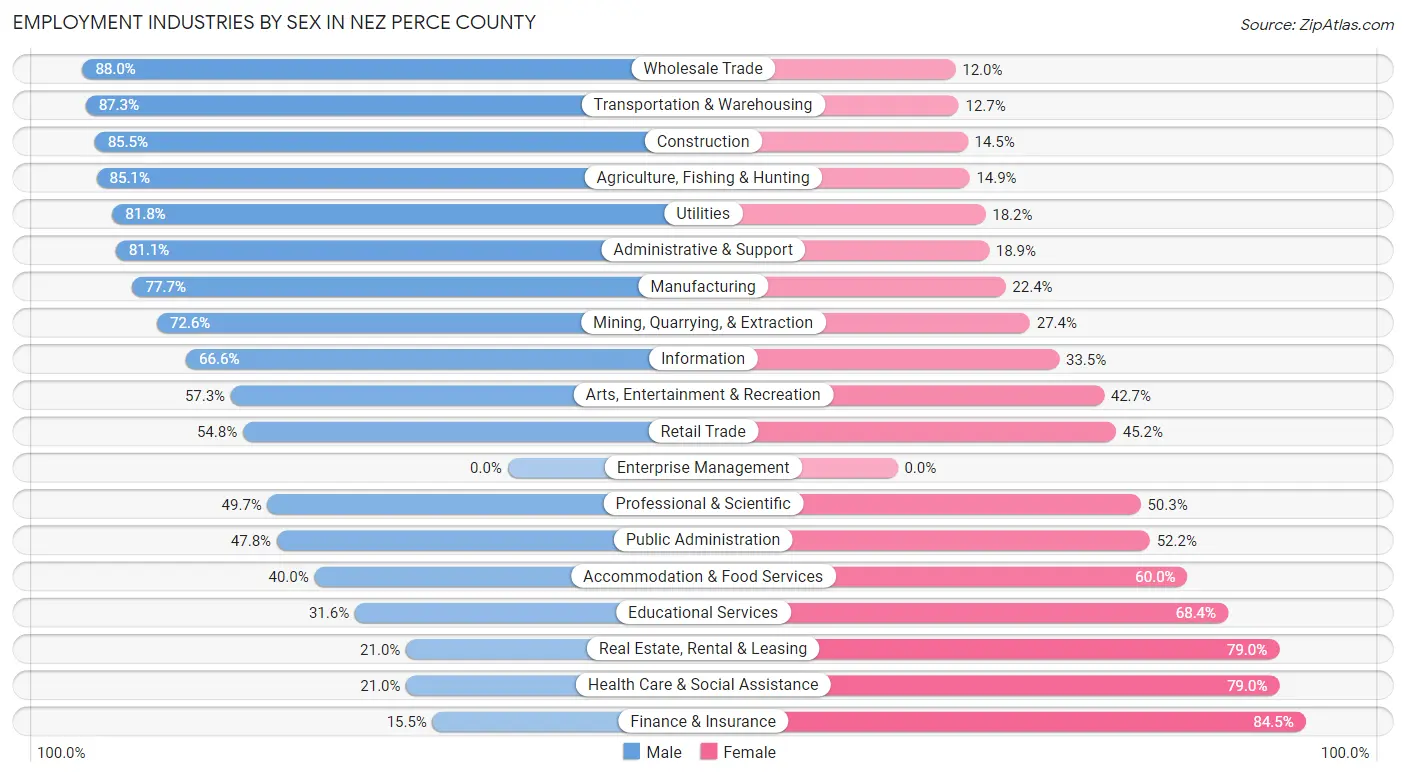
Employment Industries by Sex in Nez Perce County
The Nez Perce County industries that see more men than women are Wholesale Trade (88.0%), Transportation & Warehousing (87.3%), and Construction (85.5%), whereas the industries that tend to have a higher number of women are Finance & Insurance (84.5%), Health Care & Social Assistance (79.0%), and Real Estate, Rental & Leasing (79.0%).
| Industry | Male | Female |
| Agriculture, Fishing & Hunting | 411 (85.1%) | 72 (14.9%) |
| Mining, Quarrying, & Extraction | 53 (72.6%) | 20 (27.4%) |
| Construction | 1,083 (85.5%) | 184 (14.5%) |
| Manufacturing | 1,949 (77.6%) | 561 (22.4%) |
| Wholesale Trade | 463 (88.0%) | 63 (12.0%) |
| Retail Trade | 1,348 (54.8%) | 1,112 (45.2%) |
| Transportation & Warehousing | 545 (87.3%) | 79 (12.7%) |
| Utilities | 153 (81.8%) | 34 (18.2%) |
| Information | 189 (66.5%) | 95 (33.5%) |
| Finance & Insurance | 168 (15.5%) | 914 (84.5%) |
| Real Estate, Rental & Leasing | 62 (21.0%) | 233 (79.0%) |
| Professional & Scientific | 316 (49.7%) | 320 (50.3%) |
| Enterprise Management | 0 (0.0%) | 0 (0.0%) |
| Administrative & Support | 283 (81.1%) | 66 (18.9%) |
| Educational Services | 610 (31.6%) | 1,320 (68.4%) |
| Health Care & Social Assistance | 648 (21.0%) | 2,441 (79.0%) |
| Arts, Entertainment & Recreation | 216 (57.3%) | 161 (42.7%) |
| Accommodation & Food Services | 495 (40.0%) | 743 (60.0%) |
| Public Administration | 623 (47.8%) | 681 (52.2%) |
| Total | 10,278 (51.9%) | 9,534 (48.1%) |
Education in Nez Perce County
School Enrollment in Nez Perce County
The most common levels of schooling among the 9,265 students in Nez Perce County are elementary school (2,099 | 22.7%), college / undergraduate (2,060 | 22.2%), and high school (1,949 | 21.0%).
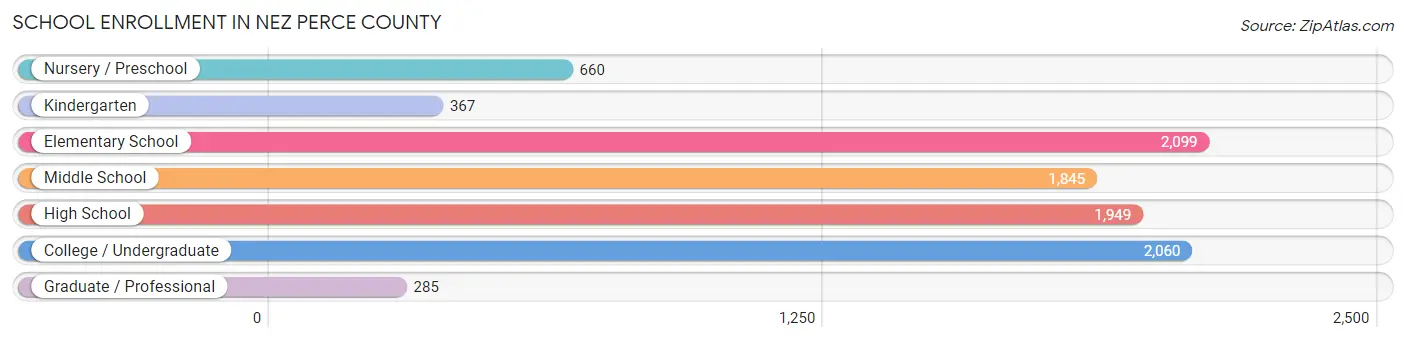
| School Level | # Students | % Students |
| Nursery / Preschool | 660 | 7.1% |
| Kindergarten | 367 | 4.0% |
| Elementary School | 2,099 | 22.7% |
| Middle School | 1,845 | 19.9% |
| High School | 1,949 | 21.0% |
| College / Undergraduate | 2,060 | 22.2% |
| Graduate / Professional | 285 | 3.1% |
| Total | 9,265 | 100.0% |
School Enrollment by Age by Funding Source in Nez Perce County
Out of a total of 9,265 students who are enrolled in schools in Nez Perce County, 1,038 (11.2%) attend a private institution, while the remaining 8,227 (88.8%) are enrolled in public schools. The age group of 3 to 4 year olds has the highest likelihood of being enrolled in private schools, with 150 (32.5% in the age bracket) enrolled. Conversely, the age group of 20 to 24 year olds has the lowest likelihood of being enrolled in a private school, with 899 (99.0% in the age bracket) attending a public institution.
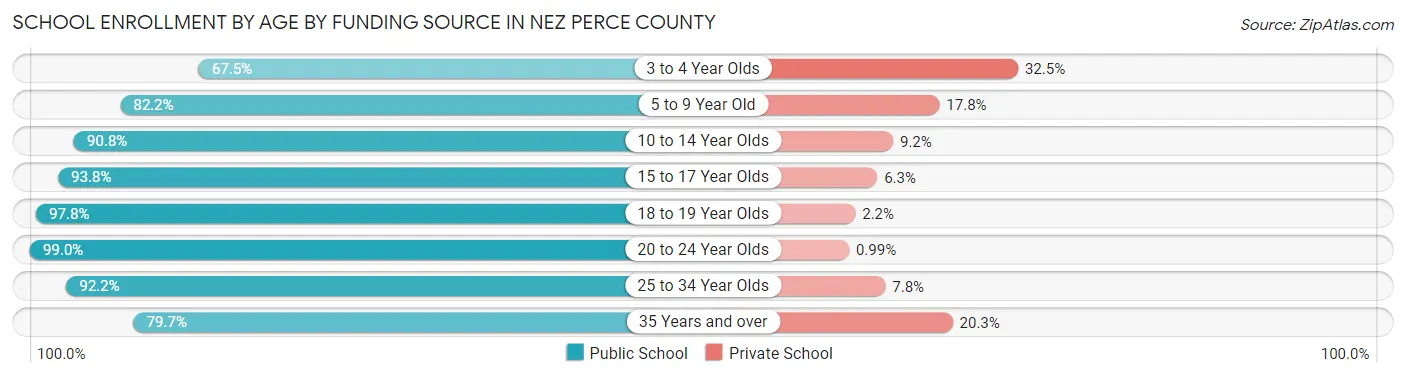
| Age Bracket | Public School | Private School |
| 3 to 4 Year Olds | 312 (67.5%) | 150 (32.5%) |
| 5 to 9 Year Old | 1,959 (82.2%) | 425 (17.8%) |
| 10 to 14 Year Olds | 2,164 (90.8%) | 219 (9.2%) |
| 15 to 17 Year Olds | 1,379 (93.8%) | 92 (6.2%) |
| 18 to 19 Year Olds | 725 (97.8%) | 16 (2.2%) |
| 20 to 24 Year Olds | 899 (99.0%) | 9 (1.0%) |
| 25 to 34 Year Olds | 463 (92.2%) | 39 (7.8%) |
| 35 Years and over | 330 (79.7%) | 84 (20.3%) |
| Total | 8,227 (88.8%) | 1,038 (11.2%) |
Educational Attainment by Field of Study in Nez Perce County
Business (1,922 | 23.8%), education (1,234 | 15.3%), bio, nature & agricultural (903 | 11.2%), science & technology (888 | 11.0%), and arts & humanities (555 | 6.9%) are the most common fields of study among 8,083 individuals in Nez Perce County who have obtained a bachelor's degree or higher.
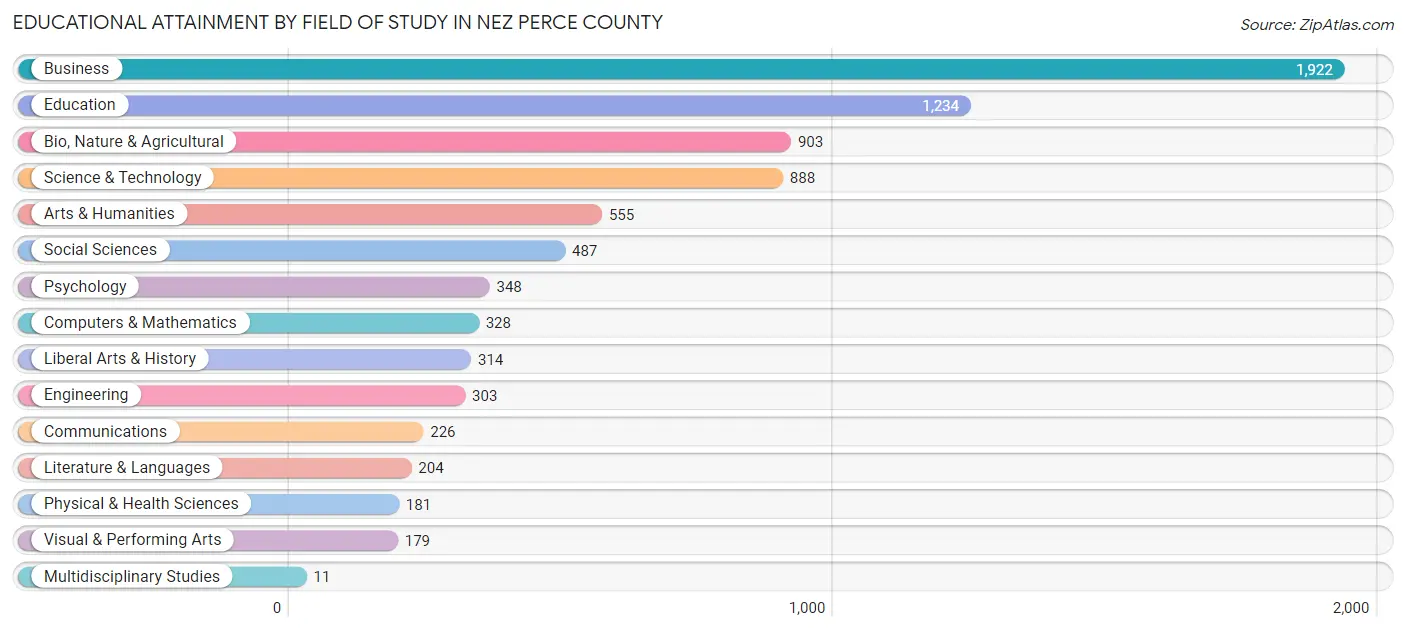
| Field of Study | # Graduates | % Graduates |
| Computers & Mathematics | 328 | 4.1% |
| Bio, Nature & Agricultural | 903 | 11.2% |
| Physical & Health Sciences | 181 | 2.2% |
| Psychology | 348 | 4.3% |
| Social Sciences | 487 | 6.0% |
| Engineering | 303 | 3.7% |
| Multidisciplinary Studies | 11 | 0.1% |
| Science & Technology | 888 | 11.0% |
| Business | 1,922 | 23.8% |
| Education | 1,234 | 15.3% |
| Literature & Languages | 204 | 2.5% |
| Liberal Arts & History | 314 | 3.9% |
| Visual & Performing Arts | 179 | 2.2% |
| Communications | 226 | 2.8% |
| Arts & Humanities | 555 | 6.9% |
| Total | 8,083 | 100.0% |
Transportation & Commute in Nez Perce County
Vehicle Availability by Sex in Nez Perce County
The most prevalent vehicle ownership categories in Nez Perce County are males with 2 vehicles (3,234, accounting for 31.7%) and females with 2 vehicles (2,774, making up 36.0%).
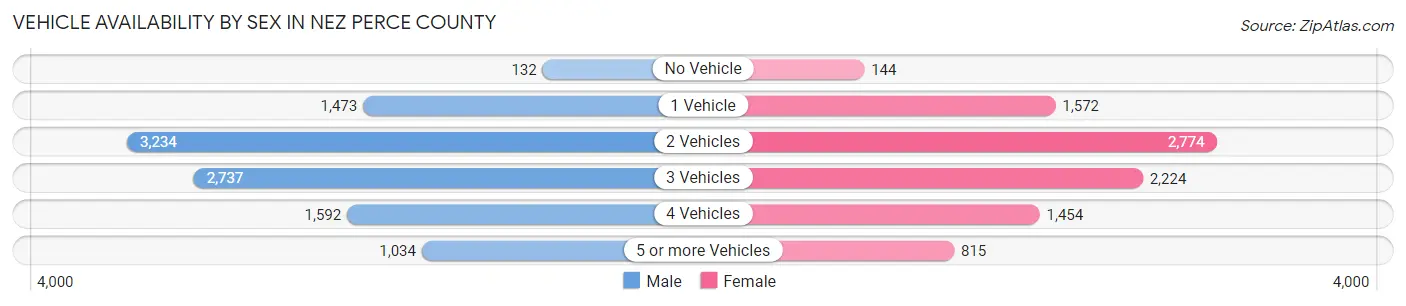
| Vehicles Available | Male | Female |
| No Vehicle | 132 (1.3%) | 144 (1.6%) |
| 1 Vehicle | 1,473 (14.4%) | 1,572 (17.5%) |
| 2 Vehicles | 3,234 (31.7%) | 2,774 (30.9%) |
| 3 Vehicles | 2,737 (26.8%) | 2,224 (24.8%) |
| 4 Vehicles | 1,592 (15.6%) | 1,454 (16.2%) |
| 5 or more Vehicles | 1,034 (10.1%) | 815 (9.1%) |
| Total | 10,202 (100.0%) | 8,983 (100.0%) |
Commute Time in Nez Perce County
The most frequently occuring commute durations in Nez Perce County are 10 to 14 minutes (4,873 commuters, 26.5%), 15 to 19 minutes (4,011 commuters, 21.8%), and 5 to 9 minutes (3,888 commuters, 21.2%).
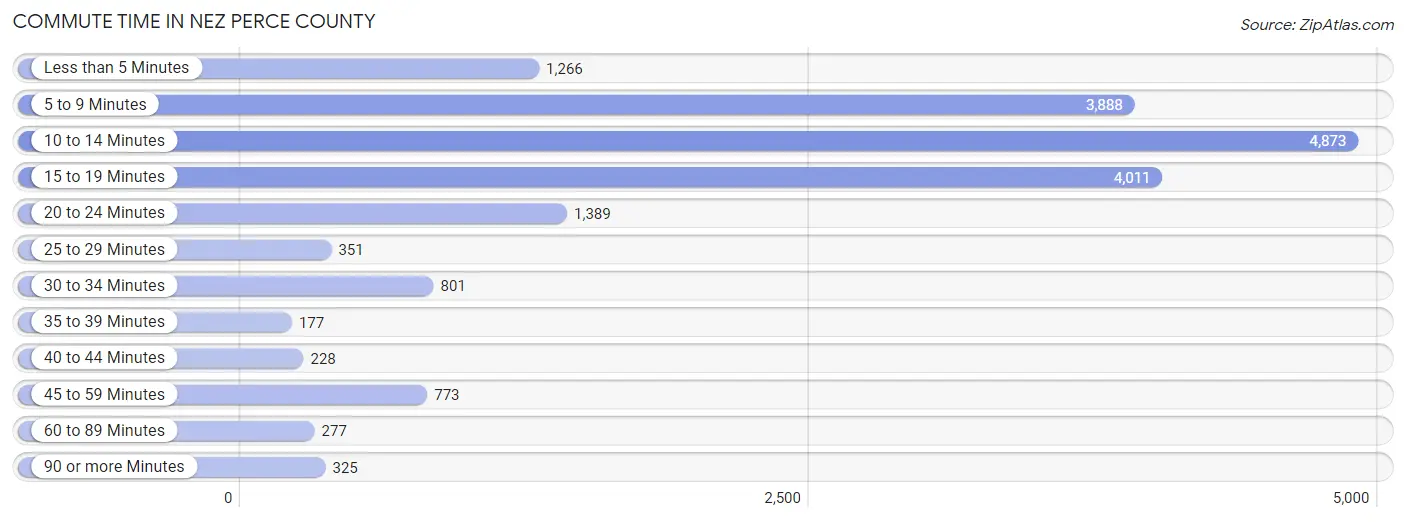
| Commute Time | # Commuters | % Commuters |
| Less than 5 Minutes | 1,266 | 6.9% |
| 5 to 9 Minutes | 3,888 | 21.2% |
| 10 to 14 Minutes | 4,873 | 26.5% |
| 15 to 19 Minutes | 4,011 | 21.8% |
| 20 to 24 Minutes | 1,389 | 7.6% |
| 25 to 29 Minutes | 351 | 1.9% |
| 30 to 34 Minutes | 801 | 4.4% |
| 35 to 39 Minutes | 177 | 1.0% |
| 40 to 44 Minutes | 228 | 1.2% |
| 45 to 59 Minutes | 773 | 4.2% |
| 60 to 89 Minutes | 277 | 1.5% |
| 90 or more Minutes | 325 | 1.8% |
Commute Time by Sex in Nez Perce County
The most common commute times in Nez Perce County are 10 to 14 minutes (2,801 commuters, 28.8%) for males and 5 to 9 minutes (2,383 commuters, 27.6%) for females.
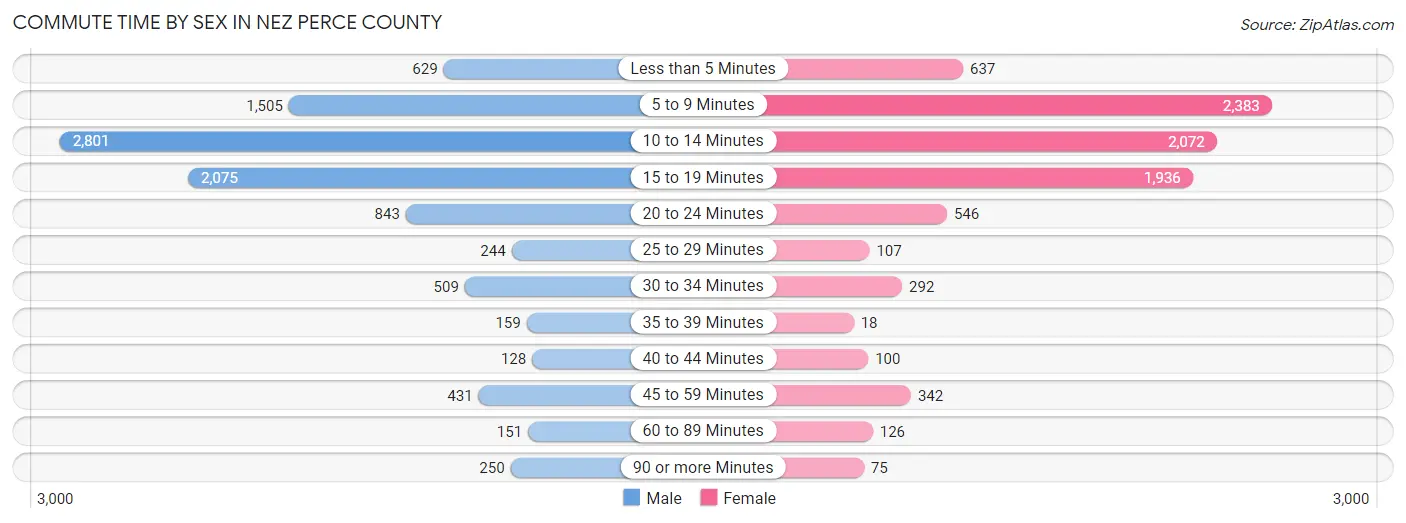
| Commute Time | Male | Female |
| Less than 5 Minutes | 629 (6.5%) | 637 (7.4%) |
| 5 to 9 Minutes | 1,505 (15.5%) | 2,383 (27.6%) |
| 10 to 14 Minutes | 2,801 (28.8%) | 2,072 (24.0%) |
| 15 to 19 Minutes | 2,075 (21.3%) | 1,936 (22.4%) |
| 20 to 24 Minutes | 843 (8.7%) | 546 (6.3%) |
| 25 to 29 Minutes | 244 (2.5%) | 107 (1.2%) |
| 30 to 34 Minutes | 509 (5.2%) | 292 (3.4%) |
| 35 to 39 Minutes | 159 (1.6%) | 18 (0.2%) |
| 40 to 44 Minutes | 128 (1.3%) | 100 (1.2%) |
| 45 to 59 Minutes | 431 (4.4%) | 342 (4.0%) |
| 60 to 89 Minutes | 151 (1.5%) | 126 (1.5%) |
| 90 or more Minutes | 250 (2.6%) | 75 (0.9%) |
Time of Departure to Work by Sex in Nez Perce County
The most frequent times of departure to work in Nez Perce County are 7:30 AM to 7:59 AM (1,350, 13.9%) for males and 7:30 AM to 7:59 AM (2,189, 25.4%) for females.
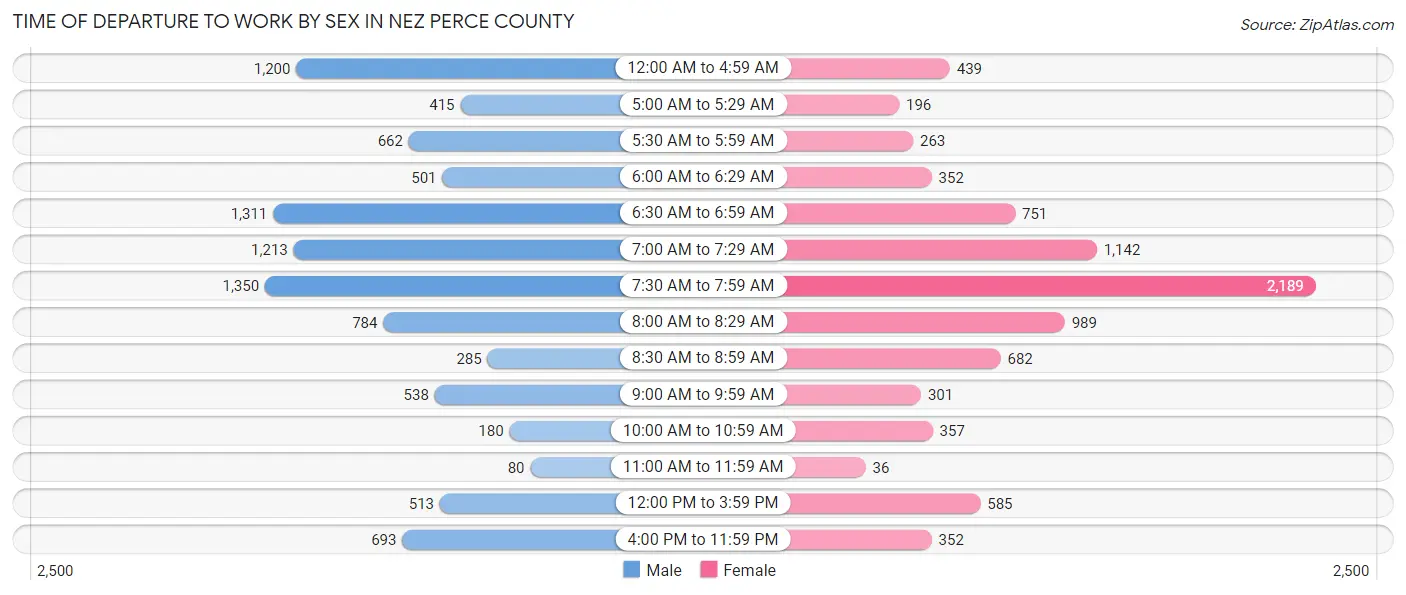
| Time of Departure | Male | Female |
| 12:00 AM to 4:59 AM | 1,200 (12.3%) | 439 (5.1%) |
| 5:00 AM to 5:29 AM | 415 (4.3%) | 196 (2.3%) |
| 5:30 AM to 5:59 AM | 662 (6.8%) | 263 (3.0%) |
| 6:00 AM to 6:29 AM | 501 (5.1%) | 352 (4.1%) |
| 6:30 AM to 6:59 AM | 1,311 (13.5%) | 751 (8.7%) |
| 7:00 AM to 7:29 AM | 1,213 (12.5%) | 1,142 (13.2%) |
| 7:30 AM to 7:59 AM | 1,350 (13.9%) | 2,189 (25.4%) |
| 8:00 AM to 8:29 AM | 784 (8.1%) | 989 (11.5%) |
| 8:30 AM to 8:59 AM | 285 (2.9%) | 682 (7.9%) |
| 9:00 AM to 9:59 AM | 538 (5.5%) | 301 (3.5%) |
| 10:00 AM to 10:59 AM | 180 (1.8%) | 357 (4.1%) |
| 11:00 AM to 11:59 AM | 80 (0.8%) | 36 (0.4%) |
| 12:00 PM to 3:59 PM | 513 (5.3%) | 585 (6.8%) |
| 4:00 PM to 11:59 PM | 693 (7.1%) | 352 (4.1%) |
| Total | 9,725 (100.0%) | 8,634 (100.0%) |
Housing Occupancy in Nez Perce County
Occupancy by Ownership in Nez Perce County
Of the total 17,124 dwellings in Nez Perce County, owner-occupied units account for 12,256 (71.6%), while renter-occupied units make up 4,868 (28.4%).
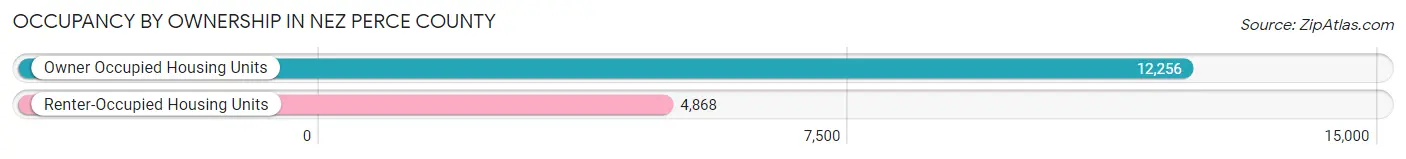
| Occupancy | # Housing Units | % Housing Units |
| Owner Occupied Housing Units | 12,256 | 71.6% |
| Renter-Occupied Housing Units | 4,868 | 28.4% |
| Total Occupied Housing Units | 17,124 | 100.0% |
Occupancy by Household Size in Nez Perce County
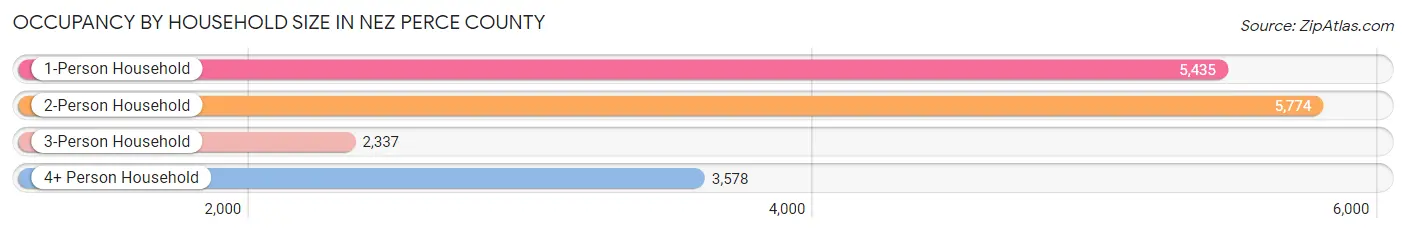
| Household Size | # Housing Units | % Housing Units |
| 1-Person Household | 5,435 | 31.7% |
| 2-Person Household | 5,774 | 33.7% |
| 3-Person Household | 2,337 | 13.7% |
| 4+ Person Household | 3,578 | 20.9% |
| Total Housing Units | 17,124 | 100.0% |
Occupancy by Ownership by Household Size in Nez Perce County
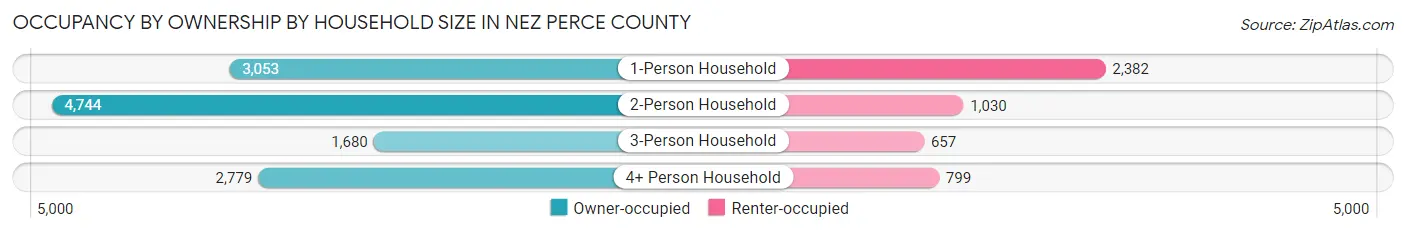
| Household Size | Owner-occupied | Renter-occupied |
| 1-Person Household | 3,053 (56.2%) | 2,382 (43.8%) |
| 2-Person Household | 4,744 (82.2%) | 1,030 (17.8%) |
| 3-Person Household | 1,680 (71.9%) | 657 (28.1%) |
| 4+ Person Household | 2,779 (77.7%) | 799 (22.3%) |
| Total Housing Units | 12,256 (71.6%) | 4,868 (28.4%) |
Occupancy by Educational Attainment in Nez Perce County
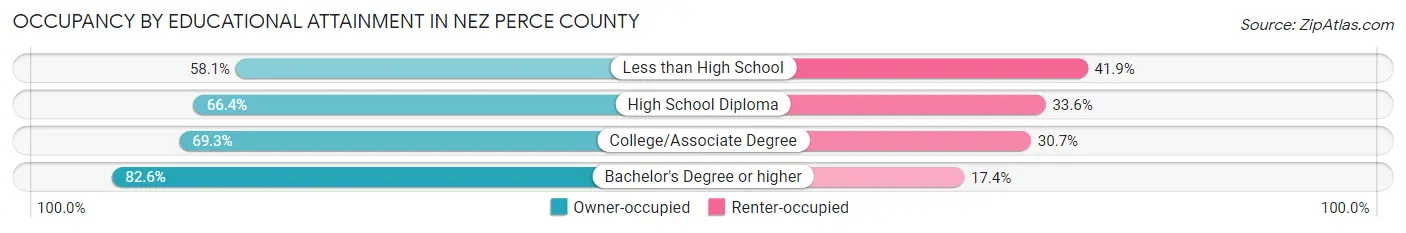
| Household Size | Owner-occupied | Renter-occupied |
| Less than High School | 570 (58.1%) | 411 (41.9%) |
| High School Diploma | 3,085 (66.4%) | 1,559 (33.6%) |
| College/Associate Degree | 4,677 (69.3%) | 2,070 (30.7%) |
| Bachelor's Degree or higher | 3,924 (82.6%) | 828 (17.4%) |
Occupancy by Age of Householder in Nez Perce County
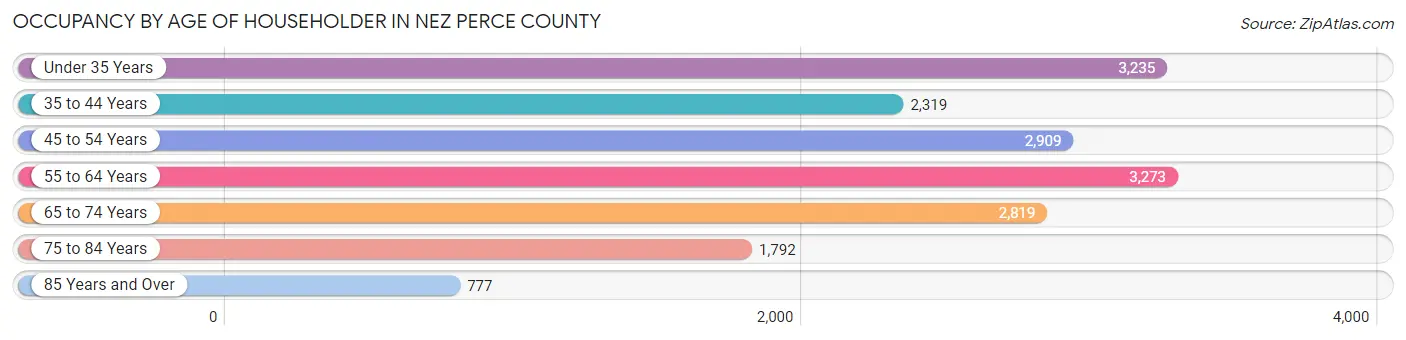
| Age Bracket | # Households | % Households |
| Under 35 Years | 3,235 | 18.9% |
| 35 to 44 Years | 2,319 | 13.5% |
| 45 to 54 Years | 2,909 | 17.0% |
| 55 to 64 Years | 3,273 | 19.1% |
| 65 to 74 Years | 2,819 | 16.5% |
| 75 to 84 Years | 1,792 | 10.5% |
| 85 Years and Over | 777 | 4.5% |
| Total | 17,124 | 100.0% |
Housing Finances in Nez Perce County
Median Income by Occupancy in Nez Perce County
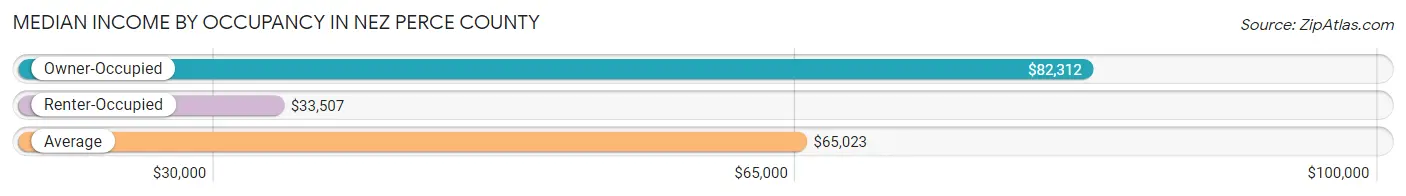
| Occupancy Type | # Households | Median Income |
| Owner-Occupied | 12,256 (71.6%) | $82,312 |
| Renter-Occupied | 4,868 (28.4%) | $33,507 |
| Average | 17,124 (100.0%) | $65,023 |
Occupancy by Householder Income Bracket in Nez Perce County

| Income Bracket | Owner-occupied | Renter-occupied |
| Less than $5,000 | 277 (2.3%) | 287 (5.9%) |
| $5,000 to $9,999 | 125 (1.0%) | 223 (4.6%) |
| $10,000 to $14,999 | 154 (1.3%) | 660 (13.6%) |
| $15,000 to $19,999 | 367 (3.0%) | 521 (10.7%) |
| $20,000 to $24,999 | 309 (2.5%) | 189 (3.9%) |
| $25,000 to $34,999 | 1,327 (10.8%) | 594 (12.2%) |
| $35,000 to $49,999 | 1,246 (10.2%) | 651 (13.4%) |
| $50,000 to $74,999 | 1,838 (15.0%) | 709 (14.6%) |
| $75,000 to $99,999 | 1,742 (14.2%) | 559 (11.5%) |
| $100,000 to $149,999 | 2,857 (23.3%) | 240 (4.9%) |
| $150,000 or more | 2,014 (16.4%) | 235 (4.8%) |
| Total | 12,256 (100.0%) | 4,868 (100.0%) |
Monthly Housing Cost Tiers in Nez Perce County
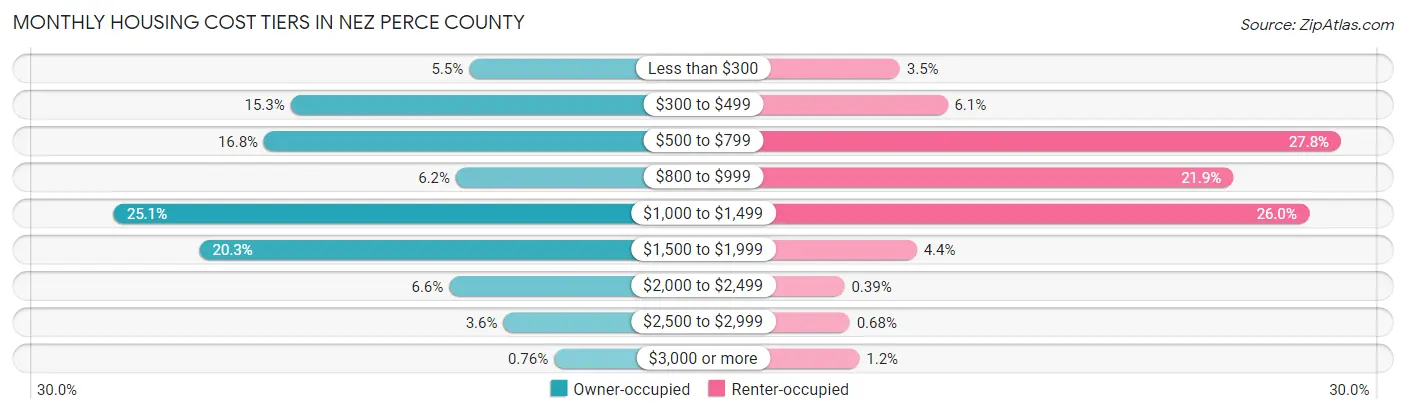
| Monthly Cost | Owner-occupied | Renter-occupied |
| Less than $300 | 668 (5.4%) | 168 (3.5%) |
| $300 to $499 | 1,877 (15.3%) | 296 (6.1%) |
| $500 to $799 | 2,056 (16.8%) | 1,354 (27.8%) |
| $800 to $999 | 758 (6.2%) | 1,064 (21.9%) |
| $1,000 to $1,499 | 3,072 (25.1%) | 1,267 (26.0%) |
| $1,500 to $1,999 | 2,493 (20.3%) | 213 (4.4%) |
| $2,000 to $2,499 | 803 (6.6%) | 19 (0.4%) |
| $2,500 to $2,999 | 436 (3.6%) | 33 (0.7%) |
| $3,000 or more | 93 (0.8%) | 59 (1.2%) |
| Total | 12,256 (100.0%) | 4,868 (100.0%) |
Physical Housing Characteristics in Nez Perce County
Housing Structures in Nez Perce County
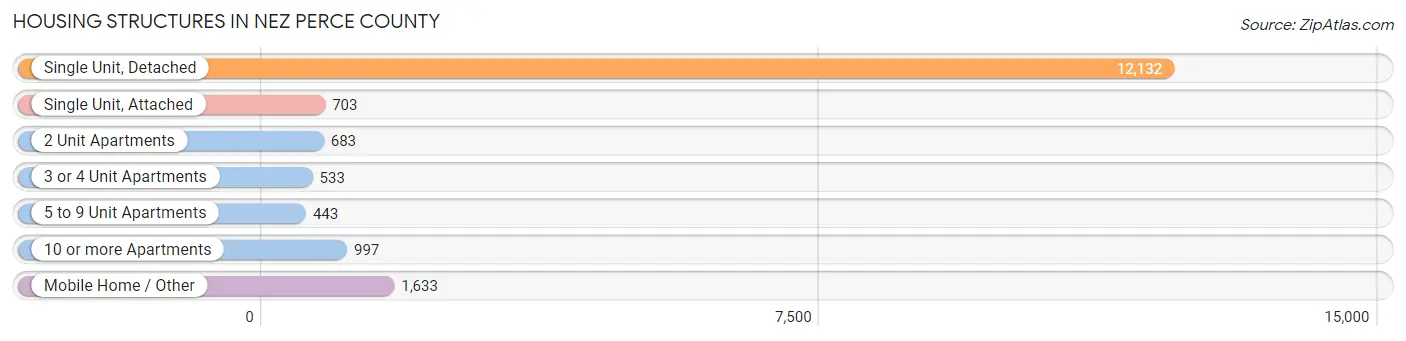
| Structure Type | # Housing Units | % Housing Units |
| Single Unit, Detached | 12,132 | 70.9% |
| Single Unit, Attached | 703 | 4.1% |
| 2 Unit Apartments | 683 | 4.0% |
| 3 or 4 Unit Apartments | 533 | 3.1% |
| 5 to 9 Unit Apartments | 443 | 2.6% |
| 10 or more Apartments | 997 | 5.8% |
| Mobile Home / Other | 1,633 | 9.5% |
| Total | 17,124 | 100.0% |
Housing Structures by Occupancy in Nez Perce County
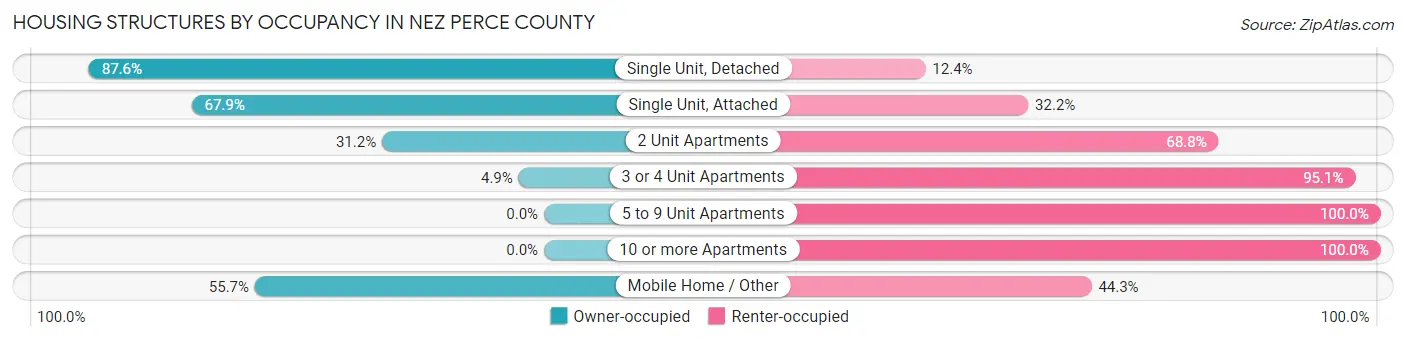
| Structure Type | Owner-occupied | Renter-occupied |
| Single Unit, Detached | 10,631 (87.6%) | 1,501 (12.4%) |
| Single Unit, Attached | 477 (67.8%) | 226 (32.2%) |
| 2 Unit Apartments | 213 (31.2%) | 470 (68.8%) |
| 3 or 4 Unit Apartments | 26 (4.9%) | 507 (95.1%) |
| 5 to 9 Unit Apartments | 0 (0.0%) | 443 (100.0%) |
| 10 or more Apartments | 0 (0.0%) | 997 (100.0%) |
| Mobile Home / Other | 909 (55.7%) | 724 (44.3%) |
| Total | 12,256 (71.6%) | 4,868 (28.4%) |
Housing Structures by Number of Rooms in Nez Perce County
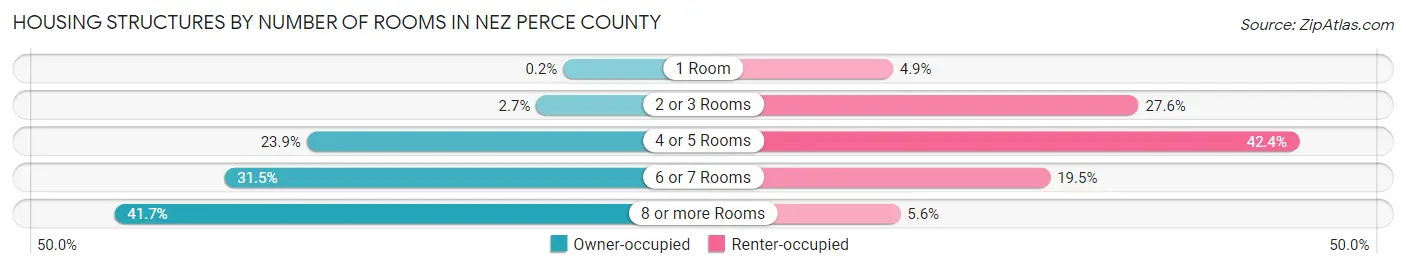
| Number of Rooms | Owner-occupied | Renter-occupied |
| 1 Room | 24 (0.2%) | 238 (4.9%) |
| 2 or 3 Rooms | 329 (2.7%) | 1,345 (27.6%) |
| 4 or 5 Rooms | 2,930 (23.9%) | 2,066 (42.4%) |
| 6 or 7 Rooms | 3,864 (31.5%) | 947 (19.5%) |
| 8 or more Rooms | 5,109 (41.7%) | 272 (5.6%) |
| Total | 12,256 (100.0%) | 4,868 (100.0%) |
Housing Structure by Heating Type in Nez Perce County
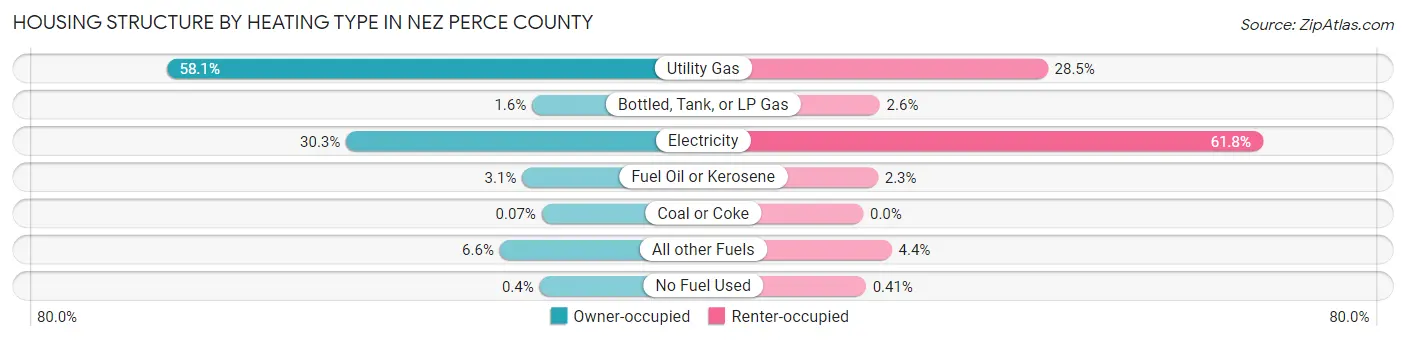
| Heating Type | Owner-occupied | Renter-occupied |
| Utility Gas | 7,114 (58.1%) | 1,389 (28.5%) |
| Bottled, Tank, or LP Gas | 191 (1.6%) | 125 (2.6%) |
| Electricity | 3,714 (30.3%) | 3,008 (61.8%) |
| Fuel Oil or Kerosene | 376 (3.1%) | 111 (2.3%) |
| Coal or Coke | 9 (0.1%) | 0 (0.0%) |
| All other Fuels | 803 (6.6%) | 215 (4.4%) |
| No Fuel Used | 49 (0.4%) | 20 (0.4%) |
| Total | 12,256 (100.0%) | 4,868 (100.0%) |
Household Vehicle Usage in Nez Perce County

| Vehicles per Household | Owner-occupied | Renter-occupied |
| No Vehicle | 373 (3.0%) | 803 (16.5%) |
| 1 Vehicle | 2,394 (19.5%) | 2,216 (45.5%) |
| 2 Vehicles | 4,610 (37.6%) | 1,009 (20.7%) |
| 3 or more Vehicles | 4,879 (39.8%) | 840 (17.3%) |
| Total | 12,256 (100.0%) | 4,868 (100.0%) |
Real Estate & Mortgages in Nez Perce County
Real Estate and Mortgage Overview in Nez Perce County
| Characteristic | Without Mortgage | With Mortgage |
| Housing Units | 4,734 | 7,522 |
| Median Property Value | $259,700 | $259,600 |
| Median Household Income | $61,007 | $1,434 |
| Monthly Housing Costs | $486 | $92 |
| Real Estate Taxes | $2,134 | $494 |
Property Value by Mortgage Status in Nez Perce County
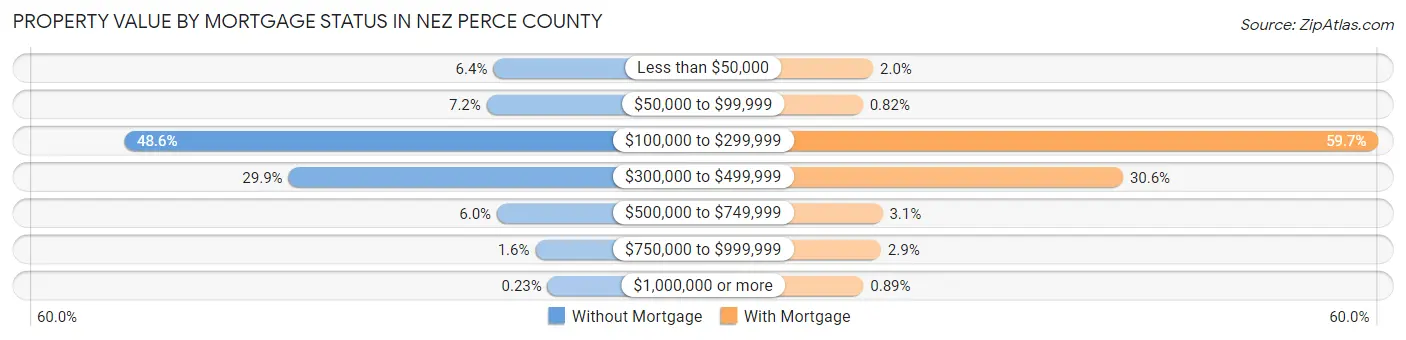
| Property Value | Without Mortgage | With Mortgage |
| Less than $50,000 | 305 (6.4%) | 151 (2.0%) |
| $50,000 to $99,999 | 341 (7.2%) | 62 (0.8%) |
| $100,000 to $299,999 | 2,302 (48.6%) | 4,493 (59.7%) |
| $300,000 to $499,999 | 1,413 (29.8%) | 2,299 (30.6%) |
| $500,000 to $749,999 | 285 (6.0%) | 232 (3.1%) |
| $750,000 to $999,999 | 77 (1.6%) | 218 (2.9%) |
| $1,000,000 or more | 11 (0.2%) | 67 (0.9%) |
| Total | 4,734 (100.0%) | 7,522 (100.0%) |
Household Income by Mortgage Status in Nez Perce County
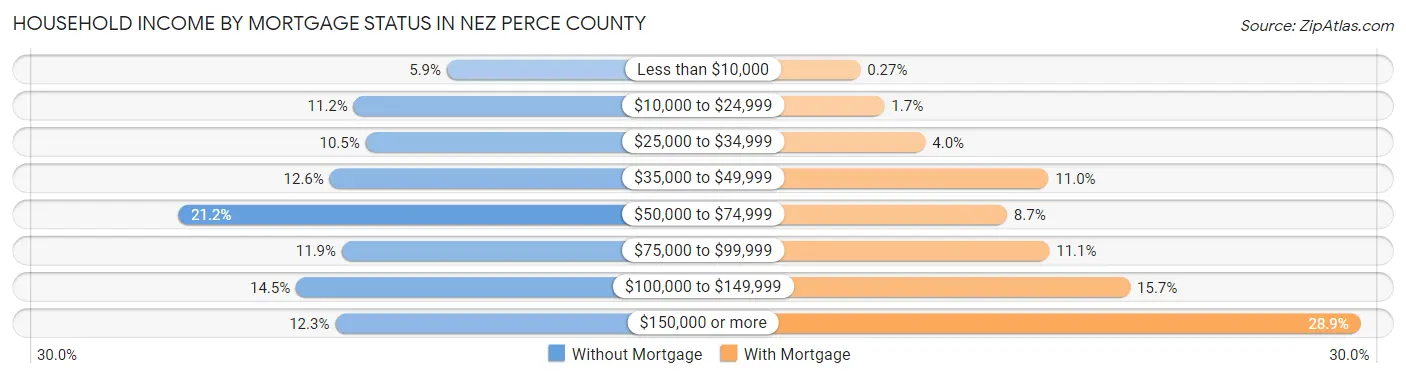
| Household Income | Without Mortgage | With Mortgage |
| Less than $10,000 | 278 (5.9%) | 20 (0.3%) |
| $10,000 to $24,999 | 530 (11.2%) | 124 (1.7%) |
| $25,000 to $34,999 | 498 (10.5%) | 300 (4.0%) |
| $35,000 to $49,999 | 595 (12.6%) | 829 (11.0%) |
| $50,000 to $74,999 | 1,005 (21.2%) | 651 (8.6%) |
| $75,000 to $99,999 | 562 (11.9%) | 833 (11.1%) |
| $100,000 to $149,999 | 686 (14.5%) | 1,180 (15.7%) |
| $150,000 or more | 580 (12.2%) | 2,171 (28.9%) |
| Total | 4,734 (100.0%) | 7,522 (100.0%) |
Property Value to Household Income Ratio in Nez Perce County
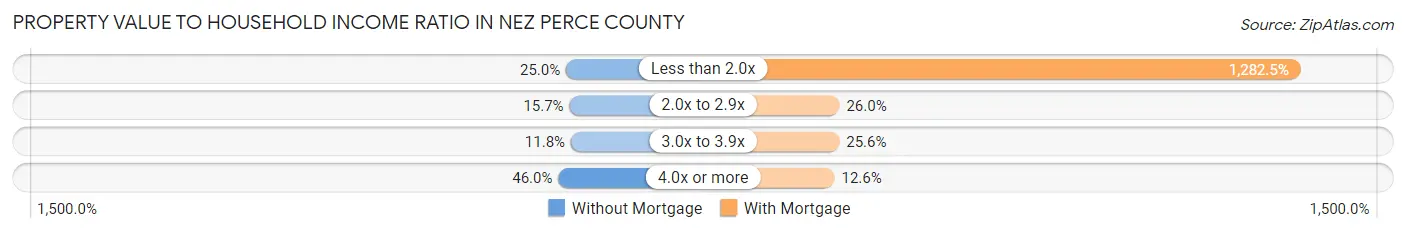
| Value-to-Income Ratio | Without Mortgage | With Mortgage |
| Less than 2.0x | 1,183 (25.0%) | 96,467 (1,282.5%) |
| 2.0x to 2.9x | 745 (15.7%) | 1,959 (26.0%) |
| 3.0x to 3.9x | 559 (11.8%) | 1,922 (25.6%) |
| 4.0x or more | 2,179 (46.0%) | 949 (12.6%) |
| Total | 4,734 (100.0%) | 7,522 (100.0%) |
Real Estate Taxes by Mortgage Status in Nez Perce County
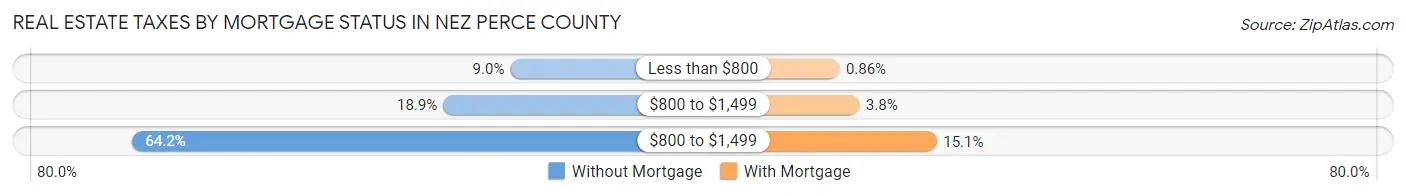
| Property Taxes | Without Mortgage | With Mortgage |
| Less than $800 | 428 (9.0%) | 65 (0.9%) |
| $800 to $1,499 | 893 (18.9%) | 284 (3.8%) |
| $800 to $1,499 | 3,041 (64.2%) | 1,135 (15.1%) |
| Total | 4,734 (100.0%) | 7,522 (100.0%) |
Health & Disability in Nez Perce County
Health Insurance Coverage by Age in Nez Perce County
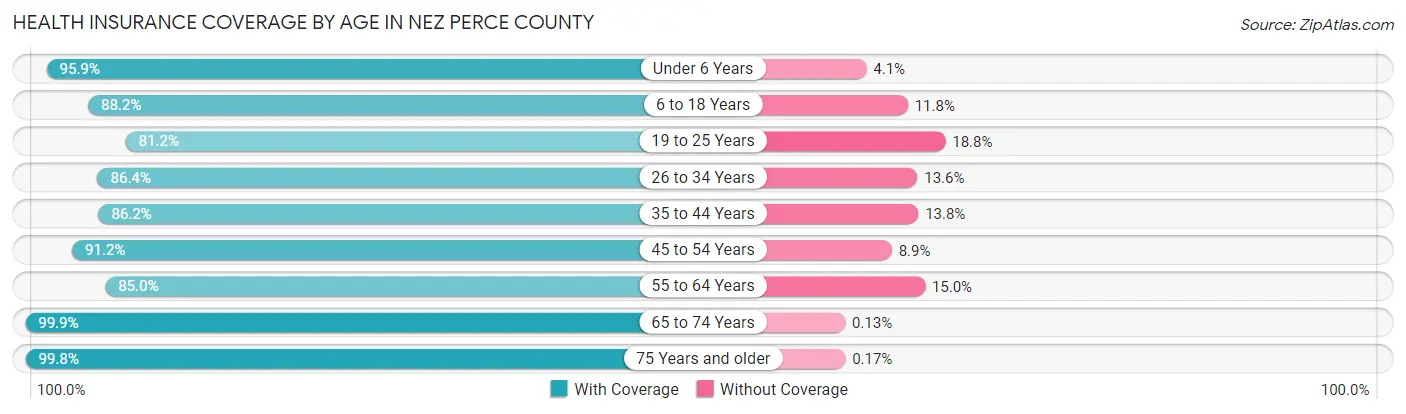
| Age Bracket | With Coverage | Without Coverage |
| Under 6 Years | 2,661 (95.9%) | 114 (4.1%) |
| 6 to 18 Years | 6,013 (88.2%) | 807 (11.8%) |
| 19 to 25 Years | 2,626 (81.2%) | 609 (18.8%) |
| 26 to 34 Years | 4,311 (86.4%) | 680 (13.6%) |
| 35 to 44 Years | 4,253 (86.2%) | 680 (13.8%) |
| 45 to 54 Years | 4,478 (91.1%) | 435 (8.8%) |
| 55 to 64 Years | 4,802 (85.0%) | 850 (15.0%) |
| 65 to 74 Years | 4,534 (99.9%) | 6 (0.1%) |
| 75 Years and older | 3,505 (99.8%) | 6 (0.2%) |
| Total | 37,183 (89.9%) | 4,187 (10.1%) |
Health Insurance Coverage by Citizenship Status in Nez Perce County
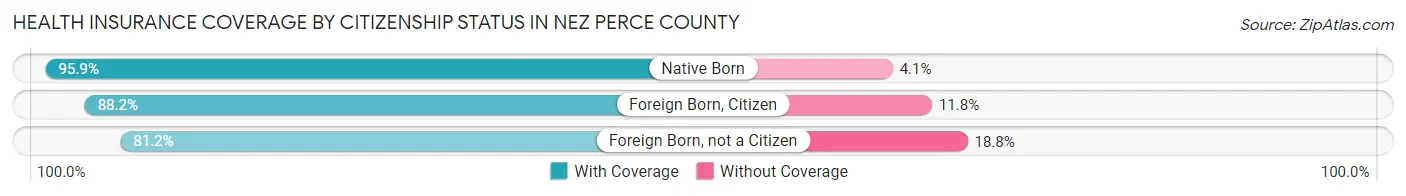
| Citizenship Status | With Coverage | Without Coverage |
| Native Born | 2,661 (95.9%) | 114 (4.1%) |
| Foreign Born, Citizen | 6,013 (88.2%) | 807 (11.8%) |
| Foreign Born, not a Citizen | 2,626 (81.2%) | 609 (18.8%) |
Health Insurance Coverage by Household Income in Nez Perce County
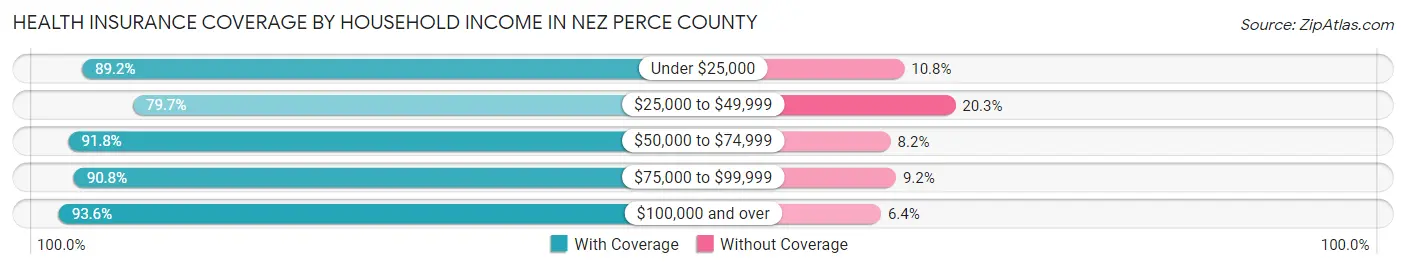
| Household Income | With Coverage | Without Coverage |
| Under $25,000 | 4,624 (89.2%) | 558 (10.8%) |
| $25,000 to $49,999 | 5,487 (79.7%) | 1,400 (20.3%) |
| $50,000 to $74,999 | 5,215 (91.8%) | 467 (8.2%) |
| $75,000 to $99,999 | 5,748 (90.8%) | 584 (9.2%) |
| $100,000 and over | 15,493 (93.6%) | 1,062 (6.4%) |
Public vs Private Health Insurance Coverage by Age in Nez Perce County
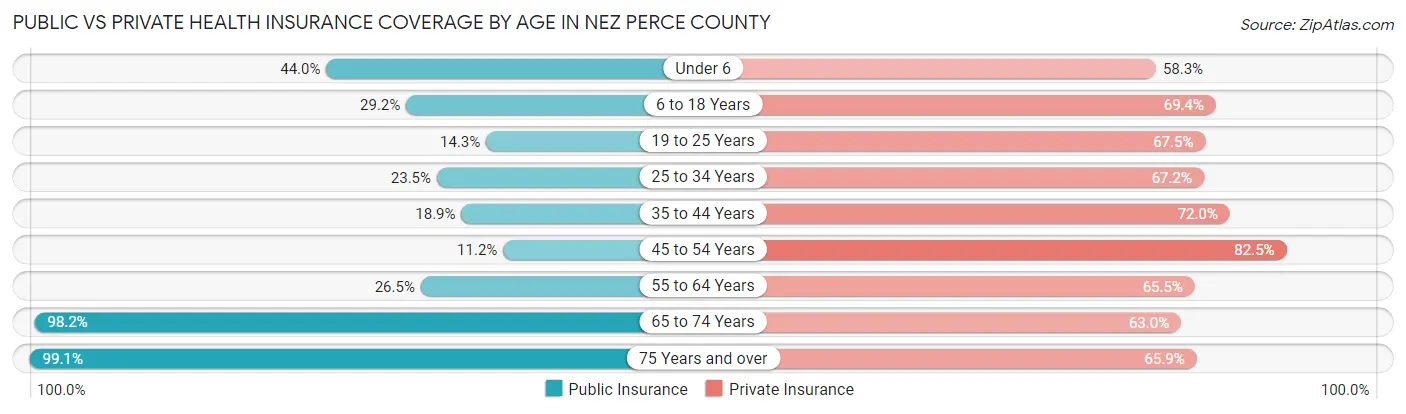
| Age Bracket | Public Insurance | Private Insurance |
| Under 6 | 1,221 (44.0%) | 1,618 (58.3%) |
| 6 to 18 Years | 1,991 (29.2%) | 4,734 (69.4%) |
| 19 to 25 Years | 464 (14.3%) | 2,182 (67.4%) |
| 25 to 34 Years | 1,172 (23.5%) | 3,353 (67.2%) |
| 35 to 44 Years | 934 (18.9%) | 3,552 (72.0%) |
| 45 to 54 Years | 549 (11.2%) | 4,054 (82.5%) |
| 55 to 64 Years | 1,496 (26.5%) | 3,702 (65.5%) |
| 65 to 74 Years | 4,457 (98.2%) | 2,858 (62.9%) |
| 75 Years and over | 3,478 (99.1%) | 2,312 (65.8%) |
| Total | 15,762 (38.1%) | 28,365 (68.6%) |
Disability Status by Sex by Age in Nez Perce County
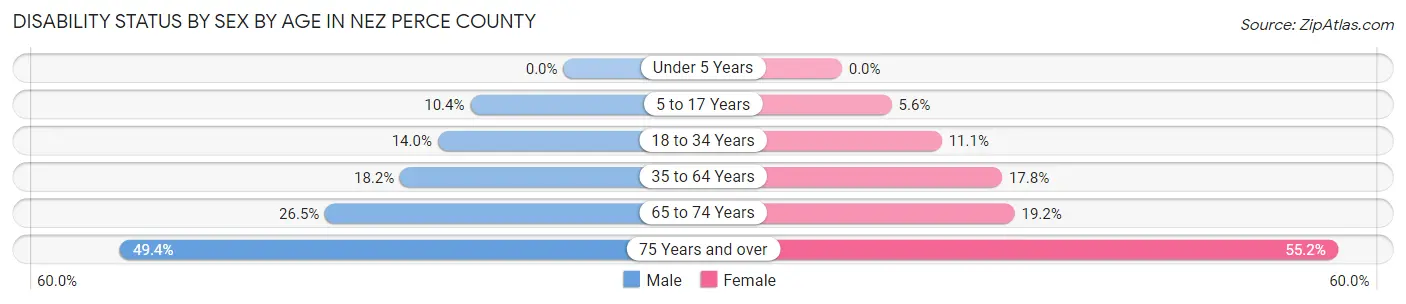
| Age Bracket | Male | Female |
| Under 5 Years | 0 (0.0%) | 0 (0.0%) |
| 5 to 17 Years | 364 (10.4%) | 175 (5.6%) |
| 18 to 34 Years | 621 (14.0%) | 492 (11.1%) |
| 35 to 64 Years | 1,417 (18.2%) | 1,375 (17.8%) |
| 65 to 74 Years | 621 (26.5%) | 423 (19.2%) |
| 75 Years and over | 728 (49.4%) | 1,124 (55.2%) |
Disability Class by Sex by Age in Nez Perce County
Disability Class: Hearing Difficulty
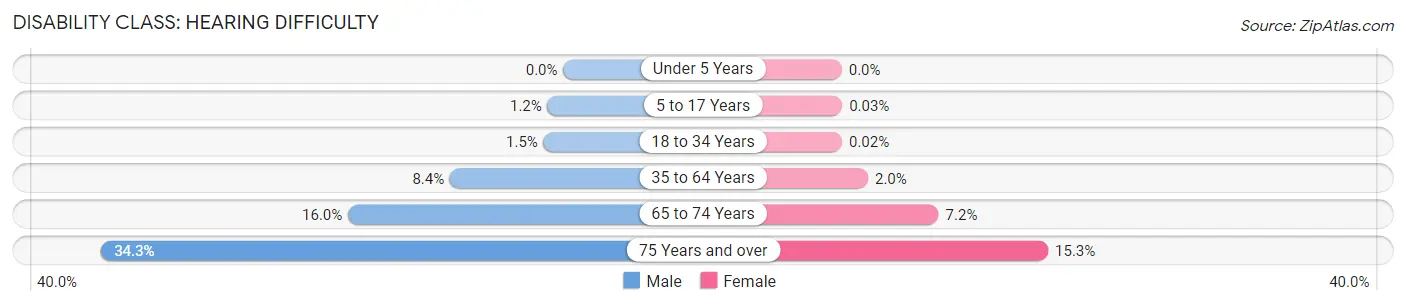
| Age Bracket | Male | Female |
| Under 5 Years | 0 (0.0%) | 0 (0.0%) |
| 5 to 17 Years | 41 (1.2%) | 1 (0.0%) |
| 18 to 34 Years | 65 (1.5%) | 1 (0.0%) |
| 35 to 64 Years | 655 (8.4%) | 150 (1.9%) |
| 65 to 74 Years | 374 (16.0%) | 158 (7.2%) |
| 75 Years and over | 506 (34.3%) | 312 (15.3%) |
Disability Class: Vision Difficulty
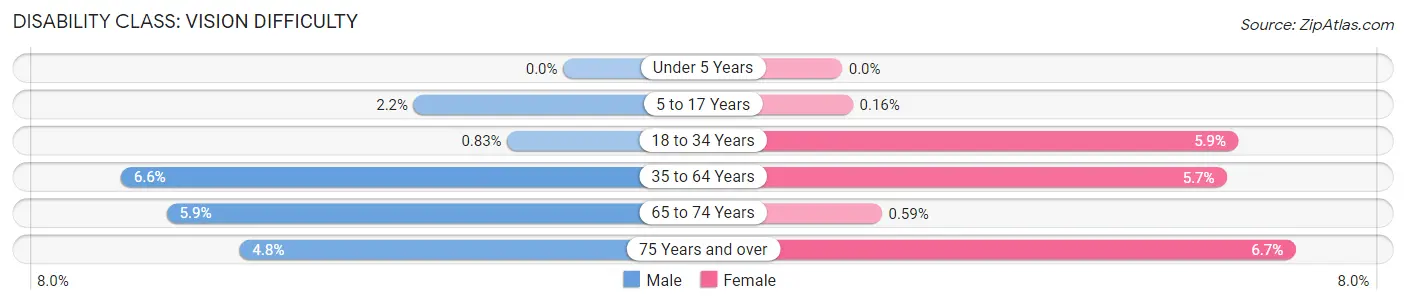
| Age Bracket | Male | Female |
| Under 5 Years | 0 (0.0%) | 0 (0.0%) |
| 5 to 17 Years | 78 (2.2%) | 5 (0.2%) |
| 18 to 34 Years | 37 (0.8%) | 260 (5.9%) |
| 35 to 64 Years | 512 (6.6%) | 440 (5.7%) |
| 65 to 74 Years | 138 (5.9%) | 13 (0.6%) |
| 75 Years and over | 71 (4.8%) | 137 (6.7%) |
Disability Class: Cognitive Difficulty
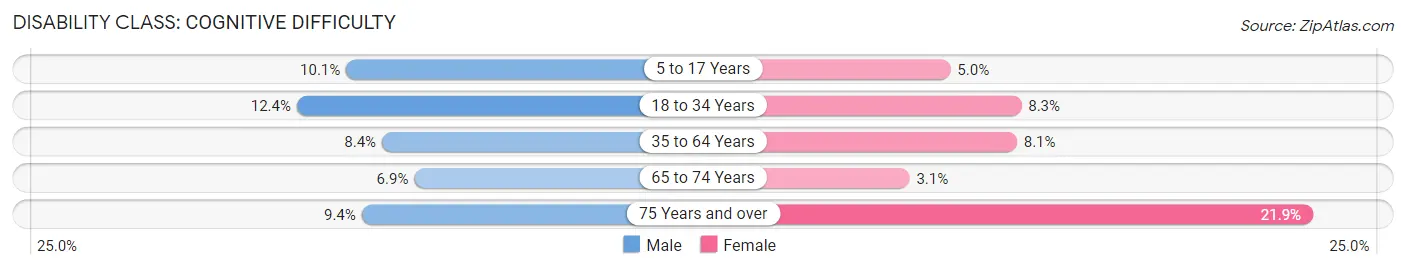
| Age Bracket | Male | Female |
| 5 to 17 Years | 354 (10.1%) | 159 (5.0%) |
| 18 to 34 Years | 549 (12.4%) | 368 (8.3%) |
| 35 to 64 Years | 656 (8.4%) | 626 (8.1%) |
| 65 to 74 Years | 162 (6.9%) | 69 (3.1%) |
| 75 Years and over | 138 (9.4%) | 445 (21.9%) |
Disability Class: Ambulatory Difficulty
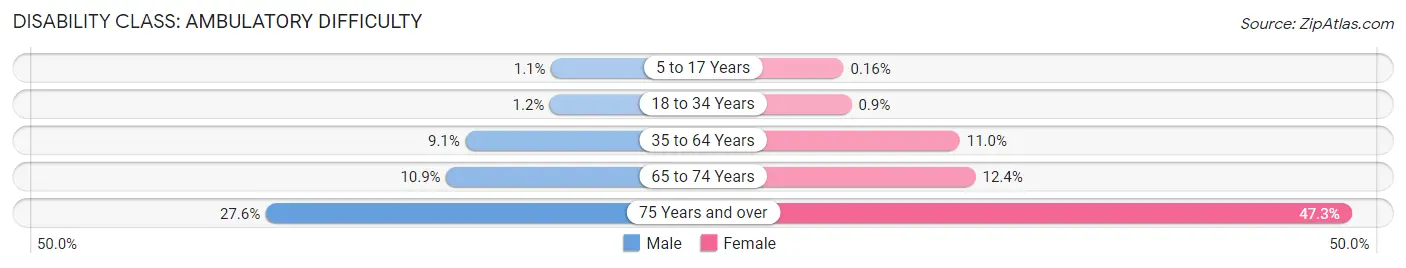
| Age Bracket | Male | Female |
| 5 to 17 Years | 39 (1.1%) | 5 (0.2%) |
| 18 to 34 Years | 54 (1.2%) | 40 (0.9%) |
| 35 to 64 Years | 707 (9.1%) | 844 (11.0%) |
| 65 to 74 Years | 254 (10.8%) | 273 (12.4%) |
| 75 Years and over | 407 (27.6%) | 963 (47.3%) |
Disability Class: Self-Care Difficulty
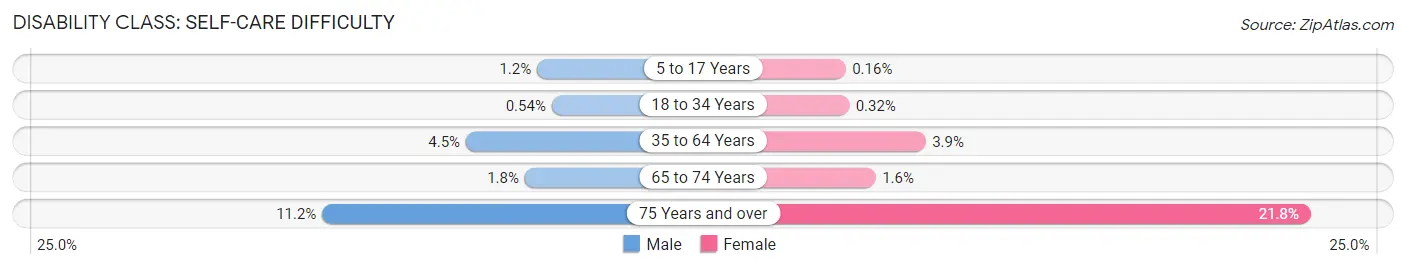
| Age Bracket | Male | Female |
| 5 to 17 Years | 43 (1.2%) | 5 (0.2%) |
| 18 to 34 Years | 24 (0.5%) | 14 (0.3%) |
| 35 to 64 Years | 352 (4.5%) | 298 (3.9%) |
| 65 to 74 Years | 42 (1.8%) | 34 (1.5%) |
| 75 Years and over | 165 (11.2%) | 443 (21.8%) |
Technology Access in Nez Perce County
Computing Device Access in Nez Perce County
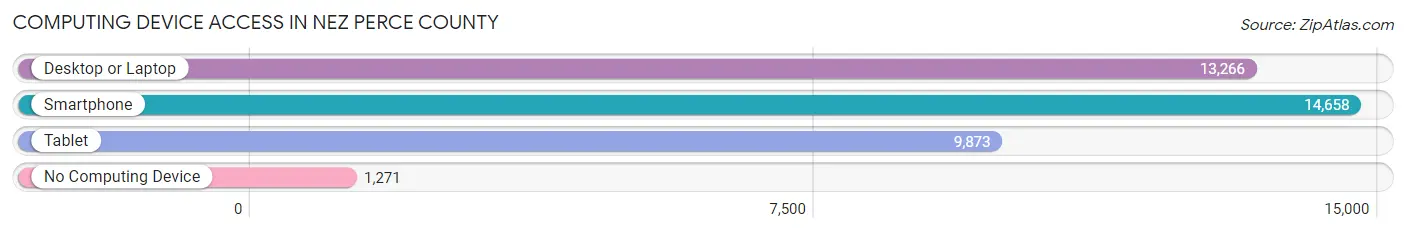
| Device Type | # Households | % Households |
| Desktop or Laptop | 13,266 | 77.5% |
| Smartphone | 14,658 | 85.6% |
| Tablet | 9,873 | 57.7% |
| No Computing Device | 1,271 | 7.4% |
| Total | 17,124 | 100.0% |
Internet Access in Nez Perce County
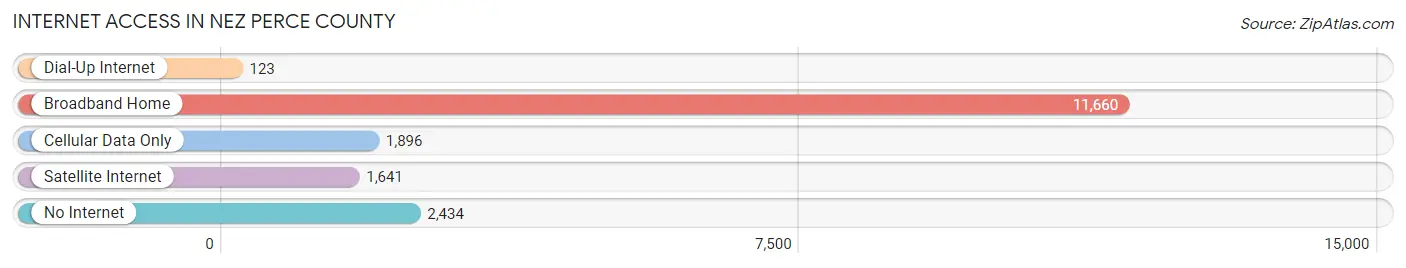
| Internet Type | # Households | % Households |
| Dial-Up Internet | 123 | 0.7% |
| Broadband Home | 11,660 | 68.1% |
| Cellular Data Only | 1,896 | 11.1% |
| Satellite Internet | 1,641 | 9.6% |
| No Internet | 2,434 | 14.2% |
| Total | 17,124 | 100.0% |
Nez Perce County Summary
Nez Perce County is located in the north central region of Idaho, and is bordered by Clearwater County to the north, Lewis County to the east, Adams County to the south, and Washington to the west. The county seat is Lewiston, and the county is named after the Nez Perce Native American tribe. The county has a total area of 2,717 square miles, and a population of 39,265 as of the 2010 census.
History
The Nez Perce tribe has lived in the area for thousands of years, and the county was established in 1861. The county was originally part of Idaho Territory, and was created by the Idaho Territorial Legislature. The county was named after the Nez Perce tribe, and the county seat was established in Lewiston in 1864.
The county was originally home to many Native American tribes, including the Nez Perce, Palouse, Coeur d'Alene, and Spokane. The area was also home to many fur traders and trappers, and the first permanent white settlers arrived in the area in the 1860s. The county was also home to many miners during the gold rush of the late 1800s.
Geography
Nez Perce County is located in the north central region of Idaho, and is bordered by Clearwater County to the north, Lewis County to the east, Adams County to the south, and Washington to the west. The county has a total area of 2,717 square miles, and is located in the Palouse region of Idaho. The county is mostly mountainous, with the Clearwater Mountains to the north and the Bitterroot Mountains to the south. The county is also home to many rivers and streams, including the Clearwater River, Snake River, and Salmon River.
The county is home to many parks and recreation areas, including Hells Gate State Park, Nez Perce National Historical Park, and the Nez Perce National Forest. The county is also home to many lakes, including Dworshak Reservoir, Lake Walcott, and Lake Lowell.
Economy
Nez Perce County has a diverse economy, with a variety of industries and businesses. The county is home to many agricultural operations, including cattle, dairy, and wheat farming. The county is also home to many manufacturing and technology companies, including Boise Cascade, Hewlett-Packard, and Micron Technology. The county is also home to many retail and service businesses, including restaurants, hotels, and stores.
The county is also home to many government and military operations, including the Lewiston Air Force Base and the Nez Perce National Forest. The county is also home to many educational institutions, including Lewis-Clark State College and the University of Idaho.
Demographics
As of the 2010 census, Nez Perce County had a population of 39,265. The population was spread out, with 24.3% under the age of 18, 10.2% from 18 to 24, 25.2% from 25 to 44, 24.3% from 45 to 64, and 15.9% who were 65 years of age or older. The median age was 37.7 years.
The racial makeup of the county was 87.2% White, 0.7% African American, 1.3% Native American, 0.7% Asian, 0.1% Pacific Islander, 7.2% from other races, and 3.0% from two or more races. Hispanic or Latino of any race were 11.2% of the population.
The median income for a household in the county was $37,945, and the median income for a family was $45,945. The per capita income for the county was $19,945. About 13.2% of families and 17.2% of the population were below the poverty line, including 22.2% of those under age 18 and 8.2% of those age 65 or over.
Common Questions
What is the Total Population of Nez Perce County?
Total Population of Nez Perce County is 42,200.
What is the Total Male Population of Nez Perce County?
Total Male Population of Nez Perce County is 21,000.
What is the Total Female Population of Nez Perce County?
Total Female Population of Nez Perce County is 21,200.
What is the Ratio of Males per 100 Females in Nez Perce County?
There are 99.06 Males per 100 Females in Nez Perce County.
What is the Ratio of Females per 100 Males in Nez Perce County?
There are 100.95 Females per 100 Males in Nez Perce County.
What is the Median Population Age in Nez Perce County?
Median Population Age in Nez Perce County is 40.7 Years.
What is the Average Family Size in Nez Perce County
Average Family Size in Nez Perce County is 2.9 People.
What is the Average Household Size in Nez Perce County
Average Household Size in Nez Perce County is 2.4 People.
What is Per Capita Income in Nez Perce County?
Per Capita income in Nez Perce County is $35,387.
What is the Median Family Income in Nez Perce County?
Median Family Income in Nez Perce County is $88,522.
What is the Median Household income in Nez Perce County?
Median Household Income in Nez Perce County is $65,023.
What is Income or Wage Gap in Nez Perce County?
Income or Wage Gap in Nez Perce County is 30.4%.
Women in Nez Perce County earn 69.6 cents for every dollar earned by a man.
What is Family Income Deficit in Nez Perce County?
Family Income Deficit in Nez Perce County is $11,598.
Families that are below poverty line in Nez Perce County earn $11,598 less on average than the poverty threshold level.
What is Inequality or Gini Index in Nez Perce County?
Inequality or Gini Index in Nez Perce County is 0.46.
How Large is the Labor Force in Nez Perce County?
There are 20,570 People in the Labor Forcein in Nez Perce County.
What is the Percentage of People in the Labor Force in Nez Perce County?
60.3% of People are in the Labor Force in Nez Perce County.
What is the Unemployment Rate in Nez Perce County?
Unemployment Rate in Nez Perce County is 3.2%.