Minidoka County, ID
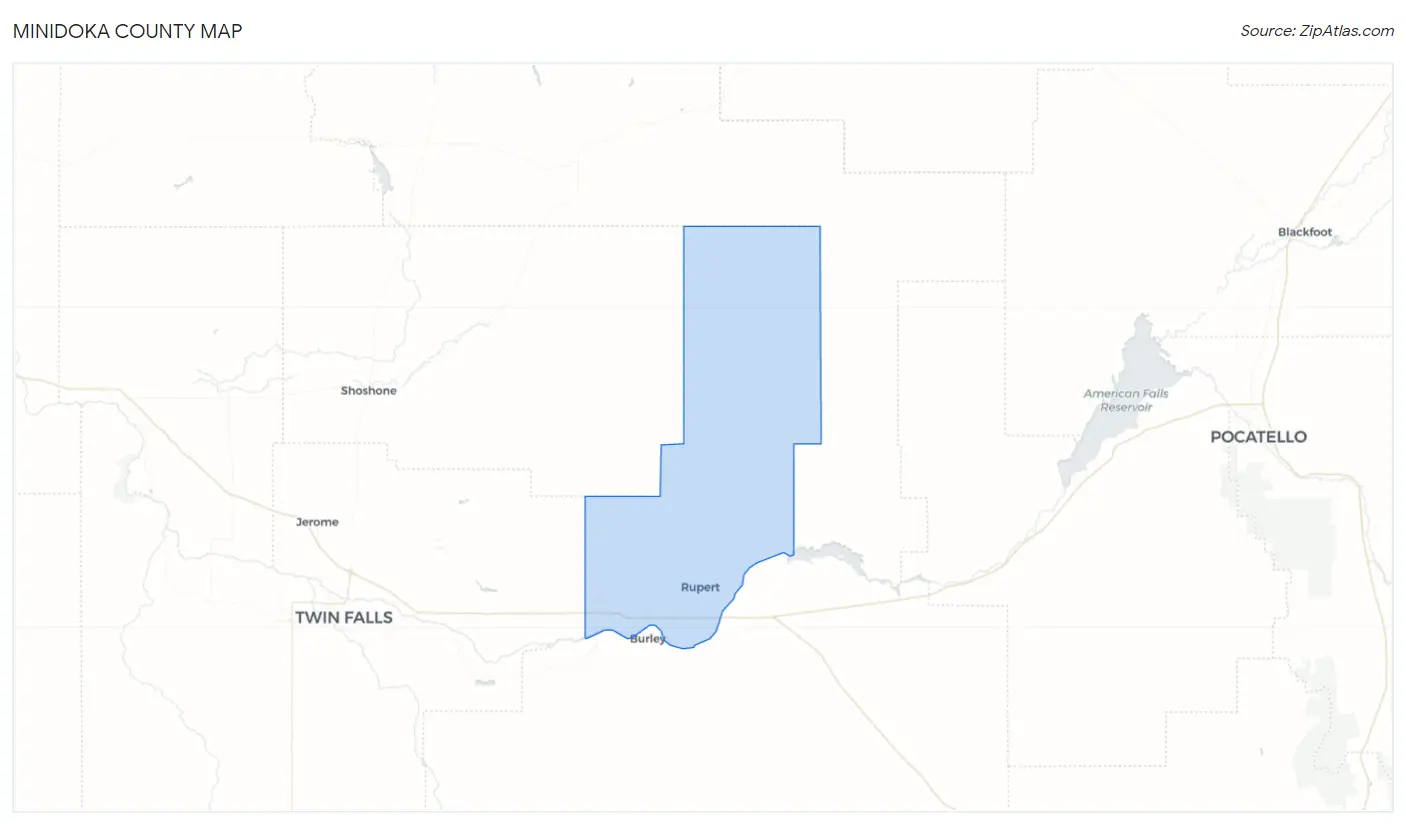
Minidoka County Map
Minidoka County Overview
21,626
TOTAL POPULATION
10,930
MALE POPULATION
10,696
FEMALE POPULATION
102.19
MALES / 100 FEMALES
97.86
FEMALES / 100 MALES
34.9
MEDIAN AGE
3.4
AVG FAMILY SIZE
2.9
AVG HOUSEHOLD SIZE
$29,561
PER CAPITA INCOME
$71,522
AVG FAMILY INCOME
$63,594
AVG HOUSEHOLD INCOME
47.9%
WAGE / INCOME GAP [ % ]
52.1¢/ $1
WAGE / INCOME GAP [ $ ]
0.43
INEQUALITY / GINI INDEX
10,406
LABOR FORCE [ PEOPLE ]
64.6%
PERCENT IN LABOR FORCE
3.3%
UNEMPLOYMENT RATE
Minidoka County Area Codes
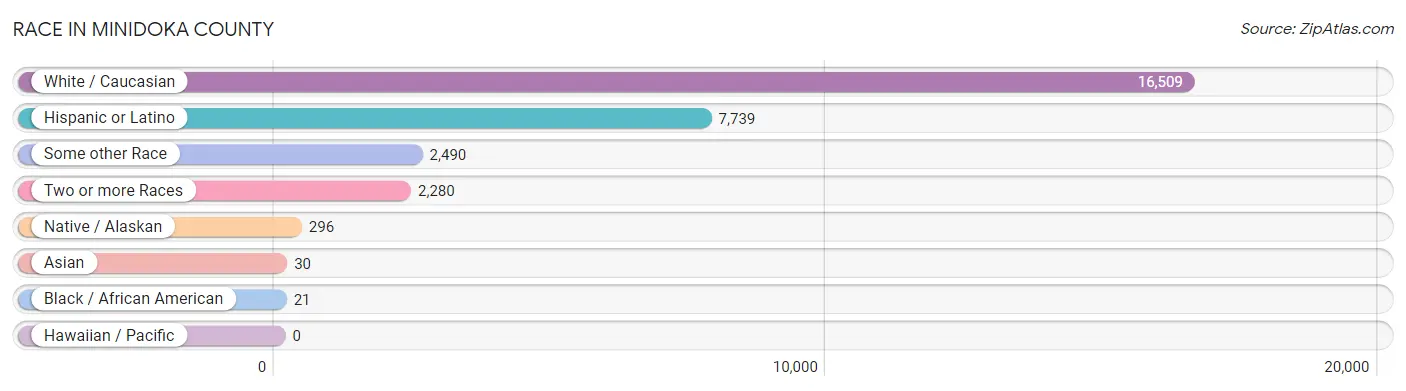
Race in Minidoka County
The most populous races in Minidoka County are White / Caucasian (16,509 | 76.3%), Hispanic or Latino (7,739 | 35.8%), and Some other Race (2,490 | 11.5%).
| Race | # Population | % Population |
| Asian | 30 | 0.1% |
| Black / African American | 21 | 0.1% |
| Hawaiian / Pacific | 0 | 0.0% |
| Hispanic or Latino | 7,739 | 35.8% |
| Native / Alaskan | 296 | 1.4% |
| White / Caucasian | 16,509 | 76.3% |
| Two or more Races | 2,280 | 10.5% |
| Some other Race | 2,490 | 11.5% |
| Total | 21,626 | 100.0% |
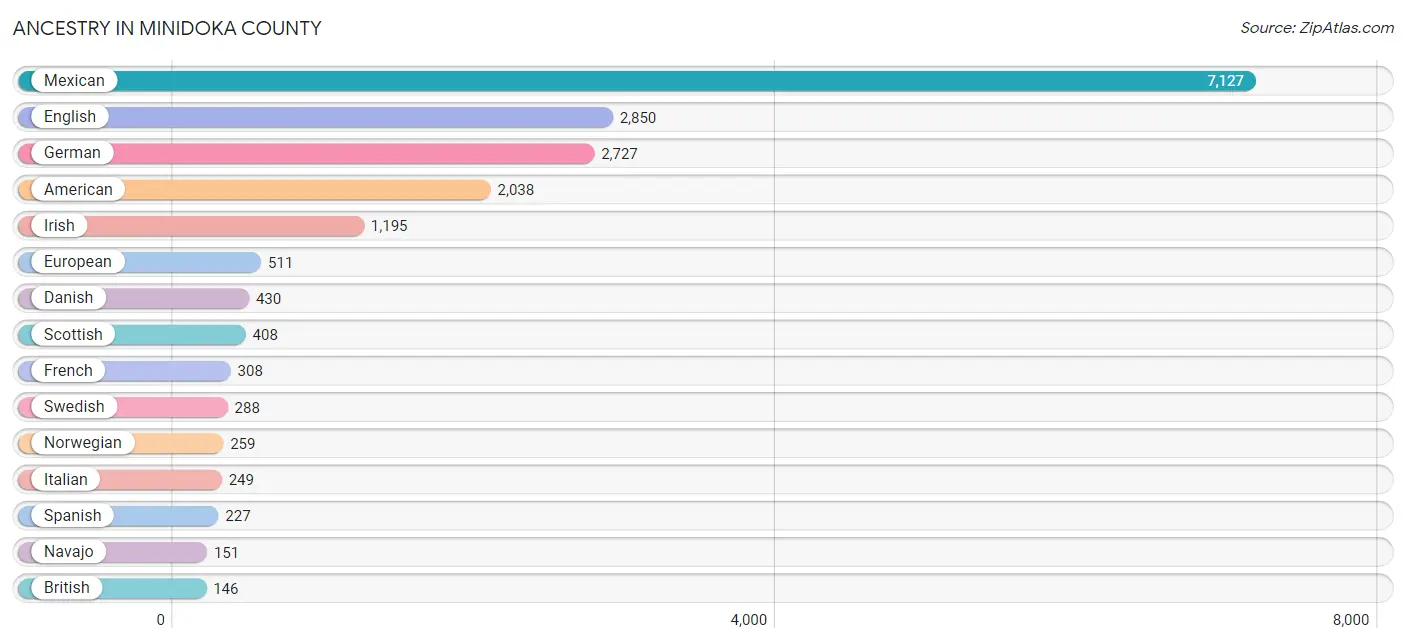
Ancestry in Minidoka County
The most populous ancestries reported in Minidoka County are Mexican (7,127 | 33.0%), English (2,850 | 13.2%), German (2,727 | 12.6%), American (2,038 | 9.4%), and Irish (1,195 | 5.5%), together accounting for 73.7% of all Minidoka County residents.
| Ancestry | # Population | % Population |
| American | 2,038 | 9.4% |
| Apache | 2 | 0.0% |
| Argentinean | 29 | 0.1% |
| Basque | 80 | 0.4% |
| Belgian | 6 | 0.0% |
| Bhutanese | 47 | 0.2% |
| British | 146 | 0.7% |
| Canadian | 14 | 0.1% |
| Central American | 32 | 0.2% |
| Cherokee | 32 | 0.2% |
| Chilean | 9 | 0.0% |
| Colville | 6 | 0.0% |
| Croatian | 24 | 0.1% |
| Cuban | 1 | 0.0% |
| Czech | 2 | 0.0% |
| Danish | 430 | 2.0% |
| Dutch | 100 | 0.5% |
| Eastern European | 25 | 0.1% |
| English | 2,850 | 13.2% |
| European | 511 | 2.4% |
| French | 308 | 1.4% |
| French American Indian | 6 | 0.0% |
| French Canadian | 33 | 0.2% |
| German | 2,727 | 12.6% |
| German Russian | 22 | 0.1% |
| Greek | 31 | 0.1% |
| Honduran | 32 | 0.2% |
| Hungarian | 2 | 0.0% |
| Indonesian | 20 | 0.1% |
| Irish | 1,195 | 5.5% |
| Iroquois | 22 | 0.1% |
| Italian | 249 | 1.1% |
| Jamaican | 3 | 0.0% |
| Korean | 50 | 0.2% |
| Mexican | 7,127 | 33.0% |
| Mexican American Indian | 107 | 0.5% |
| Navajo | 151 | 0.7% |
| Northern European | 62 | 0.3% |
| Norwegian | 259 | 1.2% |
| Pakistani | 59 | 0.3% |
| Polish | 116 | 0.5% |
| Portuguese | 21 | 0.1% |
| Puerto Rican | 43 | 0.2% |
| Russian | 60 | 0.3% |
| Samoan | 6 | 0.0% |
| Scandinavian | 43 | 0.2% |
| Scotch-Irish | 141 | 0.6% |
| Scottish | 408 | 1.9% |
| Shoshone | 16 | 0.1% |
| Sioux | 99 | 0.5% |
| Slovak | 17 | 0.1% |
| South American | 38 | 0.2% |
| Spaniard | 12 | 0.1% |
| Spanish | 227 | 1.1% |
| Swedish | 288 | 1.3% |
| Swiss | 145 | 0.7% |
| Ukrainian | 16 | 0.1% |
| Welsh | 140 | 0.6% |
| West Indian | 3 | 0.0% |
| Yugoslavian | 6 | 0.0% | View All 60 Rows |
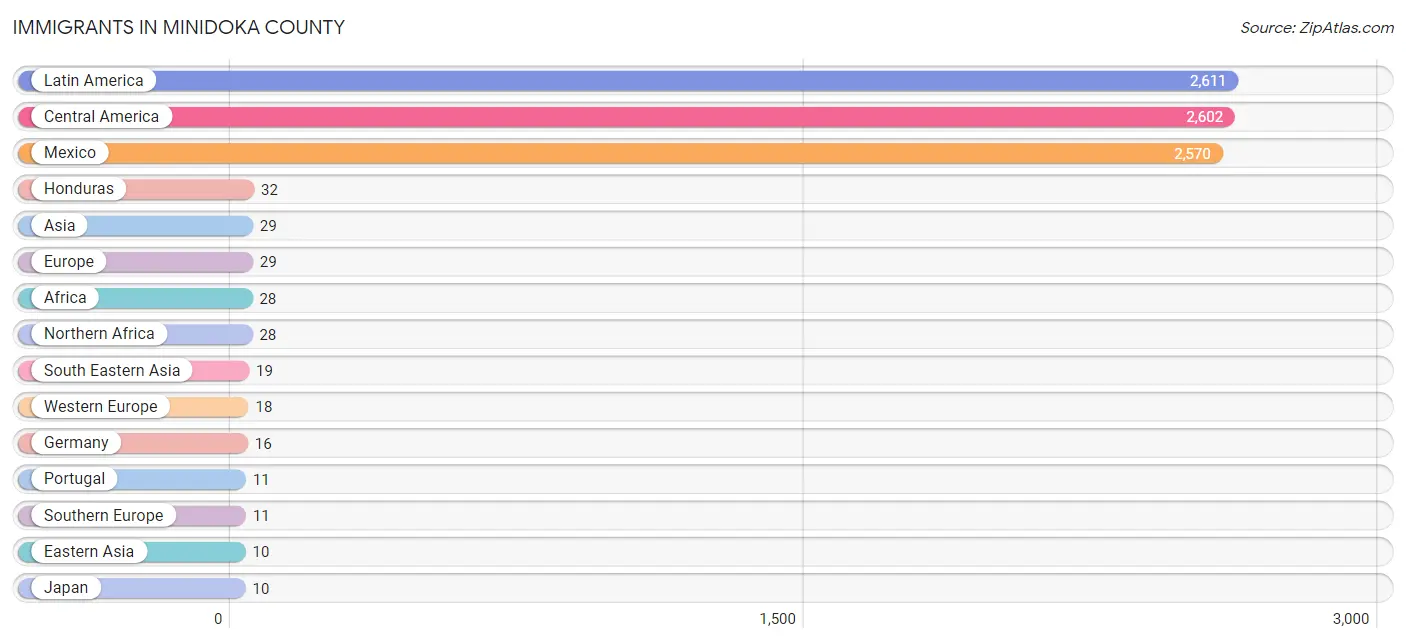
Immigrants in Minidoka County
The most numerous immigrant groups reported in Minidoka County came from Latin America (2,611 | 12.1%), Central America (2,602 | 12.0%), Mexico (2,570 | 11.9%), Honduras (32 | 0.2%), and Asia (29 | 0.1%), together accounting for 36.3% of all Minidoka County residents.
| Immigration Origin | # Population | % Population |
| Africa | 28 | 0.1% |
| Asia | 29 | 0.1% |
| Canada | 3 | 0.0% |
| Central America | 2,602 | 12.0% |
| Chile | 9 | 0.0% |
| Eastern Asia | 10 | 0.1% |
| Europe | 29 | 0.1% |
| Germany | 16 | 0.1% |
| Honduras | 32 | 0.2% |
| Japan | 10 | 0.1% |
| Latin America | 2,611 | 12.1% |
| Mexico | 2,570 | 11.9% |
| Netherlands | 2 | 0.0% |
| Northern Africa | 28 | 0.1% |
| Portugal | 11 | 0.1% |
| South America | 9 | 0.0% |
| South Eastern Asia | 19 | 0.1% |
| Southern Europe | 11 | 0.1% |
| Thailand | 9 | 0.0% |
| Western Europe | 18 | 0.1% | View All 20 Rows |
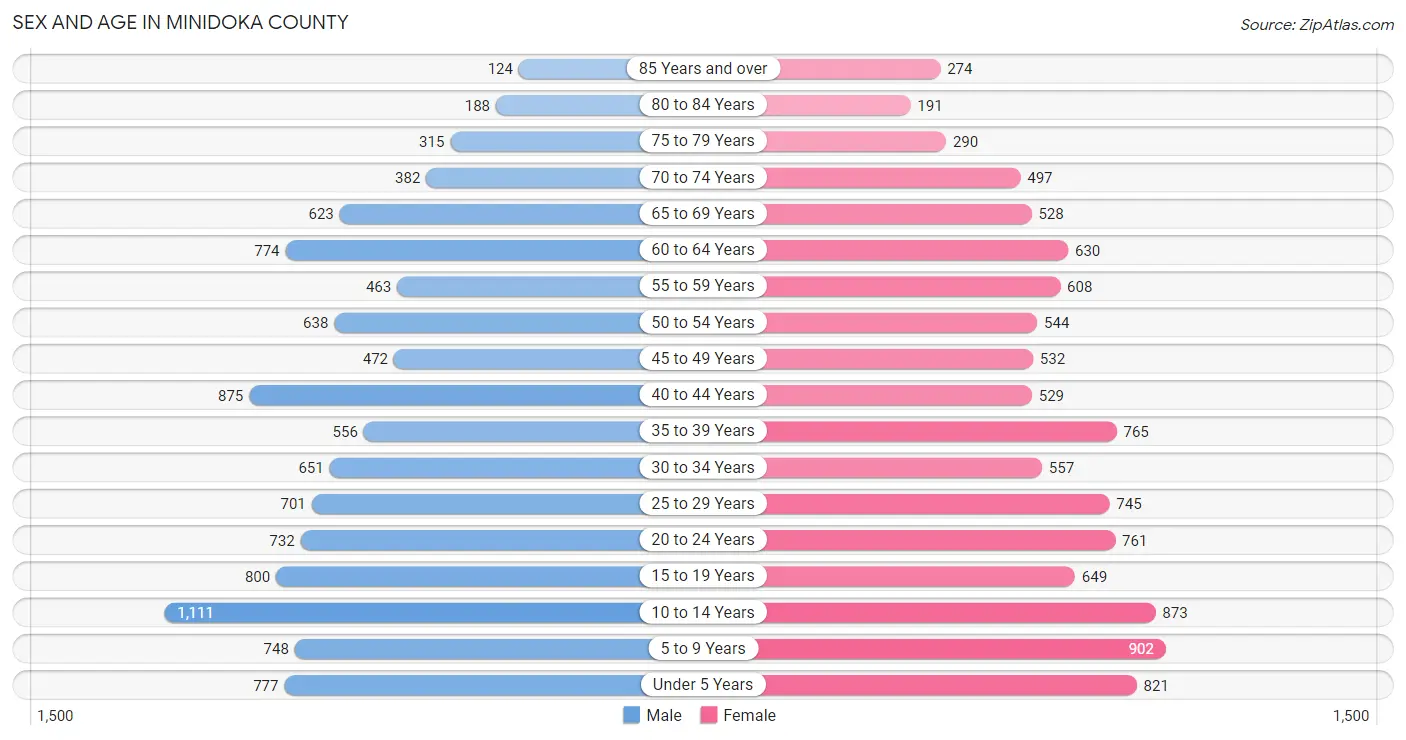
Sex and Age in Minidoka County
Sex and Age in Minidoka County
The most populous age groups in Minidoka County are 10 to 14 Years (1,111 | 10.2%) for men and 5 to 9 Years (902 | 8.4%) for women.
| Age Bracket | Male | Female |
| Under 5 Years | 777 (7.1%) | 821 (7.7%) |
| 5 to 9 Years | 748 (6.8%) | 902 (8.4%) |
| 10 to 14 Years | 1,111 (10.2%) | 873 (8.2%) |
| 15 to 19 Years | 800 (7.3%) | 649 (6.1%) |
| 20 to 24 Years | 732 (6.7%) | 761 (7.1%) |
| 25 to 29 Years | 701 (6.4%) | 745 (7.0%) |
| 30 to 34 Years | 651 (6.0%) | 557 (5.2%) |
| 35 to 39 Years | 556 (5.1%) | 765 (7.1%) |
| 40 to 44 Years | 875 (8.0%) | 529 (5.0%) |
| 45 to 49 Years | 472 (4.3%) | 532 (5.0%) |
| 50 to 54 Years | 638 (5.8%) | 544 (5.1%) |
| 55 to 59 Years | 463 (4.2%) | 608 (5.7%) |
| 60 to 64 Years | 774 (7.1%) | 630 (5.9%) |
| 65 to 69 Years | 623 (5.7%) | 528 (4.9%) |
| 70 to 74 Years | 382 (3.5%) | 497 (4.6%) |
| 75 to 79 Years | 315 (2.9%) | 290 (2.7%) |
| 80 to 84 Years | 188 (1.7%) | 191 (1.8%) |
| 85 Years and over | 124 (1.1%) | 274 (2.6%) |
| Total | 10,930 (100.0%) | 10,696 (100.0%) |
Families and Households in Minidoka County
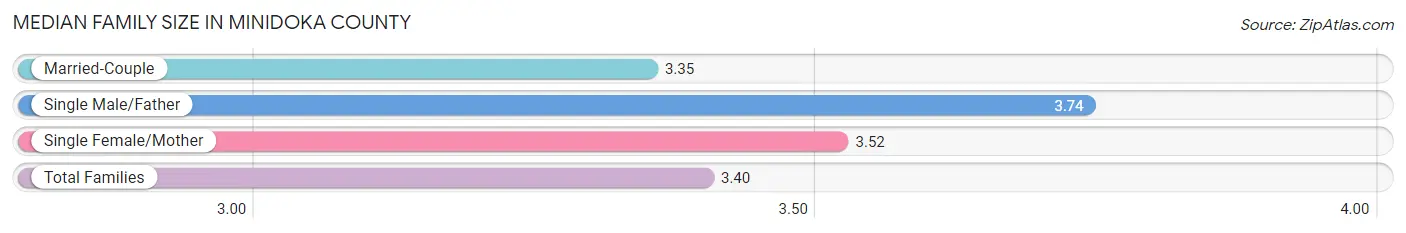
Median Family Size in Minidoka County
The median family size in Minidoka County is 3.40 persons per family, with single male/father families (430 | 7.9%) accounting for the largest median family size of 3.74 persons per family. On the other hand, married-couple families (4,369 | 80.4%) represent the smallest median family size with 3.35 persons per family.
| Family Type | # Families | Family Size |
| Married-Couple | 4,369 (80.4%) | 3.35 |
| Single Male/Father | 430 (7.9%) | 3.74 |
| Single Female/Mother | 637 (11.7%) | 3.52 |
| Total Families | 5,436 (100.0%) | 3.40 |
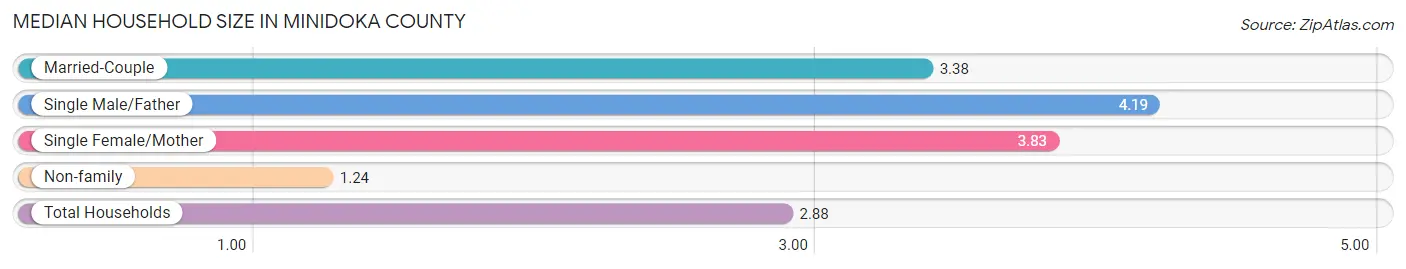
Median Household Size in Minidoka County
The median household size in Minidoka County is 2.88 persons per household, with single male/father households (430 | 5.8%) accounting for the largest median household size of 4.19 persons per household. non-family households (2,038 | 27.3%) represent the smallest median household size with 1.24 persons per household.
| Household Type | # Households | Household Size |
| Married-Couple | 4,369 (58.5%) | 3.38 |
| Single Male/Father | 430 (5.8%) | 4.19 |
| Single Female/Mother | 637 (8.5%) | 3.83 |
| Non-family | 2,038 (27.3%) | 1.24 |
| Total Households | 7,474 (100.0%) | 2.88 |
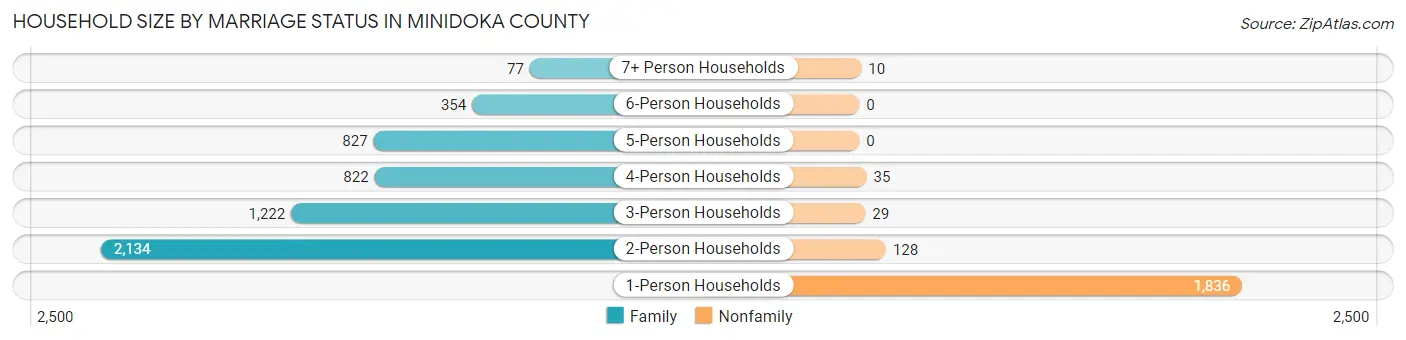
Household Size by Marriage Status in Minidoka County
Out of a total of 7,474 households in Minidoka County, 5,436 (72.7%) are family households, while 2,038 (27.3%) are nonfamily households. The most numerous type of family households are 2-person households, comprising 2,134, and the most common type of nonfamily households are 1-person households, comprising 1,836.
| Household Size | Family Households | Nonfamily Households |
| 1-Person Households | - | 1,836 (24.6%) |
| 2-Person Households | 2,134 (28.5%) | 128 (1.7%) |
| 3-Person Households | 1,222 (16.4%) | 29 (0.4%) |
| 4-Person Households | 822 (11.0%) | 35 (0.5%) |
| 5-Person Households | 827 (11.1%) | 0 (0.0%) |
| 6-Person Households | 354 (4.7%) | 0 (0.0%) |
| 7+ Person Households | 77 (1.0%) | 10 (0.1%) |
| Total | 5,436 (72.7%) | 2,038 (27.3%) |
Female Fertility in Minidoka County
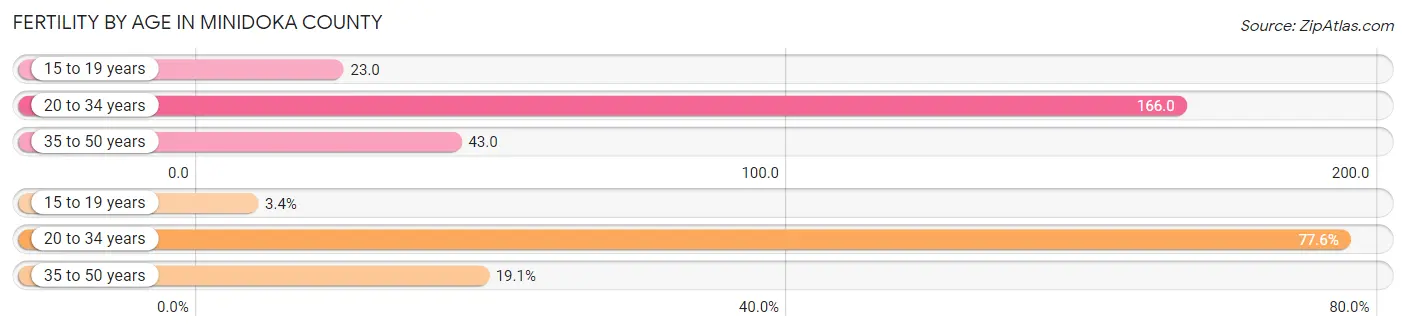
Fertility by Age in Minidoka County
Average fertility rate in Minidoka County is 94.0 births per 1,000 women. Women in the age bracket of 20 to 34 years have the highest fertility rate with 166.0 births per 1,000 women. Women in the age bracket of 20 to 34 years acount for 77.5% of all women with births.
| Age Bracket | Women with Births | Births / 1,000 Women |
| 15 to 19 years | 15 (3.4%) | 23.0 |
| 20 to 34 years | 342 (77.5%) | 166.0 |
| 35 to 50 years | 84 (19.1%) | 43.0 |
| Total | 441 (100.0%) | 94.0 |
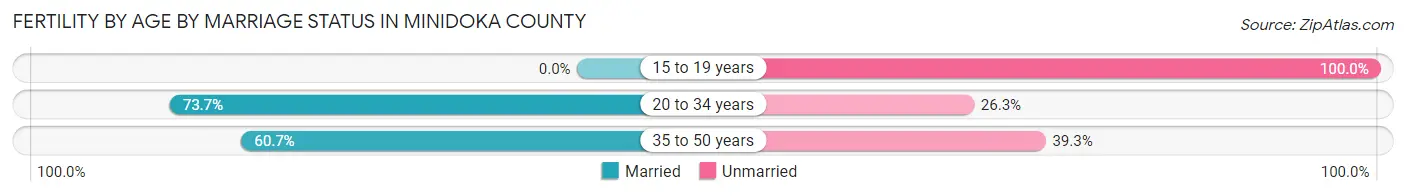
Fertility by Age by Marriage Status in Minidoka County
68.7% of women with births (441) in Minidoka County are married. The highest percentage of unmarried women with births falls into 15 to 19 years age bracket with 100.0% of them unmarried at the time of birth, while the lowest percentage of unmarried women with births belong to 20 to 34 years age bracket with 26.3% of them unmarried.
| Age Bracket | Married | Unmarried |
| 15 to 19 years | 0 (0.0%) | 15 (100.0%) |
| 20 to 34 years | 252 (73.7%) | 90 (26.3%) |
| 35 to 50 years | 51 (60.7%) | 33 (39.3%) |
| Total | 303 (68.7%) | 138 (31.3%) |
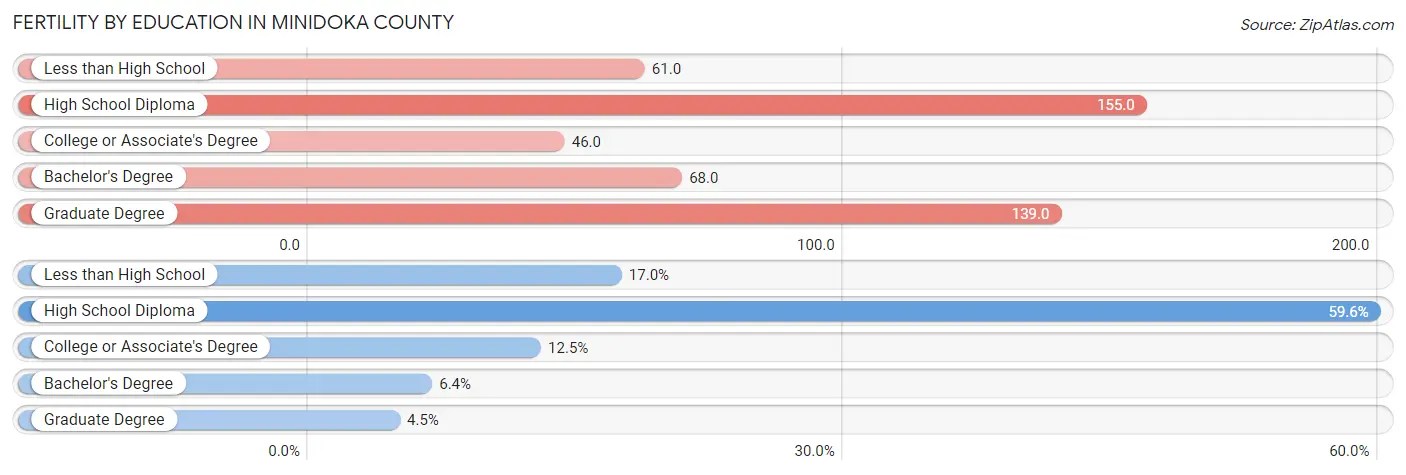
Fertility by Education in Minidoka County
Average fertility rate in Minidoka County is 94.0 births per 1,000 women. Women with the education attainment of high school diploma have the highest fertility rate of 155.0 births per 1,000 women, while women with the education attainment of college or associate's degree have the lowest fertility at 46.0 births per 1,000 women. Women with the education attainment of high school diploma represent 59.6% of all women with births.
| Educational Attainment | Women with Births | Births / 1,000 Women |
| Less than High School | 75 (17.0%) | 61.0 |
| High School Diploma | 263 (59.6%) | 155.0 |
| College or Associate's Degree | 55 (12.5%) | 46.0 |
| Bachelor's Degree | 28 (6.4%) | 68.0 |
| Graduate Degree | 20 (4.5%) | 139.0 |
| Total | 441 (100.0%) | 94.0 |
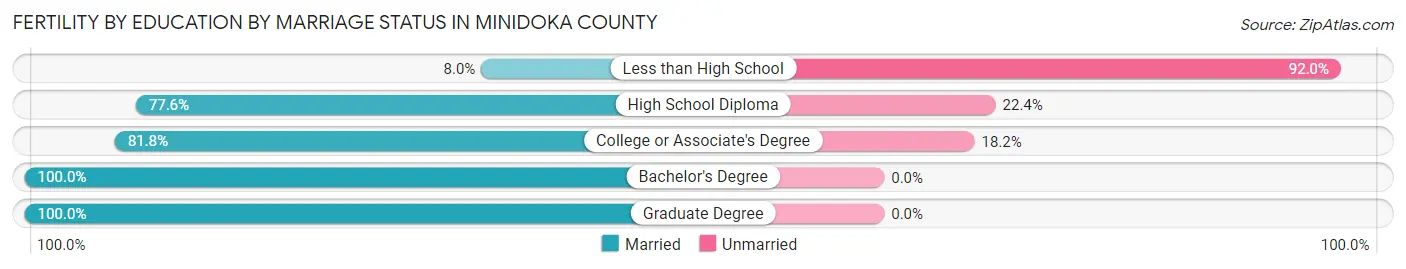
Fertility by Education by Marriage Status in Minidoka County
31.3% of women with births in Minidoka County are unmarried. Women with the educational attainment of bachelor's degree are most likely to be married with 100.0% of them married at childbirth, while women with the educational attainment of less than high school are least likely to be married with 92.0% of them unmarried at childbirth.
| Educational Attainment | Married | Unmarried |
| Less than High School | 6 (8.0%) | 69 (92.0%) |
| High School Diploma | 204 (77.6%) | 59 (22.4%) |
| College or Associate's Degree | 45 (81.8%) | 10 (18.2%) |
| Bachelor's Degree | 28 (100.0%) | 0 (0.0%) |
| Graduate Degree | 20 (100.0%) | 0 (0.0%) |
| Total | 303 (68.7%) | 138 (31.3%) |
Income in Minidoka County
Income Overview in Minidoka County
Per Capita Income in Minidoka County is $29,561, while median incomes of families and households are $71,522 and $63,594 respectively.
| Characteristic | Number | Measure |
| Per Capita Income | 21,626 | $29,561 |
| Median Family Income | 5,436 | $71,522 |
| Mean Family Income | 5,436 | $89,954 |
| Median Household Income | 7,474 | $63,594 |
| Mean Household Income | 7,474 | $80,532 |
| Income Deficit | 5,436 | $0 |
| Wage / Income Gap (%) | 21,626 | 47.89% |
| Wage / Income Gap ($) | 21,626 | 52.11¢ per $1 |
| Gini / Inequality Index | 21,626 | 0.43 |
Earnings by Sex in Minidoka County
Average Earnings in Minidoka County are $35,437, $46,071 for men and $24,007 for women, a difference of 47.9%.
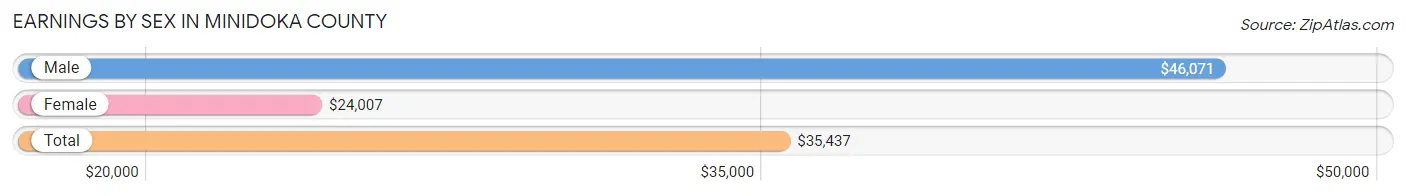
| Sex | Number | Average Earnings |
| Male | 6,101 (55.9%) | $46,071 |
| Female | 4,821 (44.1%) | $24,007 |
| Total | 10,922 (100.0%) | $35,437 |
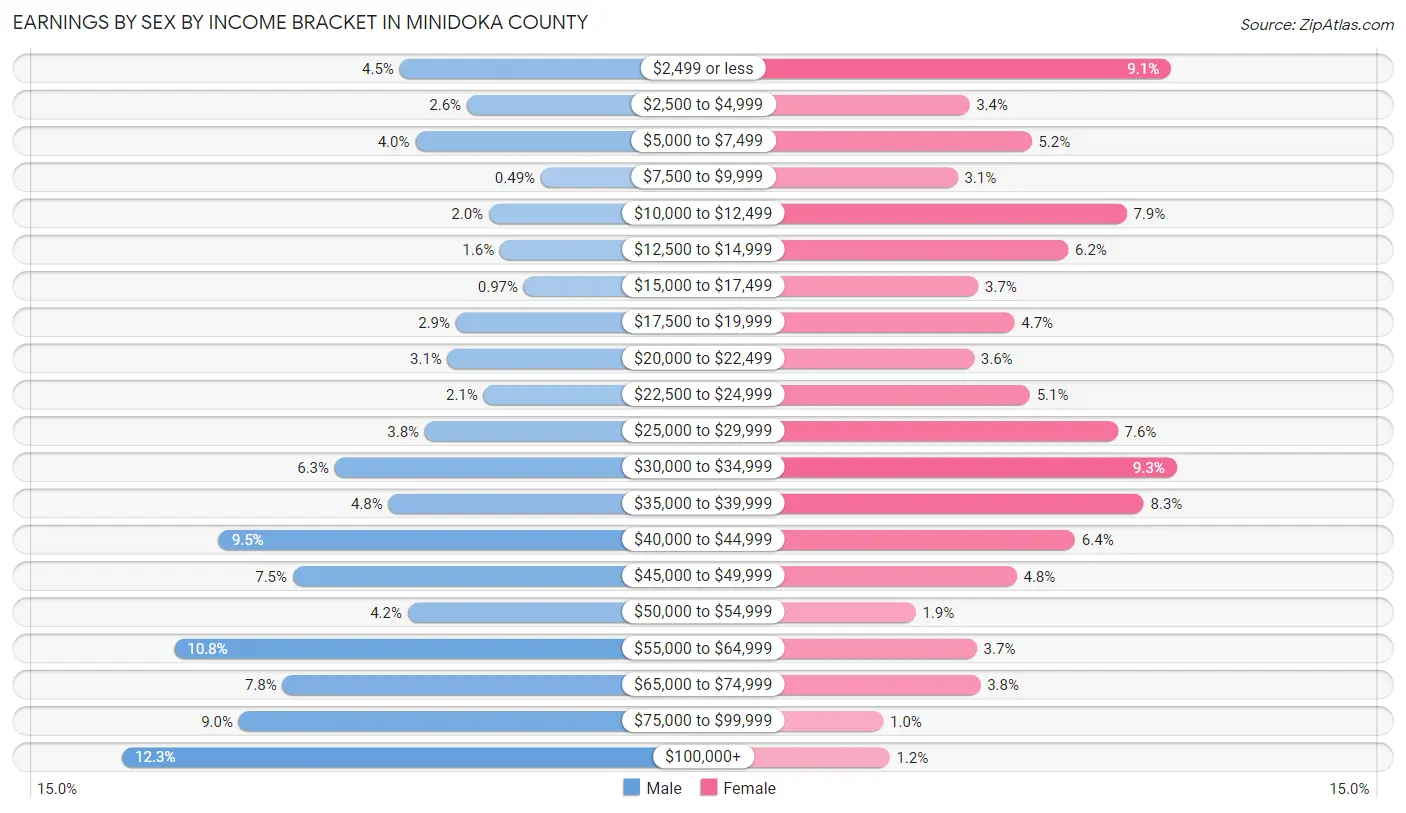
Earnings by Sex by Income Bracket in Minidoka County
The most common earnings brackets in Minidoka County are $100,000+ for men (748 | 12.3%) and $30,000 to $34,999 for women (447 | 9.3%).
| Income | Male | Female |
| $2,499 or less | 272 (4.5%) | 439 (9.1%) |
| $2,500 to $4,999 | 157 (2.6%) | 166 (3.4%) |
| $5,000 to $7,499 | 245 (4.0%) | 250 (5.2%) |
| $7,500 to $9,999 | 30 (0.5%) | 150 (3.1%) |
| $10,000 to $12,499 | 119 (1.9%) | 379 (7.9%) |
| $12,500 to $14,999 | 100 (1.6%) | 300 (6.2%) |
| $15,000 to $17,499 | 59 (1.0%) | 178 (3.7%) |
| $17,500 to $19,999 | 176 (2.9%) | 227 (4.7%) |
| $20,000 to $22,499 | 190 (3.1%) | 172 (3.6%) |
| $22,500 to $24,999 | 128 (2.1%) | 248 (5.1%) |
| $25,000 to $29,999 | 229 (3.7%) | 367 (7.6%) |
| $30,000 to $34,999 | 383 (6.3%) | 447 (9.3%) |
| $35,000 to $39,999 | 291 (4.8%) | 402 (8.3%) |
| $40,000 to $44,999 | 582 (9.5%) | 309 (6.4%) |
| $45,000 to $49,999 | 455 (7.5%) | 230 (4.8%) |
| $50,000 to $54,999 | 258 (4.2%) | 93 (1.9%) |
| $55,000 to $64,999 | 658 (10.8%) | 176 (3.6%) |
| $65,000 to $74,999 | 473 (7.7%) | 181 (3.7%) |
| $75,000 to $99,999 | 548 (9.0%) | 49 (1.0%) |
| $100,000+ | 748 (12.3%) | 58 (1.2%) |
| Total | 6,101 (100.0%) | 4,821 (100.0%) |
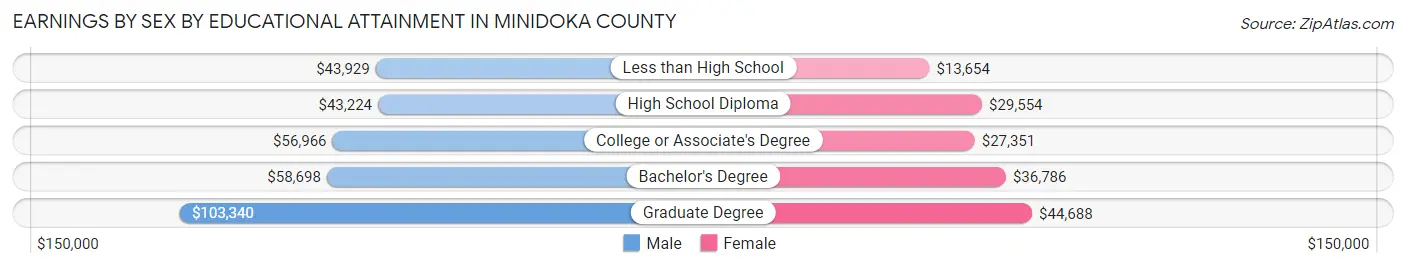
Earnings by Sex by Educational Attainment in Minidoka County
Average earnings in Minidoka County are $50,017 for men and $27,923 for women, a difference of 44.2%. Men with an educational attainment of graduate degree enjoy the highest average annual earnings of $103,340, while those with high school diploma education earn the least with $43,224. Women with an educational attainment of graduate degree earn the most with the average annual earnings of $44,688, while those with less than high school education have the smallest earnings of $13,654.
| Educational Attainment | Male Income | Female Income |
| Less than High School | $43,929 | $13,654 |
| High School Diploma | $43,224 | $29,554 |
| College or Associate's Degree | $56,966 | $27,351 |
| Bachelor's Degree | $58,698 | $36,786 |
| Graduate Degree | $103,340 | $44,688 |
| Total | $50,017 | $27,923 |
Family Income in Minidoka County
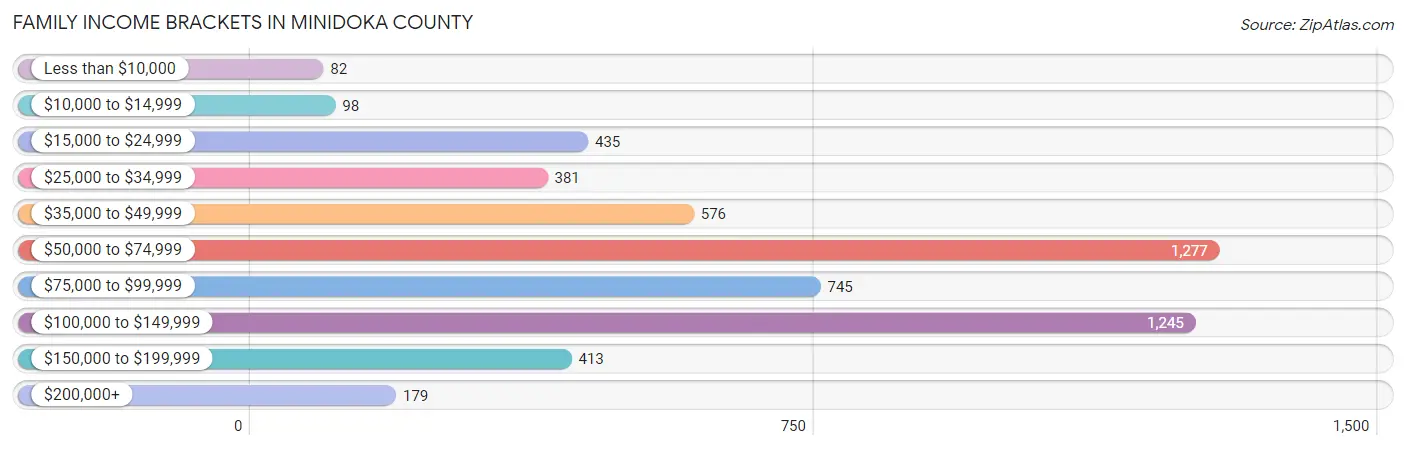
Family Income Brackets in Minidoka County
According to the Minidoka County family income data, there are 1,277 families falling into the $50,000 to $74,999 income range, which is the most common income bracket and makes up 23.5% of all families. Conversely, the less than $10,000 income bracket is the least frequent group with only 82 families (1.5%) belonging to this category.
| Income Bracket | # Families | % Families |
| Less than $10,000 | 82 | 1.5% |
| $10,000 to $14,999 | 98 | 1.8% |
| $15,000 to $24,999 | 435 | 8.0% |
| $25,000 to $34,999 | 381 | 7.0% |
| $35,000 to $49,999 | 576 | 10.6% |
| $50,000 to $74,999 | 1,277 | 23.5% |
| $75,000 to $99,999 | 745 | 13.7% |
| $100,000 to $149,999 | 1,245 | 22.9% |
| $150,000 to $199,999 | 413 | 7.6% |
| $200,000+ | 179 | 3.3% |
Family Income by Famaliy Size in Minidoka County
7+ person families (70 | 1.3%) account for the highest median family income in Minidoka County with $143,750 per family, while 2-person families (2,243 | 41.3%) have the highest median income of $34,132 per family member.
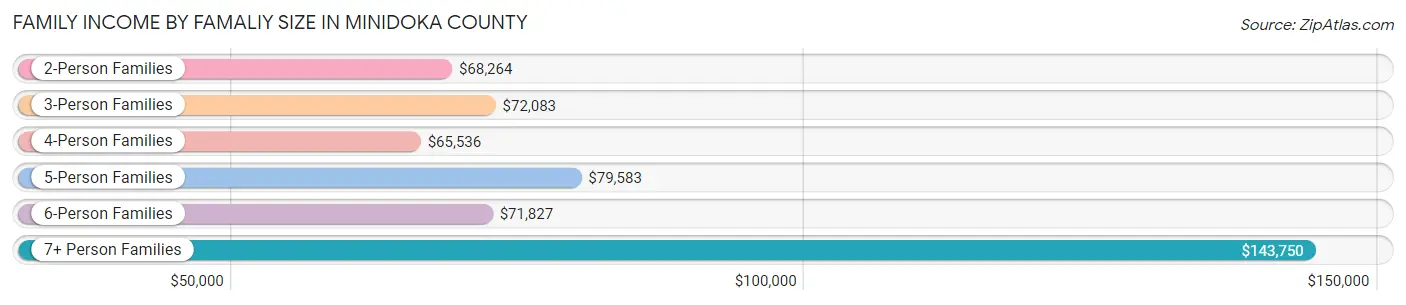
| Income Bracket | # Families | Median Income |
| 2-Person Families | 2,243 (41.3%) | $68,264 |
| 3-Person Families | 1,247 (22.9%) | $72,083 |
| 4-Person Families | 857 (15.8%) | $65,536 |
| 5-Person Families | 676 (12.4%) | $79,583 |
| 6-Person Families | 343 (6.3%) | $71,827 |
| 7+ Person Families | 70 (1.3%) | $143,750 |
| Total | 5,436 (100.0%) | $71,522 |
Family Income by Number of Earners in Minidoka County
The median family income in Minidoka County is $71,522, with families comprising 3+ earners (767) having the highest median family income of $110,197, while families with no earners (818) have the lowest median family income of $42,237, accounting for 14.1% and 15.0% of families, respectively.
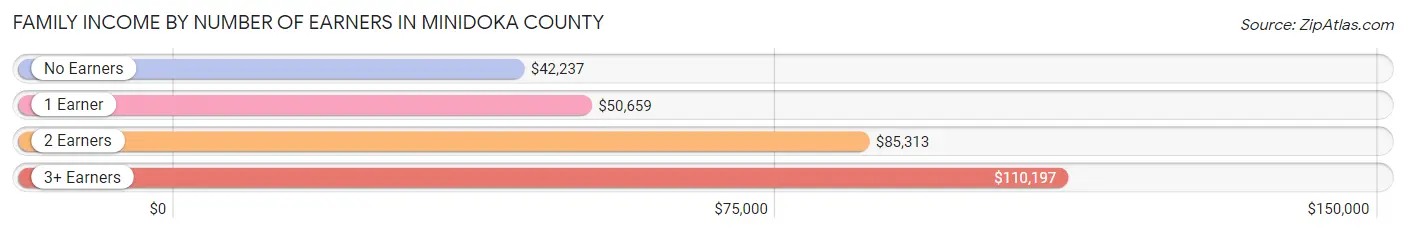
| Number of Earners | # Families | Median Income |
| No Earners | 818 (15.0%) | $42,237 |
| 1 Earner | 1,643 (30.2%) | $50,659 |
| 2 Earners | 2,208 (40.6%) | $85,313 |
| 3+ Earners | 767 (14.1%) | $110,197 |
| Total | 5,436 (100.0%) | $71,522 |
Household Income in Minidoka County
Household Income Brackets in Minidoka County
With 1,592 households falling in the category, the $50,000 to $74,999 income range is the most frequent in Minidoka County, accounting for 21.3% of all households. In contrast, only 179 households (2.4%) fall into the less than $10,000 income bracket, making it the least populous group.
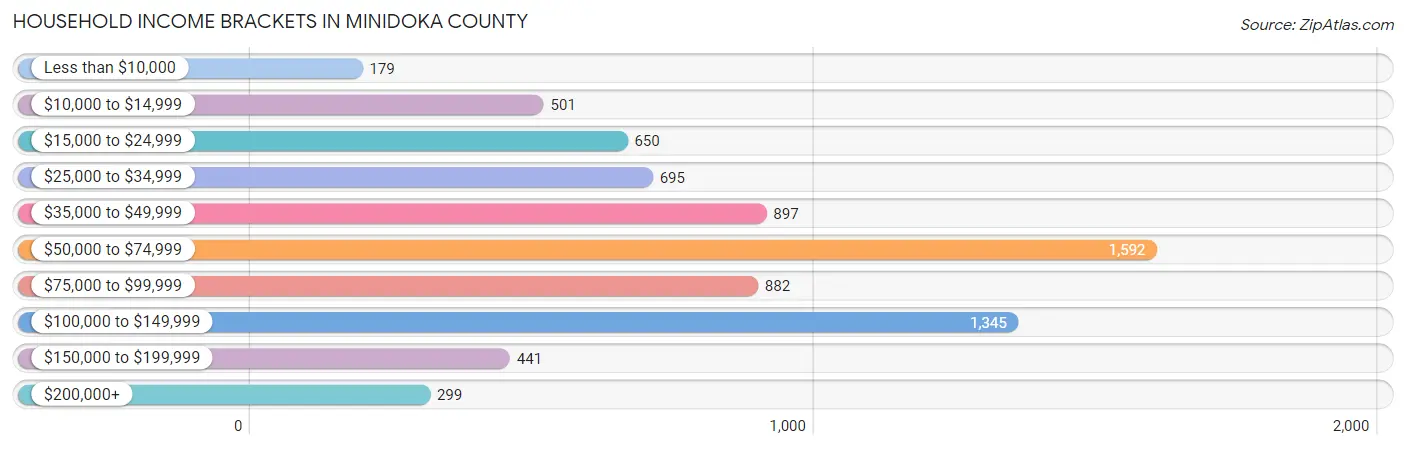
| Income Bracket | # Households | % Households |
| Less than $10,000 | 179 | 2.4% |
| $10,000 to $14,999 | 501 | 6.7% |
| $15,000 to $24,999 | 650 | 8.7% |
| $25,000 to $34,999 | 695 | 9.3% |
| $35,000 to $49,999 | 897 | 12.0% |
| $50,000 to $74,999 | 1,592 | 21.3% |
| $75,000 to $99,999 | 882 | 11.8% |
| $100,000 to $149,999 | 1,345 | 18.0% |
| $150,000 to $199,999 | 441 | 5.9% |
| $200,000+ | 299 | 4.0% |
Household Income by Householder Age in Minidoka County
The median household income in Minidoka County is $63,594, with the highest median household income of $73,542 found in the 45 to 64 years age bracket for the primary householder. A total of 2,585 households (34.6%) fall into this category. Meanwhile, the 65+ years age bracket for the primary householder has the lowest median household income of $39,313, with 2,076 households (27.8%) in this group.
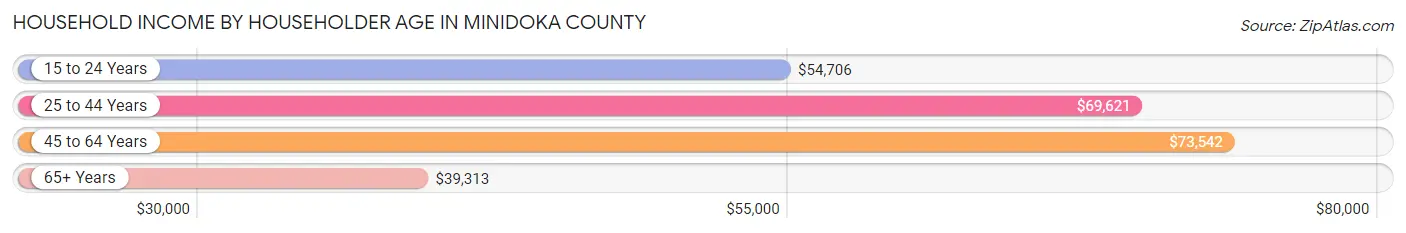
| Income Bracket | # Households | Median Income |
| 15 to 24 Years | 278 (3.7%) | $54,706 |
| 25 to 44 Years | 2,535 (33.9%) | $69,621 |
| 45 to 64 Years | 2,585 (34.6%) | $73,542 |
| 65+ Years | 2,076 (27.8%) | $39,313 |
| Total | 7,474 (100.0%) | $63,594 |
Poverty in Minidoka County
Income Below Poverty by Sex and Age in Minidoka County
With 14.2% poverty level for males and 16.0% for females among the residents of Minidoka County, 5 year old males and 25 to 34 year old females are the most vulnerable to poverty, with 74 males (46.0%) and 358 females (27.5%) in their respective age groups living below the poverty level.
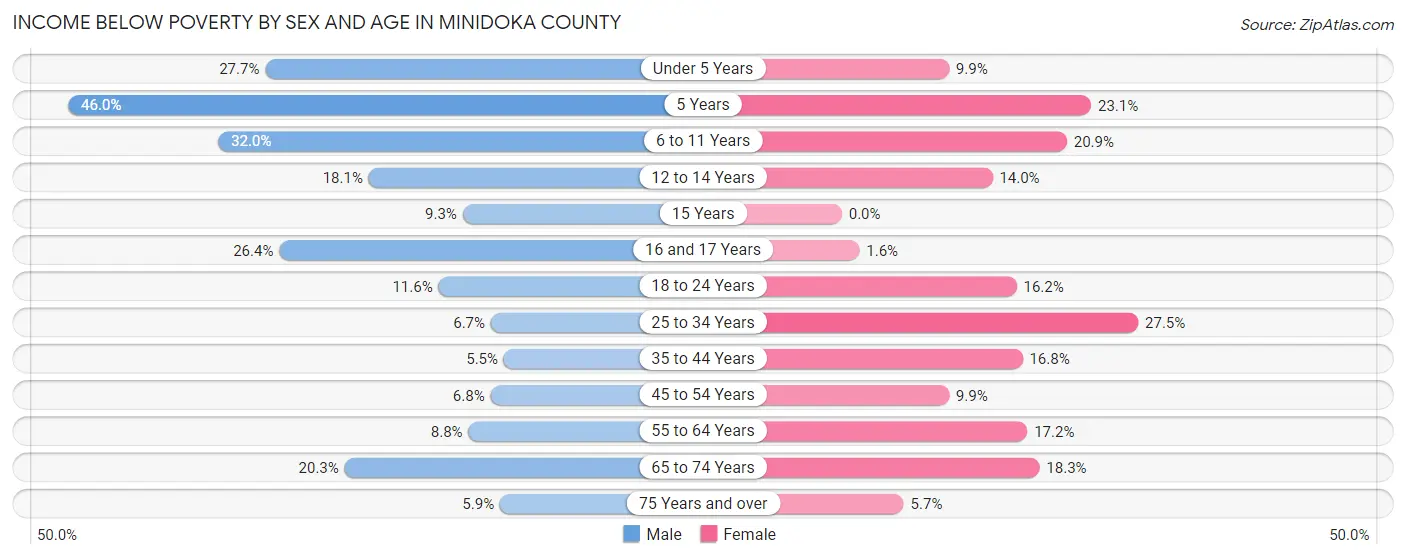
| Age Bracket | Male | Female |
| Under 5 Years | 210 (27.7%) | 80 (9.9%) |
| 5 Years | 74 (46.0%) | 71 (23.1%) |
| 6 to 11 Years | 314 (32.0%) | 186 (20.9%) |
| 12 to 14 Years | 110 (18.1%) | 78 (14.0%) |
| 15 Years | 17 (9.3%) | 0 (0.0%) |
| 16 and 17 Years | 101 (26.4%) | 6 (1.6%) |
| 18 to 24 Years | 112 (11.6%) | 152 (16.2%) |
| 25 to 34 Years | 91 (6.7%) | 358 (27.5%) |
| 35 to 44 Years | 79 (5.5%) | 217 (16.8%) |
| 45 to 54 Years | 75 (6.8%) | 107 (9.9%) |
| 55 to 64 Years | 109 (8.8%) | 213 (17.2%) |
| 65 to 74 Years | 204 (20.3%) | 188 (18.3%) |
| 75 Years and over | 35 (5.9%) | 42 (5.7%) |
| Total | 1,531 (14.2%) | 1,698 (16.0%) |
Income Above Poverty by Sex and Age in Minidoka County
According to the poverty statistics in Minidoka County, males aged 35 to 44 years and females aged 15 years are the age groups that are most secure financially, with 94.5% of males and 100.0% of females in these age groups living above the poverty line.
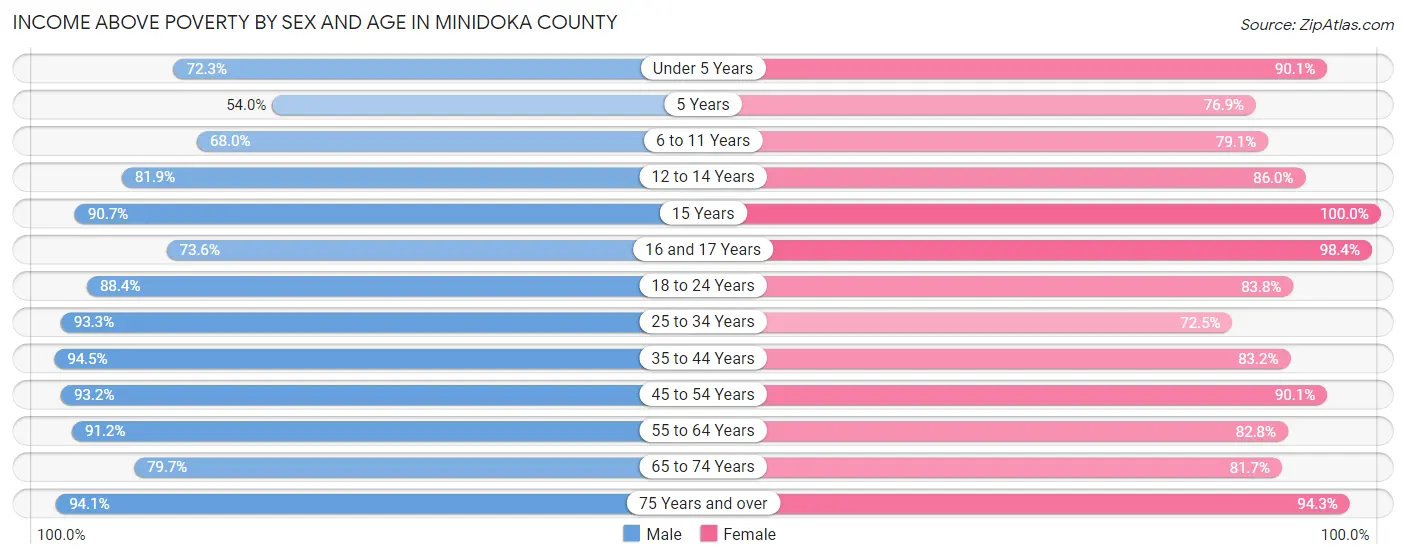
| Age Bracket | Male | Female |
| Under 5 Years | 549 (72.3%) | 725 (90.1%) |
| 5 Years | 87 (54.0%) | 236 (76.9%) |
| 6 to 11 Years | 666 (68.0%) | 705 (79.1%) |
| 12 to 14 Years | 499 (81.9%) | 480 (86.0%) |
| 15 Years | 165 (90.7%) | 100 (100.0%) |
| 16 and 17 Years | 282 (73.6%) | 362 (98.4%) |
| 18 to 24 Years | 854 (88.4%) | 785 (83.8%) |
| 25 to 34 Years | 1,261 (93.3%) | 944 (72.5%) |
| 35 to 44 Years | 1,352 (94.5%) | 1,077 (83.2%) |
| 45 to 54 Years | 1,035 (93.2%) | 969 (90.1%) |
| 55 to 64 Years | 1,128 (91.2%) | 1,025 (82.8%) |
| 65 to 74 Years | 801 (79.7%) | 837 (81.7%) |
| 75 Years and over | 560 (94.1%) | 690 (94.3%) |
| Total | 9,239 (85.8%) | 8,935 (84.0%) |
Income Below Poverty Among Married-Couple Families in Minidoka County
The poverty statistics for married-couple families in Minidoka County show that 8.6% or 378 of the total 4,369 families live below the poverty line. Families with 3 or 4 children have the highest poverty rate of 21.5%, comprising of 188 families. On the other hand, families with 5 or more children have the lowest poverty rate of 0.0%, which includes 0 families.
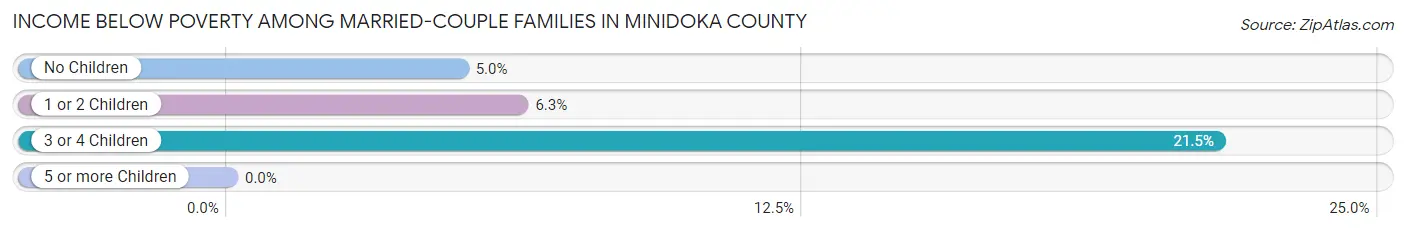
| Children | Above Poverty | Below Poverty |
| No Children | 2,159 (95.0%) | 114 (5.0%) |
| 1 or 2 Children | 1,127 (93.7%) | 76 (6.3%) |
| 3 or 4 Children | 687 (78.5%) | 188 (21.5%) |
| 5 or more Children | 18 (100.0%) | 0 (0.0%) |
| Total | 3,991 (91.3%) | 378 (8.6%) |
Income Below Poverty Among Single-Parent Households in Minidoka County
According to the poverty data in Minidoka County, 4.2% or 18 single-father households and 37.4% or 238 single-mother households are living below the poverty line. Among single-father households, those with 1 or 2 children have the highest poverty rate, with 18 households (9.9%) experiencing poverty. Likewise, among single-mother households, those with 3 or 4 children have the highest poverty rate, with 60 households (54.0%) falling below the poverty line.
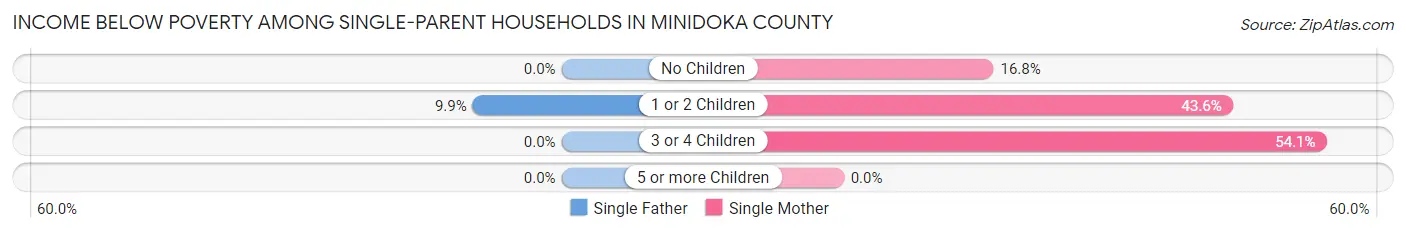
| Children | Single Father | Single Mother |
| No Children | 0 (0.0%) | 32 (16.8%) |
| 1 or 2 Children | 18 (9.9%) | 146 (43.6%) |
| 3 or 4 Children | 0 (0.0%) | 60 (54.0%) |
| 5 or more Children | 0 (0.0%) | 0 (0.0%) |
| Total | 18 (4.2%) | 238 (37.4%) |
Income Below Poverty Among Married-Couple vs Single-Parent Households in Minidoka County
The poverty data for Minidoka County shows that 378 of the married-couple family households (8.6%) and 256 of the single-parent households (24.0%) are living below the poverty level. Within the married-couple family households, those with 3 or 4 children have the highest poverty rate, with 188 households (21.5%) falling below the poverty line. Among the single-parent households, those with 1 or 2 children have the highest poverty rate, with 164 household (31.8%) living below poverty.
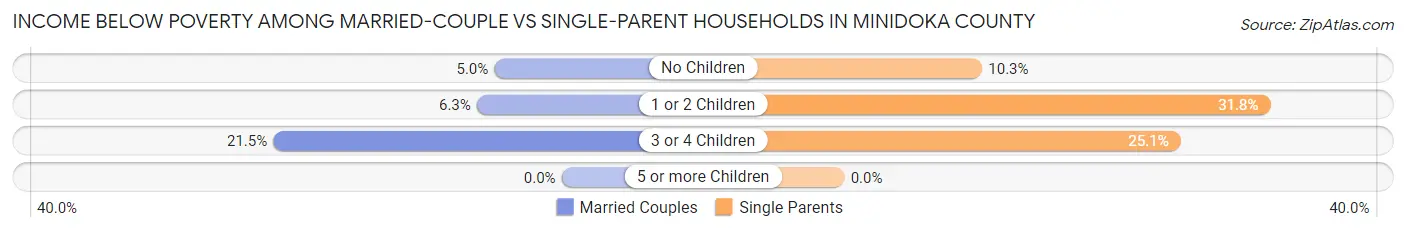
| Children | Married-Couple Families | Single-Parent Households |
| No Children | 114 (5.0%) | 32 (10.3%) |
| 1 or 2 Children | 76 (6.3%) | 164 (31.8%) |
| 3 or 4 Children | 188 (21.5%) | 60 (25.1%) |
| 5 or more Children | 0 (0.0%) | 0 (0.0%) |
| Total | 378 (8.6%) | 256 (24.0%) |
Employment Characteristics in Minidoka County
Employment by Class of Employer in Minidoka County
Among the 9,867 employed individuals in Minidoka County, private company employees (7,272 | 73.7%), local government employees (889 | 9.0%), and self-employed (not incorporated) (765 | 7.7%) make up the most common classes of employment.
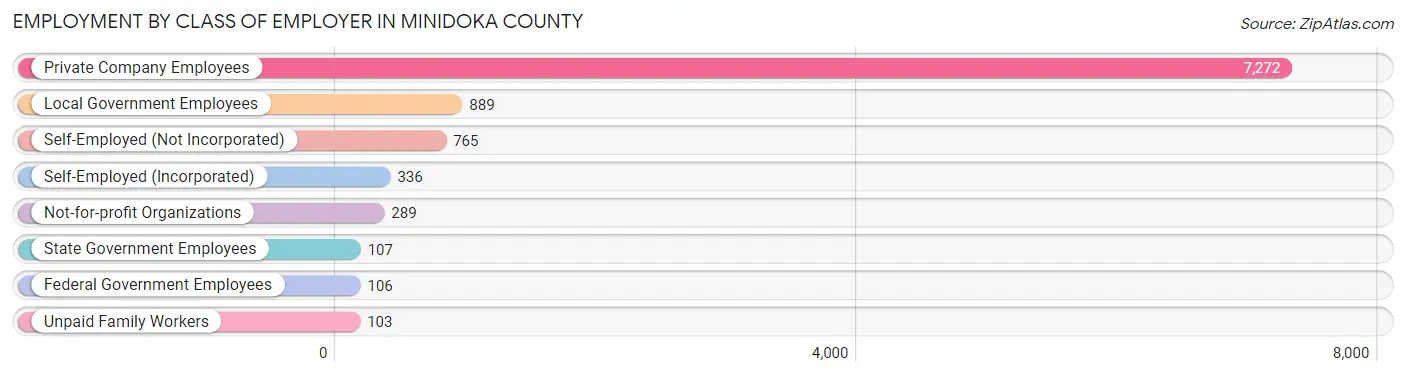
| Employer Class | # Employees | % Employees |
| Private Company Employees | 7,272 | 73.7% |
| Self-Employed (Incorporated) | 336 | 3.4% |
| Self-Employed (Not Incorporated) | 765 | 7.7% |
| Not-for-profit Organizations | 289 | 2.9% |
| Local Government Employees | 889 | 9.0% |
| State Government Employees | 107 | 1.1% |
| Federal Government Employees | 106 | 1.1% |
| Unpaid Family Workers | 103 | 1.0% |
| Total | 9,867 | 100.0% |
Employment Status by Age in Minidoka County
According to the labor force statistics for Minidoka County, out of the total population over 16 years of age (16,109), 64.6% or 10,406 individuals are in the labor force, with 3.3% or 343 of them unemployed. The age group with the highest labor force participation rate is 45 to 54 years, with 86.2% or 1,884 individuals in the labor force. Within the labor force, the 16 to 19 years age range has the highest percentage of unemployed individuals, with 17.9% or 106 of them being unemployed.
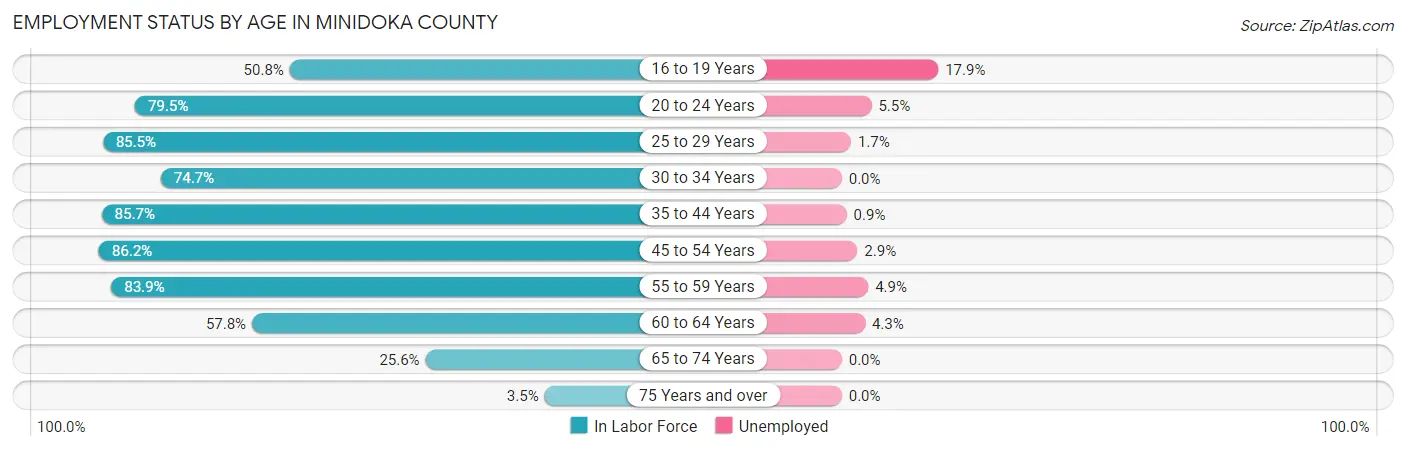
| Age Bracket | In Labor Force | Unemployed |
| 16 to 19 Years | 591 (50.8%) | 106 (17.9%) |
| 20 to 24 Years | 1,187 (79.5%) | 65 (5.5%) |
| 25 to 29 Years | 1,236 (85.5%) | 21 (1.7%) |
| 30 to 34 Years | 902 (74.7%) | 0 (0.0%) |
| 35 to 44 Years | 2,335 (85.7%) | 21 (0.9%) |
| 45 to 54 Years | 1,884 (86.2%) | 55 (2.9%) |
| 55 to 59 Years | 899 (83.9%) | 44 (4.9%) |
| 60 to 64 Years | 812 (57.8%) | 35 (4.3%) |
| 65 to 74 Years | 520 (25.6%) | 0 (0.0%) |
| 75 Years and over | 48 (3.5%) | 0 (0.0%) |
| Total | 10,406 (64.6%) | 343 (3.3%) |
Employment Status by Educational Attainment in Minidoka County
According to labor force statistics for Minidoka County, 80.3% of individuals (8,062) out of the total population between 25 and 64 years of age (10,040) are in the labor force, with 2.2% or 177 of them being unemployed. The group with the highest labor force participation rate are those with the educational attainment of bachelor's degree or higher, with 87.3% or 1,357 individuals in the labor force. Within the labor force, individuals with less than high school education have the highest percentage of unemployment, with 3.3% or 50 of them being unemployed.
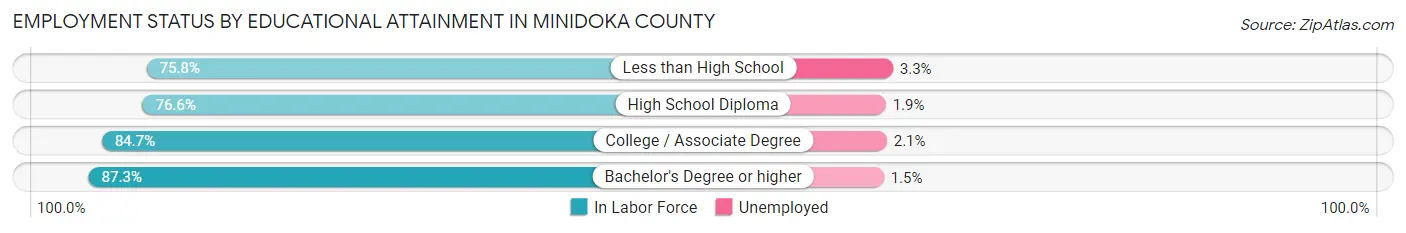
| Educational Attainment | In Labor Force | Unemployed |
| Less than High School | 1,501 (75.8%) | 65 (3.3%) |
| High School Diploma | 2,842 (76.6%) | 70 (1.9%) |
| College / Associate Degree | 2,368 (84.7%) | 59 (2.1%) |
| Bachelor's Degree or higher | 1,357 (87.3%) | 23 (1.5%) |
| Total | 8,062 (80.3%) | 221 (2.2%) |
Employment Occupations by Sex in Minidoka County
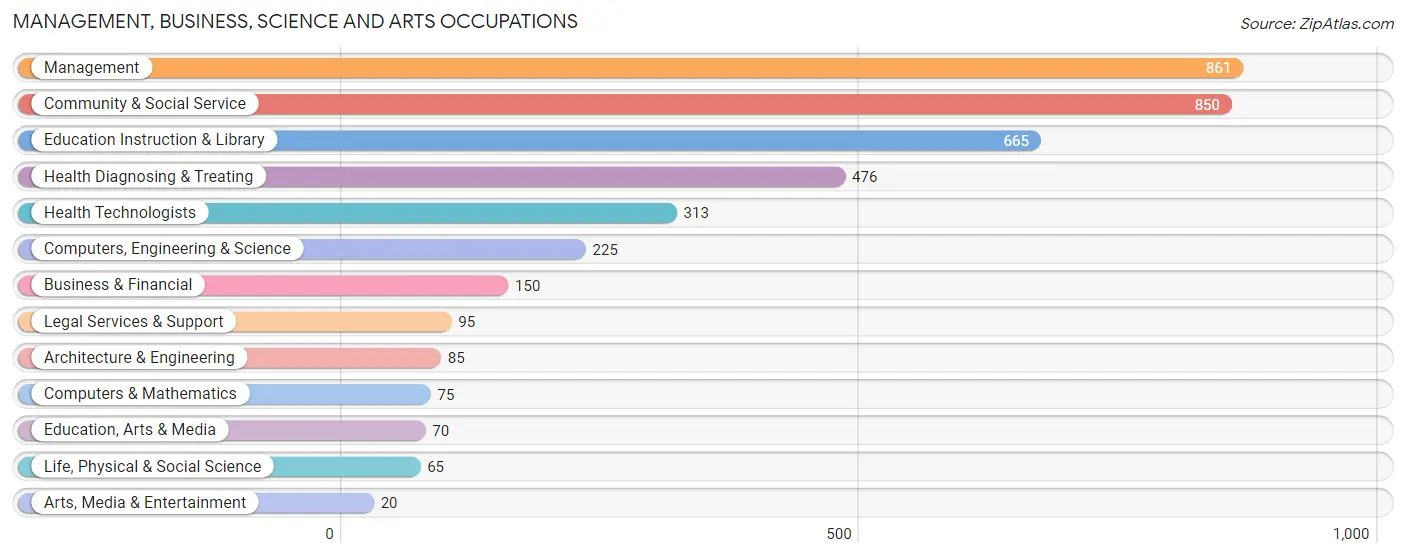
Management, Business, Science and Arts Occupations
The most common Management, Business, Science and Arts occupations in Minidoka County are Management (861 | 8.6%), Community & Social Service (850 | 8.5%), Education Instruction & Library (665 | 6.6%), Health Diagnosing & Treating (476 | 4.7%), and Health Technologists (313 | 3.1%).
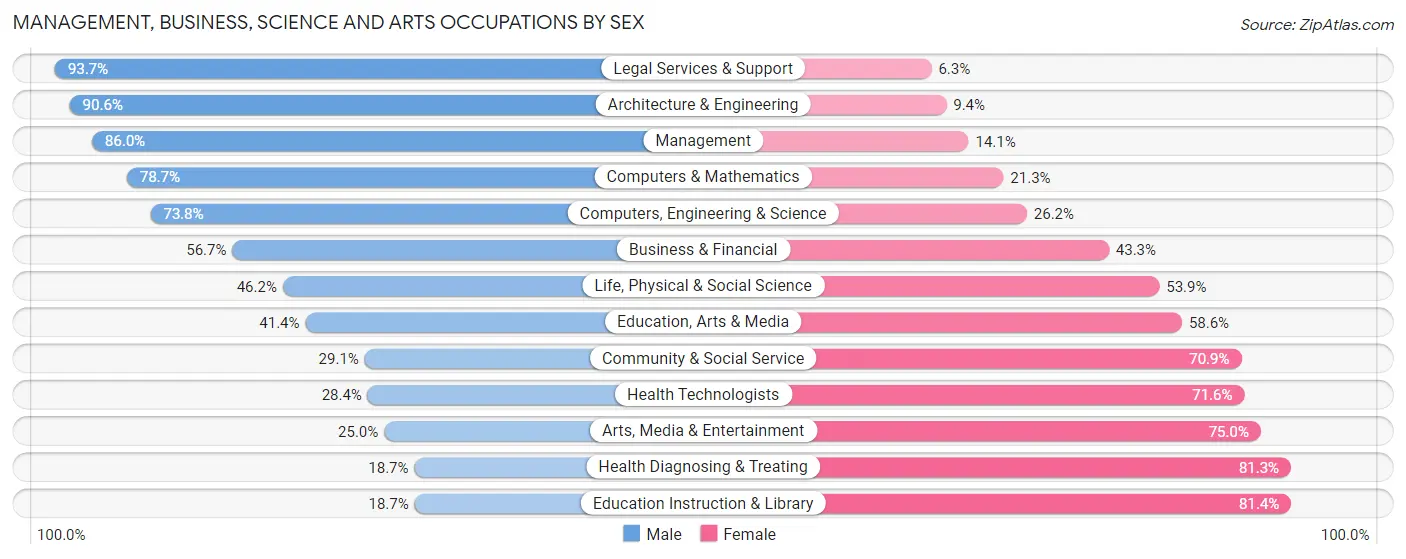
Management, Business, Science and Arts Occupations by Sex
Within the Management, Business, Science and Arts occupations in Minidoka County, the most male-oriented occupations are Legal Services & Support (93.7%), Architecture & Engineering (90.6%), and Management (86.0%), while the most female-oriented occupations are Education Instruction & Library (81.4%), Health Diagnosing & Treating (81.3%), and Arts, Media & Entertainment (75.0%).
| Occupation | Male | Female |
| Management | 740 (86.0%) | 121 (14.1%) |
| Business & Financial | 85 (56.7%) | 65 (43.3%) |
| Computers, Engineering & Science | 166 (73.8%) | 59 (26.2%) |
| Computers & Mathematics | 59 (78.7%) | 16 (21.3%) |
| Architecture & Engineering | 77 (90.6%) | 8 (9.4%) |
| Life, Physical & Social Science | 30 (46.2%) | 35 (53.8%) |
| Community & Social Service | 247 (29.1%) | 603 (70.9%) |
| Education, Arts & Media | 29 (41.4%) | 41 (58.6%) |
| Legal Services & Support | 89 (93.7%) | 6 (6.3%) |
| Education Instruction & Library | 124 (18.6%) | 541 (81.4%) |
| Arts, Media & Entertainment | 5 (25.0%) | 15 (75.0%) |
| Health Diagnosing & Treating | 89 (18.7%) | 387 (81.3%) |
| Health Technologists | 89 (28.4%) | 224 (71.6%) |
| Total (Category) | 1,327 (51.8%) | 1,235 (48.2%) |
| Total (Overall) | 5,607 (55.7%) | 4,458 (44.3%) |
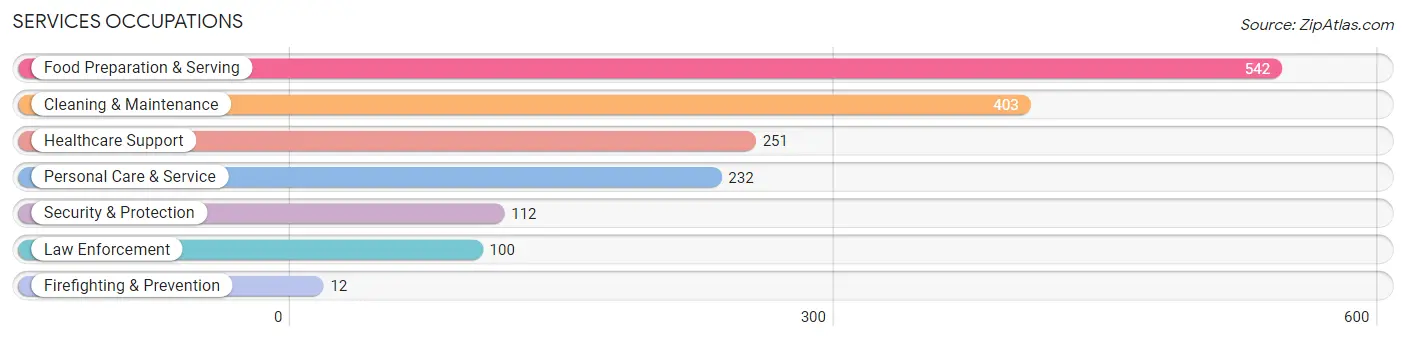
Services Occupations
The most common Services occupations in Minidoka County are Food Preparation & Serving (542 | 5.4%), Cleaning & Maintenance (403 | 4.0%), Healthcare Support (251 | 2.5%), Personal Care & Service (232 | 2.3%), and Security & Protection (112 | 1.1%).
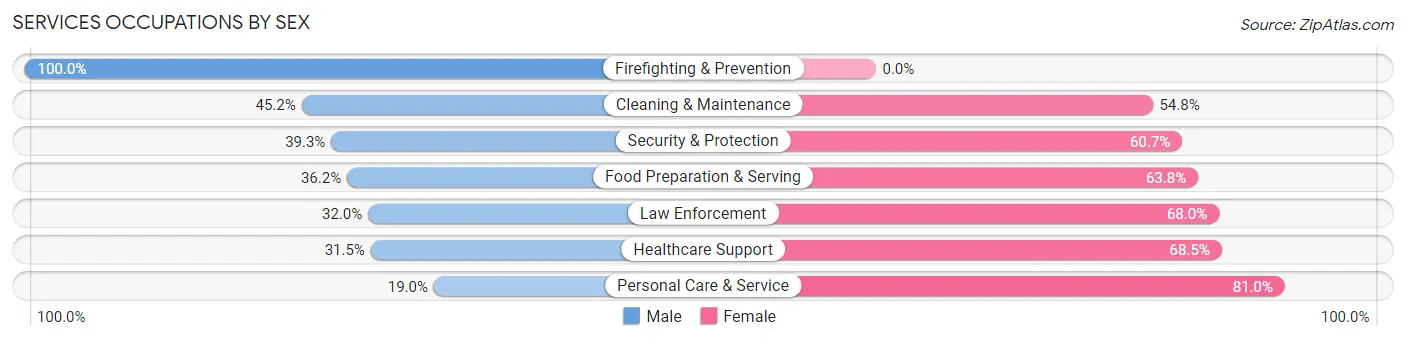
Services Occupations by Sex
Within the Services occupations in Minidoka County, the most male-oriented occupations are Firefighting & Prevention (100.0%), Cleaning & Maintenance (45.2%), and Security & Protection (39.3%), while the most female-oriented occupations are Personal Care & Service (81.0%), Healthcare Support (68.5%), and Law Enforcement (68.0%).
| Occupation | Male | Female |
| Healthcare Support | 79 (31.5%) | 172 (68.5%) |
| Security & Protection | 44 (39.3%) | 68 (60.7%) |
| Firefighting & Prevention | 12 (100.0%) | 0 (0.0%) |
| Law Enforcement | 32 (32.0%) | 68 (68.0%) |
| Food Preparation & Serving | 196 (36.2%) | 346 (63.8%) |
| Cleaning & Maintenance | 182 (45.2%) | 221 (54.8%) |
| Personal Care & Service | 44 (19.0%) | 188 (81.0%) |
| Total (Category) | 545 (35.4%) | 995 (64.6%) |
| Total (Overall) | 5,607 (55.7%) | 4,458 (44.3%) |
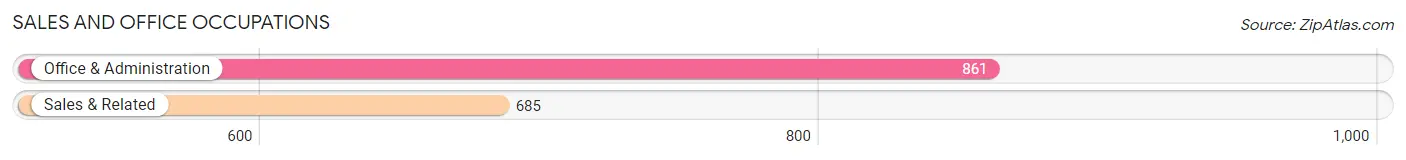
Sales and Office Occupations
The most common Sales and Office occupations in Minidoka County are Office & Administration (861 | 8.6%), and Sales & Related (685 | 6.8%).
Sales and Office Occupations by Sex
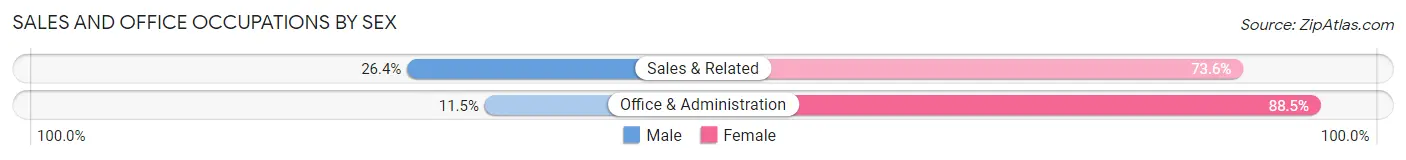
| Occupation | Male | Female |
| Sales & Related | 181 (26.4%) | 504 (73.6%) |
| Office & Administration | 99 (11.5%) | 762 (88.5%) |
| Total (Category) | 280 (18.1%) | 1,266 (81.9%) |
| Total (Overall) | 5,607 (55.7%) | 4,458 (44.3%) |
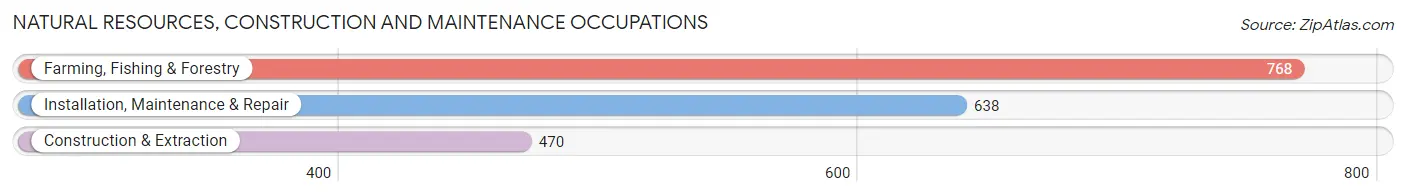
Natural Resources, Construction and Maintenance Occupations
The most common Natural Resources, Construction and Maintenance occupations in Minidoka County are Farming, Fishing & Forestry (768 | 7.6%), Installation, Maintenance & Repair (638 | 6.3%), and Construction & Extraction (470 | 4.7%).
Natural Resources, Construction and Maintenance Occupations by Sex
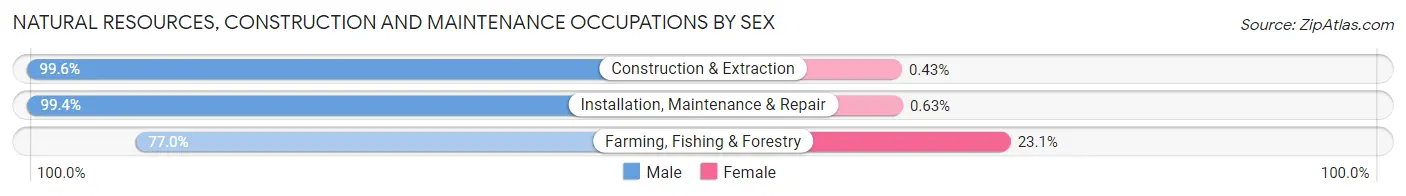
| Occupation | Male | Female |
| Farming, Fishing & Forestry | 591 (76.9%) | 177 (23.1%) |
| Construction & Extraction | 468 (99.6%) | 2 (0.4%) |
| Installation, Maintenance & Repair | 634 (99.4%) | 4 (0.6%) |
| Total (Category) | 1,693 (90.2%) | 183 (9.8%) |
| Total (Overall) | 5,607 (55.7%) | 4,458 (44.3%) |
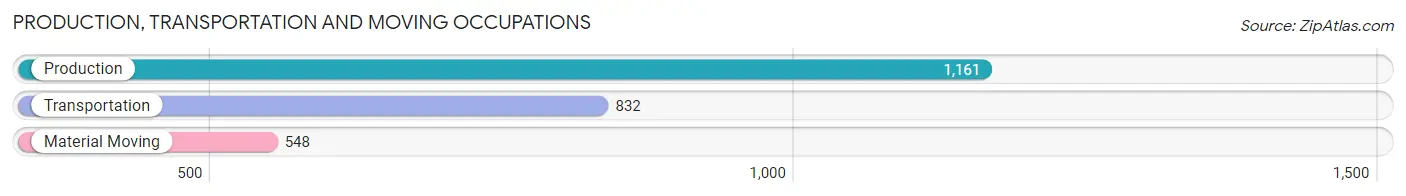
Production, Transportation and Moving Occupations
The most common Production, Transportation and Moving occupations in Minidoka County are Production (1,161 | 11.5%), Transportation (832 | 8.3%), and Material Moving (548 | 5.4%).
Production, Transportation and Moving Occupations by Sex
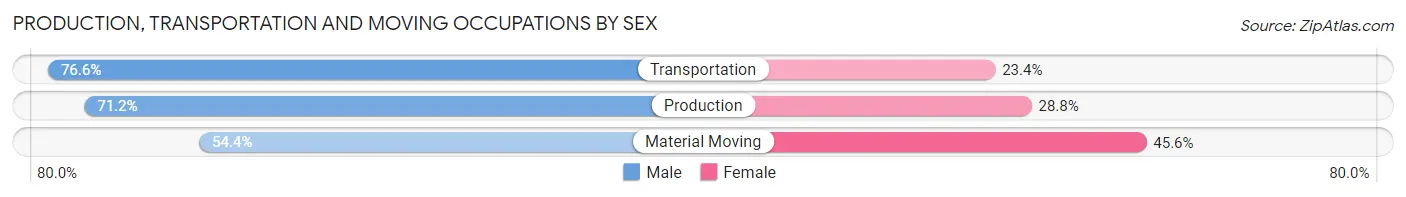
| Occupation | Male | Female |
| Production | 827 (71.2%) | 334 (28.8%) |
| Transportation | 637 (76.6%) | 195 (23.4%) |
| Material Moving | 298 (54.4%) | 250 (45.6%) |
| Total (Category) | 1,762 (69.3%) | 779 (30.7%) |
| Total (Overall) | 5,607 (55.7%) | 4,458 (44.3%) |
Employment Industries by Sex in Minidoka County
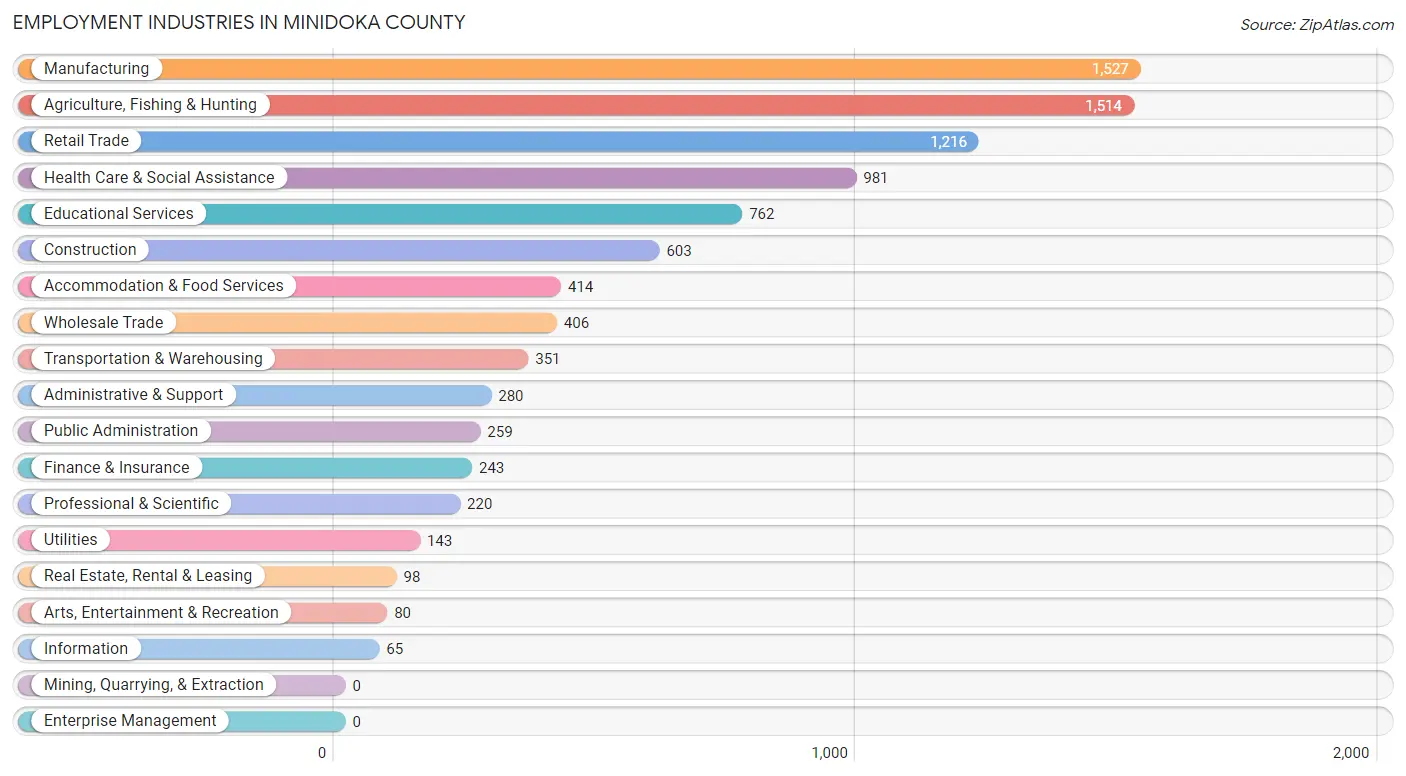
Employment Industries in Minidoka County
The major employment industries in Minidoka County include Manufacturing (1,527 | 15.2%), Agriculture, Fishing & Hunting (1,514 | 15.0%), Retail Trade (1,216 | 12.1%), Health Care & Social Assistance (981 | 9.8%), and Educational Services (762 | 7.6%).
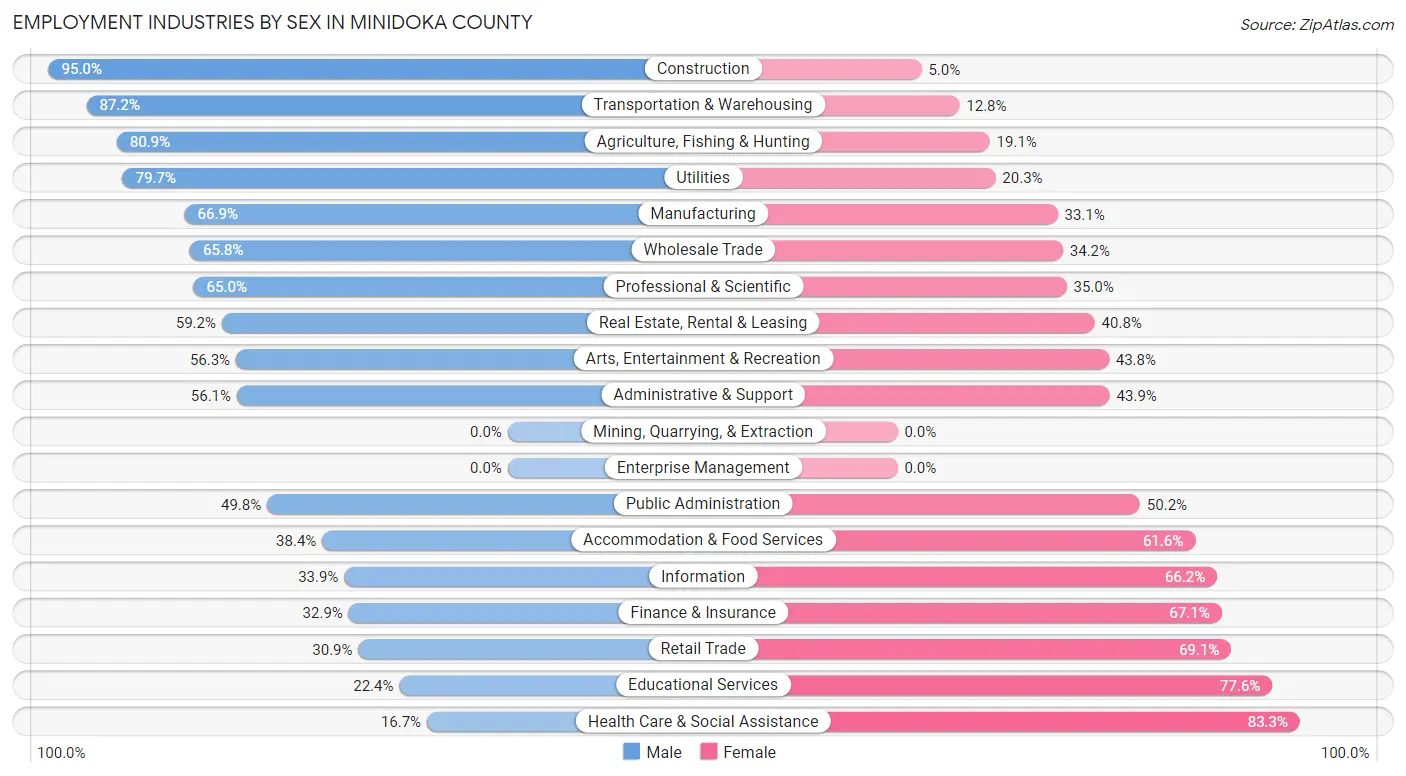
Employment Industries by Sex in Minidoka County
The Minidoka County industries that see more men than women are Construction (95.0%), Transportation & Warehousing (87.2%), and Agriculture, Fishing & Hunting (80.9%), whereas the industries that tend to have a higher number of women are Health Care & Social Assistance (83.3%), Educational Services (77.6%), and Retail Trade (69.1%).
| Industry | Male | Female |
| Agriculture, Fishing & Hunting | 1,225 (80.9%) | 289 (19.1%) |
| Mining, Quarrying, & Extraction | 0 (0.0%) | 0 (0.0%) |
| Construction | 573 (95.0%) | 30 (5.0%) |
| Manufacturing | 1,021 (66.9%) | 506 (33.1%) |
| Wholesale Trade | 267 (65.8%) | 139 (34.2%) |
| Retail Trade | 376 (30.9%) | 840 (69.1%) |
| Transportation & Warehousing | 306 (87.2%) | 45 (12.8%) |
| Utilities | 114 (79.7%) | 29 (20.3%) |
| Information | 22 (33.9%) | 43 (66.1%) |
| Finance & Insurance | 80 (32.9%) | 163 (67.1%) |
| Real Estate, Rental & Leasing | 58 (59.2%) | 40 (40.8%) |
| Professional & Scientific | 143 (65.0%) | 77 (35.0%) |
| Enterprise Management | 0 (0.0%) | 0 (0.0%) |
| Administrative & Support | 157 (56.1%) | 123 (43.9%) |
| Educational Services | 171 (22.4%) | 591 (77.6%) |
| Health Care & Social Assistance | 164 (16.7%) | 817 (83.3%) |
| Arts, Entertainment & Recreation | 45 (56.2%) | 35 (43.8%) |
| Accommodation & Food Services | 159 (38.4%) | 255 (61.6%) |
| Public Administration | 129 (49.8%) | 130 (50.2%) |
| Total | 5,607 (55.7%) | 4,458 (44.3%) |
Education in Minidoka County
School Enrollment in Minidoka County
The most common levels of schooling among the 5,503 students in Minidoka County are middle school (1,649 | 30.0%), high school (1,263 | 23.0%), and elementary school (1,228 | 22.3%).
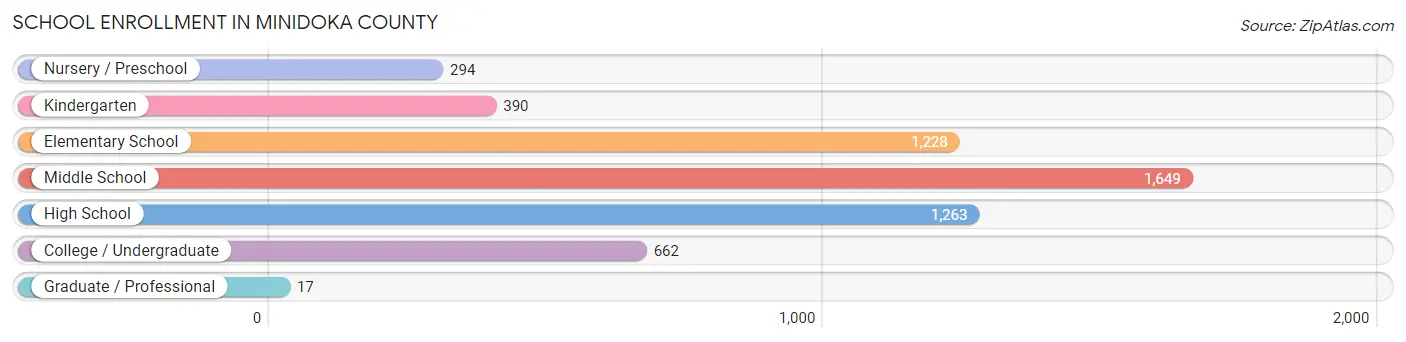
| School Level | # Students | % Students |
| Nursery / Preschool | 294 | 5.3% |
| Kindergarten | 390 | 7.1% |
| Elementary School | 1,228 | 22.3% |
| Middle School | 1,649 | 30.0% |
| High School | 1,263 | 23.0% |
| College / Undergraduate | 662 | 12.0% |
| Graduate / Professional | 17 | 0.3% |
| Total | 5,503 | 100.0% |
School Enrollment by Age by Funding Source in Minidoka County
Out of a total of 5,503 students who are enrolled in schools in Minidoka County, 402 (7.3%) attend a private institution, while the remaining 5,101 (92.7%) are enrolled in public schools. The age group of 35 years and over has the highest likelihood of being enrolled in private schools, with 56 (38.4% in the age bracket) enrolled. Conversely, the age group of 15 to 17 year olds has the lowest likelihood of being enrolled in a private school, with 978 (98.4% in the age bracket) attending a public institution.
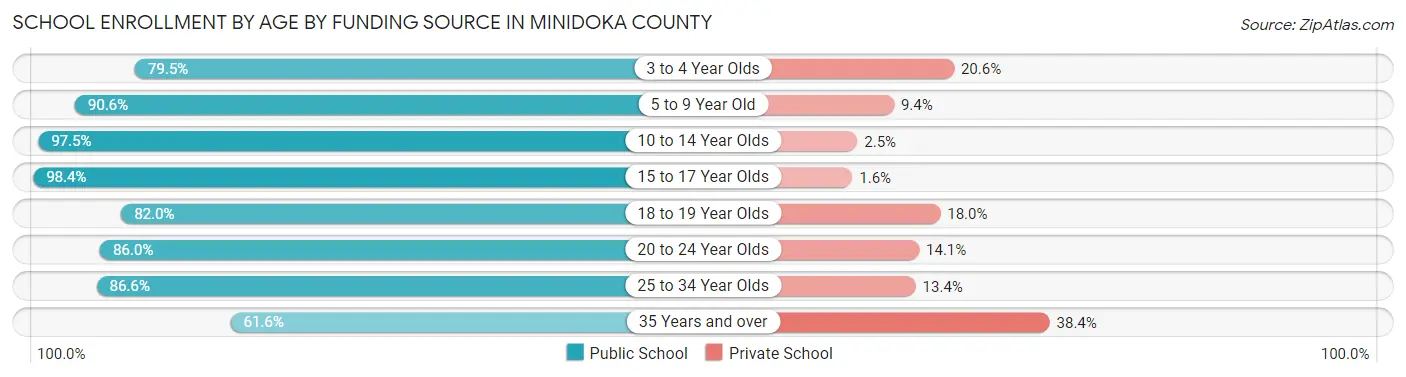
| Age Bracket | Public School | Private School |
| 3 to 4 Year Olds | 116 (79.4%) | 30 (20.5%) |
| 5 to 9 Year Old | 1,432 (90.6%) | 148 (9.4%) |
| 10 to 14 Year Olds | 1,917 (97.5%) | 50 (2.5%) |
| 15 to 17 Year Olds | 978 (98.4%) | 16 (1.6%) |
| 18 to 19 Year Olds | 164 (82.0%) | 36 (18.0%) |
| 20 to 24 Year Olds | 263 (86.0%) | 43 (14.1%) |
| 25 to 34 Year Olds | 142 (86.6%) | 22 (13.4%) |
| 35 Years and over | 90 (61.6%) | 56 (38.4%) |
| Total | 5,101 (92.7%) | 402 (7.3%) |
Educational Attainment by Field of Study in Minidoka County
Education (556 | 24.7%), bio, nature & agricultural (348 | 15.5%), business (327 | 14.5%), science & technology (207 | 9.2%), and arts & humanities (177 | 7.9%) are the most common fields of study among 2,251 individuals in Minidoka County who have obtained a bachelor's degree or higher.
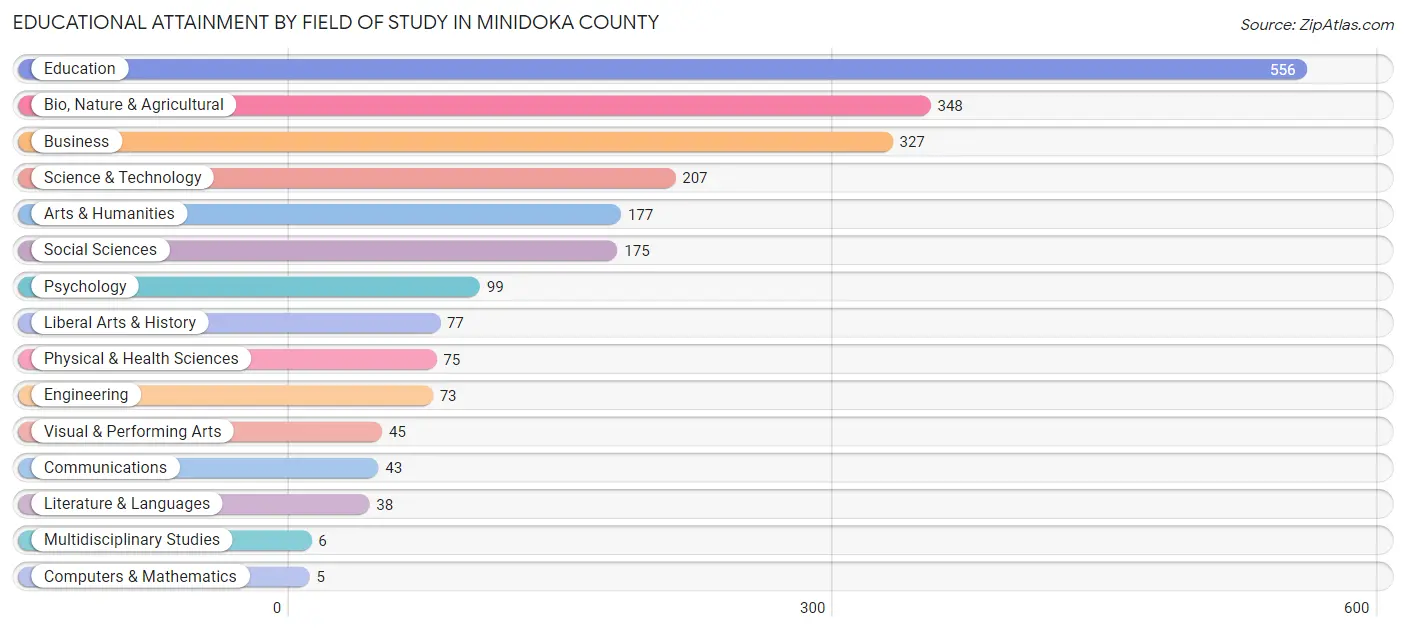
| Field of Study | # Graduates | % Graduates |
| Computers & Mathematics | 5 | 0.2% |
| Bio, Nature & Agricultural | 348 | 15.5% |
| Physical & Health Sciences | 75 | 3.3% |
| Psychology | 99 | 4.4% |
| Social Sciences | 175 | 7.8% |
| Engineering | 73 | 3.2% |
| Multidisciplinary Studies | 6 | 0.3% |
| Science & Technology | 207 | 9.2% |
| Business | 327 | 14.5% |
| Education | 556 | 24.7% |
| Literature & Languages | 38 | 1.7% |
| Liberal Arts & History | 77 | 3.4% |
| Visual & Performing Arts | 45 | 2.0% |
| Communications | 43 | 1.9% |
| Arts & Humanities | 177 | 7.9% |
| Total | 2,251 | 100.0% |
Transportation & Commute in Minidoka County
Vehicle Availability by Sex in Minidoka County
The most prevalent vehicle ownership categories in Minidoka County are males with 2 vehicles (1,977, accounting for 35.9%) and females with 2 vehicles (1,522, making up 45.5%).
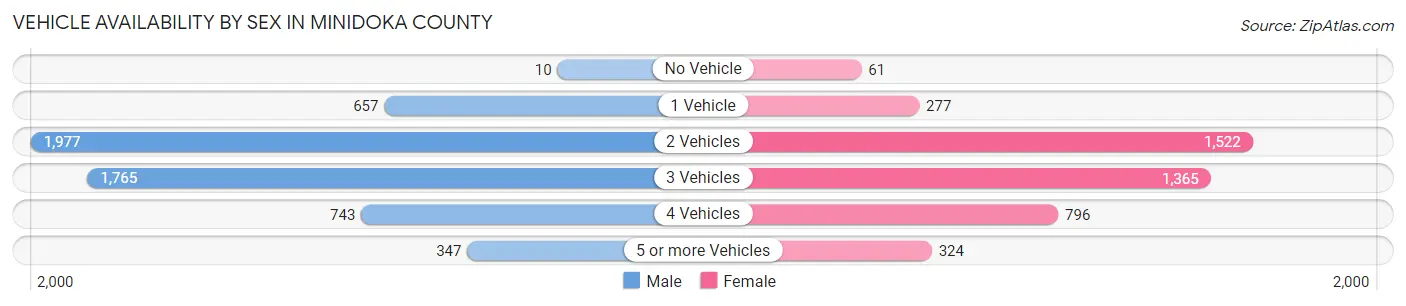
| Vehicles Available | Male | Female |
| No Vehicle | 10 (0.2%) | 61 (1.4%) |
| 1 Vehicle | 657 (11.9%) | 277 (6.4%) |
| 2 Vehicles | 1,977 (35.9%) | 1,522 (35.0%) |
| 3 Vehicles | 1,765 (32.1%) | 1,365 (31.4%) |
| 4 Vehicles | 743 (13.5%) | 796 (18.3%) |
| 5 or more Vehicles | 347 (6.3%) | 324 (7.5%) |
| Total | 5,499 (100.0%) | 4,345 (100.0%) |
Commute Time in Minidoka County
The most frequently occuring commute durations in Minidoka County are 10 to 14 minutes (2,454 commuters, 25.8%), 5 to 9 minutes (1,914 commuters, 20.2%), and 15 to 19 minutes (1,859 commuters, 19.6%).
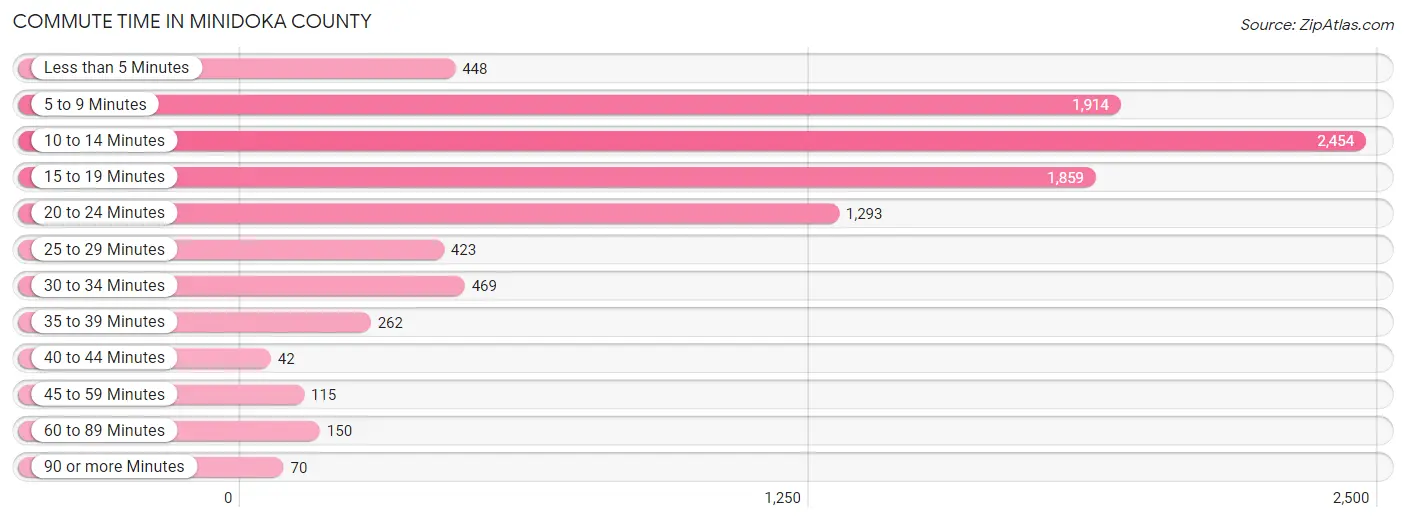
| Commute Time | # Commuters | % Commuters |
| Less than 5 Minutes | 448 | 4.7% |
| 5 to 9 Minutes | 1,914 | 20.2% |
| 10 to 14 Minutes | 2,454 | 25.8% |
| 15 to 19 Minutes | 1,859 | 19.6% |
| 20 to 24 Minutes | 1,293 | 13.6% |
| 25 to 29 Minutes | 423 | 4.4% |
| 30 to 34 Minutes | 469 | 4.9% |
| 35 to 39 Minutes | 262 | 2.8% |
| 40 to 44 Minutes | 42 | 0.4% |
| 45 to 59 Minutes | 115 | 1.2% |
| 60 to 89 Minutes | 150 | 1.6% |
| 90 or more Minutes | 70 | 0.7% |
Commute Time by Sex in Minidoka County
The most common commute times in Minidoka County are 10 to 14 minutes (1,214 commuters, 22.9%) for males and 10 to 14 minutes (1,240 commuters, 29.6%) for females.
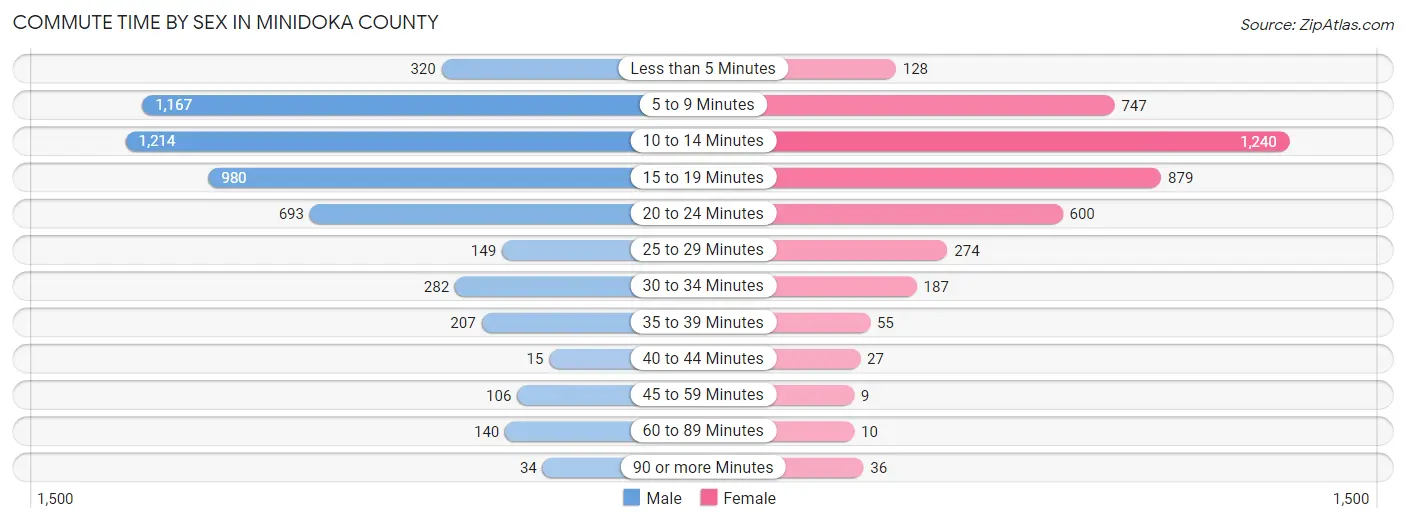
| Commute Time | Male | Female |
| Less than 5 Minutes | 320 (6.0%) | 128 (3.0%) |
| 5 to 9 Minutes | 1,167 (22.0%) | 747 (17.8%) |
| 10 to 14 Minutes | 1,214 (22.9%) | 1,240 (29.6%) |
| 15 to 19 Minutes | 980 (18.5%) | 879 (21.0%) |
| 20 to 24 Minutes | 693 (13.1%) | 600 (14.3%) |
| 25 to 29 Minutes | 149 (2.8%) | 274 (6.5%) |
| 30 to 34 Minutes | 282 (5.3%) | 187 (4.5%) |
| 35 to 39 Minutes | 207 (3.9%) | 55 (1.3%) |
| 40 to 44 Minutes | 15 (0.3%) | 27 (0.6%) |
| 45 to 59 Minutes | 106 (2.0%) | 9 (0.2%) |
| 60 to 89 Minutes | 140 (2.6%) | 10 (0.2%) |
| 90 or more Minutes | 34 (0.6%) | 36 (0.9%) |
Time of Departure to Work by Sex in Minidoka County
The most frequent times of departure to work in Minidoka County are 7:30 AM to 7:59 AM (802, 15.1%) for males and 7:30 AM to 7:59 AM (889, 21.2%) for females.
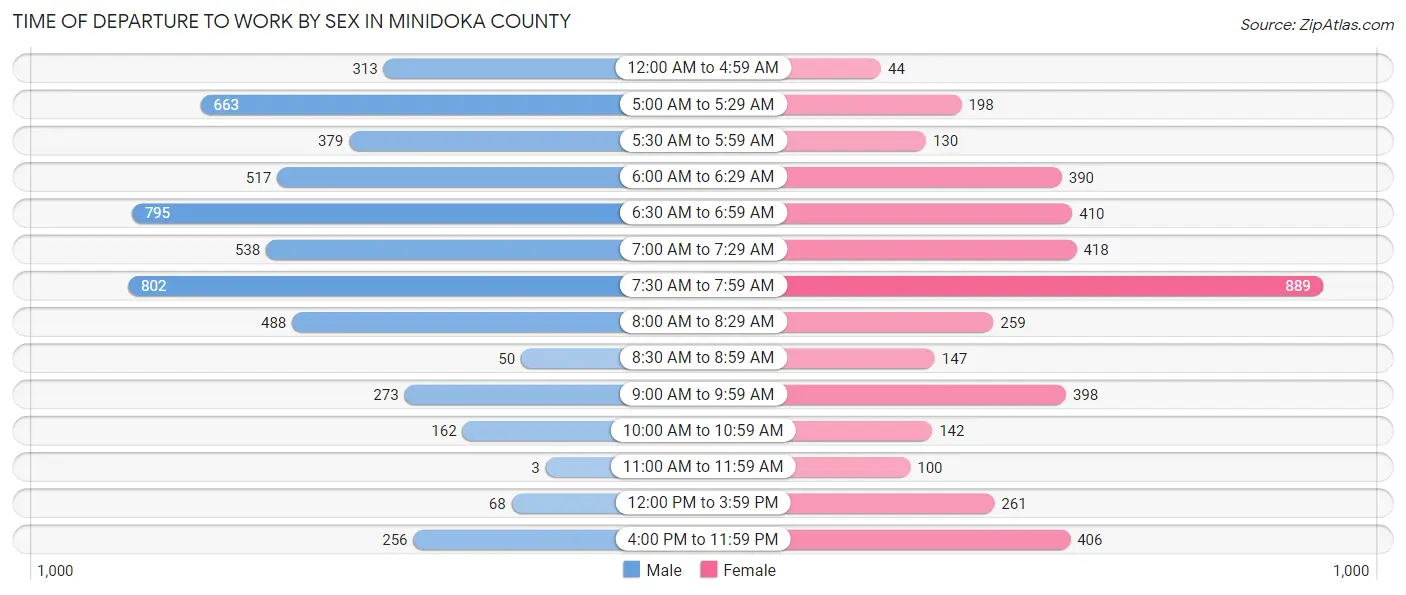
| Time of Departure | Male | Female |
| 12:00 AM to 4:59 AM | 313 (5.9%) | 44 (1.1%) |
| 5:00 AM to 5:29 AM | 663 (12.5%) | 198 (4.7%) |
| 5:30 AM to 5:59 AM | 379 (7.1%) | 130 (3.1%) |
| 6:00 AM to 6:29 AM | 517 (9.7%) | 390 (9.3%) |
| 6:30 AM to 6:59 AM | 795 (15.0%) | 410 (9.8%) |
| 7:00 AM to 7:29 AM | 538 (10.1%) | 418 (10.0%) |
| 7:30 AM to 7:59 AM | 802 (15.1%) | 889 (21.2%) |
| 8:00 AM to 8:29 AM | 488 (9.2%) | 259 (6.2%) |
| 8:30 AM to 8:59 AM | 50 (0.9%) | 147 (3.5%) |
| 9:00 AM to 9:59 AM | 273 (5.1%) | 398 (9.5%) |
| 10:00 AM to 10:59 AM | 162 (3.0%) | 142 (3.4%) |
| 11:00 AM to 11:59 AM | 3 (0.1%) | 100 (2.4%) |
| 12:00 PM to 3:59 PM | 68 (1.3%) | 261 (6.2%) |
| 4:00 PM to 11:59 PM | 256 (4.8%) | 406 (9.7%) |
| Total | 5,307 (100.0%) | 4,192 (100.0%) |
Housing Occupancy in Minidoka County
Occupancy by Ownership in Minidoka County
Of the total 7,474 dwellings in Minidoka County, owner-occupied units account for 5,390 (72.1%), while renter-occupied units make up 2,084 (27.9%).
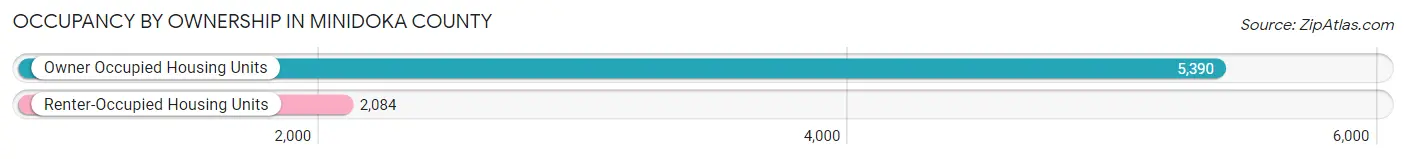
| Occupancy | # Housing Units | % Housing Units |
| Owner Occupied Housing Units | 5,390 | 72.1% |
| Renter-Occupied Housing Units | 2,084 | 27.9% |
| Total Occupied Housing Units | 7,474 | 100.0% |
Occupancy by Household Size in Minidoka County
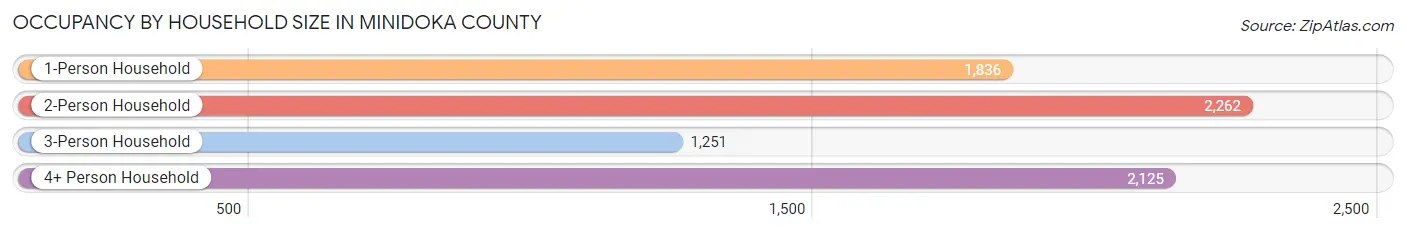
| Household Size | # Housing Units | % Housing Units |
| 1-Person Household | 1,836 | 24.6% |
| 2-Person Household | 2,262 | 30.3% |
| 3-Person Household | 1,251 | 16.7% |
| 4+ Person Household | 2,125 | 28.4% |
| Total Housing Units | 7,474 | 100.0% |
Occupancy by Ownership by Household Size in Minidoka County
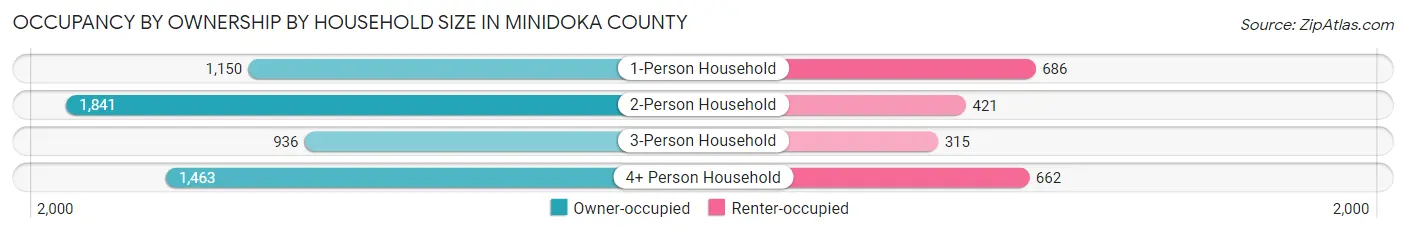
| Household Size | Owner-occupied | Renter-occupied |
| 1-Person Household | 1,150 (62.6%) | 686 (37.4%) |
| 2-Person Household | 1,841 (81.4%) | 421 (18.6%) |
| 3-Person Household | 936 (74.8%) | 315 (25.2%) |
| 4+ Person Household | 1,463 (68.9%) | 662 (31.1%) |
| Total Housing Units | 5,390 (72.1%) | 2,084 (27.9%) |
Occupancy by Educational Attainment in Minidoka County
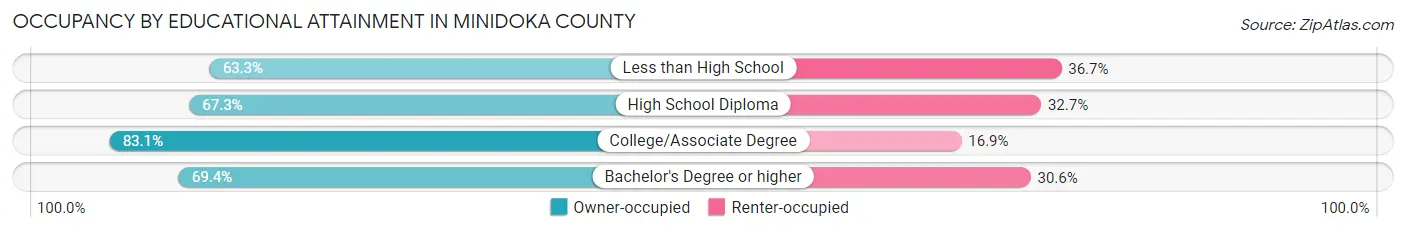
| Household Size | Owner-occupied | Renter-occupied |
| Less than High School | 786 (63.3%) | 456 (36.7%) |
| High School Diploma | 1,747 (67.3%) | 848 (32.7%) |
| College/Associate Degree | 2,018 (83.1%) | 410 (16.9%) |
| Bachelor's Degree or higher | 839 (69.4%) | 370 (30.6%) |
Occupancy by Age of Householder in Minidoka County
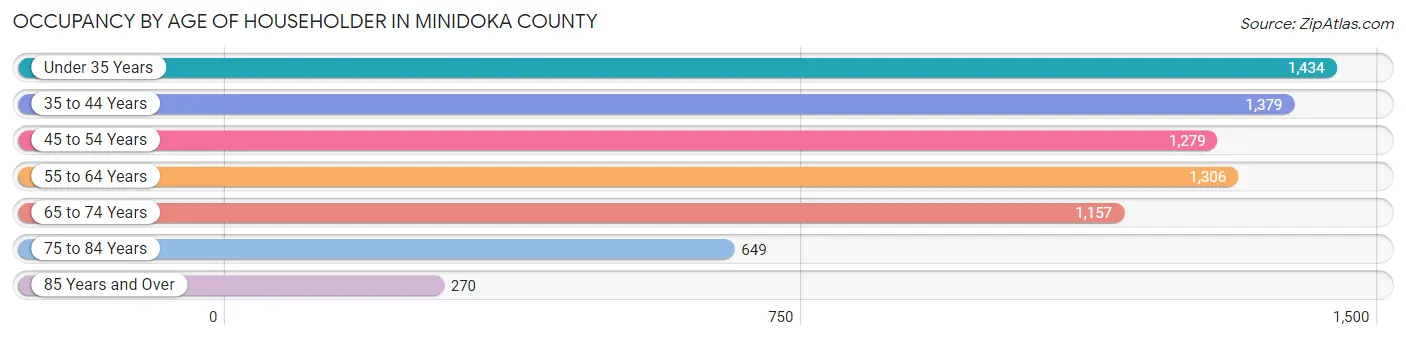
| Age Bracket | # Households | % Households |
| Under 35 Years | 1,434 | 19.2% |
| 35 to 44 Years | 1,379 | 18.4% |
| 45 to 54 Years | 1,279 | 17.1% |
| 55 to 64 Years | 1,306 | 17.5% |
| 65 to 74 Years | 1,157 | 15.5% |
| 75 to 84 Years | 649 | 8.7% |
| 85 Years and Over | 270 | 3.6% |
| Total | 7,474 | 100.0% |
Housing Finances in Minidoka County
Median Income by Occupancy in Minidoka County
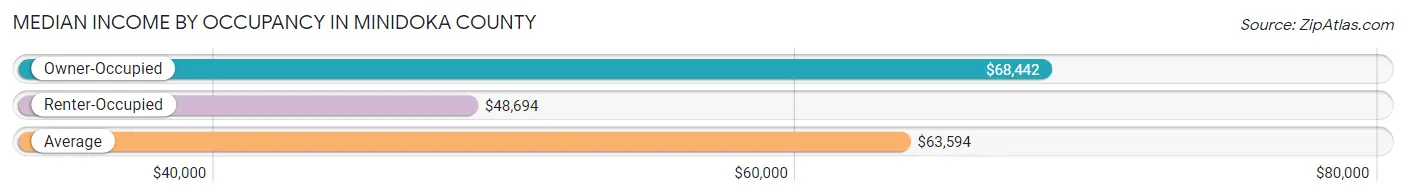
| Occupancy Type | # Households | Median Income |
| Owner-Occupied | 5,390 (72.1%) | $68,442 |
| Renter-Occupied | 2,084 (27.9%) | $48,694 |
| Average | 7,474 (100.0%) | $63,594 |
Occupancy by Householder Income Bracket in Minidoka County
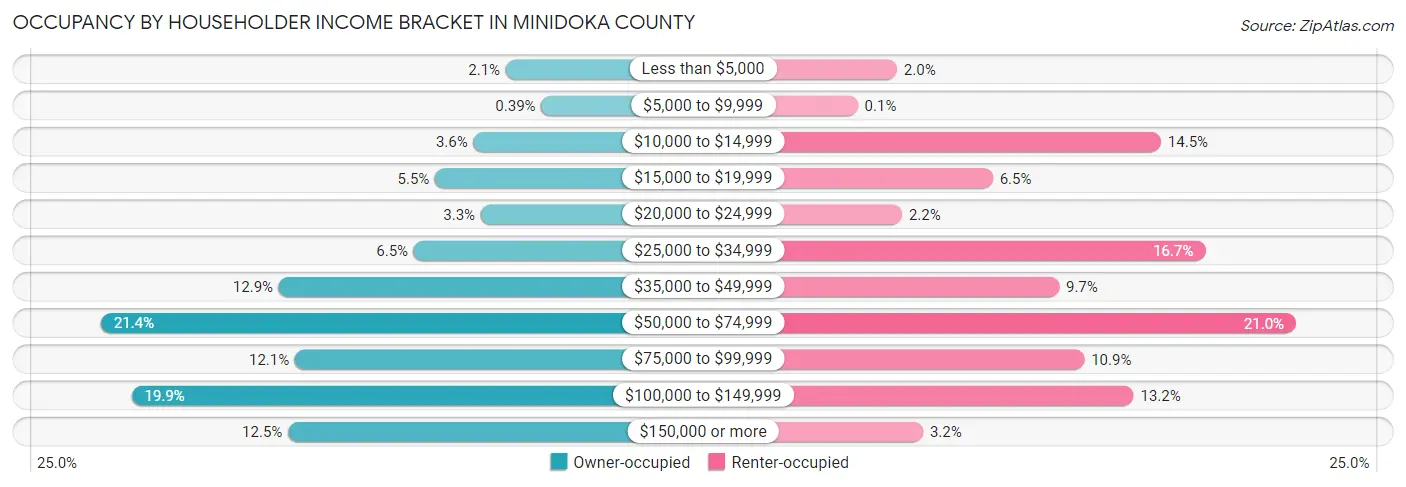
| Income Bracket | Owner-occupied | Renter-occupied |
| Less than $5,000 | 112 (2.1%) | 41 (2.0%) |
| $5,000 to $9,999 | 21 (0.4%) | 2 (0.1%) |
| $10,000 to $14,999 | 195 (3.6%) | 303 (14.5%) |
| $15,000 to $19,999 | 294 (5.4%) | 136 (6.5%) |
| $20,000 to $24,999 | 176 (3.3%) | 46 (2.2%) |
| $25,000 to $34,999 | 348 (6.5%) | 347 (16.7%) |
| $35,000 to $49,999 | 695 (12.9%) | 202 (9.7%) |
| $50,000 to $74,999 | 1,152 (21.4%) | 437 (21.0%) |
| $75,000 to $99,999 | 653 (12.1%) | 227 (10.9%) |
| $100,000 to $149,999 | 1,073 (19.9%) | 276 (13.2%) |
| $150,000 or more | 671 (12.4%) | 67 (3.2%) |
| Total | 5,390 (100.0%) | 2,084 (100.0%) |
Monthly Housing Cost Tiers in Minidoka County
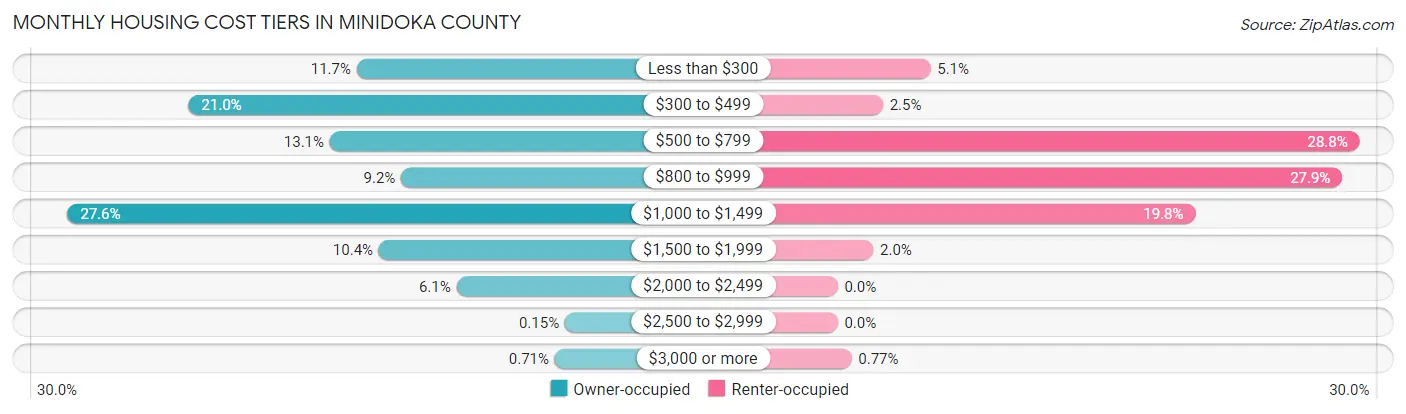
| Monthly Cost | Owner-occupied | Renter-occupied |
| Less than $300 | 628 (11.7%) | 107 (5.1%) |
| $300 to $499 | 1,129 (20.9%) | 52 (2.5%) |
| $500 to $799 | 708 (13.1%) | 601 (28.8%) |
| $800 to $999 | 496 (9.2%) | 581 (27.9%) |
| $1,000 to $1,499 | 1,490 (27.6%) | 412 (19.8%) |
| $1,500 to $1,999 | 562 (10.4%) | 41 (2.0%) |
| $2,000 to $2,499 | 331 (6.1%) | 0 (0.0%) |
| $2,500 to $2,999 | 8 (0.2%) | 0 (0.0%) |
| $3,000 or more | 38 (0.7%) | 16 (0.8%) |
| Total | 5,390 (100.0%) | 2,084 (100.0%) |
Physical Housing Characteristics in Minidoka County
Housing Structures in Minidoka County
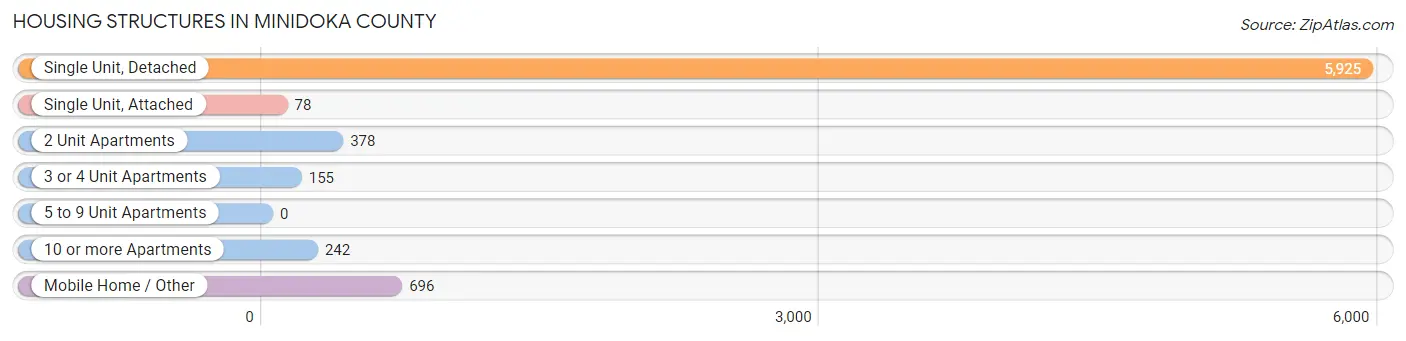
| Structure Type | # Housing Units | % Housing Units |
| Single Unit, Detached | 5,925 | 79.3% |
| Single Unit, Attached | 78 | 1.0% |
| 2 Unit Apartments | 378 | 5.1% |
| 3 or 4 Unit Apartments | 155 | 2.1% |
| 5 to 9 Unit Apartments | 0 | 0.0% |
| 10 or more Apartments | 242 | 3.2% |
| Mobile Home / Other | 696 | 9.3% |
| Total | 7,474 | 100.0% |
Housing Structures by Occupancy in Minidoka County
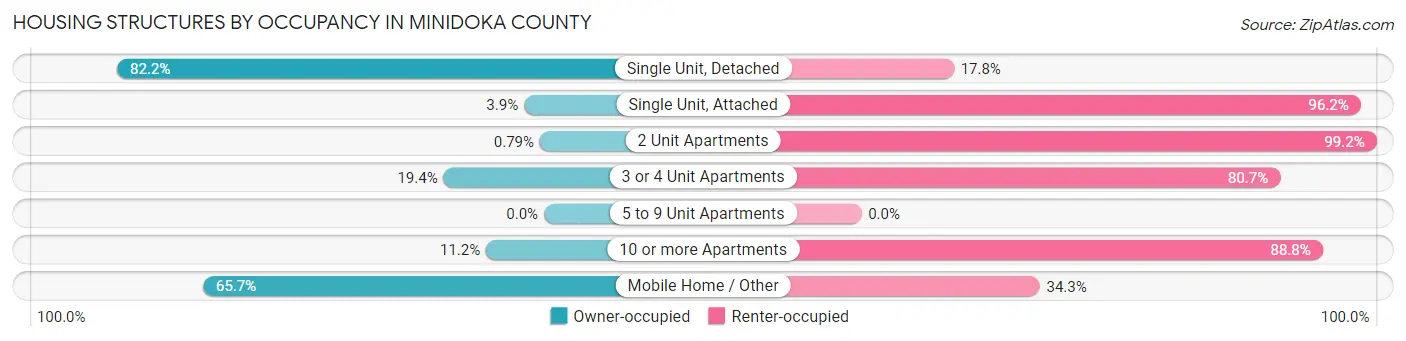
| Structure Type | Owner-occupied | Renter-occupied |
| Single Unit, Detached | 4,870 (82.2%) | 1,055 (17.8%) |
| Single Unit, Attached | 3 (3.8%) | 75 (96.2%) |
| 2 Unit Apartments | 3 (0.8%) | 375 (99.2%) |
| 3 or 4 Unit Apartments | 30 (19.4%) | 125 (80.6%) |
| 5 to 9 Unit Apartments | 0 (0.0%) | 0 (0.0%) |
| 10 or more Apartments | 27 (11.2%) | 215 (88.8%) |
| Mobile Home / Other | 457 (65.7%) | 239 (34.3%) |
| Total | 5,390 (72.1%) | 2,084 (27.9%) |
Housing Structures by Number of Rooms in Minidoka County
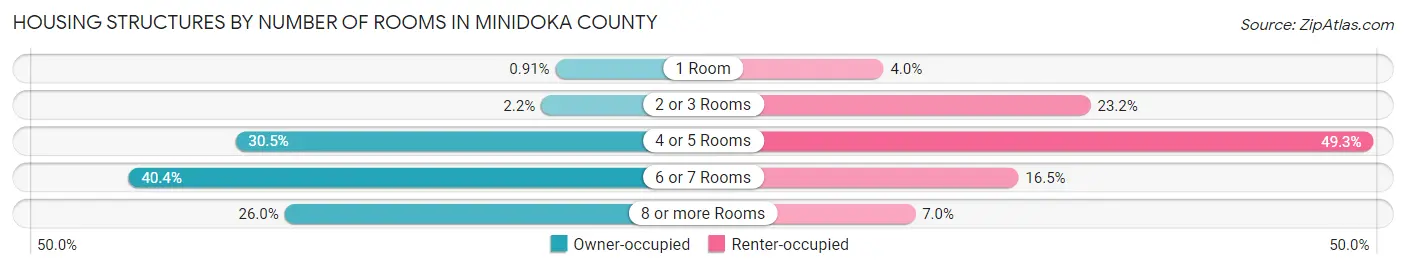
| Number of Rooms | Owner-occupied | Renter-occupied |
| 1 Room | 49 (0.9%) | 84 (4.0%) |
| 2 or 3 Rooms | 121 (2.2%) | 483 (23.2%) |
| 4 or 5 Rooms | 1,644 (30.5%) | 1,028 (49.3%) |
| 6 or 7 Rooms | 2,177 (40.4%) | 344 (16.5%) |
| 8 or more Rooms | 1,399 (26.0%) | 145 (7.0%) |
| Total | 5,390 (100.0%) | 2,084 (100.0%) |
Housing Structure by Heating Type in Minidoka County
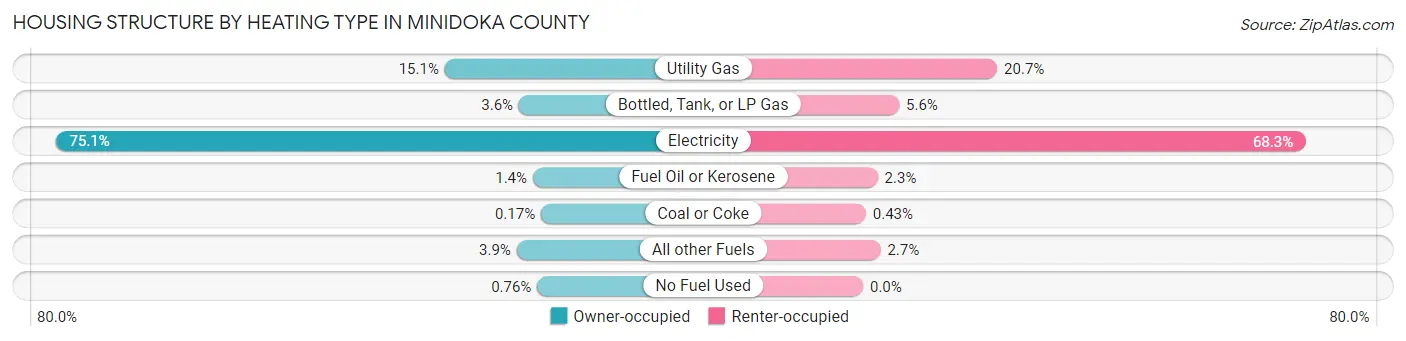
| Heating Type | Owner-occupied | Renter-occupied |
| Utility Gas | 811 (15.0%) | 432 (20.7%) |
| Bottled, Tank, or LP Gas | 193 (3.6%) | 116 (5.6%) |
| Electricity | 4,047 (75.1%) | 1,424 (68.3%) |
| Fuel Oil or Kerosene | 77 (1.4%) | 47 (2.3%) |
| Coal or Coke | 9 (0.2%) | 9 (0.4%) |
| All other Fuels | 212 (3.9%) | 56 (2.7%) |
| No Fuel Used | 41 (0.8%) | 0 (0.0%) |
| Total | 5,390 (100.0%) | 2,084 (100.0%) |
Household Vehicle Usage in Minidoka County
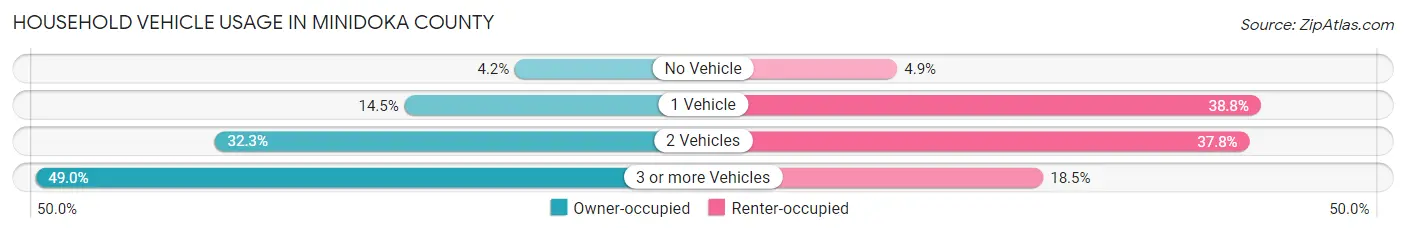
| Vehicles per Household | Owner-occupied | Renter-occupied |
| No Vehicle | 227 (4.2%) | 102 (4.9%) |
| 1 Vehicle | 783 (14.5%) | 809 (38.8%) |
| 2 Vehicles | 1,739 (32.3%) | 787 (37.8%) |
| 3 or more Vehicles | 2,641 (49.0%) | 386 (18.5%) |
| Total | 5,390 (100.0%) | 2,084 (100.0%) |
Real Estate & Mortgages in Minidoka County
Real Estate and Mortgage Overview in Minidoka County
| Characteristic | Without Mortgage | With Mortgage |
| Housing Units | 2,414 | 2,976 |
| Median Property Value | $194,700 | $201,000 |
| Median Household Income | $57,549 | $386 |
| Monthly Housing Costs | $386 | $38 |
| Real Estate Taxes | $956 | $43 |
Property Value by Mortgage Status in Minidoka County
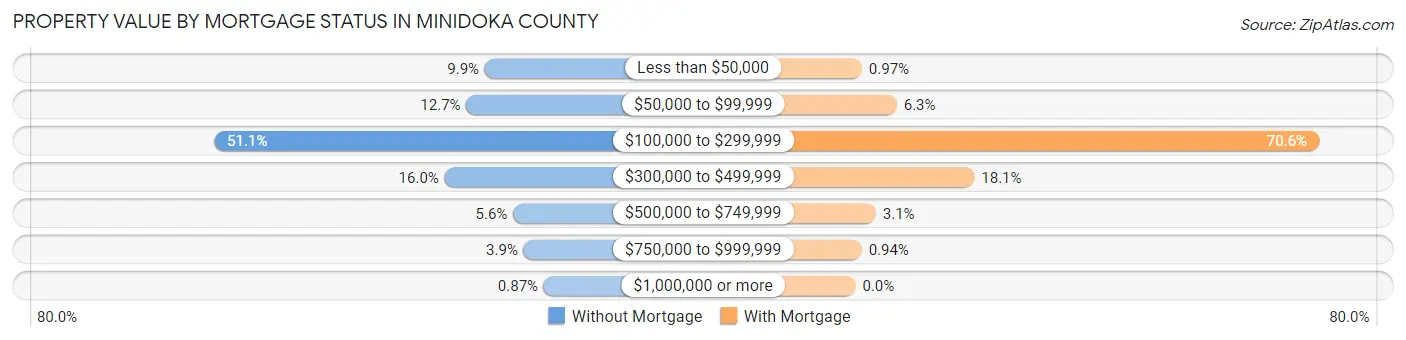
| Property Value | Without Mortgage | With Mortgage |
| Less than $50,000 | 238 (9.9%) | 29 (1.0%) |
| $50,000 to $99,999 | 306 (12.7%) | 187 (6.3%) |
| $100,000 to $299,999 | 1,234 (51.1%) | 2,101 (70.6%) |
| $300,000 to $499,999 | 386 (16.0%) | 539 (18.1%) |
| $500,000 to $749,999 | 134 (5.6%) | 92 (3.1%) |
| $750,000 to $999,999 | 95 (3.9%) | 28 (0.9%) |
| $1,000,000 or more | 21 (0.9%) | 0 (0.0%) |
| Total | 2,414 (100.0%) | 2,976 (100.0%) |
Household Income by Mortgage Status in Minidoka County
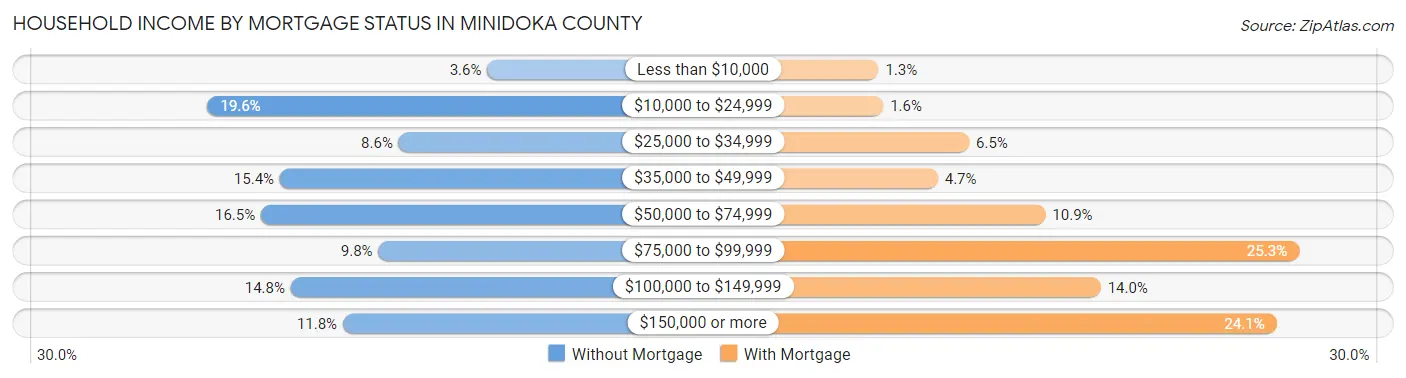
| Household Income | Without Mortgage | With Mortgage |
| Less than $10,000 | 86 (3.6%) | 39 (1.3%) |
| $10,000 to $24,999 | 472 (19.6%) | 47 (1.6%) |
| $25,000 to $34,999 | 208 (8.6%) | 193 (6.5%) |
| $35,000 to $49,999 | 372 (15.4%) | 140 (4.7%) |
| $50,000 to $74,999 | 398 (16.5%) | 323 (10.8%) |
| $75,000 to $99,999 | 236 (9.8%) | 754 (25.3%) |
| $100,000 to $149,999 | 357 (14.8%) | 417 (14.0%) |
| $150,000 or more | 285 (11.8%) | 716 (24.1%) |
| Total | 2,414 (100.0%) | 2,976 (100.0%) |
Property Value to Household Income Ratio in Minidoka County
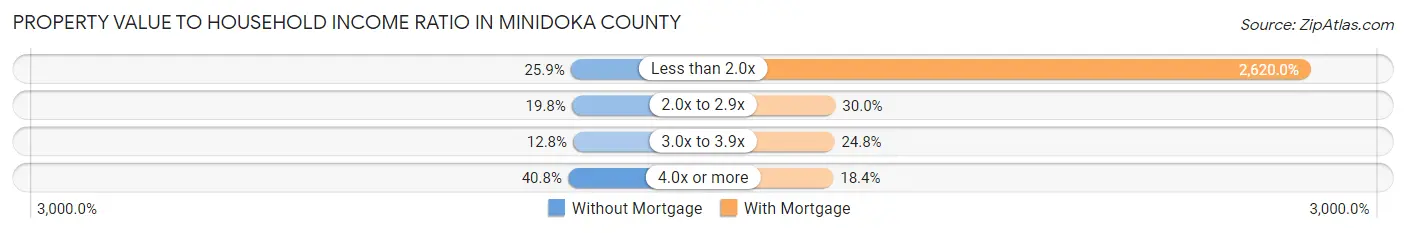
| Value-to-Income Ratio | Without Mortgage | With Mortgage |
| Less than 2.0x | 625 (25.9%) | 77,972 (2,620.0%) |
| 2.0x to 2.9x | 477 (19.8%) | 892 (30.0%) |
| 3.0x to 3.9x | 309 (12.8%) | 737 (24.8%) |
| 4.0x or more | 985 (40.8%) | 546 (18.3%) |
| Total | 2,414 (100.0%) | 2,976 (100.0%) |
Real Estate Taxes by Mortgage Status in Minidoka County
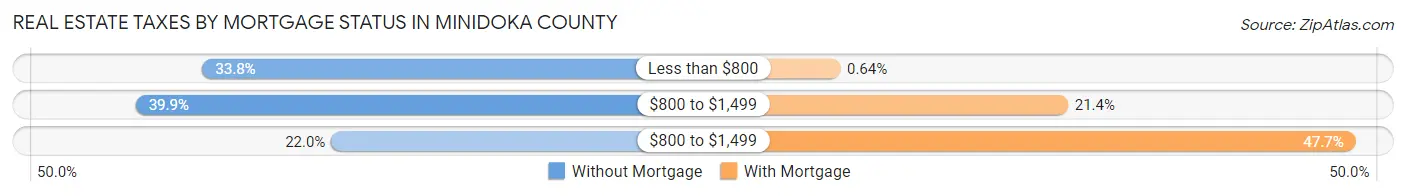
| Property Taxes | Without Mortgage | With Mortgage |
| Less than $800 | 815 (33.8%) | 19 (0.6%) |
| $800 to $1,499 | 962 (39.9%) | 638 (21.4%) |
| $800 to $1,499 | 531 (22.0%) | 1,420 (47.7%) |
| Total | 2,414 (100.0%) | 2,976 (100.0%) |
Health & Disability in Minidoka County
Health Insurance Coverage by Age in Minidoka County
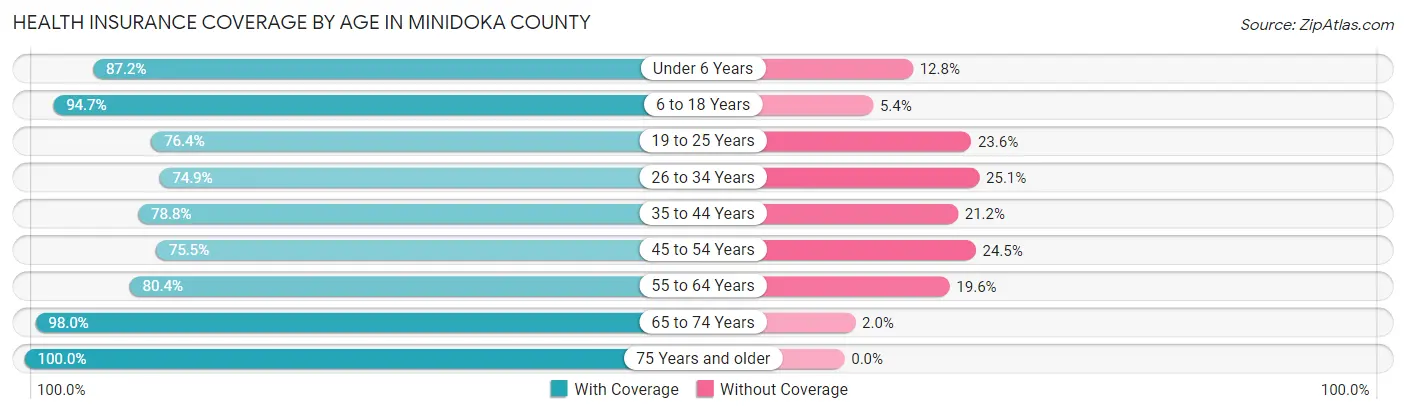
| Age Bracket | With Coverage | Without Coverage |
| Under 6 Years | 1,811 (87.2%) | 265 (12.8%) |
| 6 to 18 Years | 4,123 (94.7%) | 233 (5.3%) |
| 19 to 25 Years | 1,633 (76.4%) | 505 (23.6%) |
| 26 to 34 Years | 1,685 (74.9%) | 566 (25.1%) |
| 35 to 44 Years | 2,148 (78.8%) | 577 (21.2%) |
| 45 to 54 Years | 1,651 (75.5%) | 535 (24.5%) |
| 55 to 64 Years | 1,990 (80.4%) | 485 (19.6%) |
| 65 to 74 Years | 1,989 (98.0%) | 41 (2.0%) |
| 75 Years and older | 1,327 (100.0%) | 0 (0.0%) |
| Total | 18,357 (85.1%) | 3,207 (14.9%) |
Health Insurance Coverage by Citizenship Status in Minidoka County
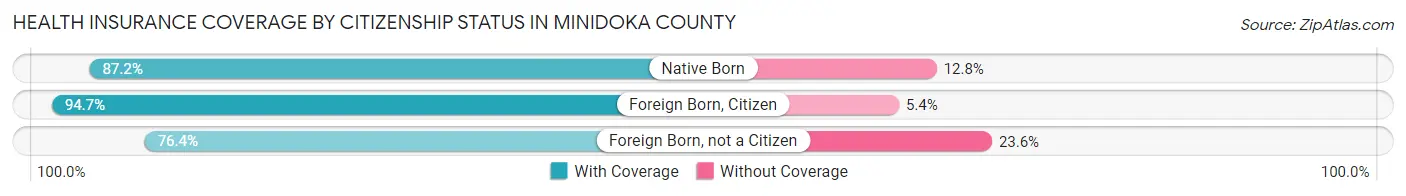
| Citizenship Status | With Coverage | Without Coverage |
| Native Born | 1,811 (87.2%) | 265 (12.8%) |
| Foreign Born, Citizen | 4,123 (94.7%) | 233 (5.3%) |
| Foreign Born, not a Citizen | 1,633 (76.4%) | 505 (23.6%) |
Health Insurance Coverage by Household Income in Minidoka County
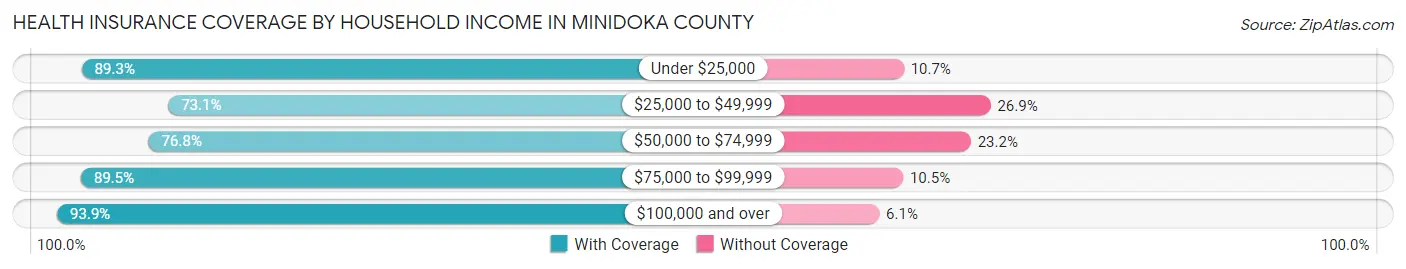
| Household Income | With Coverage | Without Coverage |
| Under $25,000 | 2,188 (89.3%) | 261 (10.7%) |
| $25,000 to $49,999 | 2,775 (73.1%) | 1,022 (26.9%) |
| $50,000 to $74,999 | 3,783 (76.8%) | 1,144 (23.2%) |
| $75,000 to $99,999 | 2,965 (89.5%) | 349 (10.5%) |
| $100,000 and over | 6,622 (93.9%) | 427 (6.1%) |
Public vs Private Health Insurance Coverage by Age in Minidoka County
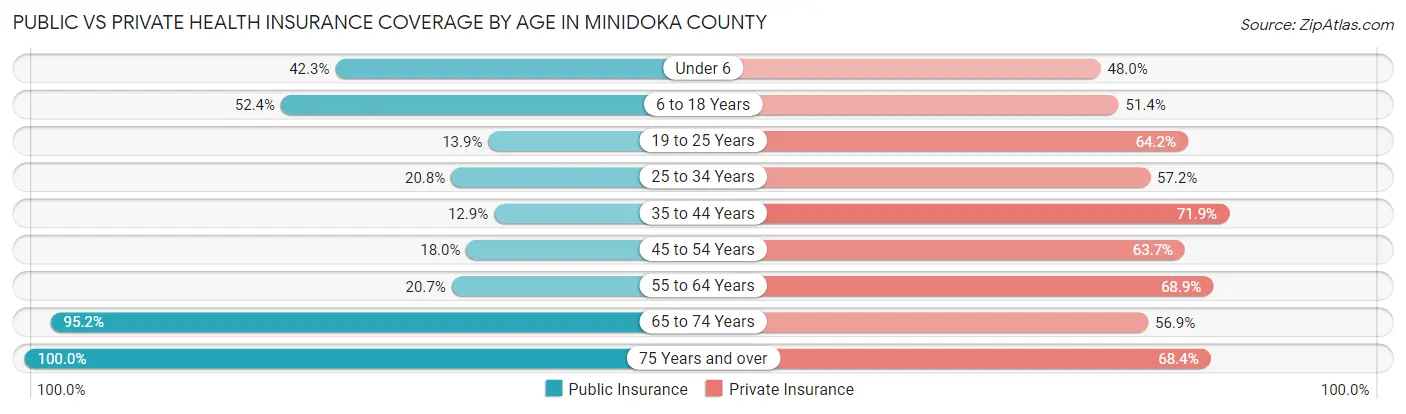
| Age Bracket | Public Insurance | Private Insurance |
| Under 6 | 879 (42.3%) | 997 (48.0%) |
| 6 to 18 Years | 2,284 (52.4%) | 2,238 (51.4%) |
| 19 to 25 Years | 298 (13.9%) | 1,373 (64.2%) |
| 25 to 34 Years | 469 (20.8%) | 1,288 (57.2%) |
| 35 to 44 Years | 351 (12.9%) | 1,958 (71.9%) |
| 45 to 54 Years | 394 (18.0%) | 1,392 (63.7%) |
| 55 to 64 Years | 513 (20.7%) | 1,706 (68.9%) |
| 65 to 74 Years | 1,932 (95.2%) | 1,154 (56.9%) |
| 75 Years and over | 1,327 (100.0%) | 908 (68.4%) |
| Total | 8,447 (39.2%) | 13,014 (60.4%) |
Disability Status by Sex by Age in Minidoka County
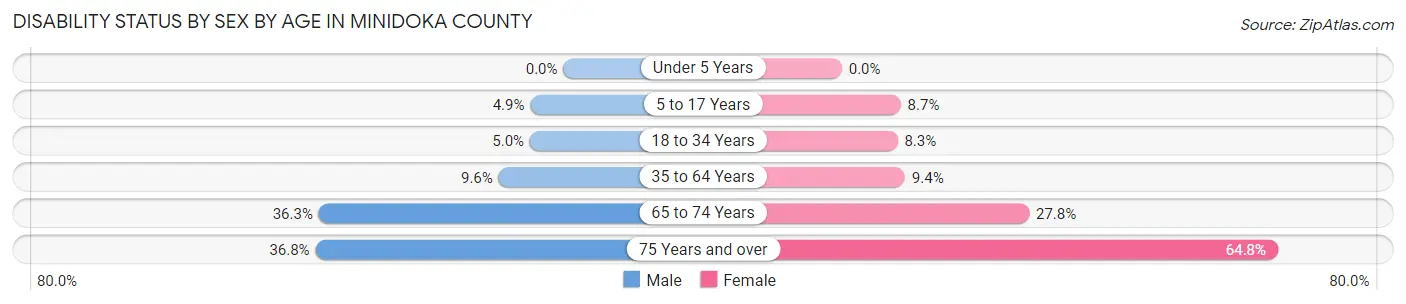
| Age Bracket | Male | Female |
| Under 5 Years | 0 (0.0%) | 0 (0.0%) |
| 5 to 17 Years | 119 (4.9%) | 196 (8.7%) |
| 18 to 34 Years | 115 (5.0%) | 185 (8.3%) |
| 35 to 64 Years | 363 (9.6%) | 338 (9.4%) |
| 65 to 74 Years | 365 (36.3%) | 285 (27.8%) |
| 75 Years and over | 219 (36.8%) | 474 (64.7%) |
Disability Class by Sex by Age in Minidoka County
Disability Class: Hearing Difficulty
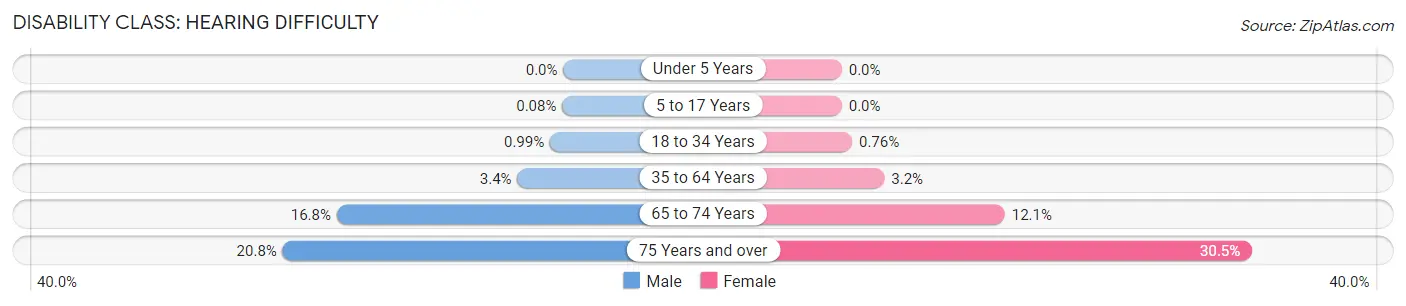
| Age Bracket | Male | Female |
| Under 5 Years | 0 (0.0%) | 0 (0.0%) |
| 5 to 17 Years | 2 (0.1%) | 0 (0.0%) |
| 18 to 34 Years | 23 (1.0%) | 17 (0.8%) |
| 35 to 64 Years | 129 (3.4%) | 114 (3.2%) |
| 65 to 74 Years | 169 (16.8%) | 124 (12.1%) |
| 75 Years and over | 124 (20.8%) | 223 (30.5%) |
Disability Class: Vision Difficulty
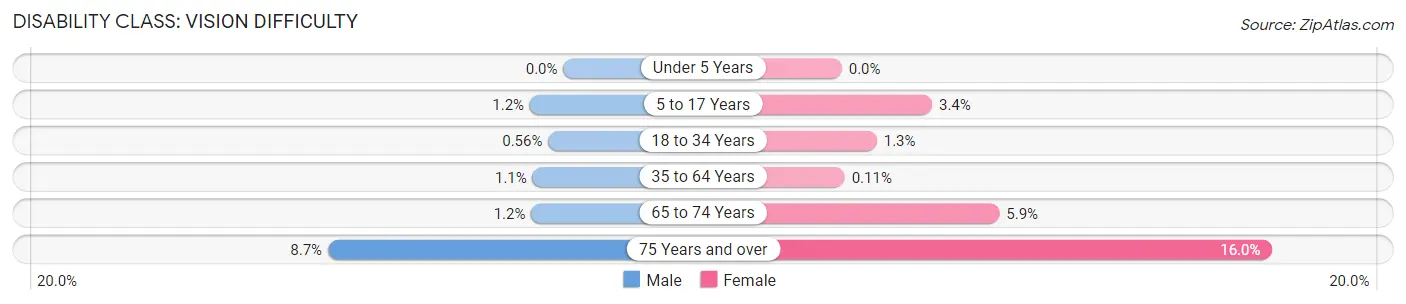
| Age Bracket | Male | Female |
| Under 5 Years | 0 (0.0%) | 0 (0.0%) |
| 5 to 17 Years | 30 (1.2%) | 75 (3.4%) |
| 18 to 34 Years | 13 (0.6%) | 29 (1.3%) |
| 35 to 64 Years | 43 (1.1%) | 4 (0.1%) |
| 65 to 74 Years | 12 (1.2%) | 60 (5.9%) |
| 75 Years and over | 52 (8.7%) | 117 (16.0%) |
Disability Class: Cognitive Difficulty
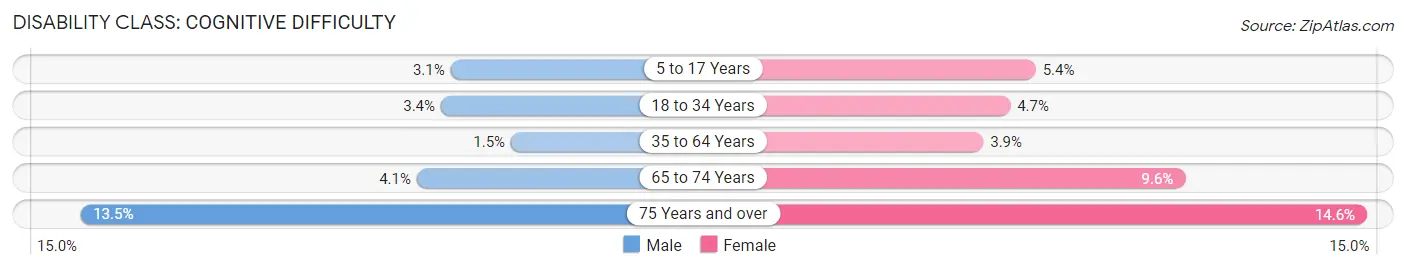
| Age Bracket | Male | Female |
| 5 to 17 Years | 76 (3.1%) | 121 (5.4%) |
| 18 to 34 Years | 79 (3.4%) | 105 (4.7%) |
| 35 to 64 Years | 55 (1.5%) | 142 (3.9%) |
| 65 to 74 Years | 41 (4.1%) | 98 (9.6%) |
| 75 Years and over | 80 (13.5%) | 107 (14.6%) |
Disability Class: Ambulatory Difficulty
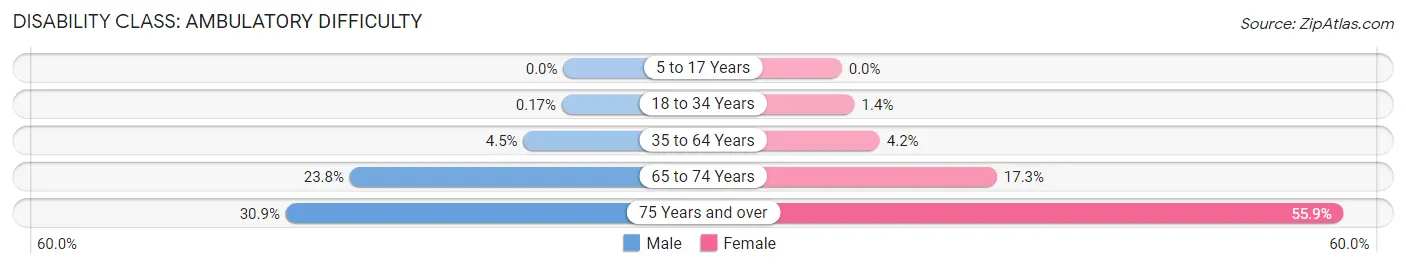
| Age Bracket | Male | Female |
| 5 to 17 Years | 0 (0.0%) | 0 (0.0%) |
| 18 to 34 Years | 4 (0.2%) | 32 (1.4%) |
| 35 to 64 Years | 168 (4.4%) | 153 (4.2%) |
| 65 to 74 Years | 239 (23.8%) | 177 (17.3%) |
| 75 Years and over | 184 (30.9%) | 409 (55.9%) |
Disability Class: Self-Care Difficulty
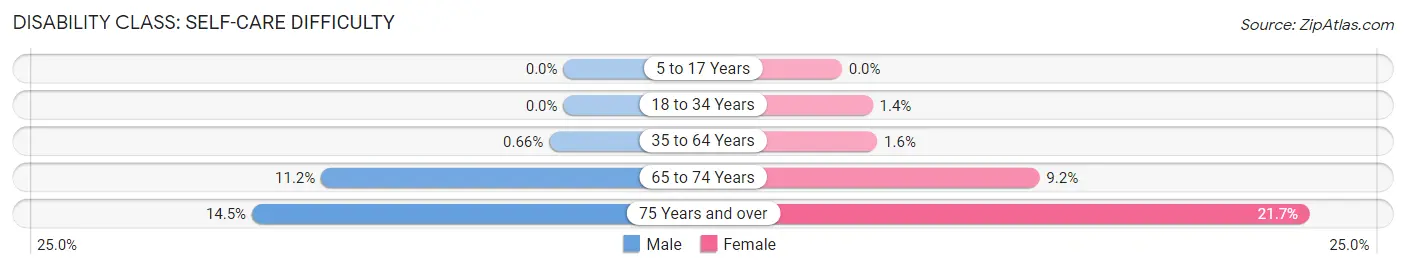
| Age Bracket | Male | Female |
| 5 to 17 Years | 0 (0.0%) | 0 (0.0%) |
| 18 to 34 Years | 0 (0.0%) | 32 (1.4%) |
| 35 to 64 Years | 25 (0.7%) | 59 (1.6%) |
| 65 to 74 Years | 113 (11.2%) | 94 (9.2%) |
| 75 Years and over | 86 (14.4%) | 159 (21.7%) |
Technology Access in Minidoka County
Computing Device Access in Minidoka County
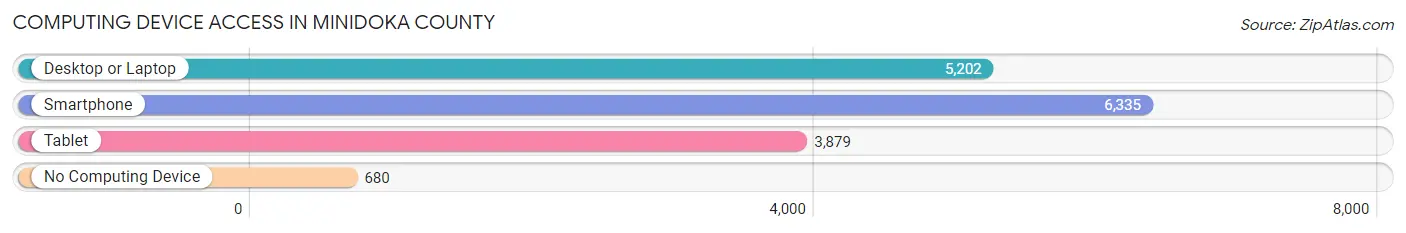
| Device Type | # Households | % Households |
| Desktop or Laptop | 5,202 | 69.6% |
| Smartphone | 6,335 | 84.8% |
| Tablet | 3,879 | 51.9% |
| No Computing Device | 680 | 9.1% |
| Total | 7,474 | 100.0% |
Internet Access in Minidoka County
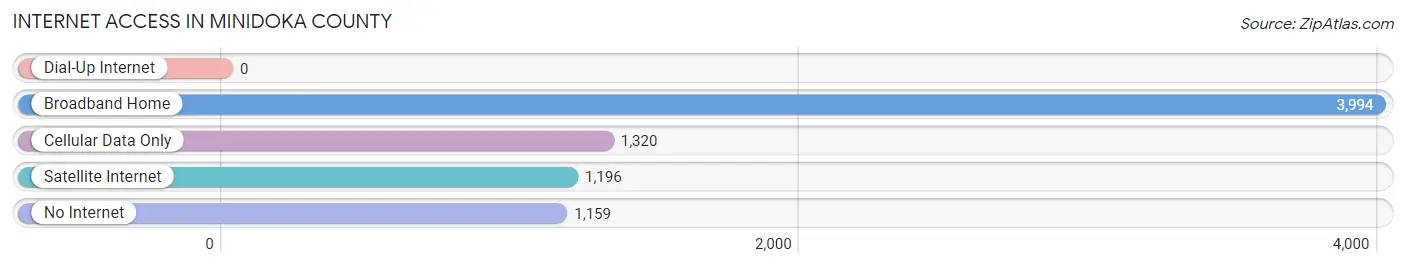
| Internet Type | # Households | % Households |
| Dial-Up Internet | 0 | 0.0% |
| Broadband Home | 3,994 | 53.4% |
| Cellular Data Only | 1,320 | 17.7% |
| Satellite Internet | 1,196 | 16.0% |
| No Internet | 1,159 | 15.5% |
| Total | 7,474 | 100.0% |
Minidoka County Summary
Minidoka County is located in the south-central region of Idaho, and is bordered by Cassia County to the north, Lincoln County to the east, Jerome County to the south, and Twin Falls County to the west. The county seat is Rupert, and the largest city is Heyburn. The county was established in 1913 and named after the Minidoka Dam, which was built on the Snake River in 1906.
Geography
Minidoka County covers an area of 1,722 square miles, making it the fourth-largest county in Idaho. The terrain is mostly flat, with some rolling hills in the northern part of the county. The Snake River forms the western border of the county, and the Raft River flows through the northern part of the county. The county is home to several lakes, including Lake Walcott, Lake Cleveland, and Lake Tiber.
The climate of Minidoka County is semi-arid, with hot summers and cold winters. The average annual precipitation is about 11 inches, and the average annual temperature is about 50 degrees Fahrenheit.
Demographics
As of the 2010 census, there were 21,233 people, 6,945 households, and 5,072 families living in Minidoka County. The population density was 12.3 people per square mile. The racial makeup of the county was 81.2% White, 0.7% African American, 0.7% Native American, 0.4% Asian, 0.1% Pacific Islander, 14.7% from other races, and 2.2% from two or more races. Hispanic or Latino of any race were 24.3% of the population.
The median income for a household in Minidoka County was $37,945, and the median income for a family was $45,945. The per capita income for the county was $17,845. About 14.2% of families and 18.2% of the population were below the poverty line, including 25.2% of those under age 18 and 8.7% of those age 65 or over.
Economy
The economy of Minidoka County is largely based on agriculture. The county is home to several large farms, and the main crops grown are potatoes, sugar beets, corn, and wheat. The county is also home to several food processing plants, including the Idahoan Foods plant in Rupert.
The county is also home to several manufacturing companies, including the Minidoka County Manufacturing Company, which produces plastic products, and the Minidoka County Textile Company, which produces clothing.
The county is also home to several tourist attractions, including the Minidoka National Historic Site, which commemorates the internment of Japanese Americans during World War II, and the Minidoka Dam, which is a popular spot for fishing and boating.
Conclusion
Minidoka County is a rural county located in south-central Idaho. The county is home to a diverse population, and the economy is largely based on agriculture and manufacturing. The county is also home to several tourist attractions, including the Minidoka National Historic Site and the Minidoka Dam.
Common Questions
What is the Total Population of Minidoka County?
Total Population of Minidoka County is 21,626.
What is the Total Male Population of Minidoka County?
Total Male Population of Minidoka County is 10,930.
What is the Total Female Population of Minidoka County?
Total Female Population of Minidoka County is 10,696.
What is the Ratio of Males per 100 Females in Minidoka County?
There are 102.19 Males per 100 Females in Minidoka County.
What is the Ratio of Females per 100 Males in Minidoka County?
There are 97.86 Females per 100 Males in Minidoka County.
What is the Median Population Age in Minidoka County?
Median Population Age in Minidoka County is 34.9 Years.
What is the Average Family Size in Minidoka County
Average Family Size in Minidoka County is 3.4 People.
What is the Average Household Size in Minidoka County
Average Household Size in Minidoka County is 2.9 People.
What is Per Capita Income in Minidoka County?
Per Capita income in Minidoka County is $29,561.
What is the Median Family Income in Minidoka County?
Median Family Income in Minidoka County is $71,522.
What is the Median Household income in Minidoka County?
Median Household Income in Minidoka County is $63,594.
What is Income or Wage Gap in Minidoka County?
Income or Wage Gap in Minidoka County is 47.9%.
Women in Minidoka County earn 52.1 cents for every dollar earned by a man.
What is Inequality or Gini Index in Minidoka County?
Inequality or Gini Index in Minidoka County is 0.43.
How Large is the Labor Force in Minidoka County?
There are 10,406 People in the Labor Forcein in Minidoka County.
What is the Percentage of People in the Labor Force in Minidoka County?
64.6% of People are in the Labor Force in Minidoka County.
What is the Unemployment Rate in Minidoka County?
Unemployment Rate in Minidoka County is 3.3%.