Madison County, ID
Madison County Map
Madison County Overview
52,487
TOTAL POPULATION
23,769
MALE POPULATION
28,718
FEMALE POPULATION
82.77
MALES / 100 FEMALES
120.82
FEMALES / 100 MALES
21.6
MEDIAN AGE
3.8
AVG FAMILY SIZE
3.9
AVG HOUSEHOLD SIZE
$21,394
PER CAPITA INCOME
$59,091
AVG FAMILY INCOME
$53,025
AVG HOUSEHOLD INCOME
47.7%
WAGE / INCOME GAP [ % ]
52.3¢/ $1
WAGE / INCOME GAP [ $ ]
0.52
INEQUALITY / GINI INDEX
29,090
LABOR FORCE [ PEOPLE ]
67.3%
PERCENT IN LABOR FORCE
8.1%
UNEMPLOYMENT RATE
Madison County Area Codes
Race in Madison County
The most populous races in Madison County are White / Caucasian (46,754 | 89.1%), Hispanic or Latino (4,382 | 8.4%), and Two or more Races (2,698 | 5.1%).

| Race | # Population | % Population |
| Asian | 949 | 1.8% |
| Black / African American | 487 | 0.9% |
| Hawaiian / Pacific | 65 | 0.1% |
| Hispanic or Latino | 4,382 | 8.4% |
| Native / Alaskan | 158 | 0.3% |
| White / Caucasian | 46,754 | 89.1% |
| Two or more Races | 2,698 | 5.1% |
| Some other Race | 1,376 | 2.6% |
| Total | 52,487 | 100.0% |
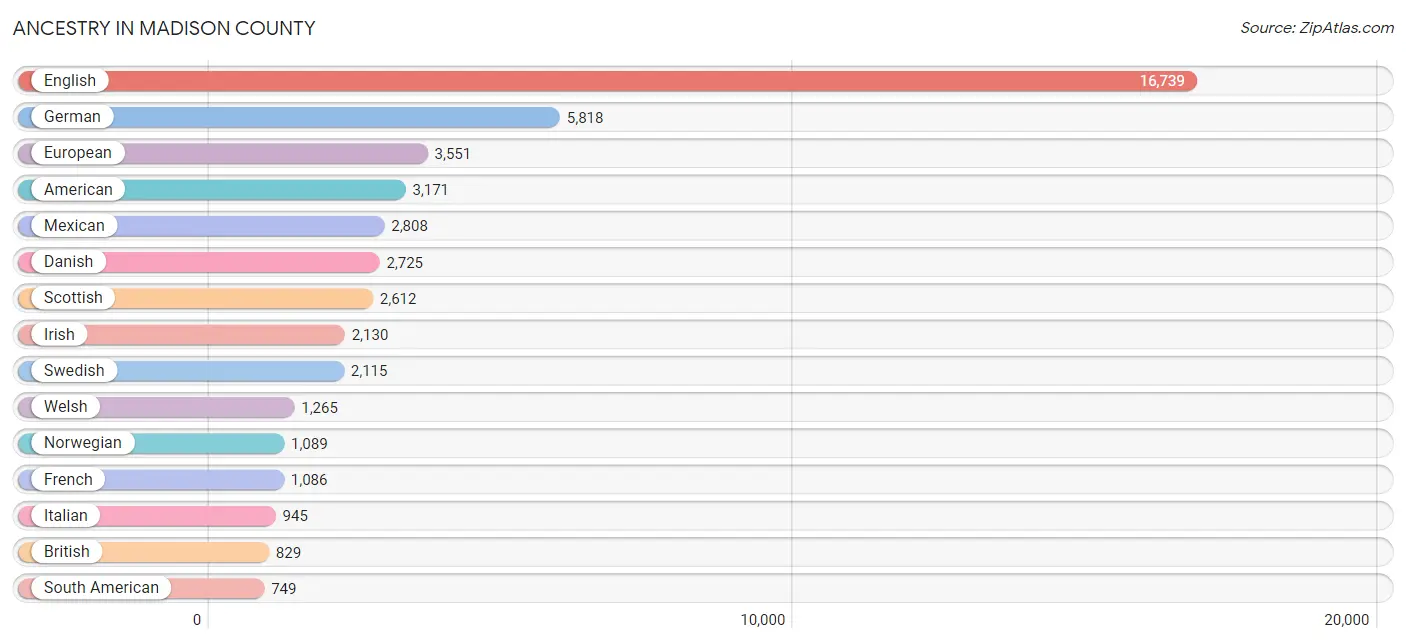
Ancestry in Madison County
The most populous ancestries reported in Madison County are English (16,739 | 31.9%), German (5,818 | 11.1%), European (3,551 | 6.8%), American (3,171 | 6.0%), and Mexican (2,808 | 5.3%), together accounting for 61.1% of all Madison County residents.
| Ancestry | # Population | % Population |
| African | 183 | 0.4% |
| Albanian | 10 | 0.0% |
| American | 3,171 | 6.0% |
| Arab | 28 | 0.1% |
| Argentinean | 68 | 0.1% |
| Armenian | 79 | 0.2% |
| Austrian | 69 | 0.1% |
| Bangladeshi | 197 | 0.4% |
| Belgian | 9 | 0.0% |
| Bhutanese | 101 | 0.2% |
| Brazilian | 175 | 0.3% |
| British | 829 | 1.6% |
| Burmese | 123 | 0.2% |
| Canadian | 114 | 0.2% |
| Central American | 199 | 0.4% |
| Central American Indian | 3 | 0.0% |
| Cherokee | 93 | 0.2% |
| Chilean | 27 | 0.1% |
| Choctaw | 98 | 0.2% |
| Colombian | 152 | 0.3% |
| Croatian | 13 | 0.0% |
| Cuban | 99 | 0.2% |
| Czech | 435 | 0.8% |
| Czechoslovakian | 116 | 0.2% |
| Danish | 2,725 | 5.2% |
| Dominican | 82 | 0.2% |
| Dutch | 569 | 1.1% |
| Eastern European | 13 | 0.0% |
| Ecuadorian | 208 | 0.4% |
| English | 16,739 | 31.9% |
| European | 3,551 | 6.8% |
| Filipino | 99 | 0.2% |
| Finnish | 26 | 0.1% |
| French | 1,086 | 2.1% |
| French Canadian | 19 | 0.0% |
| German | 5,818 | 11.1% |
| Ghanaian | 2 | 0.0% |
| Greek | 18 | 0.0% |
| Guatemalan | 63 | 0.1% |
| Haitian | 67 | 0.1% |
| Honduran | 13 | 0.0% |
| Hungarian | 23 | 0.0% |
| Indian (Asian) | 467 | 0.9% |
| Inupiat | 12 | 0.0% |
| Irish | 2,130 | 4.1% |
| Italian | 945 | 1.8% |
| Korean | 451 | 0.9% |
| Laotian | 37 | 0.1% |
| Lebanese | 28 | 0.1% |
| Lithuanian | 28 | 0.1% |
| Mexican | 2,808 | 5.3% |
| Mexican American Indian | 17 | 0.0% |
| Native Hawaiian | 182 | 0.4% |
| Navajo | 101 | 0.2% |
| Nicaraguan | 31 | 0.1% |
| Northern European | 84 | 0.2% |
| Norwegian | 1,089 | 2.1% |
| Paiute | 12 | 0.0% |
| Pakistani | 1 | 0.0% |
| Peruvian | 24 | 0.1% |
| Polish | 321 | 0.6% |
| Portuguese | 162 | 0.3% |
| Puerto Rican | 104 | 0.2% |
| Romanian | 30 | 0.1% |
| Russian | 160 | 0.3% |
| Salvadoran | 92 | 0.2% |
| Samoan | 48 | 0.1% |
| Scandinavian | 372 | 0.7% |
| Scotch-Irish | 300 | 0.6% |
| Scottish | 2,612 | 5.0% |
| Sierra Leonean | 15 | 0.0% |
| Slovak | 23 | 0.0% |
| South American | 749 | 1.4% |
| Spaniard | 56 | 0.1% |
| Subsaharan African | 200 | 0.4% |
| Swedish | 2,115 | 4.0% |
| Swiss | 399 | 0.8% |
| Tongan | 69 | 0.1% |
| Ukrainian | 32 | 0.1% |
| Venezuelan | 228 | 0.4% |
| Welsh | 1,265 | 2.4% | View All 81 Rows |
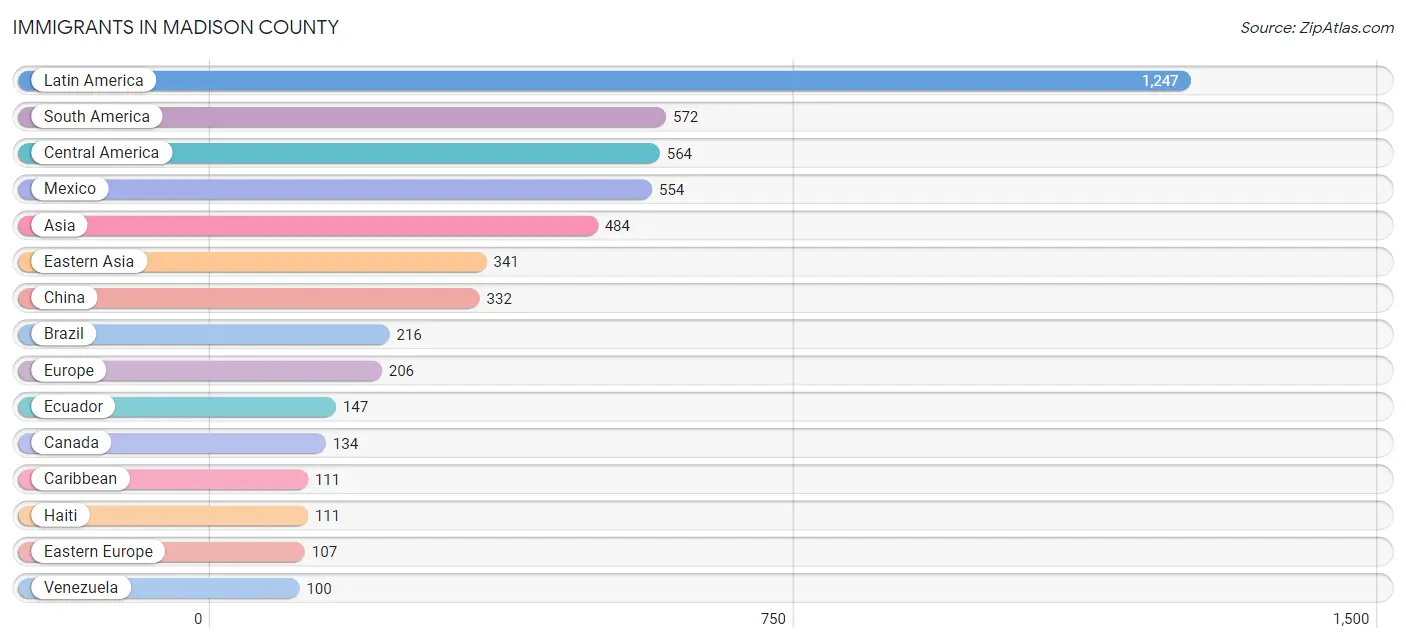
Immigrants in Madison County
The most numerous immigrant groups reported in Madison County came from Latin America (1,247 | 2.4%), South America (572 | 1.1%), Central America (564 | 1.1%), Mexico (554 | 1.1%), and Asia (484 | 0.9%), together accounting for 6.5% of all Madison County residents.
| Immigration Origin | # Population | % Population |
| Africa | 69 | 0.1% |
| Asia | 484 | 0.9% |
| Brazil | 216 | 0.4% |
| Canada | 134 | 0.3% |
| Caribbean | 111 | 0.2% |
| Central America | 564 | 1.1% |
| Chile | 17 | 0.0% |
| China | 332 | 0.6% |
| Colombia | 78 | 0.2% |
| Eastern Asia | 341 | 0.6% |
| Eastern Europe | 107 | 0.2% |
| Ecuador | 147 | 0.3% |
| El Salvador | 1 | 0.0% |
| England | 16 | 0.0% |
| Europe | 206 | 0.4% |
| France | 36 | 0.1% |
| Germany | 8 | 0.0% |
| Ghana | 47 | 0.1% |
| Haiti | 111 | 0.2% |
| Hong Kong | 61 | 0.1% |
| Italy | 14 | 0.0% |
| Japan | 5 | 0.0% |
| Korea | 4 | 0.0% |
| Kuwait | 49 | 0.1% |
| Latin America | 1,247 | 2.4% |
| Mexico | 554 | 1.1% |
| Moldova | 12 | 0.0% |
| Netherlands | 2 | 0.0% |
| Nicaragua | 9 | 0.0% |
| Northern Europe | 39 | 0.1% |
| Peru | 14 | 0.0% |
| Philippines | 47 | 0.1% |
| Russia | 67 | 0.1% |
| Sierra Leone | 15 | 0.0% |
| South Africa | 7 | 0.0% |
| South America | 572 | 1.1% |
| South Eastern Asia | 79 | 0.2% |
| Southern Europe | 14 | 0.0% |
| Sweden | 13 | 0.0% |
| Syria | 15 | 0.0% |
| Taiwan | 99 | 0.2% |
| Thailand | 32 | 0.1% |
| Ukraine | 28 | 0.1% |
| Venezuela | 100 | 0.2% |
| Western Africa | 62 | 0.1% |
| Western Asia | 64 | 0.1% |
| Western Europe | 46 | 0.1% | View All 47 Rows |
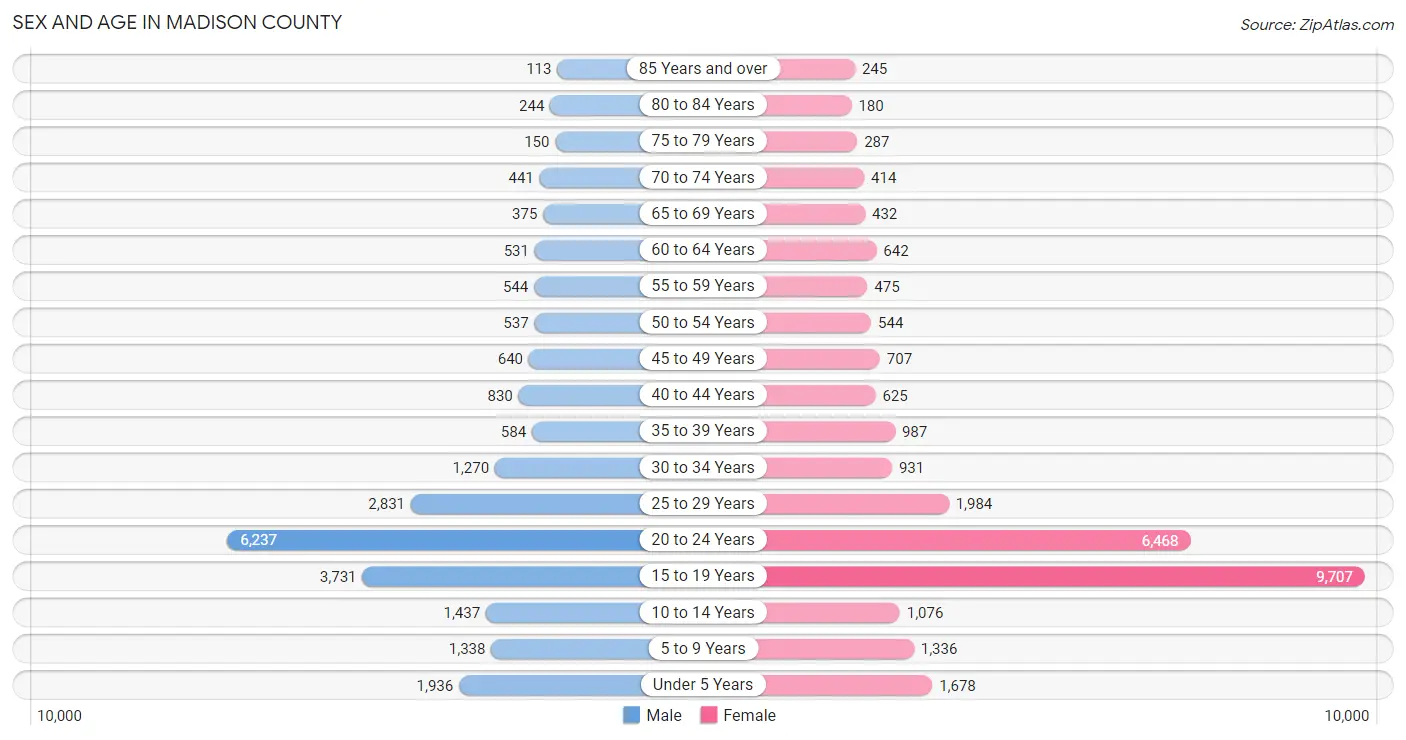
Sex and Age in Madison County
Sex and Age in Madison County
The most populous age groups in Madison County are 20 to 24 Years (6,237 | 26.2%) for men and 15 to 19 Years (9,707 | 33.8%) for women.
| Age Bracket | Male | Female |
| Under 5 Years | 1,936 (8.2%) | 1,678 (5.8%) |
| 5 to 9 Years | 1,338 (5.6%) | 1,336 (4.6%) |
| 10 to 14 Years | 1,437 (6.0%) | 1,076 (3.7%) |
| 15 to 19 Years | 3,731 (15.7%) | 9,707 (33.8%) |
| 20 to 24 Years | 6,237 (26.2%) | 6,468 (22.5%) |
| 25 to 29 Years | 2,831 (11.9%) | 1,984 (6.9%) |
| 30 to 34 Years | 1,270 (5.3%) | 931 (3.2%) |
| 35 to 39 Years | 584 (2.5%) | 987 (3.4%) |
| 40 to 44 Years | 830 (3.5%) | 625 (2.2%) |
| 45 to 49 Years | 640 (2.7%) | 707 (2.5%) |
| 50 to 54 Years | 537 (2.3%) | 544 (1.9%) |
| 55 to 59 Years | 544 (2.3%) | 475 (1.7%) |
| 60 to 64 Years | 531 (2.2%) | 642 (2.2%) |
| 65 to 69 Years | 375 (1.6%) | 432 (1.5%) |
| 70 to 74 Years | 441 (1.9%) | 414 (1.4%) |
| 75 to 79 Years | 150 (0.6%) | 287 (1.0%) |
| 80 to 84 Years | 244 (1.0%) | 180 (0.6%) |
| 85 Years and over | 113 (0.5%) | 245 (0.9%) |
| Total | 23,769 (100.0%) | 28,718 (100.0%) |
Families and Households in Madison County
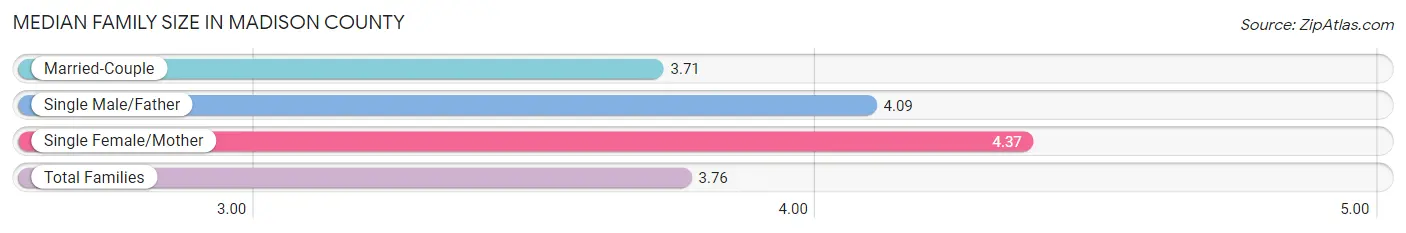
Median Family Size in Madison County
The median family size in Madison County is 3.76 persons per family, with single female/mother families (597 | 6.6%) accounting for the largest median family size of 4.37 persons per family. On the other hand, married-couple families (8,358 | 92.2%) represent the smallest median family size with 3.71 persons per family.
| Family Type | # Families | Family Size |
| Married-Couple | 8,358 (92.2%) | 3.71 |
| Single Male/Father | 111 (1.2%) | 4.09 |
| Single Female/Mother | 597 (6.6%) | 4.37 |
| Total Families | 9,066 (100.0%) | 3.76 |
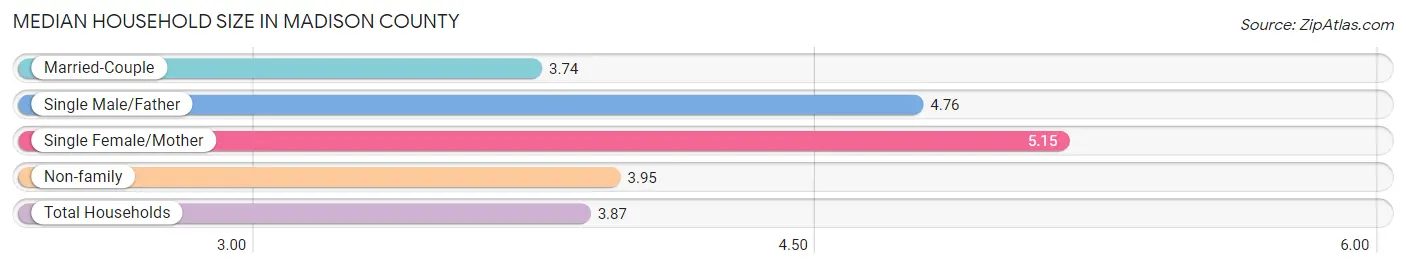
Median Household Size in Madison County
The median household size in Madison County is 3.87 persons per household, with single female/mother households (597 | 5.0%) accounting for the largest median household size of 5.15 persons per household. married-couple households (8,358 | 69.8%) represent the smallest median household size with 3.74 persons per household.
| Household Type | # Households | Household Size |
| Married-Couple | 8,358 (69.8%) | 3.74 |
| Single Male/Father | 111 (0.9%) | 4.76 |
| Single Female/Mother | 597 (5.0%) | 5.15 |
| Non-family | 2,913 (24.3%) | 3.95 |
| Total Households | 11,979 (100.0%) | 3.87 |
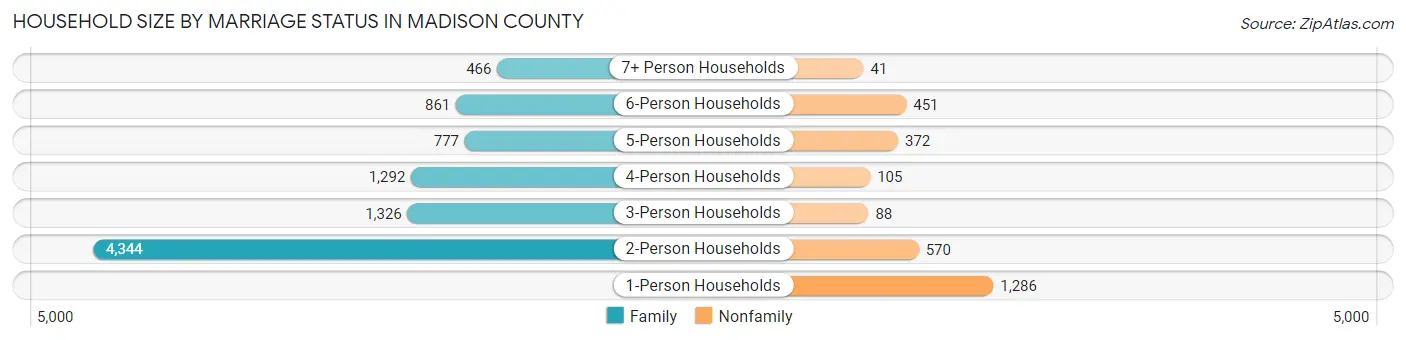
Household Size by Marriage Status in Madison County
Out of a total of 11,979 households in Madison County, 9,066 (75.7%) are family households, while 2,913 (24.3%) are nonfamily households. The most numerous type of family households are 2-person households, comprising 4,344, and the most common type of nonfamily households are 1-person households, comprising 1,286.
| Household Size | Family Households | Nonfamily Households |
| 1-Person Households | - | 1,286 (10.7%) |
| 2-Person Households | 4,344 (36.3%) | 570 (4.8%) |
| 3-Person Households | 1,326 (11.1%) | 88 (0.7%) |
| 4-Person Households | 1,292 (10.8%) | 105 (0.9%) |
| 5-Person Households | 777 (6.5%) | 372 (3.1%) |
| 6-Person Households | 861 (7.2%) | 451 (3.8%) |
| 7+ Person Households | 466 (3.9%) | 41 (0.3%) |
| Total | 9,066 (75.7%) | 2,913 (24.3%) |
Female Fertility in Madison County
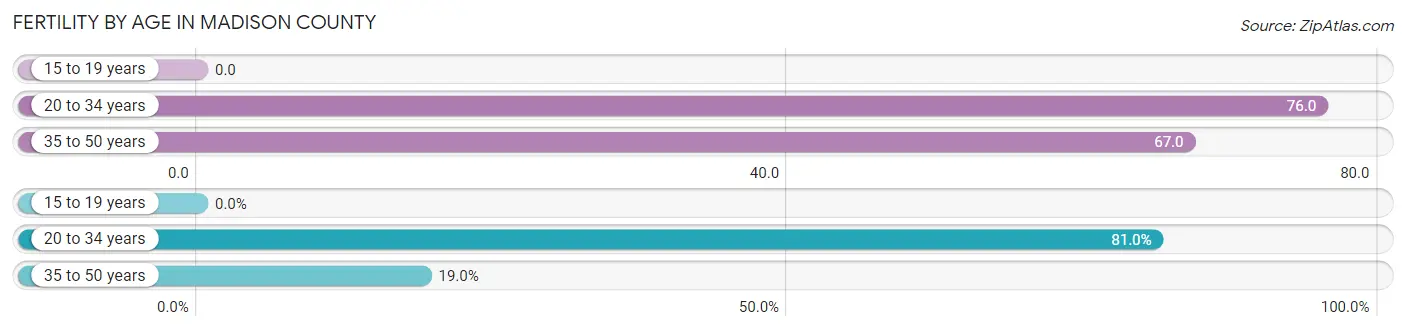
Fertility by Age in Madison County
Average fertility rate in Madison County is 41.0 births per 1,000 women. Women in the age bracket of 20 to 34 years have the highest fertility rate with 76.0 births per 1,000 women. Women in the age bracket of 20 to 34 years acount for 81.0% of all women with births.
| Age Bracket | Women with Births | Births / 1,000 Women |
| 15 to 19 years | 0 (0.0%) | 0.0 |
| 20 to 34 years | 714 (81.0%) | 76.0 |
| 35 to 50 years | 167 (19.0%) | 67.0 |
| Total | 881 (100.0%) | 41.0 |
Fertility by Age by Marriage Status in Madison County
97.7% of women with births (881) in Madison County are married. The highest percentage of unmarried women with births falls into 35 to 50 years age bracket with 7.2% of them unmarried at the time of birth, while the lowest percentage of unmarried women with births belong to 20 to 34 years age bracket with 1.1% of them unmarried.
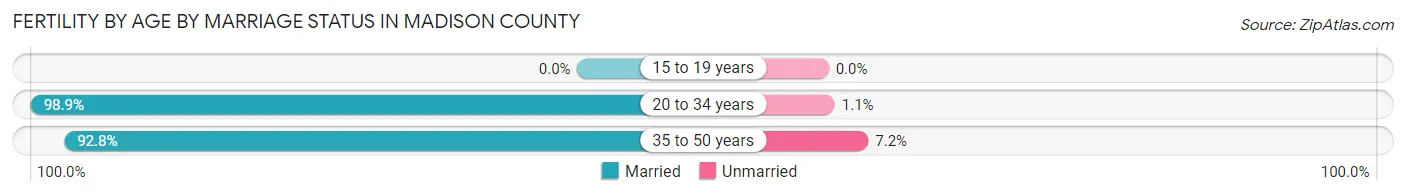
| Age Bracket | Married | Unmarried |
| 15 to 19 years | 0 (0.0%) | 0 (0.0%) |
| 20 to 34 years | 706 (98.9%) | 8 (1.1%) |
| 35 to 50 years | 155 (92.8%) | 12 (7.2%) |
| Total | 861 (97.7%) | 20 (2.3%) |
Fertility by Education in Madison County
Average fertility rate in Madison County is 41.0 births per 1,000 women. Women with the education attainment of bachelor's degree have the highest fertility rate of 111.0 births per 1,000 women, while women with the education attainment of less than high school have the lowest fertility at 3.0 births per 1,000 women. Women with the education attainment of college or associate's degree represent 51.3% of all women with births.
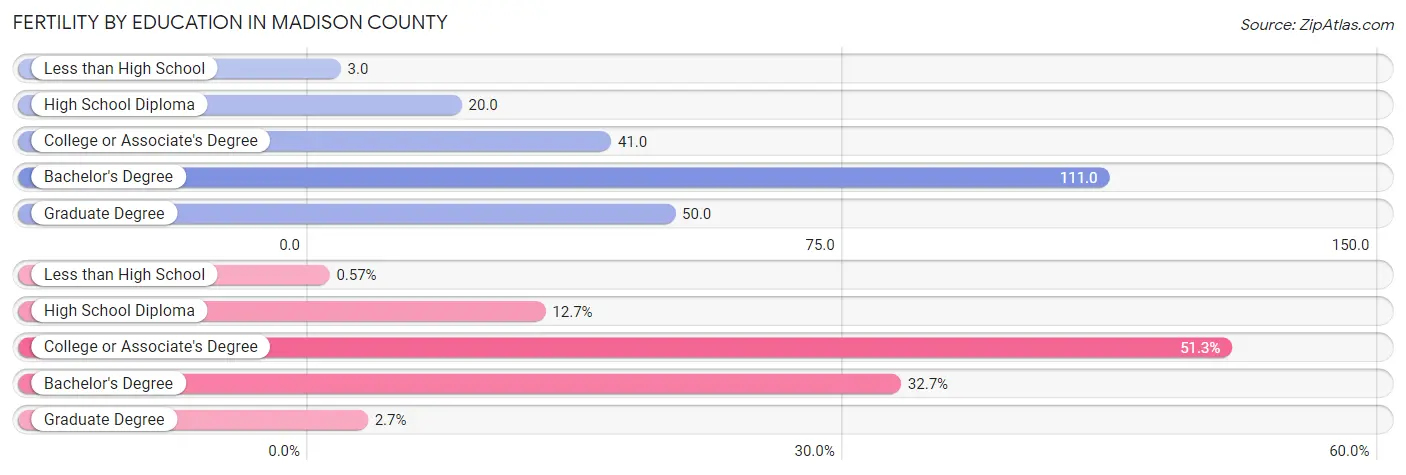
| Educational Attainment | Women with Births | Births / 1,000 Women |
| Less than High School | 5 (0.6%) | 3.0 |
| High School Diploma | 112 (12.7%) | 20.0 |
| College or Associate's Degree | 452 (51.3%) | 41.0 |
| Bachelor's Degree | 288 (32.7%) | 111.0 |
| Graduate Degree | 24 (2.7%) | 50.0 |
| Total | 881 (100.0%) | 41.0 |
Fertility by Education by Marriage Status in Madison County
2.3% of women with births in Madison County are unmarried. Women with the educational attainment of less than high school are most likely to be married with 100.0% of them married at childbirth, while women with the educational attainment of high school diploma are least likely to be married with 7.1% of them unmarried at childbirth.
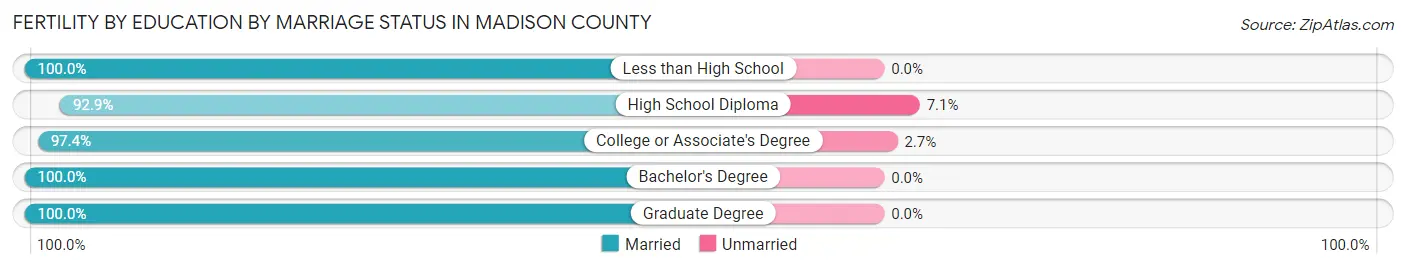
| Educational Attainment | Married | Unmarried |
| Less than High School | 5 (100.0%) | 0 (0.0%) |
| High School Diploma | 104 (92.9%) | 8 (7.1%) |
| College or Associate's Degree | 440 (97.4%) | 12 (2.6%) |
| Bachelor's Degree | 288 (100.0%) | 0 (0.0%) |
| Graduate Degree | 24 (100.0%) | 0 (0.0%) |
| Total | 861 (97.7%) | 20 (2.3%) |
Income in Madison County
Income Overview in Madison County
Per Capita Income in Madison County is $21,394, while median incomes of families and households are $59,091 and $53,025 respectively.
| Characteristic | Number | Measure |
| Per Capita Income | 52,487 | $21,394 |
| Median Family Income | 9,066 | $59,091 |
| Mean Family Income | 9,066 | $95,927 |
| Median Household Income | 11,979 | $53,025 |
| Mean Household Income | 11,979 | $84,274 |
| Income Deficit | 9,066 | $0 |
| Wage / Income Gap (%) | 52,487 | 47.74% |
| Wage / Income Gap ($) | 52,487 | 52.26¢ per $1 |
| Gini / Inequality Index | 52,487 | 0.52 |
Earnings by Sex in Madison County
Average Earnings in Madison County are $11,403, $16,693 for men and $8,724 for women, a difference of 47.7%.
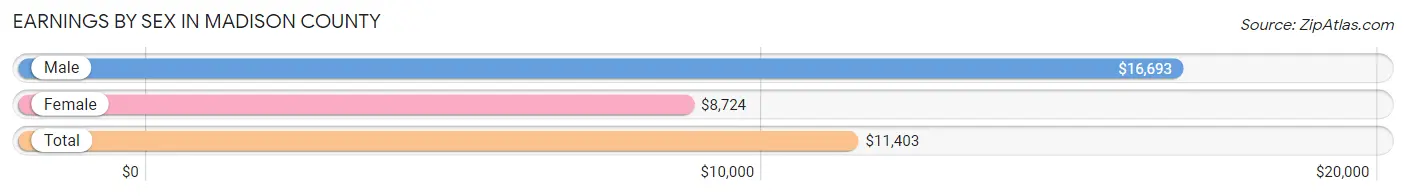
| Sex | Number | Average Earnings |
| Male | 15,845 (46.6%) | $16,693 |
| Female | 18,156 (53.4%) | $8,724 |
| Total | 34,001 (100.0%) | $11,403 |
Earnings by Sex by Income Bracket in Madison County
The most common earnings brackets in Madison County are $2,499 or less for men (1,683 | 10.6%) and $2,500 to $4,999 for women (3,081 | 17.0%).
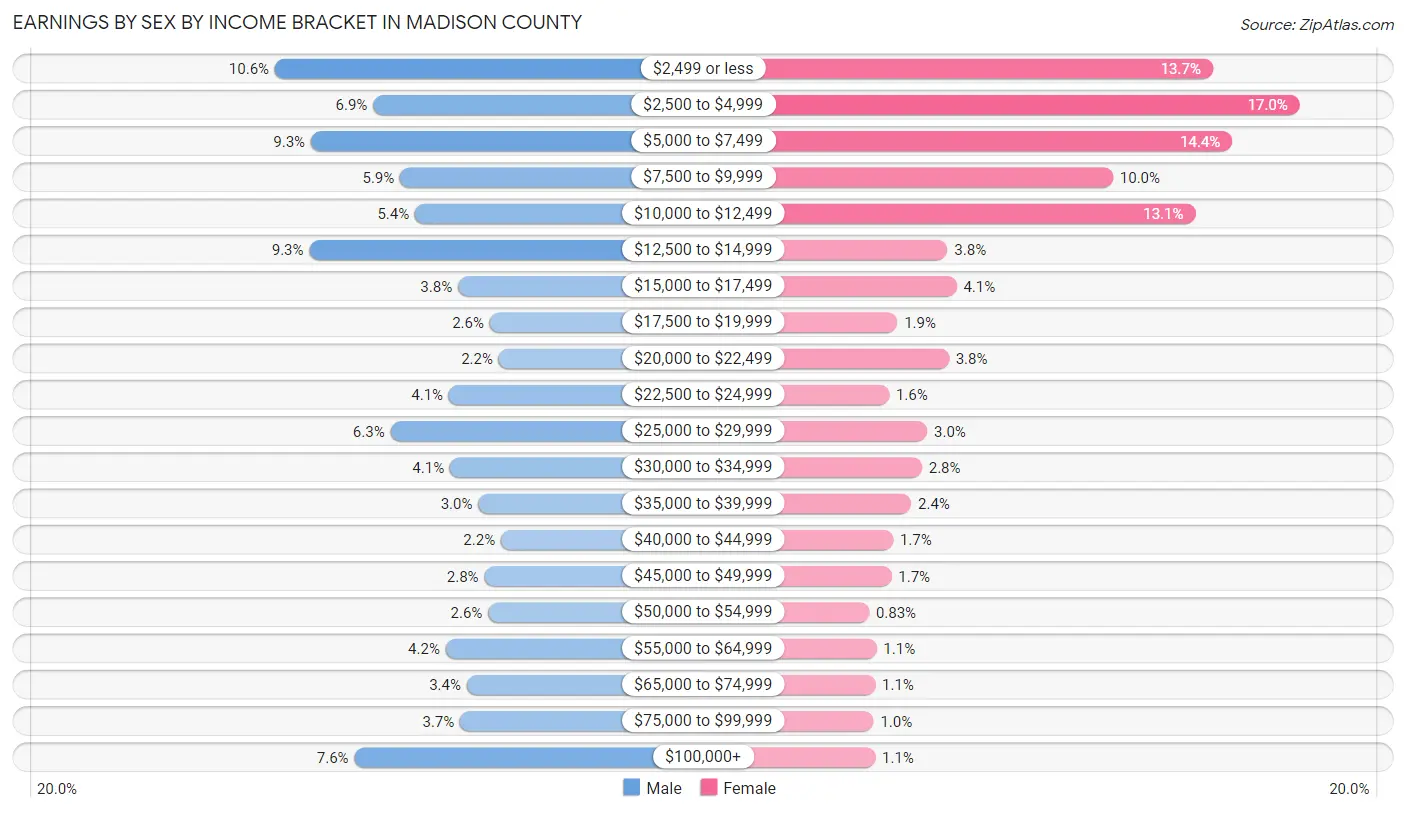
| Income | Male | Female |
| $2,499 or less | 1,683 (10.6%) | 2,489 (13.7%) |
| $2,500 to $4,999 | 1,099 (6.9%) | 3,081 (17.0%) |
| $5,000 to $7,499 | 1,469 (9.3%) | 2,622 (14.4%) |
| $7,500 to $9,999 | 939 (5.9%) | 1,810 (10.0%) |
| $10,000 to $12,499 | 851 (5.4%) | 2,371 (13.1%) |
| $12,500 to $14,999 | 1,478 (9.3%) | 685 (3.8%) |
| $15,000 to $17,499 | 596 (3.8%) | 746 (4.1%) |
| $17,500 to $19,999 | 408 (2.6%) | 343 (1.9%) |
| $20,000 to $22,499 | 354 (2.2%) | 694 (3.8%) |
| $22,500 to $24,999 | 650 (4.1%) | 287 (1.6%) |
| $25,000 to $29,999 | 996 (6.3%) | 547 (3.0%) |
| $30,000 to $34,999 | 644 (4.1%) | 511 (2.8%) |
| $35,000 to $39,999 | 475 (3.0%) | 437 (2.4%) |
| $40,000 to $44,999 | 341 (2.1%) | 314 (1.7%) |
| $45,000 to $49,999 | 439 (2.8%) | 303 (1.7%) |
| $50,000 to $54,999 | 417 (2.6%) | 150 (0.8%) |
| $55,000 to $64,999 | 668 (4.2%) | 201 (1.1%) |
| $65,000 to $74,999 | 544 (3.4%) | 192 (1.1%) |
| $75,000 to $99,999 | 583 (3.7%) | 181 (1.0%) |
| $100,000+ | 1,211 (7.6%) | 192 (1.1%) |
| Total | 15,845 (100.0%) | 18,156 (100.0%) |
Earnings by Sex by Educational Attainment in Madison County
Average earnings in Madison County are $42,816 for men and $23,524 for women, a difference of 45.1%. Men with an educational attainment of graduate degree enjoy the highest average annual earnings of $112,031, while those with less than high school education earn the least with $28,723. Women with an educational attainment of graduate degree earn the most with the average annual earnings of $49,567, while those with college or associate's degree education have the smallest earnings of $16,012.
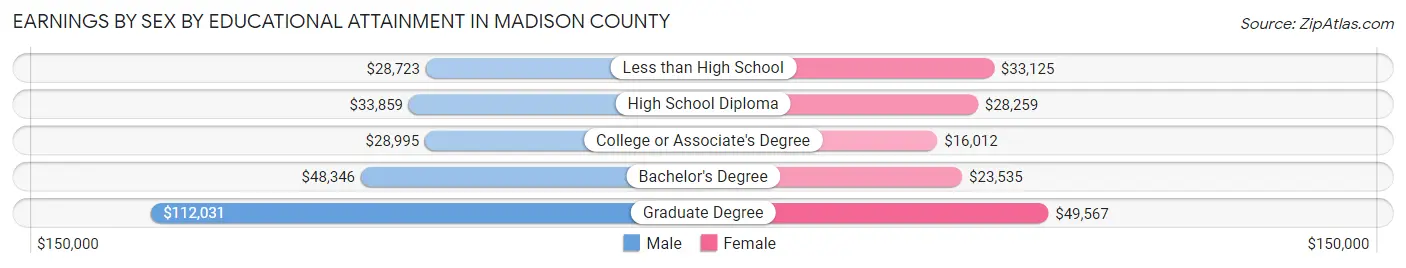
| Educational Attainment | Male Income | Female Income |
| Less than High School | $28,723 | $33,125 |
| High School Diploma | $33,859 | $28,259 |
| College or Associate's Degree | $28,995 | $16,012 |
| Bachelor's Degree | $48,346 | $23,535 |
| Graduate Degree | $112,031 | $49,567 |
| Total | $42,816 | $23,524 |
Family Income in Madison County
Family Income Brackets in Madison County
According to the Madison County family income data, there are 1,741 families falling into the $50,000 to $74,999 income range, which is the most common income bracket and makes up 19.2% of all families. Conversely, the less than $10,000 income bracket is the least frequent group with only 245 families (2.7%) belonging to this category.
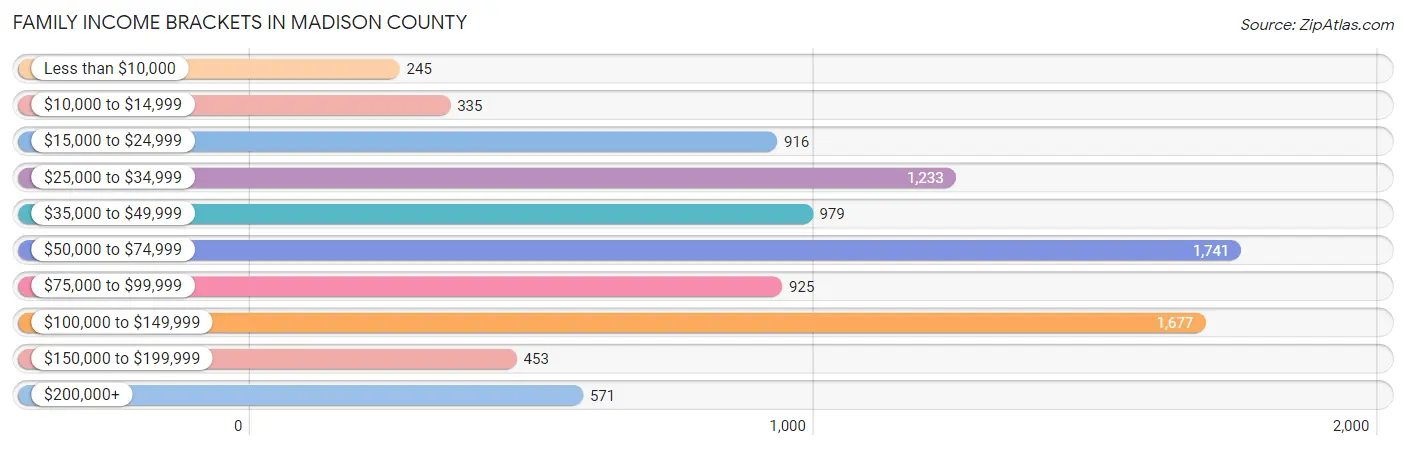
| Income Bracket | # Families | % Families |
| Less than $10,000 | 245 | 2.7% |
| $10,000 to $14,999 | 335 | 3.7% |
| $15,000 to $24,999 | 916 | 10.1% |
| $25,000 to $34,999 | 1,233 | 13.6% |
| $35,000 to $49,999 | 979 | 10.8% |
| $50,000 to $74,999 | 1,741 | 19.2% |
| $75,000 to $99,999 | 925 | 10.2% |
| $100,000 to $149,999 | 1,677 | 18.5% |
| $150,000 to $199,999 | 453 | 5.0% |
| $200,000+ | 571 | 6.3% |
Family Income by Famaliy Size in Madison County
7+ person families (457 | 5.0%) account for the highest median family income in Madison County with $114,923 per family, while 5-person families (547 | 6.0%) have the highest median income of $22,792 per family member.
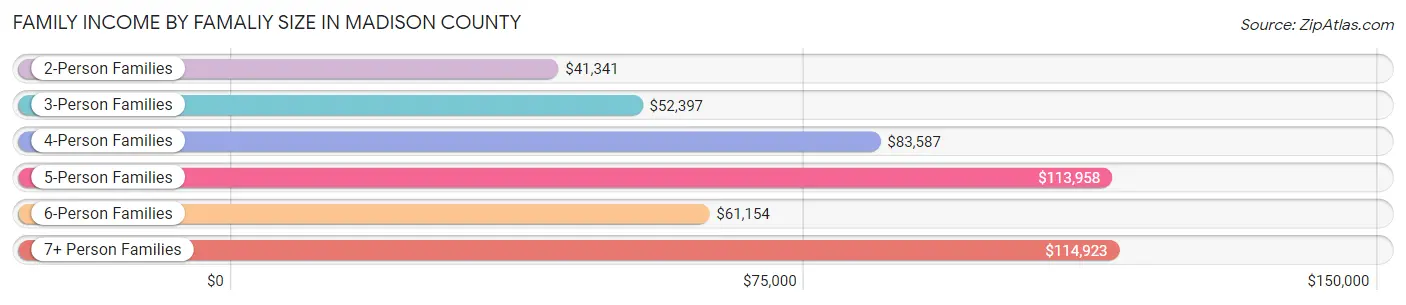
| Income Bracket | # Families | Median Income |
| 2-Person Families | 4,665 (51.5%) | $41,341 |
| 3-Person Families | 1,255 (13.8%) | $52,397 |
| 4-Person Families | 1,282 (14.1%) | $83,587 |
| 5-Person Families | 547 (6.0%) | $113,958 |
| 6-Person Families | 860 (9.5%) | $61,154 |
| 7+ Person Families | 457 (5.0%) | $114,923 |
| Total | 9,066 (100.0%) | $59,091 |
Family Income by Number of Earners in Madison County
The median family income in Madison County is $59,091, with families comprising 3+ earners (1,132) having the highest median family income of $135,127, while families with 2 earners (5,134) have the lowest median family income of $51,532, accounting for 12.5% and 56.6% of families, respectively.
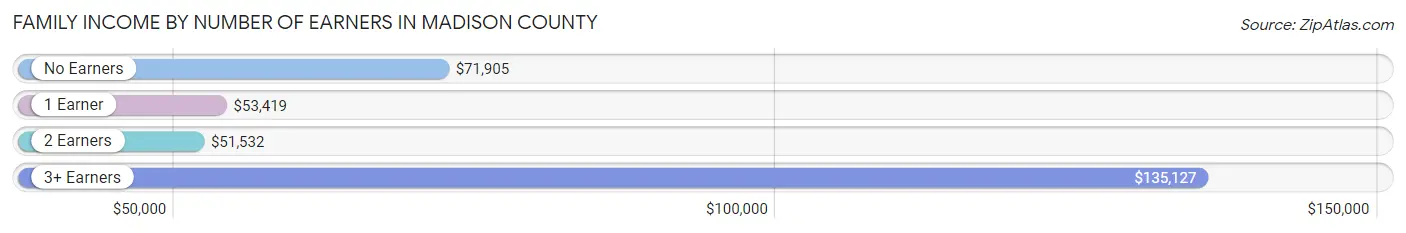
| Number of Earners | # Families | Median Income |
| No Earners | 752 (8.3%) | $71,905 |
| 1 Earner | 2,048 (22.6%) | $53,419 |
| 2 Earners | 5,134 (56.6%) | $51,532 |
| 3+ Earners | 1,132 (12.5%) | $135,127 |
| Total | 9,066 (100.0%) | $59,091 |
Household Income in Madison County
Household Income Brackets in Madison County
With 2,312 households falling in the category, the $50,000 to $74,999 income range is the most frequent in Madison County, accounting for 19.3% of all households. In contrast, only 419 households (3.5%) fall into the less than $10,000 income bracket, making it the least populous group.
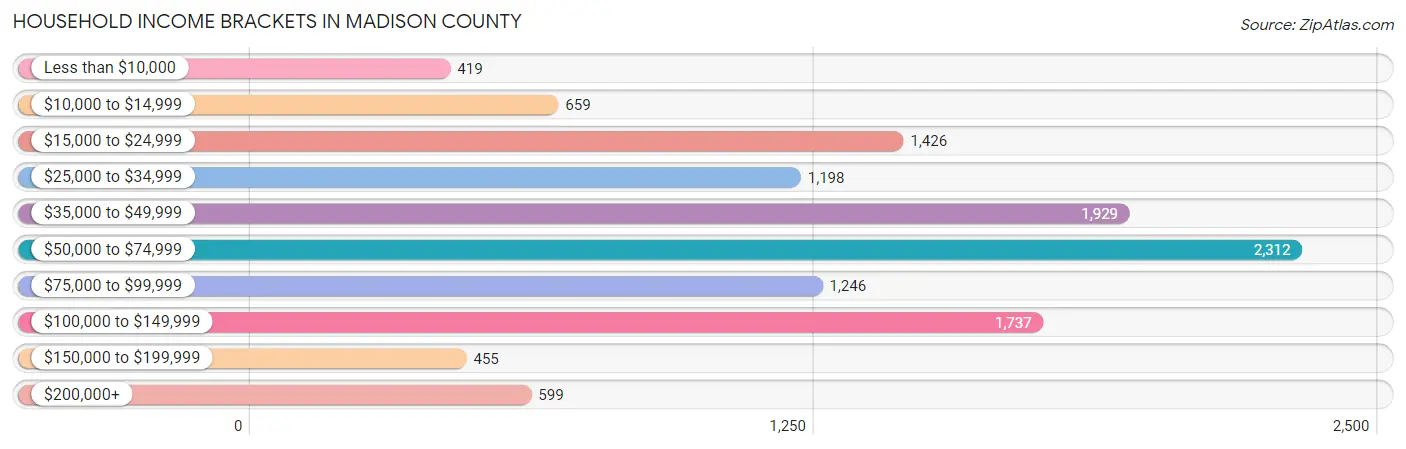
| Income Bracket | # Households | % Households |
| Less than $10,000 | 419 | 3.5% |
| $10,000 to $14,999 | 659 | 5.5% |
| $15,000 to $24,999 | 1,426 | 11.9% |
| $25,000 to $34,999 | 1,198 | 10.0% |
| $35,000 to $49,999 | 1,929 | 16.1% |
| $50,000 to $74,999 | 2,312 | 19.3% |
| $75,000 to $99,999 | 1,246 | 10.4% |
| $100,000 to $149,999 | 1,737 | 14.5% |
| $150,000 to $199,999 | 455 | 3.8% |
| $200,000+ | 599 | 5.0% |
Household Income by Householder Age in Madison County
The median household income in Madison County is $53,025, with the highest median household income of $109,357 found in the 45 to 64 years age bracket for the primary householder. A total of 2,411 households (20.1%) fall into this category. Meanwhile, the 15 to 24 years age bracket for the primary householder has the lowest median household income of $34,729, with 4,279 households (35.7%) in this group.
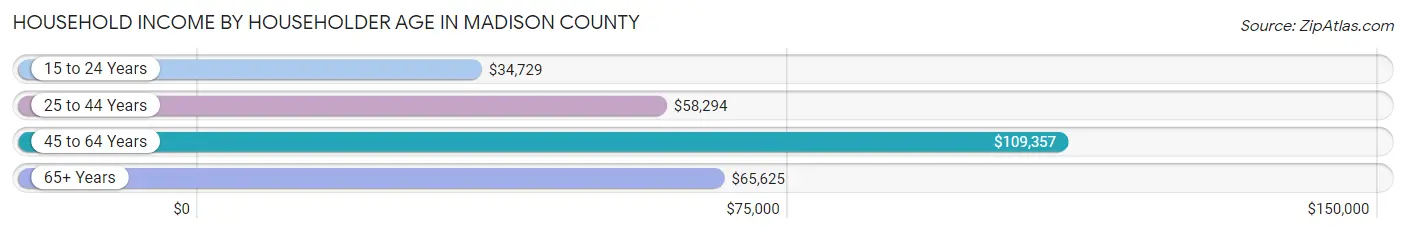
| Income Bracket | # Households | Median Income |
| 15 to 24 Years | 4,279 (35.7%) | $34,729 |
| 25 to 44 Years | 3,754 (31.3%) | $58,294 |
| 45 to 64 Years | 2,411 (20.1%) | $109,357 |
| 65+ Years | 1,535 (12.8%) | $65,625 |
| Total | 11,979 (100.0%) | $53,025 |
Poverty in Madison County
Income Below Poverty by Sex and Age in Madison County
With 19.9% poverty level for males and 38.4% for females among the residents of Madison County, 18 to 24 year old males and 18 to 24 year old females are the most vulnerable to poverty, with 2,120 males (31.0%) and 7,808 females (63.5%) in their respective age groups living below the poverty level.
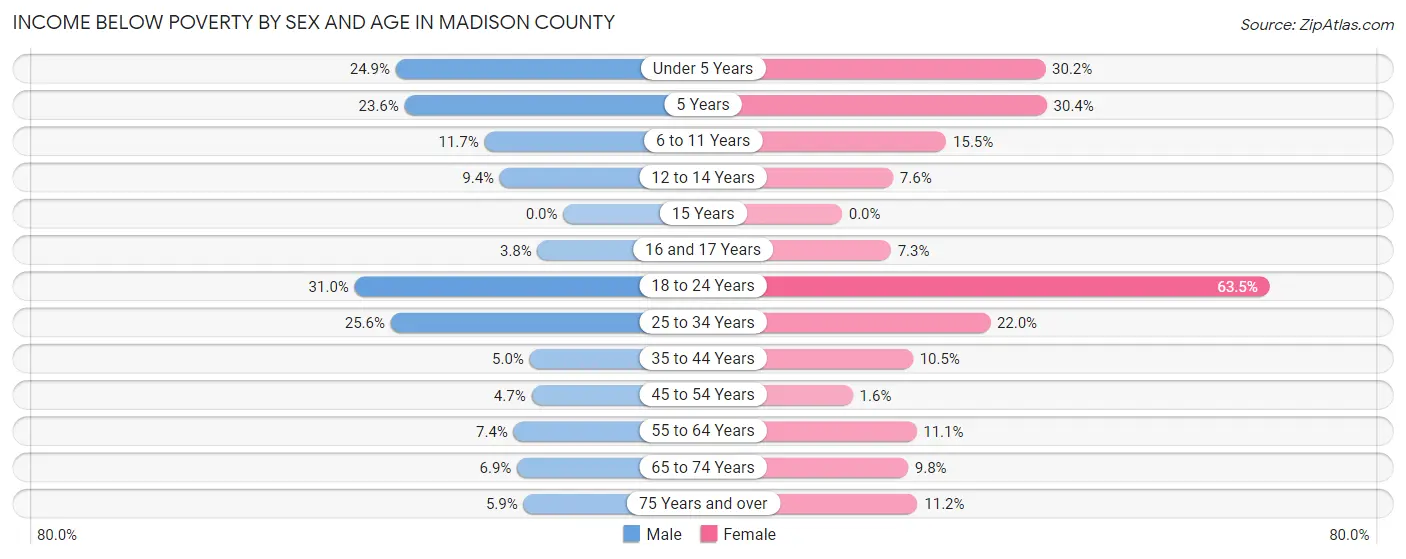
| Age Bracket | Male | Female |
| Under 5 Years | 476 (24.9%) | 500 (30.2%) |
| 5 Years | 66 (23.6%) | 111 (30.4%) |
| 6 to 11 Years | 174 (11.7%) | 211 (15.5%) |
| 12 to 14 Years | 95 (9.4%) | 52 (7.6%) |
| 15 Years | 0 (0.0%) | 0 (0.0%) |
| 16 and 17 Years | 30 (3.8%) | 46 (7.3%) |
| 18 to 24 Years | 2,120 (31.0%) | 7,808 (63.5%) |
| 25 to 34 Years | 914 (25.6%) | 613 (22.0%) |
| 35 to 44 Years | 65 (5.0%) | 169 (10.5%) |
| 45 to 54 Years | 55 (4.7%) | 20 (1.6%) |
| 55 to 64 Years | 79 (7.4%) | 122 (11.1%) |
| 65 to 74 Years | 56 (6.9%) | 83 (9.8%) |
| 75 Years and over | 29 (5.9%) | 69 (11.2%) |
| Total | 4,159 (19.9%) | 9,804 (38.4%) |
Income Above Poverty by Sex and Age in Madison County
According to the poverty statistics in Madison County, males aged 15 years and females aged 15 years are the age groups that are most secure financially, with 100.0% of males and 100.0% of females in these age groups living above the poverty line.
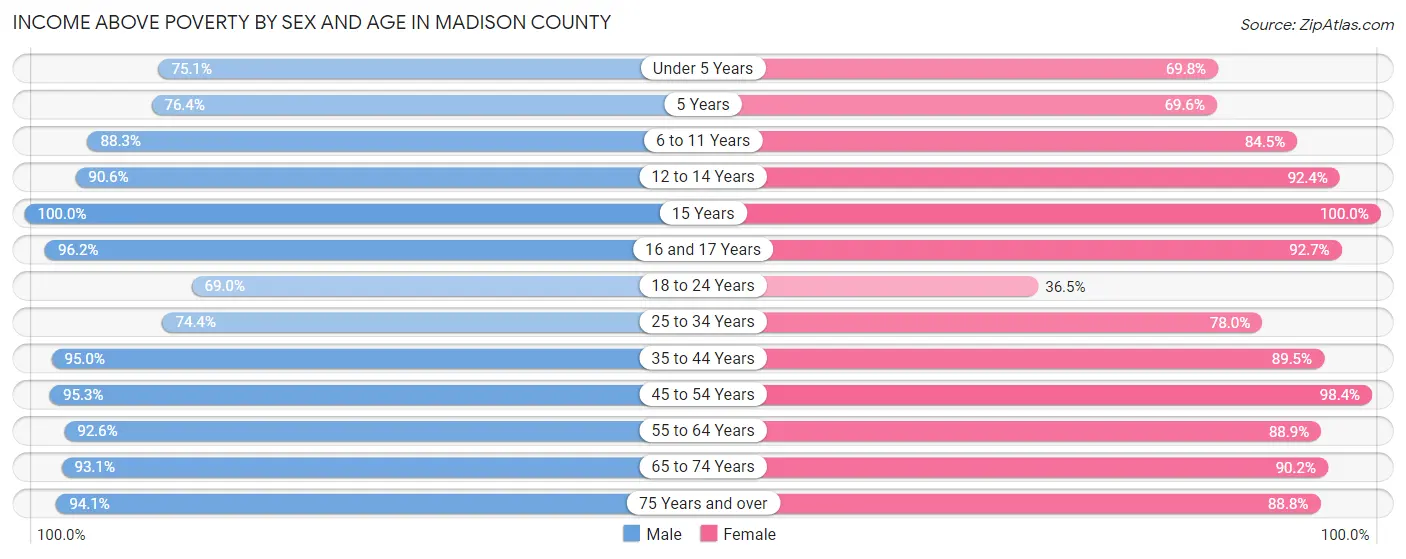
| Age Bracket | Male | Female |
| Under 5 Years | 1,437 (75.1%) | 1,156 (69.8%) |
| 5 Years | 214 (76.4%) | 254 (69.6%) |
| 6 to 11 Years | 1,313 (88.3%) | 1,151 (84.5%) |
| 12 to 14 Years | 913 (90.6%) | 633 (92.4%) |
| 15 Years | 135 (100.0%) | 327 (100.0%) |
| 16 and 17 Years | 755 (96.2%) | 587 (92.7%) |
| 18 to 24 Years | 4,721 (69.0%) | 4,484 (36.5%) |
| 25 to 34 Years | 2,654 (74.4%) | 2,173 (78.0%) |
| 35 to 44 Years | 1,234 (95.0%) | 1,436 (89.5%) |
| 45 to 54 Years | 1,107 (95.3%) | 1,225 (98.4%) |
| 55 to 64 Years | 992 (92.6%) | 981 (88.9%) |
| 65 to 74 Years | 760 (93.1%) | 763 (90.2%) |
| 75 Years and over | 462 (94.1%) | 546 (88.8%) |
| Total | 16,697 (80.1%) | 15,716 (61.6%) |
Income Below Poverty Among Married-Couple Families in Madison County
The poverty statistics for married-couple families in Madison County show that 14.8% or 1,240 of the total 8,358 families live below the poverty line. Families with 5 or more children have the highest poverty rate of 28.3%, comprising of 74 families. On the other hand, families with 3 or 4 children have the lowest poverty rate of 11.7%, which includes 147 families.
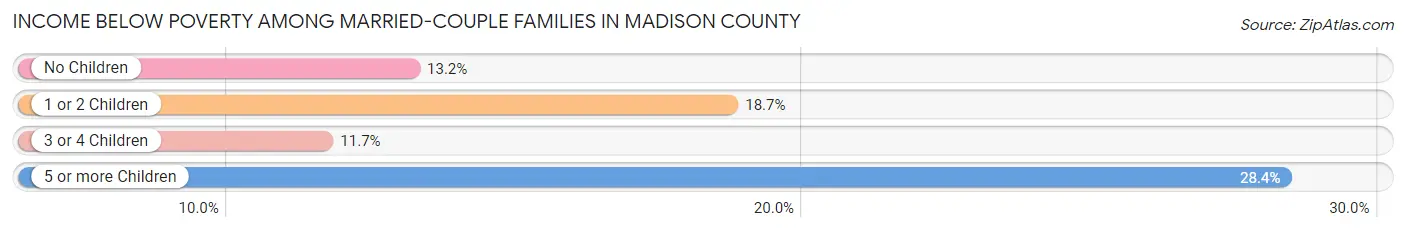
| Children | Above Poverty | Below Poverty |
| No Children | 4,075 (86.8%) | 618 (13.2%) |
| 1 or 2 Children | 1,742 (81.3%) | 401 (18.7%) |
| 3 or 4 Children | 1,114 (88.3%) | 147 (11.7%) |
| 5 or more Children | 187 (71.7%) | 74 (28.3%) |
| Total | 7,118 (85.2%) | 1,240 (14.8%) |
Income Below Poverty Among Single-Parent Households in Madison County
According to the poverty data in Madison County, 6.3% or 7 single-father households and 9.0% or 54 single-mother households are living below the poverty line. Among single-father households, those with no children have the highest poverty rate, with 7 households (36.8%) experiencing poverty. Likewise, among single-mother households, those with 3 or 4 children have the highest poverty rate, with 35 households (74.5%) falling below the poverty line.
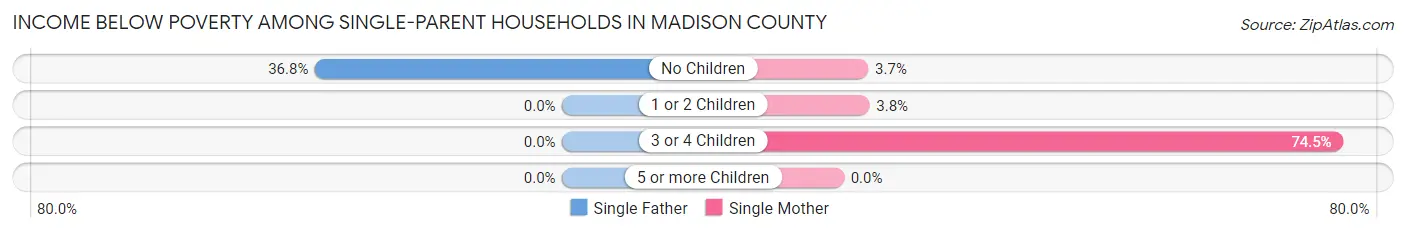
| Children | Single Father | Single Mother |
| No Children | 7 (36.8%) | 11 (3.6%) |
| 1 or 2 Children | 0 (0.0%) | 8 (3.8%) |
| 3 or 4 Children | 0 (0.0%) | 35 (74.5%) |
| 5 or more Children | 0 (0.0%) | 0 (0.0%) |
| Total | 7 (6.3%) | 54 (9.0%) |
Income Below Poverty Among Married-Couple vs Single-Parent Households in Madison County
The poverty data for Madison County shows that 1,240 of the married-couple family households (14.8%) and 61 of the single-parent households (8.6%) are living below the poverty level. Within the married-couple family households, those with 5 or more children have the highest poverty rate, with 74 households (28.3%) falling below the poverty line. Among the single-parent households, those with 3 or 4 children have the highest poverty rate, with 35 household (51.5%) living below poverty.
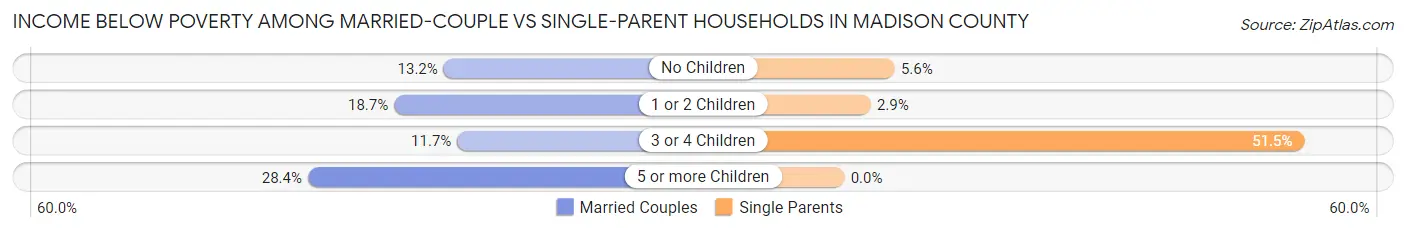
| Children | Married-Couple Families | Single-Parent Households |
| No Children | 618 (13.2%) | 18 (5.6%) |
| 1 or 2 Children | 401 (18.7%) | 8 (2.9%) |
| 3 or 4 Children | 147 (11.7%) | 35 (51.5%) |
| 5 or more Children | 74 (28.3%) | 0 (0.0%) |
| Total | 1,240 (14.8%) | 61 (8.6%) |
Employment Characteristics in Madison County
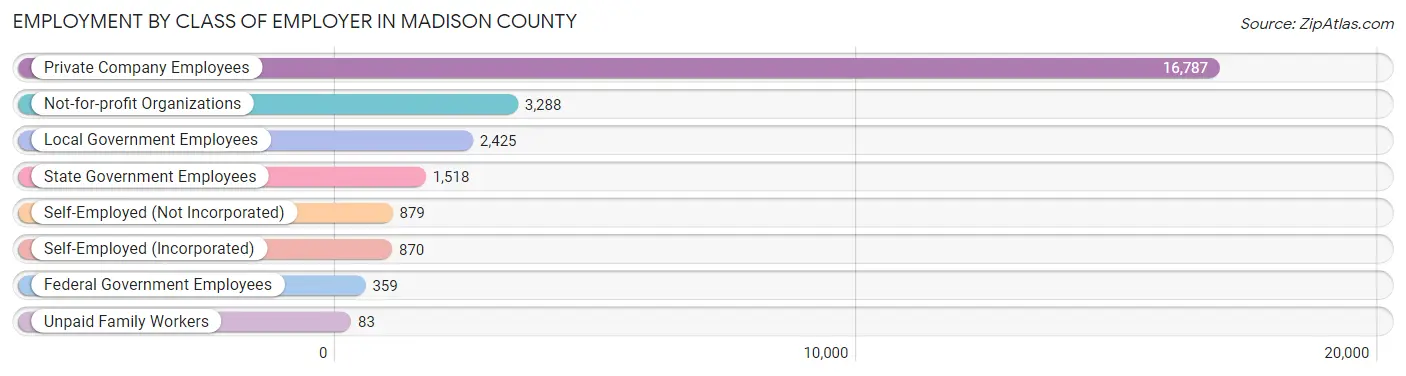
Employment by Class of Employer in Madison County
Among the 26,209 employed individuals in Madison County, private company employees (16,787 | 64.0%), not-for-profit organizations (3,288 | 12.6%), and local government employees (2,425 | 9.2%) make up the most common classes of employment.
| Employer Class | # Employees | % Employees |
| Private Company Employees | 16,787 | 64.0% |
| Self-Employed (Incorporated) | 870 | 3.3% |
| Self-Employed (Not Incorporated) | 879 | 3.4% |
| Not-for-profit Organizations | 3,288 | 12.6% |
| Local Government Employees | 2,425 | 9.2% |
| State Government Employees | 1,518 | 5.8% |
| Federal Government Employees | 359 | 1.4% |
| Unpaid Family Workers | 83 | 0.3% |
| Total | 26,209 | 100.0% |
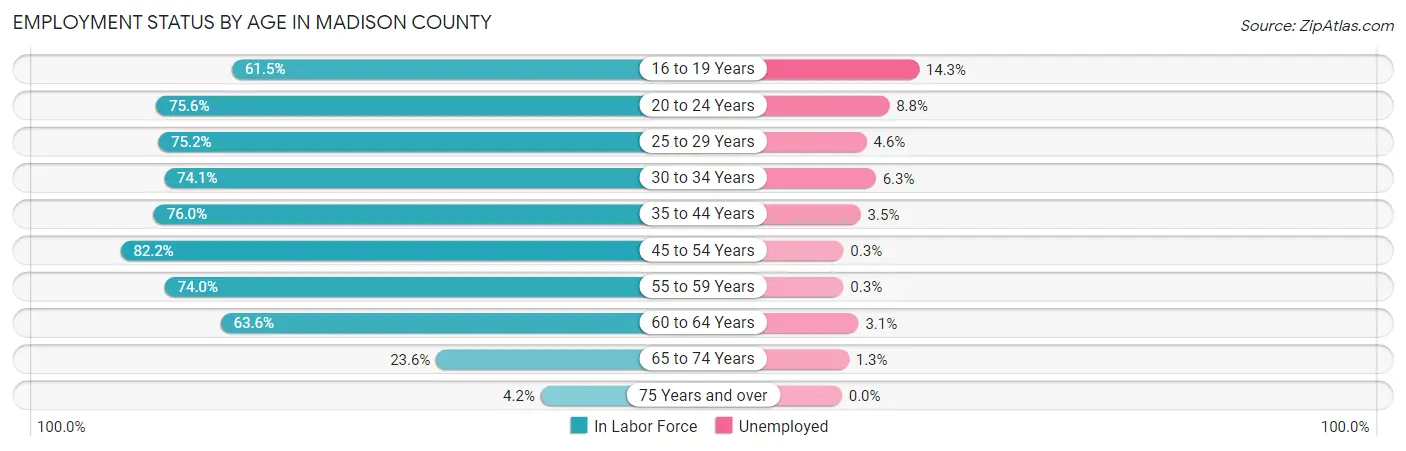
Employment Status by Age in Madison County
According to the labor force statistics for Madison County, out of the total population over 16 years of age (43,224), 67.3% or 29,090 individuals are in the labor force, with 8.1% or 2,356 of them unemployed. The age group with the highest labor force participation rate is 45 to 54 years, with 82.2% or 1,996 individuals in the labor force. Within the labor force, the 16 to 19 years age range has the highest percentage of unemployed individuals, with 14.3% or 1,141 of them being unemployed.
| Age Bracket | In Labor Force | Unemployed |
| 16 to 19 Years | 7,980 (61.5%) | 1,141 (14.3%) |
| 20 to 24 Years | 9,605 (75.6%) | 845 (8.8%) |
| 25 to 29 Years | 3,621 (75.2%) | 167 (4.6%) |
| 30 to 34 Years | 1,631 (74.1%) | 103 (6.3%) |
| 35 to 44 Years | 2,300 (76.0%) | 80 (3.5%) |
| 45 to 54 Years | 1,996 (82.2%) | 6 (0.3%) |
| 55 to 59 Years | 754 (74.0%) | 2 (0.3%) |
| 60 to 64 Years | 746 (63.6%) | 23 (3.1%) |
| 65 to 74 Years | 392 (23.6%) | 5 (1.3%) |
| 75 Years and over | 51 (4.2%) | 0 (0.0%) |
| Total | 29,090 (67.3%) | 2,356 (8.1%) |
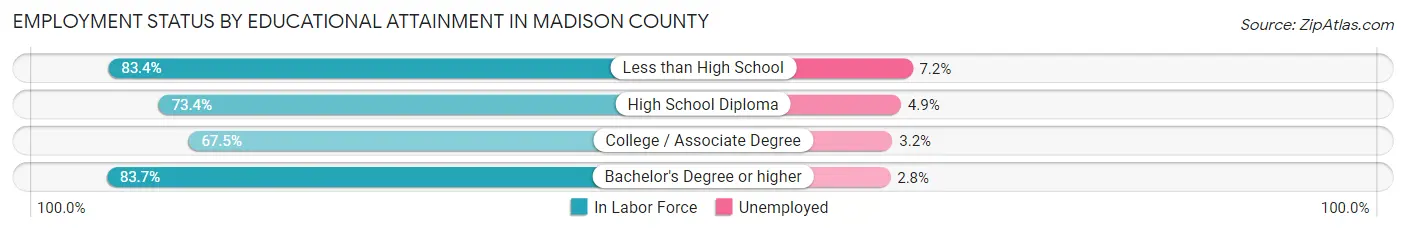
Employment Status by Educational Attainment in Madison County
According to labor force statistics for Madison County, 75.3% of individuals (11,040) out of the total population between 25 and 64 years of age (14,662) are in the labor force, with 3.4% or 375 of them being unemployed. The group with the highest labor force participation rate are those with the educational attainment of bachelor's degree or higher, with 83.7% or 4,878 individuals in the labor force. Within the labor force, individuals with less than high school education have the highest percentage of unemployment, with 7.2% or 25 of them being unemployed.
| Educational Attainment | In Labor Force | Unemployed |
| Less than High School | 346 (83.4%) | 30 (7.2%) |
| High School Diploma | 1,733 (73.4%) | 116 (4.9%) |
| College / Associate Degree | 4,089 (67.5%) | 194 (3.2%) |
| Bachelor's Degree or higher | 4,878 (83.7%) | 163 (2.8%) |
| Total | 11,040 (75.3%) | 499 (3.4%) |
Employment Occupations by Sex in Madison County
Management, Business, Science and Arts Occupations
The most common Management, Business, Science and Arts occupations in Madison County are Community & Social Service (4,855 | 18.2%), Education Instruction & Library (3,826 | 14.3%), Management (1,929 | 7.2%), Computers, Engineering & Science (1,088 | 4.1%), and Business & Financial (918 | 3.4%).
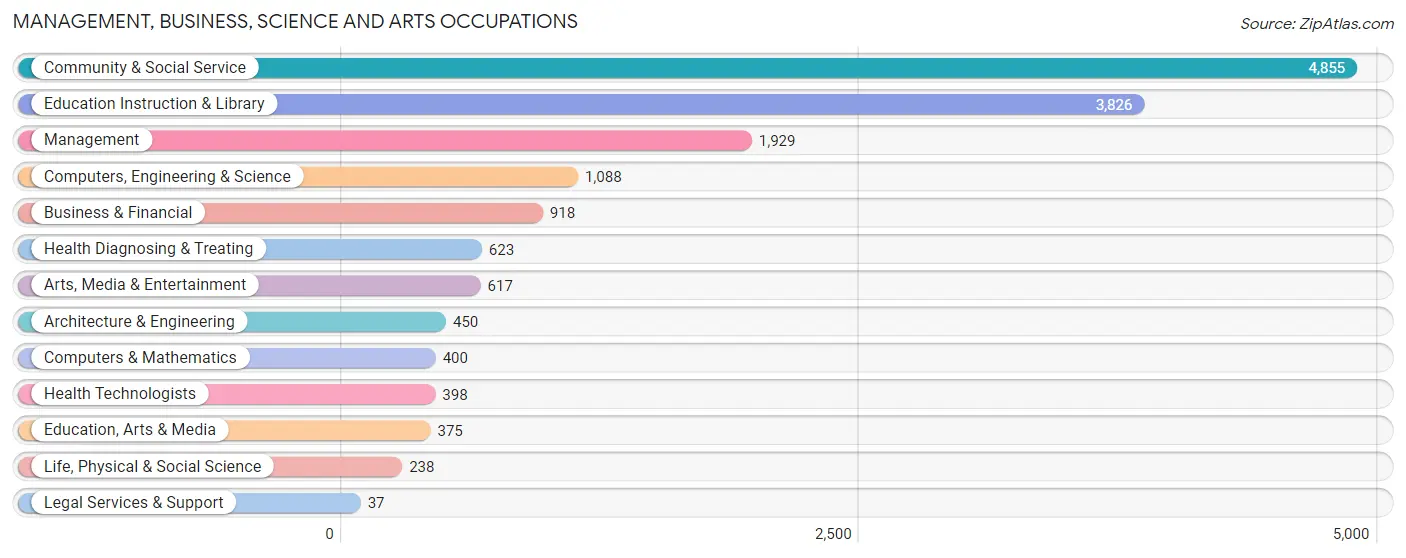
Management, Business, Science and Arts Occupations by Sex
Within the Management, Business, Science and Arts occupations in Madison County, the most male-oriented occupations are Architecture & Engineering (82.4%), Legal Services & Support (70.3%), and Business & Financial (66.9%), while the most female-oriented occupations are Health Diagnosing & Treating (81.4%), Health Technologists (79.6%), and Education, Arts & Media (69.1%).
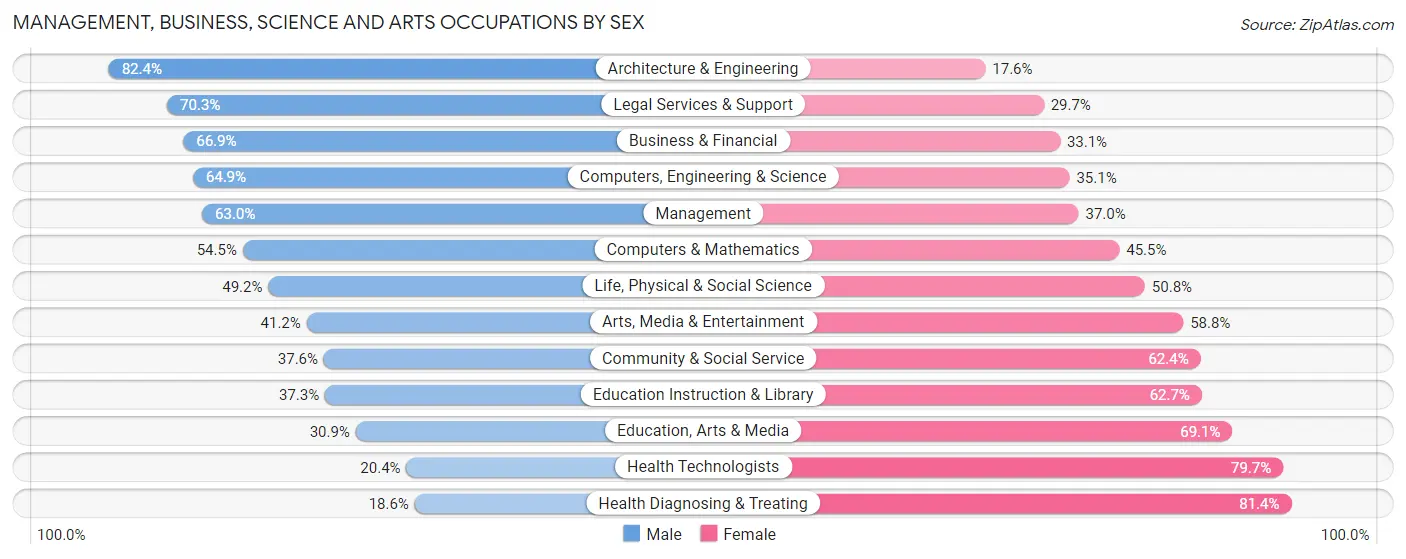
| Occupation | Male | Female |
| Management | 1,215 (63.0%) | 714 (37.0%) |
| Business & Financial | 614 (66.9%) | 304 (33.1%) |
| Computers, Engineering & Science | 706 (64.9%) | 382 (35.1%) |
| Computers & Mathematics | 218 (54.5%) | 182 (45.5%) |
| Architecture & Engineering | 371 (82.4%) | 79 (17.6%) |
| Life, Physical & Social Science | 117 (49.2%) | 121 (50.8%) |
| Community & Social Service | 1,824 (37.6%) | 3,031 (62.4%) |
| Education, Arts & Media | 116 (30.9%) | 259 (69.1%) |
| Legal Services & Support | 26 (70.3%) | 11 (29.7%) |
| Education Instruction & Library | 1,428 (37.3%) | 2,398 (62.7%) |
| Arts, Media & Entertainment | 254 (41.2%) | 363 (58.8%) |
| Health Diagnosing & Treating | 116 (18.6%) | 507 (81.4%) |
| Health Technologists | 81 (20.3%) | 317 (79.6%) |
| Total (Category) | 4,475 (47.5%) | 4,938 (52.5%) |
| Total (Overall) | 13,038 (48.8%) | 13,664 (51.2%) |
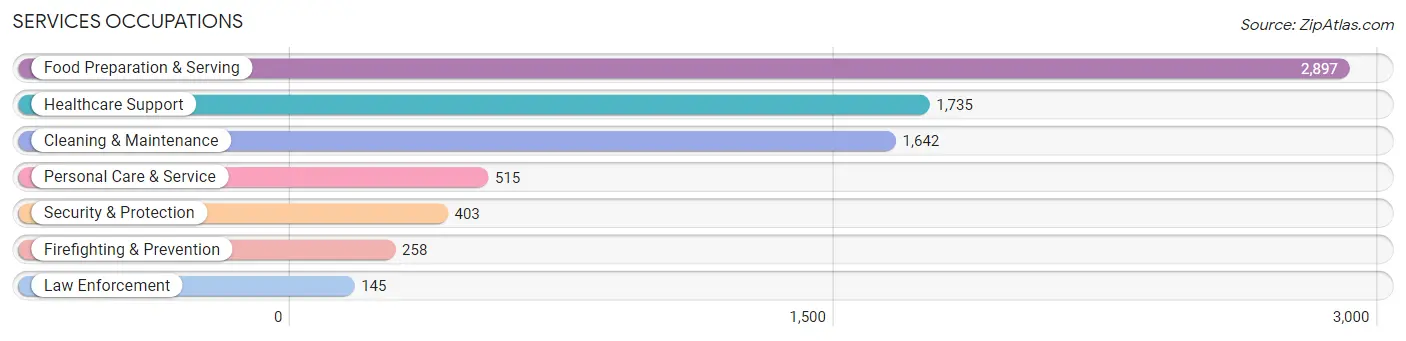
Services Occupations
The most common Services occupations in Madison County are Food Preparation & Serving (2,897 | 10.8%), Healthcare Support (1,735 | 6.5%), Cleaning & Maintenance (1,642 | 6.1%), Personal Care & Service (515 | 1.9%), and Security & Protection (403 | 1.5%).
Services Occupations by Sex
Within the Services occupations in Madison County, the most male-oriented occupations are Law Enforcement (87.6%), Cleaning & Maintenance (50.3%), and Security & Protection (48.4%), while the most female-oriented occupations are Personal Care & Service (95.3%), Healthcare Support (88.3%), and Firefighting & Prevention (73.6%).
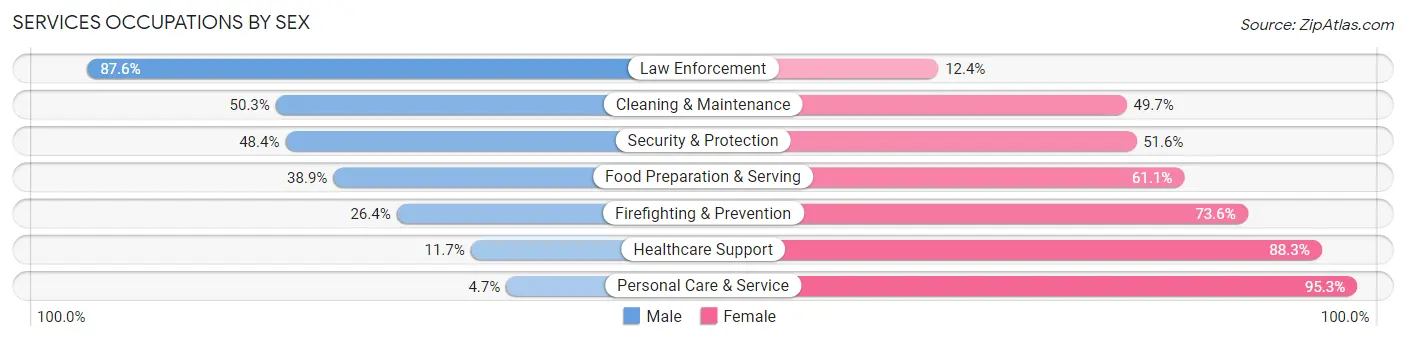
| Occupation | Male | Female |
| Healthcare Support | 203 (11.7%) | 1,532 (88.3%) |
| Security & Protection | 195 (48.4%) | 208 (51.6%) |
| Firefighting & Prevention | 68 (26.4%) | 190 (73.6%) |
| Law Enforcement | 127 (87.6%) | 18 (12.4%) |
| Food Preparation & Serving | 1,127 (38.9%) | 1,770 (61.1%) |
| Cleaning & Maintenance | 826 (50.3%) | 816 (49.7%) |
| Personal Care & Service | 24 (4.7%) | 491 (95.3%) |
| Total (Category) | 2,375 (33.0%) | 4,817 (67.0%) |
| Total (Overall) | 13,038 (48.8%) | 13,664 (51.2%) |
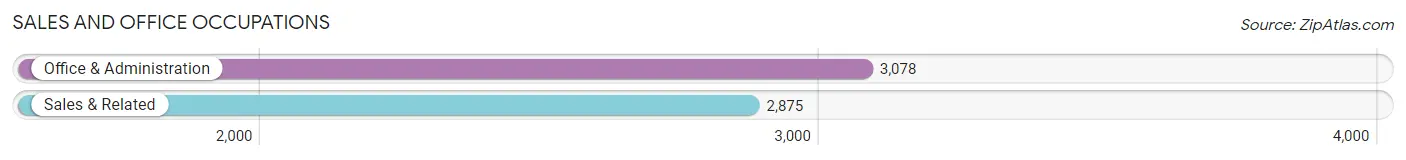
Sales and Office Occupations
The most common Sales and Office occupations in Madison County are Office & Administration (3,078 | 11.5%), and Sales & Related (2,875 | 10.8%).
Sales and Office Occupations by Sex
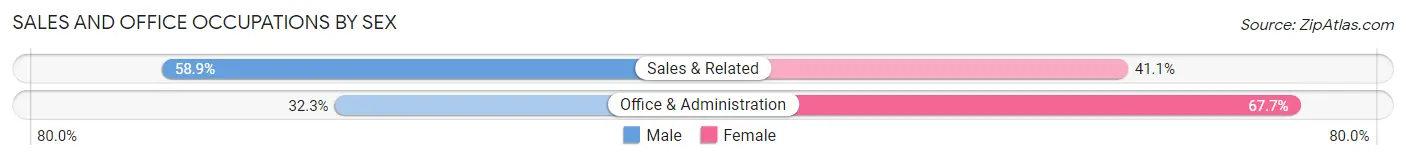
| Occupation | Male | Female |
| Sales & Related | 1,693 (58.9%) | 1,182 (41.1%) |
| Office & Administration | 995 (32.3%) | 2,083 (67.7%) |
| Total (Category) | 2,688 (45.2%) | 3,265 (54.8%) |
| Total (Overall) | 13,038 (48.8%) | 13,664 (51.2%) |
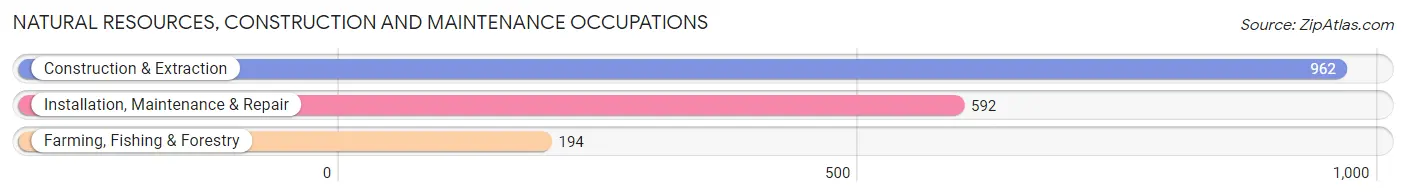
Natural Resources, Construction and Maintenance Occupations
The most common Natural Resources, Construction and Maintenance occupations in Madison County are Construction & Extraction (962 | 3.6%), Installation, Maintenance & Repair (592 | 2.2%), and Farming, Fishing & Forestry (194 | 0.7%).
Natural Resources, Construction and Maintenance Occupations by Sex
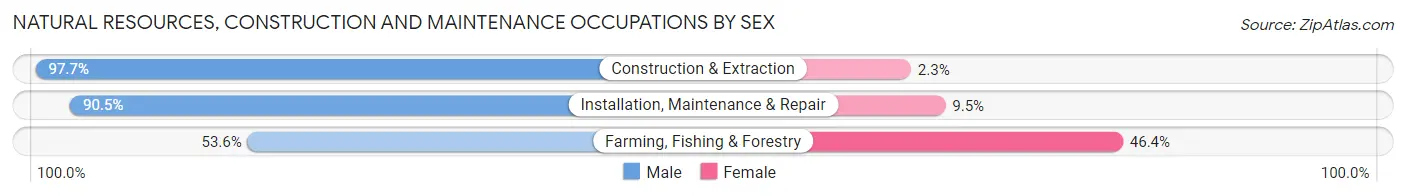
| Occupation | Male | Female |
| Farming, Fishing & Forestry | 104 (53.6%) | 90 (46.4%) |
| Construction & Extraction | 940 (97.7%) | 22 (2.3%) |
| Installation, Maintenance & Repair | 536 (90.5%) | 56 (9.5%) |
| Total (Category) | 1,580 (90.4%) | 168 (9.6%) |
| Total (Overall) | 13,038 (48.8%) | 13,664 (51.2%) |
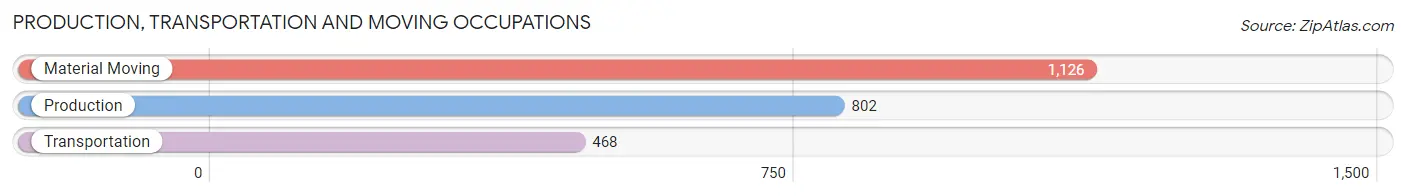
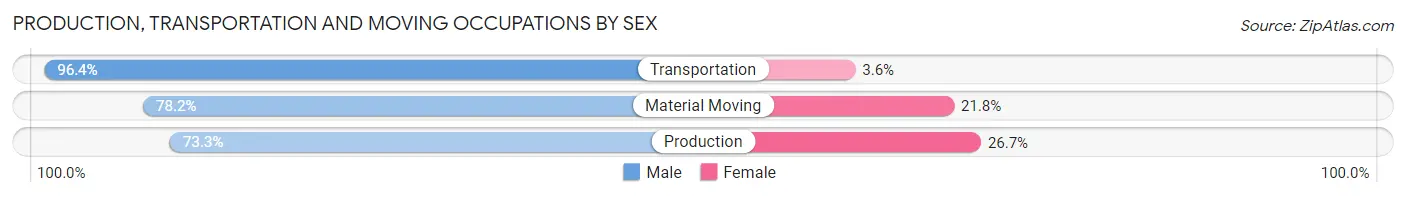
Production, Transportation and Moving Occupations
The most common Production, Transportation and Moving occupations in Madison County are Material Moving (1,126 | 4.2%), Production (802 | 3.0%), and Transportation (468 | 1.8%).
Production, Transportation and Moving Occupations by Sex
| Occupation | Male | Female |
| Production | 588 (73.3%) | 214 (26.7%) |
| Transportation | 451 (96.4%) | 17 (3.6%) |
| Material Moving | 881 (78.2%) | 245 (21.8%) |
| Total (Category) | 1,920 (80.1%) | 476 (19.9%) |
| Total (Overall) | 13,038 (48.8%) | 13,664 (51.2%) |
Employment Industries by Sex in Madison County
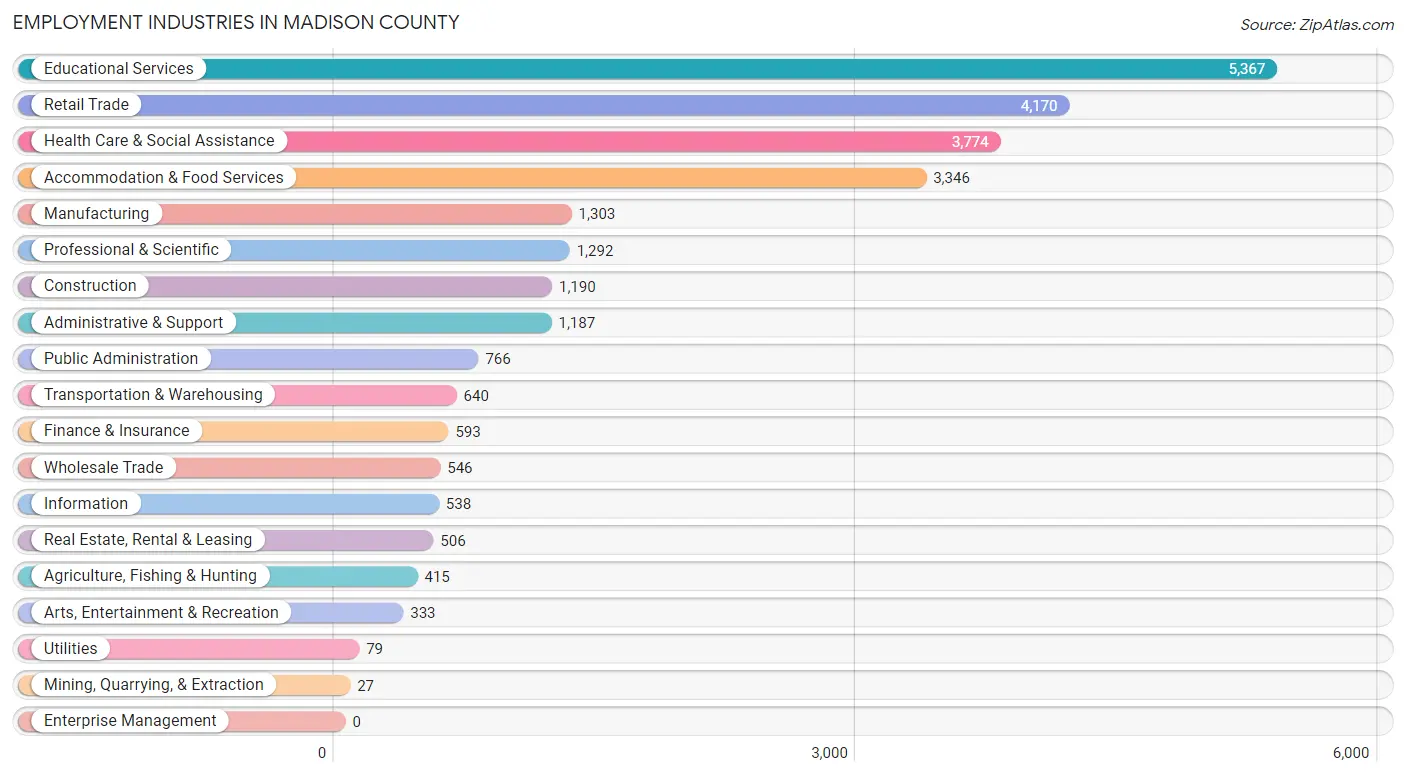
Employment Industries in Madison County
The major employment industries in Madison County include Educational Services (5,367 | 20.1%), Retail Trade (4,170 | 15.6%), Health Care & Social Assistance (3,774 | 14.1%), Accommodation & Food Services (3,346 | 12.5%), and Manufacturing (1,303 | 4.9%).
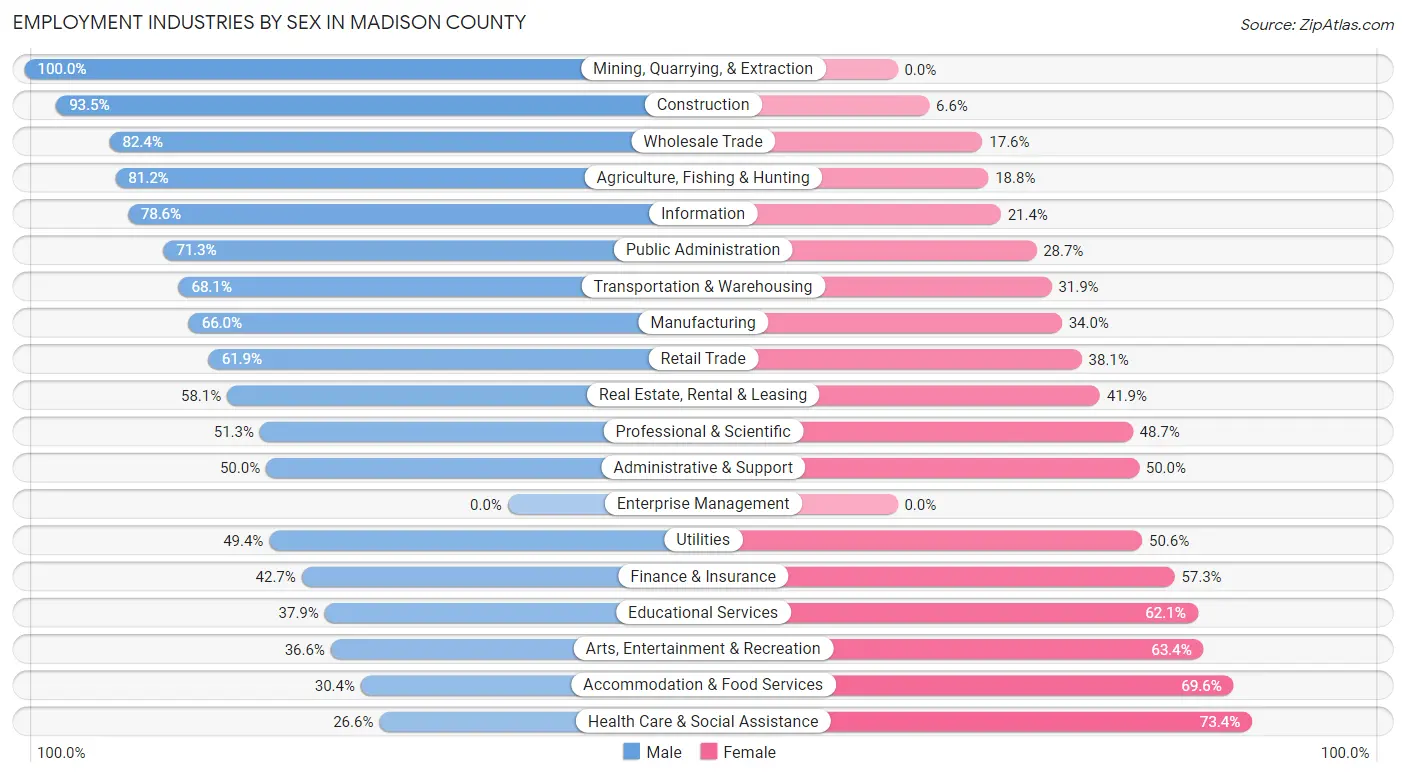
Employment Industries by Sex in Madison County
The Madison County industries that see more men than women are Mining, Quarrying, & Extraction (100.0%), Construction (93.4%), and Wholesale Trade (82.4%), whereas the industries that tend to have a higher number of women are Health Care & Social Assistance (73.4%), Accommodation & Food Services (69.6%), and Arts, Entertainment & Recreation (63.4%).
| Industry | Male | Female |
| Agriculture, Fishing & Hunting | 337 (81.2%) | 78 (18.8%) |
| Mining, Quarrying, & Extraction | 27 (100.0%) | 0 (0.0%) |
| Construction | 1,112 (93.4%) | 78 (6.6%) |
| Manufacturing | 860 (66.0%) | 443 (34.0%) |
| Wholesale Trade | 450 (82.4%) | 96 (17.6%) |
| Retail Trade | 2,580 (61.9%) | 1,590 (38.1%) |
| Transportation & Warehousing | 436 (68.1%) | 204 (31.9%) |
| Utilities | 39 (49.4%) | 40 (50.6%) |
| Information | 423 (78.6%) | 115 (21.4%) |
| Finance & Insurance | 253 (42.7%) | 340 (57.3%) |
| Real Estate, Rental & Leasing | 294 (58.1%) | 212 (41.9%) |
| Professional & Scientific | 663 (51.3%) | 629 (48.7%) |
| Enterprise Management | 0 (0.0%) | 0 (0.0%) |
| Administrative & Support | 594 (50.0%) | 593 (50.0%) |
| Educational Services | 2,034 (37.9%) | 3,333 (62.1%) |
| Health Care & Social Assistance | 1,004 (26.6%) | 2,770 (73.4%) |
| Arts, Entertainment & Recreation | 122 (36.6%) | 211 (63.4%) |
| Accommodation & Food Services | 1,018 (30.4%) | 2,328 (69.6%) |
| Public Administration | 546 (71.3%) | 220 (28.7%) |
| Total | 13,038 (48.8%) | 13,664 (51.2%) |
Education in Madison County
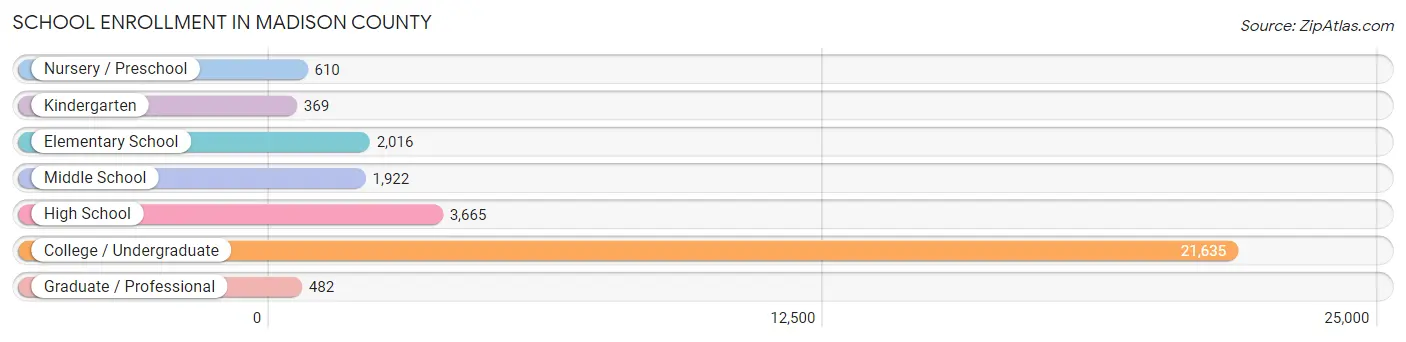
School Enrollment in Madison County
The most common levels of schooling among the 30,699 students in Madison County are college / undergraduate (21,635 | 70.5%), high school (3,665 | 11.9%), and elementary school (2,016 | 6.6%).
| School Level | # Students | % Students |
| Nursery / Preschool | 610 | 2.0% |
| Kindergarten | 369 | 1.2% |
| Elementary School | 2,016 | 6.6% |
| Middle School | 1,922 | 6.3% |
| High School | 3,665 | 11.9% |
| College / Undergraduate | 21,635 | 70.5% |
| Graduate / Professional | 482 | 1.6% |
| Total | 30,699 | 100.0% |
School Enrollment by Age by Funding Source in Madison County
Out of a total of 30,699 students who are enrolled in schools in Madison County, 18,205 (59.3%) attend a private institution, while the remaining 12,494 (40.7%) are enrolled in public schools. The age group of 20 to 24 year olds has the highest likelihood of being enrolled in private schools, with 8,434 (80.8% in the age bracket) enrolled. Conversely, the age group of 15 to 17 year olds has the lowest likelihood of being enrolled in a private school, with 1,785 (95.6% in the age bracket) attending a public institution.
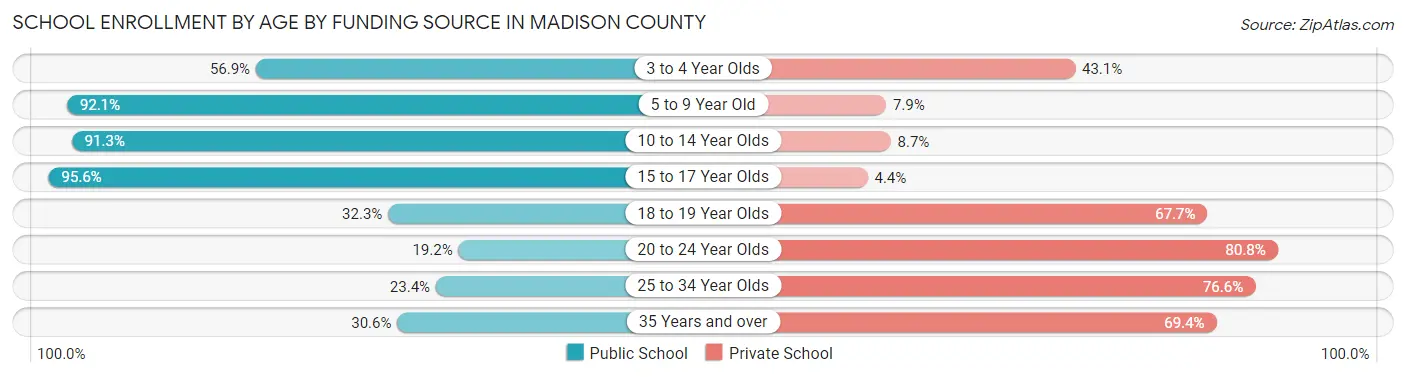
| Age Bracket | Public School | Private School |
| 3 to 4 Year Olds | 243 (56.9%) | 184 (43.1%) |
| 5 to 9 Year Old | 2,197 (92.1%) | 188 (7.9%) |
| 10 to 14 Year Olds | 2,288 (91.3%) | 219 (8.7%) |
| 15 to 17 Year Olds | 1,785 (95.6%) | 83 (4.4%) |
| 18 to 19 Year Olds | 3,209 (32.3%) | 6,733 (67.7%) |
| 20 to 24 Year Olds | 2,001 (19.2%) | 8,434 (80.8%) |
| 25 to 34 Year Olds | 617 (23.4%) | 2,021 (76.6%) |
| 35 Years and over | 152 (30.6%) | 345 (69.4%) |
| Total | 12,494 (40.7%) | 18,205 (59.3%) |
Educational Attainment by Field of Study in Madison County
Education (1,312 | 17.9%), business (1,142 | 15.6%), science & technology (872 | 11.9%), arts & humanities (796 | 10.8%), and bio, nature & agricultural (584 | 8.0%) are the most common fields of study among 7,340 individuals in Madison County who have obtained a bachelor's degree or higher.
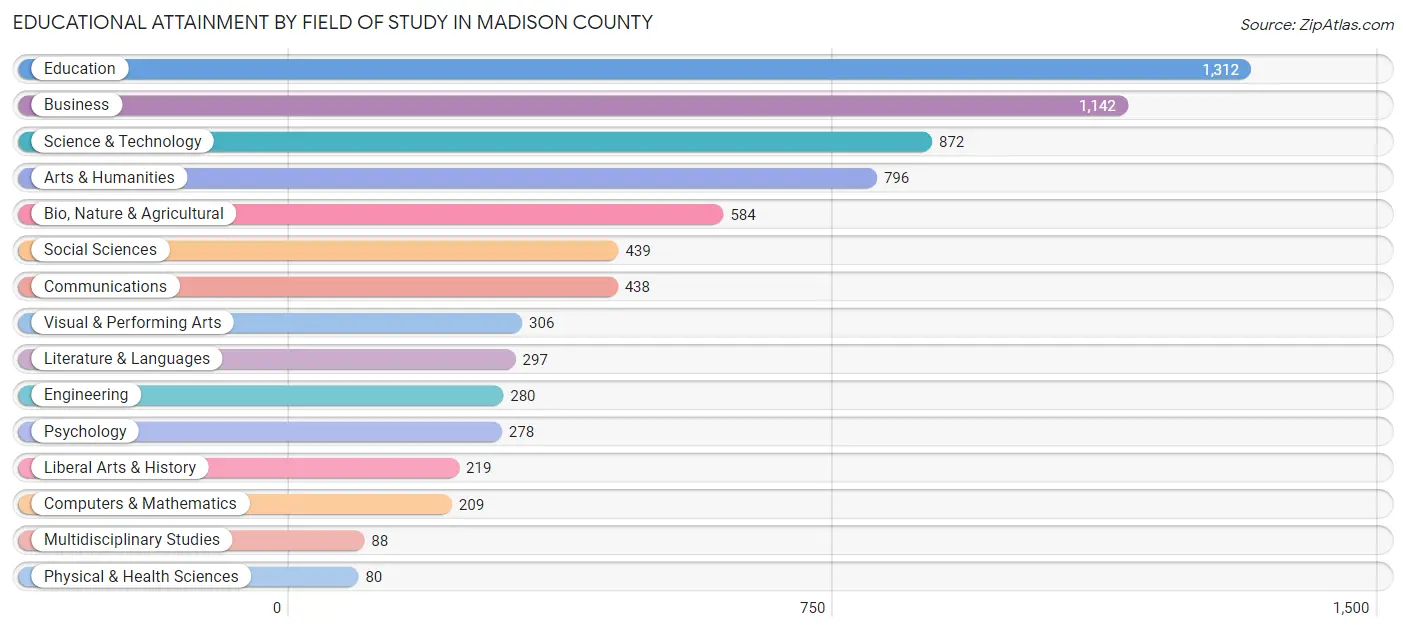
| Field of Study | # Graduates | % Graduates |
| Computers & Mathematics | 209 | 2.9% |
| Bio, Nature & Agricultural | 584 | 8.0% |
| Physical & Health Sciences | 80 | 1.1% |
| Psychology | 278 | 3.8% |
| Social Sciences | 439 | 6.0% |
| Engineering | 280 | 3.8% |
| Multidisciplinary Studies | 88 | 1.2% |
| Science & Technology | 872 | 11.9% |
| Business | 1,142 | 15.6% |
| Education | 1,312 | 17.9% |
| Literature & Languages | 297 | 4.1% |
| Liberal Arts & History | 219 | 3.0% |
| Visual & Performing Arts | 306 | 4.2% |
| Communications | 438 | 6.0% |
| Arts & Humanities | 796 | 10.8% |
| Total | 7,340 | 100.0% |
Transportation & Commute in Madison County
Vehicle Availability by Sex in Madison County
The most prevalent vehicle ownership categories in Madison County are males with 2 vehicles (4,344, accounting for 37.7%) and females with 2 vehicles (3,474, making up 38.2%).

| Vehicles Available | Male | Female |
| No Vehicle | 129 (1.1%) | 128 (1.1%) |
| 1 Vehicle | 1,795 (15.6%) | 1,788 (15.7%) |
| 2 Vehicles | 4,344 (37.7%) | 3,474 (30.6%) |
| 3 Vehicles | 2,767 (24.0%) | 3,035 (26.7%) |
| 4 Vehicles | 1,005 (8.7%) | 1,634 (14.4%) |
| 5 or more Vehicles | 1,470 (12.8%) | 1,310 (11.5%) |
| Total | 11,510 (100.0%) | 11,369 (100.0%) |
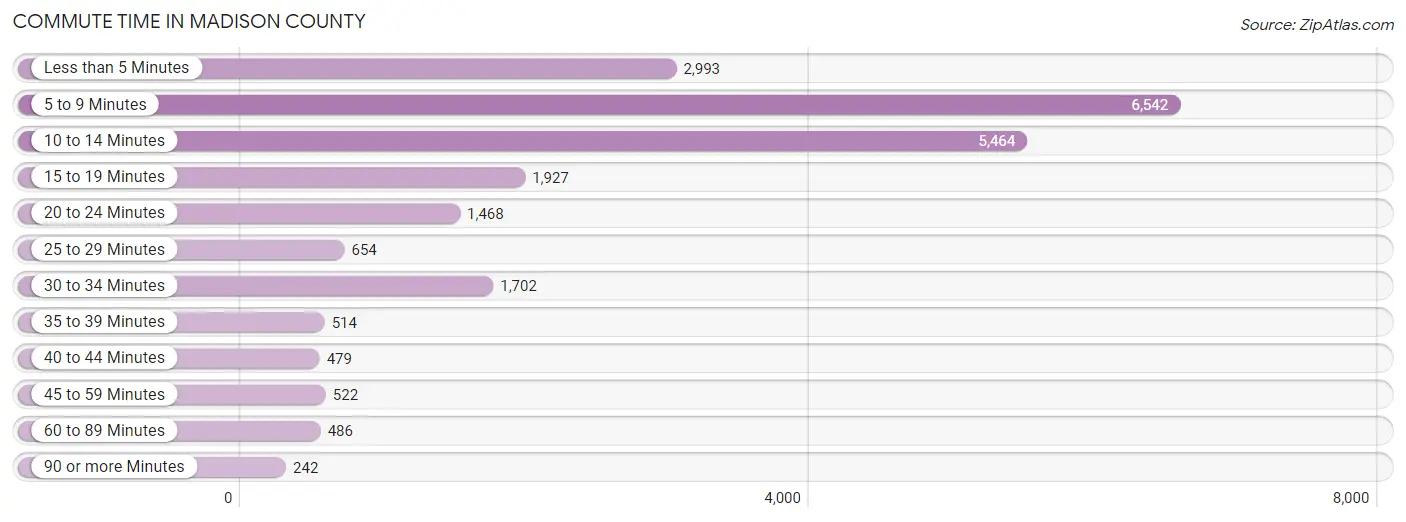
Commute Time in Madison County
The most frequently occuring commute durations in Madison County are 5 to 9 minutes (6,542 commuters, 28.4%), 10 to 14 minutes (5,464 commuters, 23.8%), and less than 5 minutes (2,993 commuters, 13.0%).
| Commute Time | # Commuters | % Commuters |
| Less than 5 Minutes | 2,993 | 13.0% |
| 5 to 9 Minutes | 6,542 | 28.4% |
| 10 to 14 Minutes | 5,464 | 23.8% |
| 15 to 19 Minutes | 1,927 | 8.4% |
| 20 to 24 Minutes | 1,468 | 6.4% |
| 25 to 29 Minutes | 654 | 2.8% |
| 30 to 34 Minutes | 1,702 | 7.4% |
| 35 to 39 Minutes | 514 | 2.2% |
| 40 to 44 Minutes | 479 | 2.1% |
| 45 to 59 Minutes | 522 | 2.3% |
| 60 to 89 Minutes | 486 | 2.1% |
| 90 or more Minutes | 242 | 1.1% |
Commute Time by Sex in Madison County
The most common commute times in Madison County are 5 to 9 minutes (3,376 commuters, 30.4%) for males and 5 to 9 minutes (3,166 commuters, 26.6%) for females.
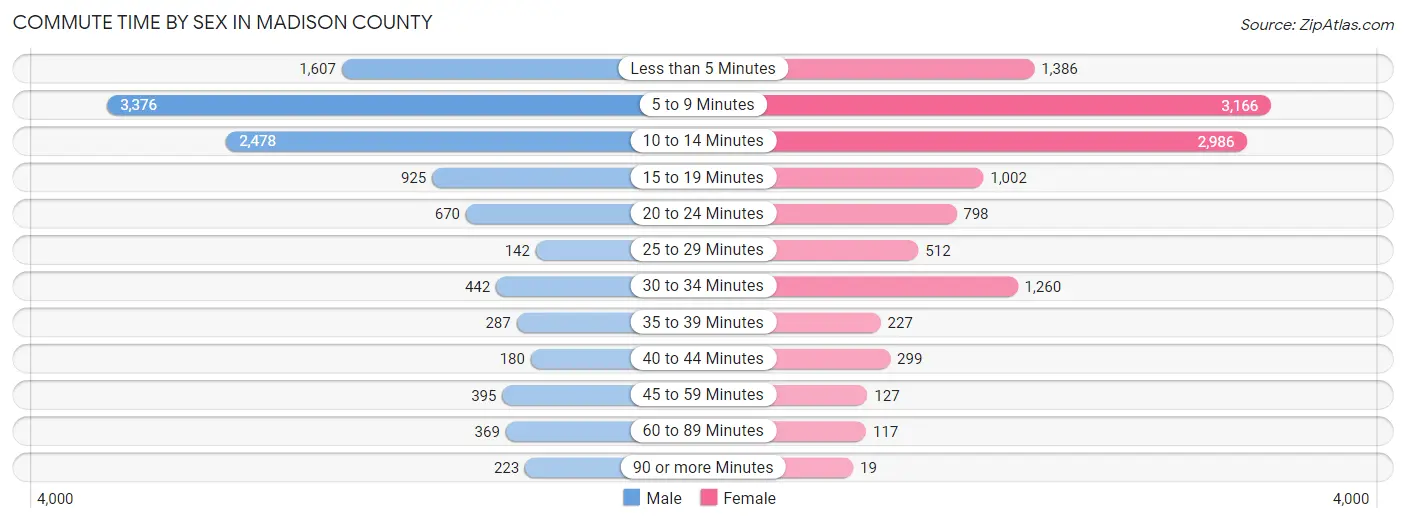
| Commute Time | Male | Female |
| Less than 5 Minutes | 1,607 (14.5%) | 1,386 (11.7%) |
| 5 to 9 Minutes | 3,376 (30.4%) | 3,166 (26.6%) |
| 10 to 14 Minutes | 2,478 (22.3%) | 2,986 (25.1%) |
| 15 to 19 Minutes | 925 (8.3%) | 1,002 (8.4%) |
| 20 to 24 Minutes | 670 (6.0%) | 798 (6.7%) |
| 25 to 29 Minutes | 142 (1.3%) | 512 (4.3%) |
| 30 to 34 Minutes | 442 (4.0%) | 1,260 (10.6%) |
| 35 to 39 Minutes | 287 (2.6%) | 227 (1.9%) |
| 40 to 44 Minutes | 180 (1.6%) | 299 (2.5%) |
| 45 to 59 Minutes | 395 (3.6%) | 127 (1.1%) |
| 60 to 89 Minutes | 369 (3.3%) | 117 (1.0%) |
| 90 or more Minutes | 223 (2.0%) | 19 (0.2%) |
Time of Departure to Work by Sex in Madison County
The most frequent times of departure to work in Madison County are 7:30 AM to 7:59 AM (1,907, 17.2%) for males and 7:30 AM to 7:59 AM (2,077, 17.5%) for females.
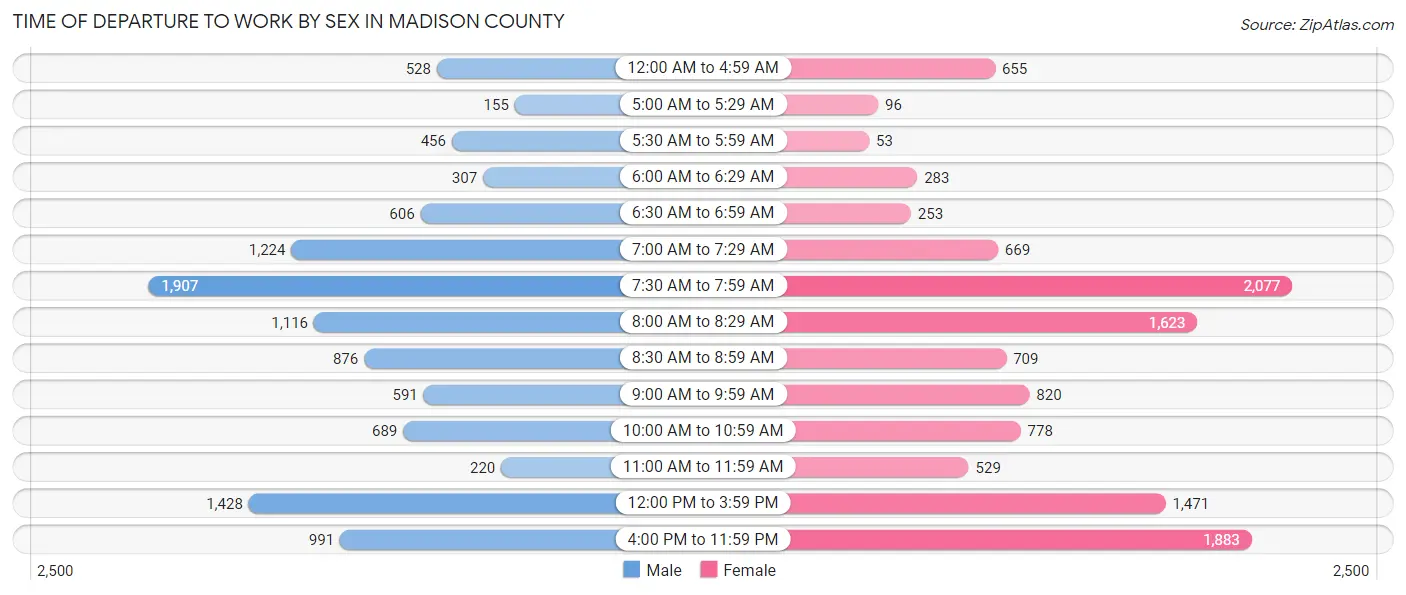
| Time of Departure | Male | Female |
| 12:00 AM to 4:59 AM | 528 (4.8%) | 655 (5.5%) |
| 5:00 AM to 5:29 AM | 155 (1.4%) | 96 (0.8%) |
| 5:30 AM to 5:59 AM | 456 (4.1%) | 53 (0.4%) |
| 6:00 AM to 6:29 AM | 307 (2.8%) | 283 (2.4%) |
| 6:30 AM to 6:59 AM | 606 (5.5%) | 253 (2.1%) |
| 7:00 AM to 7:29 AM | 1,224 (11.0%) | 669 (5.6%) |
| 7:30 AM to 7:59 AM | 1,907 (17.2%) | 2,077 (17.5%) |
| 8:00 AM to 8:29 AM | 1,116 (10.1%) | 1,623 (13.6%) |
| 8:30 AM to 8:59 AM | 876 (7.9%) | 709 (6.0%) |
| 9:00 AM to 9:59 AM | 591 (5.3%) | 820 (6.9%) |
| 10:00 AM to 10:59 AM | 689 (6.2%) | 778 (6.5%) |
| 11:00 AM to 11:59 AM | 220 (2.0%) | 529 (4.4%) |
| 12:00 PM to 3:59 PM | 1,428 (12.9%) | 1,471 (12.4%) |
| 4:00 PM to 11:59 PM | 991 (8.9%) | 1,883 (15.8%) |
| Total | 11,094 (100.0%) | 11,899 (100.0%) |
Housing Occupancy in Madison County
Occupancy by Ownership in Madison County
Of the total 11,979 dwellings in Madison County, owner-occupied units account for 4,793 (40.0%), while renter-occupied units make up 7,186 (60.0%).
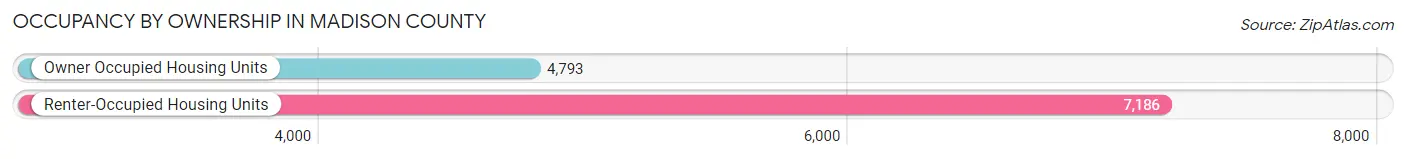
| Occupancy | # Housing Units | % Housing Units |
| Owner Occupied Housing Units | 4,793 | 40.0% |
| Renter-Occupied Housing Units | 7,186 | 60.0% |
| Total Occupied Housing Units | 11,979 | 100.0% |
Occupancy by Household Size in Madison County
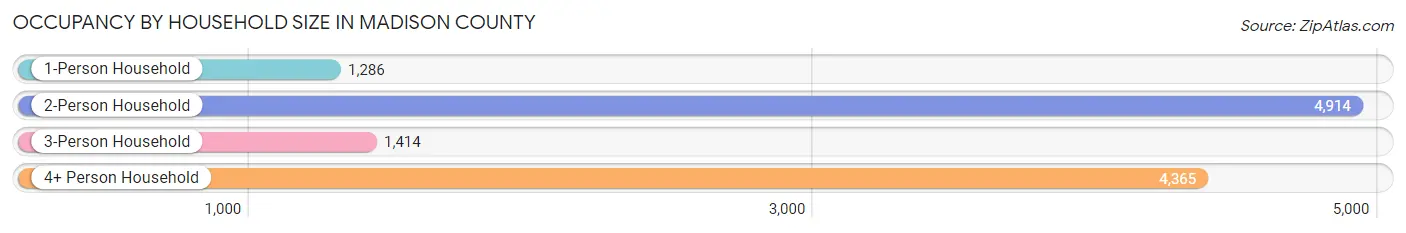
| Household Size | # Housing Units | % Housing Units |
| 1-Person Household | 1,286 | 10.7% |
| 2-Person Household | 4,914 | 41.0% |
| 3-Person Household | 1,414 | 11.8% |
| 4+ Person Household | 4,365 | 36.4% |
| Total Housing Units | 11,979 | 100.0% |
Occupancy by Ownership by Household Size in Madison County

| Household Size | Owner-occupied | Renter-occupied |
| 1-Person Household | 407 (31.7%) | 879 (68.3%) |
| 2-Person Household | 1,573 (32.0%) | 3,341 (68.0%) |
| 3-Person Household | 636 (45.0%) | 778 (55.0%) |
| 4+ Person Household | 2,177 (49.9%) | 2,188 (50.1%) |
| Total Housing Units | 4,793 (40.0%) | 7,186 (60.0%) |
Occupancy by Educational Attainment in Madison County
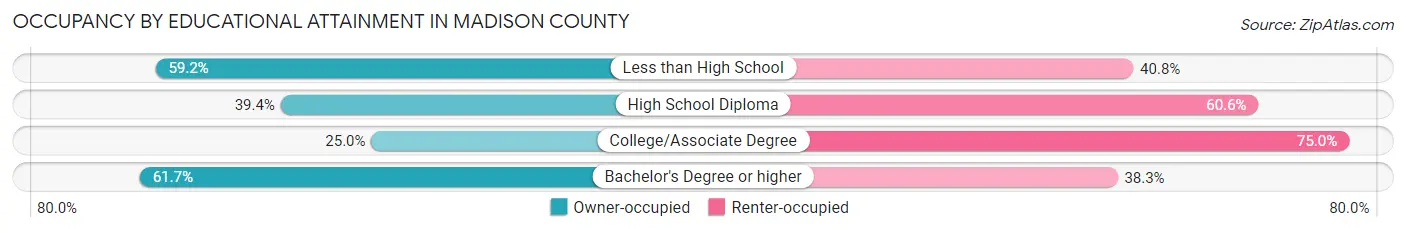
| Household Size | Owner-occupied | Renter-occupied |
| Less than High School | 93 (59.2%) | 64 (40.8%) |
| High School Diploma | 742 (39.4%) | 1,142 (60.6%) |
| College/Associate Degree | 1,482 (25.0%) | 4,445 (75.0%) |
| Bachelor's Degree or higher | 2,476 (61.7%) | 1,535 (38.3%) |
Occupancy by Age of Householder in Madison County
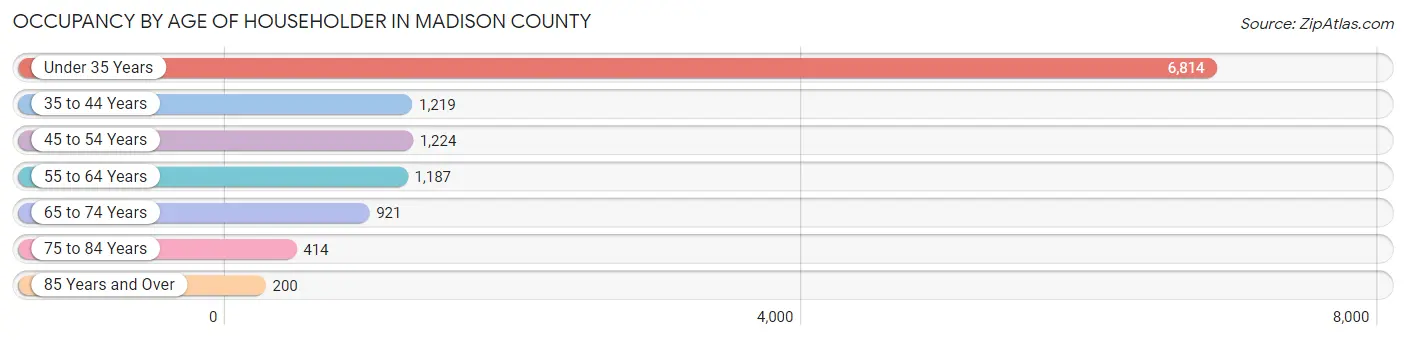
| Age Bracket | # Households | % Households |
| Under 35 Years | 6,814 | 56.9% |
| 35 to 44 Years | 1,219 | 10.2% |
| 45 to 54 Years | 1,224 | 10.2% |
| 55 to 64 Years | 1,187 | 9.9% |
| 65 to 74 Years | 921 | 7.7% |
| 75 to 84 Years | 414 | 3.5% |
| 85 Years and Over | 200 | 1.7% |
| Total | 11,979 | 100.0% |
Housing Finances in Madison County
Median Income by Occupancy in Madison County
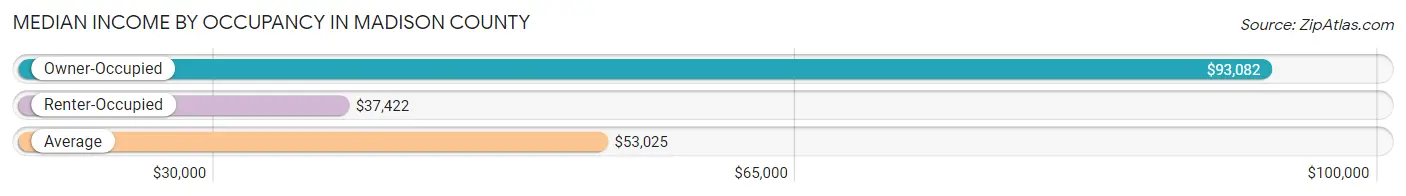
| Occupancy Type | # Households | Median Income |
| Owner-Occupied | 4,793 (40.0%) | $93,082 |
| Renter-Occupied | 7,186 (60.0%) | $37,422 |
| Average | 11,979 (100.0%) | $53,025 |
Occupancy by Householder Income Bracket in Madison County
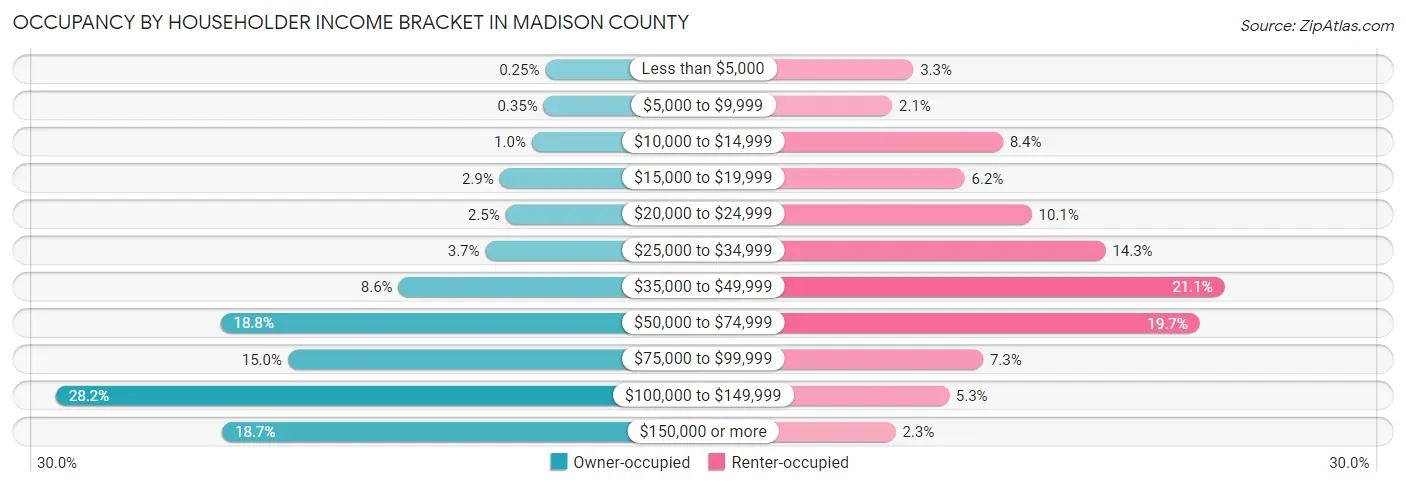
| Income Bracket | Owner-occupied | Renter-occupied |
| Less than $5,000 | 12 (0.3%) | 237 (3.3%) |
| $5,000 to $9,999 | 17 (0.4%) | 150 (2.1%) |
| $10,000 to $14,999 | 49 (1.0%) | 604 (8.4%) |
| $15,000 to $19,999 | 137 (2.9%) | 448 (6.2%) |
| $20,000 to $24,999 | 121 (2.5%) | 723 (10.1%) |
| $25,000 to $34,999 | 176 (3.7%) | 1,026 (14.3%) |
| $35,000 to $49,999 | 414 (8.6%) | 1,515 (21.1%) |
| $50,000 to $74,999 | 901 (18.8%) | 1,413 (19.7%) |
| $75,000 to $99,999 | 717 (15.0%) | 523 (7.3%) |
| $100,000 to $149,999 | 1,352 (28.2%) | 383 (5.3%) |
| $150,000 or more | 897 (18.7%) | 164 (2.3%) |
| Total | 4,793 (100.0%) | 7,186 (100.0%) |
Monthly Housing Cost Tiers in Madison County
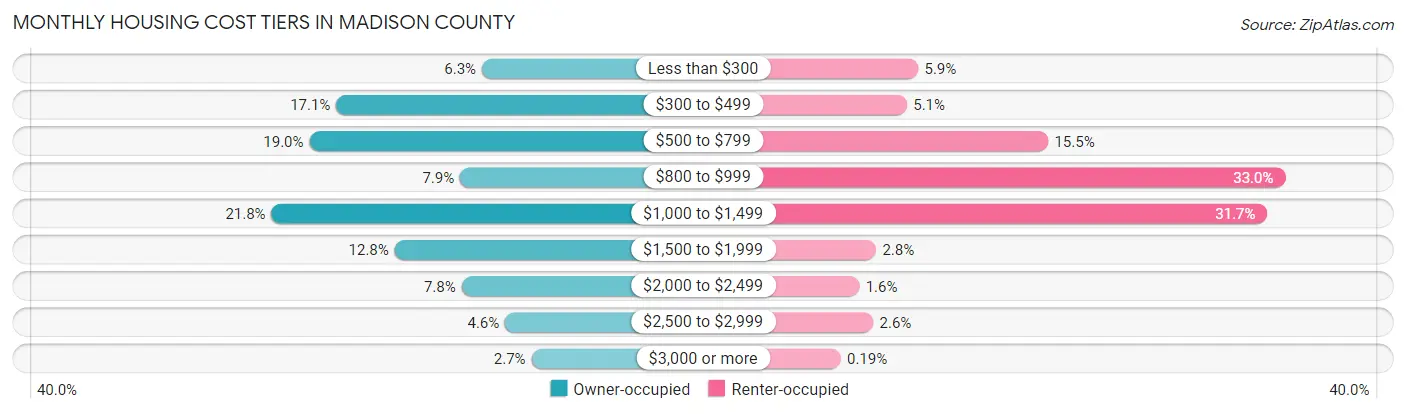
| Monthly Cost | Owner-occupied | Renter-occupied |
| Less than $300 | 303 (6.3%) | 424 (5.9%) |
| $300 to $499 | 817 (17.1%) | 364 (5.1%) |
| $500 to $799 | 912 (19.0%) | 1,112 (15.5%) |
| $800 to $999 | 380 (7.9%) | 2,370 (33.0%) |
| $1,000 to $1,499 | 1,046 (21.8%) | 2,275 (31.7%) |
| $1,500 to $1,999 | 611 (12.8%) | 201 (2.8%) |
| $2,000 to $2,499 | 375 (7.8%) | 113 (1.6%) |
| $2,500 to $2,999 | 221 (4.6%) | 186 (2.6%) |
| $3,000 or more | 128 (2.7%) | 14 (0.2%) |
| Total | 4,793 (100.0%) | 7,186 (100.0%) |
Physical Housing Characteristics in Madison County
Housing Structures in Madison County
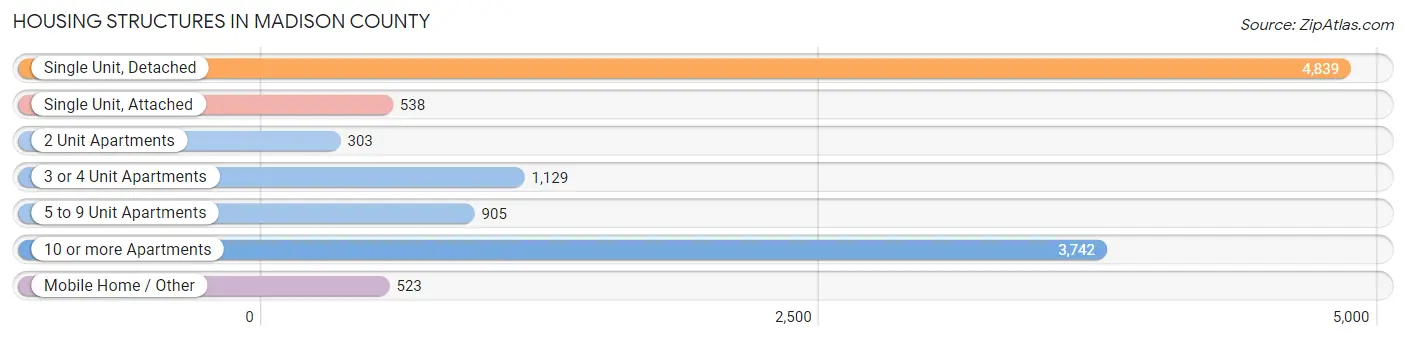
| Structure Type | # Housing Units | % Housing Units |
| Single Unit, Detached | 4,839 | 40.4% |
| Single Unit, Attached | 538 | 4.5% |
| 2 Unit Apartments | 303 | 2.5% |
| 3 or 4 Unit Apartments | 1,129 | 9.4% |
| 5 to 9 Unit Apartments | 905 | 7.5% |
| 10 or more Apartments | 3,742 | 31.2% |
| Mobile Home / Other | 523 | 4.4% |
| Total | 11,979 | 100.0% |
Housing Structures by Occupancy in Madison County
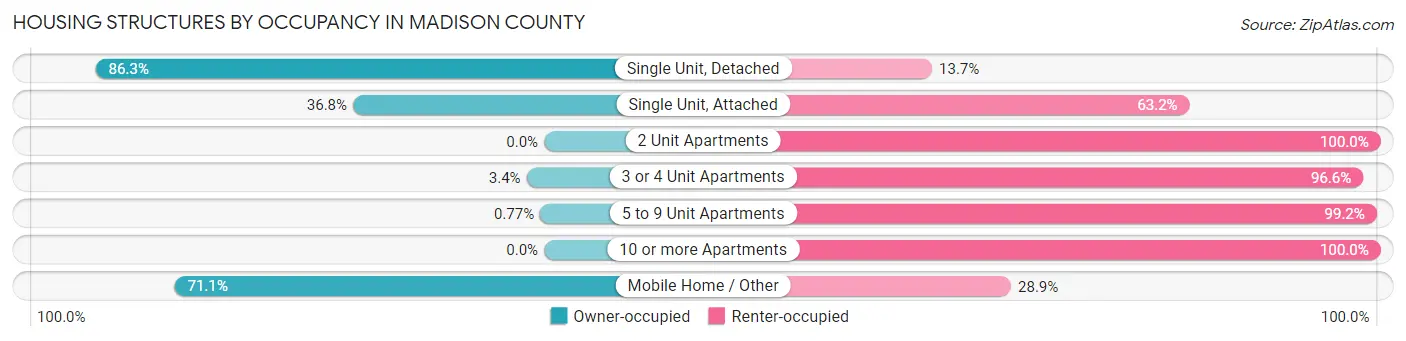
| Structure Type | Owner-occupied | Renter-occupied |
| Single Unit, Detached | 4,178 (86.3%) | 661 (13.7%) |
| Single Unit, Attached | 198 (36.8%) | 340 (63.2%) |
| 2 Unit Apartments | 0 (0.0%) | 303 (100.0%) |
| 3 or 4 Unit Apartments | 38 (3.4%) | 1,091 (96.6%) |
| 5 to 9 Unit Apartments | 7 (0.8%) | 898 (99.2%) |
| 10 or more Apartments | 0 (0.0%) | 3,742 (100.0%) |
| Mobile Home / Other | 372 (71.1%) | 151 (28.9%) |
| Total | 4,793 (40.0%) | 7,186 (60.0%) |
Housing Structures by Number of Rooms in Madison County
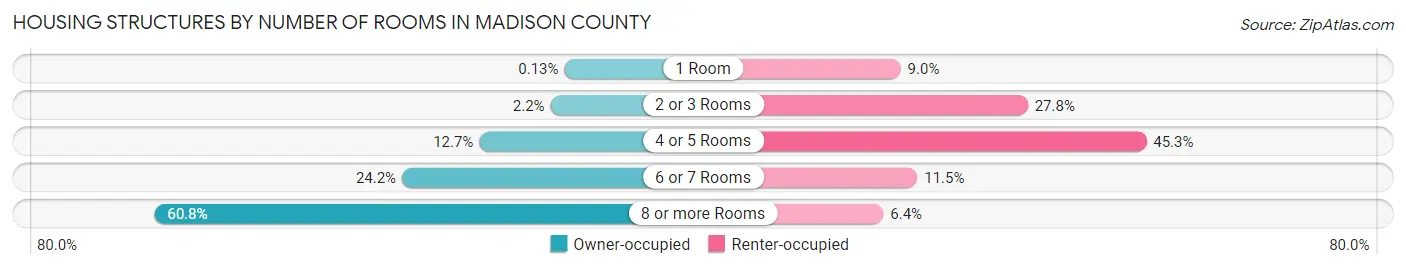
| Number of Rooms | Owner-occupied | Renter-occupied |
| 1 Room | 6 (0.1%) | 646 (9.0%) |
| 2 or 3 Rooms | 105 (2.2%) | 1,997 (27.8%) |
| 4 or 5 Rooms | 610 (12.7%) | 3,258 (45.3%) |
| 6 or 7 Rooms | 1,158 (24.2%) | 823 (11.5%) |
| 8 or more Rooms | 2,914 (60.8%) | 462 (6.4%) |
| Total | 4,793 (100.0%) | 7,186 (100.0%) |
Housing Structure by Heating Type in Madison County
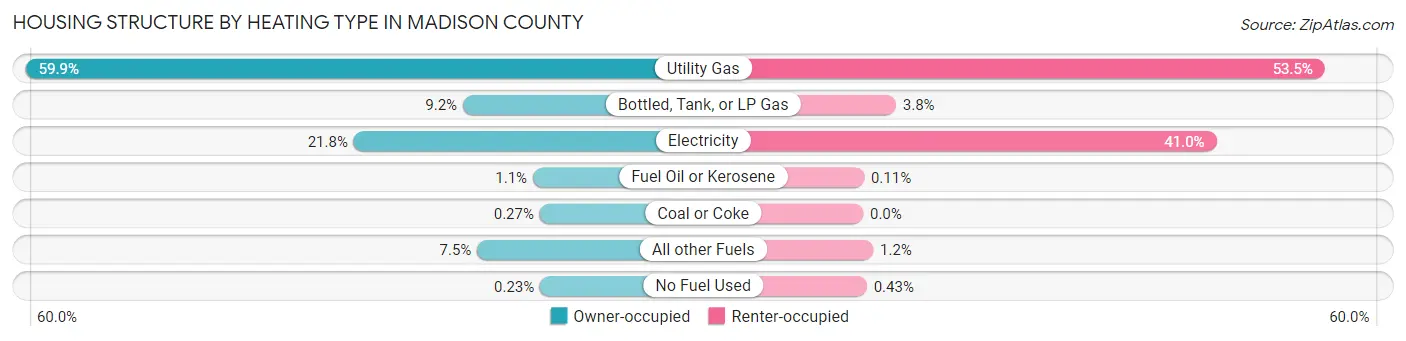
| Heating Type | Owner-occupied | Renter-occupied |
| Utility Gas | 2,870 (59.9%) | 3,846 (53.5%) |
| Bottled, Tank, or LP Gas | 440 (9.2%) | 273 (3.8%) |
| Electricity | 1,047 (21.8%) | 2,944 (41.0%) |
| Fuel Oil or Kerosene | 51 (1.1%) | 8 (0.1%) |
| Coal or Coke | 13 (0.3%) | 0 (0.0%) |
| All other Fuels | 361 (7.5%) | 84 (1.2%) |
| No Fuel Used | 11 (0.2%) | 31 (0.4%) |
| Total | 4,793 (100.0%) | 7,186 (100.0%) |
Household Vehicle Usage in Madison County
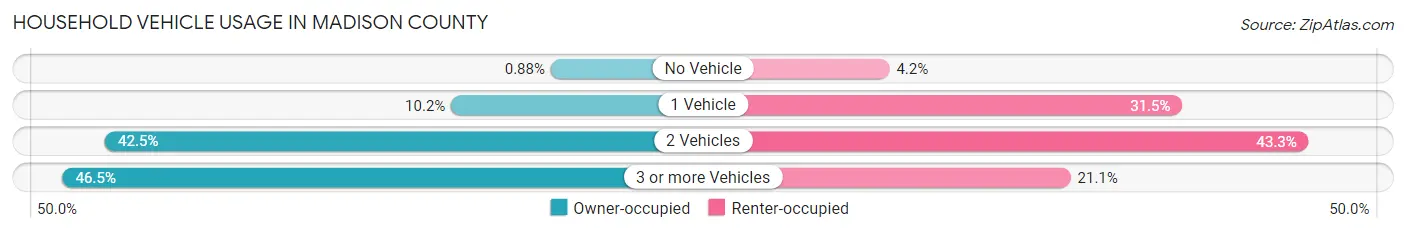
| Vehicles per Household | Owner-occupied | Renter-occupied |
| No Vehicle | 42 (0.9%) | 299 (4.2%) |
| 1 Vehicle | 488 (10.2%) | 2,263 (31.5%) |
| 2 Vehicles | 2,036 (42.5%) | 3,110 (43.3%) |
| 3 or more Vehicles | 2,227 (46.5%) | 1,514 (21.1%) |
| Total | 4,793 (100.0%) | 7,186 (100.0%) |
Real Estate & Mortgages in Madison County
Real Estate and Mortgage Overview in Madison County
| Characteristic | Without Mortgage | With Mortgage |
| Housing Units | 2,014 | 2,779 |
| Median Property Value | $313,700 | $332,200 |
| Median Household Income | $83,542 | $480 |
| Monthly Housing Costs | $480 | $128 |
| Real Estate Taxes | $1,819 | $24 |
Property Value by Mortgage Status in Madison County
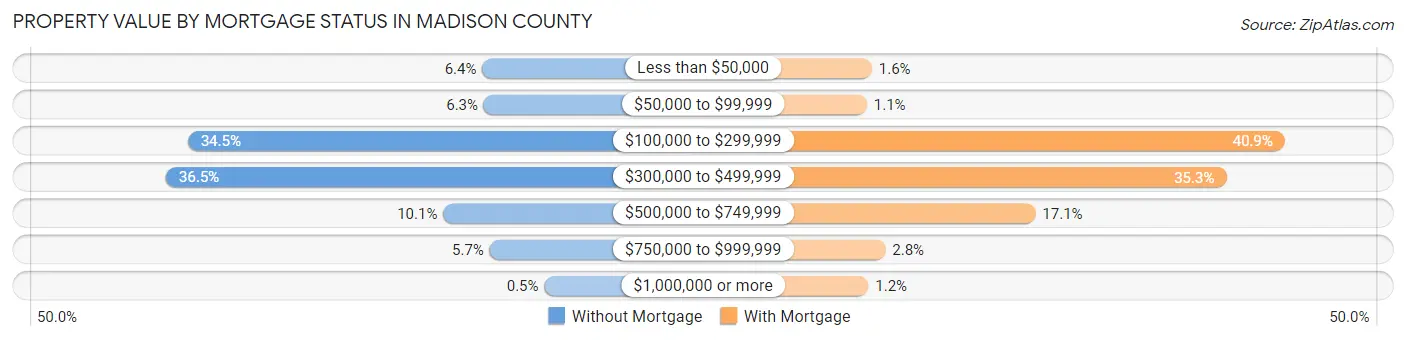
| Property Value | Without Mortgage | With Mortgage |
| Less than $50,000 | 129 (6.4%) | 43 (1.5%) |
| $50,000 to $99,999 | 126 (6.3%) | 30 (1.1%) |
| $100,000 to $299,999 | 694 (34.5%) | 1,136 (40.9%) |
| $300,000 to $499,999 | 736 (36.5%) | 981 (35.3%) |
| $500,000 to $749,999 | 204 (10.1%) | 476 (17.1%) |
| $750,000 to $999,999 | 115 (5.7%) | 79 (2.8%) |
| $1,000,000 or more | 10 (0.5%) | 34 (1.2%) |
| Total | 2,014 (100.0%) | 2,779 (100.0%) |
Household Income by Mortgage Status in Madison County
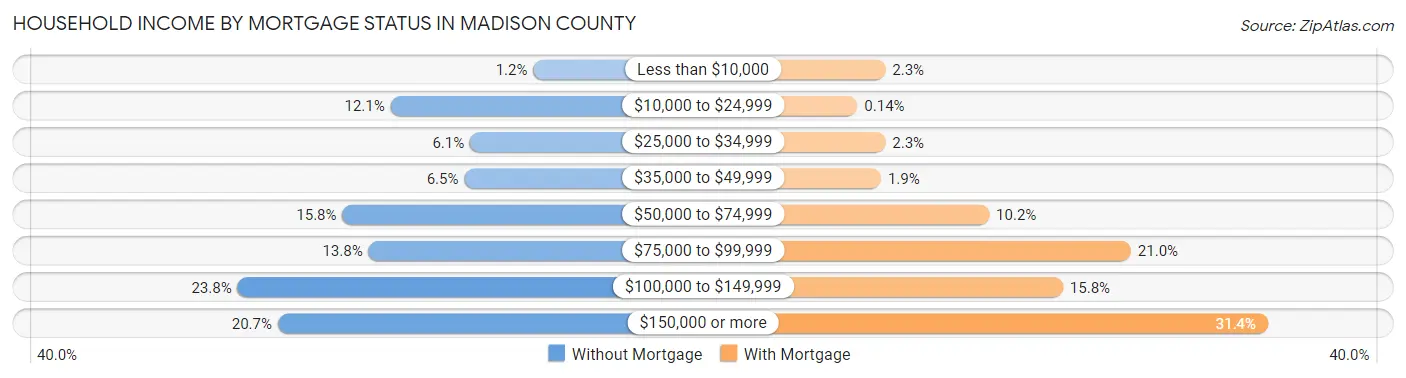
| Household Income | Without Mortgage | With Mortgage |
| Less than $10,000 | 25 (1.2%) | 63 (2.3%) |
| $10,000 to $24,999 | 244 (12.1%) | 4 (0.1%) |
| $25,000 to $34,999 | 122 (6.1%) | 63 (2.3%) |
| $35,000 to $49,999 | 131 (6.5%) | 54 (1.9%) |
| $50,000 to $74,999 | 318 (15.8%) | 283 (10.2%) |
| $75,000 to $99,999 | 278 (13.8%) | 583 (21.0%) |
| $100,000 to $149,999 | 479 (23.8%) | 439 (15.8%) |
| $150,000 or more | 417 (20.7%) | 873 (31.4%) |
| Total | 2,014 (100.0%) | 2,779 (100.0%) |
Property Value to Household Income Ratio in Madison County
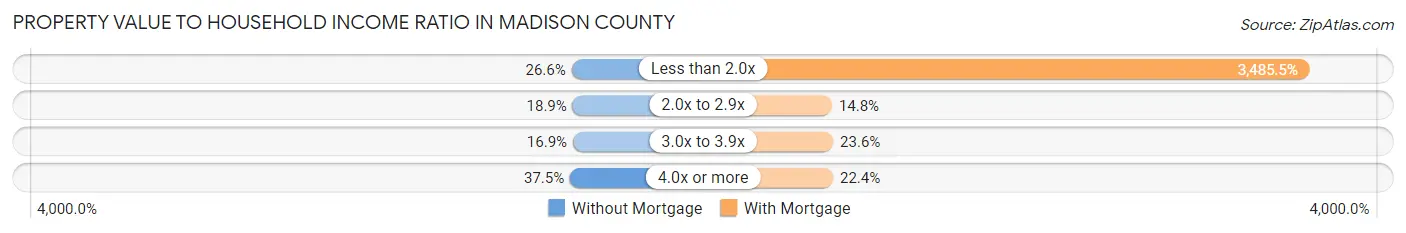
| Value-to-Income Ratio | Without Mortgage | With Mortgage |
| Less than 2.0x | 535 (26.6%) | 96,863 (3,485.5%) |
| 2.0x to 2.9x | 381 (18.9%) | 410 (14.7%) |
| 3.0x to 3.9x | 340 (16.9%) | 657 (23.6%) |
| 4.0x or more | 756 (37.5%) | 623 (22.4%) |
| Total | 2,014 (100.0%) | 2,779 (100.0%) |
Real Estate Taxes by Mortgage Status in Madison County
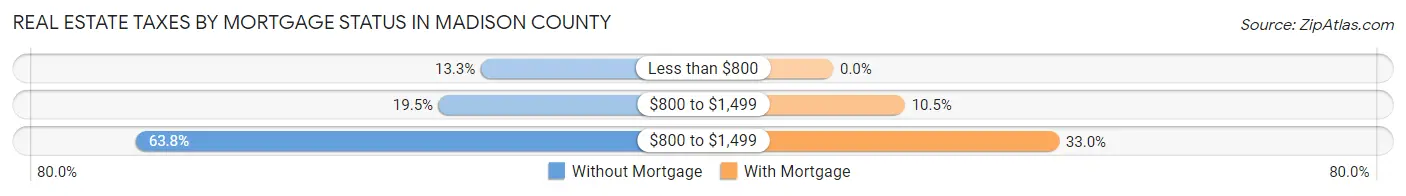
| Property Taxes | Without Mortgage | With Mortgage |
| Less than $800 | 268 (13.3%) | 0 (0.0%) |
| $800 to $1,499 | 392 (19.5%) | 291 (10.5%) |
| $800 to $1,499 | 1,284 (63.7%) | 917 (33.0%) |
| Total | 2,014 (100.0%) | 2,779 (100.0%) |
Health & Disability in Madison County
Health Insurance Coverage by Age in Madison County
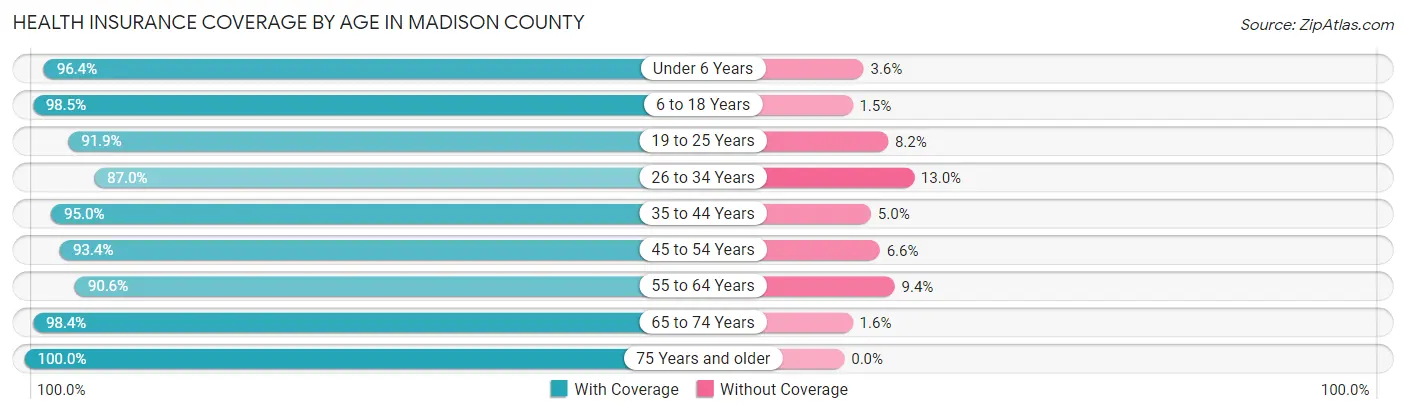
| Age Bracket | With Coverage | Without Coverage |
| Under 6 Years | 4,106 (96.4%) | 153 (3.6%) |
| 6 to 18 Years | 12,143 (98.5%) | 188 (1.5%) |
| 19 to 25 Years | 18,318 (91.8%) | 1,626 (8.2%) |
| 26 to 34 Years | 4,706 (87.0%) | 702 (13.0%) |
| 35 to 44 Years | 2,854 (95.0%) | 149 (5.0%) |
| 45 to 54 Years | 2,248 (93.4%) | 159 (6.6%) |
| 55 to 64 Years | 1,970 (90.6%) | 204 (9.4%) |
| 65 to 74 Years | 1,636 (98.4%) | 26 (1.6%) |
| 75 Years and older | 1,106 (100.0%) | 0 (0.0%) |
| Total | 49,087 (93.9%) | 3,207 (6.1%) |
Health Insurance Coverage by Citizenship Status in Madison County
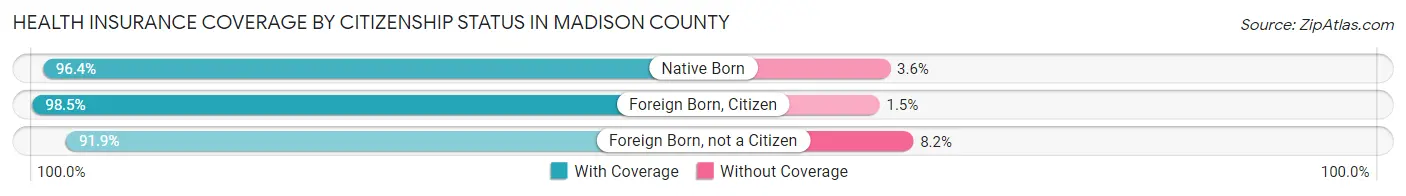
| Citizenship Status | With Coverage | Without Coverage |
| Native Born | 4,106 (96.4%) | 153 (3.6%) |
| Foreign Born, Citizen | 12,143 (98.5%) | 188 (1.5%) |
| Foreign Born, not a Citizen | 18,318 (91.8%) | 1,626 (8.2%) |
Health Insurance Coverage by Household Income in Madison County
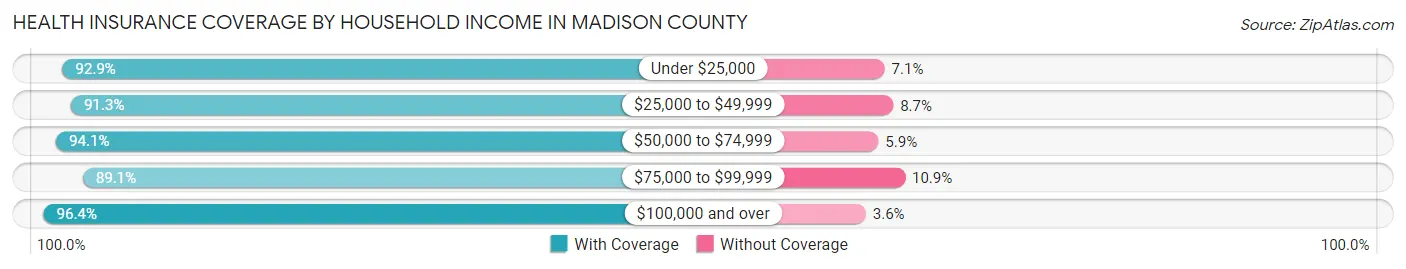
| Household Income | With Coverage | Without Coverage |
| Under $25,000 | 7,549 (92.9%) | 576 (7.1%) |
| $25,000 to $49,999 | 8,988 (91.3%) | 856 (8.7%) |
| $50,000 to $74,999 | 9,384 (94.1%) | 591 (5.9%) |
| $75,000 to $99,999 | 4,150 (89.1%) | 508 (10.9%) |
| $100,000 and over | 13,304 (96.4%) | 492 (3.6%) |
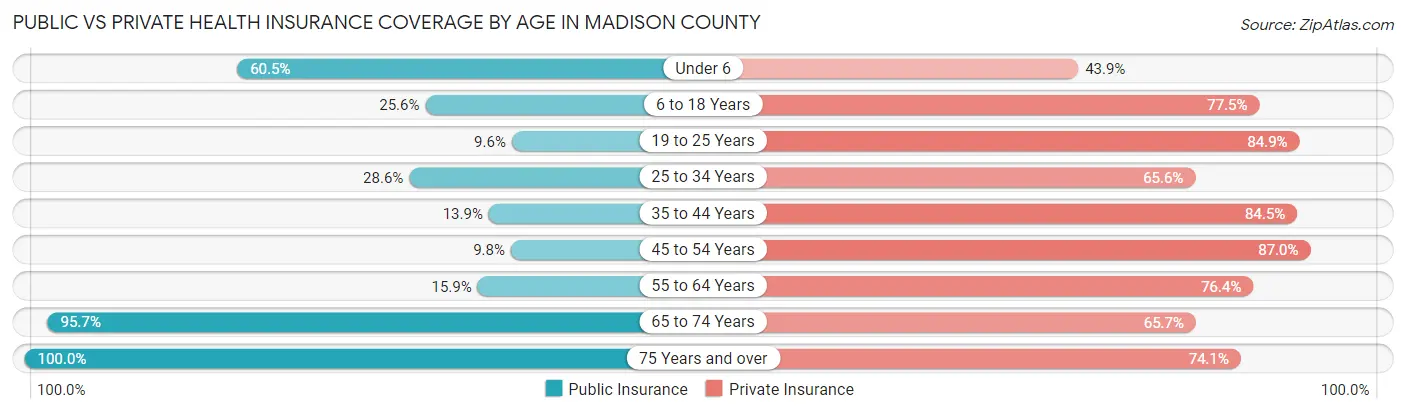
Public vs Private Health Insurance Coverage by Age in Madison County
| Age Bracket | Public Insurance | Private Insurance |
| Under 6 | 2,578 (60.5%) | 1,869 (43.9%) |
| 6 to 18 Years | 3,159 (25.6%) | 9,554 (77.5%) |
| 19 to 25 Years | 1,911 (9.6%) | 16,940 (84.9%) |
| 25 to 34 Years | 1,548 (28.6%) | 3,547 (65.6%) |
| 35 to 44 Years | 416 (13.9%) | 2,538 (84.5%) |
| 45 to 54 Years | 235 (9.8%) | 2,093 (87.0%) |
| 55 to 64 Years | 346 (15.9%) | 1,660 (76.4%) |
| 65 to 74 Years | 1,591 (95.7%) | 1,092 (65.7%) |
| 75 Years and over | 1,106 (100.0%) | 819 (74.1%) |
| Total | 12,890 (24.6%) | 40,112 (76.7%) |
Disability Status by Sex by Age in Madison County
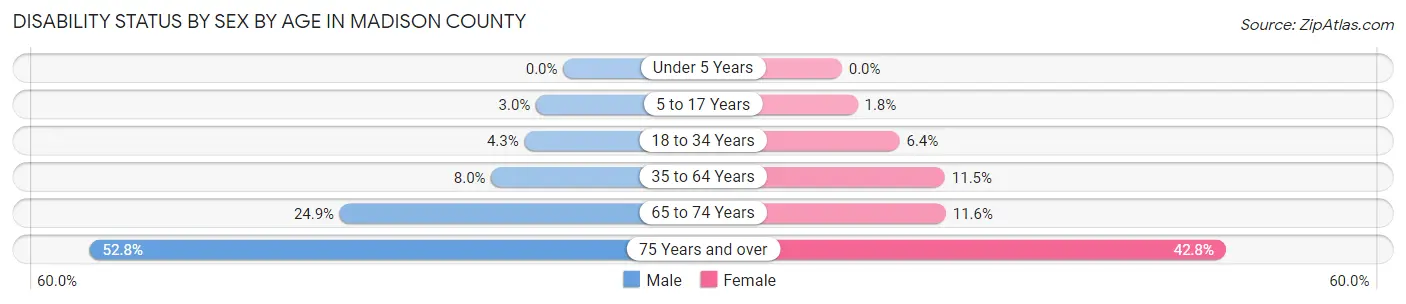
| Age Bracket | Male | Female |
| Under 5 Years | 0 (0.0%) | 0 (0.0%) |
| 5 to 17 Years | 112 (3.0%) | 59 (1.8%) |
| 18 to 34 Years | 568 (4.3%) | 1,166 (6.4%) |
| 35 to 64 Years | 291 (8.0%) | 454 (11.5%) |
| 65 to 74 Years | 203 (24.9%) | 98 (11.6%) |
| 75 Years and over | 259 (52.7%) | 263 (42.8%) |
Disability Class by Sex by Age in Madison County
Disability Class: Hearing Difficulty
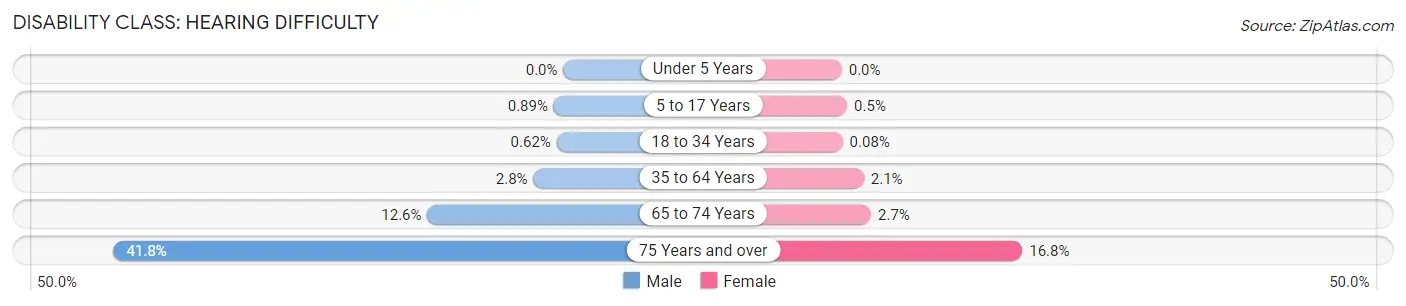
| Age Bracket | Male | Female |
| Under 5 Years | 0 (0.0%) | 0 (0.0%) |
| 5 to 17 Years | 33 (0.9%) | 17 (0.5%) |
| 18 to 34 Years | 81 (0.6%) | 14 (0.1%) |
| 35 to 64 Years | 101 (2.8%) | 81 (2.1%) |
| 65 to 74 Years | 103 (12.6%) | 23 (2.7%) |
| 75 Years and over | 205 (41.7%) | 103 (16.8%) |
Disability Class: Vision Difficulty
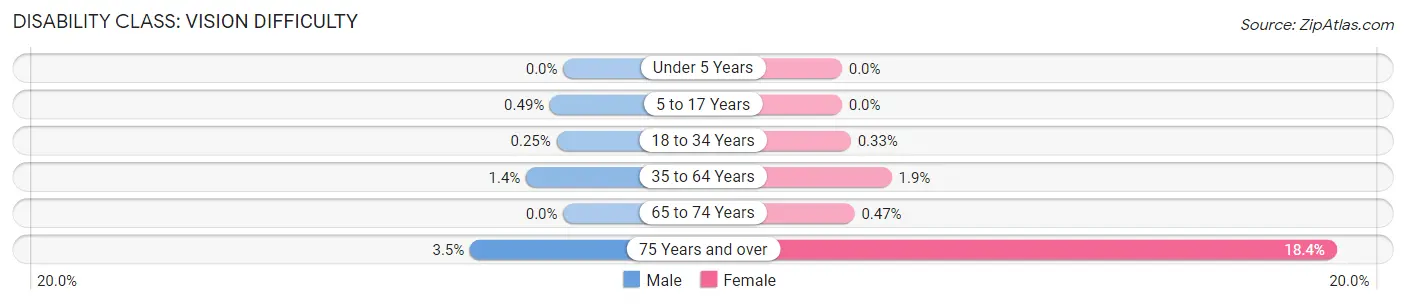
| Age Bracket | Male | Female |
| Under 5 Years | 0 (0.0%) | 0 (0.0%) |
| 5 to 17 Years | 18 (0.5%) | 0 (0.0%) |
| 18 to 34 Years | 33 (0.3%) | 60 (0.3%) |
| 35 to 64 Years | 50 (1.4%) | 73 (1.8%) |
| 65 to 74 Years | 0 (0.0%) | 4 (0.5%) |
| 75 Years and over | 17 (3.5%) | 113 (18.4%) |
Disability Class: Cognitive Difficulty
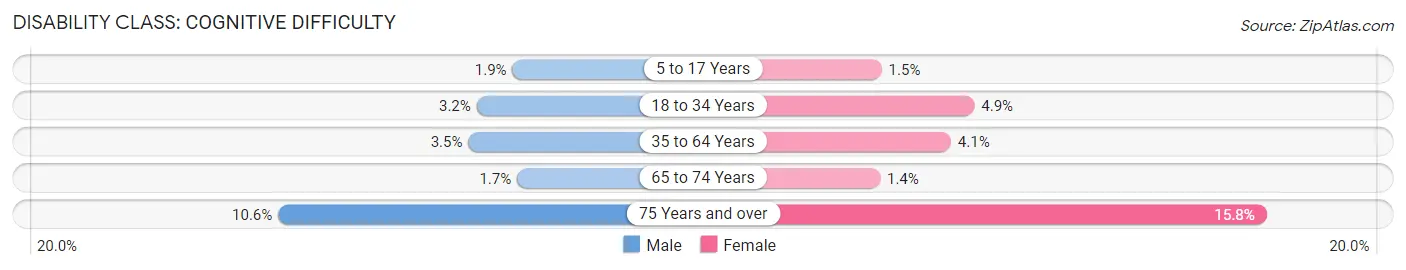
| Age Bracket | Male | Female |
| 5 to 17 Years | 70 (1.9%) | 50 (1.5%) |
| 18 to 34 Years | 423 (3.2%) | 891 (4.9%) |
| 35 to 64 Years | 128 (3.5%) | 160 (4.1%) |
| 65 to 74 Years | 14 (1.7%) | 12 (1.4%) |
| 75 Years and over | 52 (10.6%) | 97 (15.8%) |
Disability Class: Ambulatory Difficulty
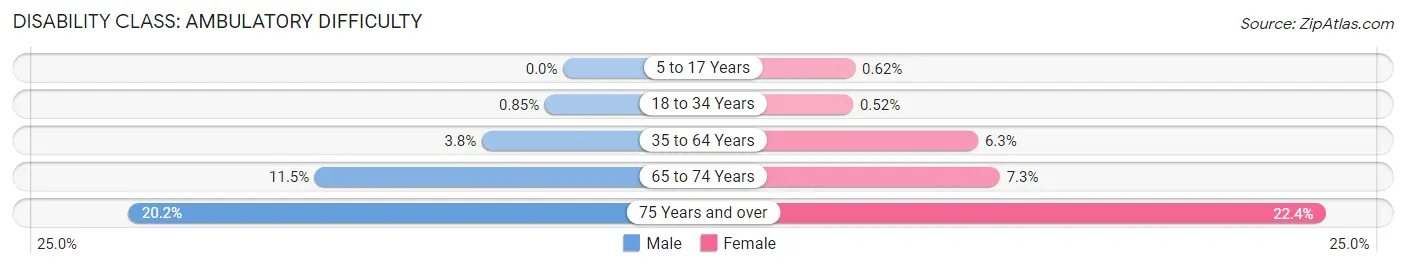
| Age Bracket | Male | Female |
| 5 to 17 Years | 0 (0.0%) | 21 (0.6%) |
| 18 to 34 Years | 112 (0.9%) | 94 (0.5%) |
| 35 to 64 Years | 137 (3.8%) | 250 (6.3%) |
| 65 to 74 Years | 94 (11.5%) | 62 (7.3%) |
| 75 Years and over | 99 (20.2%) | 138 (22.4%) |
Disability Class: Self-Care Difficulty
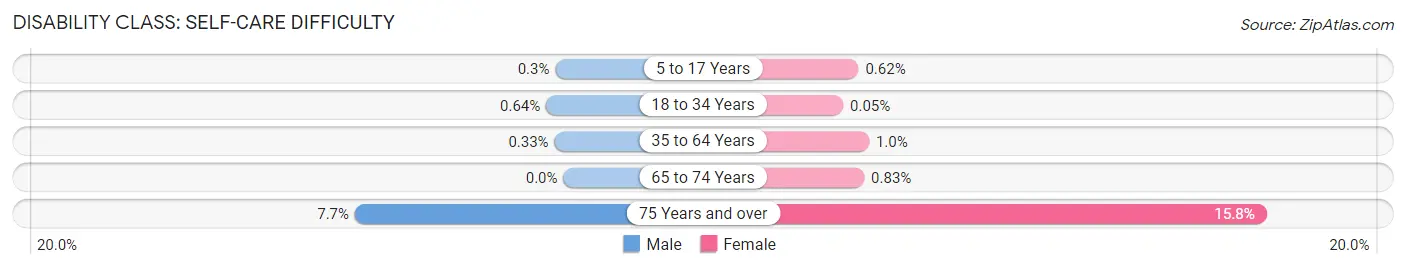
| Age Bracket | Male | Female |
| 5 to 17 Years | 11 (0.3%) | 21 (0.6%) |
| 18 to 34 Years | 84 (0.6%) | 9 (0.1%) |
| 35 to 64 Years | 12 (0.3%) | 40 (1.0%) |
| 65 to 74 Years | 0 (0.0%) | 7 (0.8%) |
| 75 Years and over | 38 (7.7%) | 97 (15.8%) |
Technology Access in Madison County
Computing Device Access in Madison County
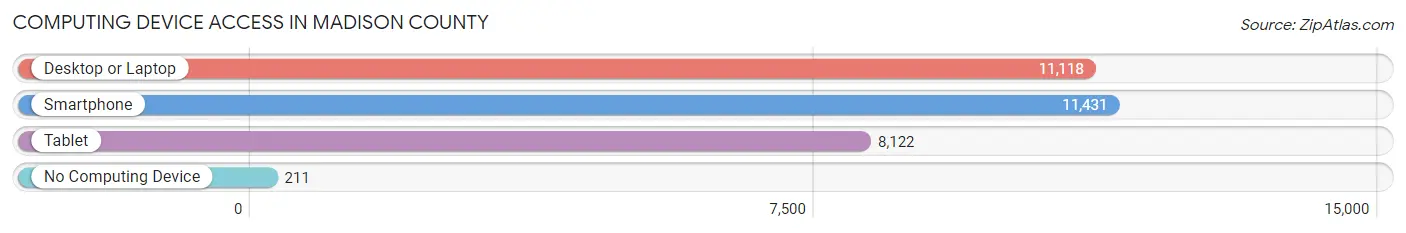
| Device Type | # Households | % Households |
| Desktop or Laptop | 11,118 | 92.8% |
| Smartphone | 11,431 | 95.4% |
| Tablet | 8,122 | 67.8% |
| No Computing Device | 211 | 1.8% |
| Total | 11,979 | 100.0% |
Internet Access in Madison County
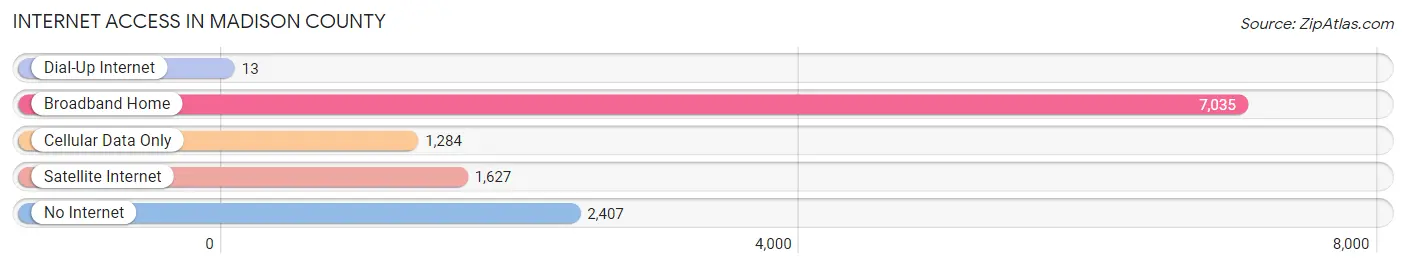
| Internet Type | # Households | % Households |
| Dial-Up Internet | 13 | 0.1% |
| Broadband Home | 7,035 | 58.7% |
| Cellular Data Only | 1,284 | 10.7% |
| Satellite Internet | 1,627 | 13.6% |
| No Internet | 2,407 | 20.1% |
| Total | 11,979 | 100.0% |
Madison County Summary
Madison County, Idaho is located in the southeastern corner of the state and is bordered by Fremont County to the east, Jefferson County to the south, and Teton County to the west. The county seat is Rexburg, and the largest city is Rexburg. The county was established in 1913 and named after James Madison, the fourth president of the United States.
Geography
Madison County covers an area of 1,717 square miles and is located in the Snake River Plain region of Idaho. The county is mostly flat, with the exception of the Teton Range, which rises to the west. The Snake River flows through the county, and there are several small lakes and reservoirs. The climate is semi-arid, with hot summers and cold winters.
Demographics
As of the 2010 census, Madison County had a population of 37,536. The population was spread out, with 25.3% under the age of 18, 11.2% from 18 to 24, 24.2% from 25 to 44, 22.2% from 45 to 64, and 17.1% who were 65 years of age or older. The median age was 32.4 years. The gender makeup of the county was 49.3% male and 50.7% female.
Economy
Agriculture is the main economic activity in Madison County. The county is home to several large farms and ranches, and the main crops grown are potatoes, wheat, barley, and hay. The county is also home to several food processing plants, including the Idahoan Foods plant in Rexburg.
The county is also home to several educational institutions, including Brigham Young University-Idaho, which is located in Rexburg. The university is the largest employer in the county, and it also provides a large number of jobs in the service sector.
The county is also home to several tourist attractions, including the Yellowstone Bear World, which is located in Rexburg. The county is also home to several ski resorts, including Grand Targhee Resort, which is located in the Teton Range.
Conclusion
Madison County, Idaho is a rural county located in the southeastern corner of the state. The county is home to several large farms and ranches, and the main crops grown are potatoes, wheat, barley, and hay. The county is also home to several educational institutions, including Brigham Young University-Idaho, and several tourist attractions, including the Yellowstone Bear World. The county has a population of 37,536, and the median age is 32.4 years. The main economic activity in the county is agriculture, and the county is also home to several food processing plants and ski resorts.
Common Questions
What is the Total Population of Madison County?
Total Population of Madison County is 52,487.
What is the Total Male Population of Madison County?
Total Male Population of Madison County is 23,769.
What is the Total Female Population of Madison County?
Total Female Population of Madison County is 28,718.
What is the Ratio of Males per 100 Females in Madison County?
There are 82.77 Males per 100 Females in Madison County.
What is the Ratio of Females per 100 Males in Madison County?
There are 120.82 Females per 100 Males in Madison County.
What is the Median Population Age in Madison County?
Median Population Age in Madison County is 21.6 Years.
What is the Average Family Size in Madison County
Average Family Size in Madison County is 3.8 People.
What is the Average Household Size in Madison County
Average Household Size in Madison County is 3.9 People.
What is Per Capita Income in Madison County?
Per Capita income in Madison County is $21,394.
What is the Median Family Income in Madison County?
Median Family Income in Madison County is $59,091.
What is the Median Household income in Madison County?
Median Household Income in Madison County is $53,025.
What is Income or Wage Gap in Madison County?
Income or Wage Gap in Madison County is 47.7%.
Women in Madison County earn 52.3 cents for every dollar earned by a man.
What is Inequality or Gini Index in Madison County?
Inequality or Gini Index in Madison County is 0.52.
How Large is the Labor Force in Madison County?
There are 29,090 People in the Labor Forcein in Madison County.
What is the Percentage of People in the Labor Force in Madison County?
67.3% of People are in the Labor Force in Madison County.
What is the Unemployment Rate in Madison County?
Unemployment Rate in Madison County is 8.1%.