Lemhi County, ID
Lemhi County Map
Lemhi County Overview
8,043
TOTAL POPULATION
4,228
MALE POPULATION
3,815
FEMALE POPULATION
110.83
MALES / 100 FEMALES
90.23
FEMALES / 100 MALES
53.2
MEDIAN AGE
3.3
AVG FAMILY SIZE
2.4
AVG HOUSEHOLD SIZE
$32,446
PER CAPITA INCOME
$73,194
AVG FAMILY INCOME
$49,216
AVG HOUSEHOLD INCOME
42.0%
WAGE / INCOME GAP [ % ]
58.0¢/ $1
WAGE / INCOME GAP [ $ ]
$10,799
FAMILY INCOME DEFICIT
0.50
INEQUALITY / GINI INDEX
3,577
LABOR FORCE [ PEOPLE ]
52.5%
PERCENT IN LABOR FORCE
3.1%
UNEMPLOYMENT RATE
Lemhi County Area Codes
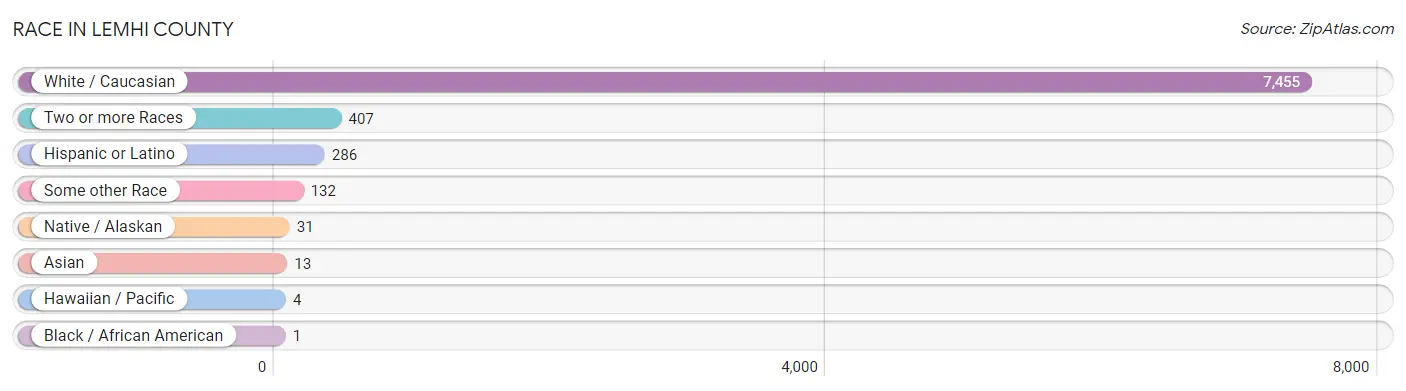
Race in Lemhi County
The most populous races in Lemhi County are White / Caucasian (7,455 | 92.7%), Two or more Races (407 | 5.1%), and Hispanic or Latino (286 | 3.6%).
| Race | # Population | % Population |
| Asian | 13 | 0.2% |
| Black / African American | 1 | 0.0% |
| Hawaiian / Pacific | 4 | 0.1% |
| Hispanic or Latino | 286 | 3.6% |
| Native / Alaskan | 31 | 0.4% |
| White / Caucasian | 7,455 | 92.7% |
| Two or more Races | 407 | 5.1% |
| Some other Race | 132 | 1.6% |
| Total | 8,043 | 100.0% |
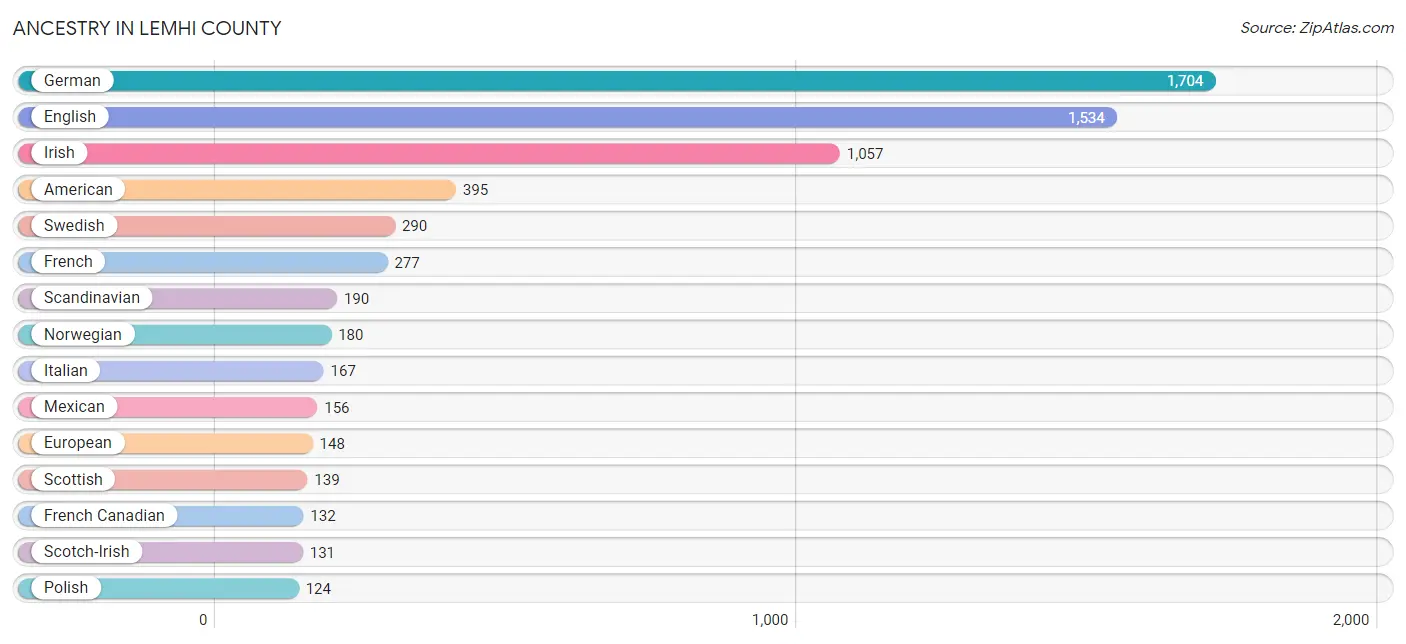
Ancestry in Lemhi County
The most populous ancestries reported in Lemhi County are German (1,704 | 21.2%), English (1,534 | 19.1%), Irish (1,057 | 13.1%), American (395 | 4.9%), and Swedish (290 | 3.6%), together accounting for 61.9% of all Lemhi County residents.
| Ancestry | # Population | % Population |
| African | 12 | 0.2% |
| American | 395 | 4.9% |
| Apache | 12 | 0.2% |
| Arab | 12 | 0.2% |
| Austrian | 12 | 0.2% |
| Basque | 7 | 0.1% |
| Belgian | 3 | 0.0% |
| Bhutanese | 8 | 0.1% |
| Blackfeet | 1 | 0.0% |
| British | 108 | 1.3% |
| Central American | 3 | 0.0% |
| Cherokee | 33 | 0.4% |
| Chickasaw | 3 | 0.0% |
| Chilean | 9 | 0.1% |
| Choctaw | 17 | 0.2% |
| Comanche | 7 | 0.1% |
| Croatian | 11 | 0.1% |
| Czech | 1 | 0.0% |
| Czechoslovakian | 41 | 0.5% |
| Danish | 90 | 1.1% |
| Dutch | 115 | 1.4% |
| Eastern European | 21 | 0.3% |
| English | 1,534 | 19.1% |
| European | 148 | 1.8% |
| Finnish | 7 | 0.1% |
| French | 277 | 3.4% |
| French Canadian | 132 | 1.6% |
| German | 1,704 | 21.2% |
| German Russian | 13 | 0.2% |
| Greek | 14 | 0.2% |
| Hungarian | 19 | 0.2% |
| Indian (Asian) | 3 | 0.0% |
| Irish | 1,057 | 13.1% |
| Iroquois | 33 | 0.4% |
| Italian | 167 | 2.1% |
| Korean | 10 | 0.1% |
| Laotian | 2 | 0.0% |
| Lebanese | 12 | 0.2% |
| Lithuanian | 59 | 0.7% |
| Mexican | 156 | 1.9% |
| Navajo | 14 | 0.2% |
| New Zealander | 10 | 0.1% |
| Nicaraguan | 3 | 0.0% |
| Northern European | 13 | 0.2% |
| Norwegian | 180 | 2.2% |
| Osage | 50 | 0.6% |
| Polish | 124 | 1.5% |
| Portuguese | 40 | 0.5% |
| Puerto Rican | 109 | 1.4% |
| Romanian | 2 | 0.0% |
| Russian | 98 | 1.2% |
| Scandinavian | 190 | 2.4% |
| Scotch-Irish | 131 | 1.6% |
| Scottish | 139 | 1.7% |
| Serbian | 11 | 0.1% |
| Sioux | 2 | 0.0% |
| Slavic | 3 | 0.0% |
| Slovene | 6 | 0.1% |
| South American | 9 | 0.1% |
| Subsaharan African | 12 | 0.2% |
| Swedish | 290 | 3.6% |
| Swiss | 30 | 0.4% |
| Tongan | 4 | 0.1% |
| Welsh | 66 | 0.8% |
| Yugoslavian | 8 | 0.1% | View All 65 Rows |
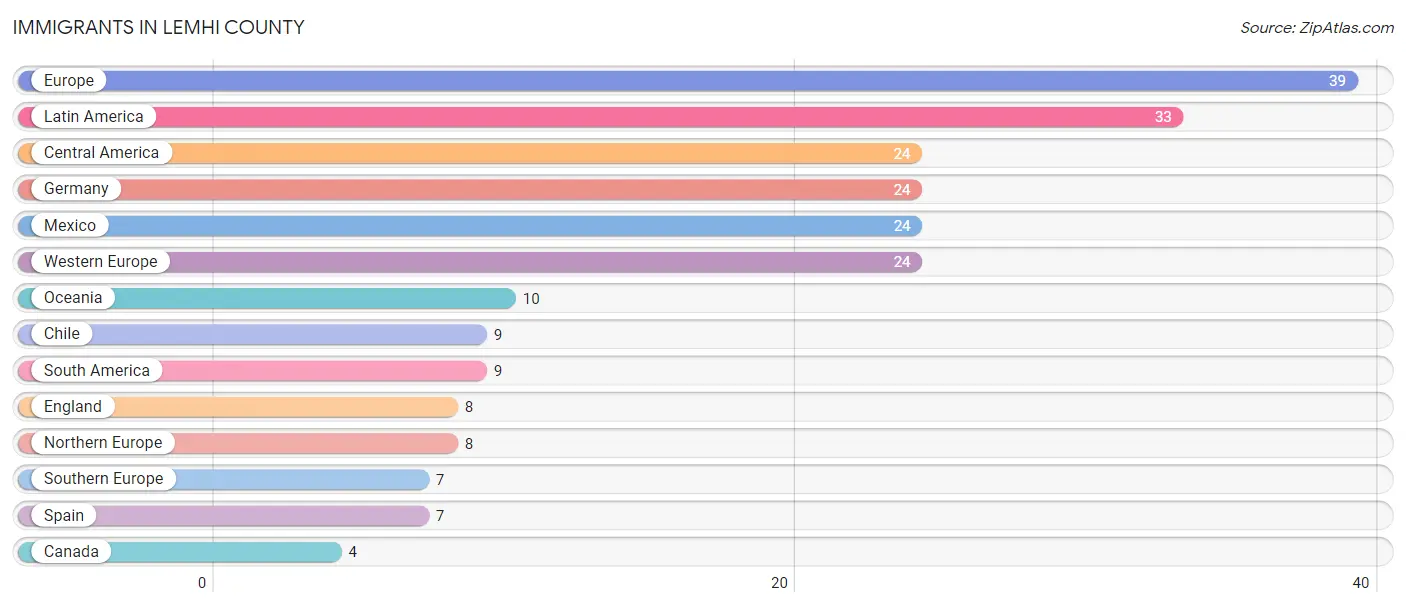
Immigrants in Lemhi County
The most numerous immigrant groups reported in Lemhi County came from Europe (39 | 0.5%), Latin America (33 | 0.4%), Central America (24 | 0.3%), Germany (24 | 0.3%), and Mexico (24 | 0.3%), together accounting for 1.8% of all Lemhi County residents.
| Immigration Origin | # Population | % Population |
| Canada | 4 | 0.1% |
| Central America | 24 | 0.3% |
| Chile | 9 | 0.1% |
| England | 8 | 0.1% |
| Europe | 39 | 0.5% |
| Germany | 24 | 0.3% |
| Latin America | 33 | 0.4% |
| Mexico | 24 | 0.3% |
| Northern Europe | 8 | 0.1% |
| Oceania | 10 | 0.1% |
| South America | 9 | 0.1% |
| Southern Europe | 7 | 0.1% |
| Spain | 7 | 0.1% |
| Western Europe | 24 | 0.3% | View All 14 Rows |
Sex and Age in Lemhi County
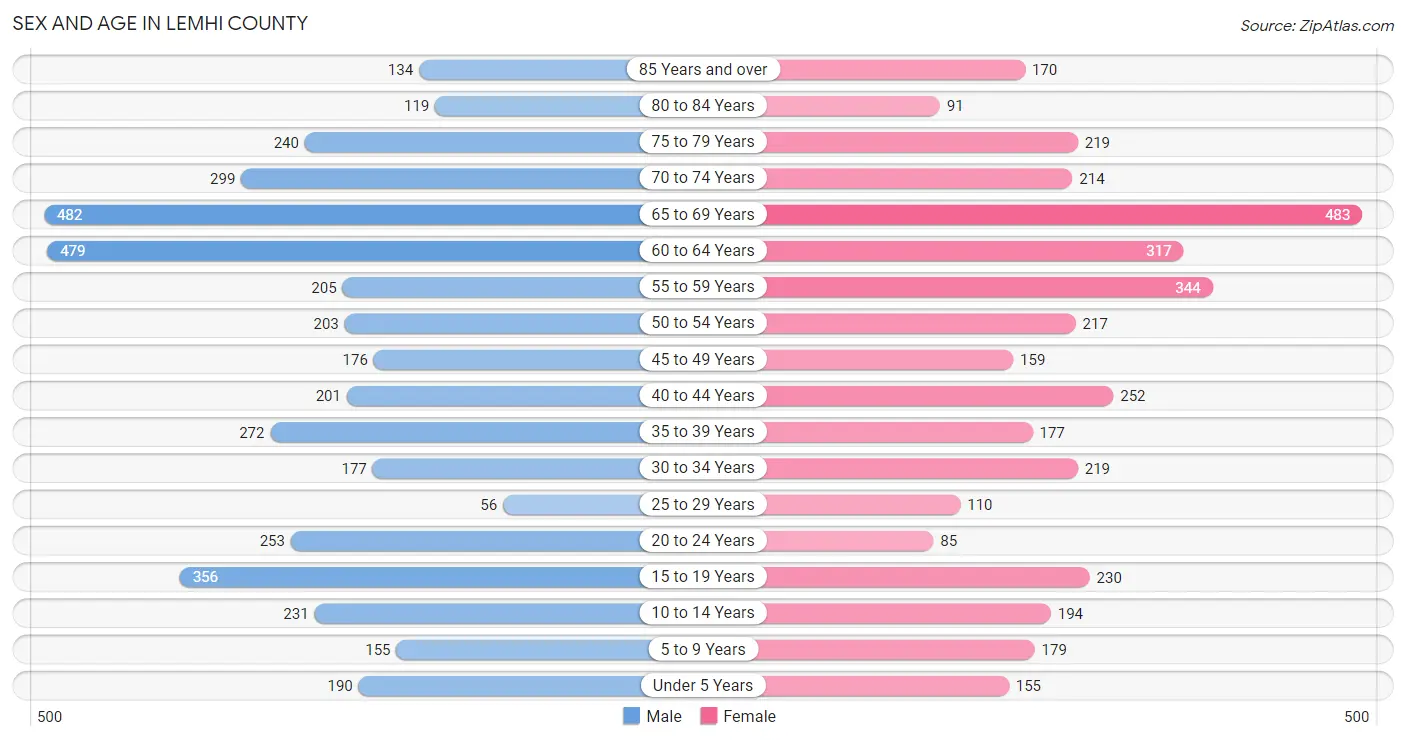
Sex and Age in Lemhi County
The most populous age groups in Lemhi County are 65 to 69 Years (482 | 11.4%) for men and 65 to 69 Years (483 | 12.7%) for women.
| Age Bracket | Male | Female |
| Under 5 Years | 190 (4.5%) | 155 (4.1%) |
| 5 to 9 Years | 155 (3.7%) | 179 (4.7%) |
| 10 to 14 Years | 231 (5.5%) | 194 (5.1%) |
| 15 to 19 Years | 356 (8.4%) | 230 (6.0%) |
| 20 to 24 Years | 253 (6.0%) | 85 (2.2%) |
| 25 to 29 Years | 56 (1.3%) | 110 (2.9%) |
| 30 to 34 Years | 177 (4.2%) | 219 (5.7%) |
| 35 to 39 Years | 272 (6.4%) | 177 (4.6%) |
| 40 to 44 Years | 201 (4.8%) | 252 (6.6%) |
| 45 to 49 Years | 176 (4.2%) | 159 (4.2%) |
| 50 to 54 Years | 203 (4.8%) | 217 (5.7%) |
| 55 to 59 Years | 205 (4.9%) | 344 (9.0%) |
| 60 to 64 Years | 479 (11.3%) | 317 (8.3%) |
| 65 to 69 Years | 482 (11.4%) | 483 (12.7%) |
| 70 to 74 Years | 299 (7.1%) | 214 (5.6%) |
| 75 to 79 Years | 240 (5.7%) | 219 (5.7%) |
| 80 to 84 Years | 119 (2.8%) | 91 (2.4%) |
| 85 Years and over | 134 (3.2%) | 170 (4.5%) |
| Total | 4,228 (100.0%) | 3,815 (100.0%) |
Families and Households in Lemhi County
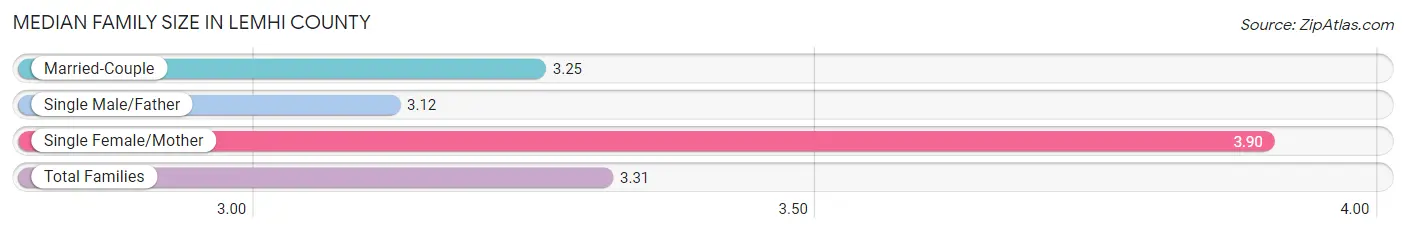
Median Family Size in Lemhi County
The median family size in Lemhi County is 3.31 persons per family, with single female/mother families (182 | 9.6%) accounting for the largest median family size of 3.9 persons per family. On the other hand, single male/father families (97 | 5.1%) represent the smallest median family size with 3.12 persons per family.
| Family Type | # Families | Family Size |
| Married-Couple | 1,608 (85.2%) | 3.25 |
| Single Male/Father | 97 (5.1%) | 3.12 |
| Single Female/Mother | 182 (9.6%) | 3.90 |
| Total Families | 1,887 (100.0%) | 3.31 |
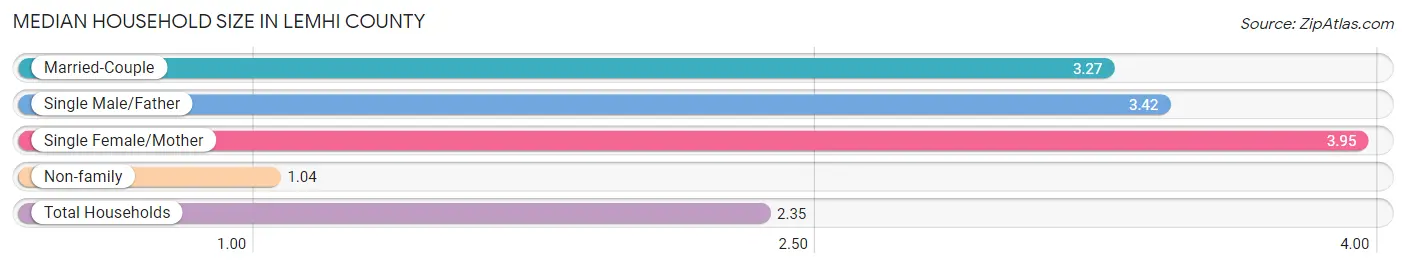
Median Household Size in Lemhi County
The median household size in Lemhi County is 2.35 persons per household, with single female/mother households (182 | 5.5%) accounting for the largest median household size of 3.95 persons per household. non-family households (1,441 | 43.3%) represent the smallest median household size with 1.04 persons per household.
| Household Type | # Households | Household Size |
| Married-Couple | 1,608 (48.3%) | 3.27 |
| Single Male/Father | 97 (2.9%) | 3.42 |
| Single Female/Mother | 182 (5.5%) | 3.95 |
| Non-family | 1,441 (43.3%) | 1.04 |
| Total Households | 3,328 (100.0%) | 2.35 |
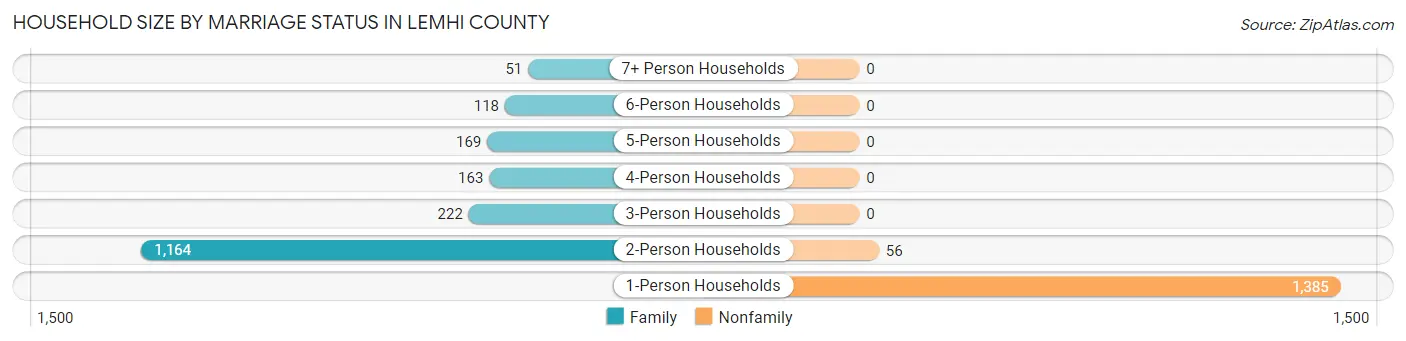
Household Size by Marriage Status in Lemhi County
Out of a total of 3,328 households in Lemhi County, 1,887 (56.7%) are family households, while 1,441 (43.3%) are nonfamily households. The most numerous type of family households are 2-person households, comprising 1,164, and the most common type of nonfamily households are 1-person households, comprising 1,385.
| Household Size | Family Households | Nonfamily Households |
| 1-Person Households | - | 1,385 (41.6%) |
| 2-Person Households | 1,164 (35.0%) | 56 (1.7%) |
| 3-Person Households | 222 (6.7%) | 0 (0.0%) |
| 4-Person Households | 163 (4.9%) | 0 (0.0%) |
| 5-Person Households | 169 (5.1%) | 0 (0.0%) |
| 6-Person Households | 118 (3.5%) | 0 (0.0%) |
| 7+ Person Households | 51 (1.5%) | 0 (0.0%) |
| Total | 1,887 (56.7%) | 1,441 (43.3%) |
Female Fertility in Lemhi County
Fertility by Age in Lemhi County
Average fertility rate in Lemhi County is 108.0 births per 1,000 women. Women in the age bracket of 20 to 34 years have the highest fertility rate with 147.0 births per 1,000 women. Women in the age bracket of 35 to 50 years acount for 54.8% of all women with births.
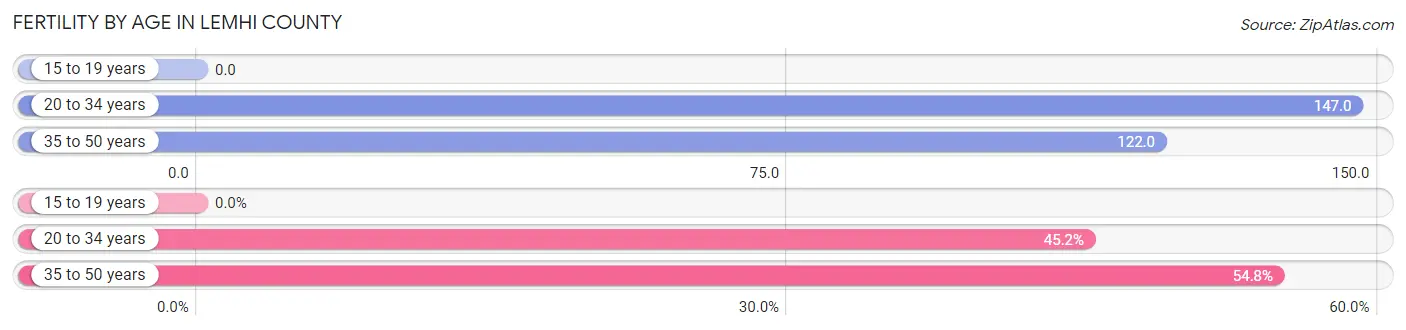
| Age Bracket | Women with Births | Births / 1,000 Women |
| 15 to 19 years | 0 (0.0%) | 0.0 |
| 20 to 34 years | 61 (45.2%) | 147.0 |
| 35 to 50 years | 74 (54.8%) | 122.0 |
| Total | 135 (100.0%) | 108.0 |
Fertility by Age by Marriage Status in Lemhi County
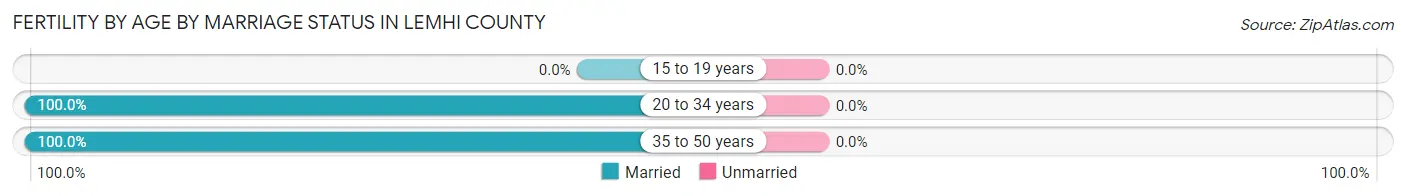
| Age Bracket | Married | Unmarried |
| 15 to 19 years | 0 (0.0%) | 0 (0.0%) |
| 20 to 34 years | 61 (100.0%) | 0 (0.0%) |
| 35 to 50 years | 74 (100.0%) | 0 (0.0%) |
| Total | 135 (100.0%) | 0 (0.0%) |
Fertility by Education in Lemhi County
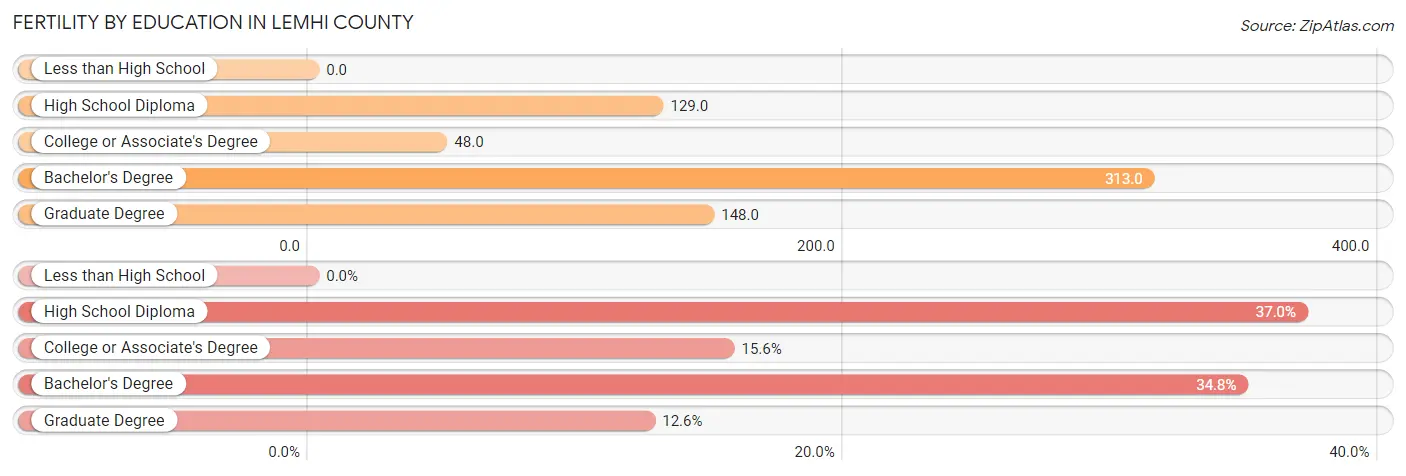
| Educational Attainment | Women with Births | Births / 1,000 Women |
| Less than High School | 0 (0.0%) | 0.0 |
| High School Diploma | 50 (37.0%) | 129.0 |
| College or Associate's Degree | 21 (15.6%) | 48.0 |
| Bachelor's Degree | 47 (34.8%) | 313.0 |
| Graduate Degree | 17 (12.6%) | 148.0 |
| Total | 135 (100.0%) | 108.0 |
Fertility by Education by Marriage Status in Lemhi County
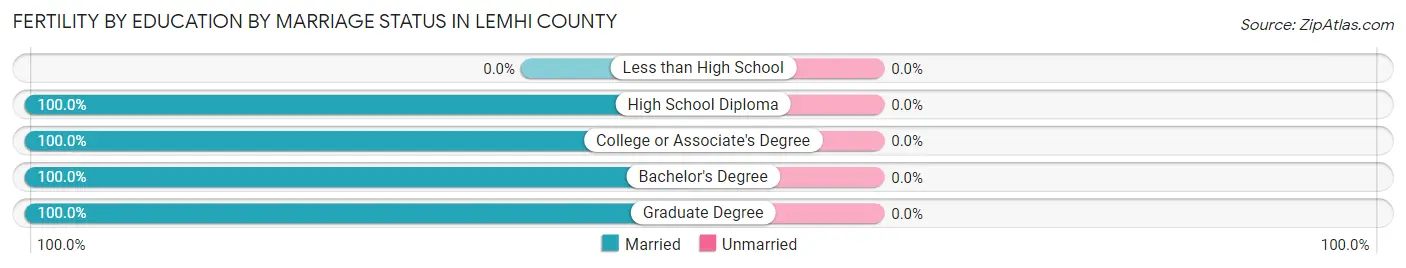
| Educational Attainment | Married | Unmarried |
| Less than High School | 0 (0.0%) | 0 (0.0%) |
| High School Diploma | 50 (100.0%) | 0 (0.0%) |
| College or Associate's Degree | 21 (100.0%) | 0 (0.0%) |
| Bachelor's Degree | 47 (100.0%) | 0 (0.0%) |
| Graduate Degree | 17 (100.0%) | 0 (0.0%) |
| Total | 135 (100.0%) | 0 (0.0%) |
Income in Lemhi County
Income Overview in Lemhi County
Per Capita Income in Lemhi County is $32,446, while median incomes of families and households are $73,194 and $49,216 respectively.
| Characteristic | Number | Measure |
| Per Capita Income | 8,043 | $32,446 |
| Median Family Income | 1,887 | $73,194 |
| Mean Family Income | 1,887 | $86,670 |
| Median Household Income | 3,328 | $49,216 |
| Mean Household Income | 3,328 | $70,830 |
| Income Deficit | 1,887 | $10,799 |
| Wage / Income Gap (%) | 8,043 | 41.98% |
| Wage / Income Gap ($) | 8,043 | 58.02¢ per $1 |
| Gini / Inequality Index | 8,043 | 0.50 |
Earnings by Sex in Lemhi County
Average Earnings in Lemhi County are $25,540, $30,028 for men and $17,423 for women, a difference of 42.0%.
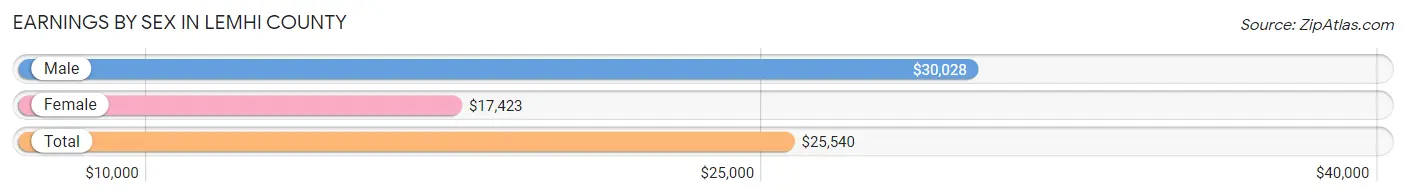
| Sex | Number | Average Earnings |
| Male | 2,221 (56.6%) | $30,028 |
| Female | 1,700 (43.4%) | $17,423 |
| Total | 3,921 (100.0%) | $25,540 |
Earnings by Sex by Income Bracket in Lemhi County
The most common earnings brackets in Lemhi County are $10,000 to $12,499 for men (285 | 12.8%) and $2,499 or less for women (240 | 14.1%).
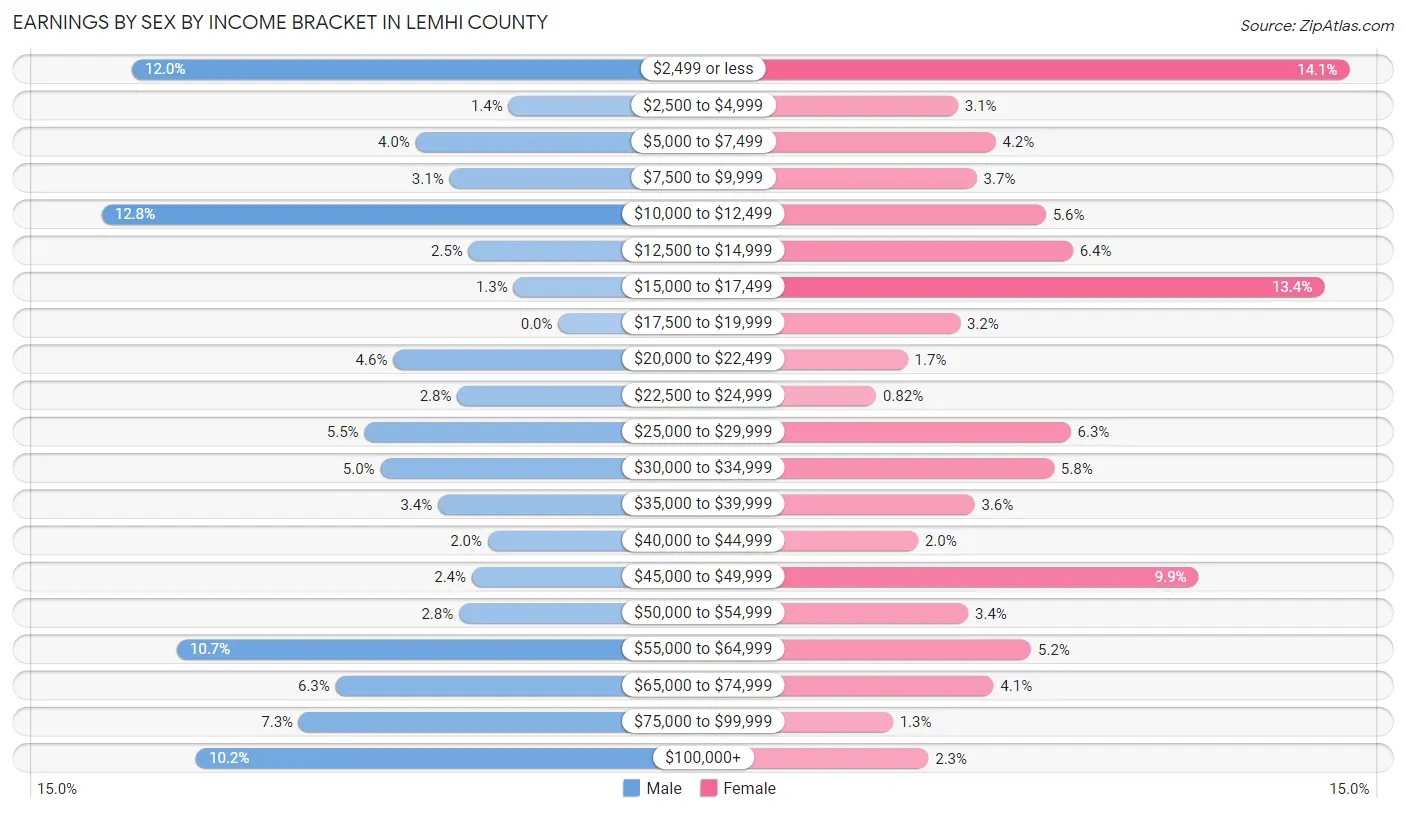
| Income | Male | Female |
| $2,499 or less | 266 (12.0%) | 240 (14.1%) |
| $2,500 to $4,999 | 31 (1.4%) | 53 (3.1%) |
| $5,000 to $7,499 | 89 (4.0%) | 71 (4.2%) |
| $7,500 to $9,999 | 68 (3.1%) | 62 (3.6%) |
| $10,000 to $12,499 | 285 (12.8%) | 95 (5.6%) |
| $12,500 to $14,999 | 56 (2.5%) | 108 (6.4%) |
| $15,000 to $17,499 | 28 (1.3%) | 228 (13.4%) |
| $17,500 to $19,999 | 0 (0.0%) | 54 (3.2%) |
| $20,000 to $22,499 | 103 (4.6%) | 29 (1.7%) |
| $22,500 to $24,999 | 63 (2.8%) | 14 (0.8%) |
| $25,000 to $29,999 | 121 (5.4%) | 107 (6.3%) |
| $30,000 to $34,999 | 111 (5.0%) | 99 (5.8%) |
| $35,000 to $39,999 | 75 (3.4%) | 61 (3.6%) |
| $40,000 to $44,999 | 44 (2.0%) | 34 (2.0%) |
| $45,000 to $49,999 | 54 (2.4%) | 168 (9.9%) |
| $50,000 to $54,999 | 62 (2.8%) | 58 (3.4%) |
| $55,000 to $64,999 | 238 (10.7%) | 88 (5.2%) |
| $65,000 to $74,999 | 139 (6.3%) | 70 (4.1%) |
| $75,000 to $99,999 | 162 (7.3%) | 22 (1.3%) |
| $100,000+ | 226 (10.2%) | 39 (2.3%) |
| Total | 2,221 (100.0%) | 1,700 (100.0%) |
Earnings by Sex by Educational Attainment in Lemhi County
Average earnings in Lemhi County are $39,519 for men and $27,083 for women, a difference of 31.5%. Men with an educational attainment of graduate degree enjoy the highest average annual earnings of $75,750, while those with college or associate's degree education earn the least with $25,568. Women with an educational attainment of graduate degree earn the most with the average annual earnings of $46,058, while those with high school diploma education have the smallest earnings of $16,850.
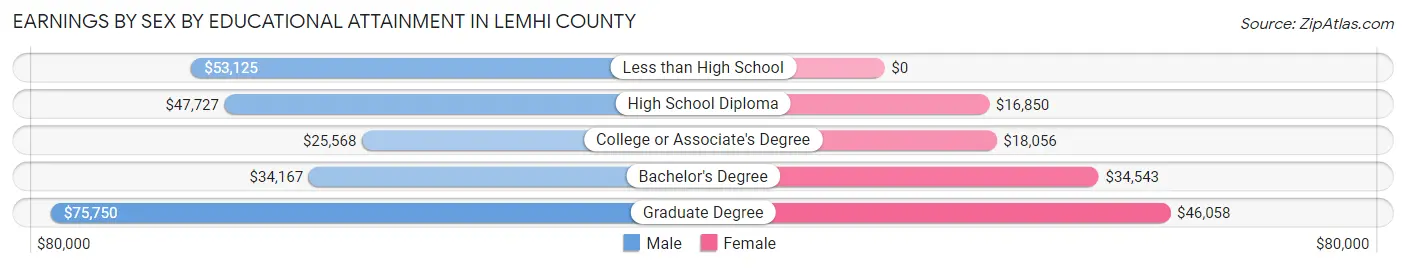
| Educational Attainment | Male Income | Female Income |
| Less than High School | $53,125 | $0 |
| High School Diploma | $47,727 | $16,850 |
| College or Associate's Degree | $25,568 | $18,056 |
| Bachelor's Degree | $34,167 | $34,543 |
| Graduate Degree | $75,750 | $46,058 |
| Total | $39,519 | $27,083 |
Family Income in Lemhi County
Family Income Brackets in Lemhi County
According to the Lemhi County family income data, there are 394 families falling into the $75,000 to $99,999 income range, which is the most common income bracket and makes up 20.9% of all families. Conversely, the $10,000 to $14,999 income bracket is the least frequent group with only 32 families (1.7%) belonging to this category.
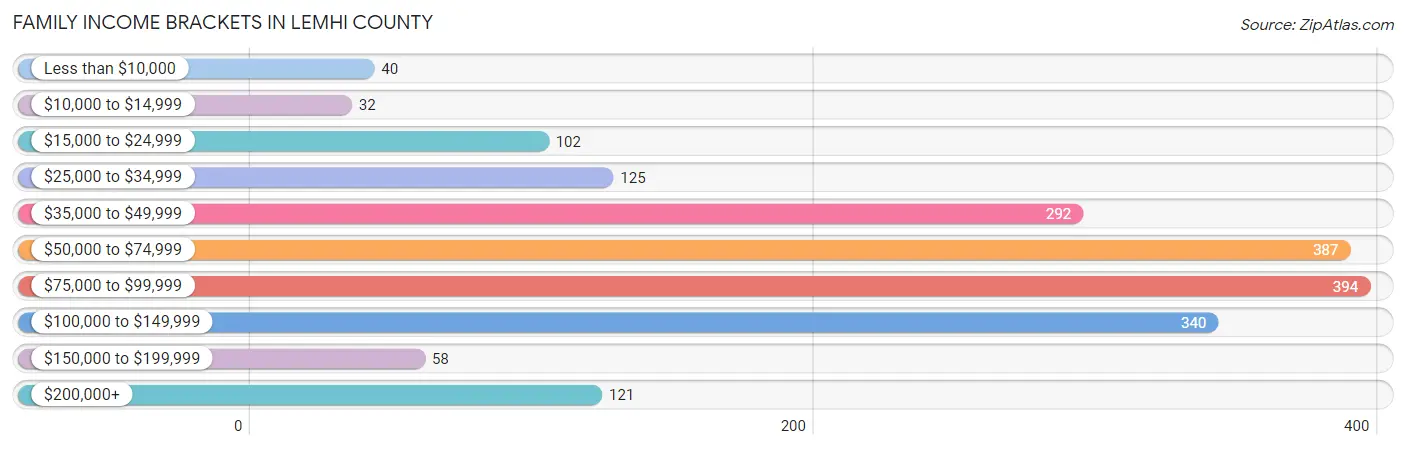
| Income Bracket | # Families | % Families |
| Less than $10,000 | 40 | 2.1% |
| $10,000 to $14,999 | 32 | 1.7% |
| $15,000 to $24,999 | 102 | 5.4% |
| $25,000 to $34,999 | 125 | 6.6% |
| $35,000 to $49,999 | 292 | 15.5% |
| $50,000 to $74,999 | 387 | 20.5% |
| $75,000 to $99,999 | 394 | 20.9% |
| $100,000 to $149,999 | 340 | 18.0% |
| $150,000 to $199,999 | 58 | 3.1% |
| $200,000+ | 121 | 6.4% |
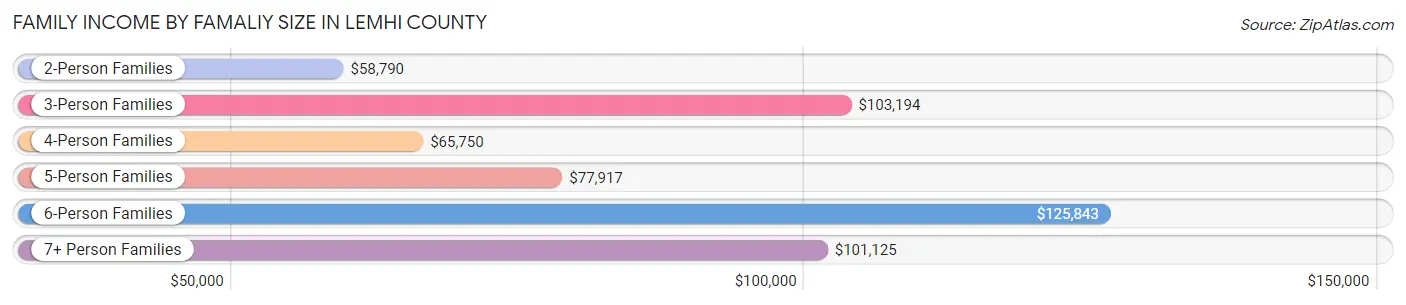
Family Income by Famaliy Size in Lemhi County
6-person families (115 | 6.1%) account for the highest median family income in Lemhi County with $125,843 per family, while 3-person families (201 | 10.6%) have the highest median income of $34,398 per family member.
| Income Bracket | # Families | Median Income |
| 2-Person Families | 1,188 (63.0%) | $58,790 |
| 3-Person Families | 201 (10.6%) | $103,194 |
| 4-Person Families | 163 (8.6%) | $65,750 |
| 5-Person Families | 169 (9.0%) | $77,917 |
| 6-Person Families | 115 (6.1%) | $125,843 |
| 7+ Person Families | 51 (2.7%) | $101,125 |
| Total | 1,887 (100.0%) | $73,194 |
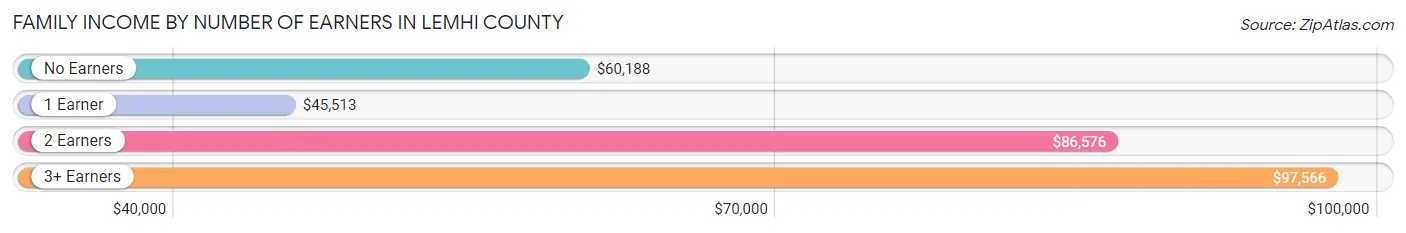
Family Income by Number of Earners in Lemhi County
The median family income in Lemhi County is $73,194, with families comprising 3+ earners (207) having the highest median family income of $97,566, while families with 1 earner (538) have the lowest median family income of $45,513, accounting for 11.0% and 28.5% of families, respectively.
| Number of Earners | # Families | Median Income |
| No Earners | 373 (19.8%) | $60,188 |
| 1 Earner | 538 (28.5%) | $45,513 |
| 2 Earners | 769 (40.7%) | $86,576 |
| 3+ Earners | 207 (11.0%) | $97,566 |
| Total | 1,887 (100.0%) | $73,194 |
Household Income in Lemhi County
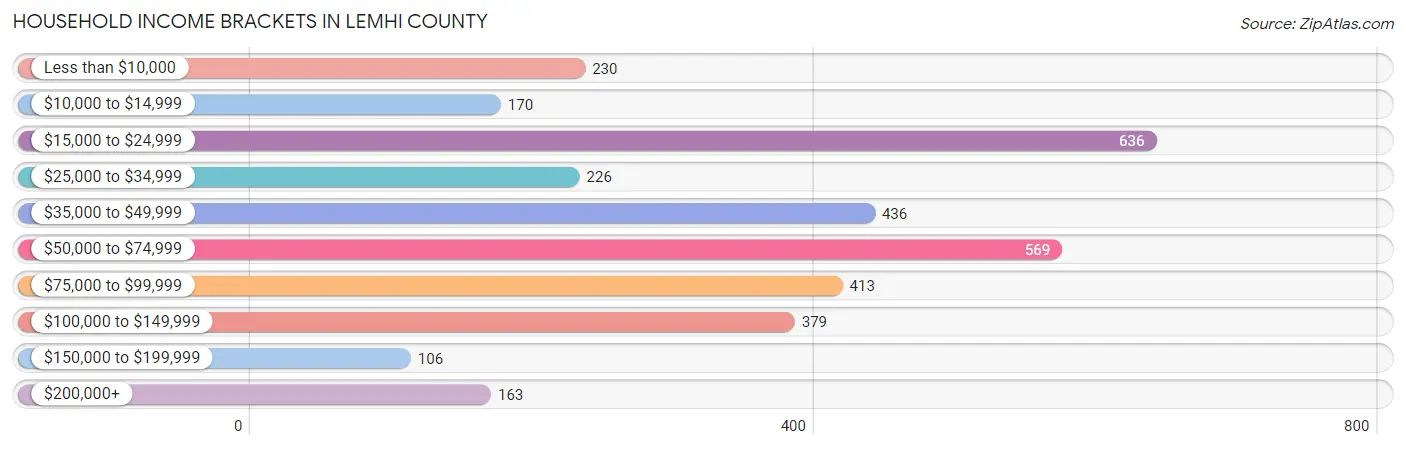
Household Income Brackets in Lemhi County
With 636 households falling in the category, the $15,000 to $24,999 income range is the most frequent in Lemhi County, accounting for 19.1% of all households. In contrast, only 106 households (3.2%) fall into the $150,000 to $199,999 income bracket, making it the least populous group.
| Income Bracket | # Households | % Households |
| Less than $10,000 | 230 | 6.9% |
| $10,000 to $14,999 | 170 | 5.1% |
| $15,000 to $24,999 | 636 | 19.1% |
| $25,000 to $34,999 | 226 | 6.8% |
| $35,000 to $49,999 | 436 | 13.1% |
| $50,000 to $74,999 | 569 | 17.1% |
| $75,000 to $99,999 | 413 | 12.4% |
| $100,000 to $149,999 | 379 | 11.4% |
| $150,000 to $199,999 | 106 | 3.2% |
| $200,000+ | 163 | 4.9% |
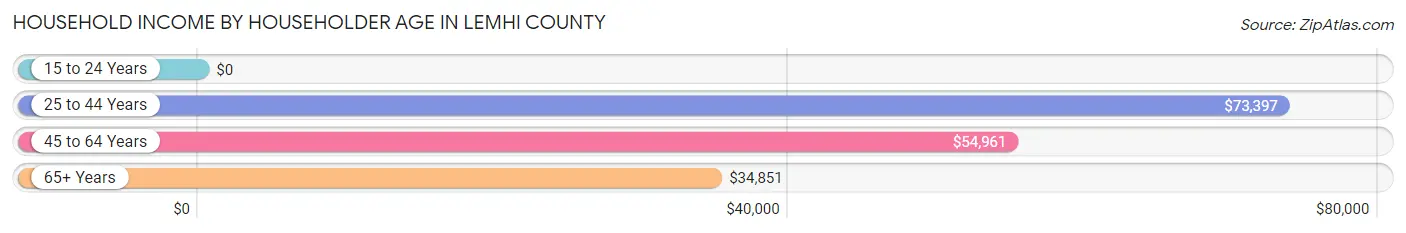
Household Income by Householder Age in Lemhi County
The median household income in Lemhi County is $49,216, with the highest median household income of $73,397 found in the 25 to 44 years age bracket for the primary householder. A total of 658 households (19.8%) fall into this category. Meanwhile, the 15 to 24 years age bracket for the primary householder has the lowest median household income of $0, with 30 households (0.9%) in this group.
| Income Bracket | # Households | Median Income |
| 15 to 24 Years | 30 (0.9%) | $0 |
| 25 to 44 Years | 658 (19.8%) | $73,397 |
| 45 to 64 Years | 1,153 (34.6%) | $54,961 |
| 65+ Years | 1,487 (44.7%) | $34,851 |
| Total | 3,328 (100.0%) | $49,216 |
Poverty in Lemhi County
Income Below Poverty by Sex and Age in Lemhi County
With 8.3% poverty level for males and 13.4% for females among the residents of Lemhi County, 6 to 11 year old males and 16 and 17 year old females are the most vulnerable to poverty, with 65 males (28.1%) and 15 females (34.9%) in their respective age groups living below the poverty level.
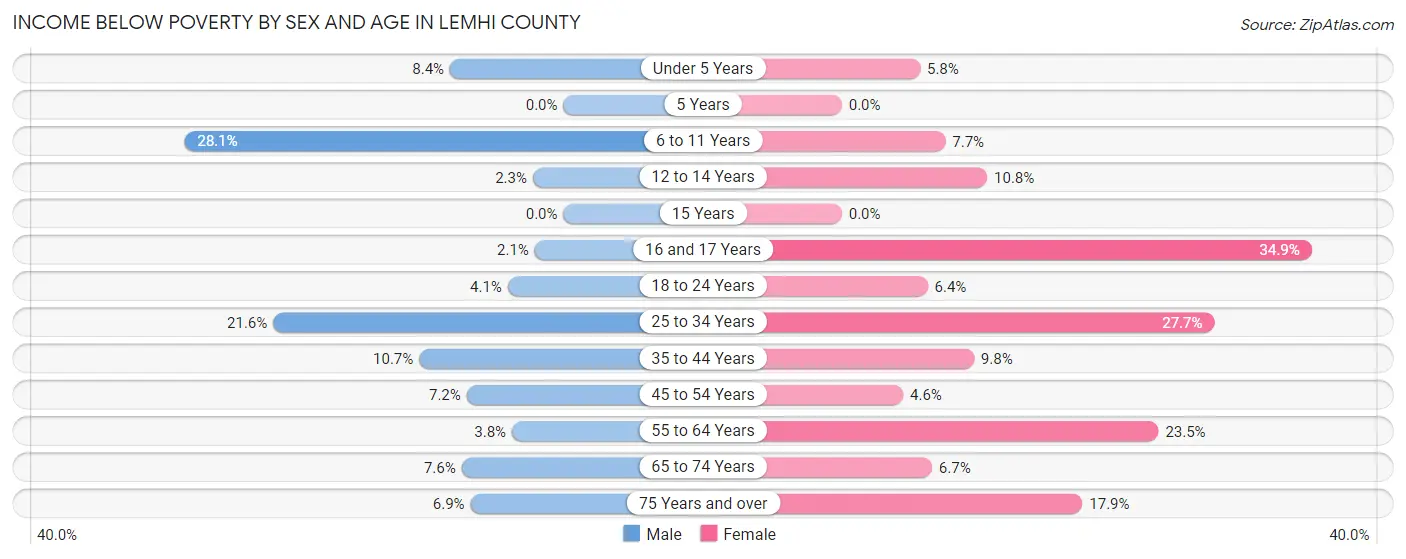
| Age Bracket | Male | Female |
| Under 5 Years | 16 (8.4%) | 9 (5.8%) |
| 5 Years | 0 (0.0%) | 0 (0.0%) |
| 6 to 11 Years | 65 (28.1%) | 17 (7.7%) |
| 12 to 14 Years | 3 (2.3%) | 15 (10.8%) |
| 15 Years | 0 (0.0%) | 0 (0.0%) |
| 16 and 17 Years | 2 (2.1%) | 15 (34.9%) |
| 18 to 24 Years | 16 (4.1%) | 13 (6.4%) |
| 25 to 34 Years | 50 (21.5%) | 91 (27.7%) |
| 35 to 44 Years | 50 (10.7%) | 42 (9.8%) |
| 45 to 54 Years | 27 (7.2%) | 17 (4.5%) |
| 55 to 64 Years | 26 (3.8%) | 154 (23.5%) |
| 65 to 74 Years | 59 (7.6%) | 46 (6.7%) |
| 75 Years and over | 33 (6.9%) | 80 (17.9%) |
| Total | 347 (8.3%) | 499 (13.4%) |
Income Above Poverty by Sex and Age in Lemhi County
According to the poverty statistics in Lemhi County, males aged 5 years and females aged 5 years are the age groups that are most secure financially, with 100.0% of males and 100.0% of females in these age groups living above the poverty line.
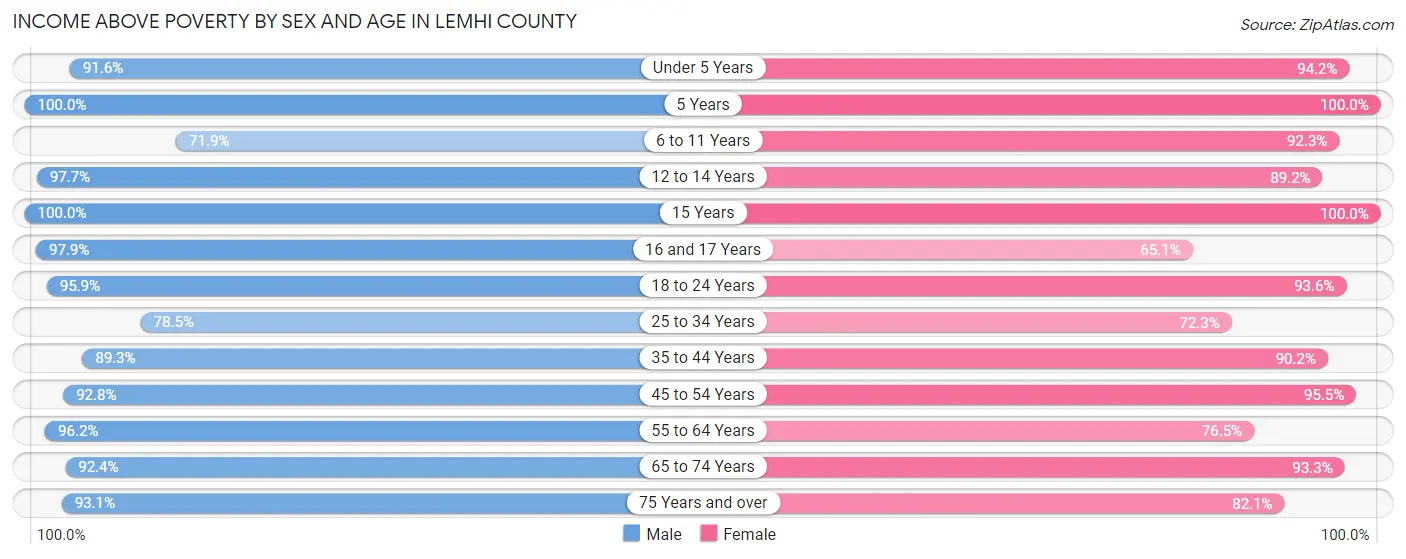
| Age Bracket | Male | Female |
| Under 5 Years | 174 (91.6%) | 146 (94.2%) |
| 5 Years | 20 (100.0%) | 10 (100.0%) |
| 6 to 11 Years | 166 (71.9%) | 204 (92.3%) |
| 12 to 14 Years | 129 (97.7%) | 124 (89.2%) |
| 15 Years | 96 (100.0%) | 29 (100.0%) |
| 16 and 17 Years | 92 (97.9%) | 28 (65.1%) |
| 18 to 24 Years | 371 (95.9%) | 191 (93.6%) |
| 25 to 34 Years | 182 (78.4%) | 238 (72.3%) |
| 35 to 44 Years | 417 (89.3%) | 386 (90.2%) |
| 45 to 54 Years | 349 (92.8%) | 357 (95.5%) |
| 55 to 64 Years | 654 (96.2%) | 501 (76.5%) |
| 65 to 74 Years | 721 (92.4%) | 642 (93.3%) |
| 75 Years and over | 445 (93.1%) | 368 (82.1%) |
| Total | 3,816 (91.7%) | 3,224 (86.6%) |
Income Below Poverty Among Married-Couple Families in Lemhi County
The poverty statistics for married-couple families in Lemhi County show that 6.7% or 107 of the total 1,608 families live below the poverty line. Families with 1 or 2 children have the highest poverty rate of 19.2%, comprising of 49 families. On the other hand, families with 5 or more children have the lowest poverty rate of 0.0%, which includes 0 families.
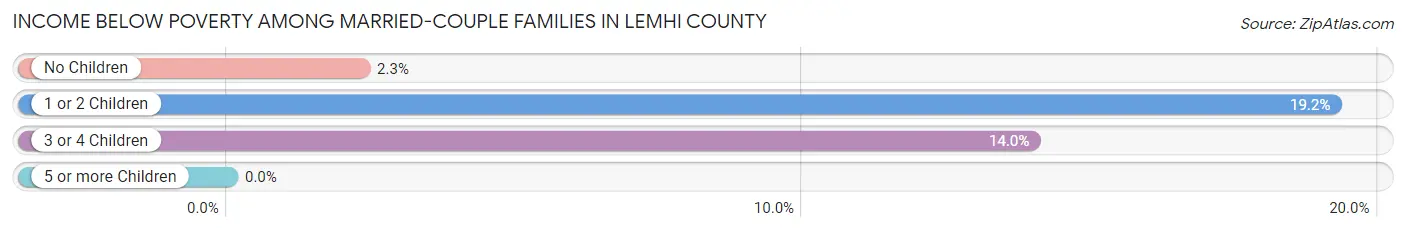
| Children | Above Poverty | Below Poverty |
| No Children | 1,061 (97.7%) | 25 (2.3%) |
| 1 or 2 Children | 206 (80.8%) | 49 (19.2%) |
| 3 or 4 Children | 203 (86.0%) | 33 (14.0%) |
| 5 or more Children | 31 (100.0%) | 0 (0.0%) |
| Total | 1,501 (93.3%) | 107 (6.7%) |
Income Below Poverty Among Single-Parent Households in Lemhi County
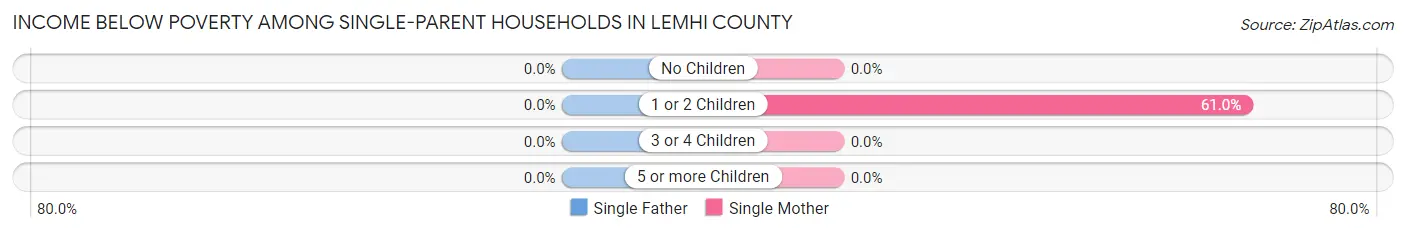
| Children | Single Father | Single Mother |
| No Children | 0 (0.0%) | 0 (0.0%) |
| 1 or 2 Children | 0 (0.0%) | 61 (61.0%) |
| 3 or 4 Children | 0 (0.0%) | 0 (0.0%) |
| 5 or more Children | 0 (0.0%) | 0 (0.0%) |
| Total | 0 (0.0%) | 61 (33.5%) |
Income Below Poverty Among Married-Couple vs Single-Parent Households in Lemhi County
The poverty data for Lemhi County shows that 107 of the married-couple family households (6.7%) and 61 of the single-parent households (21.9%) are living below the poverty level. Within the married-couple family households, those with 1 or 2 children have the highest poverty rate, with 49 households (19.2%) falling below the poverty line. Among the single-parent households, those with 1 or 2 children have the highest poverty rate, with 61 household (40.4%) living below poverty.
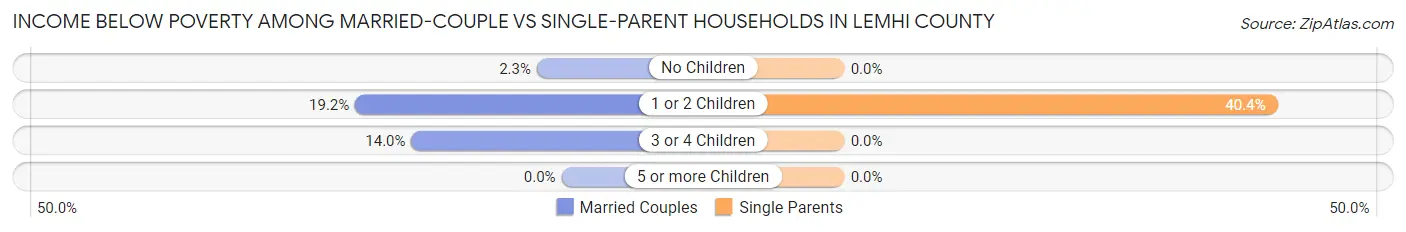
| Children | Married-Couple Families | Single-Parent Households |
| No Children | 25 (2.3%) | 0 (0.0%) |
| 1 or 2 Children | 49 (19.2%) | 61 (40.4%) |
| 3 or 4 Children | 33 (14.0%) | 0 (0.0%) |
| 5 or more Children | 0 (0.0%) | 0 (0.0%) |
| Total | 107 (6.7%) | 61 (21.9%) |
Employment Characteristics in Lemhi County
Employment by Class of Employer in Lemhi County
Among the 3,273 employed individuals in Lemhi County, private company employees (1,880 | 57.4%), self-employed (not incorporated) (386 | 11.8%), and not-for-profit organizations (253 | 7.7%) make up the most common classes of employment.
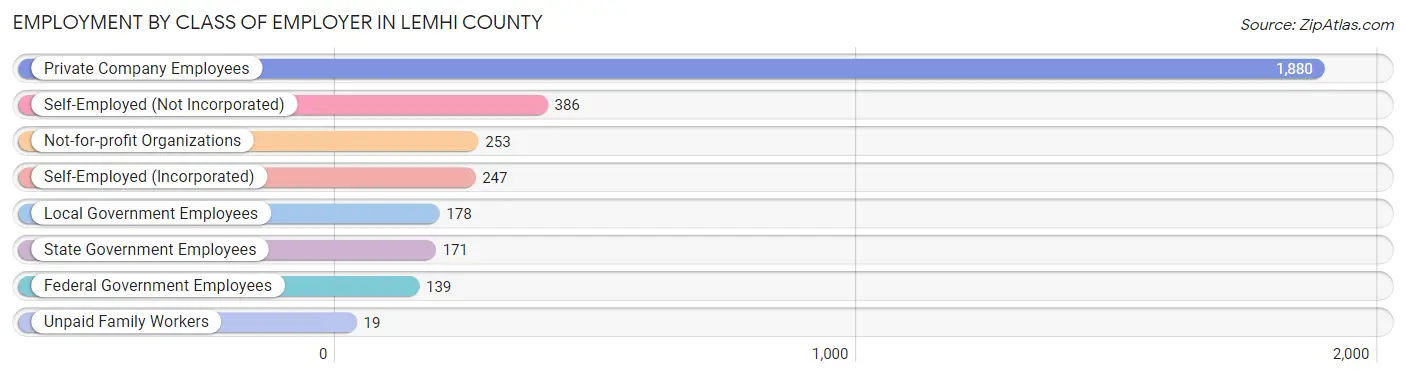
| Employer Class | # Employees | % Employees |
| Private Company Employees | 1,880 | 57.4% |
| Self-Employed (Incorporated) | 247 | 7.5% |
| Self-Employed (Not Incorporated) | 386 | 11.8% |
| Not-for-profit Organizations | 253 | 7.7% |
| Local Government Employees | 178 | 5.4% |
| State Government Employees | 171 | 5.2% |
| Federal Government Employees | 139 | 4.3% |
| Unpaid Family Workers | 19 | 0.6% |
| Total | 3,273 | 100.0% |
Employment Status by Age in Lemhi County
According to the labor force statistics for Lemhi County, out of the total population over 16 years of age (6,814), 52.5% or 3,577 individuals are in the labor force, with 3.1% or 111 of them unemployed. The age group with the highest labor force participation rate is 20 to 24 years, with 92.3% or 312 individuals in the labor force. Within the labor force, the 20 to 24 years age range has the highest percentage of unemployed individuals, with 12.5% or 39 of them being unemployed.
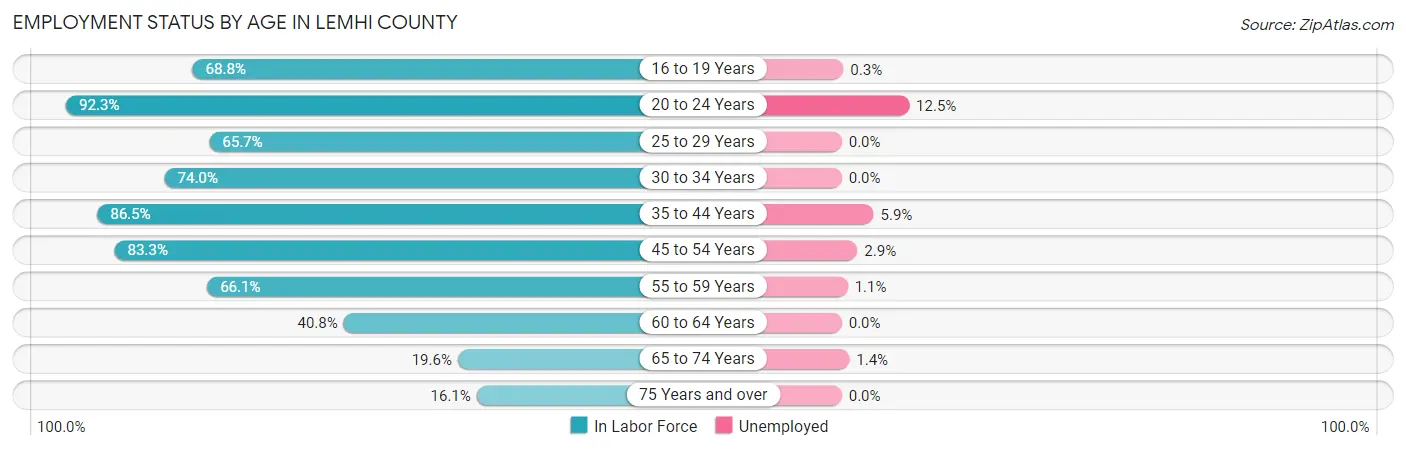
| Age Bracket | In Labor Force | Unemployed |
| 16 to 19 Years | 317 (68.8%) | 1 (0.3%) |
| 20 to 24 Years | 312 (92.3%) | 39 (12.5%) |
| 25 to 29 Years | 109 (65.7%) | 0 (0.0%) |
| 30 to 34 Years | 293 (74.0%) | 0 (0.0%) |
| 35 to 44 Years | 780 (86.5%) | 46 (5.9%) |
| 45 to 54 Years | 629 (83.3%) | 18 (2.9%) |
| 55 to 59 Years | 363 (66.1%) | 4 (1.1%) |
| 60 to 64 Years | 325 (40.8%) | 0 (0.0%) |
| 65 to 74 Years | 290 (19.6%) | 4 (1.4%) |
| 75 Years and over | 157 (16.1%) | 0 (0.0%) |
| Total | 3,577 (52.5%) | 111 (3.1%) |
Employment Status by Educational Attainment in Lemhi County
According to labor force statistics for Lemhi County, 70.1% of individuals (2,498) out of the total population between 25 and 64 years of age (3,564) are in the labor force, with 2.7% or 67 of them being unemployed. The group with the highest labor force participation rate are those with the educational attainment of bachelor's degree or higher, with 85.5% or 682 individuals in the labor force. Within the labor force, individuals with less than high school education have the highest percentage of unemployment, with 5.8% or 18 of them being unemployed.
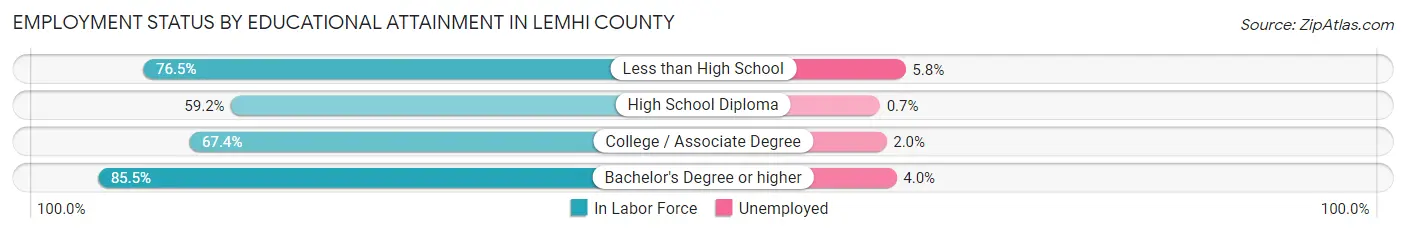
| Educational Attainment | In Labor Force | Unemployed |
| Less than High School | 309 (76.5%) | 23 (5.8%) |
| High School Diploma | 606 (59.2%) | 7 (0.7%) |
| College / Associate Degree | 902 (67.4%) | 27 (2.0%) |
| Bachelor's Degree or higher | 682 (85.5%) | 32 (4.0%) |
| Total | 2,498 (70.1%) | 96 (2.7%) |
Employment Occupations by Sex in Lemhi County
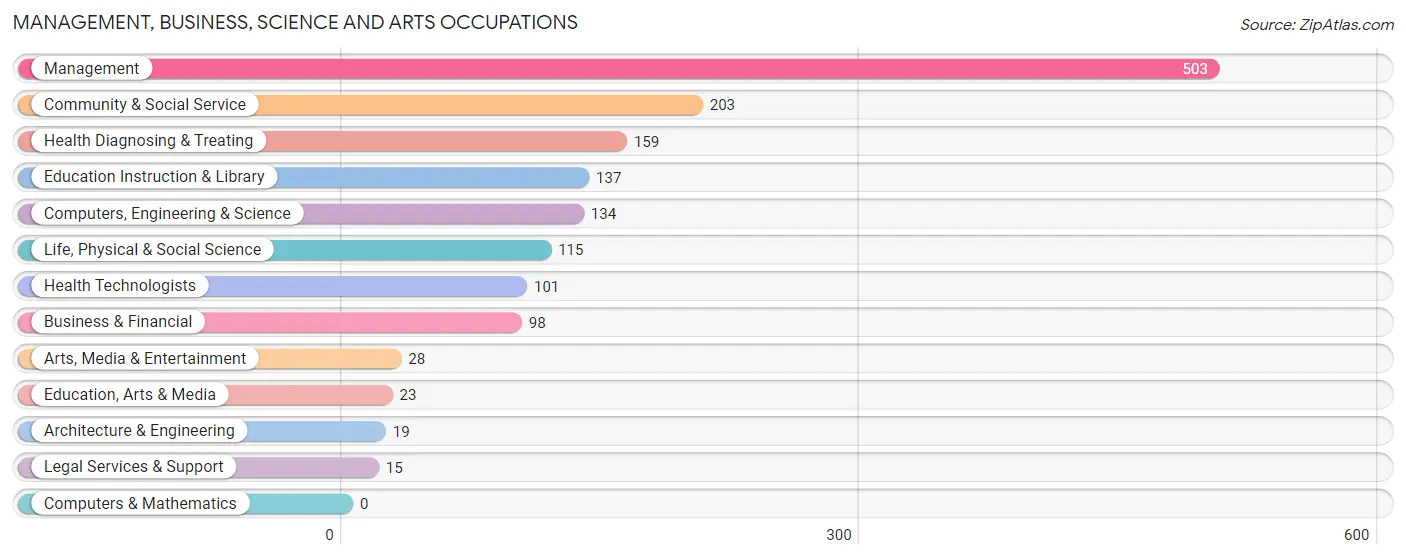
Management, Business, Science and Arts Occupations
The most common Management, Business, Science and Arts occupations in Lemhi County are Management (503 | 14.7%), Community & Social Service (203 | 5.9%), Health Diagnosing & Treating (159 | 4.6%), Education Instruction & Library (137 | 4.0%), and Computers, Engineering & Science (134 | 3.9%).
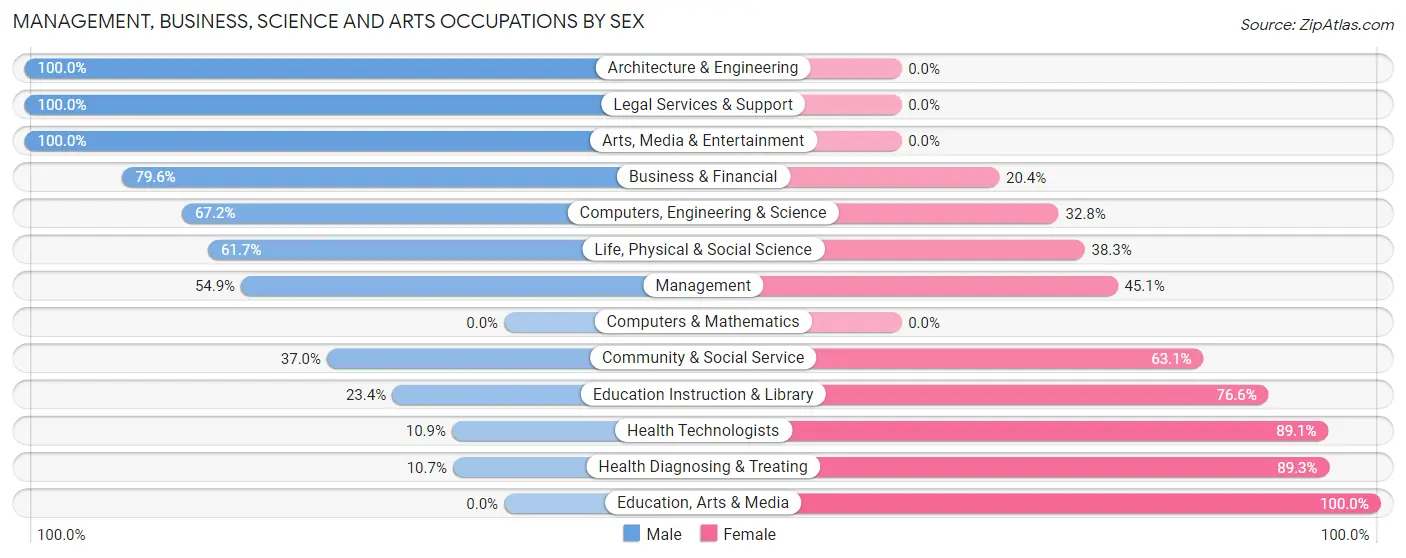
Management, Business, Science and Arts Occupations by Sex
Within the Management, Business, Science and Arts occupations in Lemhi County, the most male-oriented occupations are Architecture & Engineering (100.0%), Legal Services & Support (100.0%), and Arts, Media & Entertainment (100.0%), while the most female-oriented occupations are Education, Arts & Media (100.0%), Health Diagnosing & Treating (89.3%), and Health Technologists (89.1%).
| Occupation | Male | Female |
| Management | 276 (54.9%) | 227 (45.1%) |
| Business & Financial | 78 (79.6%) | 20 (20.4%) |
| Computers, Engineering & Science | 90 (67.2%) | 44 (32.8%) |
| Computers & Mathematics | 0 (0.0%) | 0 (0.0%) |
| Architecture & Engineering | 19 (100.0%) | 0 (0.0%) |
| Life, Physical & Social Science | 71 (61.7%) | 44 (38.3%) |
| Community & Social Service | 75 (36.9%) | 128 (63.0%) |
| Education, Arts & Media | 0 (0.0%) | 23 (100.0%) |
| Legal Services & Support | 15 (100.0%) | 0 (0.0%) |
| Education Instruction & Library | 32 (23.4%) | 105 (76.6%) |
| Arts, Media & Entertainment | 28 (100.0%) | 0 (0.0%) |
| Health Diagnosing & Treating | 17 (10.7%) | 142 (89.3%) |
| Health Technologists | 11 (10.9%) | 90 (89.1%) |
| Total (Category) | 536 (48.9%) | 561 (51.1%) |
| Total (Overall) | 1,897 (55.3%) | 1,530 (44.7%) |
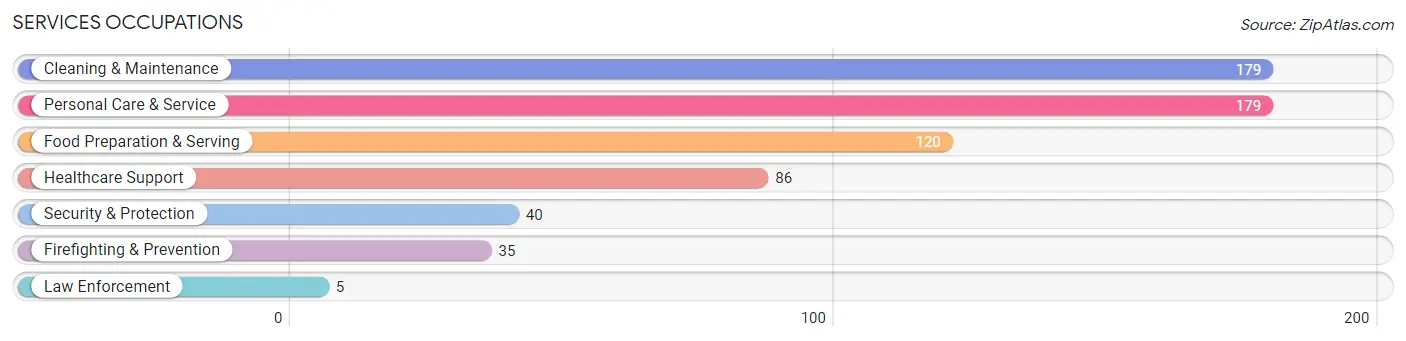
Services Occupations
The most common Services occupations in Lemhi County are Cleaning & Maintenance (179 | 5.2%), Personal Care & Service (179 | 5.2%), Food Preparation & Serving (120 | 3.5%), Healthcare Support (86 | 2.5%), and Security & Protection (40 | 1.2%).
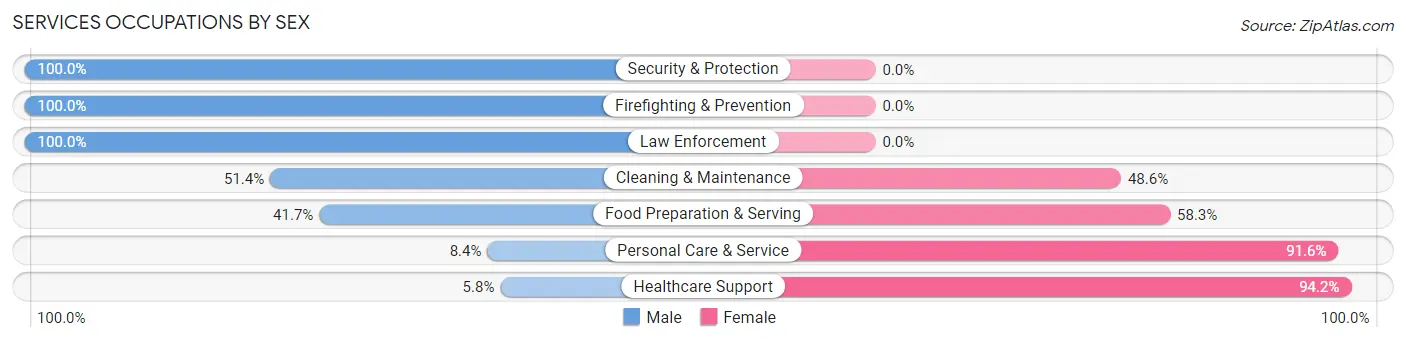
Services Occupations by Sex
Within the Services occupations in Lemhi County, the most male-oriented occupations are Security & Protection (100.0%), Firefighting & Prevention (100.0%), and Law Enforcement (100.0%), while the most female-oriented occupations are Healthcare Support (94.2%), Personal Care & Service (91.6%), and Food Preparation & Serving (58.3%).
| Occupation | Male | Female |
| Healthcare Support | 5 (5.8%) | 81 (94.2%) |
| Security & Protection | 40 (100.0%) | 0 (0.0%) |
| Firefighting & Prevention | 35 (100.0%) | 0 (0.0%) |
| Law Enforcement | 5 (100.0%) | 0 (0.0%) |
| Food Preparation & Serving | 50 (41.7%) | 70 (58.3%) |
| Cleaning & Maintenance | 92 (51.4%) | 87 (48.6%) |
| Personal Care & Service | 15 (8.4%) | 164 (91.6%) |
| Total (Category) | 202 (33.4%) | 402 (66.6%) |
| Total (Overall) | 1,897 (55.3%) | 1,530 (44.7%) |
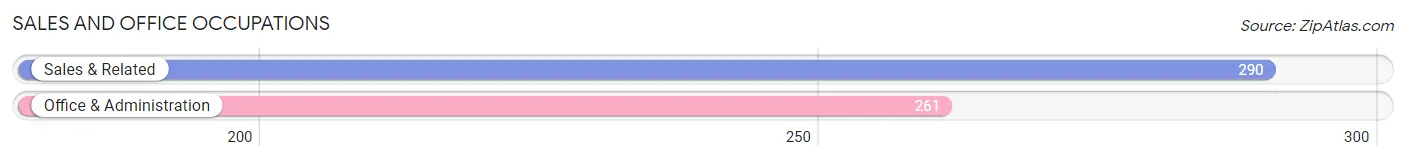
Sales and Office Occupations
The most common Sales and Office occupations in Lemhi County are Sales & Related (290 | 8.5%), and Office & Administration (261 | 7.6%).
Sales and Office Occupations by Sex
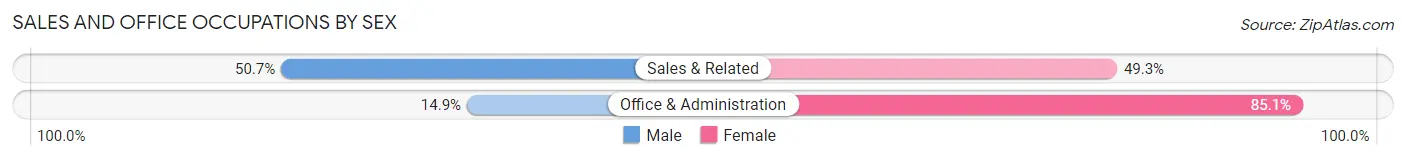
| Occupation | Male | Female |
| Sales & Related | 147 (50.7%) | 143 (49.3%) |
| Office & Administration | 39 (14.9%) | 222 (85.1%) |
| Total (Category) | 186 (33.8%) | 365 (66.2%) |
| Total (Overall) | 1,897 (55.3%) | 1,530 (44.7%) |
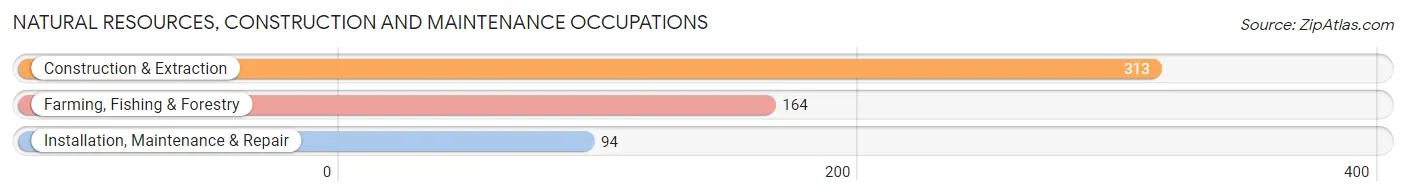
Natural Resources, Construction and Maintenance Occupations
The most common Natural Resources, Construction and Maintenance occupations in Lemhi County are Construction & Extraction (313 | 9.1%), Farming, Fishing & Forestry (164 | 4.8%), and Installation, Maintenance & Repair (94 | 2.7%).
Natural Resources, Construction and Maintenance Occupations by Sex
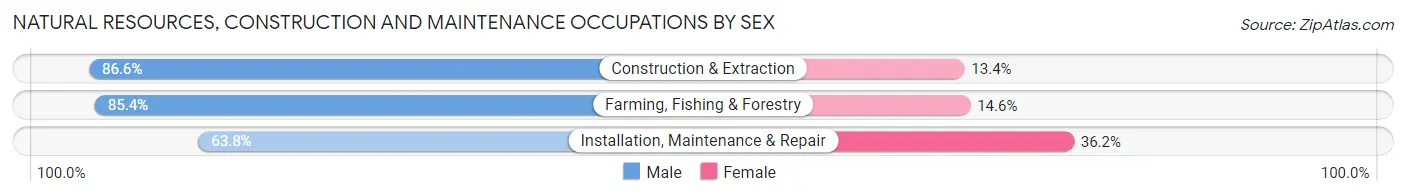
| Occupation | Male | Female |
| Farming, Fishing & Forestry | 140 (85.4%) | 24 (14.6%) |
| Construction & Extraction | 271 (86.6%) | 42 (13.4%) |
| Installation, Maintenance & Repair | 60 (63.8%) | 34 (36.2%) |
| Total (Category) | 471 (82.5%) | 100 (17.5%) |
| Total (Overall) | 1,897 (55.3%) | 1,530 (44.7%) |
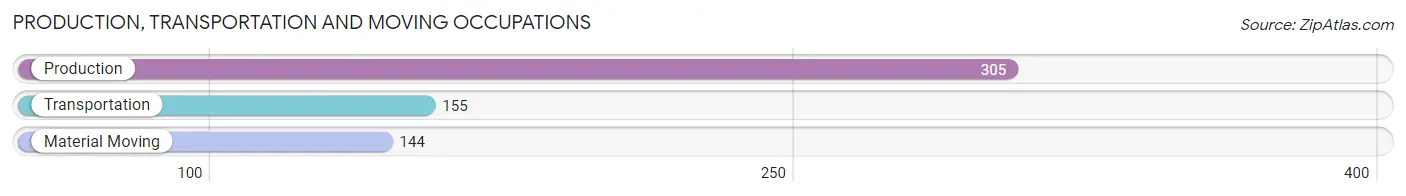
Production, Transportation and Moving Occupations
The most common Production, Transportation and Moving occupations in Lemhi County are Production (305 | 8.9%), Transportation (155 | 4.5%), and Material Moving (144 | 4.2%).
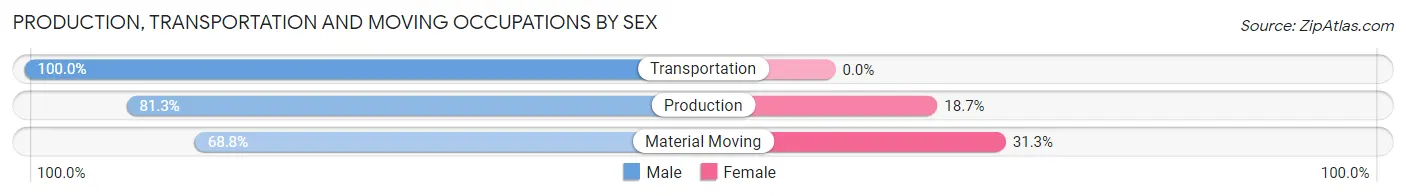
Production, Transportation and Moving Occupations by Sex
| Occupation | Male | Female |
| Production | 248 (81.3%) | 57 (18.7%) |
| Transportation | 155 (100.0%) | 0 (0.0%) |
| Material Moving | 99 (68.8%) | 45 (31.2%) |
| Total (Category) | 502 (83.1%) | 102 (16.9%) |
| Total (Overall) | 1,897 (55.3%) | 1,530 (44.7%) |
Employment Industries by Sex in Lemhi County
Employment Industries in Lemhi County
The major employment industries in Lemhi County include Retail Trade (500 | 14.6%), Health Care & Social Assistance (407 | 11.9%), Agriculture, Fishing & Hunting (380 | 11.1%), Manufacturing (360 | 10.5%), and Construction (348 | 10.2%).

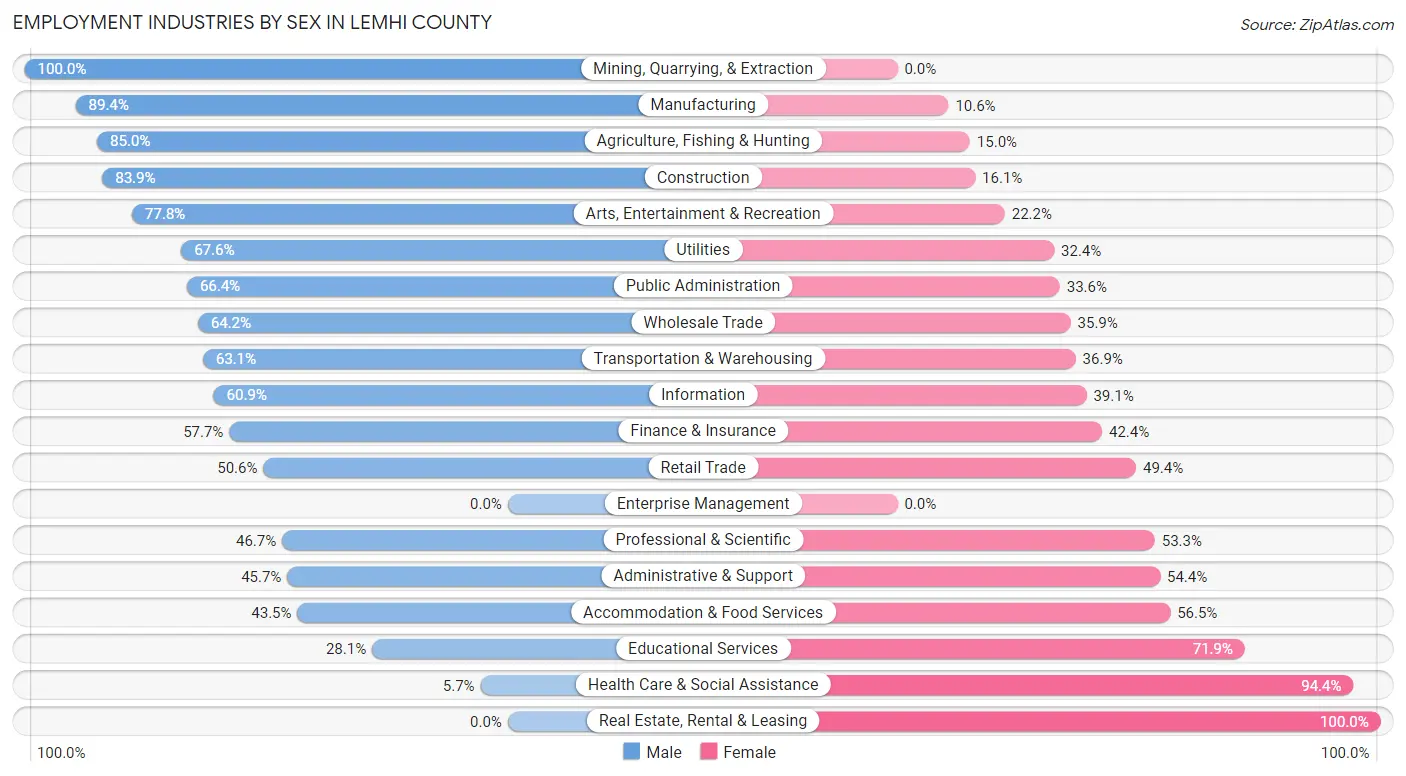
Employment Industries by Sex in Lemhi County
The Lemhi County industries that see more men than women are Mining, Quarrying, & Extraction (100.0%), Manufacturing (89.4%), and Agriculture, Fishing & Hunting (85.0%), whereas the industries that tend to have a higher number of women are Real Estate, Rental & Leasing (100.0%), Health Care & Social Assistance (94.4%), and Educational Services (71.9%).
| Industry | Male | Female |
| Agriculture, Fishing & Hunting | 323 (85.0%) | 57 (15.0%) |
| Mining, Quarrying, & Extraction | 42 (100.0%) | 0 (0.0%) |
| Construction | 292 (83.9%) | 56 (16.1%) |
| Manufacturing | 322 (89.4%) | 38 (10.6%) |
| Wholesale Trade | 34 (64.1%) | 19 (35.8%) |
| Retail Trade | 253 (50.6%) | 247 (49.4%) |
| Transportation & Warehousing | 77 (63.1%) | 45 (36.9%) |
| Utilities | 25 (67.6%) | 12 (32.4%) |
| Information | 28 (60.9%) | 18 (39.1%) |
| Finance & Insurance | 49 (57.7%) | 36 (42.3%) |
| Real Estate, Rental & Leasing | 0 (0.0%) | 18 (100.0%) |
| Professional & Scientific | 64 (46.7%) | 73 (53.3%) |
| Enterprise Management | 0 (0.0%) | 0 (0.0%) |
| Administrative & Support | 63 (45.7%) | 75 (54.3%) |
| Educational Services | 59 (28.1%) | 151 (71.9%) |
| Health Care & Social Assistance | 23 (5.7%) | 384 (94.4%) |
| Arts, Entertainment & Recreation | 42 (77.8%) | 12 (22.2%) |
| Accommodation & Food Services | 64 (43.5%) | 83 (56.5%) |
| Public Administration | 81 (66.4%) | 41 (33.6%) |
| Total | 1,897 (55.3%) | 1,530 (44.7%) |
Education in Lemhi County
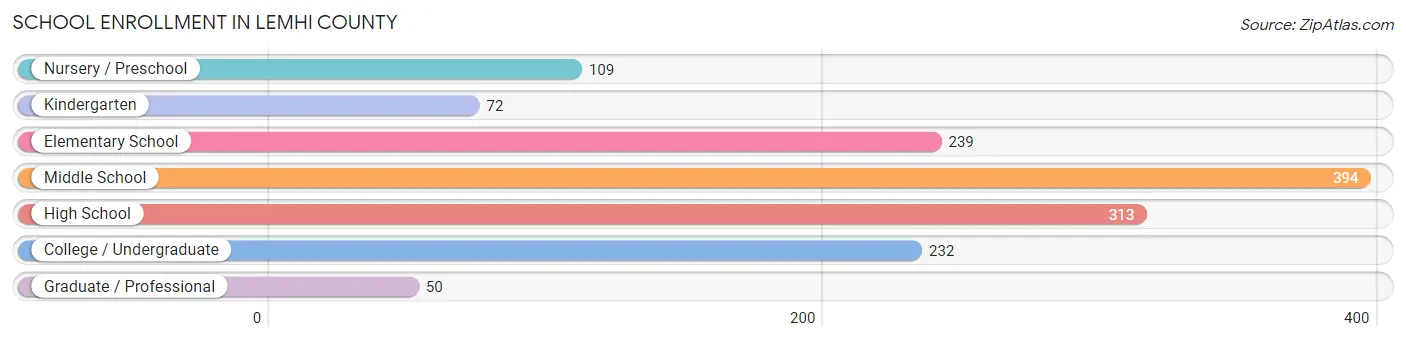
School Enrollment in Lemhi County
The most common levels of schooling among the 1,409 students in Lemhi County are middle school (394 | 28.0%), high school (313 | 22.2%), and elementary school (239 | 17.0%).
| School Level | # Students | % Students |
| Nursery / Preschool | 109 | 7.7% |
| Kindergarten | 72 | 5.1% |
| Elementary School | 239 | 17.0% |
| Middle School | 394 | 28.0% |
| High School | 313 | 22.2% |
| College / Undergraduate | 232 | 16.5% |
| Graduate / Professional | 50 | 3.5% |
| Total | 1,409 | 100.0% |
School Enrollment by Age by Funding Source in Lemhi County
Out of a total of 1,409 students who are enrolled in schools in Lemhi County, 196 (13.9%) attend a private institution, while the remaining 1,213 (86.1%) are enrolled in public schools. The age group of 35 years and over has the highest likelihood of being enrolled in private schools, with 33 (47.8% in the age bracket) enrolled. Conversely, the age group of 20 to 24 year olds has the lowest likelihood of being enrolled in a private school, with 73 (100.0% in the age bracket) attending a public institution.
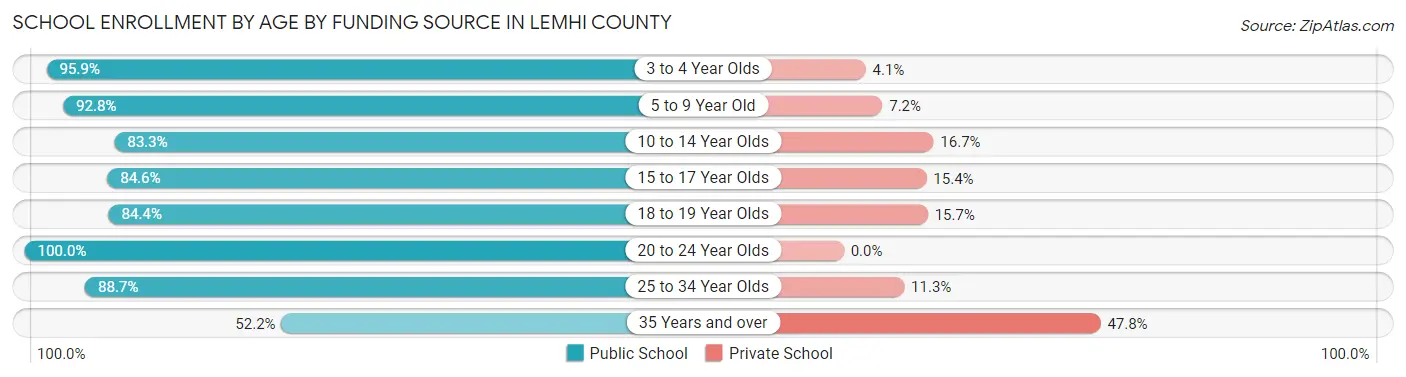
| Age Bracket | Public School | Private School |
| 3 to 4 Year Olds | 94 (95.9%) | 4 (4.1%) |
| 5 to 9 Year Old | 271 (92.8%) | 21 (7.2%) |
| 10 to 14 Year Olds | 354 (83.3%) | 71 (16.7%) |
| 15 to 17 Year Olds | 225 (84.6%) | 41 (15.4%) |
| 18 to 19 Year Olds | 97 (84.4%) | 18 (15.7%) |
| 20 to 24 Year Olds | 73 (100.0%) | 0 (0.0%) |
| 25 to 34 Year Olds | 63 (88.7%) | 8 (11.3%) |
| 35 Years and over | 36 (52.2%) | 33 (47.8%) |
| Total | 1,213 (86.1%) | 196 (13.9%) |
Educational Attainment by Field of Study in Lemhi County
Education (273 | 19.5%), bio, nature & agricultural (231 | 16.5%), business (177 | 12.6%), science & technology (166 | 11.8%), and engineering (116 | 8.3%) are the most common fields of study among 1,401 individuals in Lemhi County who have obtained a bachelor's degree or higher.
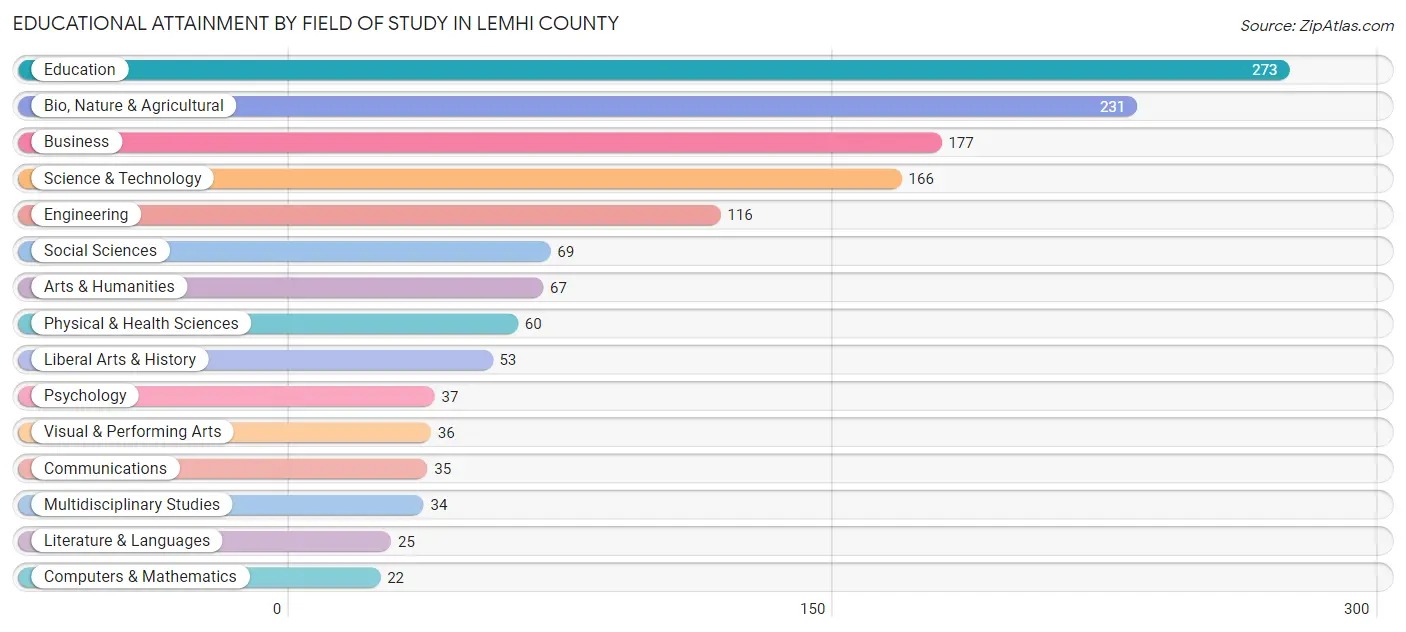
| Field of Study | # Graduates | % Graduates |
| Computers & Mathematics | 22 | 1.6% |
| Bio, Nature & Agricultural | 231 | 16.5% |
| Physical & Health Sciences | 60 | 4.3% |
| Psychology | 37 | 2.6% |
| Social Sciences | 69 | 4.9% |
| Engineering | 116 | 8.3% |
| Multidisciplinary Studies | 34 | 2.4% |
| Science & Technology | 166 | 11.8% |
| Business | 177 | 12.6% |
| Education | 273 | 19.5% |
| Literature & Languages | 25 | 1.8% |
| Liberal Arts & History | 53 | 3.8% |
| Visual & Performing Arts | 36 | 2.6% |
| Communications | 35 | 2.5% |
| Arts & Humanities | 67 | 4.8% |
| Total | 1,401 | 100.0% |
Transportation & Commute in Lemhi County
Vehicle Availability by Sex in Lemhi County
The most prevalent vehicle ownership categories in Lemhi County are males with 3 vehicles (570, accounting for 33.7%) and females with 3 vehicles (395, making up 38.9%).
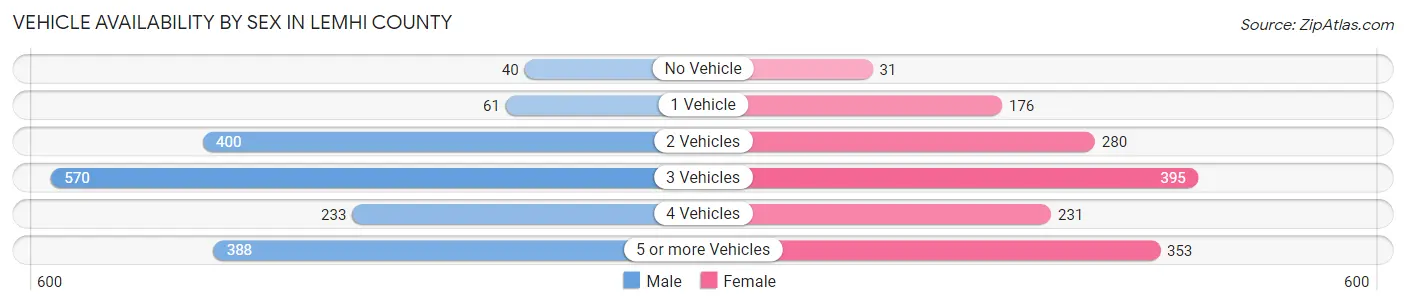
| Vehicles Available | Male | Female |
| No Vehicle | 40 (2.4%) | 31 (2.1%) |
| 1 Vehicle | 61 (3.6%) | 176 (12.0%) |
| 2 Vehicles | 400 (23.6%) | 280 (19.1%) |
| 3 Vehicles | 570 (33.7%) | 395 (26.9%) |
| 4 Vehicles | 233 (13.8%) | 231 (15.8%) |
| 5 or more Vehicles | 388 (22.9%) | 353 (24.1%) |
| Total | 1,692 (100.0%) | 1,466 (100.0%) |
Commute Time in Lemhi County
The most frequently occuring commute durations in Lemhi County are 5 to 9 minutes (1,135 commuters, 38.3%), 15 to 19 minutes (458 commuters, 15.5%), and 10 to 14 minutes (348 commuters, 11.7%).
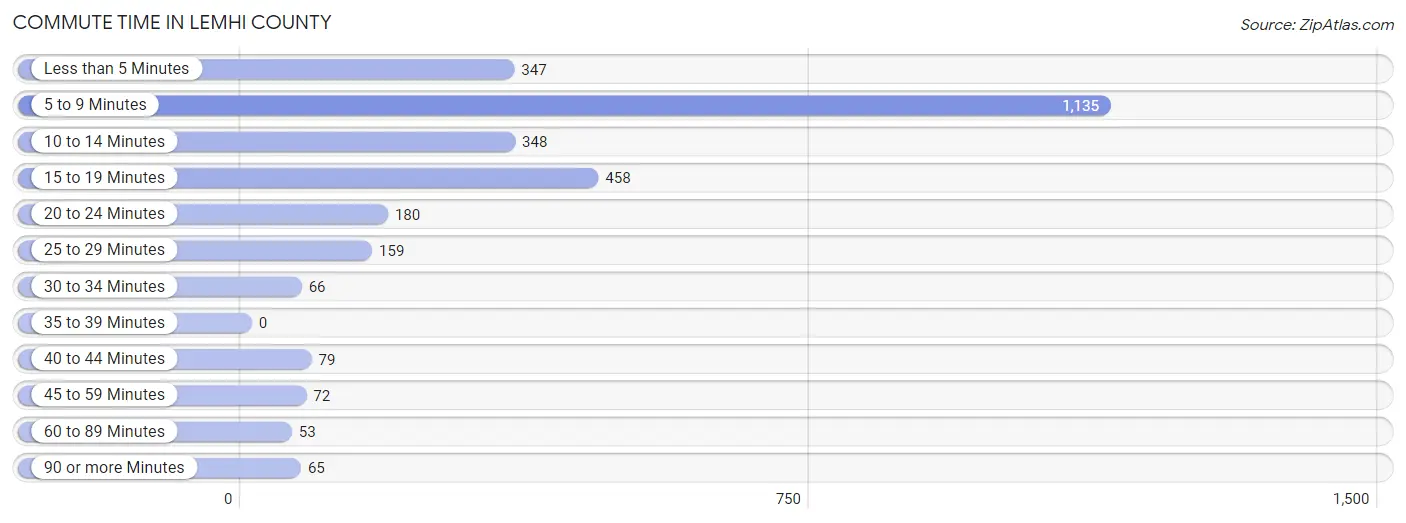
| Commute Time | # Commuters | % Commuters |
| Less than 5 Minutes | 347 | 11.7% |
| 5 to 9 Minutes | 1,135 | 38.3% |
| 10 to 14 Minutes | 348 | 11.7% |
| 15 to 19 Minutes | 458 | 15.5% |
| 20 to 24 Minutes | 180 | 6.1% |
| 25 to 29 Minutes | 159 | 5.4% |
| 30 to 34 Minutes | 66 | 2.2% |
| 35 to 39 Minutes | 0 | 0.0% |
| 40 to 44 Minutes | 79 | 2.7% |
| 45 to 59 Minutes | 72 | 2.4% |
| 60 to 89 Minutes | 53 | 1.8% |
| 90 or more Minutes | 65 | 2.2% |
Commute Time by Sex in Lemhi County
The most common commute times in Lemhi County are 5 to 9 minutes (527 commuters, 32.7%) for males and 5 to 9 minutes (608 commuters, 45.0%) for females.
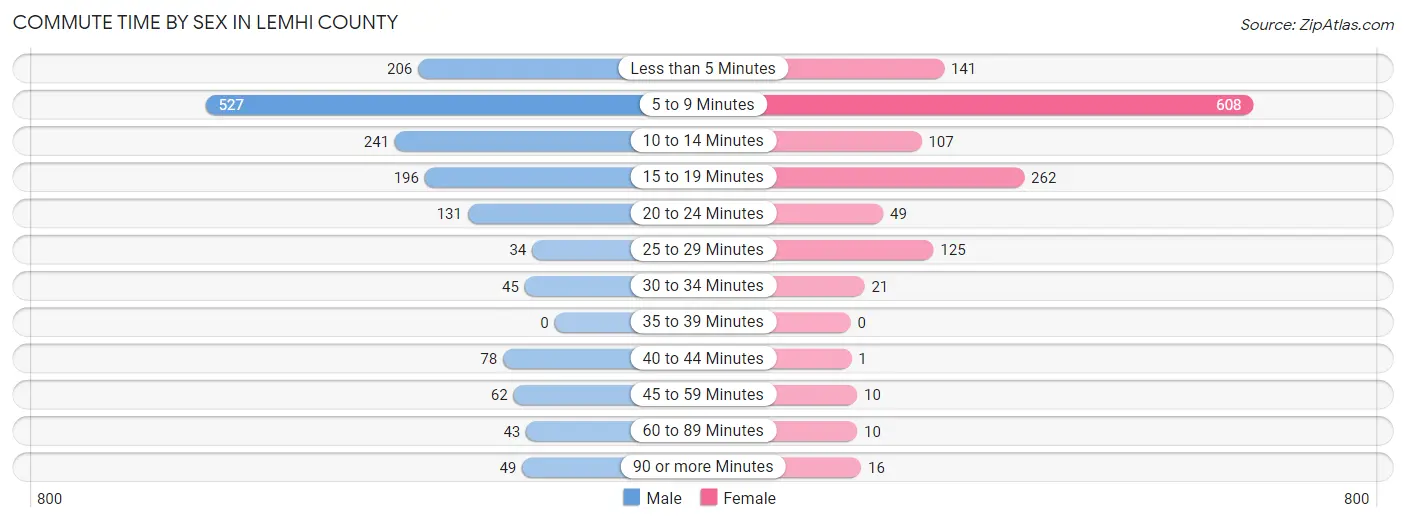
| Commute Time | Male | Female |
| Less than 5 Minutes | 206 (12.8%) | 141 (10.4%) |
| 5 to 9 Minutes | 527 (32.7%) | 608 (45.0%) |
| 10 to 14 Minutes | 241 (14.9%) | 107 (7.9%) |
| 15 to 19 Minutes | 196 (12.2%) | 262 (19.4%) |
| 20 to 24 Minutes | 131 (8.1%) | 49 (3.6%) |
| 25 to 29 Minutes | 34 (2.1%) | 125 (9.3%) |
| 30 to 34 Minutes | 45 (2.8%) | 21 (1.6%) |
| 35 to 39 Minutes | 0 (0.0%) | 0 (0.0%) |
| 40 to 44 Minutes | 78 (4.8%) | 1 (0.1%) |
| 45 to 59 Minutes | 62 (3.8%) | 10 (0.7%) |
| 60 to 89 Minutes | 43 (2.7%) | 10 (0.7%) |
| 90 or more Minutes | 49 (3.0%) | 16 (1.2%) |
Time of Departure to Work by Sex in Lemhi County
The most frequent times of departure to work in Lemhi County are 8:00 AM to 8:29 AM (302, 18.7%) for males and 7:30 AM to 7:59 AM (549, 40.7%) for females.
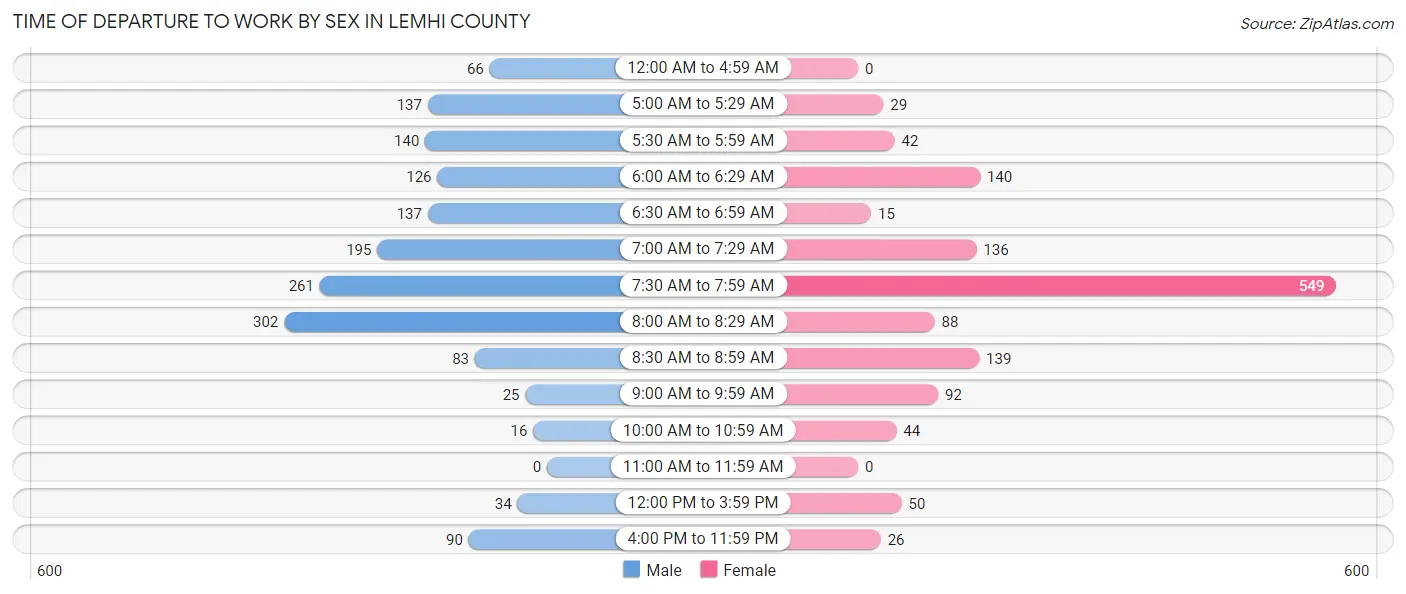
| Time of Departure | Male | Female |
| 12:00 AM to 4:59 AM | 66 (4.1%) | 0 (0.0%) |
| 5:00 AM to 5:29 AM | 137 (8.5%) | 29 (2.1%) |
| 5:30 AM to 5:59 AM | 140 (8.7%) | 42 (3.1%) |
| 6:00 AM to 6:29 AM | 126 (7.8%) | 140 (10.4%) |
| 6:30 AM to 6:59 AM | 137 (8.5%) | 15 (1.1%) |
| 7:00 AM to 7:29 AM | 195 (12.1%) | 136 (10.1%) |
| 7:30 AM to 7:59 AM | 261 (16.2%) | 549 (40.7%) |
| 8:00 AM to 8:29 AM | 302 (18.7%) | 88 (6.5%) |
| 8:30 AM to 8:59 AM | 83 (5.1%) | 139 (10.3%) |
| 9:00 AM to 9:59 AM | 25 (1.5%) | 92 (6.8%) |
| 10:00 AM to 10:59 AM | 16 (1.0%) | 44 (3.3%) |
| 11:00 AM to 11:59 AM | 0 (0.0%) | 0 (0.0%) |
| 12:00 PM to 3:59 PM | 34 (2.1%) | 50 (3.7%) |
| 4:00 PM to 11:59 PM | 90 (5.6%) | 26 (1.9%) |
| Total | 1,612 (100.0%) | 1,350 (100.0%) |
Housing Occupancy in Lemhi County
Occupancy by Ownership in Lemhi County
Of the total 3,328 dwellings in Lemhi County, owner-occupied units account for 2,781 (83.6%), while renter-occupied units make up 547 (16.4%).
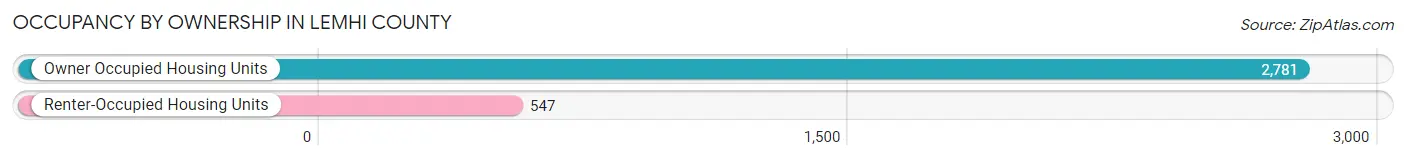
| Occupancy | # Housing Units | % Housing Units |
| Owner Occupied Housing Units | 2,781 | 83.6% |
| Renter-Occupied Housing Units | 547 | 16.4% |
| Total Occupied Housing Units | 3,328 | 100.0% |
Occupancy by Household Size in Lemhi County
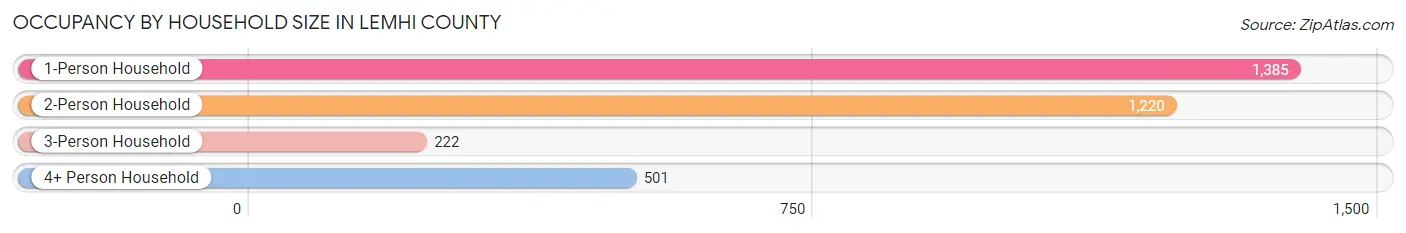
| Household Size | # Housing Units | % Housing Units |
| 1-Person Household | 1,385 | 41.6% |
| 2-Person Household | 1,220 | 36.7% |
| 3-Person Household | 222 | 6.7% |
| 4+ Person Household | 501 | 15.0% |
| Total Housing Units | 3,328 | 100.0% |
Occupancy by Ownership by Household Size in Lemhi County
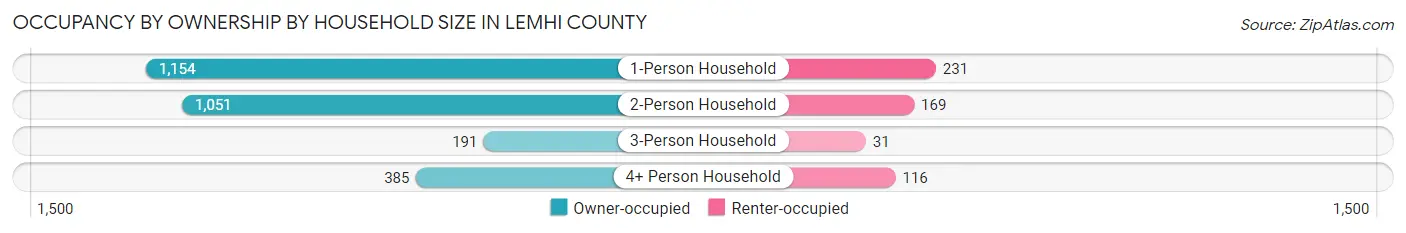
| Household Size | Owner-occupied | Renter-occupied |
| 1-Person Household | 1,154 (83.3%) | 231 (16.7%) |
| 2-Person Household | 1,051 (86.2%) | 169 (13.9%) |
| 3-Person Household | 191 (86.0%) | 31 (14.0%) |
| 4+ Person Household | 385 (76.8%) | 116 (23.2%) |
| Total Housing Units | 2,781 (83.6%) | 547 (16.4%) |
Occupancy by Educational Attainment in Lemhi County
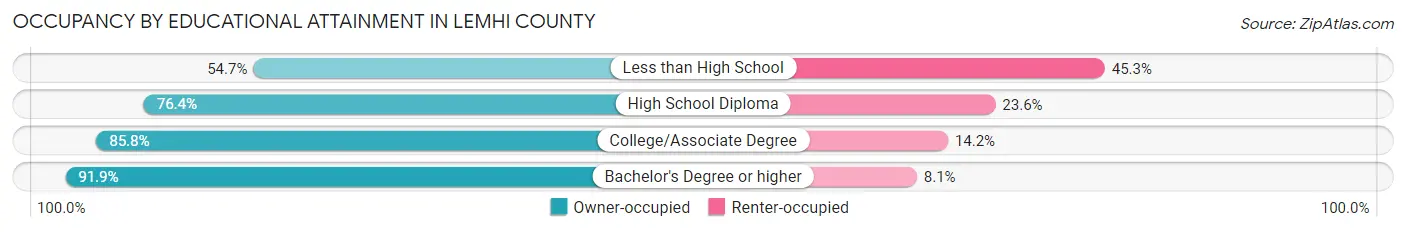
| Household Size | Owner-occupied | Renter-occupied |
| Less than High School | 82 (54.7%) | 68 (45.3%) |
| High School Diploma | 688 (76.4%) | 213 (23.6%) |
| College/Associate Degree | 1,145 (85.8%) | 190 (14.2%) |
| Bachelor's Degree or higher | 866 (91.9%) | 76 (8.1%) |
Occupancy by Age of Householder in Lemhi County
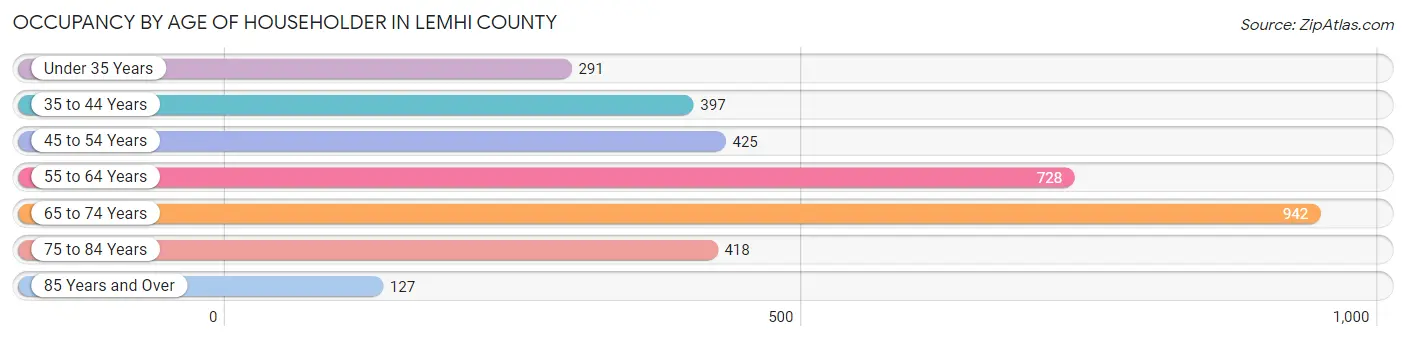
| Age Bracket | # Households | % Households |
| Under 35 Years | 291 | 8.7% |
| 35 to 44 Years | 397 | 11.9% |
| 45 to 54 Years | 425 | 12.8% |
| 55 to 64 Years | 728 | 21.9% |
| 65 to 74 Years | 942 | 28.3% |
| 75 to 84 Years | 418 | 12.6% |
| 85 Years and Over | 127 | 3.8% |
| Total | 3,328 | 100.0% |
Housing Finances in Lemhi County
Median Income by Occupancy in Lemhi County
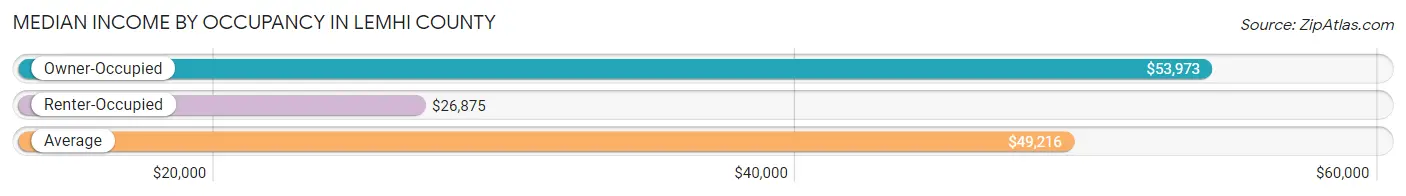
| Occupancy Type | # Households | Median Income |
| Owner-Occupied | 2,781 (83.6%) | $53,973 |
| Renter-Occupied | 547 (16.4%) | $26,875 |
| Average | 3,328 (100.0%) | $49,216 |
Occupancy by Householder Income Bracket in Lemhi County
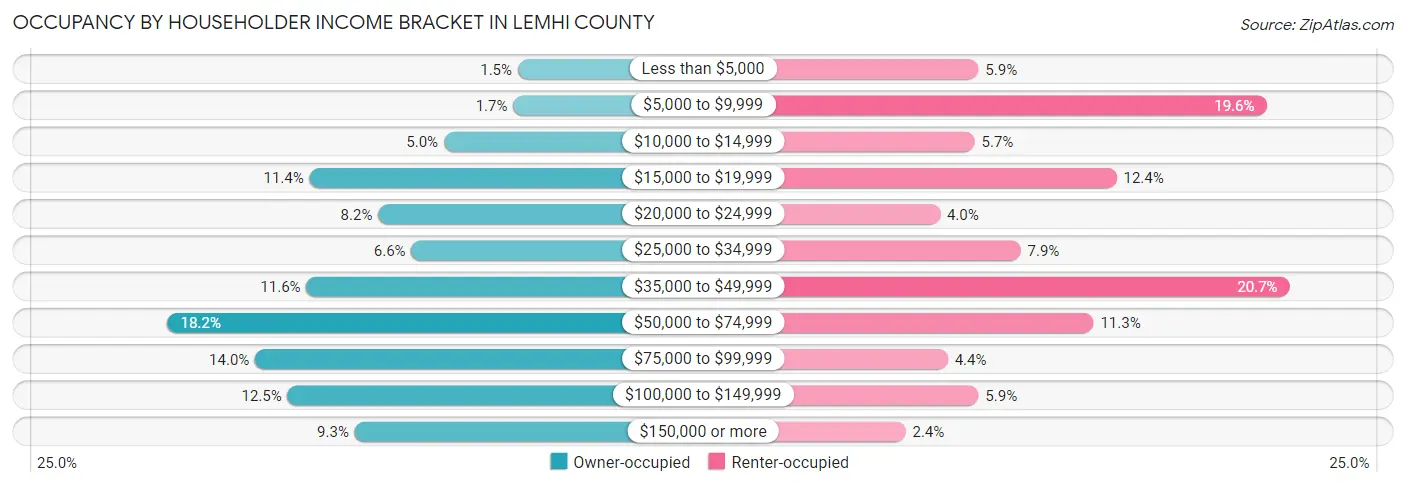
| Income Bracket | Owner-occupied | Renter-occupied |
| Less than $5,000 | 42 (1.5%) | 32 (5.9%) |
| $5,000 to $9,999 | 48 (1.7%) | 107 (19.6%) |
| $10,000 to $14,999 | 140 (5.0%) | 31 (5.7%) |
| $15,000 to $19,999 | 318 (11.4%) | 68 (12.4%) |
| $20,000 to $24,999 | 227 (8.2%) | 22 (4.0%) |
| $25,000 to $34,999 | 183 (6.6%) | 43 (7.9%) |
| $35,000 to $49,999 | 322 (11.6%) | 113 (20.7%) |
| $50,000 to $74,999 | 506 (18.2%) | 62 (11.3%) |
| $75,000 to $99,999 | 390 (14.0%) | 24 (4.4%) |
| $100,000 to $149,999 | 347 (12.5%) | 32 (5.9%) |
| $150,000 or more | 258 (9.3%) | 13 (2.4%) |
| Total | 2,781 (100.0%) | 547 (100.0%) |
Monthly Housing Cost Tiers in Lemhi County
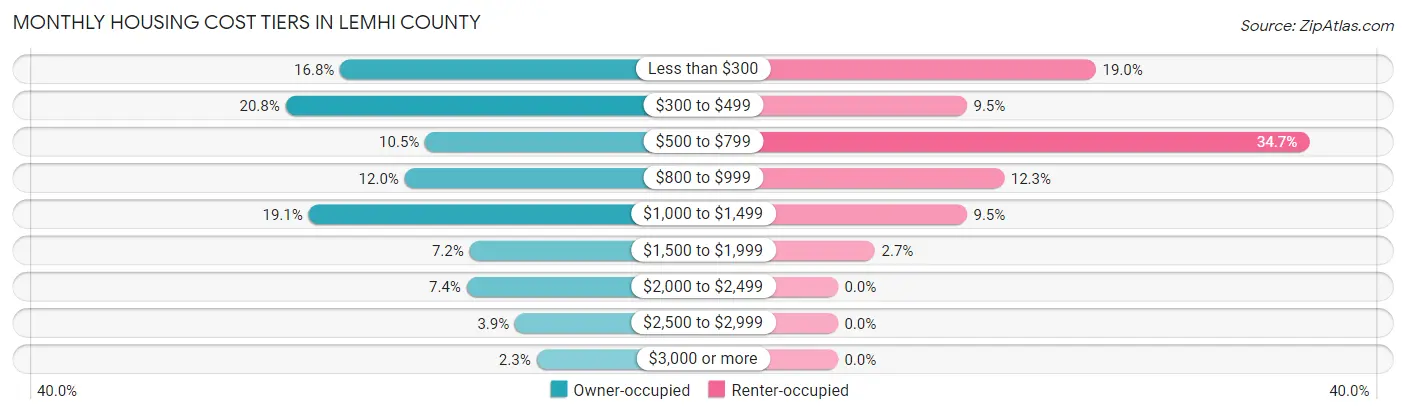
| Monthly Cost | Owner-occupied | Renter-occupied |
| Less than $300 | 466 (16.8%) | 104 (19.0%) |
| $300 to $499 | 578 (20.8%) | 52 (9.5%) |
| $500 to $799 | 292 (10.5%) | 190 (34.7%) |
| $800 to $999 | 334 (12.0%) | 67 (12.2%) |
| $1,000 to $1,499 | 531 (19.1%) | 52 (9.5%) |
| $1,500 to $1,999 | 201 (7.2%) | 15 (2.7%) |
| $2,000 to $2,499 | 207 (7.4%) | 0 (0.0%) |
| $2,500 to $2,999 | 108 (3.9%) | 0 (0.0%) |
| $3,000 or more | 64 (2.3%) | 0 (0.0%) |
| Total | 2,781 (100.0%) | 547 (100.0%) |
Physical Housing Characteristics in Lemhi County
Housing Structures in Lemhi County
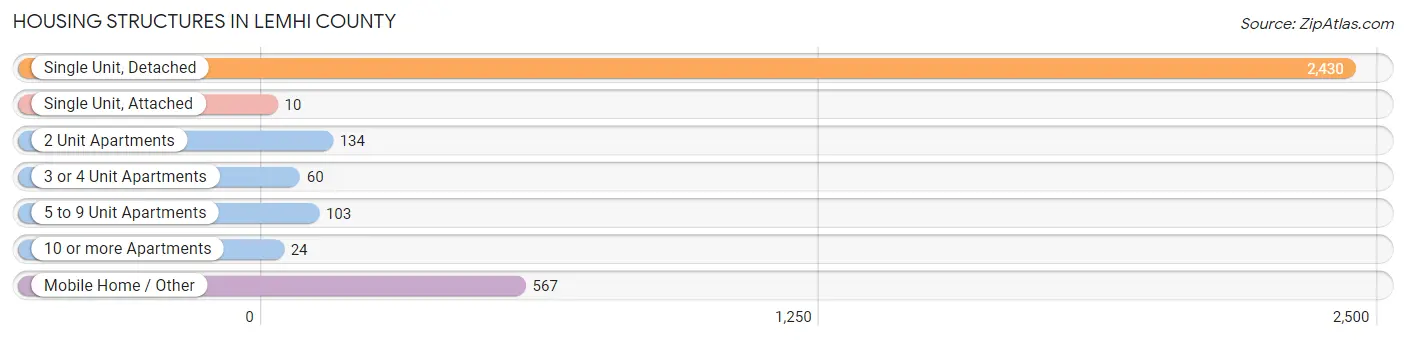
| Structure Type | # Housing Units | % Housing Units |
| Single Unit, Detached | 2,430 | 73.0% |
| Single Unit, Attached | 10 | 0.3% |
| 2 Unit Apartments | 134 | 4.0% |
| 3 or 4 Unit Apartments | 60 | 1.8% |
| 5 to 9 Unit Apartments | 103 | 3.1% |
| 10 or more Apartments | 24 | 0.7% |
| Mobile Home / Other | 567 | 17.0% |
| Total | 3,328 | 100.0% |
Housing Structures by Occupancy in Lemhi County
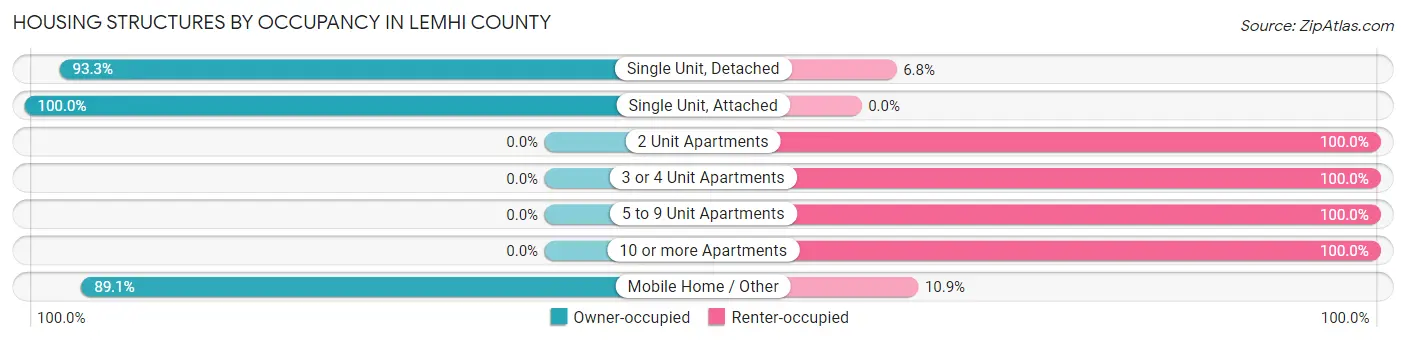
| Structure Type | Owner-occupied | Renter-occupied |
| Single Unit, Detached | 2,266 (93.2%) | 164 (6.8%) |
| Single Unit, Attached | 10 (100.0%) | 0 (0.0%) |
| 2 Unit Apartments | 0 (0.0%) | 134 (100.0%) |
| 3 or 4 Unit Apartments | 0 (0.0%) | 60 (100.0%) |
| 5 to 9 Unit Apartments | 0 (0.0%) | 103 (100.0%) |
| 10 or more Apartments | 0 (0.0%) | 24 (100.0%) |
| Mobile Home / Other | 505 (89.1%) | 62 (10.9%) |
| Total | 2,781 (83.6%) | 547 (16.4%) |
Housing Structures by Number of Rooms in Lemhi County
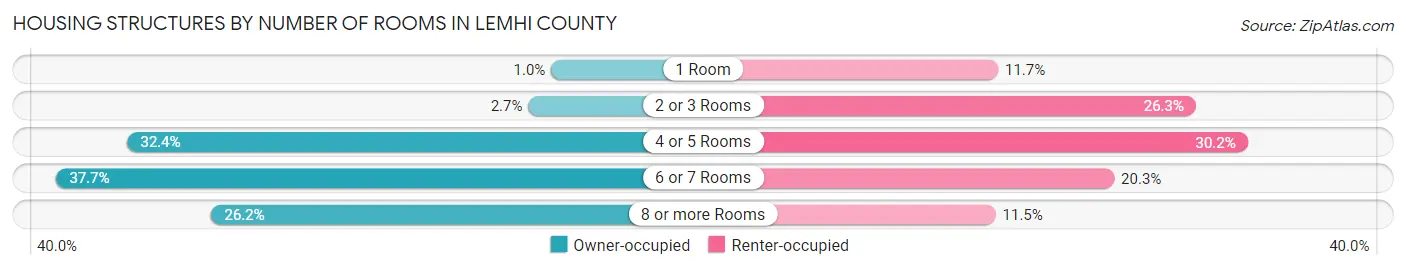
| Number of Rooms | Owner-occupied | Renter-occupied |
| 1 Room | 29 (1.0%) | 64 (11.7%) |
| 2 or 3 Rooms | 76 (2.7%) | 144 (26.3%) |
| 4 or 5 Rooms | 901 (32.4%) | 165 (30.2%) |
| 6 or 7 Rooms | 1,047 (37.7%) | 111 (20.3%) |
| 8 or more Rooms | 728 (26.2%) | 63 (11.5%) |
| Total | 2,781 (100.0%) | 547 (100.0%) |
Housing Structure by Heating Type in Lemhi County
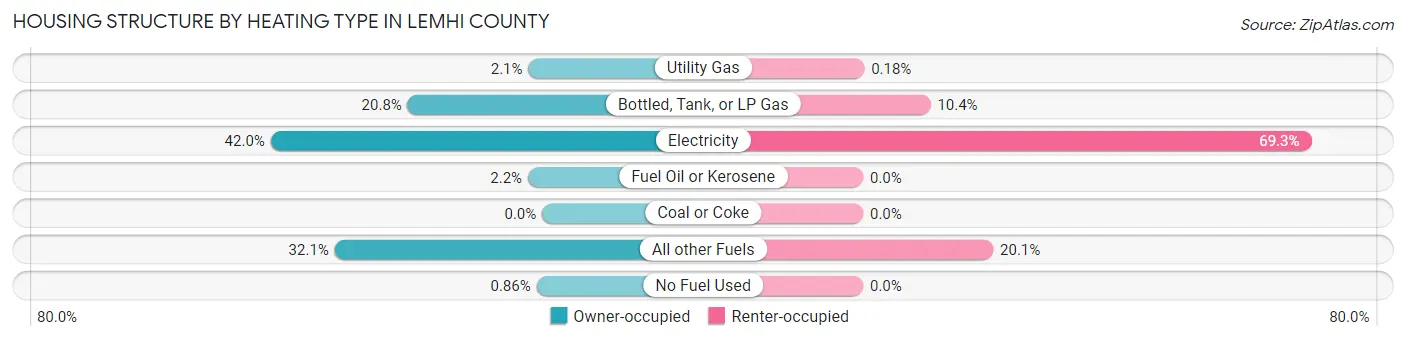
| Heating Type | Owner-occupied | Renter-occupied |
| Utility Gas | 59 (2.1%) | 1 (0.2%) |
| Bottled, Tank, or LP Gas | 578 (20.8%) | 57 (10.4%) |
| Electricity | 1,167 (42.0%) | 379 (69.3%) |
| Fuel Oil or Kerosene | 61 (2.2%) | 0 (0.0%) |
| Coal or Coke | 0 (0.0%) | 0 (0.0%) |
| All other Fuels | 892 (32.1%) | 110 (20.1%) |
| No Fuel Used | 24 (0.9%) | 0 (0.0%) |
| Total | 2,781 (100.0%) | 547 (100.0%) |
Household Vehicle Usage in Lemhi County
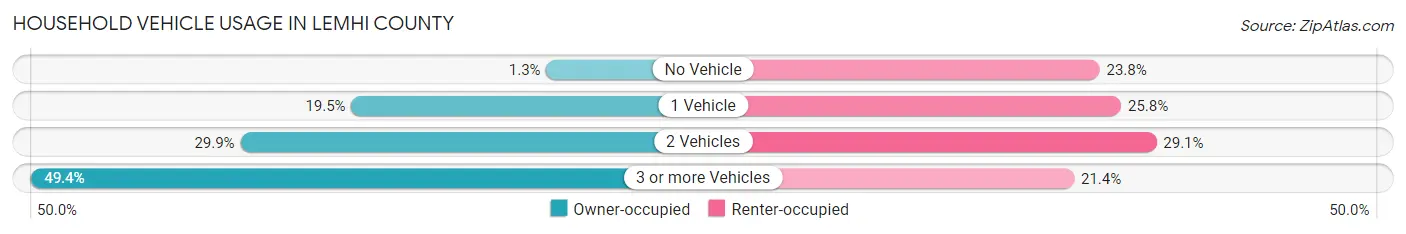
| Vehicles per Household | Owner-occupied | Renter-occupied |
| No Vehicle | 36 (1.3%) | 130 (23.8%) |
| 1 Vehicle | 542 (19.5%) | 141 (25.8%) |
| 2 Vehicles | 830 (29.8%) | 159 (29.1%) |
| 3 or more Vehicles | 1,373 (49.4%) | 117 (21.4%) |
| Total | 2,781 (100.0%) | 547 (100.0%) |
Real Estate & Mortgages in Lemhi County
Real Estate and Mortgage Overview in Lemhi County
| Characteristic | Without Mortgage | With Mortgage |
| Housing Units | 1,327 | 1,454 |
| Median Property Value | $211,300 | $280,800 |
| Median Household Income | $41,767 | $225 |
| Monthly Housing Costs | $351 | $64 |
| Real Estate Taxes | $746 | $30 |
Property Value by Mortgage Status in Lemhi County
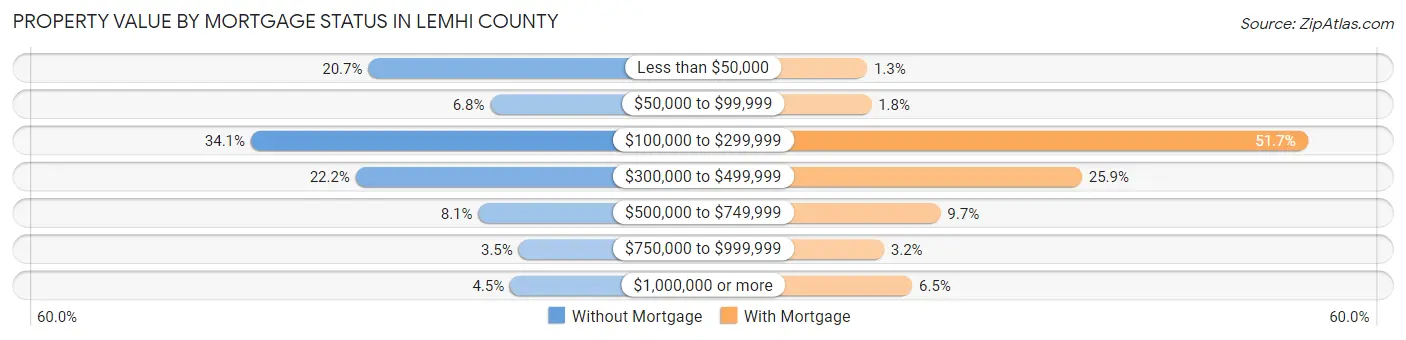
| Property Value | Without Mortgage | With Mortgage |
| Less than $50,000 | 275 (20.7%) | 19 (1.3%) |
| $50,000 to $99,999 | 90 (6.8%) | 26 (1.8%) |
| $100,000 to $299,999 | 453 (34.1%) | 751 (51.6%) |
| $300,000 to $499,999 | 294 (22.2%) | 376 (25.9%) |
| $500,000 to $749,999 | 108 (8.1%) | 141 (9.7%) |
| $750,000 to $999,999 | 47 (3.5%) | 47 (3.2%) |
| $1,000,000 or more | 60 (4.5%) | 94 (6.5%) |
| Total | 1,327 (100.0%) | 1,454 (100.0%) |
Household Income by Mortgage Status in Lemhi County
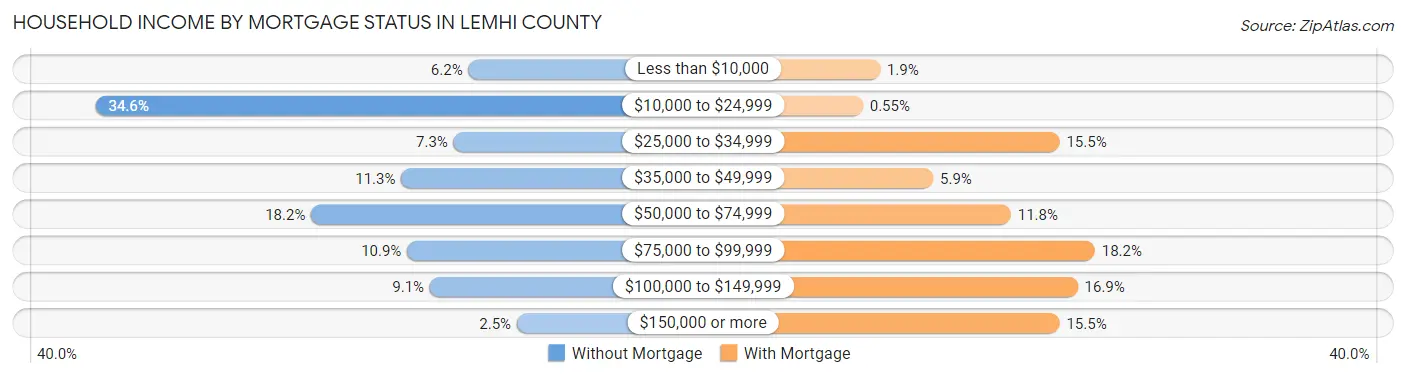
| Household Income | Without Mortgage | With Mortgage |
| Less than $10,000 | 82 (6.2%) | 27 (1.9%) |
| $10,000 to $24,999 | 459 (34.6%) | 8 (0.5%) |
| $25,000 to $34,999 | 97 (7.3%) | 226 (15.5%) |
| $35,000 to $49,999 | 150 (11.3%) | 86 (5.9%) |
| $50,000 to $74,999 | 241 (18.2%) | 172 (11.8%) |
| $75,000 to $99,999 | 144 (10.8%) | 265 (18.2%) |
| $100,000 to $149,999 | 121 (9.1%) | 246 (16.9%) |
| $150,000 or more | 33 (2.5%) | 226 (15.5%) |
| Total | 1,327 (100.0%) | 1,454 (100.0%) |
Property Value to Household Income Ratio in Lemhi County
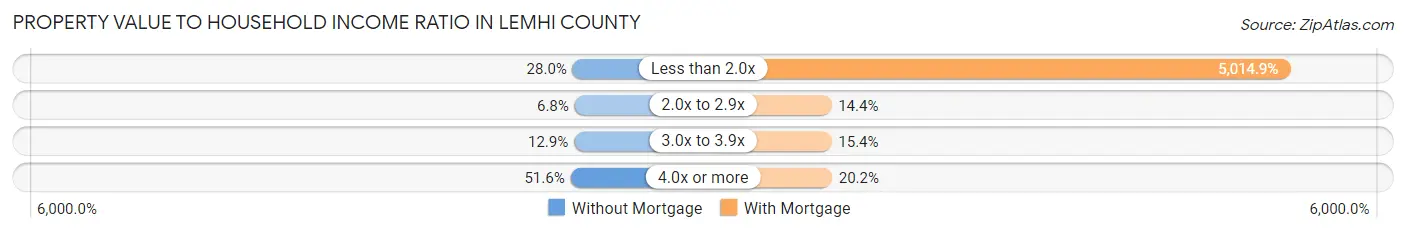
| Value-to-Income Ratio | Without Mortgage | With Mortgage |
| Less than 2.0x | 371 (28.0%) | 72,917 (5,014.9%) |
| 2.0x to 2.9x | 90 (6.8%) | 209 (14.4%) |
| 3.0x to 3.9x | 171 (12.9%) | 224 (15.4%) |
| 4.0x or more | 685 (51.6%) | 293 (20.2%) |
| Total | 1,327 (100.0%) | 1,454 (100.0%) |
Real Estate Taxes by Mortgage Status in Lemhi County
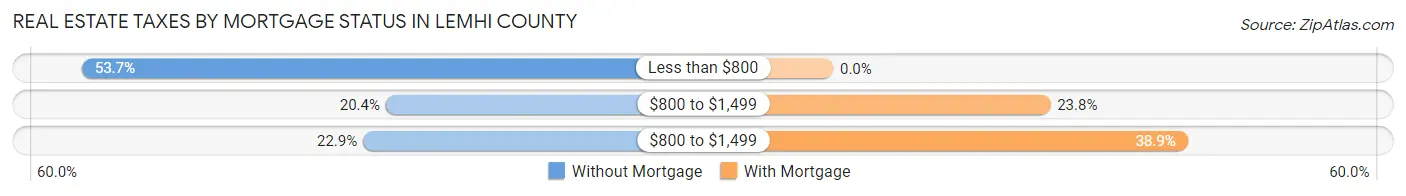
| Property Taxes | Without Mortgage | With Mortgage |
| Less than $800 | 713 (53.7%) | 0 (0.0%) |
| $800 to $1,499 | 271 (20.4%) | 346 (23.8%) |
| $800 to $1,499 | 304 (22.9%) | 565 (38.9%) |
| Total | 1,327 (100.0%) | 1,454 (100.0%) |
Health & Disability in Lemhi County
Health Insurance Coverage by Age in Lemhi County
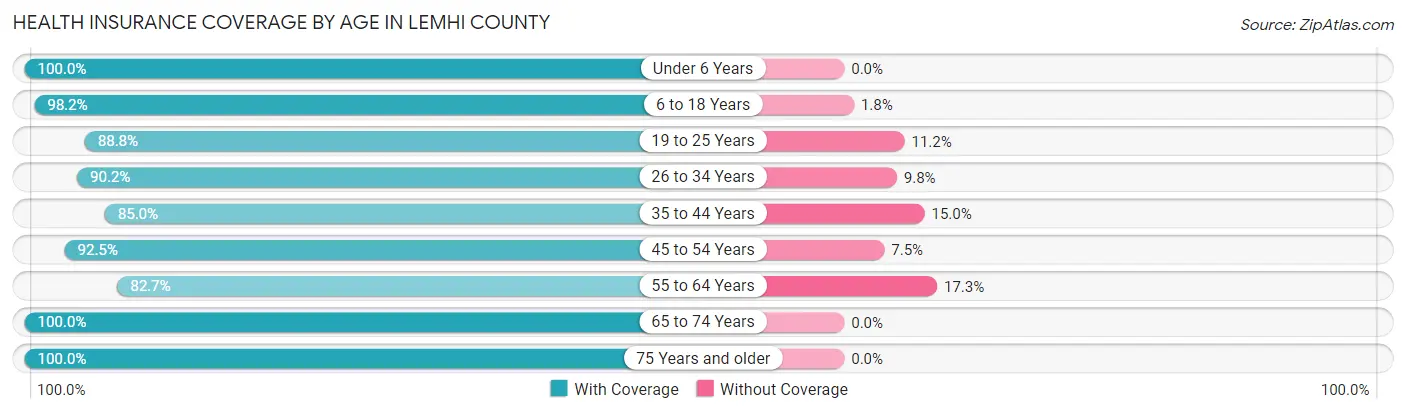
| Age Bracket | With Coverage | Without Coverage |
| Under 6 Years | 375 (100.0%) | 0 (0.0%) |
| 6 to 18 Years | 1,138 (98.2%) | 21 (1.8%) |
| 19 to 25 Years | 474 (88.8%) | 60 (11.2%) |
| 26 to 34 Years | 460 (90.2%) | 50 (9.8%) |
| 35 to 44 Years | 744 (85.0%) | 131 (15.0%) |
| 45 to 54 Years | 681 (92.5%) | 55 (7.5%) |
| 55 to 64 Years | 1,104 (82.7%) | 231 (17.3%) |
| 65 to 74 Years | 1,468 (100.0%) | 0 (0.0%) |
| 75 Years and older | 926 (100.0%) | 0 (0.0%) |
| Total | 7,370 (93.1%) | 548 (6.9%) |
Health Insurance Coverage by Citizenship Status in Lemhi County
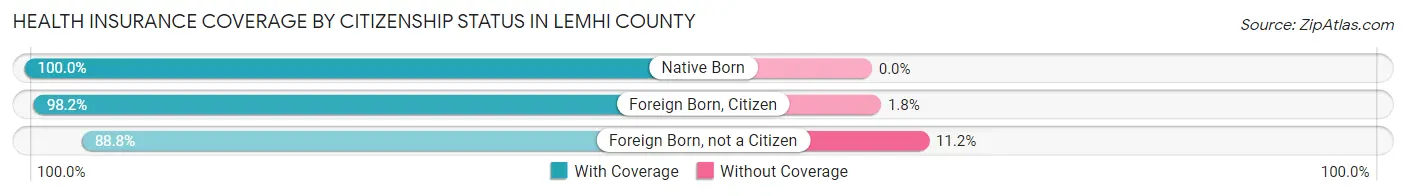
| Citizenship Status | With Coverage | Without Coverage |
| Native Born | 375 (100.0%) | 0 (0.0%) |
| Foreign Born, Citizen | 1,138 (98.2%) | 21 (1.8%) |
| Foreign Born, not a Citizen | 474 (88.8%) | 60 (11.2%) |
Health Insurance Coverage by Household Income in Lemhi County
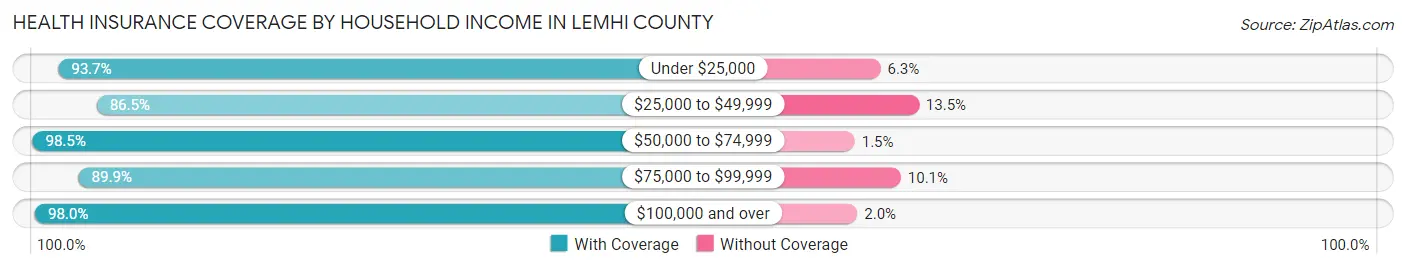
| Household Income | With Coverage | Without Coverage |
| Under $25,000 | 1,171 (93.7%) | 79 (6.3%) |
| $25,000 to $49,999 | 1,280 (86.5%) | 200 (13.5%) |
| $50,000 to $74,999 | 1,313 (98.5%) | 20 (1.5%) |
| $75,000 to $99,999 | 1,322 (89.9%) | 149 (10.1%) |
| $100,000 and over | 2,191 (98.0%) | 44 (2.0%) |
Public vs Private Health Insurance Coverage by Age in Lemhi County
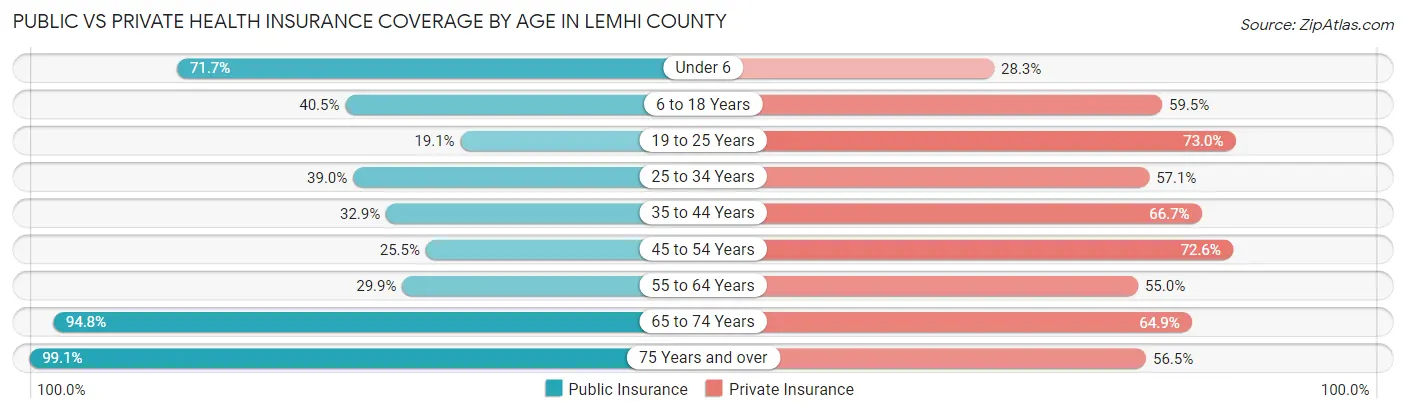
| Age Bracket | Public Insurance | Private Insurance |
| Under 6 | 269 (71.7%) | 106 (28.3%) |
| 6 to 18 Years | 469 (40.5%) | 689 (59.5%) |
| 19 to 25 Years | 102 (19.1%) | 390 (73.0%) |
| 25 to 34 Years | 199 (39.0%) | 291 (57.1%) |
| 35 to 44 Years | 288 (32.9%) | 584 (66.7%) |
| 45 to 54 Years | 188 (25.5%) | 534 (72.6%) |
| 55 to 64 Years | 399 (29.9%) | 734 (55.0%) |
| 65 to 74 Years | 1,391 (94.8%) | 953 (64.9%) |
| 75 Years and over | 918 (99.1%) | 523 (56.5%) |
| Total | 4,223 (53.3%) | 4,804 (60.7%) |
Disability Status by Sex by Age in Lemhi County
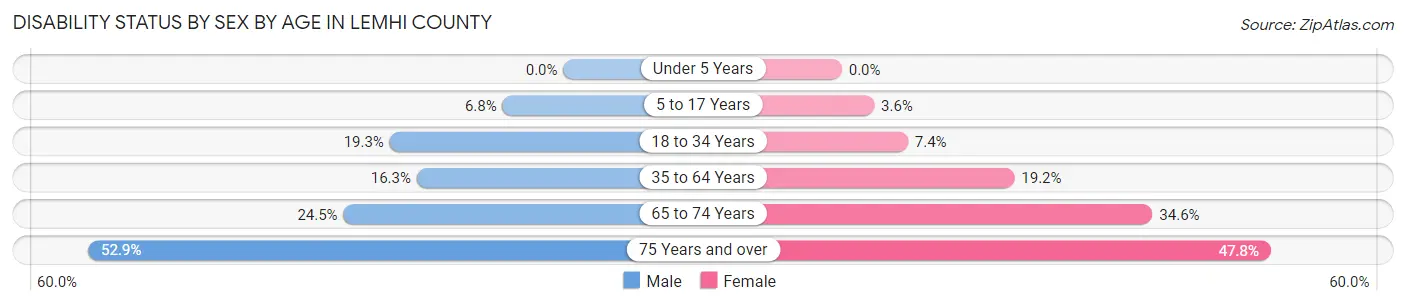
| Age Bracket | Male | Female |
| Under 5 Years | 0 (0.0%) | 0 (0.0%) |
| 5 to 17 Years | 39 (6.8%) | 16 (3.6%) |
| 18 to 34 Years | 124 (19.3%) | 42 (7.4%) |
| 35 to 64 Years | 243 (16.3%) | 280 (19.2%) |
| 65 to 74 Years | 191 (24.5%) | 238 (34.6%) |
| 75 Years and over | 253 (52.9%) | 214 (47.8%) |
Disability Class by Sex by Age in Lemhi County
Disability Class: Hearing Difficulty

| Age Bracket | Male | Female |
| Under 5 Years | 0 (0.0%) | 0 (0.0%) |
| 5 to 17 Years | 4 (0.7%) | 0 (0.0%) |
| 18 to 34 Years | 47 (7.3%) | 0 (0.0%) |
| 35 to 64 Years | 108 (7.2%) | 25 (1.7%) |
| 65 to 74 Years | 120 (15.4%) | 39 (5.7%) |
| 75 Years and over | 202 (42.3%) | 69 (15.4%) |
Disability Class: Vision Difficulty
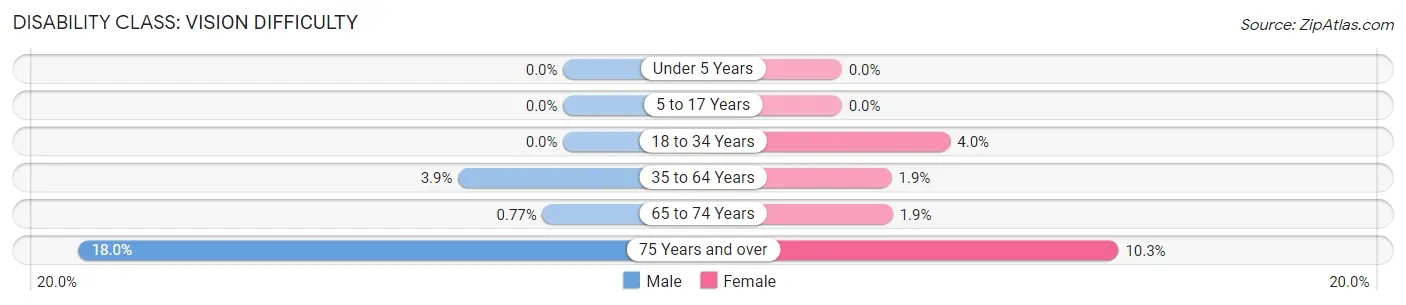
| Age Bracket | Male | Female |
| Under 5 Years | 0 (0.0%) | 0 (0.0%) |
| 5 to 17 Years | 0 (0.0%) | 0 (0.0%) |
| 18 to 34 Years | 0 (0.0%) | 23 (4.0%) |
| 35 to 64 Years | 58 (3.9%) | 27 (1.8%) |
| 65 to 74 Years | 6 (0.8%) | 13 (1.9%) |
| 75 Years and over | 86 (18.0%) | 46 (10.3%) |
Disability Class: Cognitive Difficulty
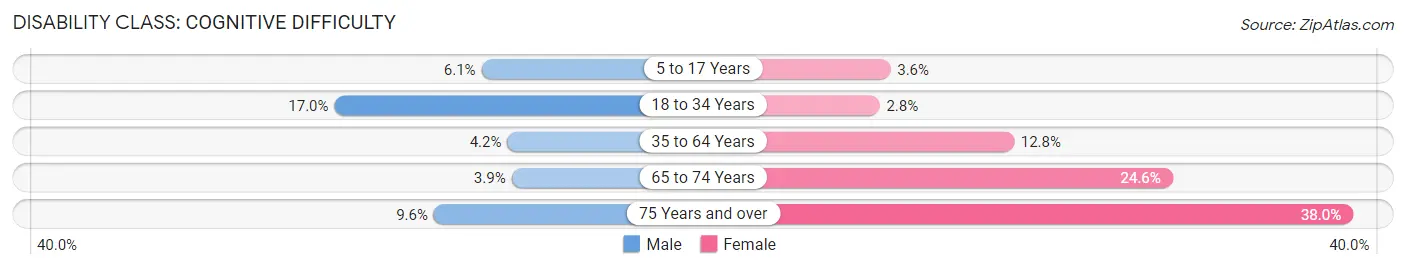
| Age Bracket | Male | Female |
| 5 to 17 Years | 35 (6.1%) | 16 (3.6%) |
| 18 to 34 Years | 109 (17.0%) | 16 (2.8%) |
| 35 to 64 Years | 62 (4.2%) | 186 (12.8%) |
| 65 to 74 Years | 30 (3.8%) | 169 (24.6%) |
| 75 Years and over | 46 (9.6%) | 170 (38.0%) |
Disability Class: Ambulatory Difficulty
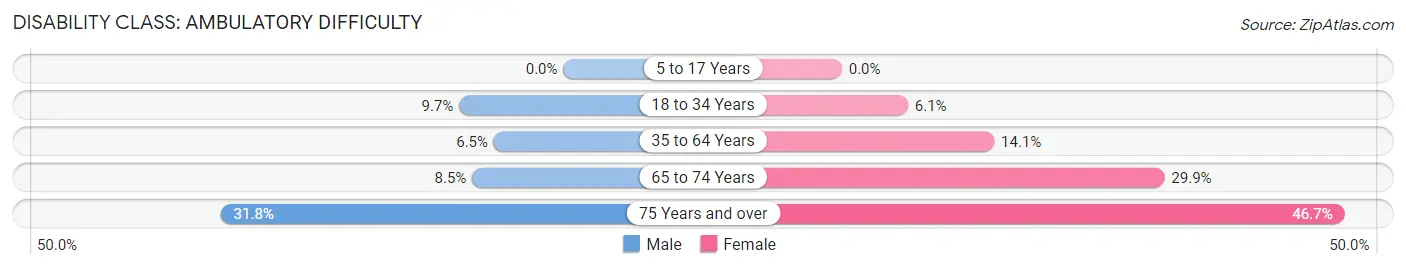
| Age Bracket | Male | Female |
| 5 to 17 Years | 0 (0.0%) | 0 (0.0%) |
| 18 to 34 Years | 62 (9.7%) | 35 (6.1%) |
| 35 to 64 Years | 96 (6.5%) | 206 (14.1%) |
| 65 to 74 Years | 66 (8.5%) | 206 (29.9%) |
| 75 Years and over | 152 (31.8%) | 209 (46.7%) |
Disability Class: Self-Care Difficulty
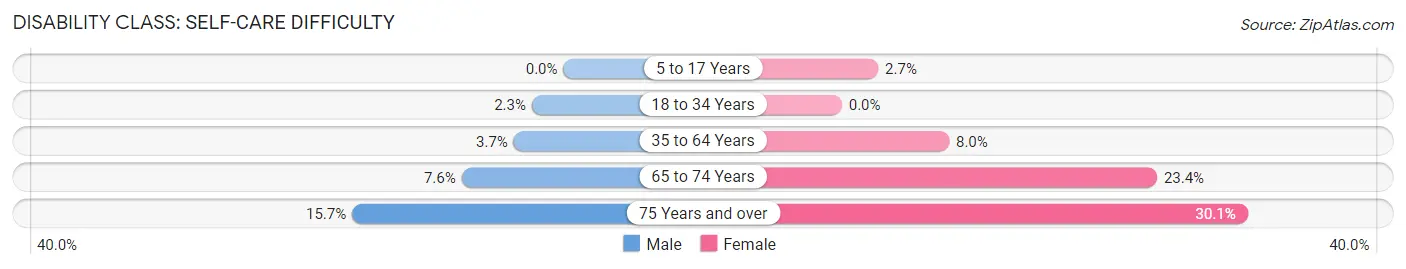
| Age Bracket | Male | Female |
| 5 to 17 Years | 0 (0.0%) | 12 (2.7%) |
| 18 to 34 Years | 15 (2.3%) | 0 (0.0%) |
| 35 to 64 Years | 55 (3.7%) | 116 (8.0%) |
| 65 to 74 Years | 59 (7.6%) | 161 (23.4%) |
| 75 Years and over | 75 (15.7%) | 135 (30.1%) |
Technology Access in Lemhi County
Computing Device Access in Lemhi County
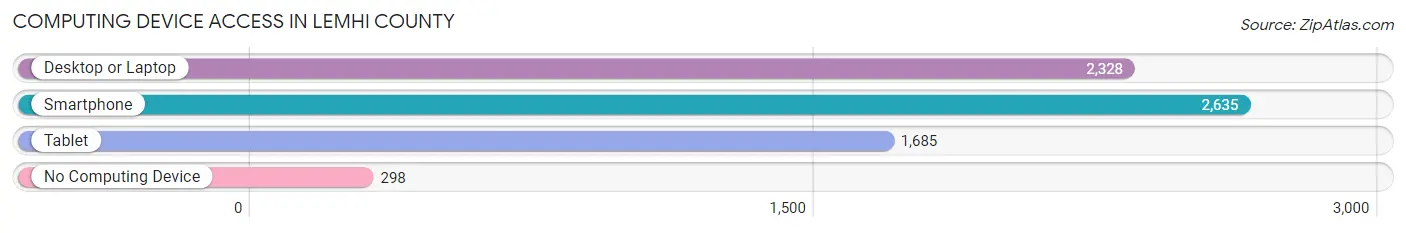
| Device Type | # Households | % Households |
| Desktop or Laptop | 2,328 | 70.0% |
| Smartphone | 2,635 | 79.2% |
| Tablet | 1,685 | 50.6% |
| No Computing Device | 298 | 8.9% |
| Total | 3,328 | 100.0% |
Internet Access in Lemhi County
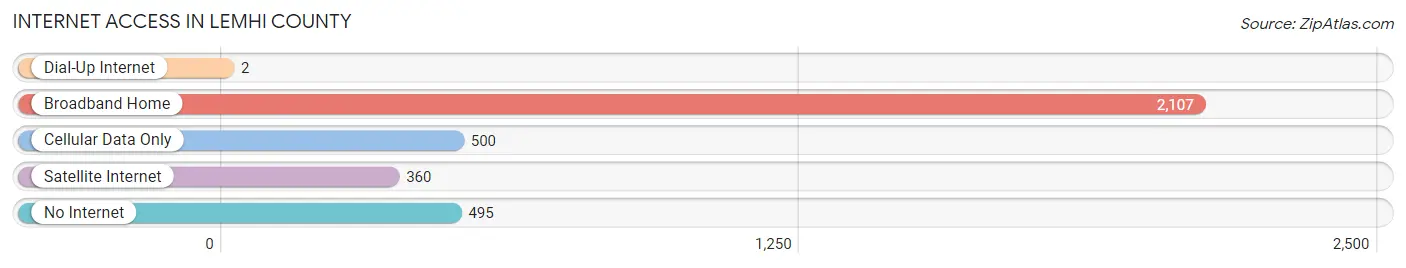
| Internet Type | # Households | % Households |
| Dial-Up Internet | 2 | 0.1% |
| Broadband Home | 2,107 | 63.3% |
| Cellular Data Only | 500 | 15.0% |
| Satellite Internet | 360 | 10.8% |
| No Internet | 495 | 14.9% |
| Total | 3,328 | 100.0% |
Lemhi County Summary
Lemhi County is located in the central part of the state of Idaho, in the United States. It is bordered by Custer County to the north, Butte County to the east, Clark County to the south, and Blaine County to the west. The county seat is Salmon, and the largest city is Salmon. The county has a total area of 2,945 square miles, of which 2,944 square miles is land and 1 square mile is water.
History
Lemhi County was created in 1869, and was named after the Lemhi River, which was named after the Lemhi Shoshone tribe. The county was originally part of Idaho Territory, and was part of the original Idaho County. In 1887, Lemhi County was split off from Idaho County, and became its own county.
The county was originally inhabited by the Shoshone and Bannock tribes, who were later joined by settlers from the Oregon Trail. The first permanent settlement in the county was Salmon City, which was established in 1869. The county was primarily an agricultural area, with the main crops being wheat, barley, oats, and potatoes.
Geography
Lemhi County is located in the central part of the state of Idaho. It is bordered by Custer County to the north, Butte County to the east, Clark County to the south, and Blaine County to the west. The county has a total area of 2,945 square miles, of which 2,944 square miles is land and 1 square mile is water.
The county is located in the Rocky Mountains, and is home to several mountain ranges, including the Lemhi Range, the Bitterroot Range, and the Salmon River Mountains. The highest point in the county is Mount McGuire, which has an elevation of 10,912 feet. The county also contains several rivers, including the Lemhi River, the Salmon River, and the Snake River.
Economy
The economy of Lemhi County is primarily based on agriculture, forestry, and tourism. The county is home to several large agricultural operations, including cattle ranches, wheat farms, and potato farms. The county is also home to several timber companies, which harvest timber from the county's forests.
Tourism is also an important part of the county's economy. The county is home to several popular tourist attractions, including the Salmon River, the Lemhi River, and the Bitterroot Range. The county is also home to several ski resorts, which attract visitors from all over the world.
Demographics
As of the 2010 census, the population of Lemhi County was 7,936. The population density was 2.7 people per square mile. The racial makeup of the county was 95.3% White, 0.3% African American, 1.2% Native American, 0.3% Asian, 0.1% Pacific Islander, 0.7% from other races, and 1.9% from two or more races. Hispanic or Latino of any race were 2.7% of the population.
The median income for a household in the county was $35,938, and the median income for a family was $41,944. The per capita income for the county was $17,945. About 13.2% of families and 17.2% of the population were below the poverty line, including 22.2% of those under age 18 and 8.2% of those age 65 or over.
Common Questions
What is the Total Population of Lemhi County?
Total Population of Lemhi County is 8,043.
What is the Total Male Population of Lemhi County?
Total Male Population of Lemhi County is 4,228.
What is the Total Female Population of Lemhi County?
Total Female Population of Lemhi County is 3,815.
What is the Ratio of Males per 100 Females in Lemhi County?
There are 110.83 Males per 100 Females in Lemhi County.
What is the Ratio of Females per 100 Males in Lemhi County?
There are 90.23 Females per 100 Males in Lemhi County.
What is the Median Population Age in Lemhi County?
Median Population Age in Lemhi County is 53.2 Years.
What is the Average Family Size in Lemhi County
Average Family Size in Lemhi County is 3.3 People.
What is the Average Household Size in Lemhi County
Average Household Size in Lemhi County is 2.4 People.
What is Per Capita Income in Lemhi County?
Per Capita income in Lemhi County is $32,446.
What is the Median Family Income in Lemhi County?
Median Family Income in Lemhi County is $73,194.
What is the Median Household income in Lemhi County?
Median Household Income in Lemhi County is $49,216.
What is Income or Wage Gap in Lemhi County?
Income or Wage Gap in Lemhi County is 42.0%.
Women in Lemhi County earn 58.0 cents for every dollar earned by a man.
What is Family Income Deficit in Lemhi County?
Family Income Deficit in Lemhi County is $10,799.
Families that are below poverty line in Lemhi County earn $10,799 less on average than the poverty threshold level.
What is Inequality or Gini Index in Lemhi County?
Inequality or Gini Index in Lemhi County is 0.50.
How Large is the Labor Force in Lemhi County?
There are 3,577 People in the Labor Forcein in Lemhi County.
What is the Percentage of People in the Labor Force in Lemhi County?
52.5% of People are in the Labor Force in Lemhi County.
What is the Unemployment Rate in Lemhi County?
Unemployment Rate in Lemhi County is 3.1%.