Latah County, ID
Latah County Map
Latah County Overview
39,872
TOTAL POPULATION
20,524
MALE POPULATION
19,348
FEMALE POPULATION
106.08
MALES / 100 FEMALES
94.27
FEMALES / 100 MALES
30.3
MEDIAN AGE
2.7
AVG FAMILY SIZE
2.1
AVG HOUSEHOLD SIZE
$33,342
PER CAPITA INCOME
$86,186
AVG FAMILY INCOME
$62,258
AVG HOUSEHOLD INCOME
34.4%
WAGE / INCOME GAP [ % ]
65.6¢/ $1
WAGE / INCOME GAP [ $ ]
$9,396
FAMILY INCOME DEFICIT
0.46
INEQUALITY / GINI INDEX
20,452
LABOR FORCE [ PEOPLE ]
61.3%
PERCENT IN LABOR FORCE
5.3%
UNEMPLOYMENT RATE
Latah County Area Codes
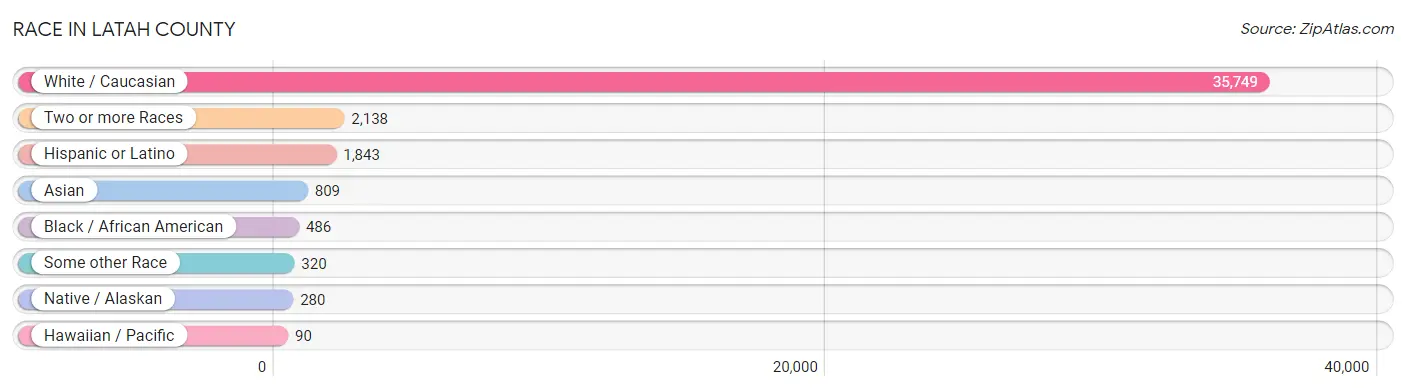
Race in Latah County
The most populous races in Latah County are White / Caucasian (35,749 | 89.7%), Two or more Races (2,138 | 5.4%), and Hispanic or Latino (1,843 | 4.6%).
| Race | # Population | % Population |
| Asian | 809 | 2.0% |
| Black / African American | 486 | 1.2% |
| Hawaiian / Pacific | 90 | 0.2% |
| Hispanic or Latino | 1,843 | 4.6% |
| Native / Alaskan | 280 | 0.7% |
| White / Caucasian | 35,749 | 89.7% |
| Two or more Races | 2,138 | 5.4% |
| Some other Race | 320 | 0.8% |
| Total | 39,872 | 100.0% |
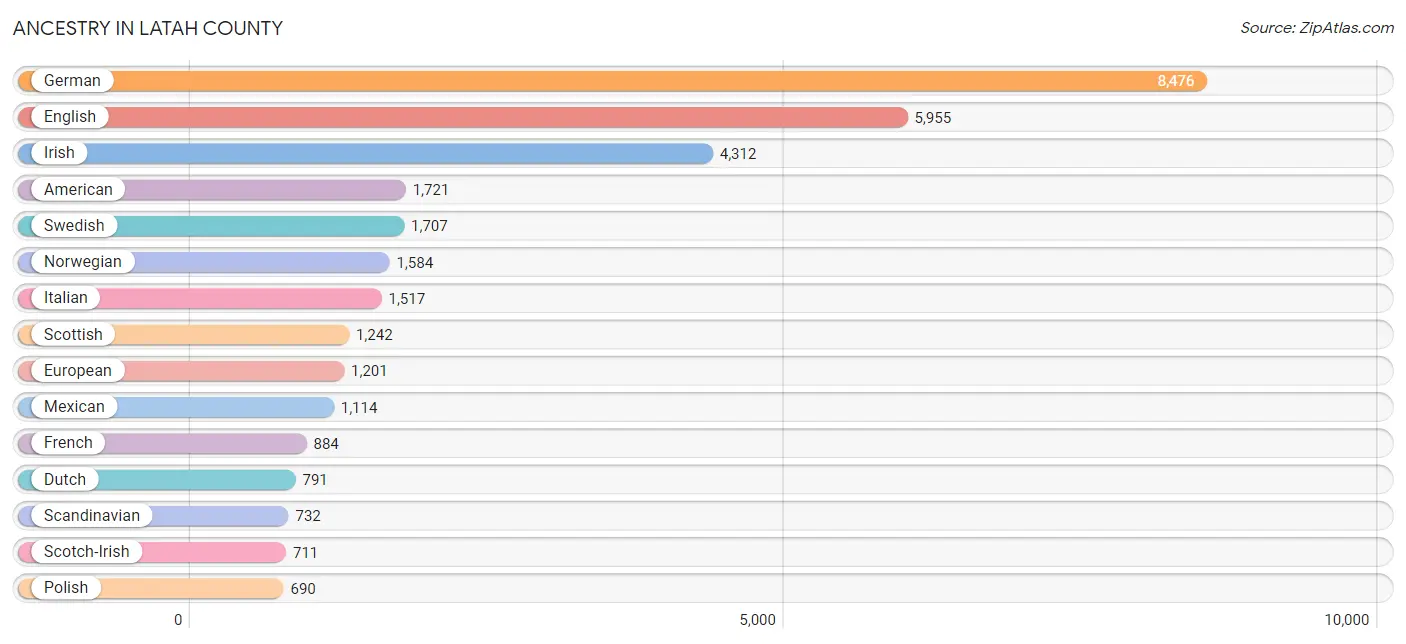
Ancestry in Latah County
The most populous ancestries reported in Latah County are German (8,476 | 21.3%), English (5,955 | 14.9%), Irish (4,312 | 10.8%), American (1,721 | 4.3%), and Swedish (1,707 | 4.3%), together accounting for 55.6% of all Latah County residents.
| Ancestry | # Population | % Population |
| African | 57 | 0.1% |
| Alaska Native | 4 | 0.0% |
| Aleut | 16 | 0.0% |
| American | 1,721 | 4.3% |
| Arab | 319 | 0.8% |
| Armenian | 71 | 0.2% |
| Austrian | 101 | 0.3% |
| Basque | 85 | 0.2% |
| Belgian | 95 | 0.2% |
| Bhutanese | 193 | 0.5% |
| Blackfeet | 89 | 0.2% |
| Brazilian | 8 | 0.0% |
| British | 291 | 0.7% |
| Burmese | 230 | 0.6% |
| Cambodian | 5 | 0.0% |
| Canadian | 275 | 0.7% |
| Celtic | 12 | 0.0% |
| Central American | 134 | 0.3% |
| Cherokee | 128 | 0.3% |
| Chilean | 17 | 0.0% |
| Chippewa | 8 | 0.0% |
| Choctaw | 60 | 0.2% |
| Creek | 4 | 0.0% |
| Croatian | 126 | 0.3% |
| Cuban | 40 | 0.1% |
| Czech | 101 | 0.3% |
| Czechoslovakian | 37 | 0.1% |
| Danish | 440 | 1.1% |
| Dutch | 791 | 2.0% |
| Dutch West Indian | 5 | 0.0% |
| Eastern European | 94 | 0.2% |
| Ecuadorian | 58 | 0.2% |
| Egyptian | 83 | 0.2% |
| English | 5,955 | 14.9% |
| Ethiopian | 39 | 0.1% |
| European | 1,201 | 3.0% |
| Filipino | 23 | 0.1% |
| Finnish | 208 | 0.5% |
| French | 884 | 2.2% |
| French Canadian | 150 | 0.4% |
| German | 8,476 | 21.3% |
| Greek | 18 | 0.1% |
| Guamanian / Chamorro | 4 | 0.0% |
| Guatemalan | 15 | 0.0% |
| Haitian | 15 | 0.0% |
| Honduran | 42 | 0.1% |
| Hungarian | 66 | 0.2% |
| Icelander | 14 | 0.0% |
| Indian (Asian) | 307 | 0.8% |
| Inupiat | 89 | 0.2% |
| Iranian | 19 | 0.1% |
| Irish | 4,312 | 10.8% |
| Italian | 1,517 | 3.8% |
| Jordanian | 9 | 0.0% |
| Korean | 239 | 0.6% |
| Latvian | 33 | 0.1% |
| Lebanese | 83 | 0.2% |
| Lithuanian | 14 | 0.0% |
| Luxembourger | 5 | 0.0% |
| Malaysian | 63 | 0.2% |
| Menominee | 2 | 0.0% |
| Mexican | 1,114 | 2.8% |
| Mongolian | 17 | 0.0% |
| Native Hawaiian | 85 | 0.2% |
| Navajo | 3 | 0.0% |
| Northern European | 148 | 0.4% |
| Norwegian | 1,584 | 4.0% |
| Pakistani | 106 | 0.3% |
| Panamanian | 64 | 0.2% |
| Pennsylvania German | 13 | 0.0% |
| Peruvian | 37 | 0.1% |
| Polish | 690 | 1.7% |
| Portuguese | 141 | 0.4% |
| Potawatomi | 19 | 0.1% |
| Puerto Rican | 29 | 0.1% |
| Puget Sound Salish | 12 | 0.0% |
| Romanian | 46 | 0.1% |
| Russian | 287 | 0.7% |
| Salvadoran | 13 | 0.0% |
| Samoan | 64 | 0.2% |
| Scandinavian | 732 | 1.8% |
| Scotch-Irish | 711 | 1.8% |
| Scottish | 1,242 | 3.1% |
| Shoshone | 30 | 0.1% |
| Sioux | 24 | 0.1% |
| Slavic | 22 | 0.1% |
| Slovak | 9 | 0.0% |
| Slovene | 72 | 0.2% |
| South American | 124 | 0.3% |
| Spaniard | 281 | 0.7% |
| Spanish | 58 | 0.2% |
| Sri Lankan | 121 | 0.3% |
| Subsaharan African | 167 | 0.4% |
| Sudanese | 45 | 0.1% |
| Swedish | 1,707 | 4.3% |
| Swiss | 278 | 0.7% |
| Thai | 165 | 0.4% |
| Tlingit-Haida | 6 | 0.0% |
| Tongan | 3 | 0.0% |
| Turkish | 39 | 0.1% |
| Ukrainian | 87 | 0.2% |
| Uruguayan | 6 | 0.0% |
| Venezuelan | 6 | 0.0% |
| Welsh | 239 | 0.6% |
| Yakama | 39 | 0.1% |
| Yugoslavian | 18 | 0.1% | View All 106 Rows |
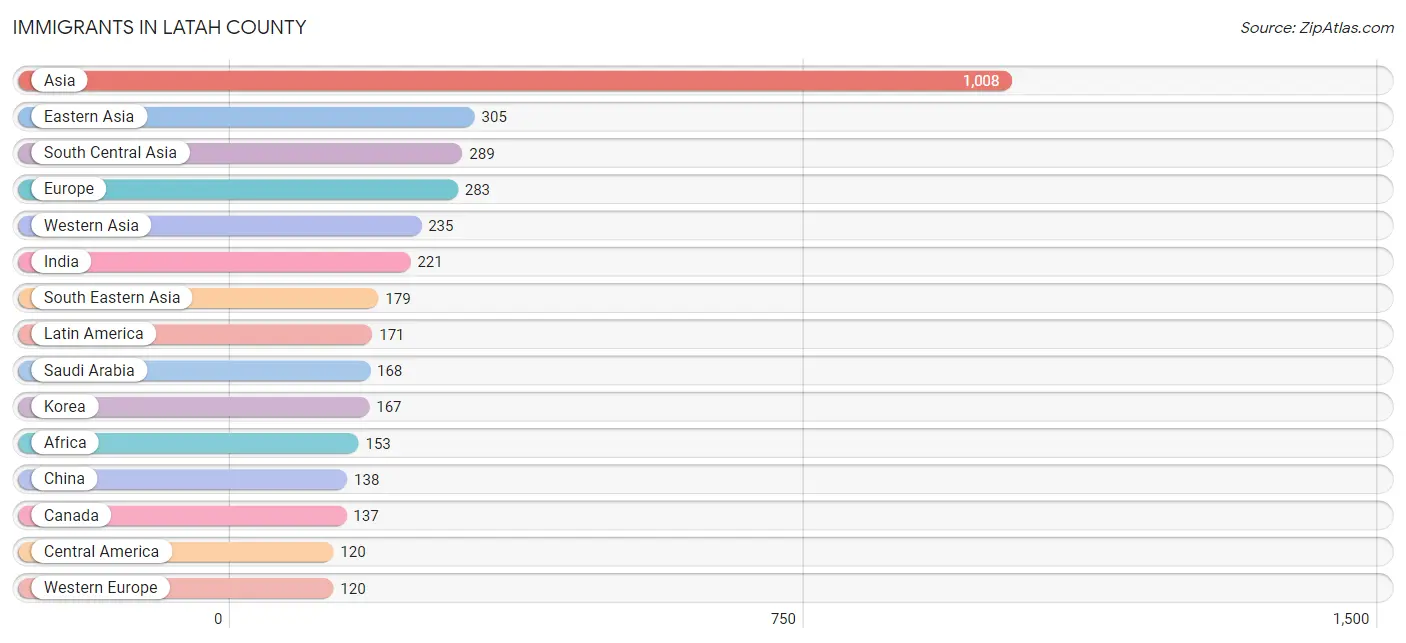
Immigrants in Latah County
The most numerous immigrant groups reported in Latah County came from Asia (1,008 | 2.5%), Eastern Asia (305 | 0.8%), South Central Asia (289 | 0.7%), Europe (283 | 0.7%), and Western Asia (235 | 0.6%), together accounting for 5.3% of all Latah County residents.
| Immigration Origin | # Population | % Population |
| Africa | 153 | 0.4% |
| Asia | 1,008 | 2.5% |
| Austria | 11 | 0.0% |
| Brazil | 40 | 0.1% |
| Canada | 137 | 0.3% |
| Caribbean | 5 | 0.0% |
| Central America | 120 | 0.3% |
| China | 138 | 0.4% |
| Congo | 15 | 0.0% |
| Eastern Africa | 44 | 0.1% |
| Eastern Asia | 305 | 0.8% |
| Eastern Europe | 66 | 0.2% |
| Ecuador | 6 | 0.0% |
| Egypt | 47 | 0.1% |
| England | 73 | 0.2% |
| Europe | 283 | 0.7% |
| France | 14 | 0.0% |
| Germany | 90 | 0.2% |
| Honduras | 18 | 0.1% |
| India | 221 | 0.5% |
| Iran | 19 | 0.1% |
| Italy | 16 | 0.0% |
| Jordan | 9 | 0.0% |
| Korea | 167 | 0.4% |
| Kuwait | 58 | 0.2% |
| Latin America | 171 | 0.4% |
| Mexico | 95 | 0.2% |
| Middle Africa | 15 | 0.0% |
| Nepal | 49 | 0.1% |
| Netherlands | 5 | 0.0% |
| Northern Africa | 94 | 0.2% |
| Northern Europe | 81 | 0.2% |
| Oceania | 2 | 0.0% |
| Panama | 7 | 0.0% |
| Philippines | 34 | 0.1% |
| Romania | 6 | 0.0% |
| Russia | 55 | 0.1% |
| Saudi Arabia | 168 | 0.4% |
| South America | 46 | 0.1% |
| South Central Asia | 289 | 0.7% |
| South Eastern Asia | 179 | 0.4% |
| Southern Europe | 16 | 0.0% |
| Sudan | 45 | 0.1% |
| Taiwan | 23 | 0.1% |
| Thailand | 88 | 0.2% |
| Trinidad and Tobago | 5 | 0.0% |
| Ukraine | 5 | 0.0% |
| Vietnam | 57 | 0.1% |
| Western Asia | 235 | 0.6% |
| Western Europe | 120 | 0.3% | View All 50 Rows |
Sex and Age in Latah County
Sex and Age in Latah County
The most populous age groups in Latah County are 20 to 24 Years (3,049 | 14.9%) for men and 15 to 19 Years (2,626 | 13.6%) for women.
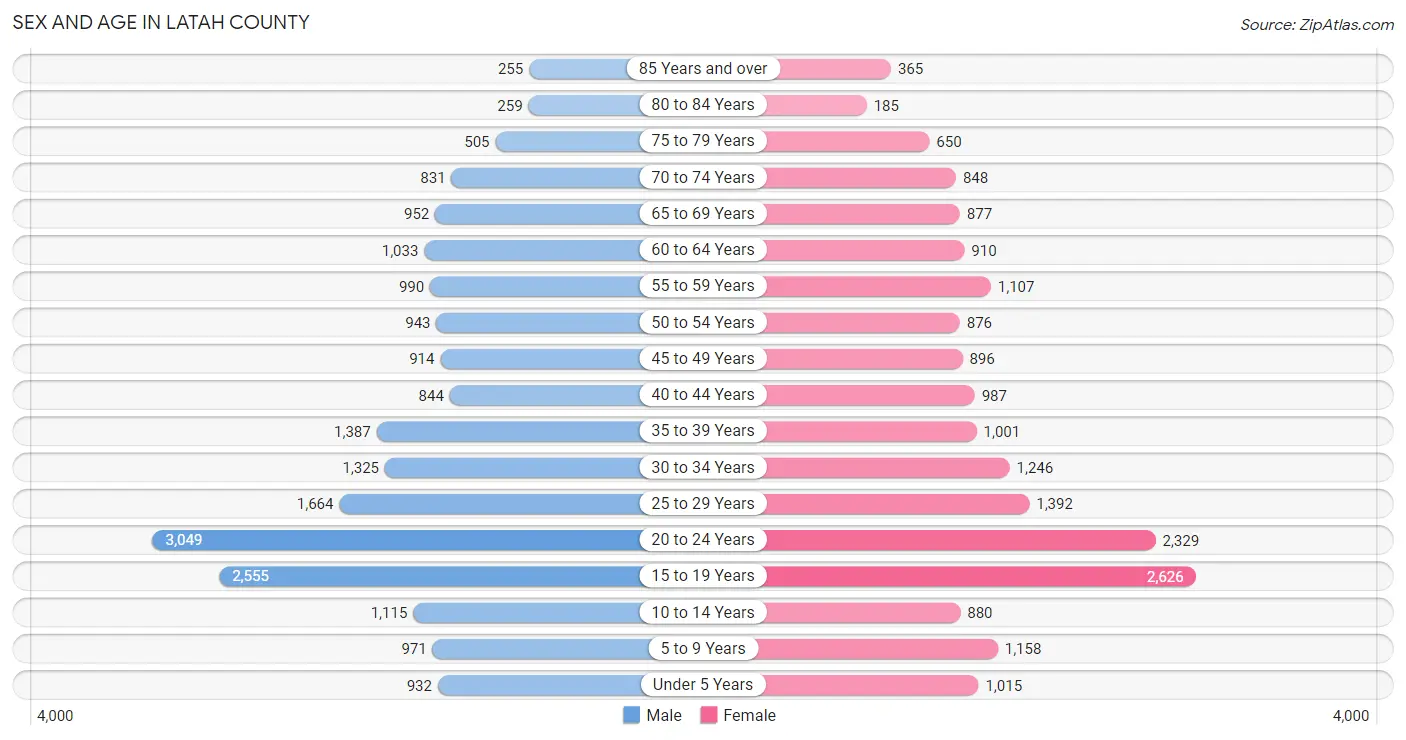
| Age Bracket | Male | Female |
| Under 5 Years | 932 (4.5%) | 1,015 (5.2%) |
| 5 to 9 Years | 971 (4.7%) | 1,158 (6.0%) |
| 10 to 14 Years | 1,115 (5.4%) | 880 (4.5%) |
| 15 to 19 Years | 2,555 (12.4%) | 2,626 (13.6%) |
| 20 to 24 Years | 3,049 (14.9%) | 2,329 (12.0%) |
| 25 to 29 Years | 1,664 (8.1%) | 1,392 (7.2%) |
| 30 to 34 Years | 1,325 (6.5%) | 1,246 (6.4%) |
| 35 to 39 Years | 1,387 (6.8%) | 1,001 (5.2%) |
| 40 to 44 Years | 844 (4.1%) | 987 (5.1%) |
| 45 to 49 Years | 914 (4.4%) | 896 (4.6%) |
| 50 to 54 Years | 943 (4.6%) | 876 (4.5%) |
| 55 to 59 Years | 990 (4.8%) | 1,107 (5.7%) |
| 60 to 64 Years | 1,033 (5.0%) | 910 (4.7%) |
| 65 to 69 Years | 952 (4.6%) | 877 (4.5%) |
| 70 to 74 Years | 831 (4.1%) | 848 (4.4%) |
| 75 to 79 Years | 505 (2.5%) | 650 (3.4%) |
| 80 to 84 Years | 259 (1.3%) | 185 (1.0%) |
| 85 Years and over | 255 (1.2%) | 365 (1.9%) |
| Total | 20,524 (100.0%) | 19,348 (100.0%) |
Families and Households in Latah County
Median Family Size in Latah County
The median family size in Latah County is 2.72 persons per family, with married-couple families (7,539 | 83.4%) accounting for the largest median family size of 2.81 persons per family. On the other hand, single male/father families (519 | 5.7%) represent the smallest median family size with 2.07 persons per family.
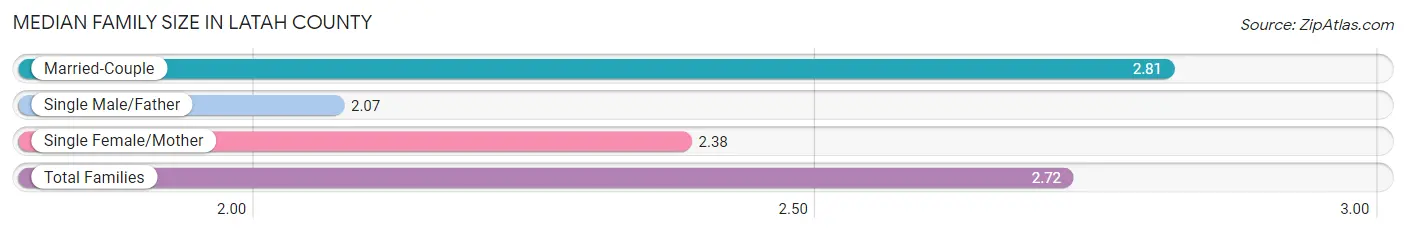
| Family Type | # Families | Family Size |
| Married-Couple | 7,539 (83.4%) | 2.81 |
| Single Male/Father | 519 (5.7%) | 2.07 |
| Single Female/Mother | 981 (10.8%) | 2.38 |
| Total Families | 9,039 (100.0%) | 2.72 |
Median Household Size in Latah County
The median household size in Latah County is 2.14 persons per household, with married-couple households (7,539 | 47.3%) accounting for the largest median household size of 2.82 persons per household. non-family households (6,890 | 43.2%) represent the smallest median household size with 1.31 persons per household.
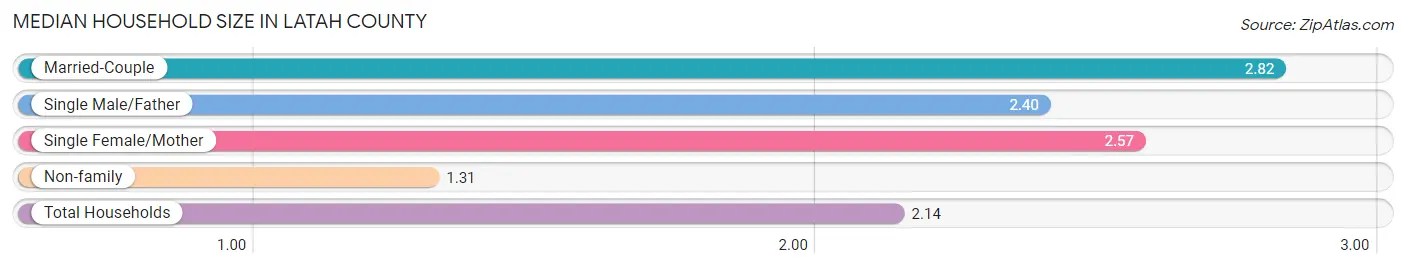
| Household Type | # Households | Household Size |
| Married-Couple | 7,539 (47.3%) | 2.82 |
| Single Male/Father | 519 (3.3%) | 2.40 |
| Single Female/Mother | 981 (6.2%) | 2.57 |
| Non-family | 6,890 (43.2%) | 1.31 |
| Total Households | 15,929 (100.0%) | 2.14 |
Household Size by Marriage Status in Latah County
Out of a total of 15,929 households in Latah County, 9,039 (56.8%) are family households, while 6,890 (43.2%) are nonfamily households. The most numerous type of family households are 2-person households, comprising 4,382, and the most common type of nonfamily households are 1-person households, comprising 4,553.

| Household Size | Family Households | Nonfamily Households |
| 1-Person Households | - | 4,553 (28.6%) |
| 2-Person Households | 4,382 (27.5%) | 1,694 (10.6%) |
| 3-Person Households | 2,180 (13.7%) | 399 (2.5%) |
| 4-Person Households | 1,310 (8.2%) | 85 (0.5%) |
| 5-Person Households | 798 (5.0%) | 137 (0.9%) |
| 6-Person Households | 142 (0.9%) | 0 (0.0%) |
| 7+ Person Households | 227 (1.4%) | 22 (0.1%) |
| Total | 9,039 (56.8%) | 6,890 (43.2%) |
Female Fertility in Latah County
Fertility by Age in Latah County
Average fertility rate in Latah County is 40.0 births per 1,000 women. Women in the age bracket of 20 to 34 years have the highest fertility rate with 81.0 births per 1,000 women. Women in the age bracket of 20 to 34 years acount for 93.3% of all women with births.
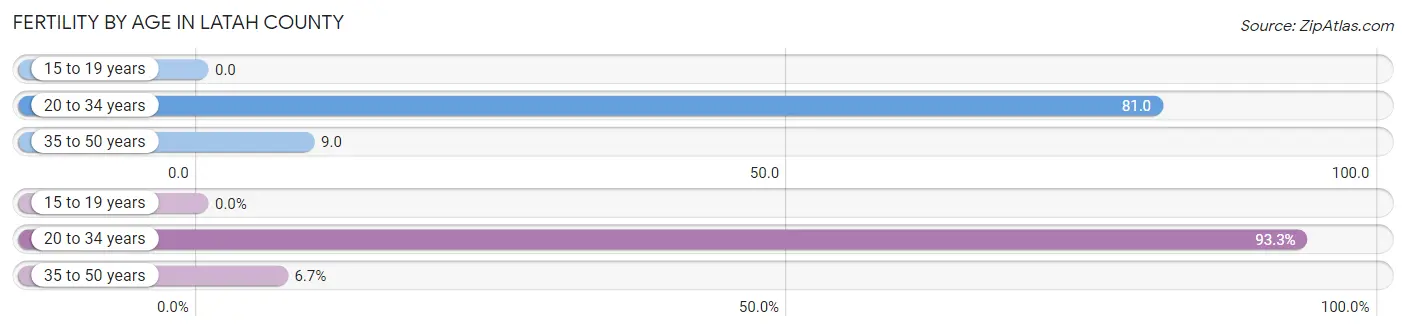
| Age Bracket | Women with Births | Births / 1,000 Women |
| 15 to 19 years | 0 (0.0%) | 0.0 |
| 20 to 34 years | 401 (93.3%) | 81.0 |
| 35 to 50 years | 29 (6.7%) | 9.0 |
| Total | 430 (100.0%) | 40.0 |
Fertility by Age by Marriage Status in Latah County
98.8% of women with births (430) in Latah County are married. The highest percentage of unmarried women with births falls into 20 to 34 years age bracket with 1.3% of them unmarried at the time of birth, while the lowest percentage of unmarried women with births belong to 35 to 50 years age bracket with 0.0% of them unmarried.
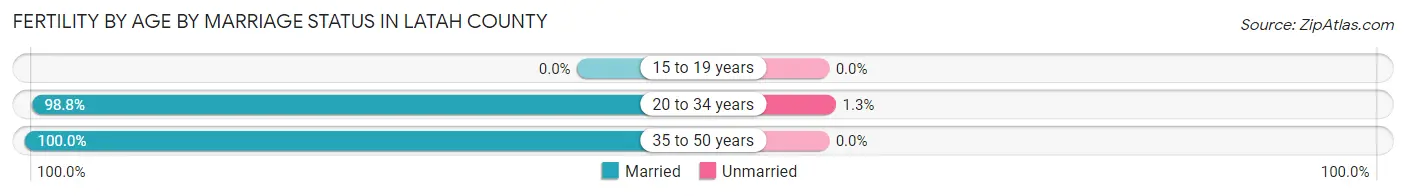
| Age Bracket | Married | Unmarried |
| 15 to 19 years | 0 (0.0%) | 0 (0.0%) |
| 20 to 34 years | 396 (98.8%) | 5 (1.3%) |
| 35 to 50 years | 29 (100.0%) | 0 (0.0%) |
| Total | 425 (98.8%) | 5 (1.2%) |
Fertility by Education in Latah County
Average fertility rate in Latah County is 40.0 births per 1,000 women. Women with the education attainment of bachelor's degree have the highest fertility rate of 69.0 births per 1,000 women, while women with the education attainment of high school diploma have the lowest fertility at 12.0 births per 1,000 women. Women with the education attainment of bachelor's degree represent 42.6% of all women with births.
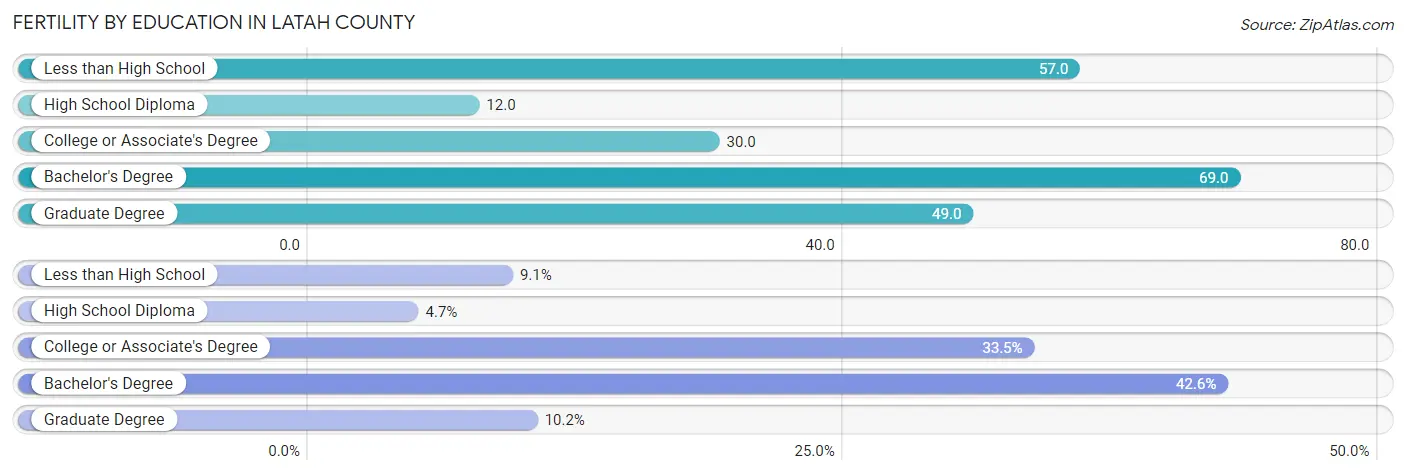
| Educational Attainment | Women with Births | Births / 1,000 Women |
| Less than High School | 39 (9.1%) | 57.0 |
| High School Diploma | 20 (4.6%) | 12.0 |
| College or Associate's Degree | 144 (33.5%) | 30.0 |
| Bachelor's Degree | 183 (42.6%) | 69.0 |
| Graduate Degree | 44 (10.2%) | 49.0 |
| Total | 430 (100.0%) | 40.0 |
Fertility by Education by Marriage Status in Latah County
1.2% of women with births in Latah County are unmarried. Women with the educational attainment of less than high school are most likely to be married with 100.0% of them married at childbirth, while women with the educational attainment of bachelor's degree are least likely to be married with 2.2% of them unmarried at childbirth.
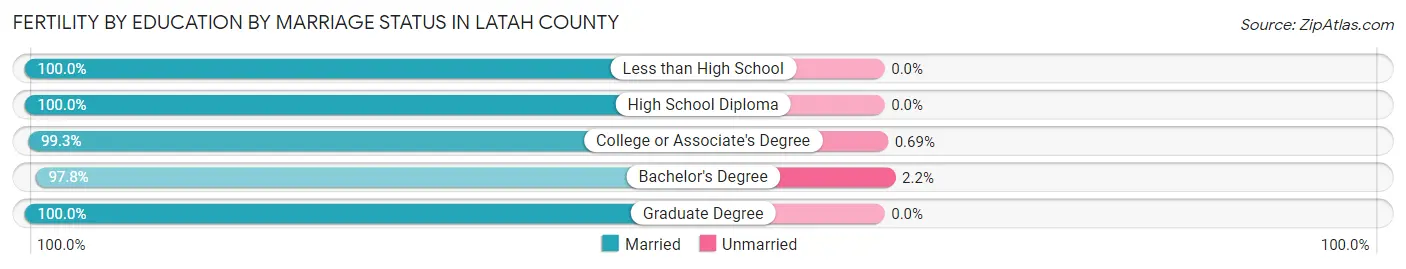
| Educational Attainment | Married | Unmarried |
| Less than High School | 39 (100.0%) | 0 (0.0%) |
| High School Diploma | 20 (100.0%) | 0 (0.0%) |
| College or Associate's Degree | 143 (99.3%) | 1 (0.7%) |
| Bachelor's Degree | 179 (97.8%) | 4 (2.2%) |
| Graduate Degree | 44 (100.0%) | 0 (0.0%) |
| Total | 425 (98.8%) | 5 (1.2%) |
Income in Latah County
Income Overview in Latah County
Per Capita Income in Latah County is $33,342, while median incomes of families and households are $86,186 and $62,258 respectively.
| Characteristic | Number | Measure |
| Per Capita Income | 39,872 | $33,342 |
| Median Family Income | 9,039 | $86,186 |
| Mean Family Income | 9,039 | $108,314 |
| Median Household Income | 15,929 | $62,258 |
| Mean Household Income | 15,929 | $82,919 |
| Income Deficit | 9,039 | $9,396 |
| Wage / Income Gap (%) | 39,872 | 34.45% |
| Wage / Income Gap ($) | 39,872 | 65.55¢ per $1 |
| Gini / Inequality Index | 39,872 | 0.46 |
Earnings by Sex in Latah County
Average Earnings in Latah County are $27,361, $32,479 for men and $21,291 for women, a difference of 34.4%.
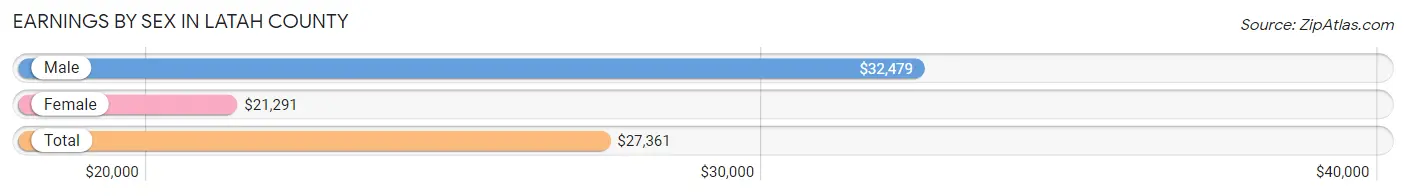
| Sex | Number | Average Earnings |
| Male | 13,519 (54.9%) | $32,479 |
| Female | 11,088 (45.1%) | $21,291 |
| Total | 24,607 (100.0%) | $27,361 |
Earnings by Sex by Income Bracket in Latah County
The most common earnings brackets in Latah County are $100,000+ for men (1,525 | 11.3%) and $2,499 or less for women (1,278 | 11.5%).
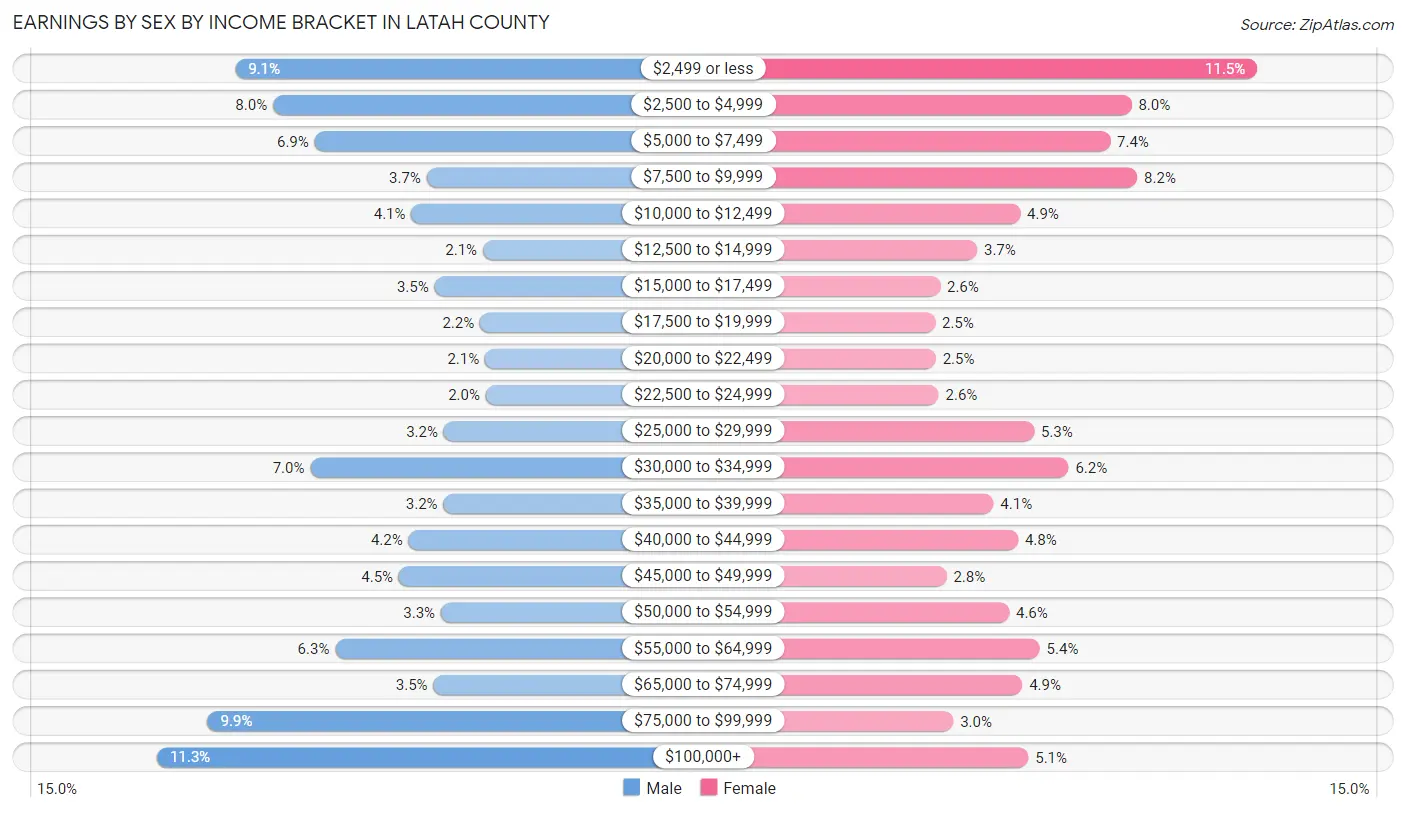
| Income | Male | Female |
| $2,499 or less | 1,227 (9.1%) | 1,278 (11.5%) |
| $2,500 to $4,999 | 1,084 (8.0%) | 887 (8.0%) |
| $5,000 to $7,499 | 926 (6.9%) | 820 (7.4%) |
| $7,500 to $9,999 | 500 (3.7%) | 905 (8.2%) |
| $10,000 to $12,499 | 559 (4.1%) | 540 (4.9%) |
| $12,500 to $14,999 | 286 (2.1%) | 406 (3.7%) |
| $15,000 to $17,499 | 470 (3.5%) | 290 (2.6%) |
| $17,500 to $19,999 | 298 (2.2%) | 275 (2.5%) |
| $20,000 to $22,499 | 279 (2.1%) | 277 (2.5%) |
| $22,500 to $24,999 | 276 (2.0%) | 286 (2.6%) |
| $25,000 to $29,999 | 435 (3.2%) | 583 (5.3%) |
| $30,000 to $34,999 | 942 (7.0%) | 691 (6.2%) |
| $35,000 to $39,999 | 437 (3.2%) | 457 (4.1%) |
| $40,000 to $44,999 | 569 (4.2%) | 533 (4.8%) |
| $45,000 to $49,999 | 605 (4.5%) | 310 (2.8%) |
| $50,000 to $54,999 | 446 (3.3%) | 506 (4.6%) |
| $55,000 to $64,999 | 848 (6.3%) | 601 (5.4%) |
| $65,000 to $74,999 | 474 (3.5%) | 547 (4.9%) |
| $75,000 to $99,999 | 1,333 (9.9%) | 331 (3.0%) |
| $100,000+ | 1,525 (11.3%) | 565 (5.1%) |
| Total | 13,519 (100.0%) | 11,088 (100.0%) |
Earnings by Sex by Educational Attainment in Latah County
Average earnings in Latah County are $51,153 for men and $37,597 for women, a difference of 26.5%. Men with an educational attainment of bachelor's degree enjoy the highest average annual earnings of $76,429, while those with less than high school education earn the least with $34,149. Women with an educational attainment of graduate degree earn the most with the average annual earnings of $48,494, while those with less than high school education have the smallest earnings of $21,250.
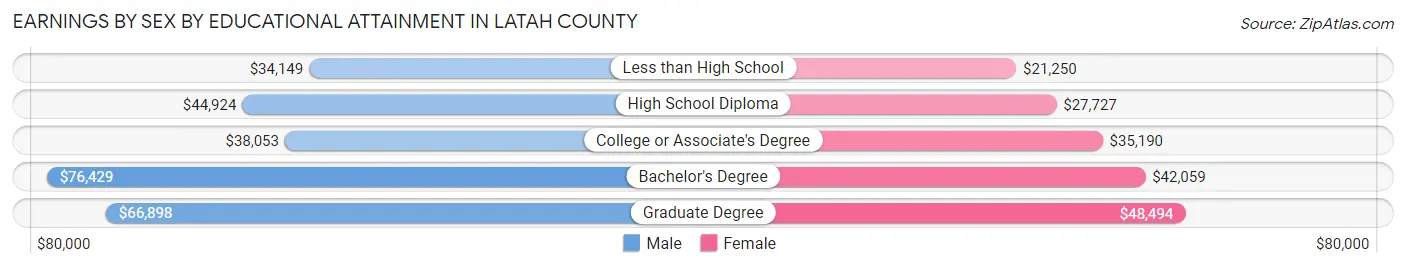
| Educational Attainment | Male Income | Female Income |
| Less than High School | $34,149 | $21,250 |
| High School Diploma | $44,924 | $27,727 |
| College or Associate's Degree | $38,053 | $35,190 |
| Bachelor's Degree | $76,429 | $42,059 |
| Graduate Degree | $66,898 | $48,494 |
| Total | $51,153 | $37,597 |
Family Income in Latah County
Family Income Brackets in Latah County
According to the Latah County family income data, there are 1,790 families falling into the $100,000 to $149,999 income range, which is the most common income bracket and makes up 19.8% of all families. Conversely, the $10,000 to $14,999 income bracket is the least frequent group with only 127 families (1.4%) belonging to this category.
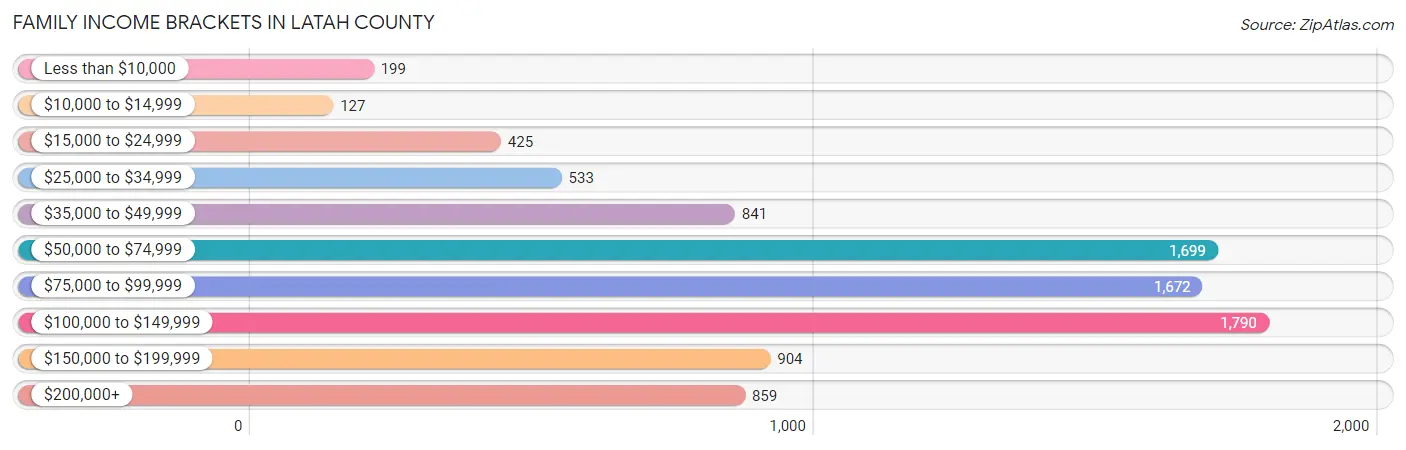
| Income Bracket | # Families | % Families |
| Less than $10,000 | 199 | 2.2% |
| $10,000 to $14,999 | 127 | 1.4% |
| $15,000 to $24,999 | 425 | 4.7% |
| $25,000 to $34,999 | 533 | 5.9% |
| $35,000 to $49,999 | 841 | 9.3% |
| $50,000 to $74,999 | 1,699 | 18.8% |
| $75,000 to $99,999 | 1,672 | 18.5% |
| $100,000 to $149,999 | 1,790 | 19.8% |
| $150,000 to $199,999 | 904 | 10.0% |
| $200,000+ | 859 | 9.5% |
Family Income by Famaliy Size in Latah County
6-person families (153 | 1.7%) account for the highest median family income in Latah County with $124,148 per family, while 2-person families (4,538 | 50.2%) have the highest median income of $38,062 per family member.
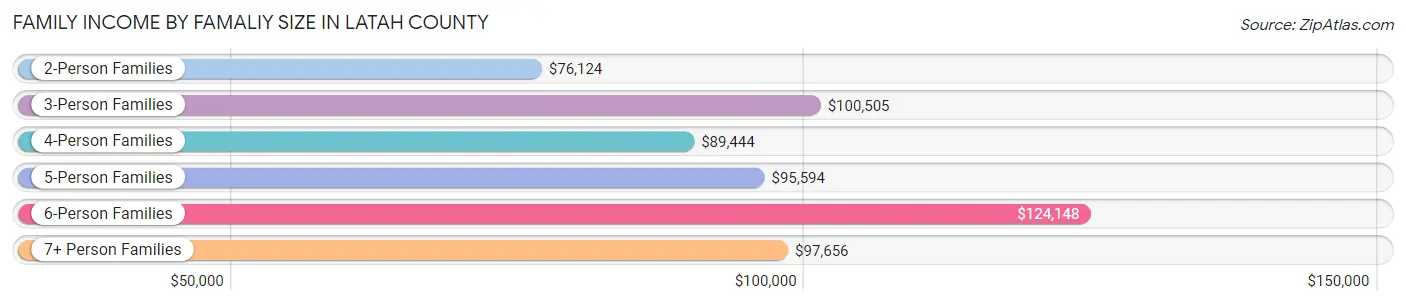
| Income Bracket | # Families | Median Income |
| 2-Person Families | 4,538 (50.2%) | $76,124 |
| 3-Person Families | 2,209 (24.4%) | $100,505 |
| 4-Person Families | 1,230 (13.6%) | $89,444 |
| 5-Person Families | 730 (8.1%) | $95,594 |
| 6-Person Families | 153 (1.7%) | $124,148 |
| 7+ Person Families | 179 (2.0%) | $97,656 |
| Total | 9,039 (100.0%) | $86,186 |
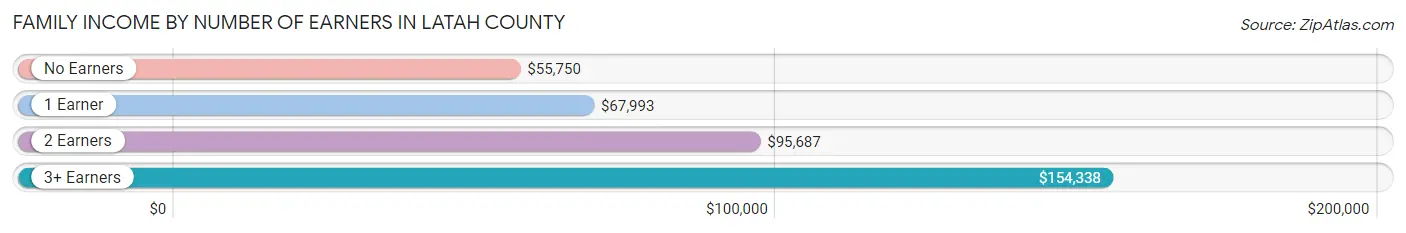
Family Income by Number of Earners in Latah County
The median family income in Latah County is $86,186, with families comprising 3+ earners (703) having the highest median family income of $154,338, while families with no earners (1,426) have the lowest median family income of $55,750, accounting for 7.8% and 15.8% of families, respectively.
| Number of Earners | # Families | Median Income |
| No Earners | 1,426 (15.8%) | $55,750 |
| 1 Earner | 2,693 (29.8%) | $67,993 |
| 2 Earners | 4,217 (46.7%) | $95,687 |
| 3+ Earners | 703 (7.8%) | $154,338 |
| Total | 9,039 (100.0%) | $86,186 |
Household Income in Latah County
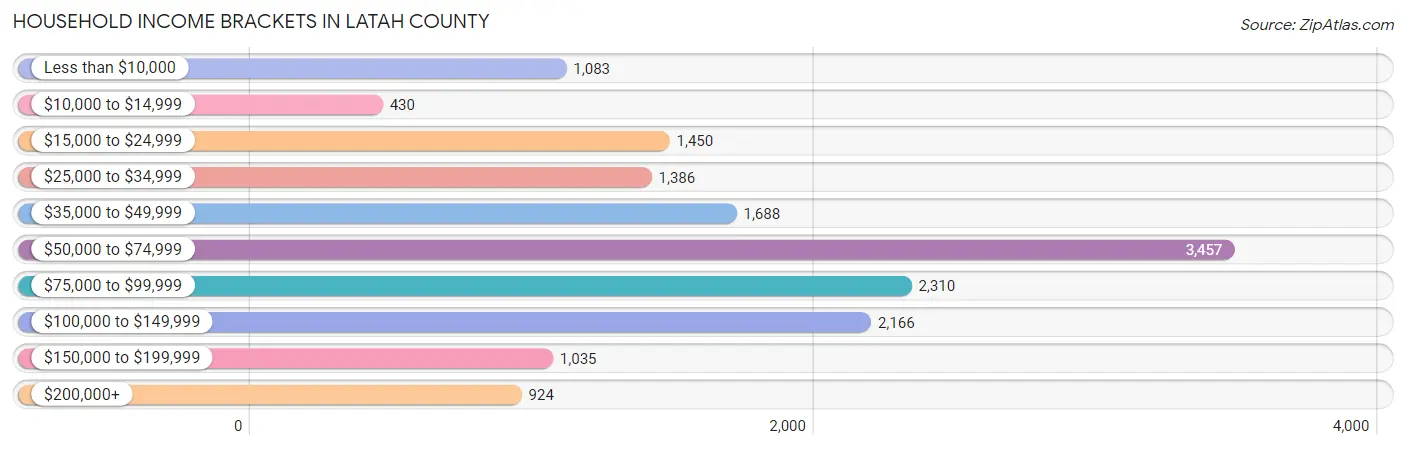
Household Income Brackets in Latah County
With 3,457 households falling in the category, the $50,000 to $74,999 income range is the most frequent in Latah County, accounting for 21.7% of all households. In contrast, only 430 households (2.7%) fall into the $10,000 to $14,999 income bracket, making it the least populous group.
| Income Bracket | # Households | % Households |
| Less than $10,000 | 1,083 | 6.8% |
| $10,000 to $14,999 | 430 | 2.7% |
| $15,000 to $24,999 | 1,450 | 9.1% |
| $25,000 to $34,999 | 1,386 | 8.7% |
| $35,000 to $49,999 | 1,688 | 10.6% |
| $50,000 to $74,999 | 3,457 | 21.7% |
| $75,000 to $99,999 | 2,310 | 14.5% |
| $100,000 to $149,999 | 2,166 | 13.6% |
| $150,000 to $199,999 | 1,035 | 6.5% |
| $200,000+ | 924 | 5.8% |
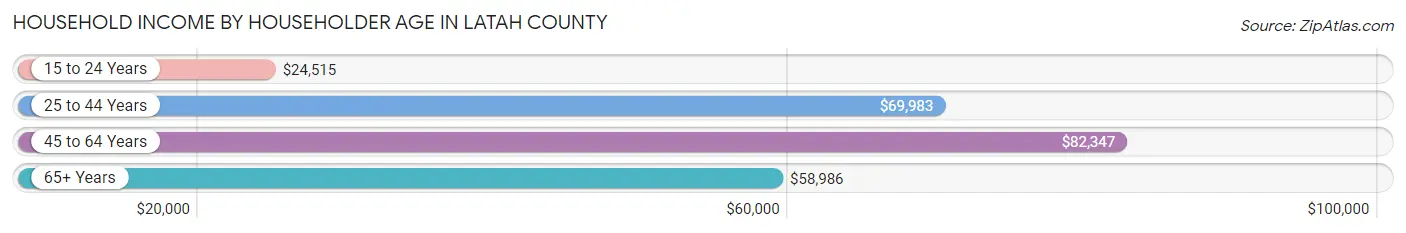
Household Income by Householder Age in Latah County
The median household income in Latah County is $62,258, with the highest median household income of $82,347 found in the 45 to 64 years age bracket for the primary householder. A total of 4,647 households (29.2%) fall into this category. Meanwhile, the 15 to 24 years age bracket for the primary householder has the lowest median household income of $24,515, with 2,228 households (14.0%) in this group.
| Income Bracket | # Households | Median Income |
| 15 to 24 Years | 2,228 (14.0%) | $24,515 |
| 25 to 44 Years | 5,426 (34.1%) | $69,983 |
| 45 to 64 Years | 4,647 (29.2%) | $82,347 |
| 65+ Years | 3,628 (22.8%) | $58,986 |
| Total | 15,929 (100.0%) | $62,258 |
Poverty in Latah County
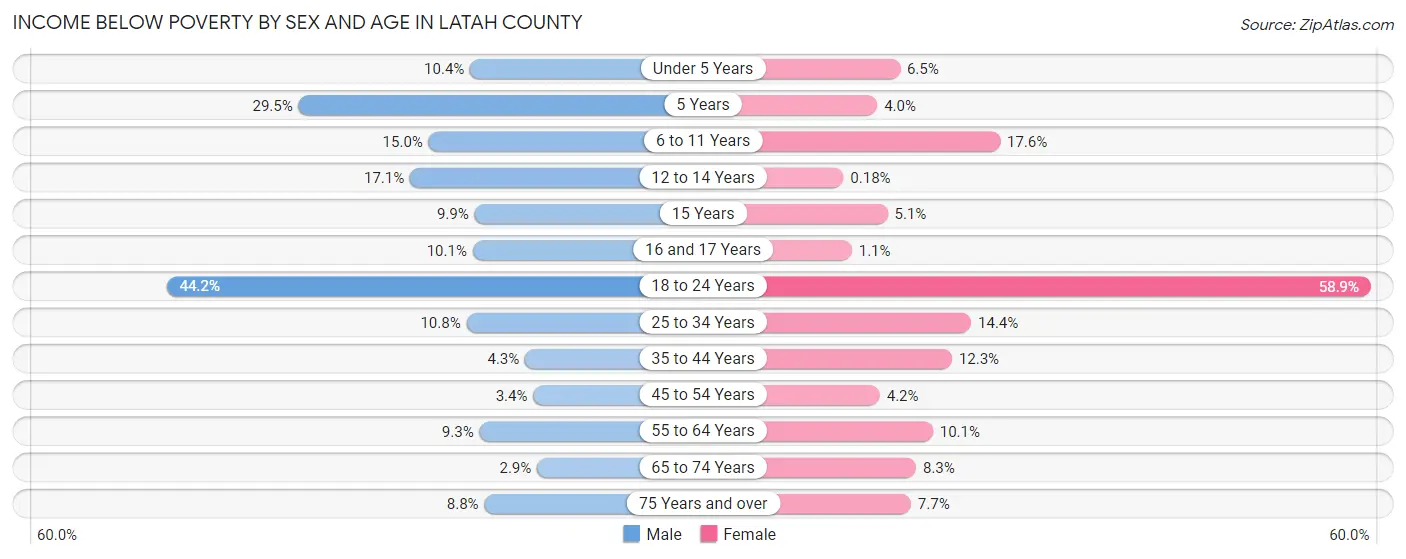
Income Below Poverty by Sex and Age in Latah County
With 13.1% poverty level for males and 14.9% for females among the residents of Latah County, 18 to 24 year old males and 18 to 24 year old females are the most vulnerable to poverty, with 1,007 males (44.2%) and 1,030 females (58.9%) in their respective age groups living below the poverty level.
| Age Bracket | Male | Female |
| Under 5 Years | 87 (10.4%) | 65 (6.5%) |
| 5 Years | 46 (29.5%) | 12 (4.0%) |
| 6 to 11 Years | 198 (15.0%) | 207 (17.6%) |
| 12 to 14 Years | 99 (17.1%) | 1 (0.2%) |
| 15 Years | 18 (9.9%) | 13 (5.1%) |
| 16 and 17 Years | 45 (10.1%) | 3 (1.1%) |
| 18 to 24 Years | 1,007 (44.2%) | 1,030 (58.9%) |
| 25 to 34 Years | 321 (10.8%) | 366 (14.4%) |
| 35 to 44 Years | 95 (4.3%) | 243 (12.3%) |
| 45 to 54 Years | 62 (3.4%) | 75 (4.2%) |
| 55 to 64 Years | 189 (9.3%) | 204 (10.1%) |
| 65 to 74 Years | 51 (2.9%) | 141 (8.3%) |
| 75 Years and over | 87 (8.8%) | 86 (7.7%) |
| Total | 2,305 (13.1%) | 2,446 (14.9%) |
Income Above Poverty by Sex and Age in Latah County
According to the poverty statistics in Latah County, males aged 65 to 74 years and females aged 12 to 14 years are the age groups that are most secure financially, with 97.1% of males and 99.8% of females in these age groups living above the poverty line.
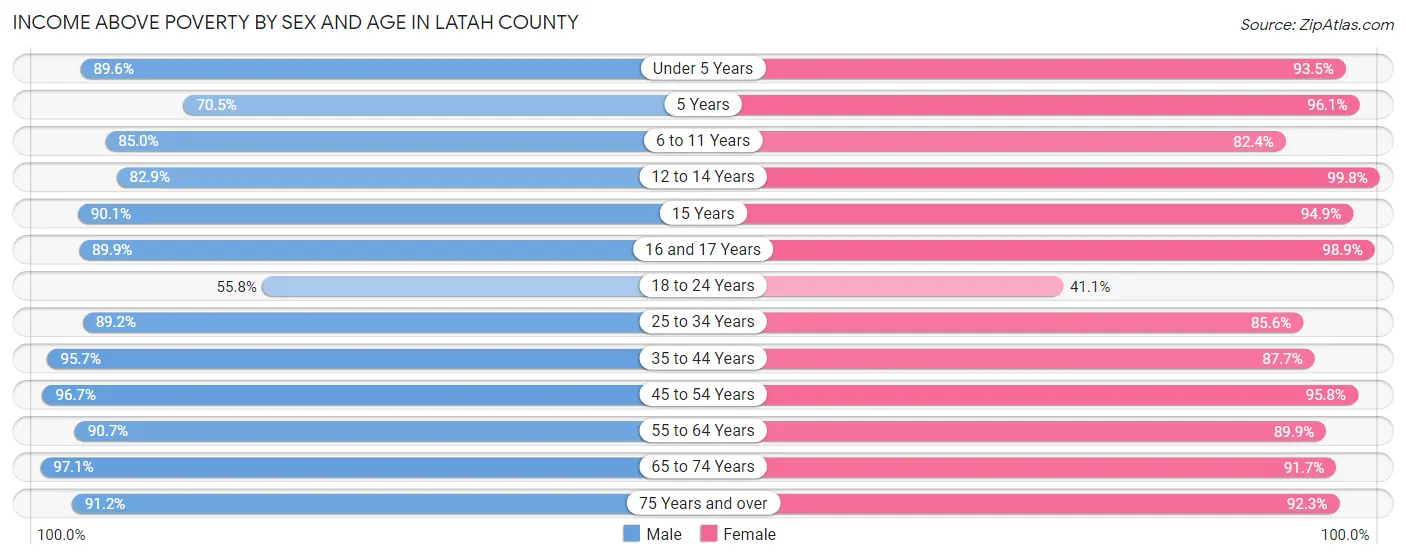
| Age Bracket | Male | Female |
| Under 5 Years | 751 (89.6%) | 938 (93.5%) |
| 5 Years | 110 (70.5%) | 292 (96.1%) |
| 6 to 11 Years | 1,122 (85.0%) | 968 (82.4%) |
| 12 to 14 Years | 481 (82.9%) | 541 (99.8%) |
| 15 Years | 164 (90.1%) | 242 (94.9%) |
| 16 and 17 Years | 401 (89.9%) | 268 (98.9%) |
| 18 to 24 Years | 1,272 (55.8%) | 718 (41.1%) |
| 25 to 34 Years | 2,655 (89.2%) | 2,176 (85.6%) |
| 35 to 44 Years | 2,136 (95.7%) | 1,738 (87.7%) |
| 45 to 54 Years | 1,790 (96.7%) | 1,697 (95.8%) |
| 55 to 64 Years | 1,834 (90.7%) | 1,810 (89.9%) |
| 65 to 74 Years | 1,695 (97.1%) | 1,564 (91.7%) |
| 75 Years and over | 903 (91.2%) | 1,031 (92.3%) |
| Total | 15,314 (86.9%) | 13,983 (85.1%) |
Income Below Poverty Among Married-Couple Families in Latah County
The poverty statistics for married-couple families in Latah County show that 3.4% or 254 of the total 7,539 families live below the poverty line. Families with 1 or 2 children have the highest poverty rate of 6.2%, comprising of 131 families. On the other hand, families with 5 or more children have the lowest poverty rate of 0.0%, which includes 0 families.
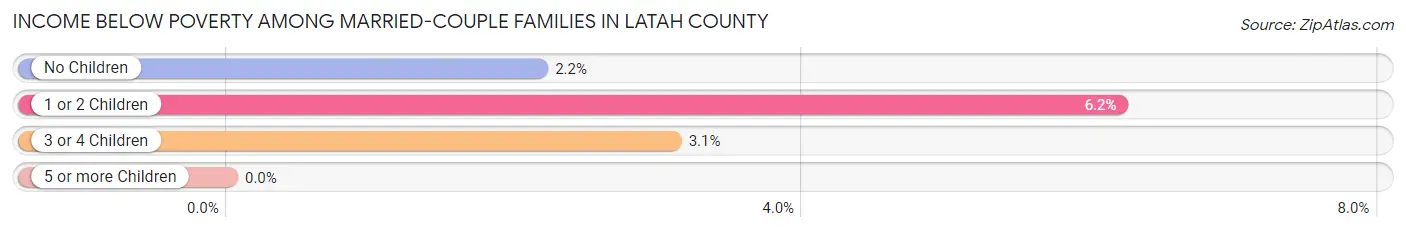
| Children | Above Poverty | Below Poverty |
| No Children | 4,385 (97.8%) | 97 (2.2%) |
| 1 or 2 Children | 1,981 (93.8%) | 131 (6.2%) |
| 3 or 4 Children | 815 (96.9%) | 26 (3.1%) |
| 5 or more Children | 104 (100.0%) | 0 (0.0%) |
| Total | 7,285 (96.6%) | 254 (3.4%) |
Income Below Poverty Among Single-Parent Households in Latah County
According to the poverty data in Latah County, 18.3% or 95 single-father households and 32.2% or 316 single-mother households are living below the poverty line. Among single-father households, those with no children have the highest poverty rate, with 57 households (22.3%) experiencing poverty. Likewise, among single-mother households, those with 5 or more children have the highest poverty rate, with 5 households (100.0%) falling below the poverty line.
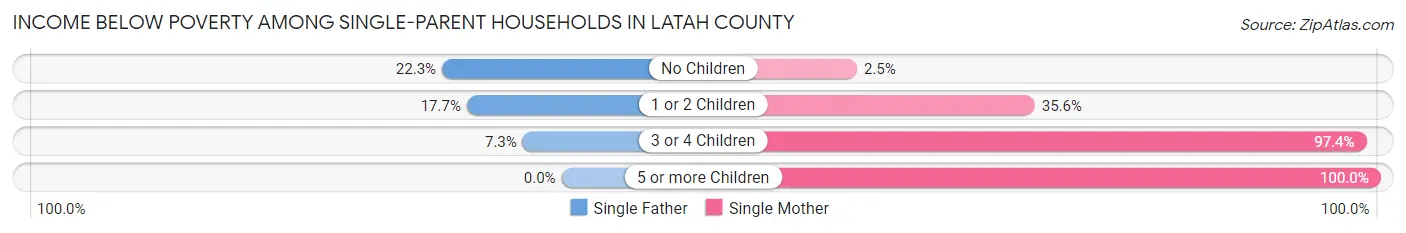
| Children | Single Father | Single Mother |
| No Children | 57 (22.3%) | 8 (2.5%) |
| 1 or 2 Children | 33 (17.6%) | 193 (35.6%) |
| 3 or 4 Children | 5 (7.2%) | 110 (97.4%) |
| 5 or more Children | 0 (0.0%) | 5 (100.0%) |
| Total | 95 (18.3%) | 316 (32.2%) |
Income Below Poverty Among Married-Couple vs Single-Parent Households in Latah County
The poverty data for Latah County shows that 254 of the married-couple family households (3.4%) and 411 of the single-parent households (27.4%) are living below the poverty level. Within the married-couple family households, those with 1 or 2 children have the highest poverty rate, with 131 households (6.2%) falling below the poverty line. Among the single-parent households, those with 3 or 4 children have the highest poverty rate, with 115 household (63.2%) living below poverty.
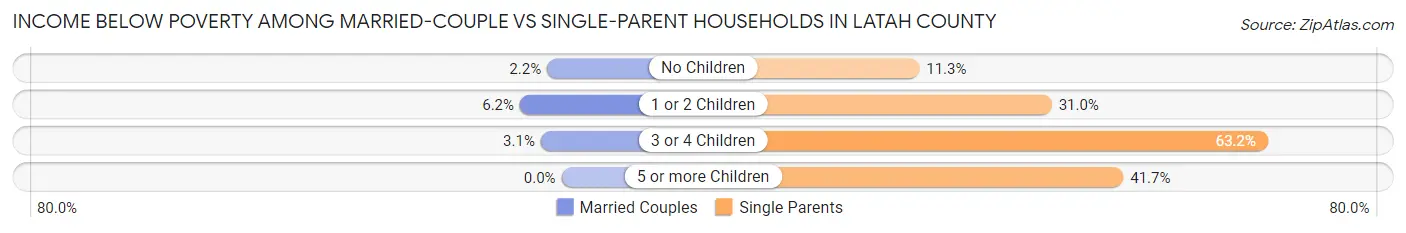
| Children | Married-Couple Families | Single-Parent Households |
| No Children | 97 (2.2%) | 65 (11.3%) |
| 1 or 2 Children | 131 (6.2%) | 226 (31.0%) |
| 3 or 4 Children | 26 (3.1%) | 115 (63.2%) |
| 5 or more Children | 0 (0.0%) | 5 (41.7%) |
| Total | 254 (3.4%) | 411 (27.4%) |
Employment Characteristics in Latah County
Employment by Class of Employer in Latah County
Among the 18,879 employed individuals in Latah County, private company employees (10,481 | 55.5%), state government employees (3,620 | 19.2%), and not-for-profit organizations (1,271 | 6.7%) make up the most common classes of employment.

| Employer Class | # Employees | % Employees |
| Private Company Employees | 10,481 | 55.5% |
| Self-Employed (Incorporated) | 652 | 3.5% |
| Self-Employed (Not Incorporated) | 1,084 | 5.7% |
| Not-for-profit Organizations | 1,271 | 6.7% |
| Local Government Employees | 1,248 | 6.6% |
| State Government Employees | 3,620 | 19.2% |
| Federal Government Employees | 506 | 2.7% |
| Unpaid Family Workers | 17 | 0.1% |
| Total | 18,879 | 100.0% |
Employment Status by Age in Latah County
According to the labor force statistics for Latah County, out of the total population over 16 years of age (33,364), 61.3% or 20,452 individuals are in the labor force, with 5.3% or 1,084 of them unemployed. The age group with the highest labor force participation rate is 35 to 44 years, with 89.2% or 3,763 individuals in the labor force. Within the labor force, the 75 years and over age range has the highest percentage of unemployed individuals, with 18.6% or 30 of them being unemployed.

| Age Bracket | In Labor Force | Unemployed |
| 16 to 19 Years | 2,244 (47.3%) | 348 (15.5%) |
| 20 to 24 Years | 3,410 (63.4%) | 290 (8.5%) |
| 25 to 29 Years | 2,237 (73.2%) | 174 (7.8%) |
| 30 to 34 Years | 2,085 (81.1%) | 13 (0.6%) |
| 35 to 44 Years | 3,763 (89.2%) | 19 (0.5%) |
| 45 to 54 Years | 3,037 (83.7%) | 112 (3.7%) |
| 55 to 59 Years | 1,489 (71.0%) | 13 (0.9%) |
| 60 to 64 Years | 1,150 (59.2%) | 55 (4.8%) |
| 65 to 74 Years | 888 (25.3%) | 25 (2.8%) |
| 75 Years and over | 162 (7.3%) | 30 (18.6%) |
| Total | 20,452 (61.3%) | 1,084 (5.3%) |
Employment Status by Educational Attainment in Latah County
According to labor force statistics for Latah County, 78.6% of individuals (13,767) out of the total population between 25 and 64 years of age (17,515) are in the labor force, with 2.8% or 385 of them being unemployed. The group with the highest labor force participation rate are those with the educational attainment of bachelor's degree or higher, with 82.6% or 6,490 individuals in the labor force. Within the labor force, individuals with college / associate degree education have the highest percentage of unemployment, with 5.9% or 261 of them being unemployed.

| Educational Attainment | In Labor Force | Unemployed |
| Less than High School | 320 (61.5%) | 7 (1.3%) |
| High School Diploma | 2,525 (73.8%) | 31 (0.9%) |
| College / Associate Degree | 4,430 (77.5%) | 337 (5.9%) |
| Bachelor's Degree or higher | 6,490 (82.6%) | 118 (1.5%) |
| Total | 13,767 (78.6%) | 490 (2.8%) |
Employment Occupations by Sex in Latah County
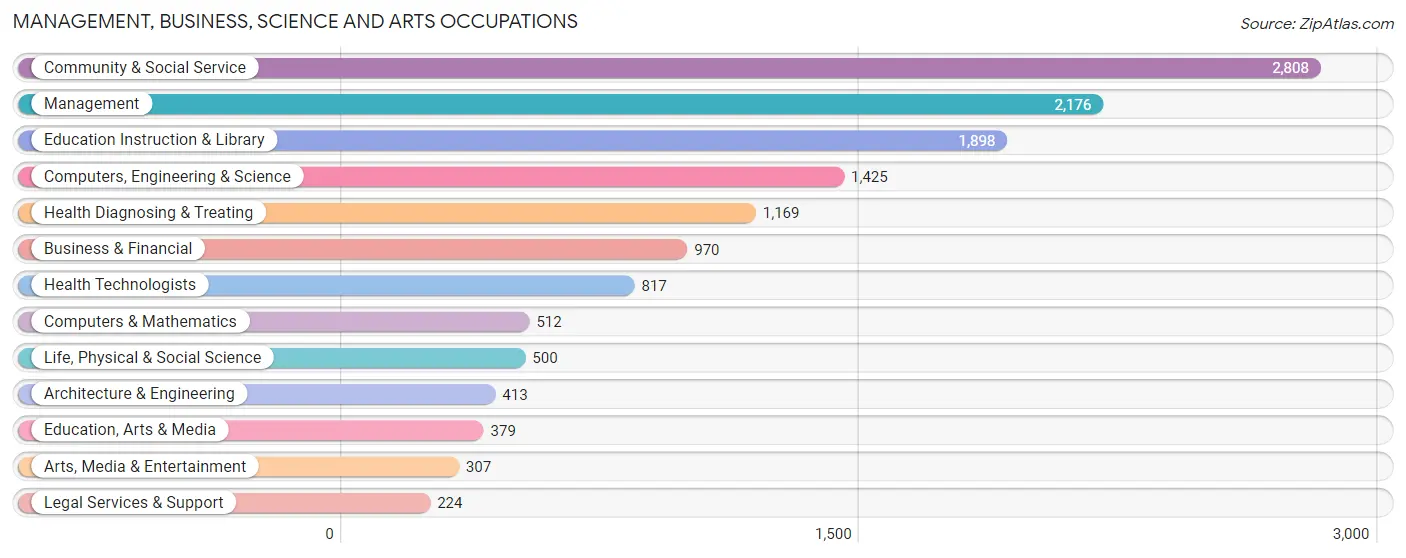
Management, Business, Science and Arts Occupations
The most common Management, Business, Science and Arts occupations in Latah County are Community & Social Service (2,808 | 14.5%), Management (2,176 | 11.3%), Education Instruction & Library (1,898 | 9.8%), Computers, Engineering & Science (1,425 | 7.4%), and Health Diagnosing & Treating (1,169 | 6.0%).
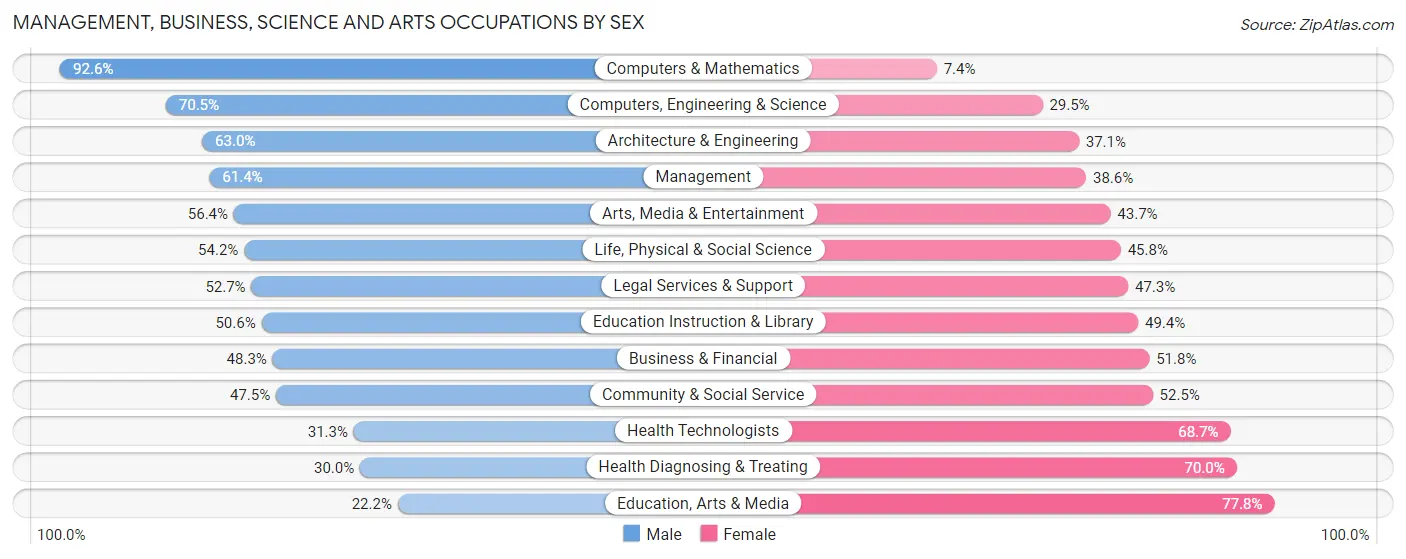
Management, Business, Science and Arts Occupations by Sex
Within the Management, Business, Science and Arts occupations in Latah County, the most male-oriented occupations are Computers & Mathematics (92.6%), Computers, Engineering & Science (70.5%), and Architecture & Engineering (62.9%), while the most female-oriented occupations are Education, Arts & Media (77.8%), Health Diagnosing & Treating (70.0%), and Health Technologists (68.7%).
| Occupation | Male | Female |
| Management | 1,337 (61.4%) | 839 (38.6%) |
| Business & Financial | 468 (48.2%) | 502 (51.7%) |
| Computers, Engineering & Science | 1,005 (70.5%) | 420 (29.5%) |
| Computers & Mathematics | 474 (92.6%) | 38 (7.4%) |
| Architecture & Engineering | 260 (62.9%) | 153 (37.0%) |
| Life, Physical & Social Science | 271 (54.2%) | 229 (45.8%) |
| Community & Social Service | 1,335 (47.5%) | 1,473 (52.5%) |
| Education, Arts & Media | 84 (22.2%) | 295 (77.8%) |
| Legal Services & Support | 118 (52.7%) | 106 (47.3%) |
| Education Instruction & Library | 960 (50.6%) | 938 (49.4%) |
| Arts, Media & Entertainment | 173 (56.4%) | 134 (43.6%) |
| Health Diagnosing & Treating | 351 (30.0%) | 818 (70.0%) |
| Health Technologists | 256 (31.3%) | 561 (68.7%) |
| Total (Category) | 4,496 (52.6%) | 4,052 (47.4%) |
| Total (Overall) | 10,476 (54.2%) | 8,868 (45.8%) |
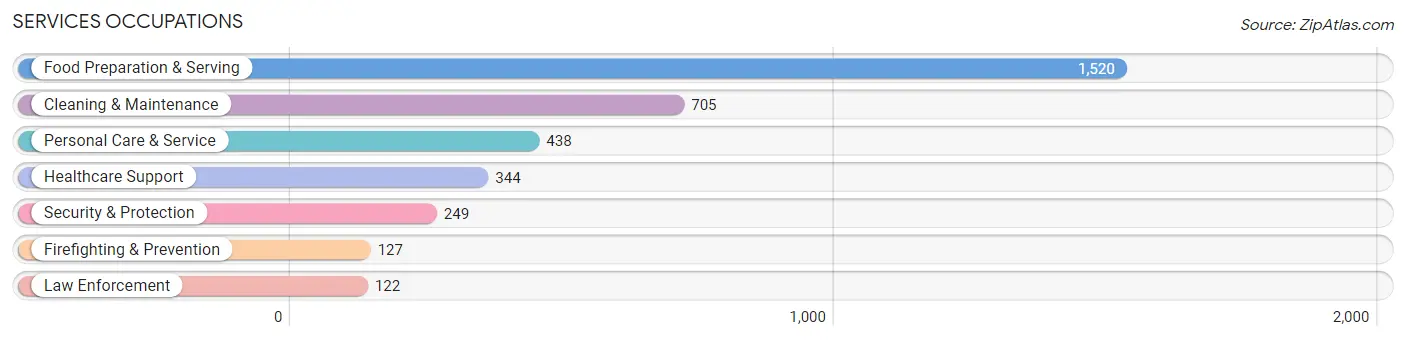
Services Occupations
The most common Services occupations in Latah County are Food Preparation & Serving (1,520 | 7.9%), Cleaning & Maintenance (705 | 3.6%), Personal Care & Service (438 | 2.3%), Healthcare Support (344 | 1.8%), and Security & Protection (249 | 1.3%).
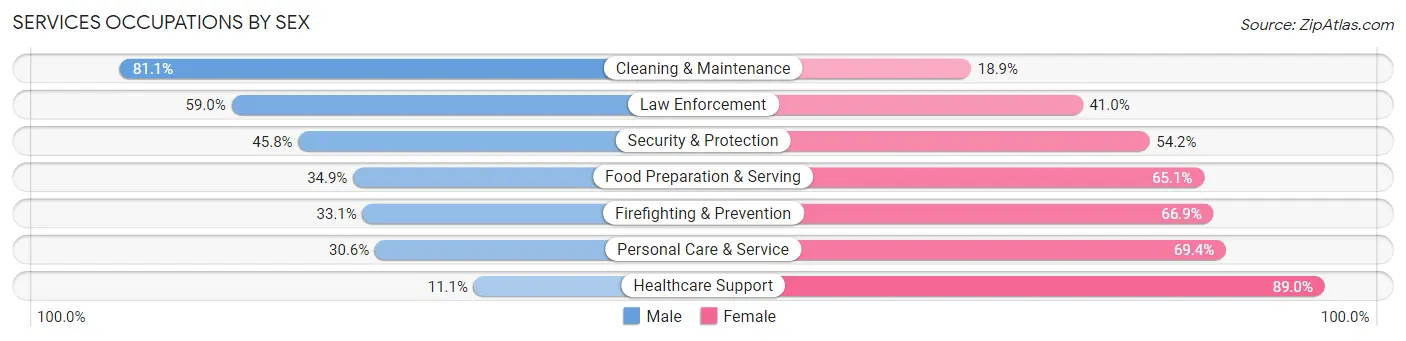
Services Occupations by Sex
Within the Services occupations in Latah County, the most male-oriented occupations are Cleaning & Maintenance (81.1%), Law Enforcement (59.0%), and Security & Protection (45.8%), while the most female-oriented occupations are Healthcare Support (88.9%), Personal Care & Service (69.4%), and Firefighting & Prevention (66.9%).
| Occupation | Male | Female |
| Healthcare Support | 38 (11.1%) | 306 (88.9%) |
| Security & Protection | 114 (45.8%) | 135 (54.2%) |
| Firefighting & Prevention | 42 (33.1%) | 85 (66.9%) |
| Law Enforcement | 72 (59.0%) | 50 (41.0%) |
| Food Preparation & Serving | 531 (34.9%) | 989 (65.1%) |
| Cleaning & Maintenance | 572 (81.1%) | 133 (18.9%) |
| Personal Care & Service | 134 (30.6%) | 304 (69.4%) |
| Total (Category) | 1,389 (42.7%) | 1,867 (57.3%) |
| Total (Overall) | 10,476 (54.2%) | 8,868 (45.8%) |
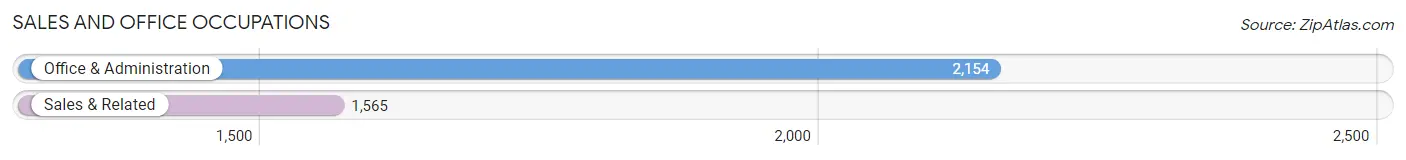
Sales and Office Occupations
The most common Sales and Office occupations in Latah County are Office & Administration (2,154 | 11.1%), and Sales & Related (1,565 | 8.1%).
Sales and Office Occupations by Sex
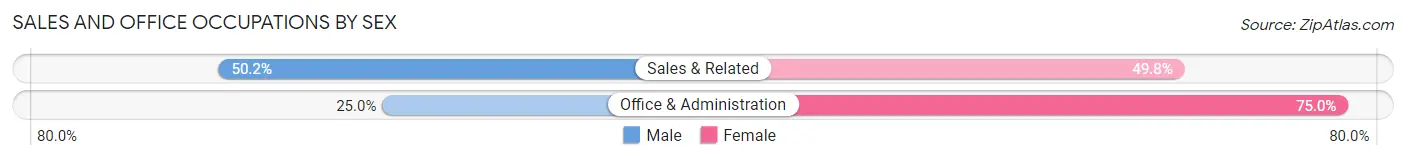
| Occupation | Male | Female |
| Sales & Related | 785 (50.2%) | 780 (49.8%) |
| Office & Administration | 538 (25.0%) | 1,616 (75.0%) |
| Total (Category) | 1,323 (35.6%) | 2,396 (64.4%) |
| Total (Overall) | 10,476 (54.2%) | 8,868 (45.8%) |
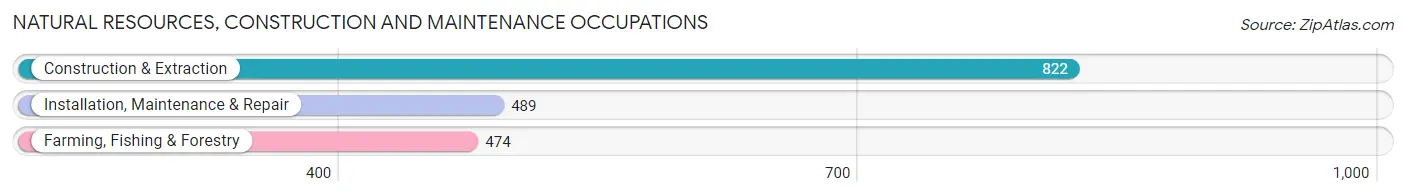
Natural Resources, Construction and Maintenance Occupations
The most common Natural Resources, Construction and Maintenance occupations in Latah County are Construction & Extraction (822 | 4.3%), Installation, Maintenance & Repair (489 | 2.5%), and Farming, Fishing & Forestry (474 | 2.5%).
Natural Resources, Construction and Maintenance Occupations by Sex
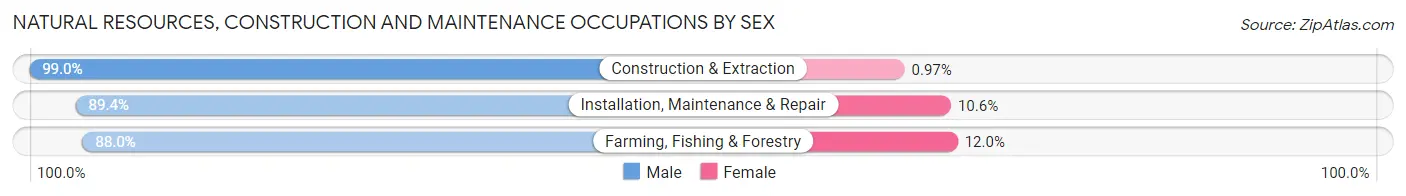
| Occupation | Male | Female |
| Farming, Fishing & Forestry | 417 (88.0%) | 57 (12.0%) |
| Construction & Extraction | 814 (99.0%) | 8 (1.0%) |
| Installation, Maintenance & Repair | 437 (89.4%) | 52 (10.6%) |
| Total (Category) | 1,668 (93.4%) | 117 (6.6%) |
| Total (Overall) | 10,476 (54.2%) | 8,868 (45.8%) |
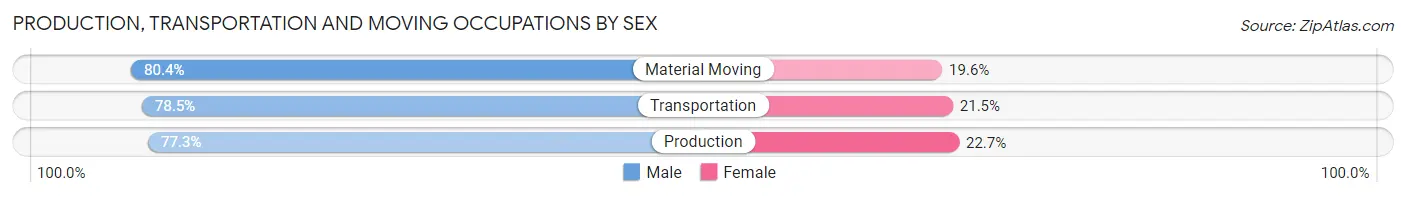
Production, Transportation and Moving Occupations
The most common Production, Transportation and Moving occupations in Latah County are Production (984 | 5.1%), Material Moving (685 | 3.5%), and Transportation (367 | 1.9%).

Production, Transportation and Moving Occupations by Sex
| Occupation | Male | Female |
| Production | 761 (77.3%) | 223 (22.7%) |
| Transportation | 288 (78.5%) | 79 (21.5%) |
| Material Moving | 551 (80.4%) | 134 (19.6%) |
| Total (Category) | 1,600 (78.6%) | 436 (21.4%) |
| Total (Overall) | 10,476 (54.2%) | 8,868 (45.8%) |
Employment Industries by Sex in Latah County
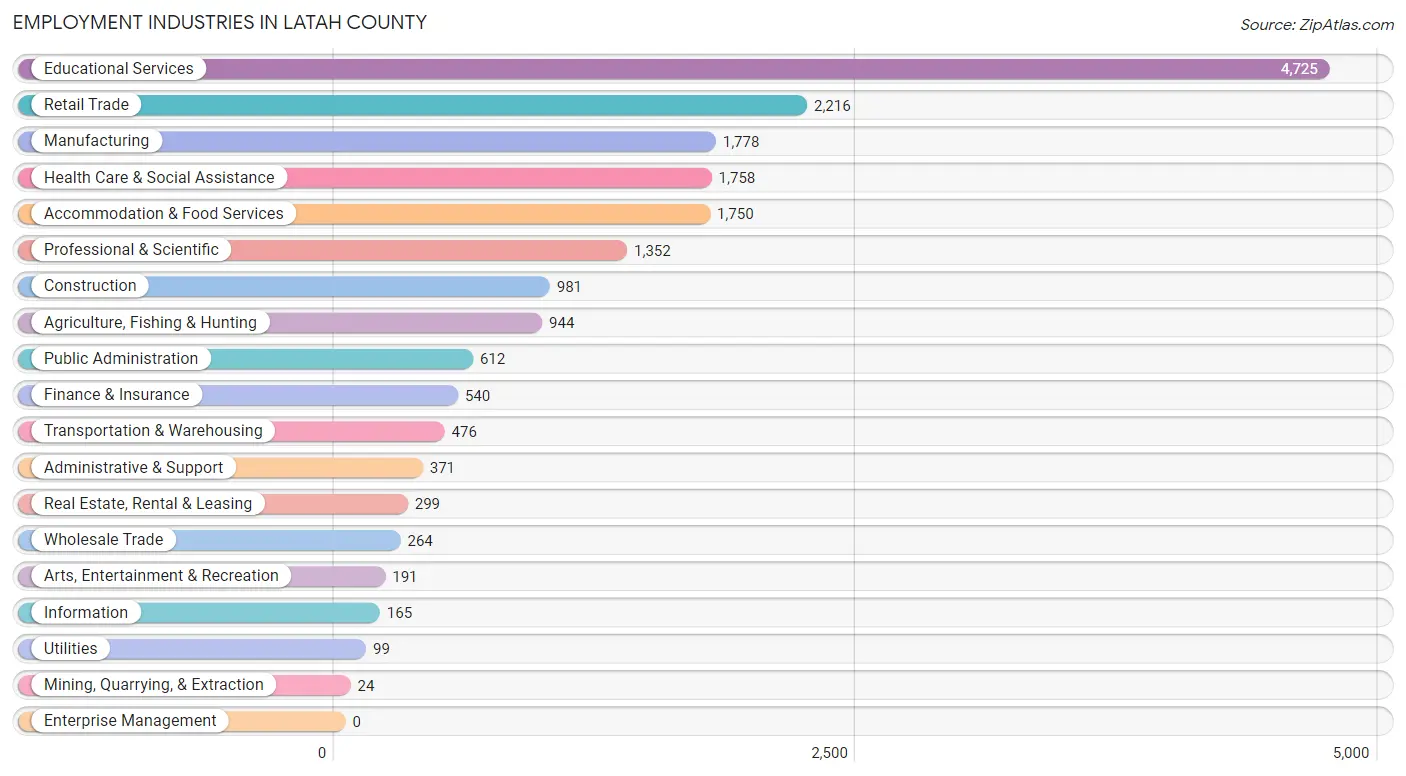
Employment Industries in Latah County
The major employment industries in Latah County include Educational Services (4,725 | 24.4%), Retail Trade (2,216 | 11.5%), Manufacturing (1,778 | 9.2%), Health Care & Social Assistance (1,758 | 9.1%), and Accommodation & Food Services (1,750 | 9.0%).
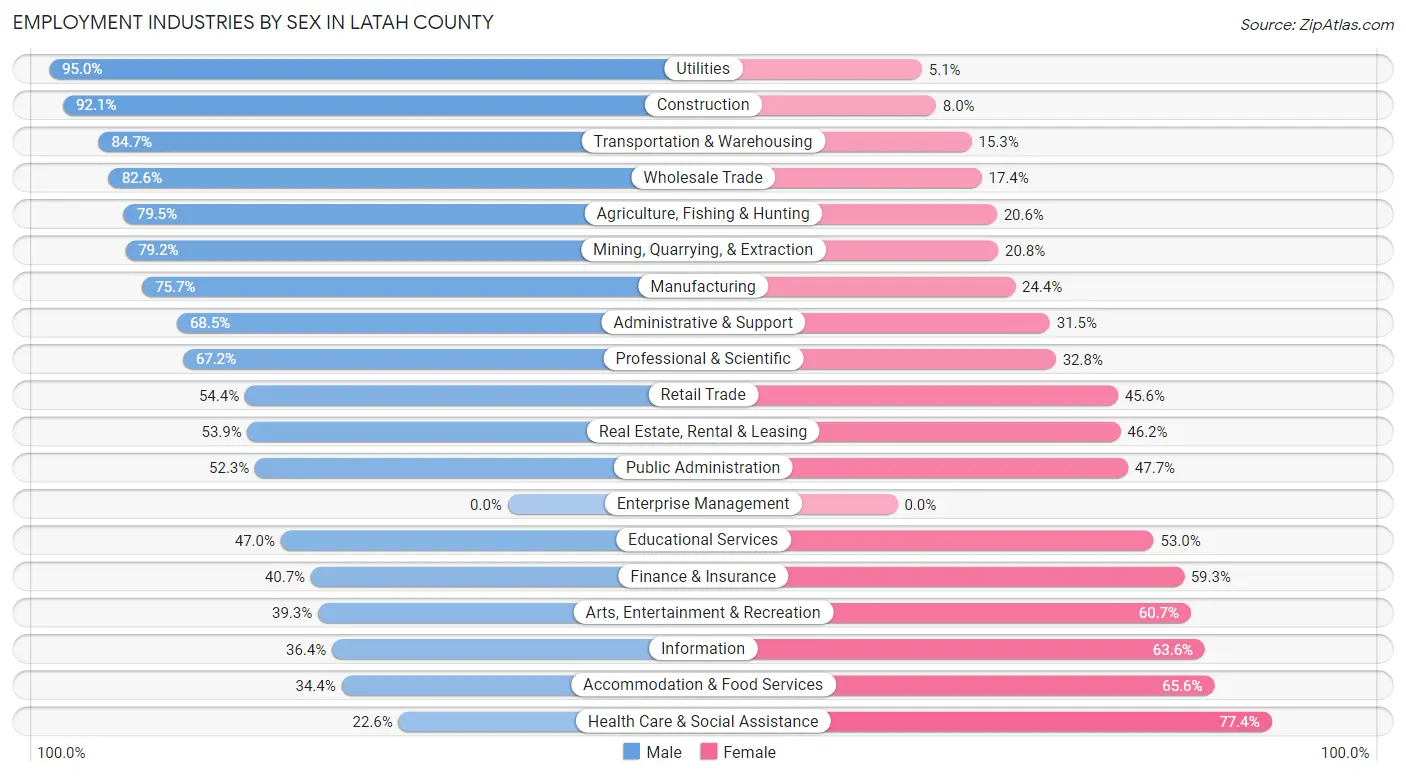
Employment Industries by Sex in Latah County
The Latah County industries that see more men than women are Utilities (95.0%), Construction (92.0%), and Transportation & Warehousing (84.7%), whereas the industries that tend to have a higher number of women are Health Care & Social Assistance (77.4%), Accommodation & Food Services (65.6%), and Information (63.6%).
| Industry | Male | Female |
| Agriculture, Fishing & Hunting | 750 (79.4%) | 194 (20.5%) |
| Mining, Quarrying, & Extraction | 19 (79.2%) | 5 (20.8%) |
| Construction | 903 (92.0%) | 78 (8.0%) |
| Manufacturing | 1,345 (75.6%) | 433 (24.3%) |
| Wholesale Trade | 218 (82.6%) | 46 (17.4%) |
| Retail Trade | 1,205 (54.4%) | 1,011 (45.6%) |
| Transportation & Warehousing | 403 (84.7%) | 73 (15.3%) |
| Utilities | 94 (95.0%) | 5 (5.1%) |
| Information | 60 (36.4%) | 105 (63.6%) |
| Finance & Insurance | 220 (40.7%) | 320 (59.3%) |
| Real Estate, Rental & Leasing | 161 (53.8%) | 138 (46.2%) |
| Professional & Scientific | 909 (67.2%) | 443 (32.8%) |
| Enterprise Management | 0 (0.0%) | 0 (0.0%) |
| Administrative & Support | 254 (68.5%) | 117 (31.5%) |
| Educational Services | 2,220 (47.0%) | 2,505 (53.0%) |
| Health Care & Social Assistance | 397 (22.6%) | 1,361 (77.4%) |
| Arts, Entertainment & Recreation | 75 (39.3%) | 116 (60.7%) |
| Accommodation & Food Services | 602 (34.4%) | 1,148 (65.6%) |
| Public Administration | 320 (52.3%) | 292 (47.7%) |
| Total | 10,476 (54.2%) | 8,868 (45.8%) |
Education in Latah County
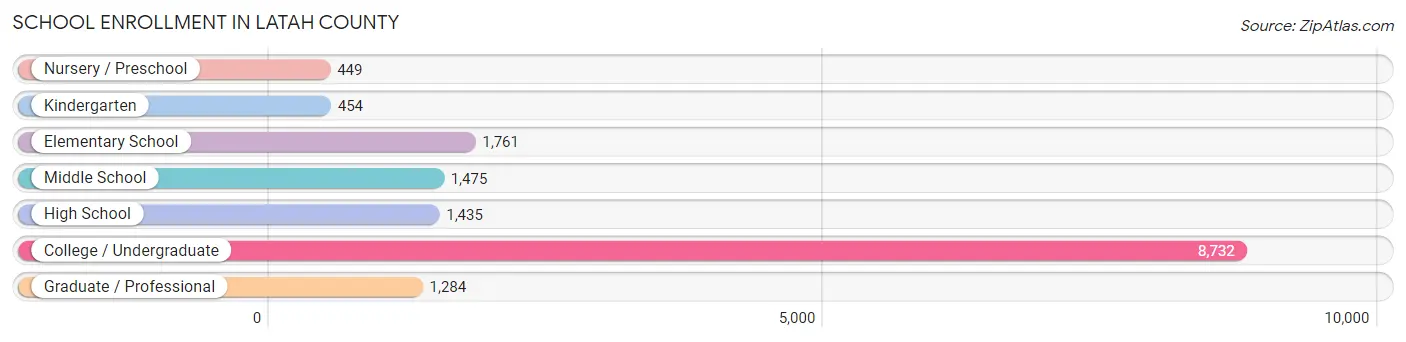
School Enrollment in Latah County
The most common levels of schooling among the 15,590 students in Latah County are college / undergraduate (8,732 | 56.0%), elementary school (1,761 | 11.3%), and middle school (1,475 | 9.5%).
| School Level | # Students | % Students |
| Nursery / Preschool | 449 | 2.9% |
| Kindergarten | 454 | 2.9% |
| Elementary School | 1,761 | 11.3% |
| Middle School | 1,475 | 9.5% |
| High School | 1,435 | 9.2% |
| College / Undergraduate | 8,732 | 56.0% |
| Graduate / Professional | 1,284 | 8.2% |
| Total | 15,590 | 100.0% |
School Enrollment by Age by Funding Source in Latah County
Out of a total of 15,590 students who are enrolled in schools in Latah County, 1,543 (9.9%) attend a private institution, while the remaining 14,047 (90.1%) are enrolled in public schools. The age group of 3 to 4 year olds has the highest likelihood of being enrolled in private schools, with 249 (64.0% in the age bracket) enrolled. Conversely, the age group of 18 to 19 year olds has the lowest likelihood of being enrolled in a private school, with 3,653 (98.6% in the age bracket) attending a public institution.
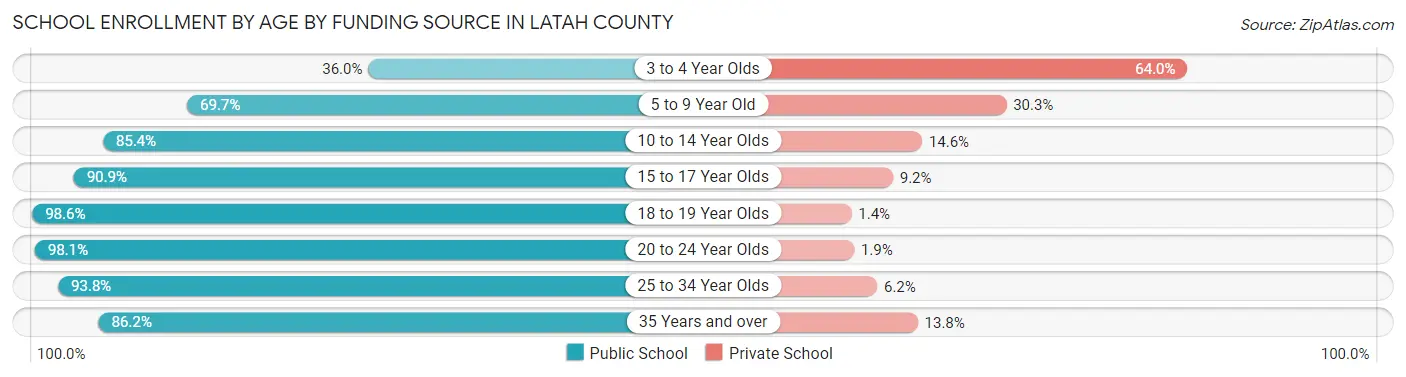
| Age Bracket | Public School | Private School |
| 3 to 4 Year Olds | 140 (36.0%) | 249 (64.0%) |
| 5 to 9 Year Old | 1,403 (69.7%) | 609 (30.3%) |
| 10 to 14 Year Olds | 1,664 (85.4%) | 284 (14.6%) |
| 15 to 17 Year Olds | 1,132 (90.8%) | 114 (9.1%) |
| 18 to 19 Year Olds | 3,653 (98.6%) | 53 (1.4%) |
| 20 to 24 Year Olds | 4,314 (98.1%) | 84 (1.9%) |
| 25 to 34 Year Olds | 1,433 (93.8%) | 95 (6.2%) |
| 35 Years and over | 313 (86.2%) | 50 (13.8%) |
| Total | 14,047 (90.1%) | 1,543 (9.9%) |
Educational Attainment by Field of Study in Latah County
Bio, nature & agricultural (1,884 | 16.7%), business (1,393 | 12.3%), education (1,345 | 11.9%), arts & humanities (854 | 7.6%), and science & technology (808 | 7.2%) are the most common fields of study among 11,290 individuals in Latah County who have obtained a bachelor's degree or higher.

| Field of Study | # Graduates | % Graduates |
| Computers & Mathematics | 356 | 3.2% |
| Bio, Nature & Agricultural | 1,884 | 16.7% |
| Physical & Health Sciences | 521 | 4.6% |
| Psychology | 444 | 3.9% |
| Social Sciences | 786 | 7.0% |
| Engineering | 589 | 5.2% |
| Multidisciplinary Studies | 166 | 1.5% |
| Science & Technology | 808 | 7.2% |
| Business | 1,393 | 12.3% |
| Education | 1,345 | 11.9% |
| Literature & Languages | 594 | 5.3% |
| Liberal Arts & History | 571 | 5.1% |
| Visual & Performing Arts | 615 | 5.4% |
| Communications | 364 | 3.2% |
| Arts & Humanities | 854 | 7.6% |
| Total | 11,290 | 100.0% |
Transportation & Commute in Latah County
Vehicle Availability by Sex in Latah County
The most prevalent vehicle ownership categories in Latah County are males with 2 vehicles (3,579, accounting for 37.1%) and females with 2 vehicles (2,886, making up 49.2%).
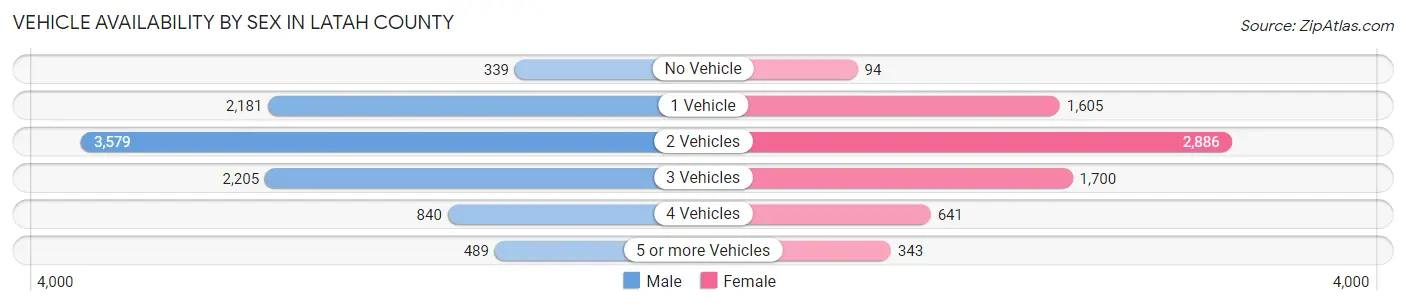
| Vehicles Available | Male | Female |
| No Vehicle | 339 (3.5%) | 94 (1.3%) |
| 1 Vehicle | 2,181 (22.6%) | 1,605 (22.1%) |
| 2 Vehicles | 3,579 (37.1%) | 2,886 (39.7%) |
| 3 Vehicles | 2,205 (22.9%) | 1,700 (23.4%) |
| 4 Vehicles | 840 (8.7%) | 641 (8.8%) |
| 5 or more Vehicles | 489 (5.1%) | 343 (4.7%) |
| Total | 9,633 (100.0%) | 7,269 (100.0%) |
Commute Time in Latah County
The most frequently occuring commute durations in Latah County are 5 to 9 minutes (4,304 commuters, 25.2%), 10 to 14 minutes (2,872 commuters, 16.8%), and 20 to 24 minutes (2,243 commuters, 13.1%).
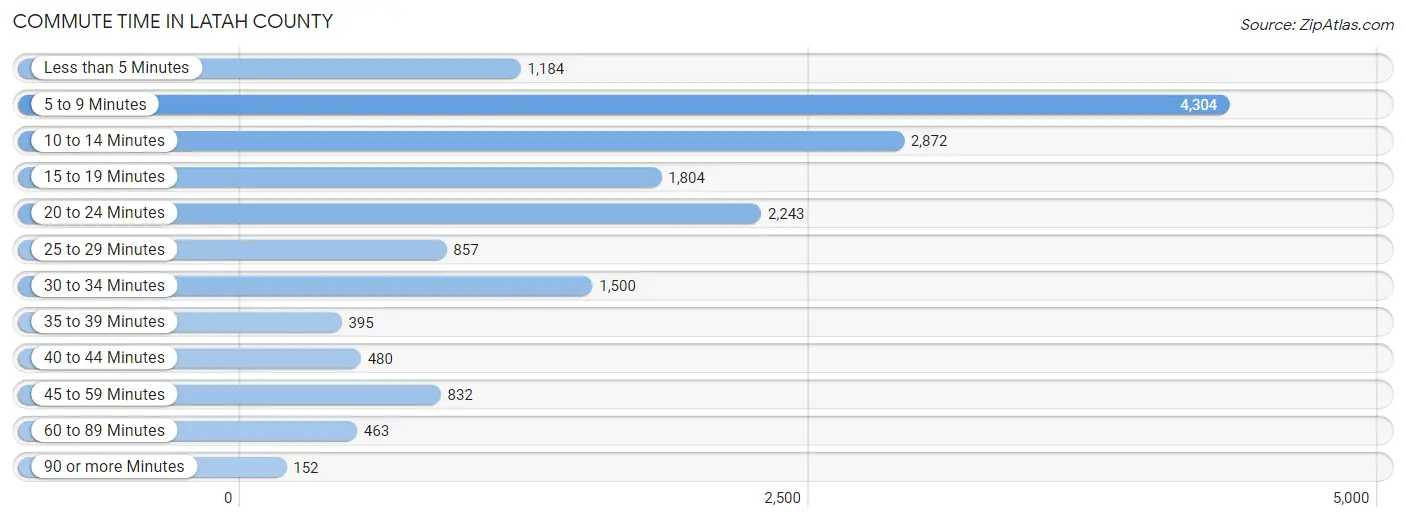
| Commute Time | # Commuters | % Commuters |
| Less than 5 Minutes | 1,184 | 6.9% |
| 5 to 9 Minutes | 4,304 | 25.2% |
| 10 to 14 Minutes | 2,872 | 16.8% |
| 15 to 19 Minutes | 1,804 | 10.6% |
| 20 to 24 Minutes | 2,243 | 13.1% |
| 25 to 29 Minutes | 857 | 5.0% |
| 30 to 34 Minutes | 1,500 | 8.8% |
| 35 to 39 Minutes | 395 | 2.3% |
| 40 to 44 Minutes | 480 | 2.8% |
| 45 to 59 Minutes | 832 | 4.9% |
| 60 to 89 Minutes | 463 | 2.7% |
| 90 or more Minutes | 152 | 0.9% |
Commute Time by Sex in Latah County
The most common commute times in Latah County are 5 to 9 minutes (2,038 commuters, 21.7%) for males and 5 to 9 minutes (2,266 commuters, 29.4%) for females.
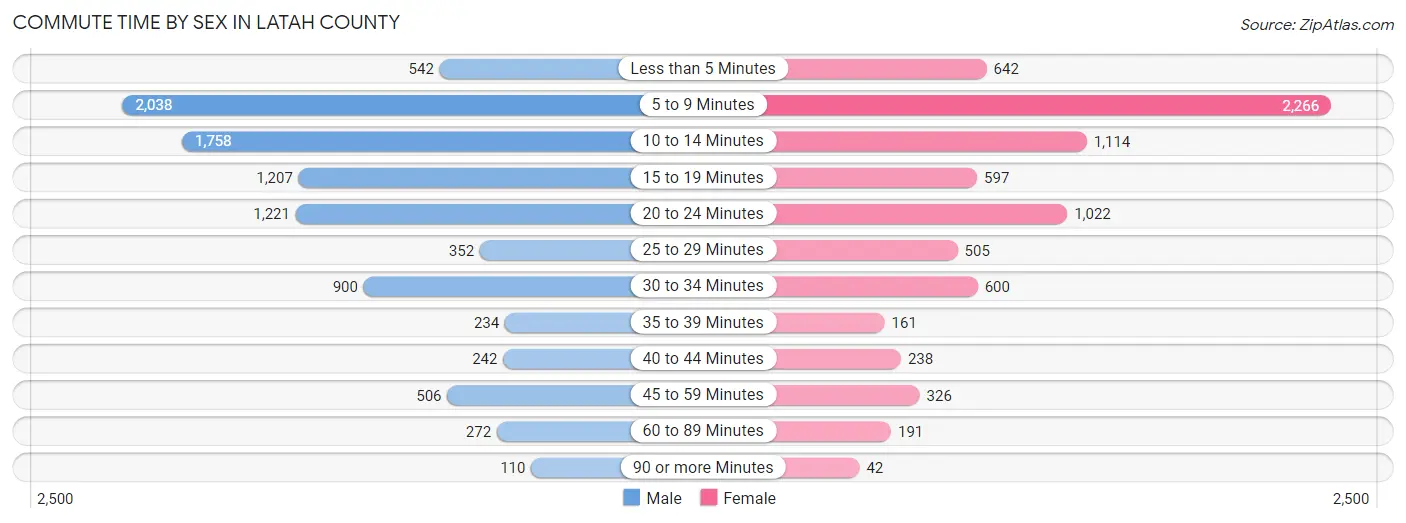
| Commute Time | Male | Female |
| Less than 5 Minutes | 542 (5.8%) | 642 (8.3%) |
| 5 to 9 Minutes | 2,038 (21.7%) | 2,266 (29.4%) |
| 10 to 14 Minutes | 1,758 (18.7%) | 1,114 (14.5%) |
| 15 to 19 Minutes | 1,207 (12.9%) | 597 (7.7%) |
| 20 to 24 Minutes | 1,221 (13.0%) | 1,022 (13.3%) |
| 25 to 29 Minutes | 352 (3.7%) | 505 (6.6%) |
| 30 to 34 Minutes | 900 (9.6%) | 600 (7.8%) |
| 35 to 39 Minutes | 234 (2.5%) | 161 (2.1%) |
| 40 to 44 Minutes | 242 (2.6%) | 238 (3.1%) |
| 45 to 59 Minutes | 506 (5.4%) | 326 (4.2%) |
| 60 to 89 Minutes | 272 (2.9%) | 191 (2.5%) |
| 90 or more Minutes | 110 (1.2%) | 42 (0.5%) |
Time of Departure to Work by Sex in Latah County
The most frequent times of departure to work in Latah County are 7:30 AM to 7:59 AM (1,284, 13.7%) for males and 7:30 AM to 7:59 AM (1,195, 15.5%) for females.
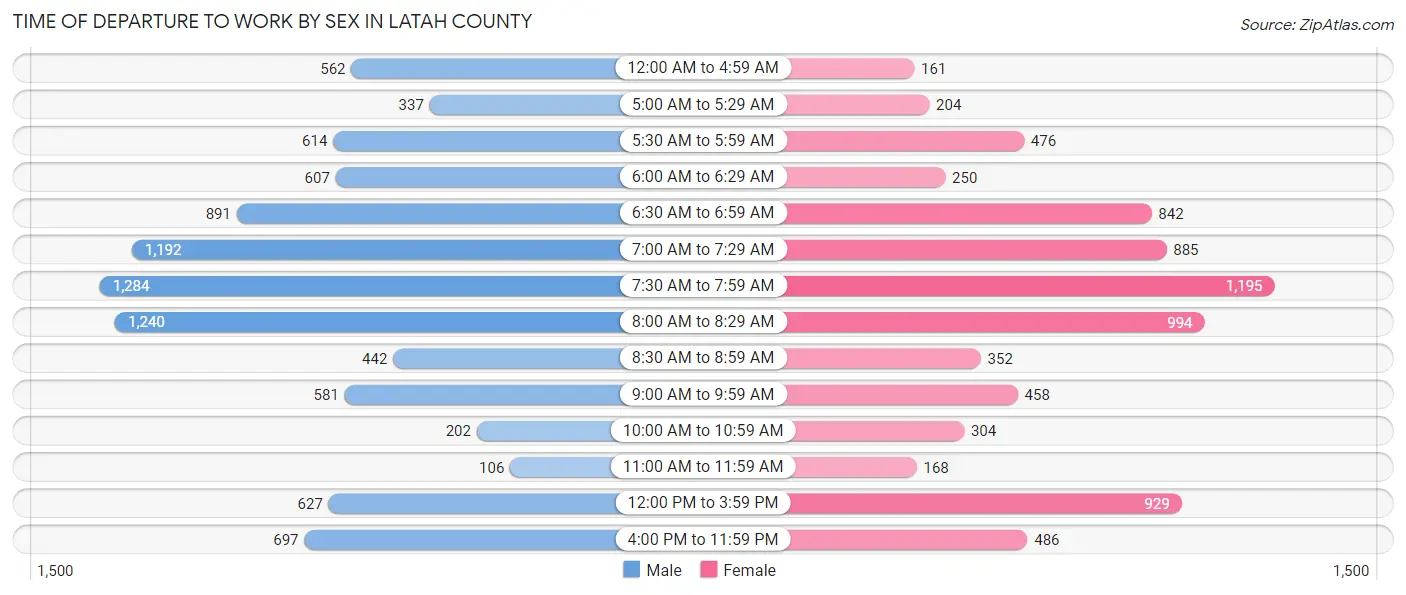
| Time of Departure | Male | Female |
| 12:00 AM to 4:59 AM | 562 (6.0%) | 161 (2.1%) |
| 5:00 AM to 5:29 AM | 337 (3.6%) | 204 (2.6%) |
| 5:30 AM to 5:59 AM | 614 (6.5%) | 476 (6.2%) |
| 6:00 AM to 6:29 AM | 607 (6.5%) | 250 (3.3%) |
| 6:30 AM to 6:59 AM | 891 (9.5%) | 842 (10.9%) |
| 7:00 AM to 7:29 AM | 1,192 (12.7%) | 885 (11.5%) |
| 7:30 AM to 7:59 AM | 1,284 (13.7%) | 1,195 (15.5%) |
| 8:00 AM to 8:29 AM | 1,240 (13.2%) | 994 (12.9%) |
| 8:30 AM to 8:59 AM | 442 (4.7%) | 352 (4.6%) |
| 9:00 AM to 9:59 AM | 581 (6.2%) | 458 (5.9%) |
| 10:00 AM to 10:59 AM | 202 (2.1%) | 304 (4.0%) |
| 11:00 AM to 11:59 AM | 106 (1.1%) | 168 (2.2%) |
| 12:00 PM to 3:59 PM | 627 (6.7%) | 929 (12.1%) |
| 4:00 PM to 11:59 PM | 697 (7.4%) | 486 (6.3%) |
| Total | 9,382 (100.0%) | 7,704 (100.0%) |
Housing Occupancy in Latah County
Occupancy by Ownership in Latah County
Of the total 15,929 dwellings in Latah County, owner-occupied units account for 9,545 (59.9%), while renter-occupied units make up 6,384 (40.1%).
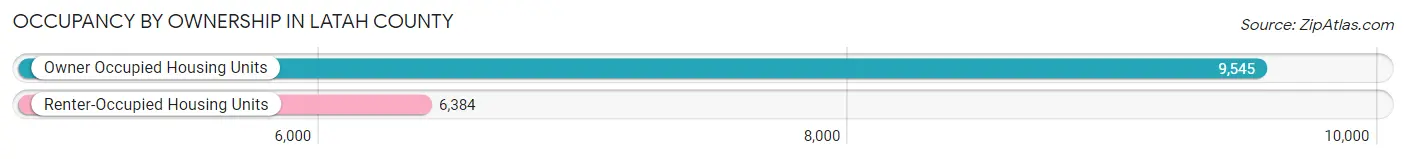
| Occupancy | # Housing Units | % Housing Units |
| Owner Occupied Housing Units | 9,545 | 59.9% |
| Renter-Occupied Housing Units | 6,384 | 40.1% |
| Total Occupied Housing Units | 15,929 | 100.0% |
Occupancy by Household Size in Latah County
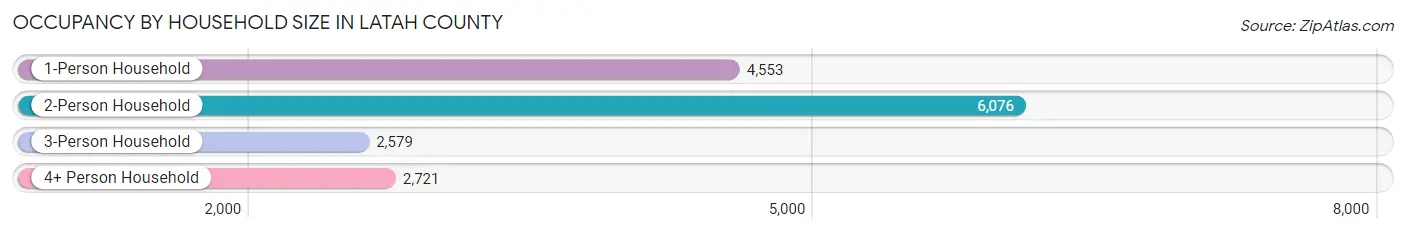
| Household Size | # Housing Units | % Housing Units |
| 1-Person Household | 4,553 | 28.6% |
| 2-Person Household | 6,076 | 38.1% |
| 3-Person Household | 2,579 | 16.2% |
| 4+ Person Household | 2,721 | 17.1% |
| Total Housing Units | 15,929 | 100.0% |
Occupancy by Ownership by Household Size in Latah County
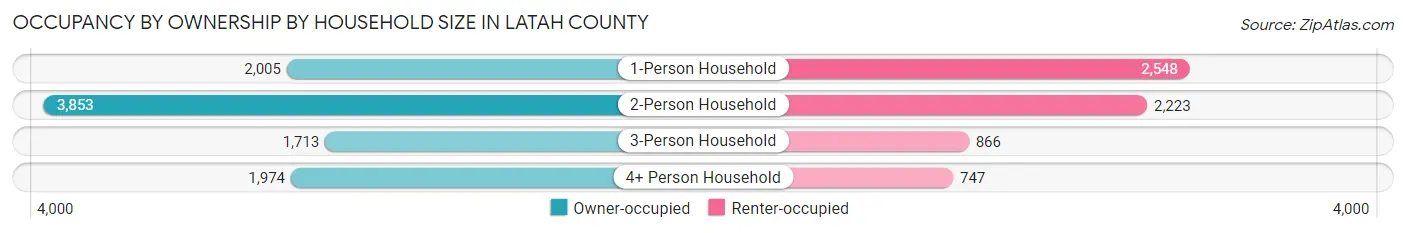
| Household Size | Owner-occupied | Renter-occupied |
| 1-Person Household | 2,005 (44.0%) | 2,548 (56.0%) |
| 2-Person Household | 3,853 (63.4%) | 2,223 (36.6%) |
| 3-Person Household | 1,713 (66.4%) | 866 (33.6%) |
| 4+ Person Household | 1,974 (72.6%) | 747 (27.5%) |
| Total Housing Units | 9,545 (59.9%) | 6,384 (40.1%) |
Occupancy by Educational Attainment in Latah County
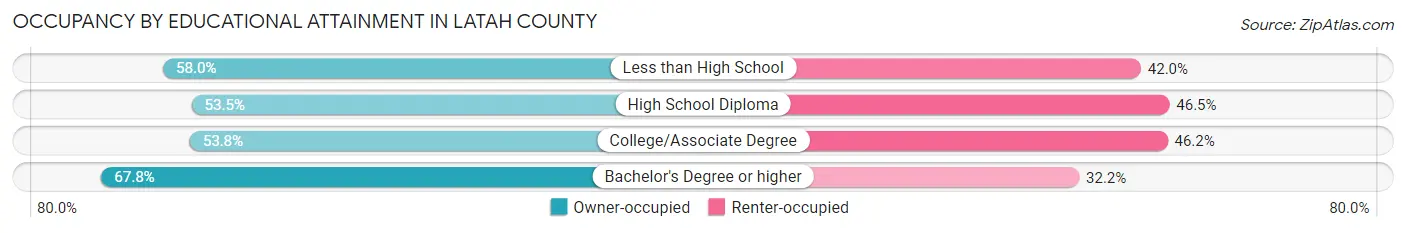
| Household Size | Owner-occupied | Renter-occupied |
| Less than High School | 217 (58.0%) | 157 (42.0%) |
| High School Diploma | 1,620 (53.5%) | 1,408 (46.5%) |
| College/Associate Degree | 3,017 (53.8%) | 2,592 (46.2%) |
| Bachelor's Degree or higher | 4,691 (67.8%) | 2,227 (32.2%) |
Occupancy by Age of Householder in Latah County
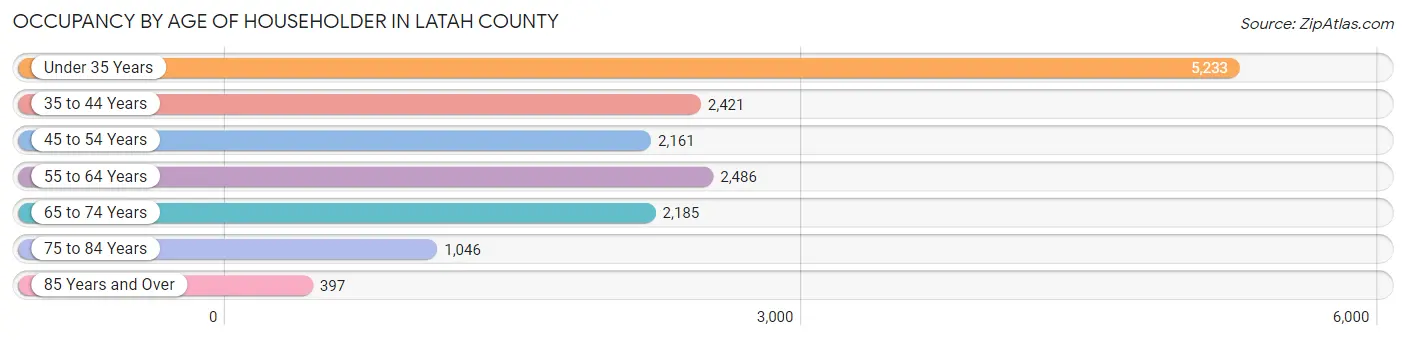
| Age Bracket | # Households | % Households |
| Under 35 Years | 5,233 | 32.9% |
| 35 to 44 Years | 2,421 | 15.2% |
| 45 to 54 Years | 2,161 | 13.6% |
| 55 to 64 Years | 2,486 | 15.6% |
| 65 to 74 Years | 2,185 | 13.7% |
| 75 to 84 Years | 1,046 | 6.6% |
| 85 Years and Over | 397 | 2.5% |
| Total | 15,929 | 100.0% |
Housing Finances in Latah County
Median Income by Occupancy in Latah County

| Occupancy Type | # Households | Median Income |
| Owner-Occupied | 9,545 (59.9%) | $86,278 |
| Renter-Occupied | 6,384 (40.1%) | $37,604 |
| Average | 15,929 (100.0%) | $62,258 |
Occupancy by Householder Income Bracket in Latah County
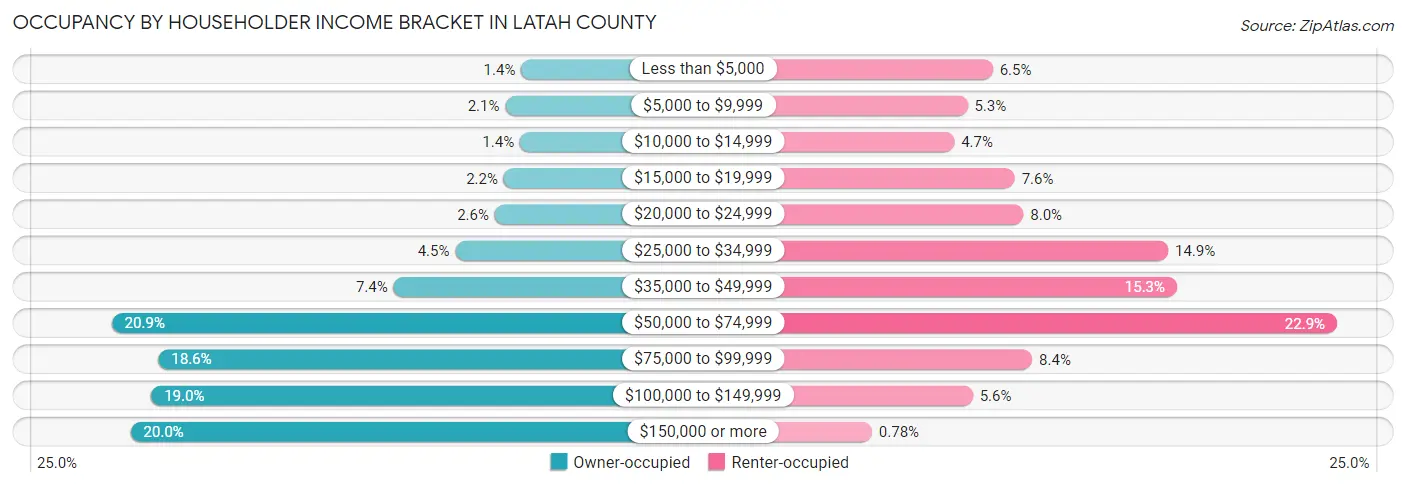
| Income Bracket | Owner-occupied | Renter-occupied |
| Less than $5,000 | 129 (1.3%) | 417 (6.5%) |
| $5,000 to $9,999 | 201 (2.1%) | 340 (5.3%) |
| $10,000 to $14,999 | 135 (1.4%) | 300 (4.7%) |
| $15,000 to $19,999 | 208 (2.2%) | 484 (7.6%) |
| $20,000 to $24,999 | 249 (2.6%) | 510 (8.0%) |
| $25,000 to $34,999 | 429 (4.5%) | 950 (14.9%) |
| $35,000 to $49,999 | 709 (7.4%) | 977 (15.3%) |
| $50,000 to $74,999 | 1,991 (20.9%) | 1,463 (22.9%) |
| $75,000 to $99,999 | 1,778 (18.6%) | 537 (8.4%) |
| $100,000 to $149,999 | 1,811 (19.0%) | 356 (5.6%) |
| $150,000 or more | 1,905 (20.0%) | 50 (0.8%) |
| Total | 9,545 (100.0%) | 6,384 (100.0%) |
Monthly Housing Cost Tiers in Latah County
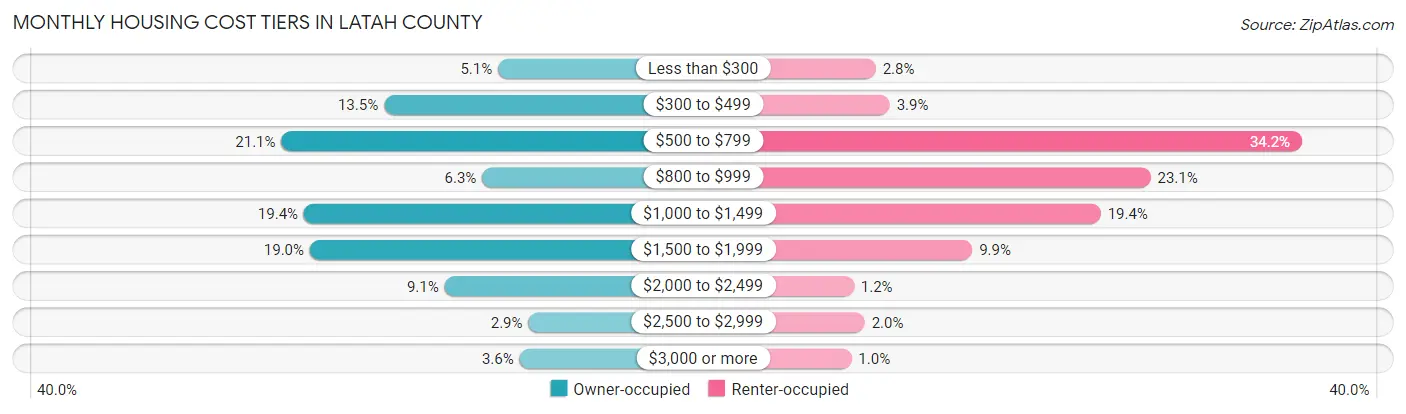
| Monthly Cost | Owner-occupied | Renter-occupied |
| Less than $300 | 490 (5.1%) | 180 (2.8%) |
| $300 to $499 | 1,291 (13.5%) | 246 (3.8%) |
| $500 to $799 | 2,013 (21.1%) | 2,184 (34.2%) |
| $800 to $999 | 601 (6.3%) | 1,472 (23.1%) |
| $1,000 to $1,499 | 1,855 (19.4%) | 1,238 (19.4%) |
| $1,500 to $1,999 | 1,813 (19.0%) | 634 (9.9%) |
| $2,000 to $2,499 | 866 (9.1%) | 77 (1.2%) |
| $2,500 to $2,999 | 277 (2.9%) | 128 (2.0%) |
| $3,000 or more | 339 (3.5%) | 66 (1.0%) |
| Total | 9,545 (100.0%) | 6,384 (100.0%) |
Physical Housing Characteristics in Latah County
Housing Structures in Latah County

| Structure Type | # Housing Units | % Housing Units |
| Single Unit, Detached | 9,083 | 57.0% |
| Single Unit, Attached | 700 | 4.4% |
| 2 Unit Apartments | 612 | 3.8% |
| 3 or 4 Unit Apartments | 719 | 4.5% |
| 5 to 9 Unit Apartments | 1,082 | 6.8% |
| 10 or more Apartments | 2,150 | 13.5% |
| Mobile Home / Other | 1,583 | 9.9% |
| Total | 15,929 | 100.0% |
Housing Structures by Occupancy in Latah County
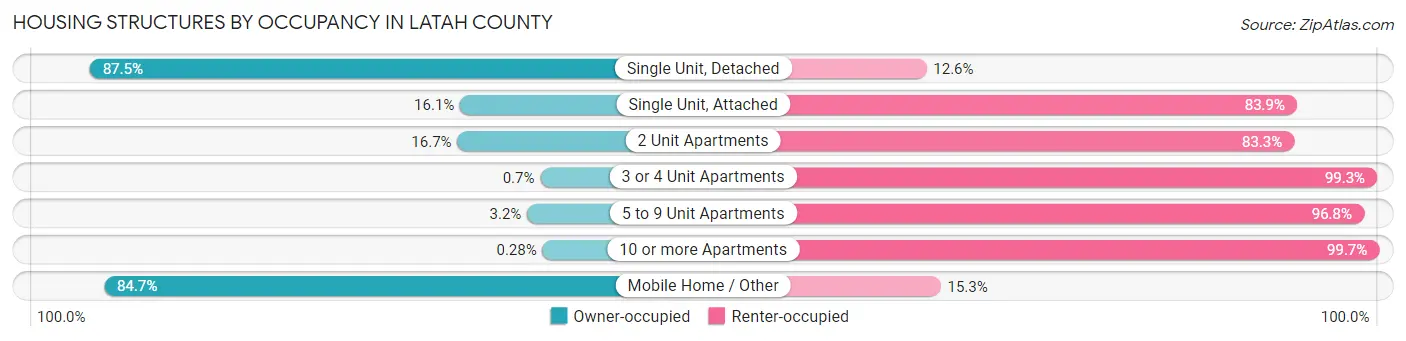
| Structure Type | Owner-occupied | Renter-occupied |
| Single Unit, Detached | 7,943 (87.5%) | 1,140 (12.6%) |
| Single Unit, Attached | 113 (16.1%) | 587 (83.9%) |
| 2 Unit Apartments | 102 (16.7%) | 510 (83.3%) |
| 3 or 4 Unit Apartments | 5 (0.7%) | 714 (99.3%) |
| 5 to 9 Unit Apartments | 35 (3.2%) | 1,047 (96.8%) |
| 10 or more Apartments | 6 (0.3%) | 2,144 (99.7%) |
| Mobile Home / Other | 1,341 (84.7%) | 242 (15.3%) |
| Total | 9,545 (59.9%) | 6,384 (40.1%) |
Housing Structures by Number of Rooms in Latah County
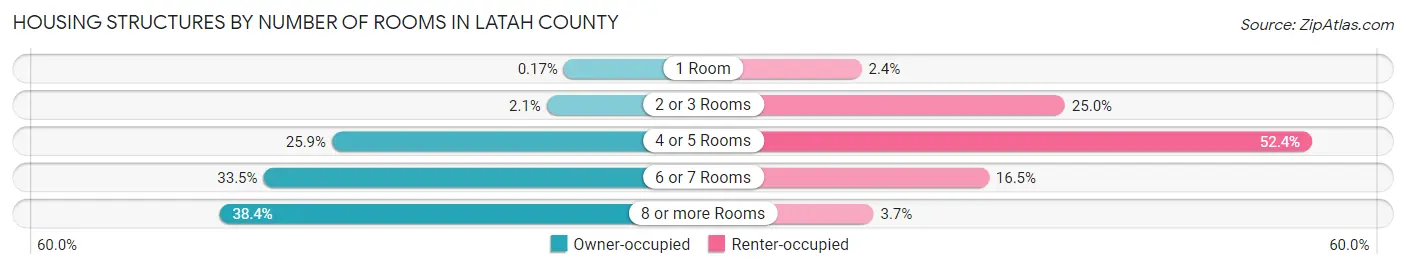
| Number of Rooms | Owner-occupied | Renter-occupied |
| 1 Room | 16 (0.2%) | 153 (2.4%) |
| 2 or 3 Rooms | 197 (2.1%) | 1,594 (25.0%) |
| 4 or 5 Rooms | 2,472 (25.9%) | 3,344 (52.4%) |
| 6 or 7 Rooms | 3,198 (33.5%) | 1,055 (16.5%) |
| 8 or more Rooms | 3,662 (38.4%) | 238 (3.7%) |
| Total | 9,545 (100.0%) | 6,384 (100.0%) |
Housing Structure by Heating Type in Latah County
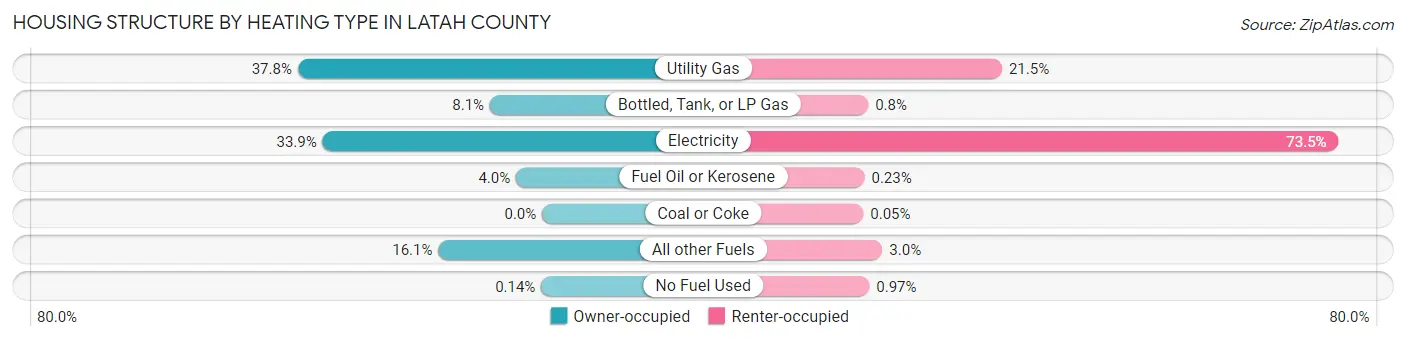
| Heating Type | Owner-occupied | Renter-occupied |
| Utility Gas | 3,606 (37.8%) | 1,371 (21.5%) |
| Bottled, Tank, or LP Gas | 769 (8.1%) | 51 (0.8%) |
| Electricity | 3,240 (33.9%) | 4,691 (73.5%) |
| Fuel Oil or Kerosene | 385 (4.0%) | 15 (0.2%) |
| Coal or Coke | 0 (0.0%) | 3 (0.1%) |
| All other Fuels | 1,532 (16.1%) | 191 (3.0%) |
| No Fuel Used | 13 (0.1%) | 62 (1.0%) |
| Total | 9,545 (100.0%) | 6,384 (100.0%) |
Household Vehicle Usage in Latah County
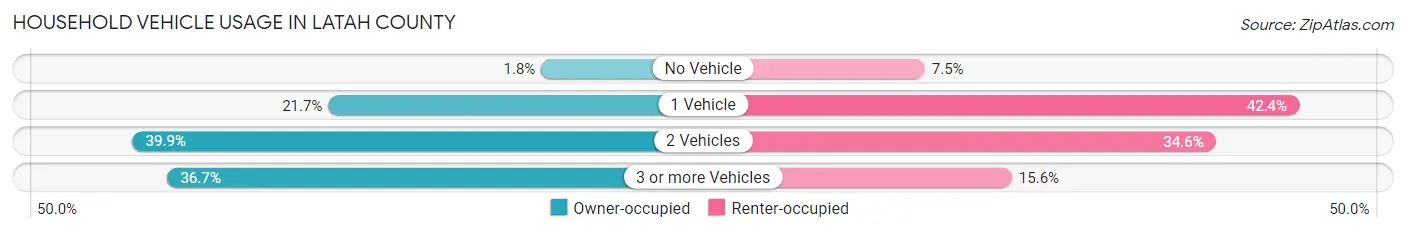
| Vehicles per Household | Owner-occupied | Renter-occupied |
| No Vehicle | 170 (1.8%) | 476 (7.5%) |
| 1 Vehicle | 2,067 (21.7%) | 2,705 (42.4%) |
| 2 Vehicles | 3,809 (39.9%) | 2,208 (34.6%) |
| 3 or more Vehicles | 3,499 (36.7%) | 995 (15.6%) |
| Total | 9,545 (100.0%) | 6,384 (100.0%) |
Real Estate & Mortgages in Latah County
Real Estate and Mortgage Overview in Latah County
| Characteristic | Without Mortgage | With Mortgage |
| Housing Units | 3,951 | 5,594 |
| Median Property Value | $283,800 | $324,900 |
| Median Household Income | $67,888 | $1,389 |
| Monthly Housing Costs | $522 | $339 |
| Real Estate Taxes | $1,879 | $108 |
Property Value by Mortgage Status in Latah County
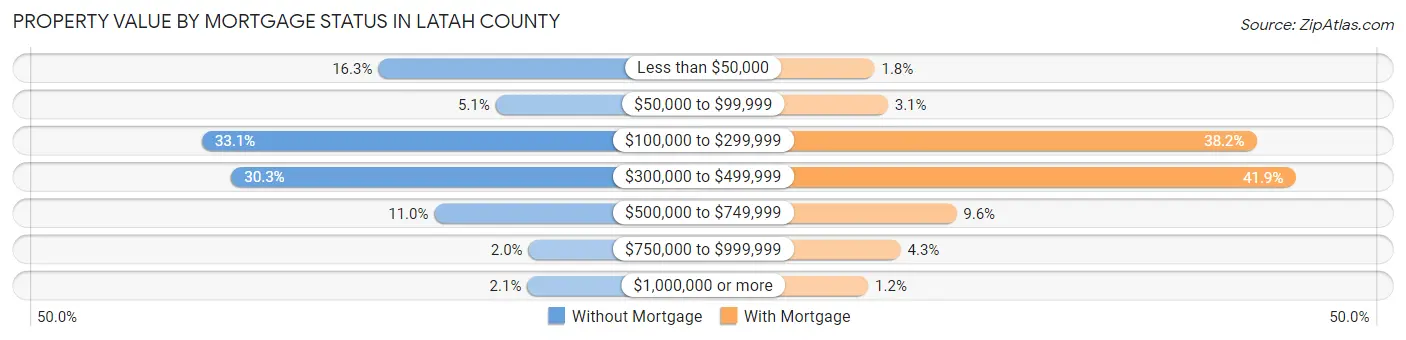
| Property Value | Without Mortgage | With Mortgage |
| Less than $50,000 | 645 (16.3%) | 101 (1.8%) |
| $50,000 to $99,999 | 203 (5.1%) | 172 (3.1%) |
| $100,000 to $299,999 | 1,308 (33.1%) | 2,135 (38.2%) |
| $300,000 to $499,999 | 1,197 (30.3%) | 2,342 (41.9%) |
| $500,000 to $749,999 | 434 (11.0%) | 537 (9.6%) |
| $750,000 to $999,999 | 80 (2.0%) | 240 (4.3%) |
| $1,000,000 or more | 84 (2.1%) | 67 (1.2%) |
| Total | 3,951 (100.0%) | 5,594 (100.0%) |
Household Income by Mortgage Status in Latah County
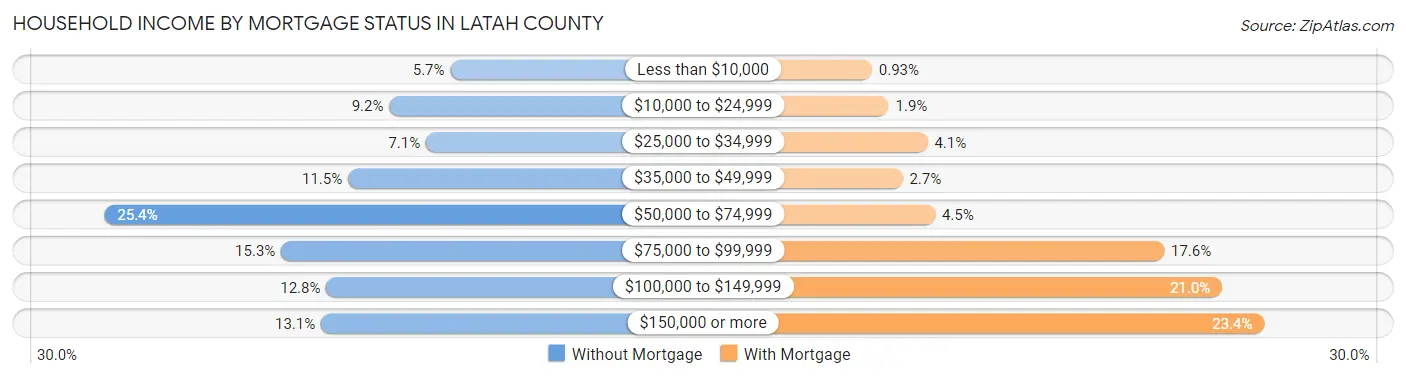
| Household Income | Without Mortgage | With Mortgage |
| Less than $10,000 | 224 (5.7%) | 52 (0.9%) |
| $10,000 to $24,999 | 362 (9.2%) | 106 (1.9%) |
| $25,000 to $34,999 | 279 (7.1%) | 230 (4.1%) |
| $35,000 to $49,999 | 455 (11.5%) | 150 (2.7%) |
| $50,000 to $74,999 | 1,005 (25.4%) | 254 (4.5%) |
| $75,000 to $99,999 | 606 (15.3%) | 986 (17.6%) |
| $100,000 to $149,999 | 504 (12.8%) | 1,172 (20.9%) |
| $150,000 or more | 516 (13.1%) | 1,307 (23.4%) |
| Total | 3,951 (100.0%) | 5,594 (100.0%) |
Property Value to Household Income Ratio in Latah County
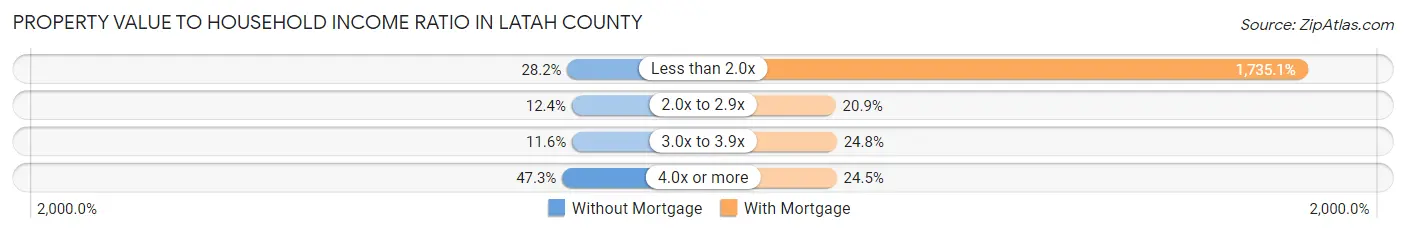
| Value-to-Income Ratio | Without Mortgage | With Mortgage |
| Less than 2.0x | 1,113 (28.2%) | 97,060 (1,735.1%) |
| 2.0x to 2.9x | 489 (12.4%) | 1,170 (20.9%) |
| 3.0x to 3.9x | 459 (11.6%) | 1,386 (24.8%) |
| 4.0x or more | 1,870 (47.3%) | 1,372 (24.5%) |
| Total | 3,951 (100.0%) | 5,594 (100.0%) |
Real Estate Taxes by Mortgage Status in Latah County
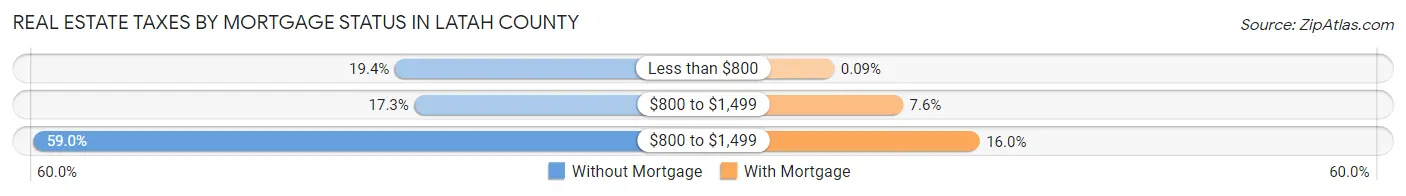
| Property Taxes | Without Mortgage | With Mortgage |
| Less than $800 | 766 (19.4%) | 5 (0.1%) |
| $800 to $1,499 | 682 (17.3%) | 426 (7.6%) |
| $800 to $1,499 | 2,331 (59.0%) | 896 (16.0%) |
| Total | 3,951 (100.0%) | 5,594 (100.0%) |
Health & Disability in Latah County
Health Insurance Coverage by Age in Latah County
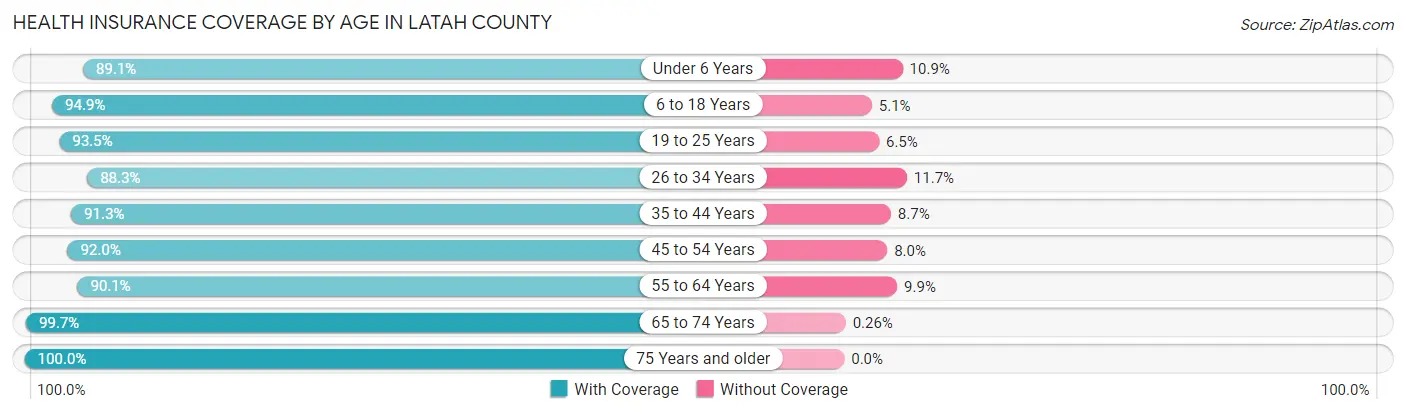
| Age Bracket | With Coverage | Without Coverage |
| Under 6 Years | 2,154 (89.1%) | 263 (10.9%) |
| 6 to 18 Years | 6,368 (94.9%) | 345 (5.1%) |
| 19 to 25 Years | 7,666 (93.5%) | 531 (6.5%) |
| 26 to 34 Years | 4,301 (88.3%) | 569 (11.7%) |
| 35 to 44 Years | 3,846 (91.3%) | 366 (8.7%) |
| 45 to 54 Years | 3,334 (92.0%) | 290 (8.0%) |
| 55 to 64 Years | 3,639 (90.1%) | 398 (9.9%) |
| 65 to 74 Years | 3,442 (99.7%) | 9 (0.3%) |
| 75 Years and older | 2,107 (100.0%) | 0 (0.0%) |
| Total | 36,857 (93.0%) | 2,771 (7.0%) |
Health Insurance Coverage by Citizenship Status in Latah County
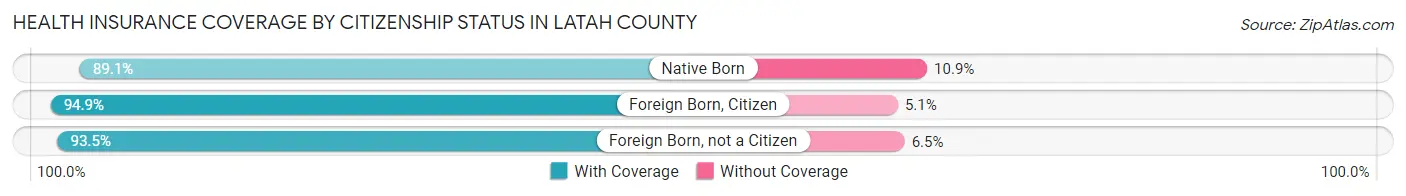
| Citizenship Status | With Coverage | Without Coverage |
| Native Born | 2,154 (89.1%) | 263 (10.9%) |
| Foreign Born, Citizen | 6,368 (94.9%) | 345 (5.1%) |
| Foreign Born, not a Citizen | 7,666 (93.5%) | 531 (6.5%) |
Health Insurance Coverage by Household Income in Latah County
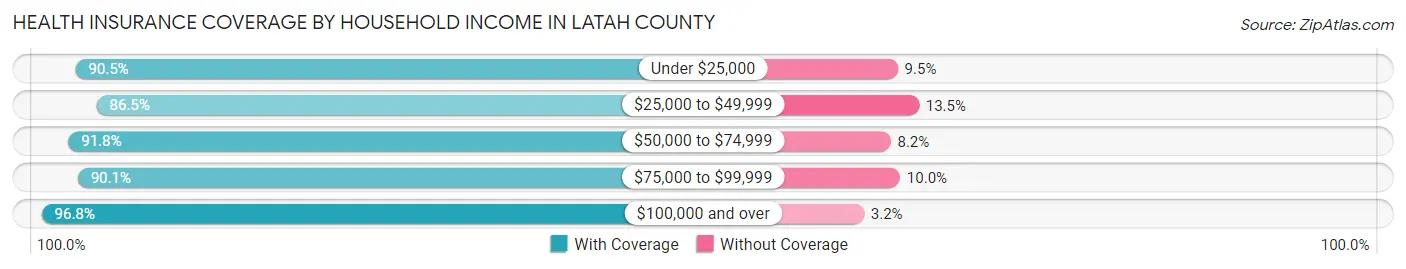
| Household Income | With Coverage | Without Coverage |
| Under $25,000 | 4,006 (90.5%) | 422 (9.5%) |
| $25,000 to $49,999 | 4,654 (86.5%) | 726 (13.5%) |
| $50,000 to $74,999 | 6,647 (91.8%) | 594 (8.2%) |
| $75,000 to $99,999 | 5,266 (90.0%) | 582 (10.0%) |
| $100,000 and over | 10,803 (96.8%) | 356 (3.2%) |
Public vs Private Health Insurance Coverage by Age in Latah County
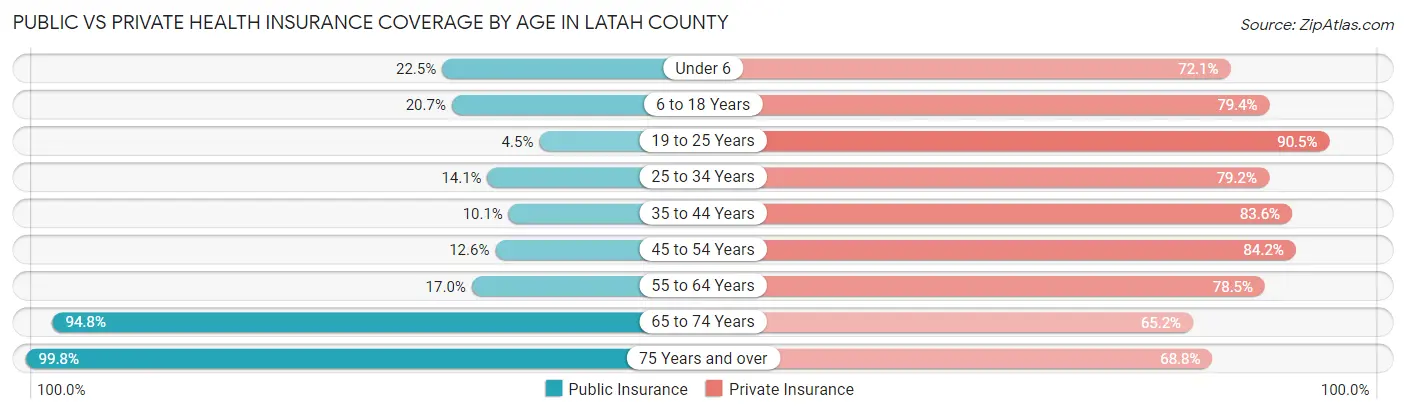
| Age Bracket | Public Insurance | Private Insurance |
| Under 6 | 544 (22.5%) | 1,743 (72.1%) |
| 6 to 18 Years | 1,391 (20.7%) | 5,328 (79.4%) |
| 19 to 25 Years | 367 (4.5%) | 7,417 (90.5%) |
| 25 to 34 Years | 686 (14.1%) | 3,859 (79.2%) |
| 35 to 44 Years | 427 (10.1%) | 3,519 (83.6%) |
| 45 to 54 Years | 458 (12.6%) | 3,053 (84.2%) |
| 55 to 64 Years | 687 (17.0%) | 3,170 (78.5%) |
| 65 to 74 Years | 3,272 (94.8%) | 2,249 (65.2%) |
| 75 Years and over | 2,103 (99.8%) | 1,449 (68.8%) |
| Total | 9,935 (25.1%) | 31,787 (80.2%) |
Disability Status by Sex by Age in Latah County
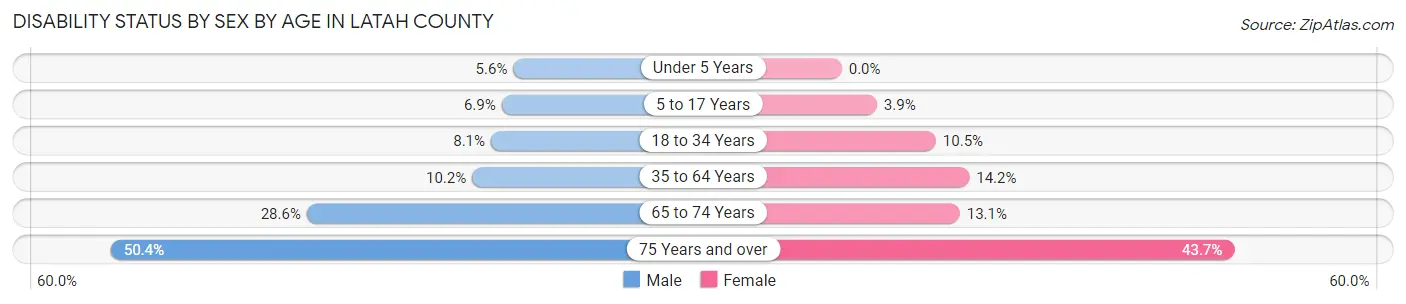
| Age Bracket | Male | Female |
| Under 5 Years | 52 (5.6%) | 0 (0.0%) |
| 5 to 17 Years | 191 (6.9%) | 103 (3.9%) |
| 18 to 34 Years | 634 (8.1%) | 732 (10.5%) |
| 35 to 64 Years | 621 (10.2%) | 819 (14.2%) |
| 65 to 74 Years | 499 (28.6%) | 224 (13.1%) |
| 75 Years and over | 499 (50.4%) | 488 (43.7%) |
Disability Class by Sex by Age in Latah County
Disability Class: Hearing Difficulty
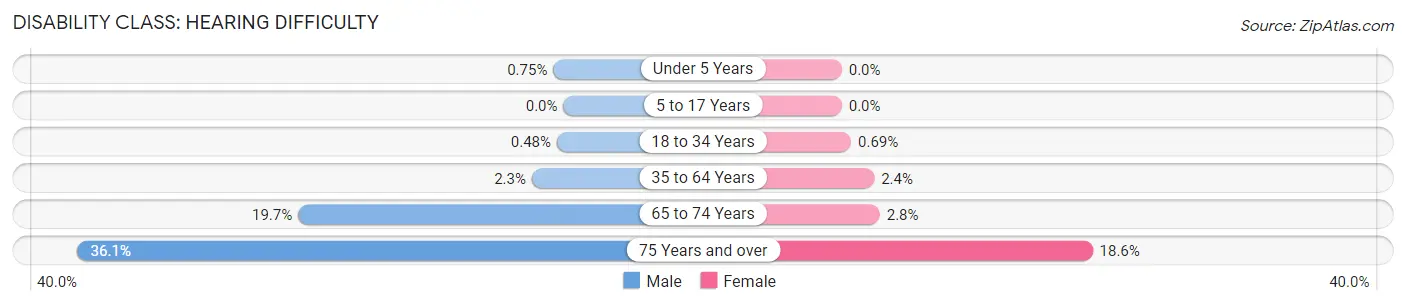
| Age Bracket | Male | Female |
| Under 5 Years | 7 (0.7%) | 0 (0.0%) |
| 5 to 17 Years | 0 (0.0%) | 0 (0.0%) |
| 18 to 34 Years | 38 (0.5%) | 48 (0.7%) |
| 35 to 64 Years | 143 (2.3%) | 139 (2.4%) |
| 65 to 74 Years | 344 (19.7%) | 48 (2.8%) |
| 75 Years and over | 357 (36.1%) | 208 (18.6%) |
Disability Class: Vision Difficulty
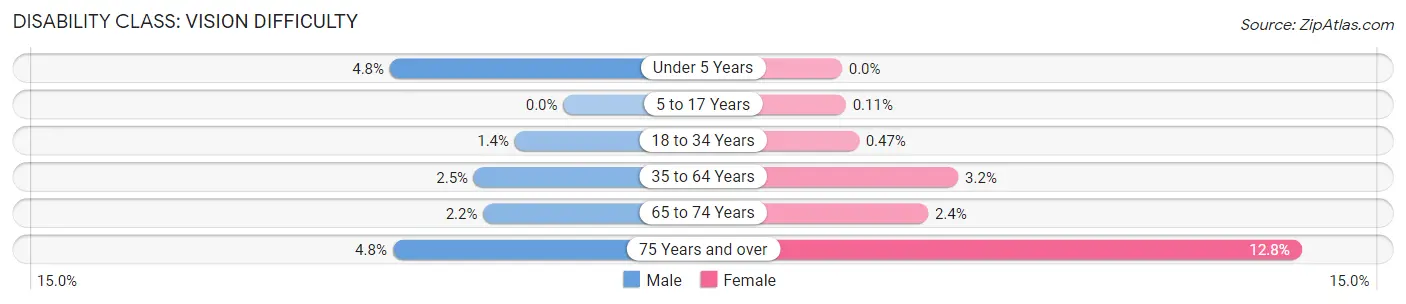
| Age Bracket | Male | Female |
| Under 5 Years | 45 (4.8%) | 0 (0.0%) |
| 5 to 17 Years | 0 (0.0%) | 3 (0.1%) |
| 18 to 34 Years | 106 (1.3%) | 33 (0.5%) |
| 35 to 64 Years | 152 (2.5%) | 187 (3.2%) |
| 65 to 74 Years | 39 (2.2%) | 41 (2.4%) |
| 75 Years and over | 47 (4.8%) | 143 (12.8%) |
Disability Class: Cognitive Difficulty
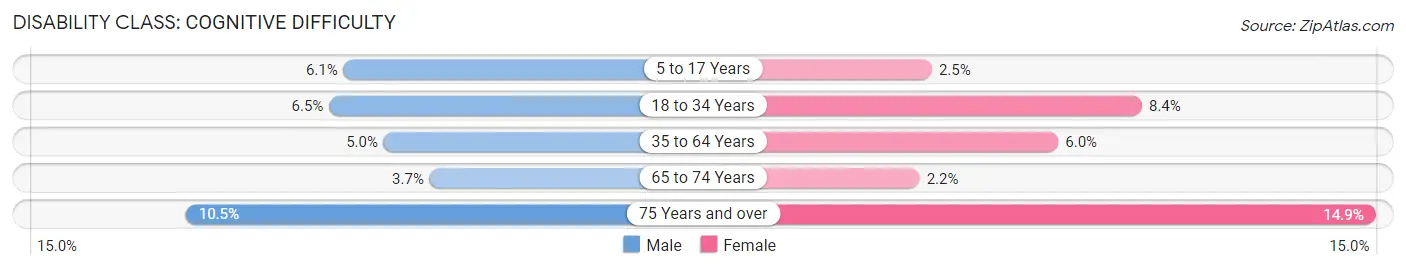
| Age Bracket | Male | Female |
| 5 to 17 Years | 170 (6.1%) | 66 (2.5%) |
| 18 to 34 Years | 512 (6.5%) | 584 (8.4%) |
| 35 to 64 Years | 305 (5.0%) | 348 (6.0%) |
| 65 to 74 Years | 65 (3.7%) | 37 (2.2%) |
| 75 Years and over | 104 (10.5%) | 166 (14.9%) |
Disability Class: Ambulatory Difficulty
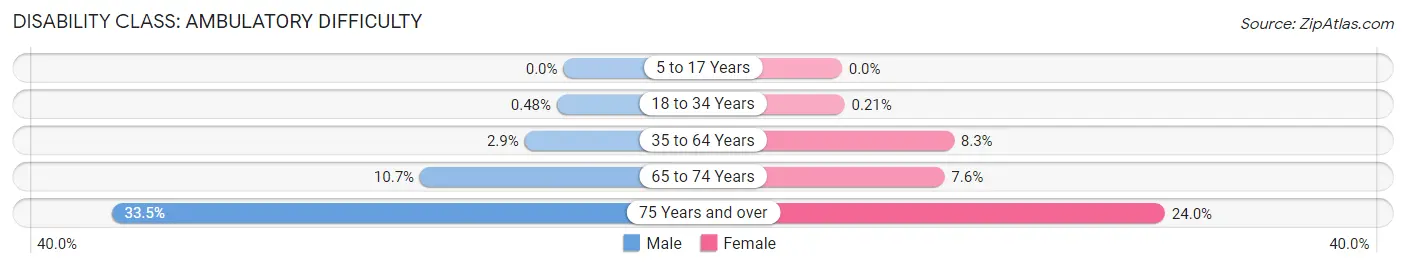
| Age Bracket | Male | Female |
| 5 to 17 Years | 0 (0.0%) | 0 (0.0%) |
| 18 to 34 Years | 38 (0.5%) | 15 (0.2%) |
| 35 to 64 Years | 176 (2.9%) | 480 (8.3%) |
| 65 to 74 Years | 186 (10.6%) | 130 (7.6%) |
| 75 Years and over | 332 (33.5%) | 268 (24.0%) |
Disability Class: Self-Care Difficulty
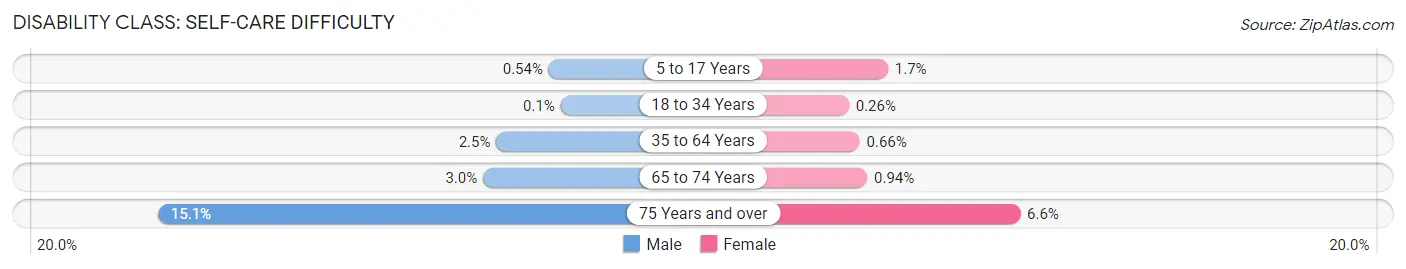
| Age Bracket | Male | Female |
| 5 to 17 Years | 15 (0.5%) | 45 (1.7%) |
| 18 to 34 Years | 8 (0.1%) | 18 (0.3%) |
| 35 to 64 Years | 152 (2.5%) | 38 (0.7%) |
| 65 to 74 Years | 52 (3.0%) | 16 (0.9%) |
| 75 Years and over | 149 (15.0%) | 74 (6.6%) |
Technology Access in Latah County
Computing Device Access in Latah County
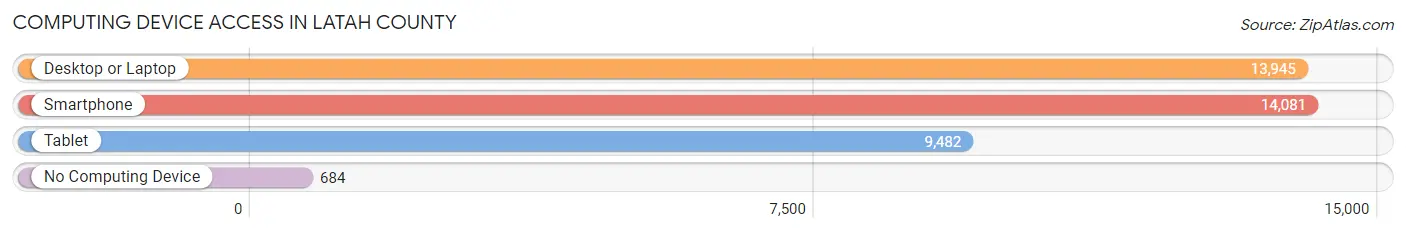
| Device Type | # Households | % Households |
| Desktop or Laptop | 13,945 | 87.5% |
| Smartphone | 14,081 | 88.4% |
| Tablet | 9,482 | 59.5% |
| No Computing Device | 684 | 4.3% |
| Total | 15,929 | 100.0% |
Internet Access in Latah County
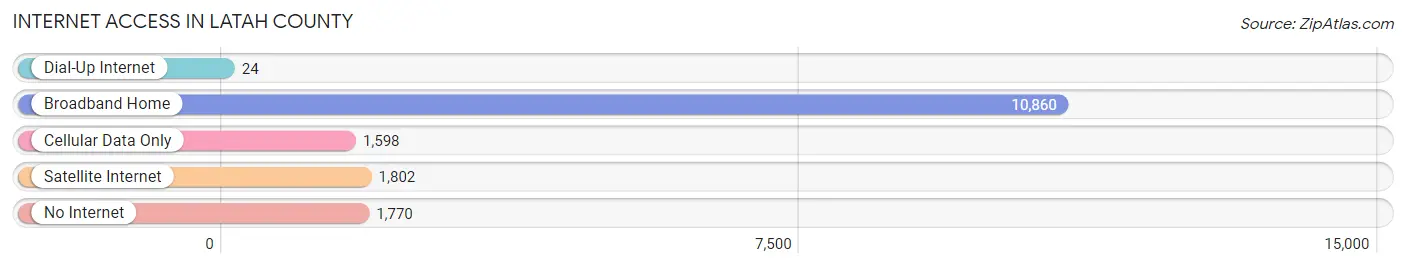
| Internet Type | # Households | % Households |
| Dial-Up Internet | 24 | 0.2% |
| Broadband Home | 10,860 | 68.2% |
| Cellular Data Only | 1,598 | 10.0% |
| Satellite Internet | 1,802 | 11.3% |
| No Internet | 1,770 | 11.1% |
| Total | 15,929 | 100.0% |
Latah County Summary
Latah County is located in the northern part of the state of Idaho, in the United States. It is bordered by the Clearwater River to the north, the Palouse River to the east, and the Snake River to the south. The county seat is Moscow, and the largest city is Pullman, Washington. The county was established in 1888 and named after the Latah Creek, which flows through the county.
History
The area that is now Latah County was originally inhabited by the Nez Perce and Palouse tribes. The first white settlers arrived in the area in the late 1860s, and the county was officially established in 1888. The county was named after the Latah Creek, which flows through the county.
The county was initially an agricultural area, with wheat, oats, and barley being the main crops. In the early 1900s, the county began to diversify its economy, with the establishment of a sawmill, a flour mill, and a creamery.
In the 1920s, the county experienced a population boom, as people moved to the area to take advantage of the agricultural opportunities. The county also experienced an influx of immigrants from Europe, particularly from Germany and Russia.
In the 1950s, the county began to diversify its economy further, with the establishment of a number of manufacturing plants. The county also experienced a population boom, as people moved to the area to take advantage of the new job opportunities.
Geography
Latah County covers an area of 1,741 square miles, making it the second-largest county in Idaho. The county is located in the northern part of the state, and is bordered by the Clearwater River to the north, the Palouse River to the east, and the Snake River to the south. The county is mostly rural, with the majority of the population living in small towns and villages.
The county is home to several mountain ranges, including the Bitterroot Mountains, the Clearwater Mountains, and the Selkirk Mountains. The highest point in the county is Mount Spokane, which has an elevation of 5,883 feet.
Economy
Latah County has a diverse economy, with agriculture, manufacturing, and tourism being the main industries. The county is home to several large agricultural operations, including wheat, oats, barley, and potatoes. The county is also home to several manufacturing plants, including a sawmill, a flour mill, and a creamery.
The county is also home to several tourist attractions, including the University of Idaho, the Latah County Historical Museum, and the Palouse Falls State Park.
Demographics
As of the 2010 census, the population of Latah County was 37,244. The population is predominantly white (94.2%), with small percentages of Native American (1.2%), Asian (1.1%), and African American (0.5%) populations. The median household income in the county is $41,945, and the median age is 36.7 years.
Latah County is home to several colleges and universities, including the University of Idaho, Washington State University, and Lewis-Clark State College. The county is also home to several museums, including the Latah County Historical Museum and the Palouse Falls State Park.
Common Questions
What is the Total Population of Latah County?
Total Population of Latah County is 39,872.
What is the Total Male Population of Latah County?
Total Male Population of Latah County is 20,524.
What is the Total Female Population of Latah County?
Total Female Population of Latah County is 19,348.
What is the Ratio of Males per 100 Females in Latah County?
There are 106.08 Males per 100 Females in Latah County.
What is the Ratio of Females per 100 Males in Latah County?
There are 94.27 Females per 100 Males in Latah County.
What is the Median Population Age in Latah County?
Median Population Age in Latah County is 30.3 Years.
What is the Average Family Size in Latah County
Average Family Size in Latah County is 2.7 People.
What is the Average Household Size in Latah County
Average Household Size in Latah County is 2.1 People.
What is Per Capita Income in Latah County?
Per Capita income in Latah County is $33,342.
What is the Median Family Income in Latah County?
Median Family Income in Latah County is $86,186.
What is the Median Household income in Latah County?
Median Household Income in Latah County is $62,258.
What is Income or Wage Gap in Latah County?
Income or Wage Gap in Latah County is 34.4%.
Women in Latah County earn 65.6 cents for every dollar earned by a man.
What is Family Income Deficit in Latah County?
Family Income Deficit in Latah County is $9,396.
Families that are below poverty line in Latah County earn $9,396 less on average than the poverty threshold level.
What is Inequality or Gini Index in Latah County?
Inequality or Gini Index in Latah County is 0.46.
How Large is the Labor Force in Latah County?
There are 20,452 People in the Labor Forcein in Latah County.
What is the Percentage of People in the Labor Force in Latah County?
61.3% of People are in the Labor Force in Latah County.
What is the Unemployment Rate in Latah County?
Unemployment Rate in Latah County is 5.3%.