Kootenai County, ID
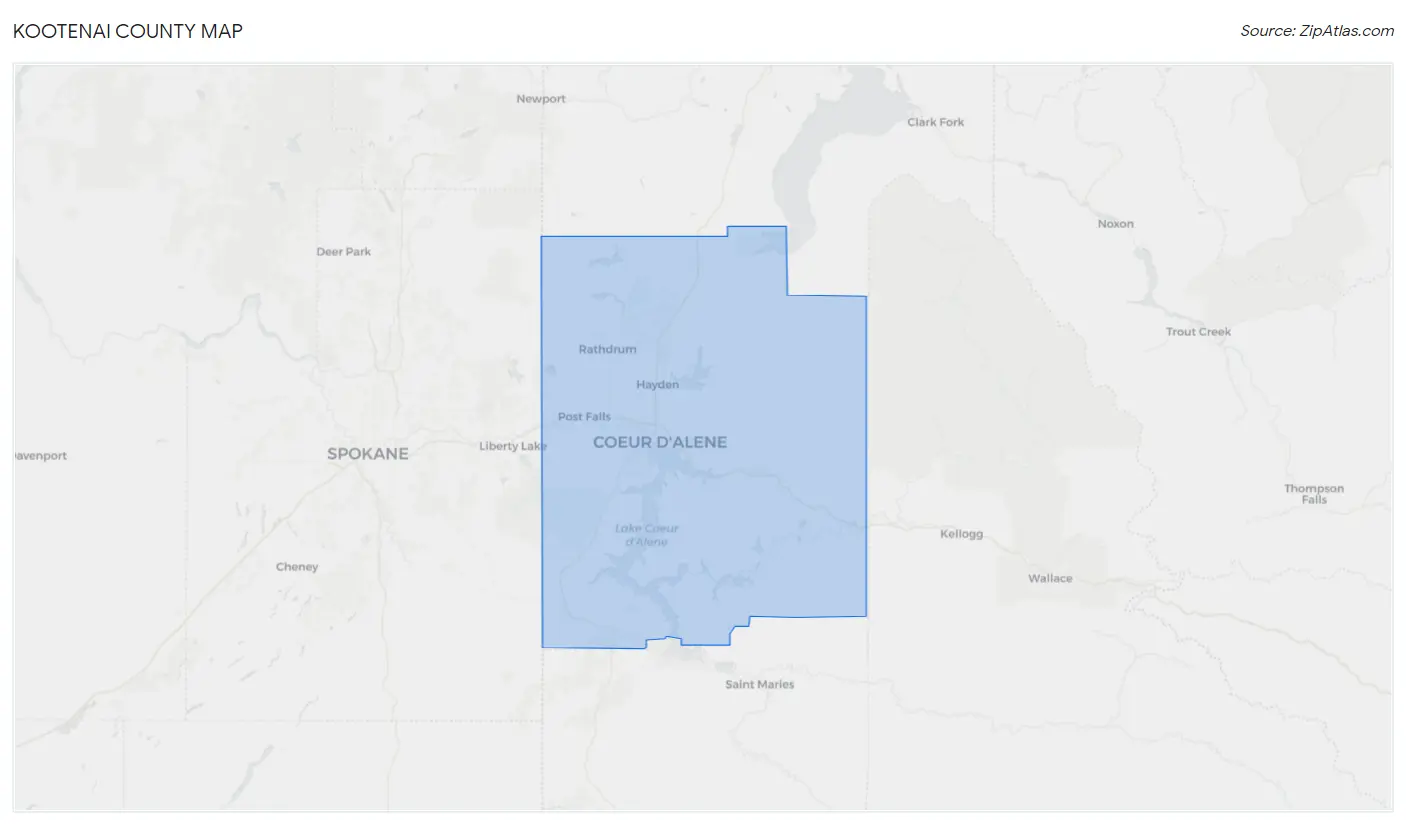
Kootenai County Map
Kootenai County Overview
173,396
TOTAL POPULATION
86,516
MALE POPULATION
86,880
FEMALE POPULATION
99.58
MALES / 100 FEMALES
100.42
FEMALES / 100 MALES
40.7
MEDIAN AGE
3.0
AVG FAMILY SIZE
2.5
AVG HOUSEHOLD SIZE
$36,718
PER CAPITA INCOME
$84,489
AVG FAMILY INCOME
$71,949
AVG HOUSEHOLD INCOME
35.1%
WAGE / INCOME GAP [ % ]
64.9¢/ $1
WAGE / INCOME GAP [ $ ]
$10,129
FAMILY INCOME DEFICIT
0.43
INEQUALITY / GINI INDEX
84,133
LABOR FORCE [ PEOPLE ]
60.7%
PERCENT IN LABOR FORCE
3.1%
UNEMPLOYMENT RATE
Kootenai County Area Codes
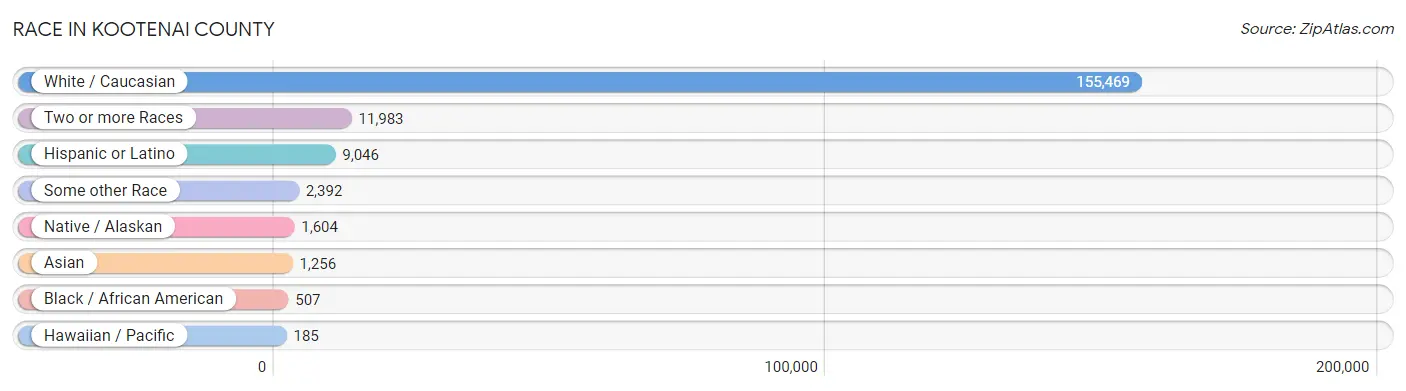
Race in Kootenai County
The most populous races in Kootenai County are White / Caucasian (155,469 | 89.7%), Two or more Races (11,983 | 6.9%), and Hispanic or Latino (9,046 | 5.2%).
| Race | # Population | % Population |
| Asian | 1,256 | 0.7% |
| Black / African American | 507 | 0.3% |
| Hawaiian / Pacific | 185 | 0.1% |
| Hispanic or Latino | 9,046 | 5.2% |
| Native / Alaskan | 1,604 | 0.9% |
| White / Caucasian | 155,469 | 89.7% |
| Two or more Races | 11,983 | 6.9% |
| Some other Race | 2,392 | 1.4% |
| Total | 173,396 | 100.0% |
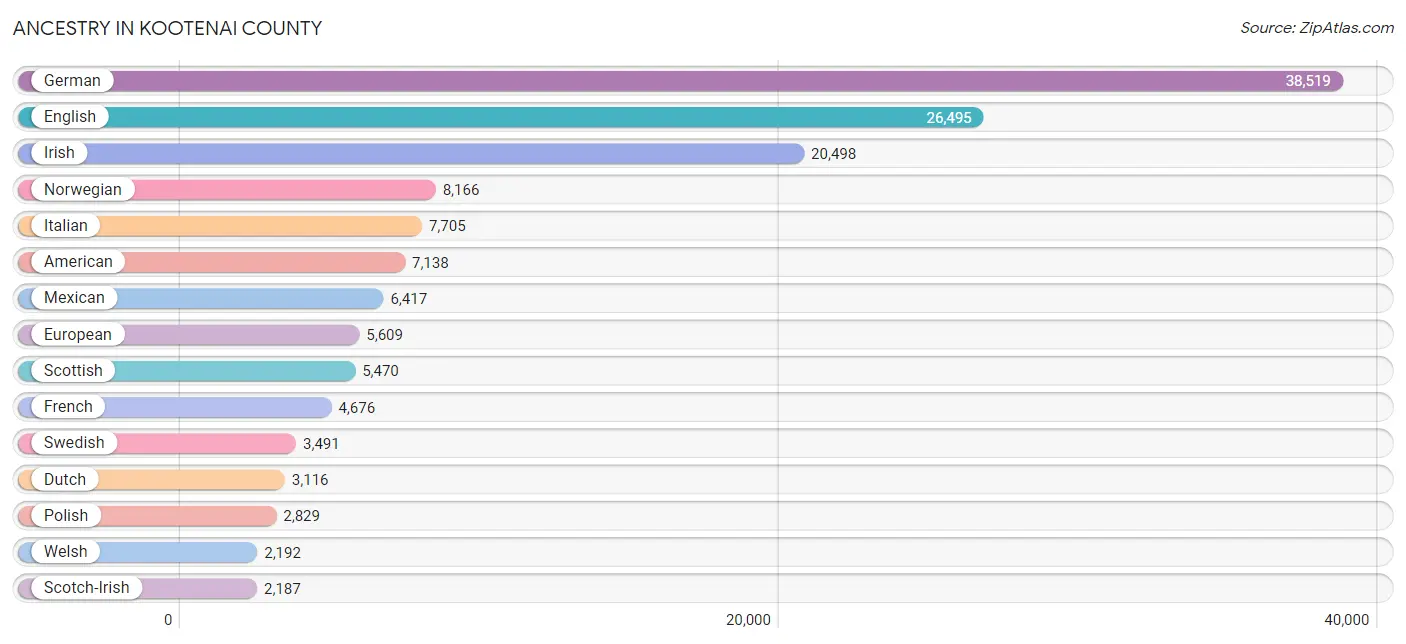
Ancestry in Kootenai County
The most populous ancestries reported in Kootenai County are German (38,519 | 22.2%), English (26,495 | 15.3%), Irish (20,498 | 11.8%), Norwegian (8,166 | 4.7%), and Italian (7,705 | 4.4%), together accounting for 58.5% of all Kootenai County residents.
| Ancestry | # Population | % Population |
| African | 50 | 0.0% |
| Albanian | 28 | 0.0% |
| Aleut | 39 | 0.0% |
| American | 7,138 | 4.1% |
| Apache | 160 | 0.1% |
| Arab | 163 | 0.1% |
| Argentinean | 10 | 0.0% |
| Armenian | 176 | 0.1% |
| Assyrian / Chaldean / Syriac | 9 | 0.0% |
| Australian | 82 | 0.1% |
| Austrian | 501 | 0.3% |
| Basque | 258 | 0.2% |
| Belgian | 95 | 0.1% |
| Bhutanese | 375 | 0.2% |
| Blackfeet | 269 | 0.2% |
| Brazilian | 28 | 0.0% |
| British | 1,437 | 0.8% |
| Bulgarian | 45 | 0.0% |
| Burmese | 248 | 0.1% |
| Canadian | 658 | 0.4% |
| Celtic | 21 | 0.0% |
| Central American | 387 | 0.2% |
| Central American Indian | 70 | 0.0% |
| Cherokee | 855 | 0.5% |
| Cheyenne | 12 | 0.0% |
| Chickasaw | 7 | 0.0% |
| Chilean | 38 | 0.0% |
| Chippewa | 72 | 0.0% |
| Choctaw | 143 | 0.1% |
| Colombian | 157 | 0.1% |
| Colville | 101 | 0.1% |
| Comanche | 10 | 0.0% |
| Cree | 84 | 0.1% |
| Creek | 78 | 0.0% |
| Croatian | 93 | 0.1% |
| Crow | 69 | 0.0% |
| Cuban | 87 | 0.1% |
| Czech | 440 | 0.3% |
| Czechoslovakian | 94 | 0.1% |
| Danish | 1,333 | 0.8% |
| Delaware | 32 | 0.0% |
| Dominican | 22 | 0.0% |
| Dutch | 3,116 | 1.8% |
| Eastern European | 159 | 0.1% |
| Ecuadorian | 12 | 0.0% |
| English | 26,495 | 15.3% |
| Estonian | 11 | 0.0% |
| Ethiopian | 15 | 0.0% |
| European | 5,609 | 3.2% |
| Finnish | 620 | 0.4% |
| French | 4,676 | 2.7% |
| French Canadian | 1,011 | 0.6% |
| German | 38,519 | 22.2% |
| Greek | 453 | 0.3% |
| Guamanian / Chamorro | 89 | 0.1% |
| Guatemalan | 5 | 0.0% |
| Honduran | 76 | 0.0% |
| Hopi | 6 | 0.0% |
| Hungarian | 508 | 0.3% |
| Icelander | 35 | 0.0% |
| Indian (Asian) | 462 | 0.3% |
| Inupiat | 126 | 0.1% |
| Iranian | 140 | 0.1% |
| Iraqi | 3 | 0.0% |
| Irish | 20,498 | 11.8% |
| Iroquois | 8 | 0.0% |
| Italian | 7,705 | 4.4% |
| Jamaican | 2 | 0.0% |
| Japanese | 46 | 0.0% |
| Jordanian | 10 | 0.0% |
| Korean | 1,481 | 0.9% |
| Laotian | 17 | 0.0% |
| Latvian | 6 | 0.0% |
| Lebanese | 59 | 0.0% |
| Lithuanian | 67 | 0.0% |
| Luxembourger | 80 | 0.1% |
| Macedonian | 17 | 0.0% |
| Malaysian | 24 | 0.0% |
| Maltese | 31 | 0.0% |
| Mexican | 6,417 | 3.7% |
| Mexican American Indian | 181 | 0.1% |
| Moroccan | 12 | 0.0% |
| Native Hawaiian | 364 | 0.2% |
| Navajo | 27 | 0.0% |
| New Zealander | 5 | 0.0% |
| Nicaraguan | 56 | 0.0% |
| Nigerian | 31 | 0.0% |
| Northern European | 440 | 0.3% |
| Norwegian | 8,166 | 4.7% |
| Paiute | 12 | 0.0% |
| Pakistani | 234 | 0.1% |
| Panamanian | 53 | 0.0% |
| Paraguayan | 6 | 0.0% |
| Pennsylvania German | 20 | 0.0% |
| Peruvian | 72 | 0.0% |
| Polish | 2,829 | 1.6% |
| Portuguese | 802 | 0.5% |
| Potawatomi | 75 | 0.0% |
| Pueblo | 3 | 0.0% |
| Puerto Rican | 638 | 0.4% |
| Puget Sound Salish | 10 | 0.0% |
| Romanian | 411 | 0.2% |
| Russian | 765 | 0.4% |
| Salvadoran | 182 | 0.1% |
| Samoan | 110 | 0.1% |
| Scandinavian | 1,879 | 1.1% |
| Scotch-Irish | 2,187 | 1.3% |
| Scottish | 5,470 | 3.2% |
| Seminole | 67 | 0.0% |
| Serbian | 14 | 0.0% |
| Shoshone | 3 | 0.0% |
| Sioux | 133 | 0.1% |
| Slavic | 51 | 0.0% |
| Slovak | 89 | 0.1% |
| Slovene | 22 | 0.0% |
| South African | 39 | 0.0% |
| South American | 308 | 0.2% |
| South American Indian | 18 | 0.0% |
| Spaniard | 387 | 0.2% |
| Spanish | 556 | 0.3% |
| Spanish American | 9 | 0.0% |
| Sri Lankan | 74 | 0.0% |
| Subsaharan African | 137 | 0.1% |
| Swedish | 3,491 | 2.0% |
| Swiss | 481 | 0.3% |
| Syrian | 3 | 0.0% |
| Thai | 197 | 0.1% |
| Tlingit-Haida | 14 | 0.0% |
| Tsimshian | 44 | 0.0% |
| Turkish | 22 | 0.0% |
| Ukrainian | 249 | 0.1% |
| Venezuelan | 13 | 0.0% |
| Welsh | 2,192 | 1.3% |
| West Indian | 9 | 0.0% |
| Yaqui | 5 | 0.0% |
| Yugoslavian | 51 | 0.0% | View All 136 Rows |
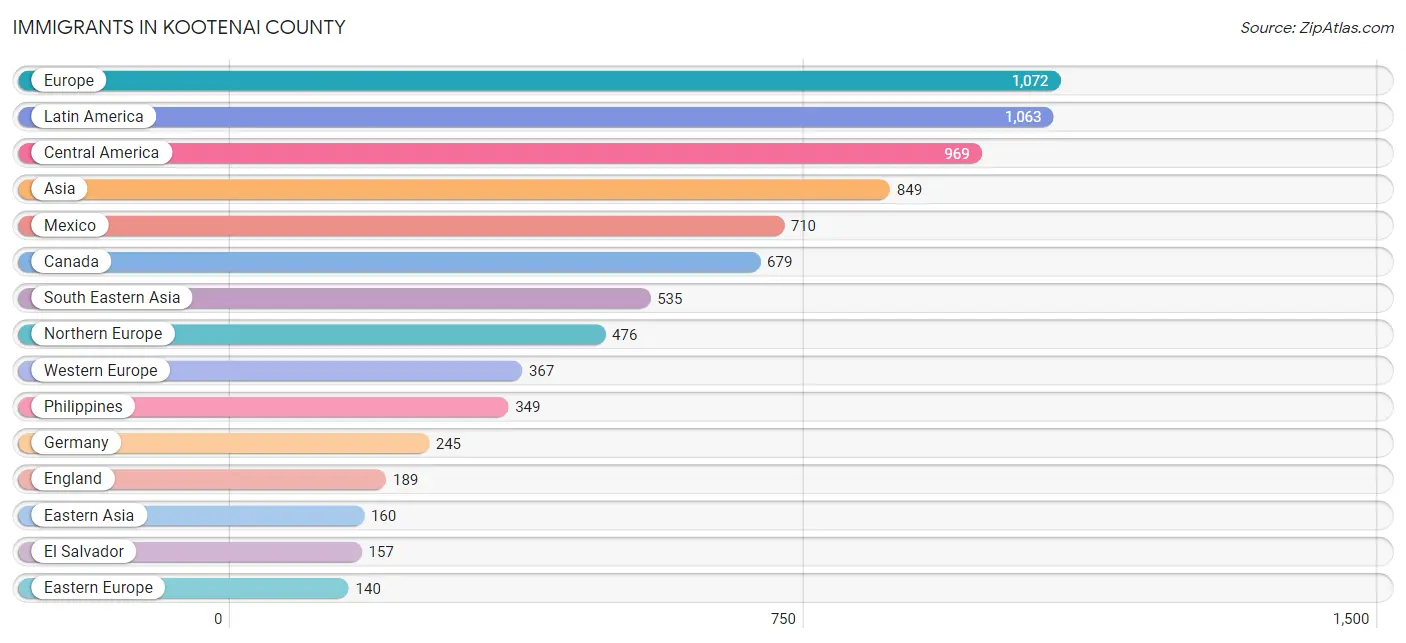
Immigrants in Kootenai County
The most numerous immigrant groups reported in Kootenai County came from Europe (1,072 | 0.6%), Latin America (1,063 | 0.6%), Central America (969 | 0.6%), Asia (849 | 0.5%), and Mexico (710 | 0.4%), together accounting for 2.7% of all Kootenai County residents.
| Immigration Origin | # Population | % Population |
| Africa | 129 | 0.1% |
| Argentina | 3 | 0.0% |
| Asia | 849 | 0.5% |
| Australia | 27 | 0.0% |
| Austria | 21 | 0.0% |
| Belgium | 20 | 0.0% |
| Brazil | 28 | 0.0% |
| Cambodia | 20 | 0.0% |
| Canada | 679 | 0.4% |
| Caribbean | 1 | 0.0% |
| Central America | 969 | 0.6% |
| China | 108 | 0.1% |
| Congo | 2 | 0.0% |
| Cuba | 1 | 0.0% |
| Eastern Africa | 52 | 0.0% |
| Eastern Asia | 160 | 0.1% |
| Eastern Europe | 140 | 0.1% |
| Ecuador | 9 | 0.0% |
| Egypt | 2 | 0.0% |
| El Salvador | 157 | 0.1% |
| England | 189 | 0.1% |
| Ethiopia | 16 | 0.0% |
| Europe | 1,072 | 0.6% |
| France | 8 | 0.0% |
| Germany | 245 | 0.1% |
| Guyana | 30 | 0.0% |
| Honduras | 47 | 0.0% |
| Hungary | 11 | 0.0% |
| India | 22 | 0.0% |
| Indonesia | 21 | 0.0% |
| Iran | 74 | 0.0% |
| Ireland | 34 | 0.0% |
| Italy | 26 | 0.0% |
| Japan | 4 | 0.0% |
| Jordan | 10 | 0.0% |
| Korea | 48 | 0.0% |
| Laos | 24 | 0.0% |
| Latin America | 1,063 | 0.6% |
| Malaysia | 1 | 0.0% |
| Mexico | 710 | 0.4% |
| Middle Africa | 2 | 0.0% |
| Netherlands | 47 | 0.0% |
| Nigeria | 22 | 0.0% |
| North Macedonia | 2 | 0.0% |
| Northern Africa | 2 | 0.0% |
| Northern Europe | 476 | 0.3% |
| Norway | 12 | 0.0% |
| Oceania | 32 | 0.0% |
| Panama | 55 | 0.0% |
| Peru | 17 | 0.0% |
| Philippines | 349 | 0.2% |
| Portugal | 11 | 0.0% |
| Romania | 36 | 0.0% |
| Russia | 50 | 0.0% |
| Scotland | 20 | 0.0% |
| Serbia | 5 | 0.0% |
| Singapore | 12 | 0.0% |
| South Africa | 51 | 0.0% |
| South America | 93 | 0.1% |
| South Central Asia | 110 | 0.1% |
| South Eastern Asia | 535 | 0.3% |
| Southern Europe | 89 | 0.1% |
| Spain | 52 | 0.0% |
| Switzerland | 26 | 0.0% |
| Thailand | 65 | 0.0% |
| Ukraine | 36 | 0.0% |
| Vietnam | 43 | 0.0% |
| Western Africa | 22 | 0.0% |
| Western Asia | 44 | 0.0% |
| Western Europe | 367 | 0.2% |
| Yemen | 31 | 0.0% |
| Zimbabwe | 26 | 0.0% | View All 72 Rows |
Sex and Age in Kootenai County
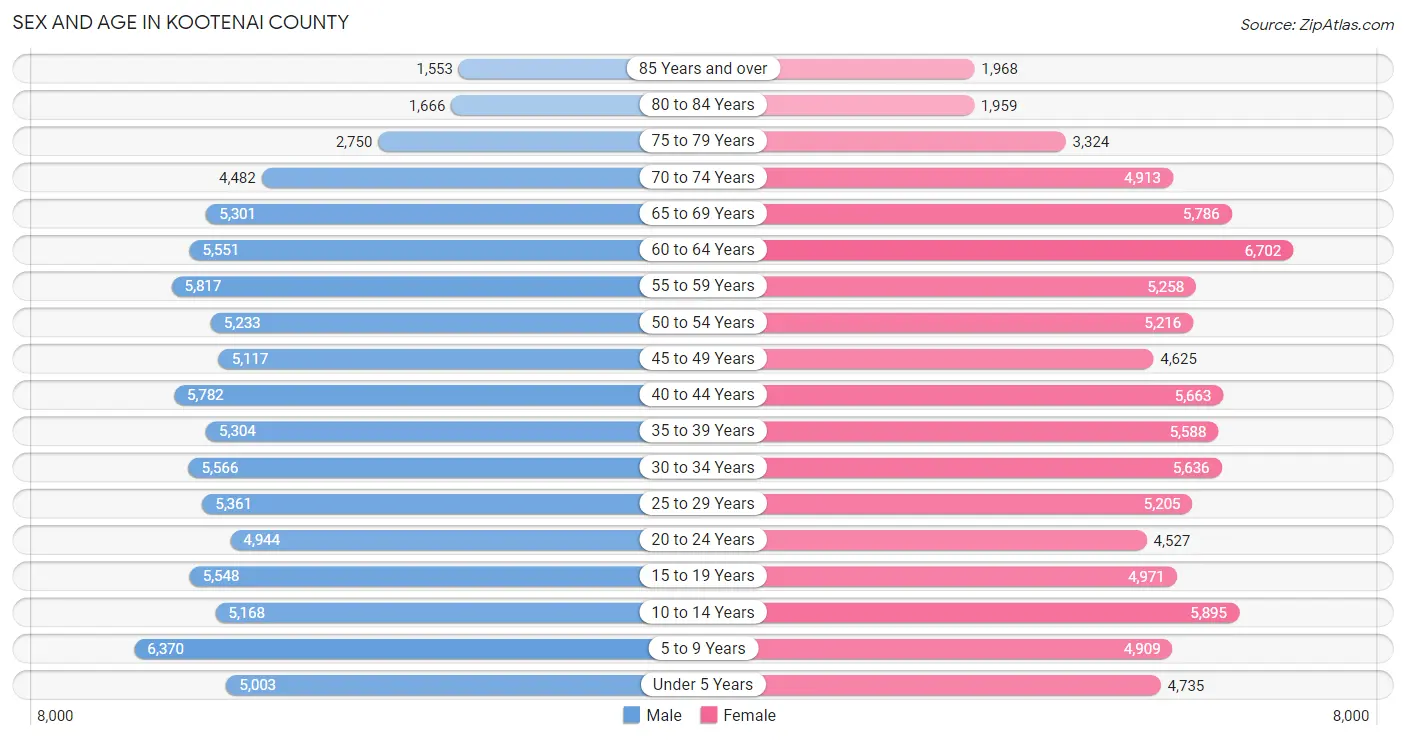
Sex and Age in Kootenai County
The most populous age groups in Kootenai County are 5 to 9 Years (6,370 | 7.4%) for men and 60 to 64 Years (6,702 | 7.7%) for women.
| Age Bracket | Male | Female |
| Under 5 Years | 5,003 (5.8%) | 4,735 (5.4%) |
| 5 to 9 Years | 6,370 (7.4%) | 4,909 (5.7%) |
| 10 to 14 Years | 5,168 (6.0%) | 5,895 (6.8%) |
| 15 to 19 Years | 5,548 (6.4%) | 4,971 (5.7%) |
| 20 to 24 Years | 4,944 (5.7%) | 4,527 (5.2%) |
| 25 to 29 Years | 5,361 (6.2%) | 5,205 (6.0%) |
| 30 to 34 Years | 5,566 (6.4%) | 5,636 (6.5%) |
| 35 to 39 Years | 5,304 (6.1%) | 5,588 (6.4%) |
| 40 to 44 Years | 5,782 (6.7%) | 5,663 (6.5%) |
| 45 to 49 Years | 5,117 (5.9%) | 4,625 (5.3%) |
| 50 to 54 Years | 5,233 (6.0%) | 5,216 (6.0%) |
| 55 to 59 Years | 5,817 (6.7%) | 5,258 (6.0%) |
| 60 to 64 Years | 5,551 (6.4%) | 6,702 (7.7%) |
| 65 to 69 Years | 5,301 (6.1%) | 5,786 (6.7%) |
| 70 to 74 Years | 4,482 (5.2%) | 4,913 (5.7%) |
| 75 to 79 Years | 2,750 (3.2%) | 3,324 (3.8%) |
| 80 to 84 Years | 1,666 (1.9%) | 1,959 (2.2%) |
| 85 Years and over | 1,553 (1.8%) | 1,968 (2.3%) |
| Total | 86,516 (100.0%) | 86,880 (100.0%) |
Families and Households in Kootenai County
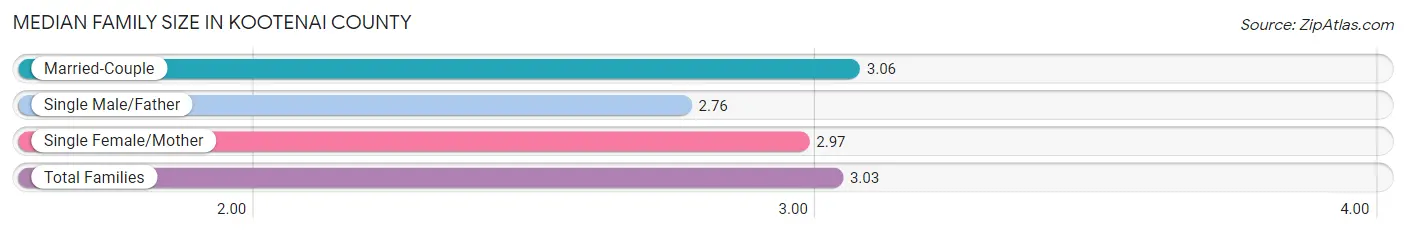
Median Family Size in Kootenai County
The median family size in Kootenai County is 3.03 persons per family, with married-couple families (37,289 | 80.8%) accounting for the largest median family size of 3.06 persons per family. On the other hand, single male/father families (3,424 | 7.4%) represent the smallest median family size with 2.76 persons per family.
| Family Type | # Families | Family Size |
| Married-Couple | 37,289 (80.8%) | 3.06 |
| Single Male/Father | 3,424 (7.4%) | 2.76 |
| Single Female/Mother | 5,449 (11.8%) | 2.97 |
| Total Families | 46,162 (100.0%) | 3.03 |
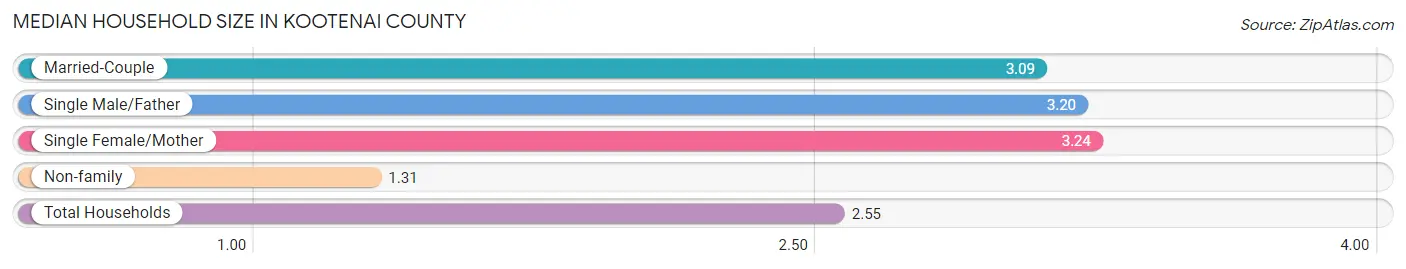
Median Household Size in Kootenai County
The median household size in Kootenai County is 2.55 persons per household, with single female/mother households (5,449 | 8.1%) accounting for the largest median household size of 3.24 persons per household. non-family households (20,840 | 31.1%) represent the smallest median household size with 1.31 persons per household.
| Household Type | # Households | Household Size |
| Married-Couple | 37,289 (55.6%) | 3.09 |
| Single Male/Father | 3,424 (5.1%) | 3.20 |
| Single Female/Mother | 5,449 (8.1%) | 3.24 |
| Non-family | 20,840 (31.1%) | 1.31 |
| Total Households | 67,002 (100.0%) | 2.55 |
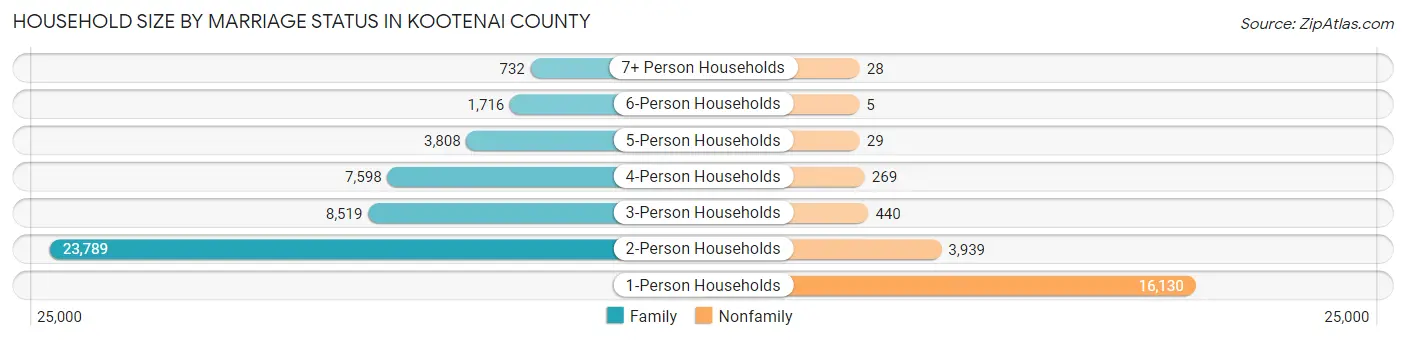
Household Size by Marriage Status in Kootenai County
Out of a total of 67,002 households in Kootenai County, 46,162 (68.9%) are family households, while 20,840 (31.1%) are nonfamily households. The most numerous type of family households are 2-person households, comprising 23,789, and the most common type of nonfamily households are 1-person households, comprising 16,130.
| Household Size | Family Households | Nonfamily Households |
| 1-Person Households | - | 16,130 (24.1%) |
| 2-Person Households | 23,789 (35.5%) | 3,939 (5.9%) |
| 3-Person Households | 8,519 (12.7%) | 440 (0.7%) |
| 4-Person Households | 7,598 (11.3%) | 269 (0.4%) |
| 5-Person Households | 3,808 (5.7%) | 29 (0.0%) |
| 6-Person Households | 1,716 (2.6%) | 5 (0.0%) |
| 7+ Person Households | 732 (1.1%) | 28 (0.0%) |
| Total | 46,162 (68.9%) | 20,840 (31.1%) |
Female Fertility in Kootenai County
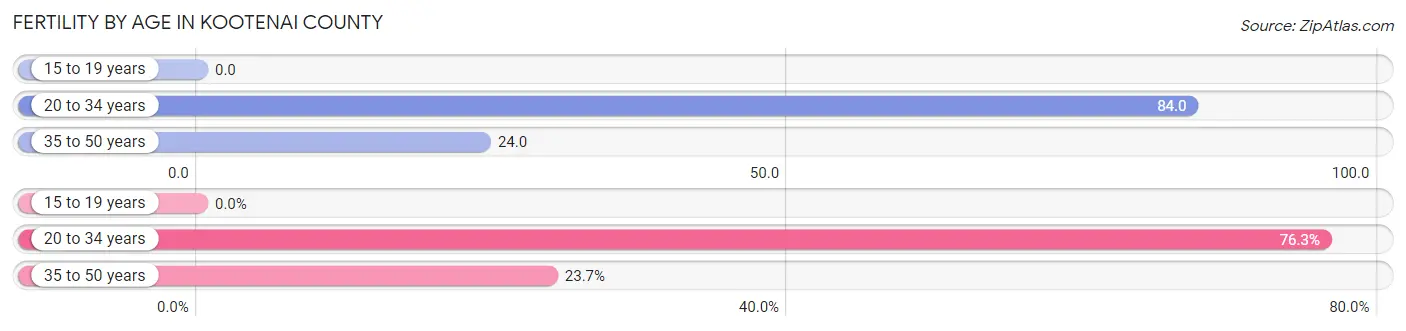
Fertility by Age in Kootenai County
Average fertility rate in Kootenai County is 45.0 births per 1,000 women. Women in the age bracket of 20 to 34 years have the highest fertility rate with 84.0 births per 1,000 women. Women in the age bracket of 20 to 34 years acount for 76.3% of all women with births.
| Age Bracket | Women with Births | Births / 1,000 Women |
| 15 to 19 years | 0 (0.0%) | 0.0 |
| 20 to 34 years | 1,288 (76.3%) | 84.0 |
| 35 to 50 years | 401 (23.7%) | 24.0 |
| Total | 1,689 (100.0%) | 45.0 |
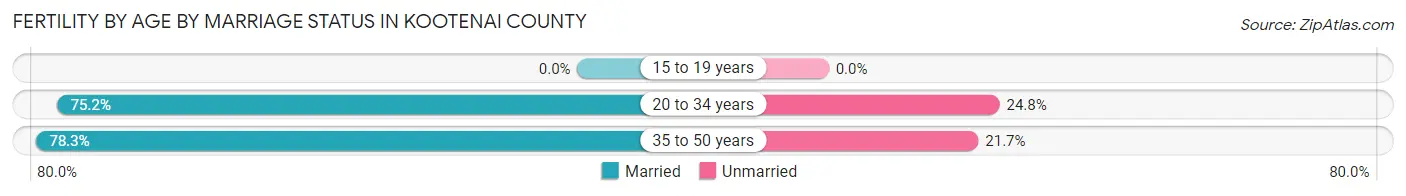
Fertility by Age by Marriage Status in Kootenai County
75.9% of women with births (1,689) in Kootenai County are married. The highest percentage of unmarried women with births falls into 20 to 34 years age bracket with 24.8% of them unmarried at the time of birth, while the lowest percentage of unmarried women with births belong to 35 to 50 years age bracket with 21.7% of them unmarried.
| Age Bracket | Married | Unmarried |
| 15 to 19 years | 0 (0.0%) | 0 (0.0%) |
| 20 to 34 years | 969 (75.2%) | 319 (24.8%) |
| 35 to 50 years | 314 (78.3%) | 87 (21.7%) |
| Total | 1,282 (75.9%) | 407 (24.1%) |
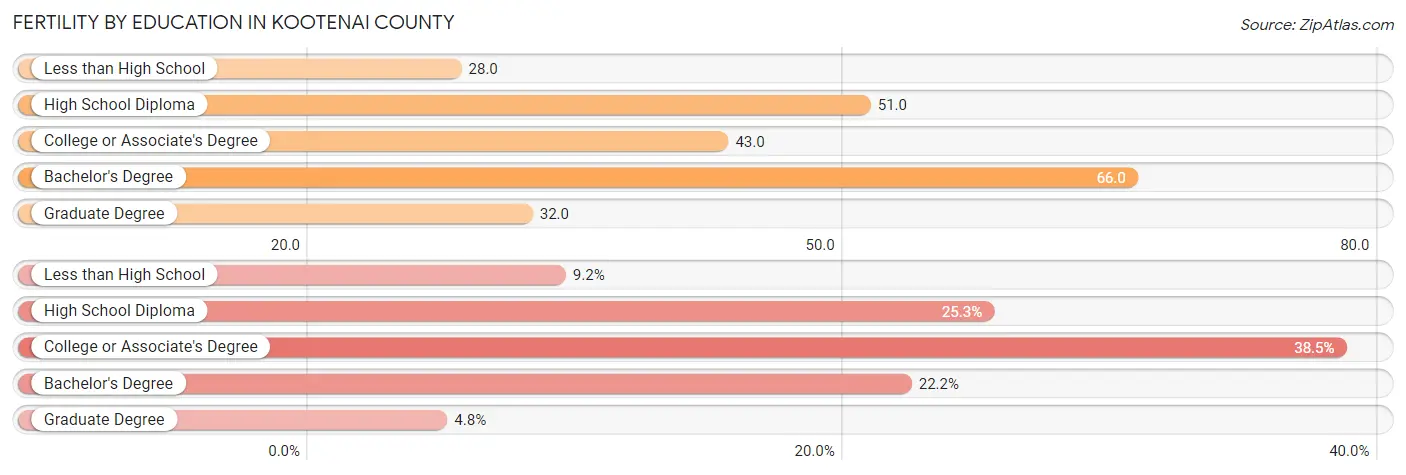
Fertility by Education in Kootenai County
Average fertility rate in Kootenai County is 45.0 births per 1,000 women. Women with the education attainment of bachelor's degree have the highest fertility rate of 66.0 births per 1,000 women, while women with the education attainment of less than high school have the lowest fertility at 28.0 births per 1,000 women. Women with the education attainment of college or associate's degree represent 38.5% of all women with births.
| Educational Attainment | Women with Births | Births / 1,000 Women |
| Less than High School | 156 (9.2%) | 28.0 |
| High School Diploma | 427 (25.3%) | 51.0 |
| College or Associate's Degree | 650 (38.5%) | 43.0 |
| Bachelor's Degree | 375 (22.2%) | 66.0 |
| Graduate Degree | 81 (4.8%) | 32.0 |
| Total | 1,689 (100.0%) | 45.0 |
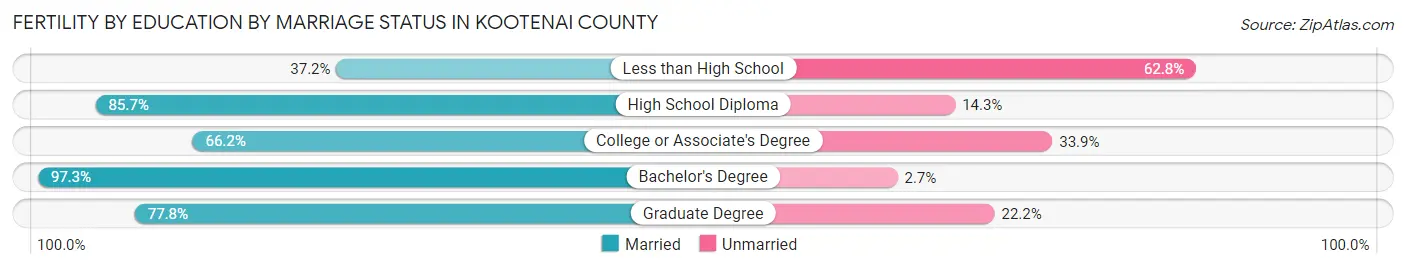
Fertility by Education by Marriage Status in Kootenai County
24.1% of women with births in Kootenai County are unmarried. Women with the educational attainment of bachelor's degree are most likely to be married with 97.3% of them married at childbirth, while women with the educational attainment of less than high school are least likely to be married with 62.8% of them unmarried at childbirth.
| Educational Attainment | Married | Unmarried |
| Less than High School | 58 (37.2%) | 98 (62.8%) |
| High School Diploma | 366 (85.7%) | 61 (14.3%) |
| College or Associate's Degree | 430 (66.1%) | 220 (33.9%) |
| Bachelor's Degree | 365 (97.3%) | 10 (2.7%) |
| Graduate Degree | 63 (77.8%) | 18 (22.2%) |
| Total | 1,282 (75.9%) | 407 (24.1%) |
Income in Kootenai County
Income Overview in Kootenai County
Per Capita Income in Kootenai County is $36,718, while median incomes of families and households are $84,489 and $71,949 respectively.
| Characteristic | Number | Measure |
| Per Capita Income | 173,396 | $36,718 |
| Median Family Income | 46,162 | $84,489 |
| Mean Family Income | 46,162 | $105,856 |
| Median Household Income | 67,002 | $71,949 |
| Mean Household Income | 67,002 | $92,570 |
| Income Deficit | 46,162 | $10,129 |
| Wage / Income Gap (%) | 173,396 | 35.06% |
| Wage / Income Gap ($) | 173,396 | 64.94¢ per $1 |
| Gini / Inequality Index | 173,396 | 0.43 |
Earnings by Sex in Kootenai County
Average Earnings in Kootenai County are $38,621, $46,578 for men and $30,248 for women, a difference of 35.1%.
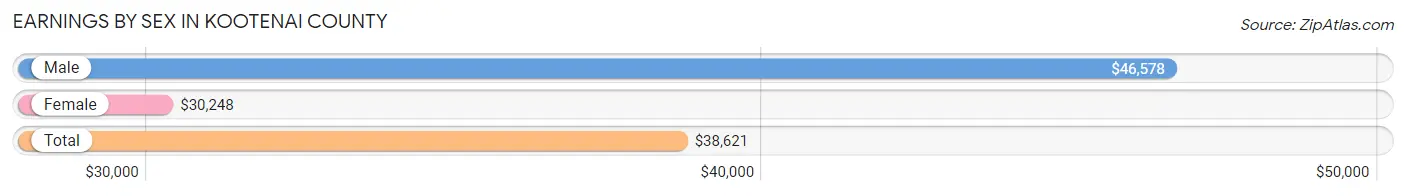
| Sex | Number | Average Earnings |
| Male | 47,435 (53.0%) | $46,578 |
| Female | 42,049 (47.0%) | $30,248 |
| Total | 89,484 (100.0%) | $38,621 |
Earnings by Sex by Income Bracket in Kootenai County
The most common earnings brackets in Kootenai County are $100,000+ for men (6,360 | 13.4%) and $30,000 to $34,999 for women (3,275 | 7.8%).
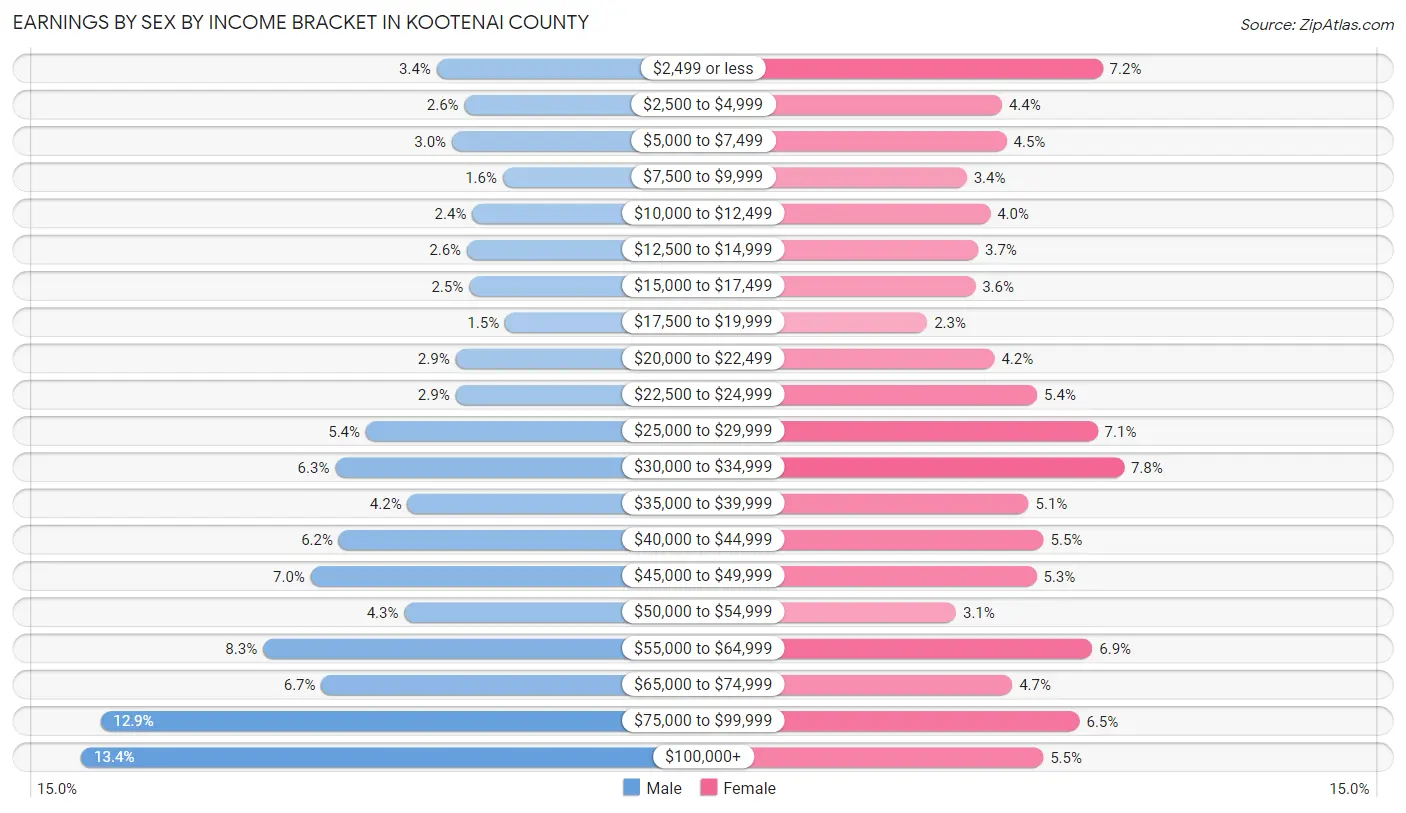
| Income | Male | Female |
| $2,499 or less | 1,624 (3.4%) | 3,024 (7.2%) |
| $2,500 to $4,999 | 1,252 (2.6%) | 1,833 (4.4%) |
| $5,000 to $7,499 | 1,416 (3.0%) | 1,890 (4.5%) |
| $7,500 to $9,999 | 741 (1.6%) | 1,416 (3.4%) |
| $10,000 to $12,499 | 1,147 (2.4%) | 1,693 (4.0%) |
| $12,500 to $14,999 | 1,218 (2.6%) | 1,552 (3.7%) |
| $15,000 to $17,499 | 1,189 (2.5%) | 1,519 (3.6%) |
| $17,500 to $19,999 | 710 (1.5%) | 952 (2.3%) |
| $20,000 to $22,499 | 1,371 (2.9%) | 1,743 (4.2%) |
| $22,500 to $24,999 | 1,371 (2.9%) | 2,251 (5.3%) |
| $25,000 to $29,999 | 2,566 (5.4%) | 2,966 (7.0%) |
| $30,000 to $34,999 | 2,975 (6.3%) | 3,275 (7.8%) |
| $35,000 to $39,999 | 2,013 (4.2%) | 2,150 (5.1%) |
| $40,000 to $44,999 | 2,926 (6.2%) | 2,327 (5.5%) |
| $45,000 to $49,999 | 3,303 (7.0%) | 2,241 (5.3%) |
| $50,000 to $54,999 | 2,052 (4.3%) | 1,292 (3.1%) |
| $55,000 to $64,999 | 3,938 (8.3%) | 2,901 (6.9%) |
| $65,000 to $74,999 | 3,157 (6.7%) | 1,954 (4.6%) |
| $75,000 to $99,999 | 6,106 (12.9%) | 2,749 (6.5%) |
| $100,000+ | 6,360 (13.4%) | 2,321 (5.5%) |
| Total | 47,435 (100.0%) | 42,049 (100.0%) |
Earnings by Sex by Educational Attainment in Kootenai County
Average earnings in Kootenai County are $51,574 for men and $33,902 for women, a difference of 34.3%. Men with an educational attainment of graduate degree enjoy the highest average annual earnings of $86,094, while those with less than high school education earn the least with $32,833. Women with an educational attainment of graduate degree earn the most with the average annual earnings of $62,043, while those with less than high school education have the smallest earnings of $17,604.
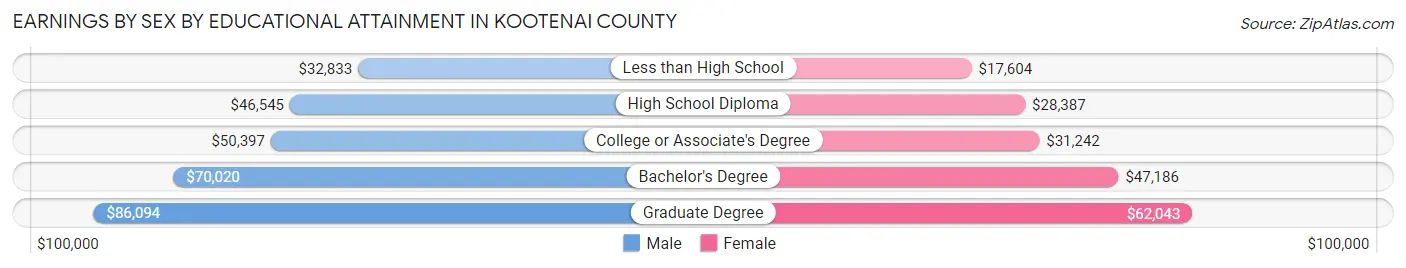
| Educational Attainment | Male Income | Female Income |
| Less than High School | $32,833 | $17,604 |
| High School Diploma | $46,545 | $28,387 |
| College or Associate's Degree | $50,397 | $31,242 |
| Bachelor's Degree | $70,020 | $47,186 |
| Graduate Degree | $86,094 | $62,043 |
| Total | $51,574 | $33,902 |
Family Income in Kootenai County
Family Income Brackets in Kootenai County
According to the Kootenai County family income data, there are 11,033 families falling into the $100,000 to $149,999 income range, which is the most common income bracket and makes up 23.9% of all families. Conversely, the $10,000 to $14,999 income bracket is the least frequent group with only 646 families (1.4%) belonging to this category.
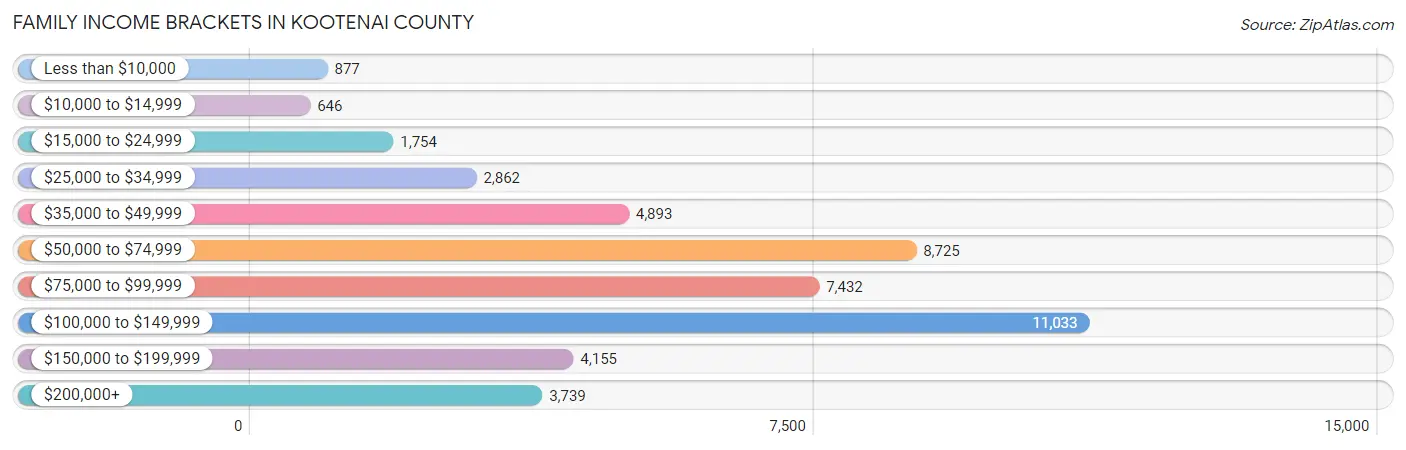
| Income Bracket | # Families | % Families |
| Less than $10,000 | 877 | 1.9% |
| $10,000 to $14,999 | 646 | 1.4% |
| $15,000 to $24,999 | 1,754 | 3.8% |
| $25,000 to $34,999 | 2,862 | 6.2% |
| $35,000 to $49,999 | 4,893 | 10.6% |
| $50,000 to $74,999 | 8,725 | 18.9% |
| $75,000 to $99,999 | 7,432 | 16.1% |
| $100,000 to $149,999 | 11,033 | 23.9% |
| $150,000 to $199,999 | 4,155 | 9.0% |
| $200,000+ | 3,739 | 8.1% |
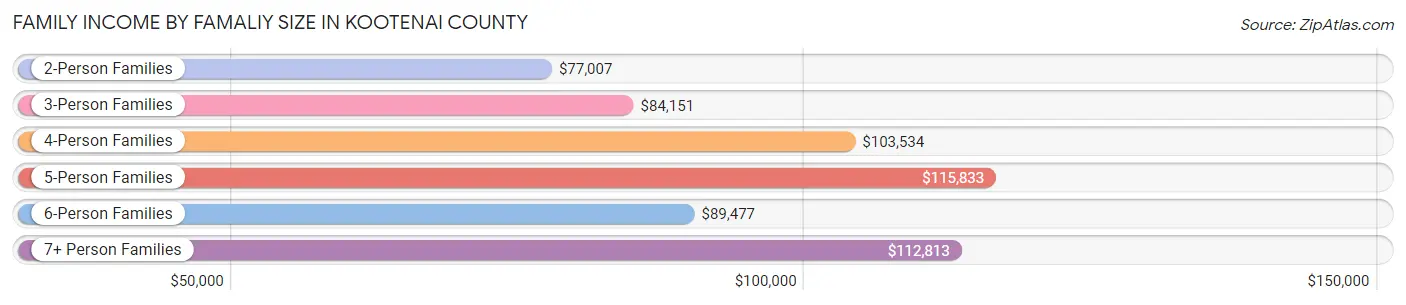
Family Income by Famaliy Size in Kootenai County
5-person families (3,316 | 7.2%) account for the highest median family income in Kootenai County with $115,833 per family, while 2-person families (25,091 | 54.3%) have the highest median income of $38,504 per family member.
| Income Bracket | # Families | Median Income |
| 2-Person Families | 25,091 (54.3%) | $77,007 |
| 3-Person Families | 8,462 (18.3%) | $84,151 |
| 4-Person Families | 7,124 (15.4%) | $103,534 |
| 5-Person Families | 3,316 (7.2%) | $115,833 |
| 6-Person Families | 1,542 (3.3%) | $89,477 |
| 7+ Person Families | 627 (1.4%) | $112,813 |
| Total | 46,162 (100.0%) | $84,489 |
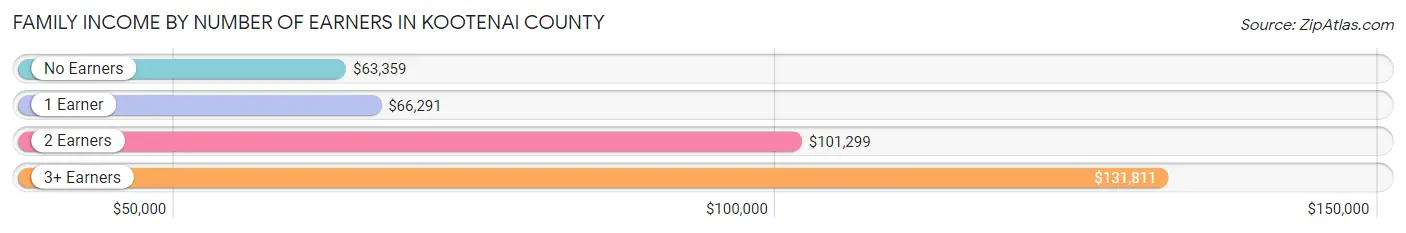
Family Income by Number of Earners in Kootenai County
The median family income in Kootenai County is $84,489, with families comprising 3+ earners (4,303) having the highest median family income of $131,811, while families with no earners (9,127) have the lowest median family income of $63,359, accounting for 9.3% and 19.8% of families, respectively.
| Number of Earners | # Families | Median Income |
| No Earners | 9,127 (19.8%) | $63,359 |
| 1 Earner | 13,759 (29.8%) | $66,291 |
| 2 Earners | 18,973 (41.1%) | $101,299 |
| 3+ Earners | 4,303 (9.3%) | $131,811 |
| Total | 46,162 (100.0%) | $84,489 |
Household Income in Kootenai County
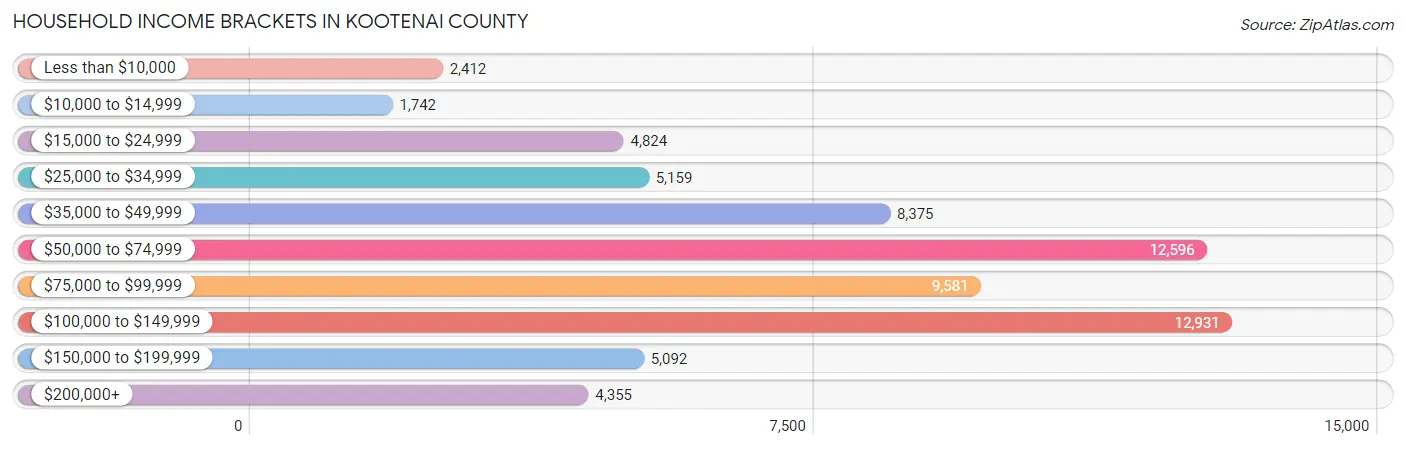
Household Income Brackets in Kootenai County
With 12,931 households falling in the category, the $100,000 to $149,999 income range is the most frequent in Kootenai County, accounting for 19.3% of all households. In contrast, only 1,742 households (2.6%) fall into the $10,000 to $14,999 income bracket, making it the least populous group.
| Income Bracket | # Households | % Households |
| Less than $10,000 | 2,412 | 3.6% |
| $10,000 to $14,999 | 1,742 | 2.6% |
| $15,000 to $24,999 | 4,824 | 7.2% |
| $25,000 to $34,999 | 5,159 | 7.7% |
| $35,000 to $49,999 | 8,375 | 12.5% |
| $50,000 to $74,999 | 12,596 | 18.8% |
| $75,000 to $99,999 | 9,581 | 14.3% |
| $100,000 to $149,999 | 12,931 | 19.3% |
| $150,000 to $199,999 | 5,092 | 7.6% |
| $200,000+ | 4,355 | 6.5% |
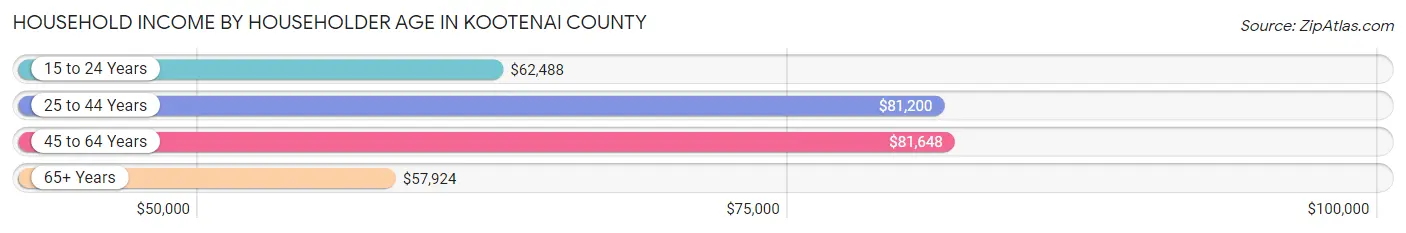
Household Income by Householder Age in Kootenai County
The median household income in Kootenai County is $71,949, with the highest median household income of $81,648 found in the 45 to 64 years age bracket for the primary householder. A total of 23,388 households (34.9%) fall into this category. Meanwhile, the 65+ years age bracket for the primary householder has the lowest median household income of $57,924, with 20,315 households (30.3%) in this group.
| Income Bracket | # Households | Median Income |
| 15 to 24 Years | 2,308 (3.4%) | $62,488 |
| 25 to 44 Years | 20,991 (31.3%) | $81,200 |
| 45 to 64 Years | 23,388 (34.9%) | $81,648 |
| 65+ Years | 20,315 (30.3%) | $57,924 |
| Total | 67,002 (100.0%) | $71,949 |
Poverty in Kootenai County
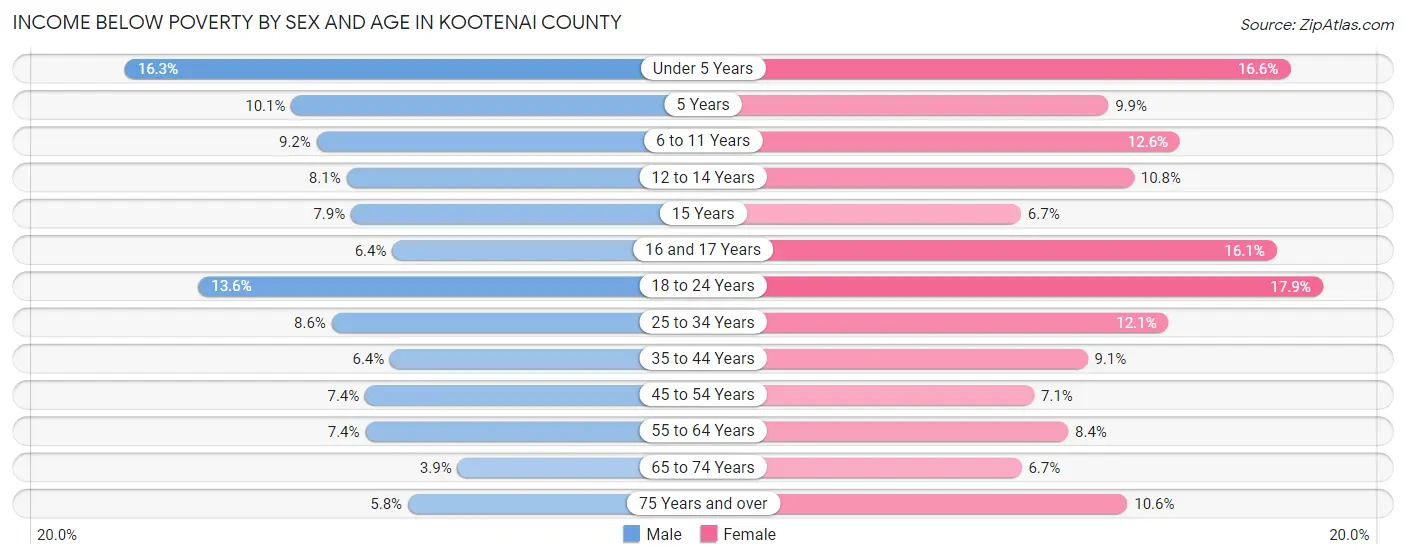
Income Below Poverty by Sex and Age in Kootenai County
With 8.1% poverty level for males and 10.4% for females among the residents of Kootenai County, under 5 year old males and 18 to 24 year old females are the most vulnerable to poverty, with 787 males (16.3%) and 1,078 females (17.8%) in their respective age groups living below the poverty level.
| Age Bracket | Male | Female |
| Under 5 Years | 787 (16.3%) | 781 (16.6%) |
| 5 Years | 154 (10.1%) | 113 (9.9%) |
| 6 to 11 Years | 612 (9.2%) | 688 (12.6%) |
| 12 to 14 Years | 249 (8.1%) | 426 (10.8%) |
| 15 Years | 113 (7.9%) | 84 (6.7%) |
| 16 and 17 Years | 135 (6.4%) | 328 (16.1%) |
| 18 to 24 Years | 911 (13.6%) | 1,078 (17.8%) |
| 25 to 34 Years | 932 (8.6%) | 1,309 (12.1%) |
| 35 to 44 Years | 709 (6.4%) | 1,023 (9.1%) |
| 45 to 54 Years | 758 (7.4%) | 699 (7.1%) |
| 55 to 64 Years | 832 (7.3%) | 1,004 (8.4%) |
| 65 to 74 Years | 380 (3.9%) | 707 (6.7%) |
| 75 Years and over | 330 (5.8%) | 715 (10.6%) |
| Total | 6,902 (8.1%) | 8,955 (10.4%) |
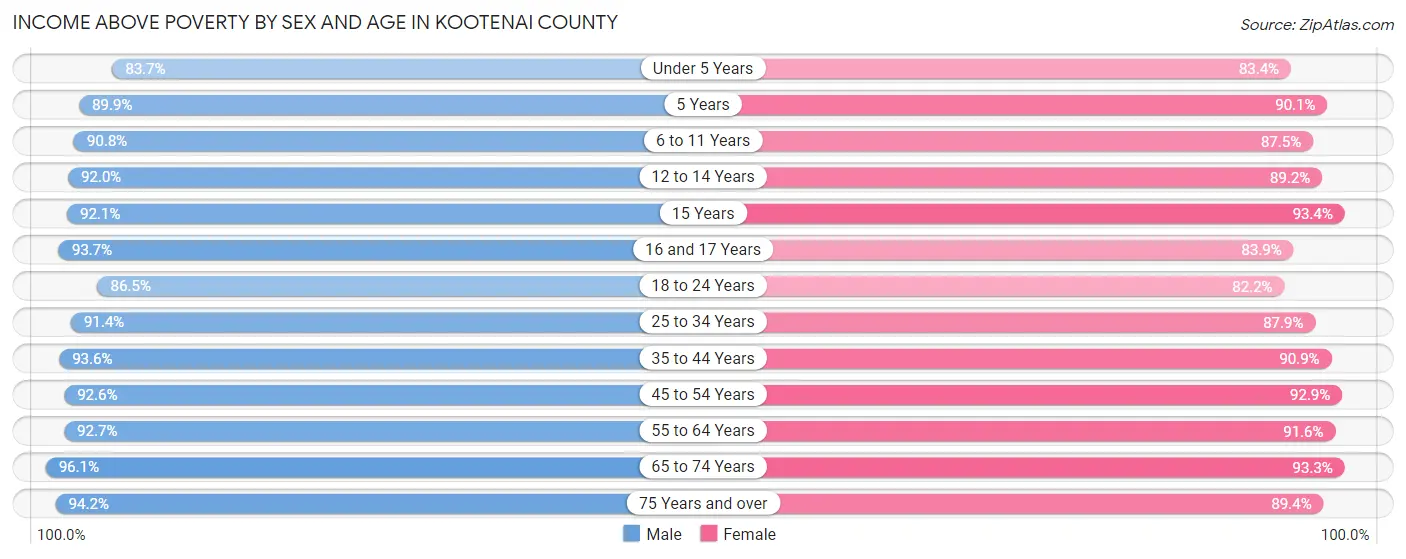
Income Above Poverty by Sex and Age in Kootenai County
According to the poverty statistics in Kootenai County, males aged 65 to 74 years and females aged 15 years are the age groups that are most secure financially, with 96.1% of males and 93.3% of females in these age groups living above the poverty line.
| Age Bracket | Male | Female |
| Under 5 Years | 4,048 (83.7%) | 3,913 (83.4%) |
| 5 Years | 1,371 (89.9%) | 1,030 (90.1%) |
| 6 to 11 Years | 6,070 (90.8%) | 4,794 (87.5%) |
| 12 to 14 Years | 2,846 (91.9%) | 3,505 (89.2%) |
| 15 Years | 1,321 (92.1%) | 1,180 (93.3%) |
| 16 and 17 Years | 1,991 (93.6%) | 1,704 (83.9%) |
| 18 to 24 Years | 5,810 (86.5%) | 4,960 (82.2%) |
| 25 to 34 Years | 9,906 (91.4%) | 9,481 (87.9%) |
| 35 to 44 Years | 10,317 (93.6%) | 10,193 (90.9%) |
| 45 to 54 Years | 9,541 (92.6%) | 9,097 (92.9%) |
| 55 to 64 Years | 10,486 (92.6%) | 10,945 (91.6%) |
| 65 to 74 Years | 9,298 (96.1%) | 9,899 (93.3%) |
| 75 Years and over | 5,391 (94.2%) | 6,032 (89.4%) |
| Total | 78,396 (91.9%) | 76,733 (89.5%) |
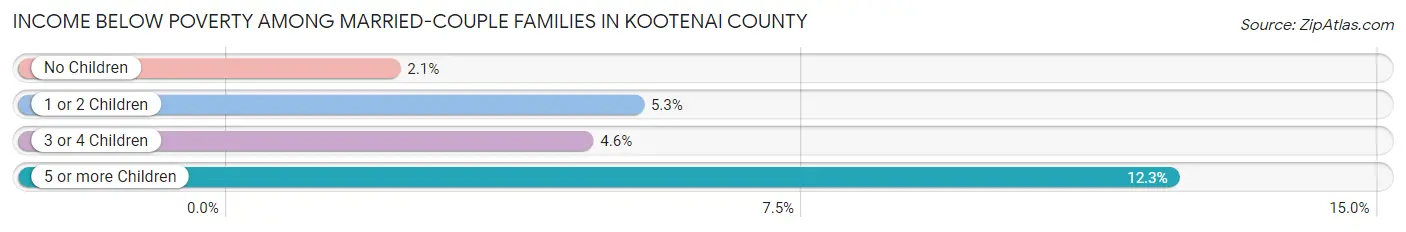
Income Below Poverty Among Married-Couple Families in Kootenai County
The poverty statistics for married-couple families in Kootenai County show that 3.3% or 1,227 of the total 37,289 families live below the poverty line. Families with 5 or more children have the highest poverty rate of 12.3%, comprising of 36 families. On the other hand, families with no children have the lowest poverty rate of 2.1%, which includes 502 families.
| Children | Above Poverty | Below Poverty |
| No Children | 23,125 (97.9%) | 502 (2.1%) |
| 1 or 2 Children | 9,863 (94.7%) | 552 (5.3%) |
| 3 or 4 Children | 2,817 (95.4%) | 137 (4.6%) |
| 5 or more Children | 257 (87.7%) | 36 (12.3%) |
| Total | 36,062 (96.7%) | 1,227 (3.3%) |
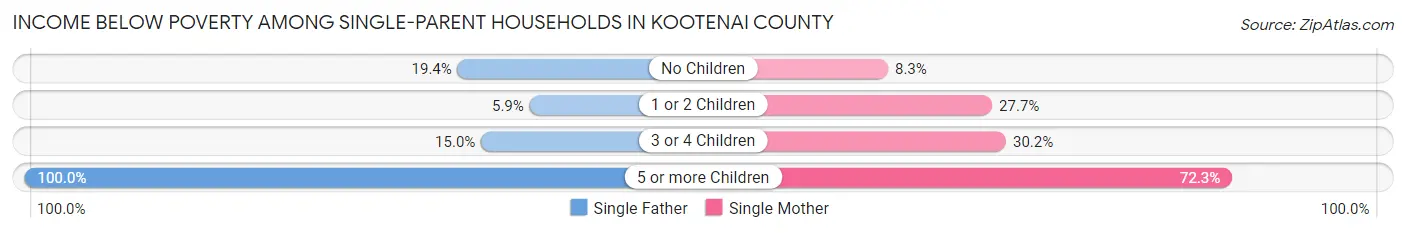
Income Below Poverty Among Single-Parent Households in Kootenai County
According to the poverty data in Kootenai County, 13.0% or 445 single-father households and 21.3% or 1,163 single-mother households are living below the poverty line. Among single-father households, those with 5 or more children have the highest poverty rate, with 39 households (100.0%) experiencing poverty. Likewise, among single-mother households, those with 5 or more children have the highest poverty rate, with 34 households (72.3%) falling below the poverty line.
| Children | Single Father | Single Mother |
| No Children | 263 (19.4%) | 161 (8.3%) |
| 1 or 2 Children | 105 (5.9%) | 818 (27.7%) |
| 3 or 4 Children | 38 (15.0%) | 150 (30.2%) |
| 5 or more Children | 39 (100.0%) | 34 (72.3%) |
| Total | 445 (13.0%) | 1,163 (21.3%) |
Income Below Poverty Among Married-Couple vs Single-Parent Households in Kootenai County
The poverty data for Kootenai County shows that 1,227 of the married-couple family households (3.3%) and 1,608 of the single-parent households (18.1%) are living below the poverty level. Within the married-couple family households, those with 5 or more children have the highest poverty rate, with 36 households (12.3%) falling below the poverty line. Among the single-parent households, those with 5 or more children have the highest poverty rate, with 73 household (84.9%) living below poverty.
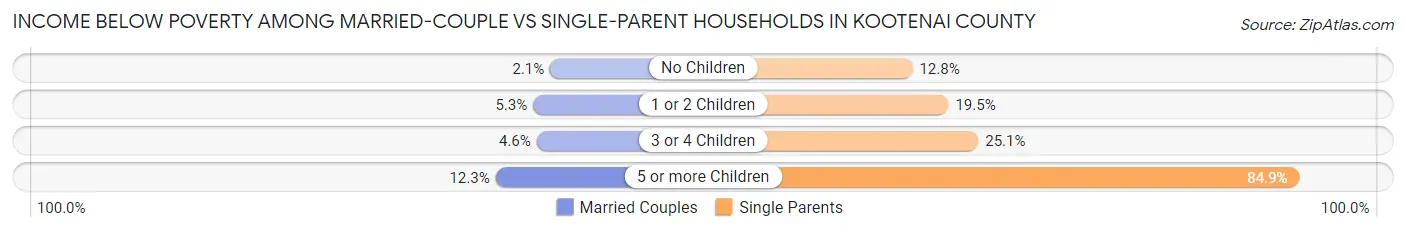
| Children | Married-Couple Families | Single-Parent Households |
| No Children | 502 (2.1%) | 424 (12.8%) |
| 1 or 2 Children | 552 (5.3%) | 923 (19.5%) |
| 3 or 4 Children | 137 (4.6%) | 188 (25.1%) |
| 5 or more Children | 36 (12.3%) | 73 (84.9%) |
| Total | 1,227 (3.3%) | 1,608 (18.1%) |
Employment Characteristics in Kootenai County
Employment by Class of Employer in Kootenai County
Among the 80,056 employed individuals in Kootenai County, private company employees (53,942 | 67.4%), self-employed (not incorporated) (7,051 | 8.8%), and not-for-profit organizations (5,921 | 7.4%) make up the most common classes of employment.
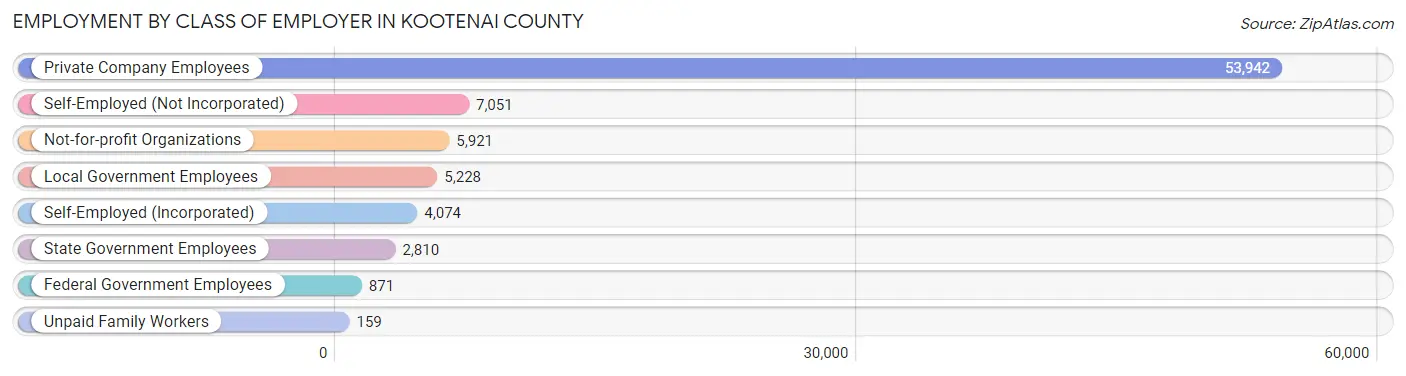
| Employer Class | # Employees | % Employees |
| Private Company Employees | 53,942 | 67.4% |
| Self-Employed (Incorporated) | 4,074 | 5.1% |
| Self-Employed (Not Incorporated) | 7,051 | 8.8% |
| Not-for-profit Organizations | 5,921 | 7.4% |
| Local Government Employees | 5,228 | 6.5% |
| State Government Employees | 2,810 | 3.5% |
| Federal Government Employees | 871 | 1.1% |
| Unpaid Family Workers | 159 | 0.2% |
| Total | 80,056 | 100.0% |
Employment Status by Age in Kootenai County
According to the labor force statistics for Kootenai County, out of the total population over 16 years of age (138,605), 60.7% or 84,133 individuals are in the labor force, with 3.1% or 2,608 of them unemployed. The age group with the highest labor force participation rate is 25 to 29 years, with 86.6% or 9,150 individuals in the labor force. Within the labor force, the 16 to 19 years age range has the highest percentage of unemployed individuals, with 10.7% or 398 of them being unemployed.
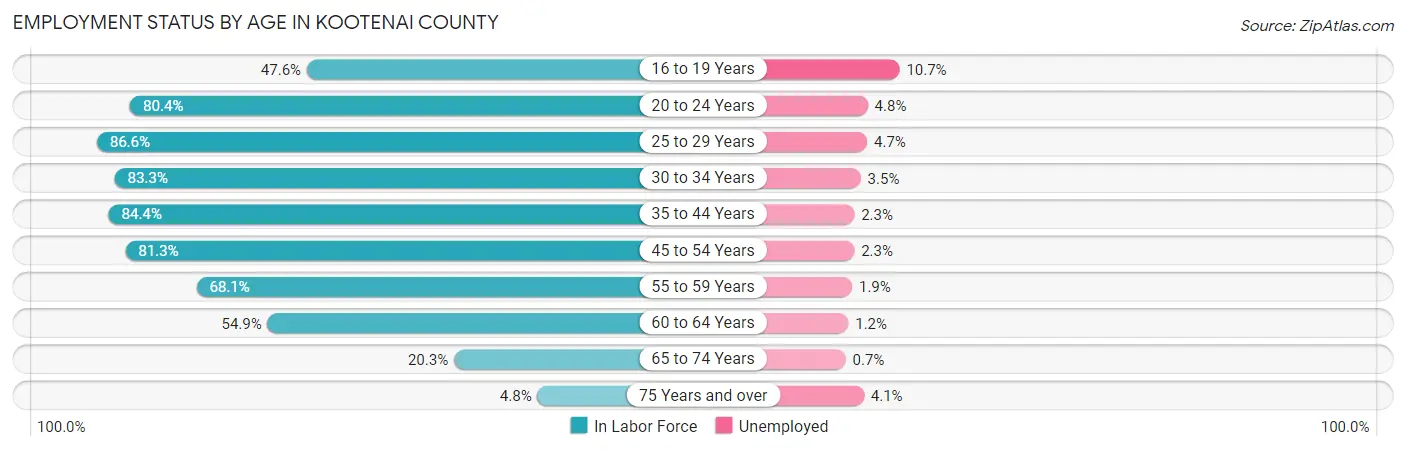
| Age Bracket | In Labor Force | Unemployed |
| 16 to 19 Years | 3,717 (47.6%) | 398 (10.7%) |
| 20 to 24 Years | 7,615 (80.4%) | 366 (4.8%) |
| 25 to 29 Years | 9,150 (86.6%) | 430 (4.7%) |
| 30 to 34 Years | 9,331 (83.3%) | 327 (3.5%) |
| 35 to 44 Years | 18,852 (84.4%) | 434 (2.3%) |
| 45 to 54 Years | 16,415 (81.3%) | 378 (2.3%) |
| 55 to 59 Years | 7,542 (68.1%) | 143 (1.9%) |
| 60 to 64 Years | 6,727 (54.9%) | 81 (1.2%) |
| 65 to 74 Years | 4,158 (20.3%) | 29 (0.7%) |
| 75 Years and over | 635 (4.8%) | 26 (4.1%) |
| Total | 84,133 (60.7%) | 2,608 (3.1%) |
Employment Status by Educational Attainment in Kootenai County
According to labor force statistics for Kootenai County, 77.6% of individuals (67,996) out of the total population between 25 and 64 years of age (87,624) are in the labor force, with 2.7% or 1,836 of them being unemployed. The group with the highest labor force participation rate are those with the educational attainment of bachelor's degree or higher, with 80.9% or 18,012 individuals in the labor force. Within the labor force, individuals with less than high school education have the highest percentage of unemployment, with 5.5% or 196 of them being unemployed.
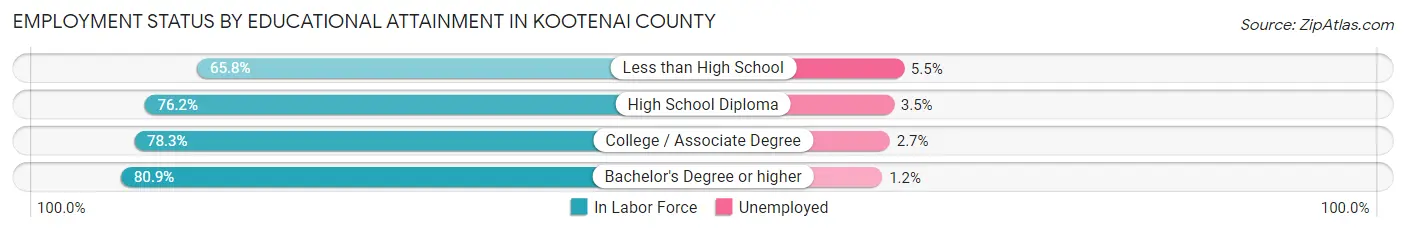
| Educational Attainment | In Labor Force | Unemployed |
| Less than High School | 3,565 (65.8%) | 298 (5.5%) |
| High School Diploma | 18,308 (76.2%) | 841 (3.5%) |
| College / Associate Degree | 28,122 (78.3%) | 970 (2.7%) |
| Bachelor's Degree or higher | 18,012 (80.9%) | 267 (1.2%) |
| Total | 67,996 (77.6%) | 2,366 (2.7%) |
Employment Occupations by Sex in Kootenai County
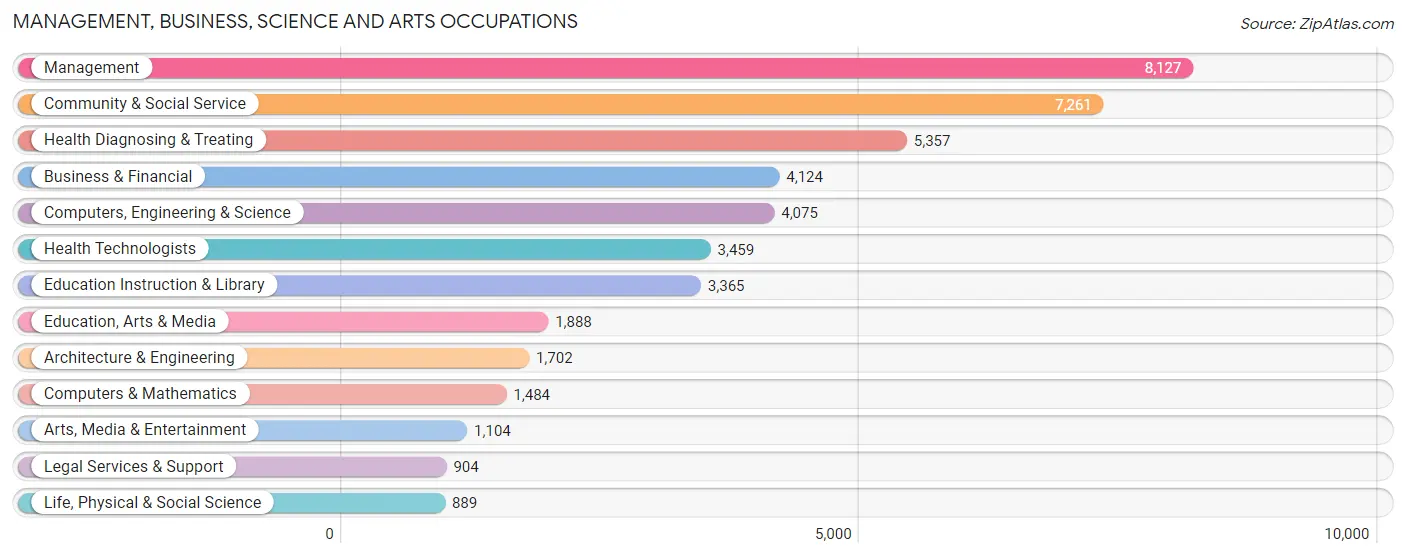
Management, Business, Science and Arts Occupations
The most common Management, Business, Science and Arts occupations in Kootenai County are Management (8,127 | 10.0%), Community & Social Service (7,261 | 8.9%), Health Diagnosing & Treating (5,357 | 6.6%), Business & Financial (4,124 | 5.1%), and Computers, Engineering & Science (4,075 | 5.0%).
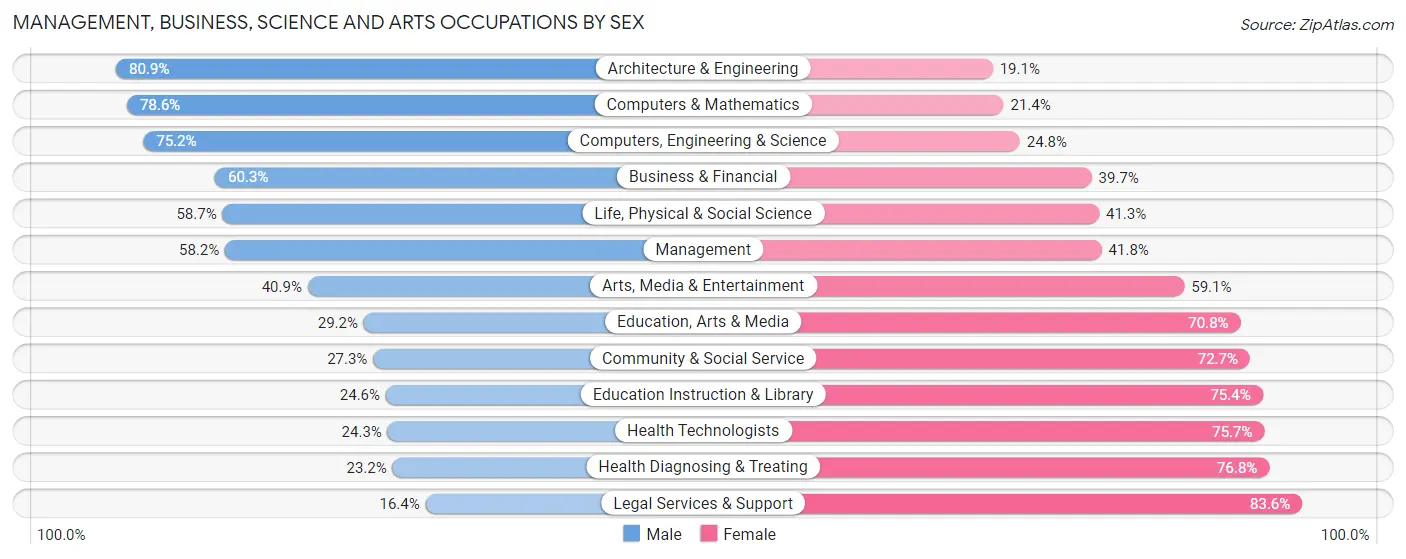
Management, Business, Science and Arts Occupations by Sex
Within the Management, Business, Science and Arts occupations in Kootenai County, the most male-oriented occupations are Architecture & Engineering (80.9%), Computers & Mathematics (78.6%), and Computers, Engineering & Science (75.2%), while the most female-oriented occupations are Legal Services & Support (83.6%), Health Diagnosing & Treating (76.8%), and Health Technologists (75.7%).
| Occupation | Male | Female |
| Management | 4,728 (58.2%) | 3,399 (41.8%) |
| Business & Financial | 2,485 (60.3%) | 1,639 (39.7%) |
| Computers, Engineering & Science | 3,066 (75.2%) | 1,009 (24.8%) |
| Computers & Mathematics | 1,167 (78.6%) | 317 (21.4%) |
| Architecture & Engineering | 1,377 (80.9%) | 325 (19.1%) |
| Life, Physical & Social Science | 522 (58.7%) | 367 (41.3%) |
| Community & Social Service | 1,981 (27.3%) | 5,280 (72.7%) |
| Education, Arts & Media | 552 (29.2%) | 1,336 (70.8%) |
| Legal Services & Support | 148 (16.4%) | 756 (83.6%) |
| Education Instruction & Library | 829 (24.6%) | 2,536 (75.4%) |
| Arts, Media & Entertainment | 452 (40.9%) | 652 (59.1%) |
| Health Diagnosing & Treating | 1,245 (23.2%) | 4,112 (76.8%) |
| Health Technologists | 839 (24.3%) | 2,620 (75.7%) |
| Total (Category) | 13,505 (46.7%) | 15,439 (53.3%) |
| Total (Overall) | 42,967 (52.7%) | 38,509 (47.3%) |
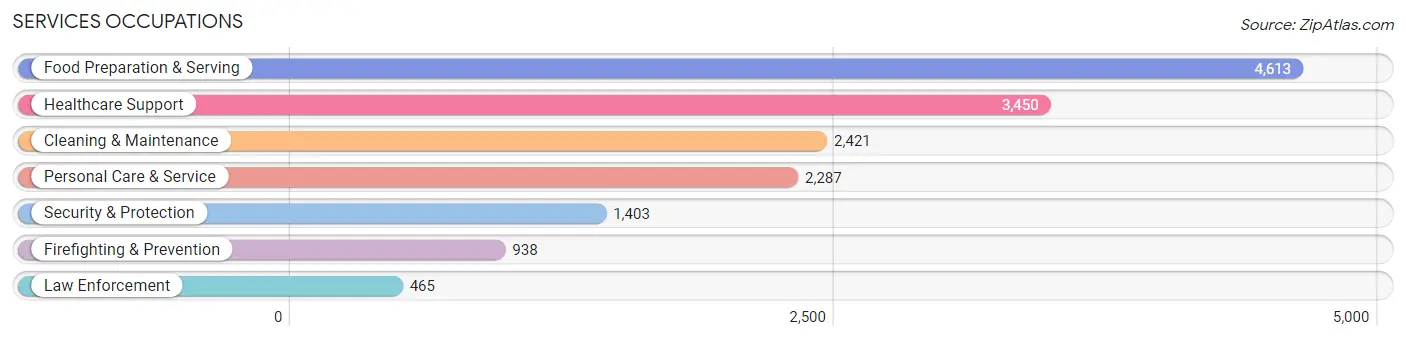
Services Occupations
The most common Services occupations in Kootenai County are Food Preparation & Serving (4,613 | 5.7%), Healthcare Support (3,450 | 4.2%), Cleaning & Maintenance (2,421 | 3.0%), Personal Care & Service (2,287 | 2.8%), and Security & Protection (1,403 | 1.7%).
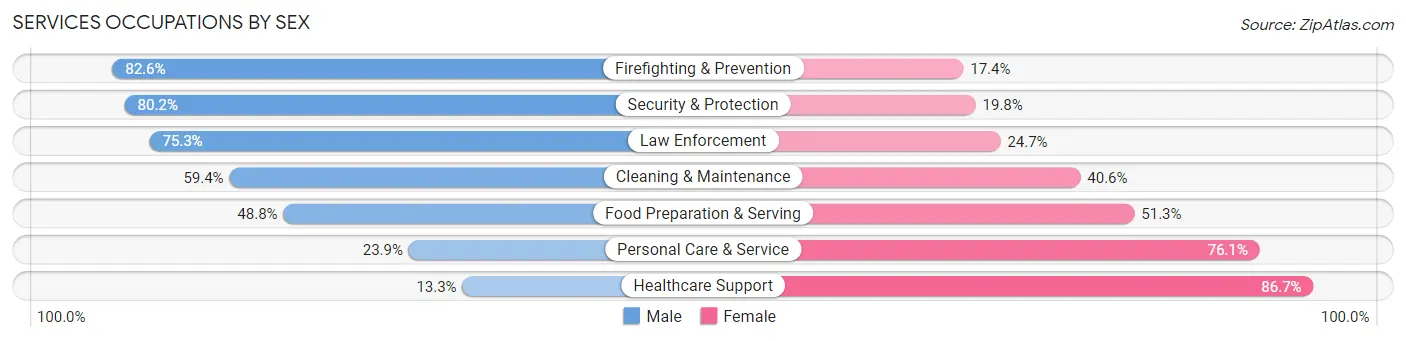
Services Occupations by Sex
Within the Services occupations in Kootenai County, the most male-oriented occupations are Firefighting & Prevention (82.6%), Security & Protection (80.2%), and Law Enforcement (75.3%), while the most female-oriented occupations are Healthcare Support (86.7%), Personal Care & Service (76.1%), and Food Preparation & Serving (51.2%).
| Occupation | Male | Female |
| Healthcare Support | 459 (13.3%) | 2,991 (86.7%) |
| Security & Protection | 1,125 (80.2%) | 278 (19.8%) |
| Firefighting & Prevention | 775 (82.6%) | 163 (17.4%) |
| Law Enforcement | 350 (75.3%) | 115 (24.7%) |
| Food Preparation & Serving | 2,249 (48.7%) | 2,364 (51.2%) |
| Cleaning & Maintenance | 1,439 (59.4%) | 982 (40.6%) |
| Personal Care & Service | 547 (23.9%) | 1,740 (76.1%) |
| Total (Category) | 5,819 (41.0%) | 8,355 (59.0%) |
| Total (Overall) | 42,967 (52.7%) | 38,509 (47.3%) |
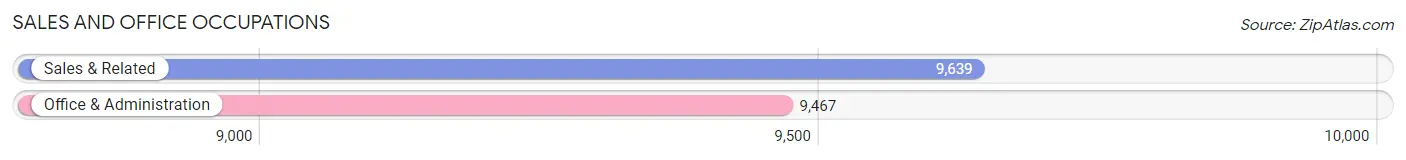
Sales and Office Occupations
The most common Sales and Office occupations in Kootenai County are Sales & Related (9,639 | 11.8%), and Office & Administration (9,467 | 11.6%).
Sales and Office Occupations by Sex
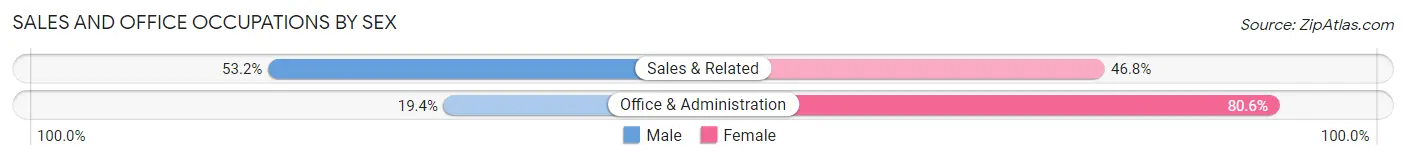
| Occupation | Male | Female |
| Sales & Related | 5,124 (53.2%) | 4,515 (46.8%) |
| Office & Administration | 1,836 (19.4%) | 7,631 (80.6%) |
| Total (Category) | 6,960 (36.4%) | 12,146 (63.6%) |
| Total (Overall) | 42,967 (52.7%) | 38,509 (47.3%) |
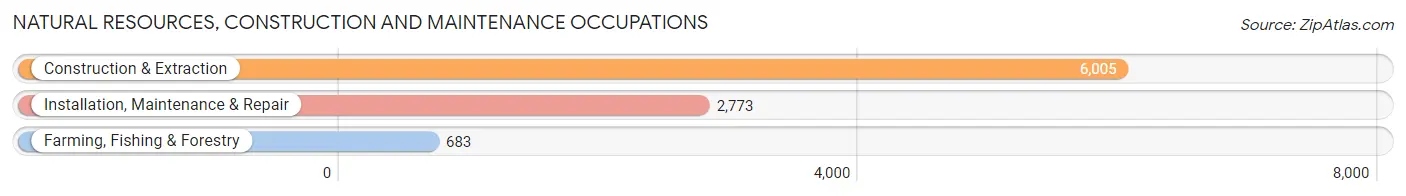
Natural Resources, Construction and Maintenance Occupations
The most common Natural Resources, Construction and Maintenance occupations in Kootenai County are Construction & Extraction (6,005 | 7.4%), Installation, Maintenance & Repair (2,773 | 3.4%), and Farming, Fishing & Forestry (683 | 0.8%).
Natural Resources, Construction and Maintenance Occupations by Sex
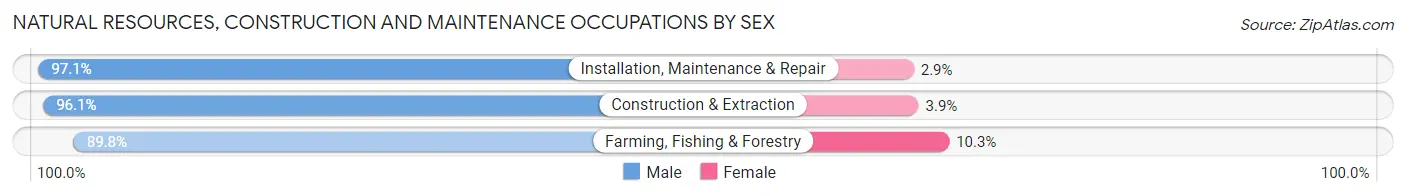
| Occupation | Male | Female |
| Farming, Fishing & Forestry | 613 (89.7%) | 70 (10.2%) |
| Construction & Extraction | 5,772 (96.1%) | 233 (3.9%) |
| Installation, Maintenance & Repair | 2,693 (97.1%) | 80 (2.9%) |
| Total (Category) | 9,078 (96.0%) | 383 (4.1%) |
| Total (Overall) | 42,967 (52.7%) | 38,509 (47.3%) |
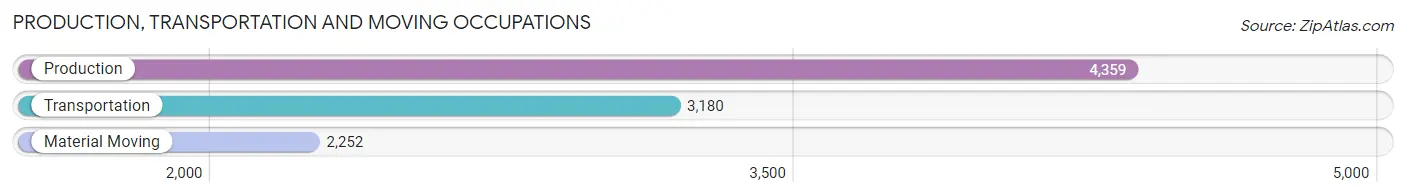
Production, Transportation and Moving Occupations
The most common Production, Transportation and Moving occupations in Kootenai County are Production (4,359 | 5.3%), Transportation (3,180 | 3.9%), and Material Moving (2,252 | 2.8%).
Production, Transportation and Moving Occupations by Sex
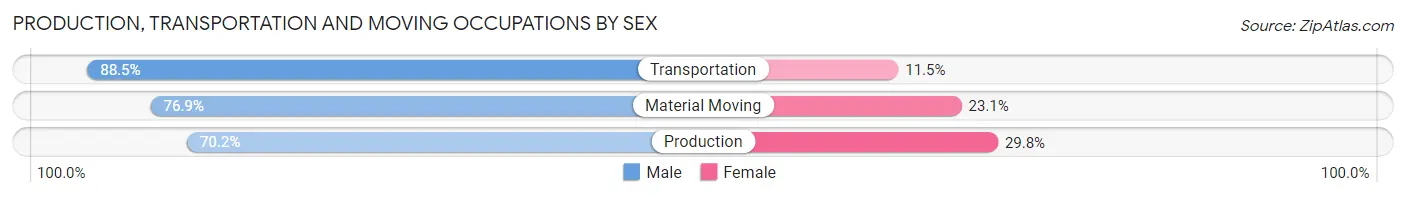
| Occupation | Male | Female |
| Production | 3,060 (70.2%) | 1,299 (29.8%) |
| Transportation | 2,814 (88.5%) | 366 (11.5%) |
| Material Moving | 1,731 (76.9%) | 521 (23.1%) |
| Total (Category) | 7,605 (77.7%) | 2,186 (22.3%) |
| Total (Overall) | 42,967 (52.7%) | 38,509 (47.3%) |
Employment Industries by Sex in Kootenai County
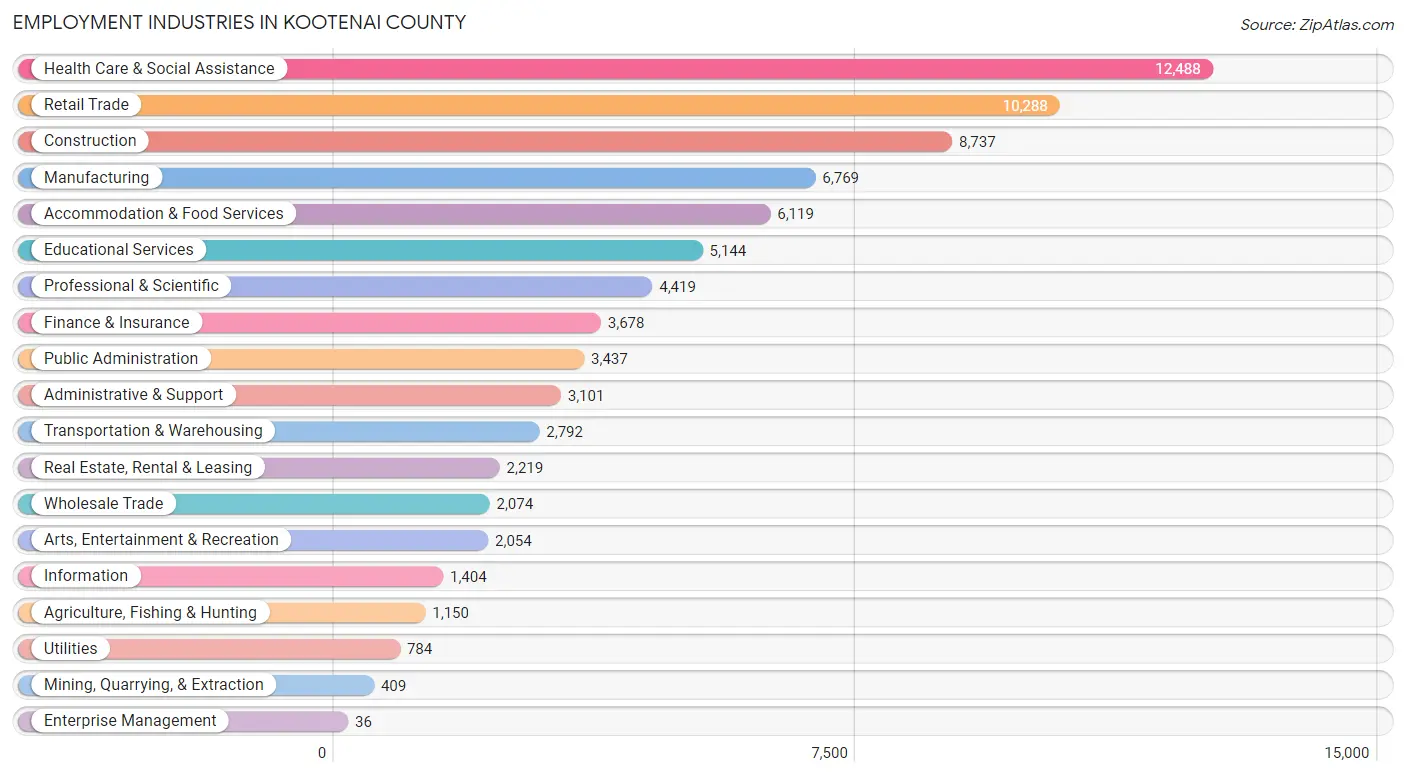
Employment Industries in Kootenai County
The major employment industries in Kootenai County include Health Care & Social Assistance (12,488 | 15.3%), Retail Trade (10,288 | 12.6%), Construction (8,737 | 10.7%), Manufacturing (6,769 | 8.3%), and Accommodation & Food Services (6,119 | 7.5%).
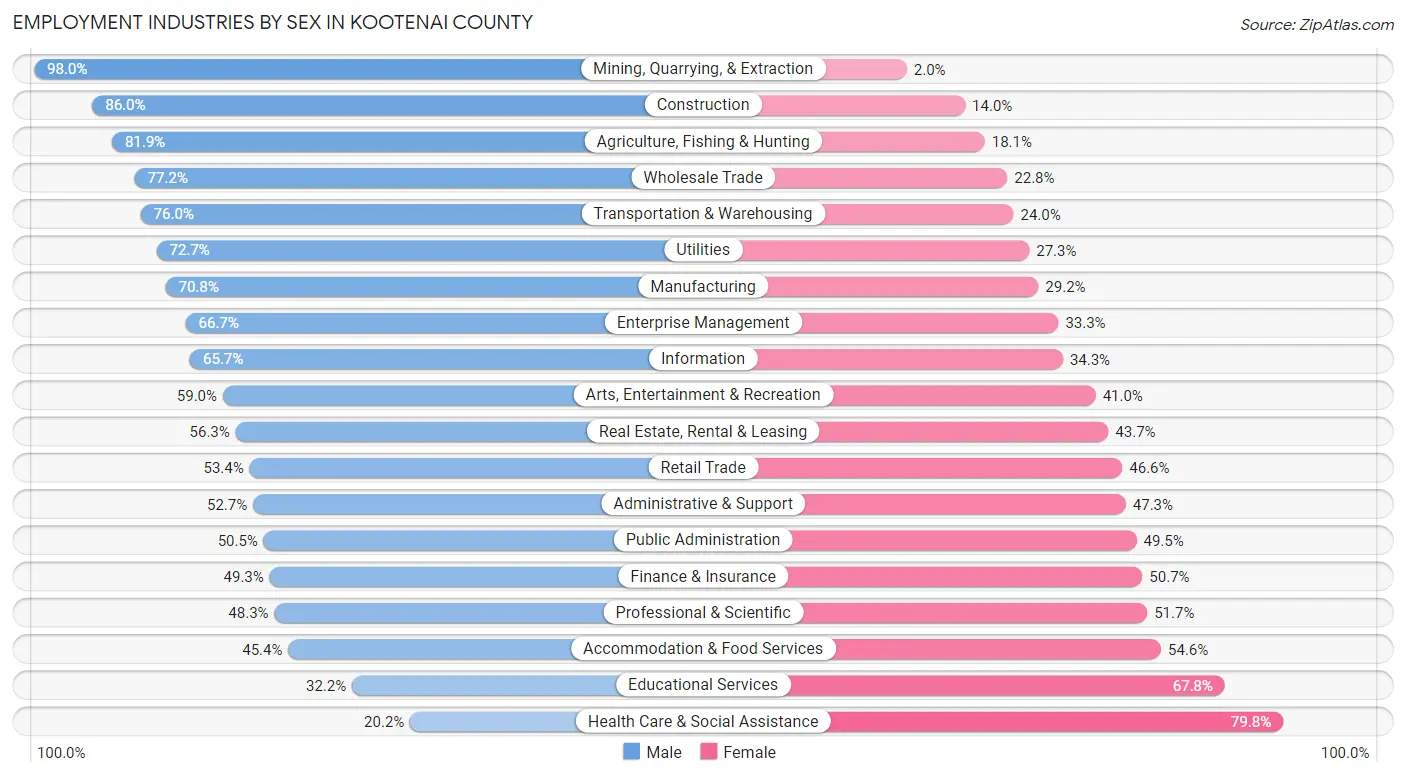
Employment Industries by Sex in Kootenai County
The Kootenai County industries that see more men than women are Mining, Quarrying, & Extraction (98.0%), Construction (86.0%), and Agriculture, Fishing & Hunting (81.9%), whereas the industries that tend to have a higher number of women are Health Care & Social Assistance (79.8%), Educational Services (67.8%), and Accommodation & Food Services (54.6%).
| Industry | Male | Female |
| Agriculture, Fishing & Hunting | 942 (81.9%) | 208 (18.1%) |
| Mining, Quarrying, & Extraction | 401 (98.0%) | 8 (2.0%) |
| Construction | 7,512 (86.0%) | 1,225 (14.0%) |
| Manufacturing | 4,794 (70.8%) | 1,975 (29.2%) |
| Wholesale Trade | 1,602 (77.2%) | 472 (22.8%) |
| Retail Trade | 5,498 (53.4%) | 4,790 (46.6%) |
| Transportation & Warehousing | 2,121 (76.0%) | 671 (24.0%) |
| Utilities | 570 (72.7%) | 214 (27.3%) |
| Information | 923 (65.7%) | 481 (34.3%) |
| Finance & Insurance | 1,813 (49.3%) | 1,865 (50.7%) |
| Real Estate, Rental & Leasing | 1,250 (56.3%) | 969 (43.7%) |
| Professional & Scientific | 2,134 (48.3%) | 2,285 (51.7%) |
| Enterprise Management | 24 (66.7%) | 12 (33.3%) |
| Administrative & Support | 1,635 (52.7%) | 1,466 (47.3%) |
| Educational Services | 1,658 (32.2%) | 3,486 (67.8%) |
| Health Care & Social Assistance | 2,521 (20.2%) | 9,967 (79.8%) |
| Arts, Entertainment & Recreation | 1,211 (59.0%) | 843 (41.0%) |
| Accommodation & Food Services | 2,779 (45.4%) | 3,340 (54.6%) |
| Public Administration | 1,736 (50.5%) | 1,701 (49.5%) |
| Total | 42,967 (52.7%) | 38,509 (47.3%) |
Education in Kootenai County
School Enrollment in Kootenai County
The most common levels of schooling among the 36,926 students in Kootenai County are middle school (8,964 | 24.3%), high school (8,622 | 23.4%), and elementary school (8,296 | 22.5%).
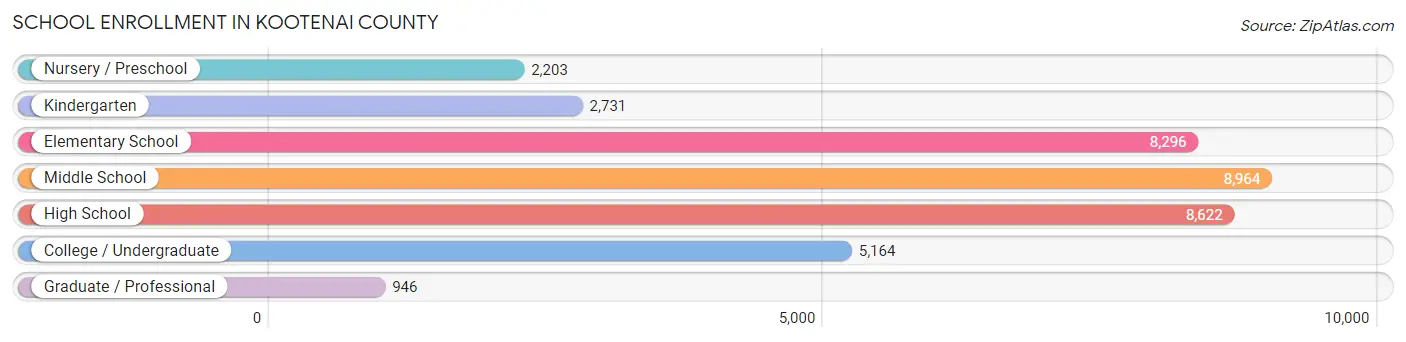
| School Level | # Students | % Students |
| Nursery / Preschool | 2,203 | 6.0% |
| Kindergarten | 2,731 | 7.4% |
| Elementary School | 8,296 | 22.5% |
| Middle School | 8,964 | 24.3% |
| High School | 8,622 | 23.4% |
| College / Undergraduate | 5,164 | 14.0% |
| Graduate / Professional | 946 | 2.6% |
| Total | 36,926 | 100.0% |
School Enrollment by Age by Funding Source in Kootenai County
Out of a total of 36,926 students who are enrolled in schools in Kootenai County, 6,868 (18.6%) attend a private institution, while the remaining 30,058 (81.4%) are enrolled in public schools. The age group of 3 to 4 year olds has the highest likelihood of being enrolled in private schools, with 939 (52.7% in the age bracket) enrolled. Conversely, the age group of 20 to 24 year olds has the lowest likelihood of being enrolled in a private school, with 1,648 (91.2% in the age bracket) attending a public institution.
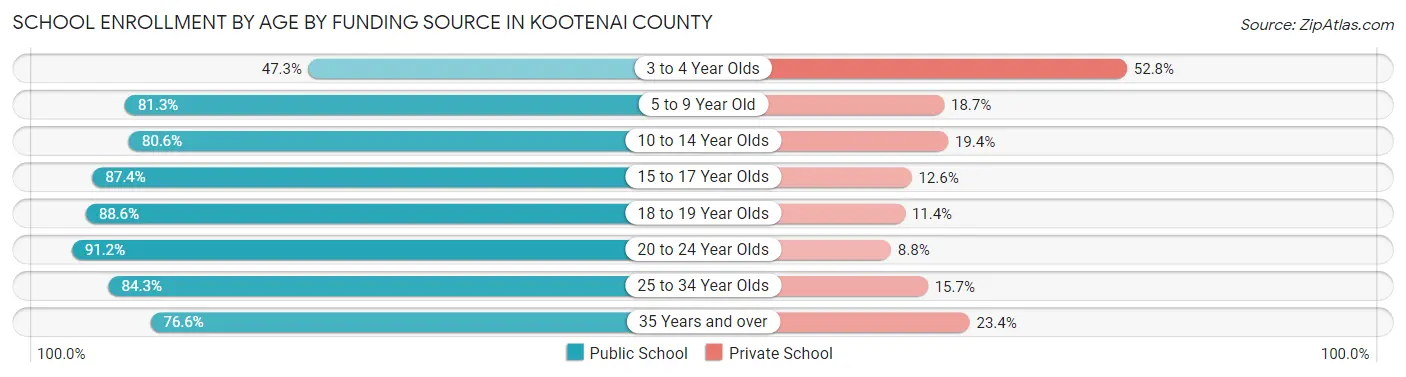
| Age Bracket | Public School | Private School |
| 3 to 4 Year Olds | 841 (47.2%) | 939 (52.7%) |
| 5 to 9 Year Old | 8,434 (81.3%) | 1,939 (18.7%) |
| 10 to 14 Year Olds | 8,752 (80.6%) | 2,111 (19.4%) |
| 15 to 17 Year Olds | 5,847 (87.4%) | 845 (12.6%) |
| 18 to 19 Year Olds | 1,871 (88.6%) | 241 (11.4%) |
| 20 to 24 Year Olds | 1,648 (91.2%) | 159 (8.8%) |
| 25 to 34 Year Olds | 1,379 (84.3%) | 256 (15.7%) |
| 35 Years and over | 1,274 (76.6%) | 390 (23.4%) |
| Total | 30,058 (81.4%) | 6,868 (18.6%) |
Educational Attainment by Field of Study in Kootenai County
Business (6,129 | 17.4%), education (5,142 | 14.6%), science & technology (4,766 | 13.6%), arts & humanities (3,063 | 8.7%), and bio, nature & agricultural (2,665 | 7.6%) are the most common fields of study among 35,163 individuals in Kootenai County who have obtained a bachelor's degree or higher.
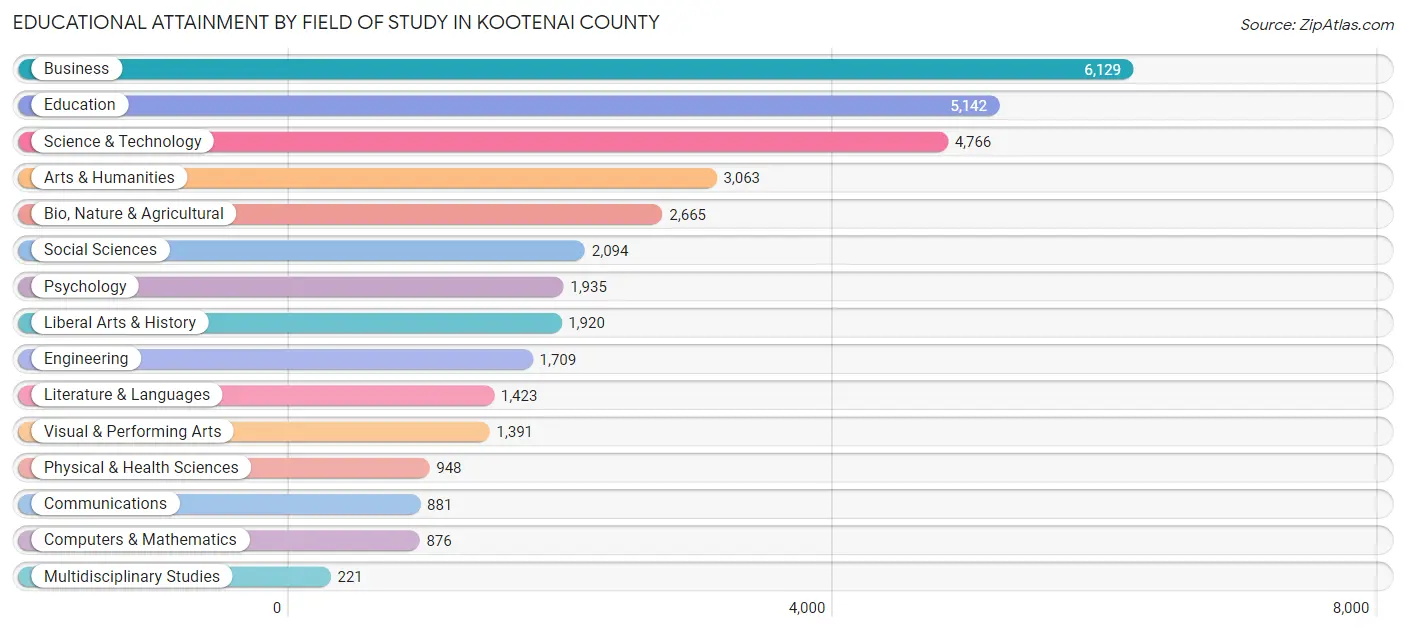
| Field of Study | # Graduates | % Graduates |
| Computers & Mathematics | 876 | 2.5% |
| Bio, Nature & Agricultural | 2,665 | 7.6% |
| Physical & Health Sciences | 948 | 2.7% |
| Psychology | 1,935 | 5.5% |
| Social Sciences | 2,094 | 6.0% |
| Engineering | 1,709 | 4.9% |
| Multidisciplinary Studies | 221 | 0.6% |
| Science & Technology | 4,766 | 13.6% |
| Business | 6,129 | 17.4% |
| Education | 5,142 | 14.6% |
| Literature & Languages | 1,423 | 4.1% |
| Liberal Arts & History | 1,920 | 5.5% |
| Visual & Performing Arts | 1,391 | 4.0% |
| Communications | 881 | 2.5% |
| Arts & Humanities | 3,063 | 8.7% |
| Total | 35,163 | 100.0% |
Transportation & Commute in Kootenai County
Vehicle Availability by Sex in Kootenai County
The most prevalent vehicle ownership categories in Kootenai County are males with 2 vehicles (16,564, accounting for 39.2%) and females with 2 vehicles (14,807, making up 44.2%).
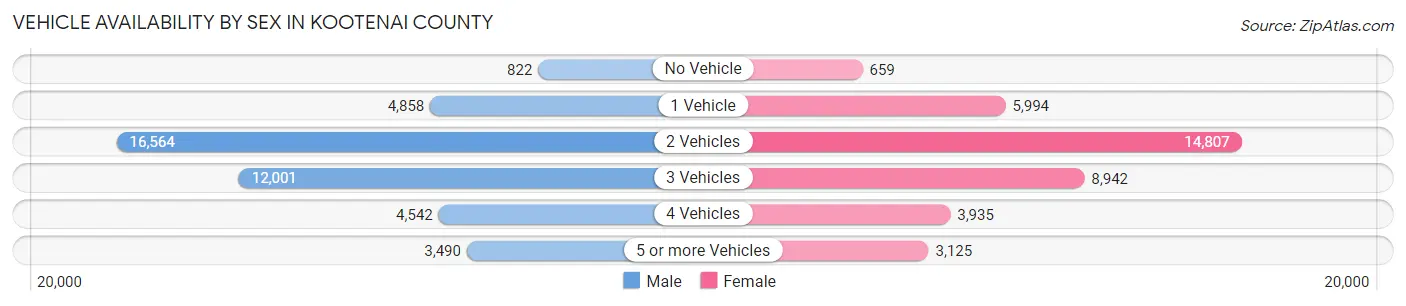
| Vehicles Available | Male | Female |
| No Vehicle | 822 (1.9%) | 659 (1.8%) |
| 1 Vehicle | 4,858 (11.5%) | 5,994 (16.0%) |
| 2 Vehicles | 16,564 (39.2%) | 14,807 (39.5%) |
| 3 Vehicles | 12,001 (28.4%) | 8,942 (23.9%) |
| 4 Vehicles | 4,542 (10.7%) | 3,935 (10.5%) |
| 5 or more Vehicles | 3,490 (8.3%) | 3,125 (8.3%) |
| Total | 42,277 (100.0%) | 37,462 (100.0%) |
Commute Time in Kootenai County
The most frequently occuring commute durations in Kootenai County are 15 to 19 minutes (13,610 commuters, 19.3%), 10 to 14 minutes (11,976 commuters, 16.9%), and 20 to 24 minutes (10,344 commuters, 14.6%).
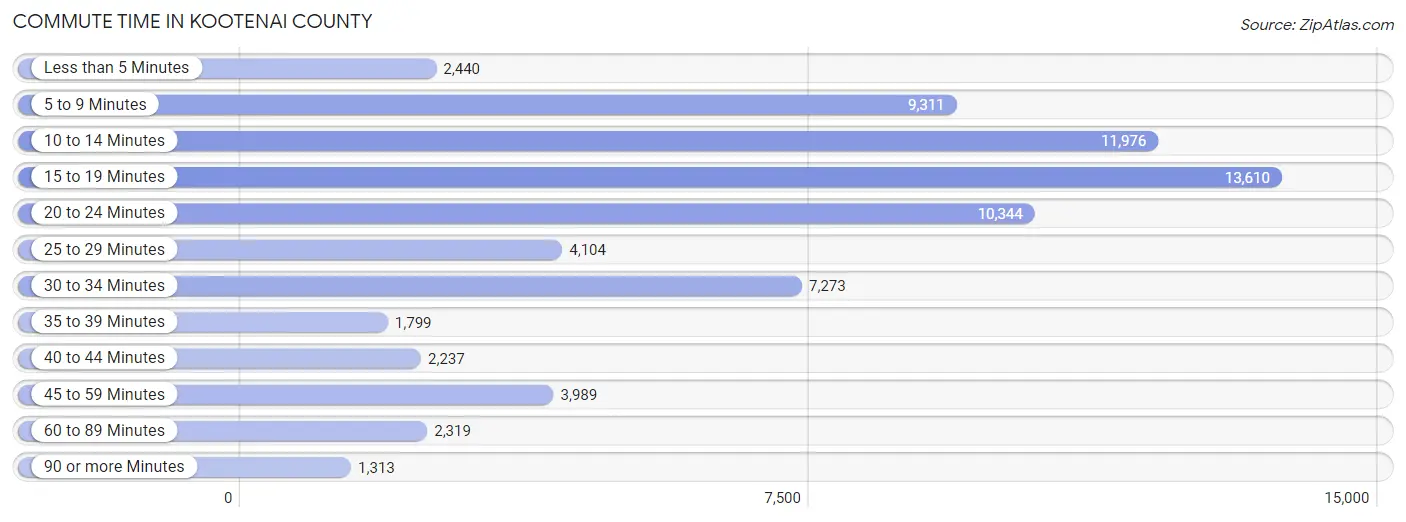
| Commute Time | # Commuters | % Commuters |
| Less than 5 Minutes | 2,440 | 3.5% |
| 5 to 9 Minutes | 9,311 | 13.2% |
| 10 to 14 Minutes | 11,976 | 16.9% |
| 15 to 19 Minutes | 13,610 | 19.3% |
| 20 to 24 Minutes | 10,344 | 14.6% |
| 25 to 29 Minutes | 4,104 | 5.8% |
| 30 to 34 Minutes | 7,273 | 10.3% |
| 35 to 39 Minutes | 1,799 | 2.5% |
| 40 to 44 Minutes | 2,237 | 3.2% |
| 45 to 59 Minutes | 3,989 | 5.6% |
| 60 to 89 Minutes | 2,319 | 3.3% |
| 90 or more Minutes | 1,313 | 1.9% |
Commute Time by Sex in Kootenai County
The most common commute times in Kootenai County are 15 to 19 minutes (6,594 commuters, 17.4%) for males and 15 to 19 minutes (7,016 commuters, 21.3%) for females.
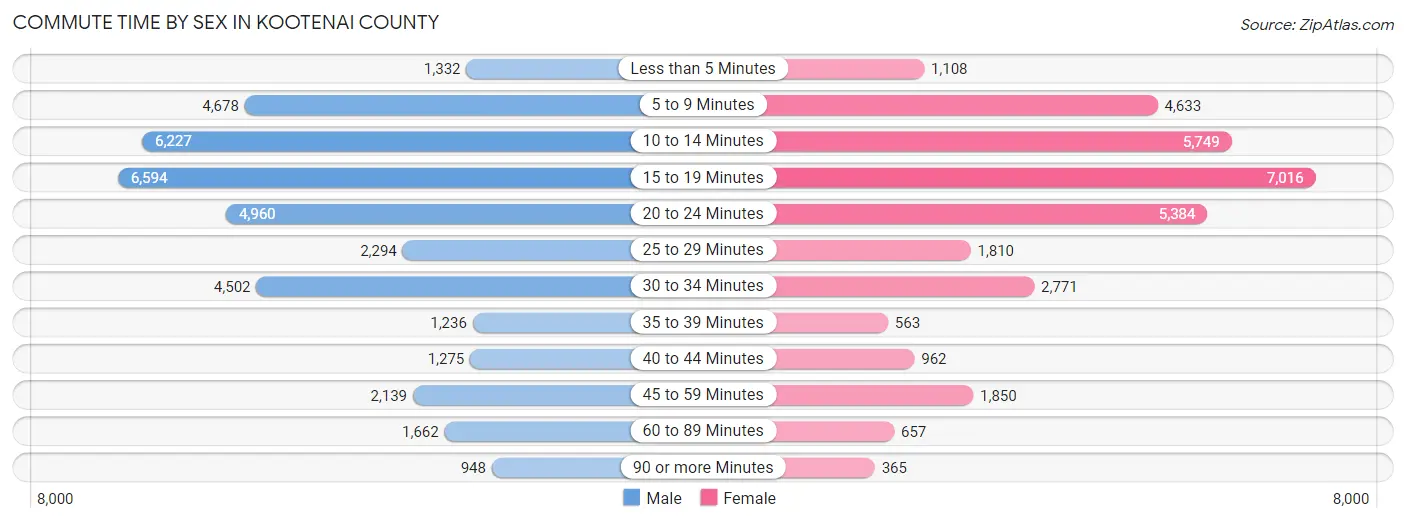
| Commute Time | Male | Female |
| Less than 5 Minutes | 1,332 (3.5%) | 1,108 (3.4%) |
| 5 to 9 Minutes | 4,678 (12.4%) | 4,633 (14.1%) |
| 10 to 14 Minutes | 6,227 (16.5%) | 5,749 (17.5%) |
| 15 to 19 Minutes | 6,594 (17.4%) | 7,016 (21.3%) |
| 20 to 24 Minutes | 4,960 (13.1%) | 5,384 (16.4%) |
| 25 to 29 Minutes | 2,294 (6.1%) | 1,810 (5.5%) |
| 30 to 34 Minutes | 4,502 (11.9%) | 2,771 (8.4%) |
| 35 to 39 Minutes | 1,236 (3.3%) | 563 (1.7%) |
| 40 to 44 Minutes | 1,275 (3.4%) | 962 (2.9%) |
| 45 to 59 Minutes | 2,139 (5.7%) | 1,850 (5.6%) |
| 60 to 89 Minutes | 1,662 (4.4%) | 657 (2.0%) |
| 90 or more Minutes | 948 (2.5%) | 365 (1.1%) |
Time of Departure to Work by Sex in Kootenai County
The most frequent times of departure to work in Kootenai County are 7:00 AM to 7:29 AM (5,135, 13.6%) for males and 7:00 AM to 7:29 AM (5,269, 16.0%) for females.
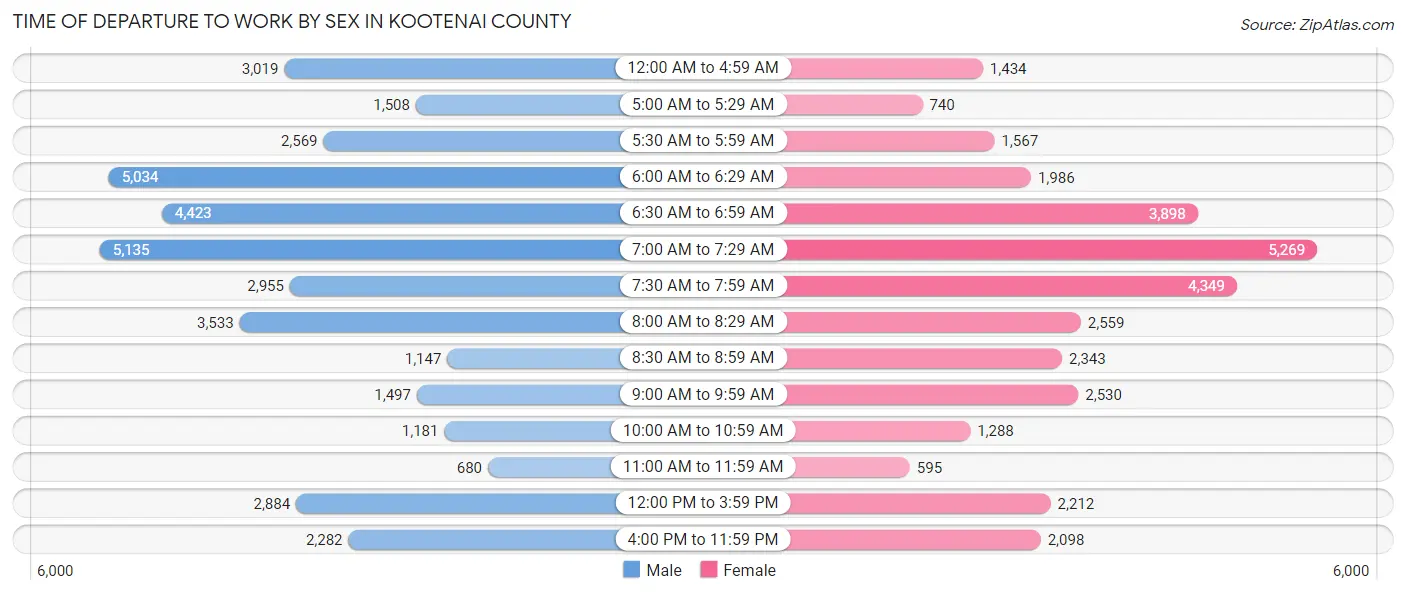
| Time of Departure | Male | Female |
| 12:00 AM to 4:59 AM | 3,019 (8.0%) | 1,434 (4.4%) |
| 5:00 AM to 5:29 AM | 1,508 (4.0%) | 740 (2.2%) |
| 5:30 AM to 5:59 AM | 2,569 (6.8%) | 1,567 (4.8%) |
| 6:00 AM to 6:29 AM | 5,034 (13.3%) | 1,986 (6.0%) |
| 6:30 AM to 6:59 AM | 4,423 (11.7%) | 3,898 (11.9%) |
| 7:00 AM to 7:29 AM | 5,135 (13.6%) | 5,269 (16.0%) |
| 7:30 AM to 7:59 AM | 2,955 (7.8%) | 4,349 (13.2%) |
| 8:00 AM to 8:29 AM | 3,533 (9.3%) | 2,559 (7.8%) |
| 8:30 AM to 8:59 AM | 1,147 (3.0%) | 2,343 (7.1%) |
| 9:00 AM to 9:59 AM | 1,497 (4.0%) | 2,530 (7.7%) |
| 10:00 AM to 10:59 AM | 1,181 (3.1%) | 1,288 (3.9%) |
| 11:00 AM to 11:59 AM | 680 (1.8%) | 595 (1.8%) |
| 12:00 PM to 3:59 PM | 2,884 (7.6%) | 2,212 (6.7%) |
| 4:00 PM to 11:59 PM | 2,282 (6.0%) | 2,098 (6.4%) |
| Total | 37,847 (100.0%) | 32,868 (100.0%) |
Housing Occupancy in Kootenai County
Occupancy by Ownership in Kootenai County
Of the total 67,002 dwellings in Kootenai County, owner-occupied units account for 48,458 (72.3%), while renter-occupied units make up 18,544 (27.7%).
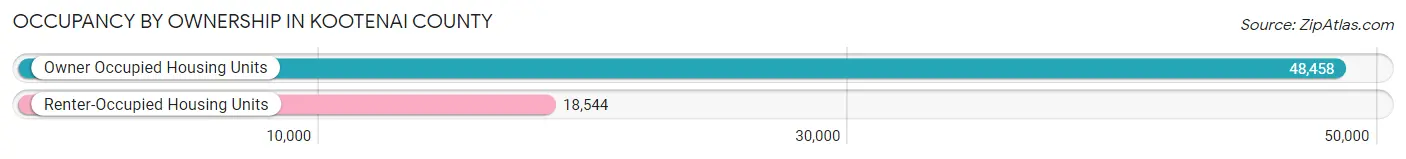
| Occupancy | # Housing Units | % Housing Units |
| Owner Occupied Housing Units | 48,458 | 72.3% |
| Renter-Occupied Housing Units | 18,544 | 27.7% |
| Total Occupied Housing Units | 67,002 | 100.0% |
Occupancy by Household Size in Kootenai County
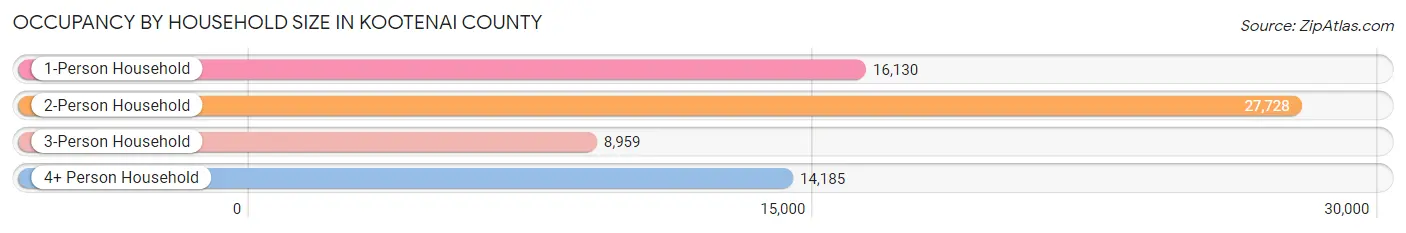
| Household Size | # Housing Units | % Housing Units |
| 1-Person Household | 16,130 | 24.1% |
| 2-Person Household | 27,728 | 41.4% |
| 3-Person Household | 8,959 | 13.4% |
| 4+ Person Household | 14,185 | 21.2% |
| Total Housing Units | 67,002 | 100.0% |
Occupancy by Ownership by Household Size in Kootenai County
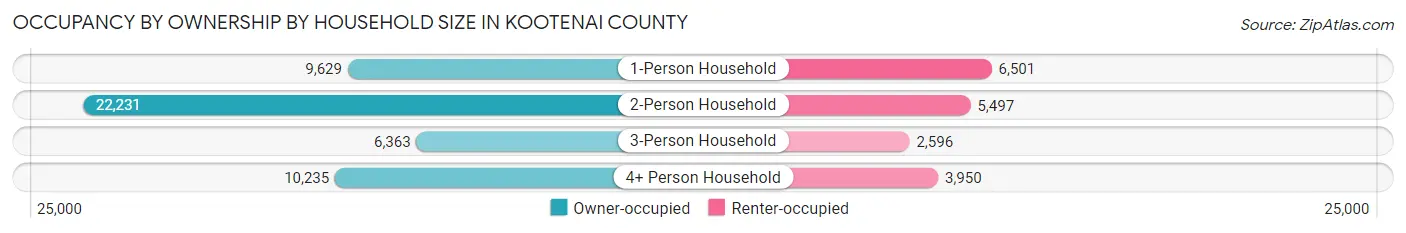
| Household Size | Owner-occupied | Renter-occupied |
| 1-Person Household | 9,629 (59.7%) | 6,501 (40.3%) |
| 2-Person Household | 22,231 (80.2%) | 5,497 (19.8%) |
| 3-Person Household | 6,363 (71.0%) | 2,596 (29.0%) |
| 4+ Person Household | 10,235 (72.2%) | 3,950 (27.9%) |
| Total Housing Units | 48,458 (72.3%) | 18,544 (27.7%) |
Occupancy by Educational Attainment in Kootenai County
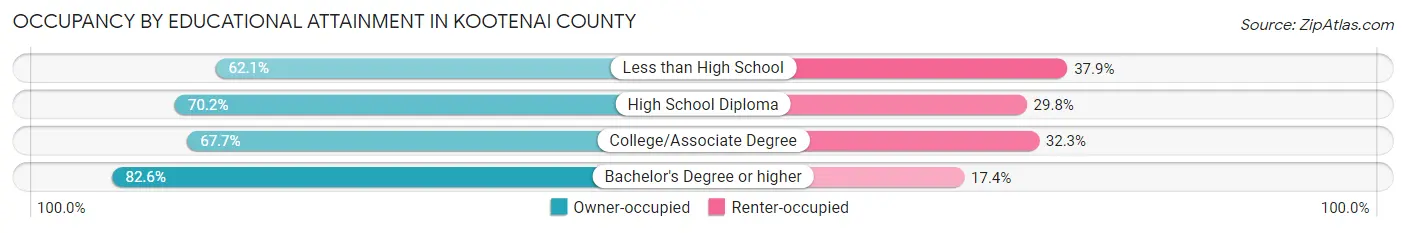
| Household Size | Owner-occupied | Renter-occupied |
| Less than High School | 2,401 (62.1%) | 1,464 (37.9%) |
| High School Diploma | 10,565 (70.2%) | 4,494 (29.8%) |
| College/Associate Degree | 19,203 (67.7%) | 9,145 (32.3%) |
| Bachelor's Degree or higher | 16,289 (82.6%) | 3,441 (17.4%) |
Occupancy by Age of Householder in Kootenai County
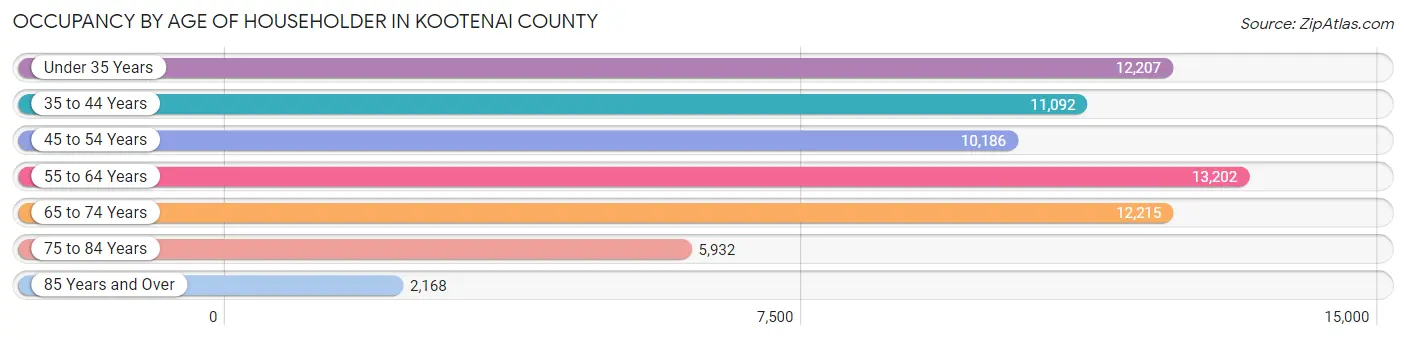
| Age Bracket | # Households | % Households |
| Under 35 Years | 12,207 | 18.2% |
| 35 to 44 Years | 11,092 | 16.6% |
| 45 to 54 Years | 10,186 | 15.2% |
| 55 to 64 Years | 13,202 | 19.7% |
| 65 to 74 Years | 12,215 | 18.2% |
| 75 to 84 Years | 5,932 | 8.8% |
| 85 Years and Over | 2,168 | 3.2% |
| Total | 67,002 | 100.0% |
Housing Finances in Kootenai County
Median Income by Occupancy in Kootenai County
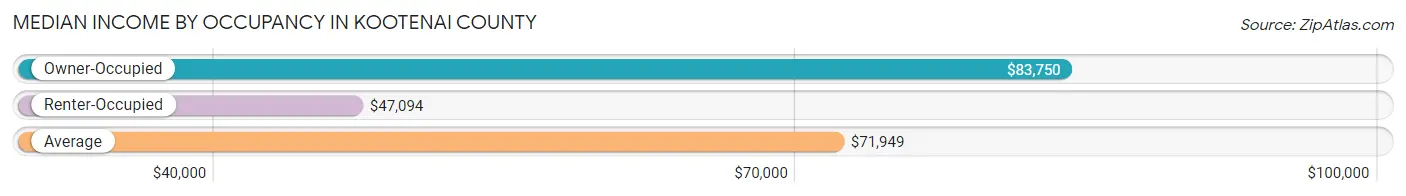
| Occupancy Type | # Households | Median Income |
| Owner-Occupied | 48,458 (72.3%) | $83,750 |
| Renter-Occupied | 18,544 (27.7%) | $47,094 |
| Average | 67,002 (100.0%) | $71,949 |
Occupancy by Householder Income Bracket in Kootenai County
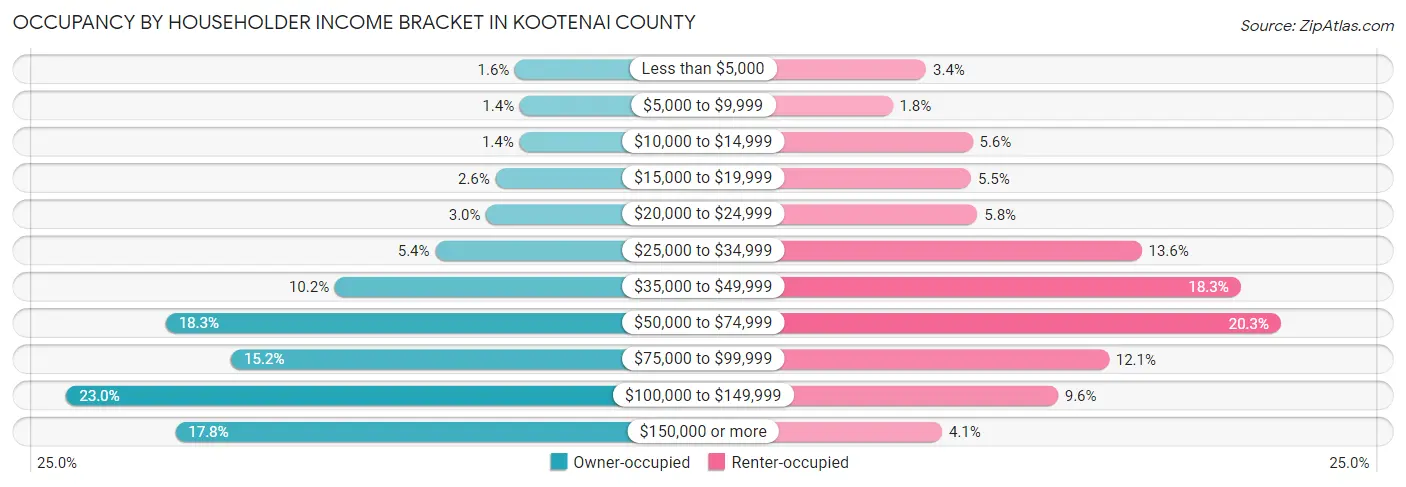
| Income Bracket | Owner-occupied | Renter-occupied |
| Less than $5,000 | 797 (1.6%) | 623 (3.4%) |
| $5,000 to $9,999 | 685 (1.4%) | 326 (1.8%) |
| $10,000 to $14,999 | 693 (1.4%) | 1,032 (5.6%) |
| $15,000 to $19,999 | 1,247 (2.6%) | 1,020 (5.5%) |
| $20,000 to $24,999 | 1,458 (3.0%) | 1,076 (5.8%) |
| $25,000 to $34,999 | 2,637 (5.4%) | 2,525 (13.6%) |
| $35,000 to $49,999 | 4,950 (10.2%) | 3,399 (18.3%) |
| $50,000 to $74,999 | 8,860 (18.3%) | 3,756 (20.3%) |
| $75,000 to $99,999 | 7,350 (15.2%) | 2,237 (12.1%) |
| $100,000 to $149,999 | 11,148 (23.0%) | 1,786 (9.6%) |
| $150,000 or more | 8,633 (17.8%) | 764 (4.1%) |
| Total | 48,458 (100.0%) | 18,544 (100.0%) |
Monthly Housing Cost Tiers in Kootenai County
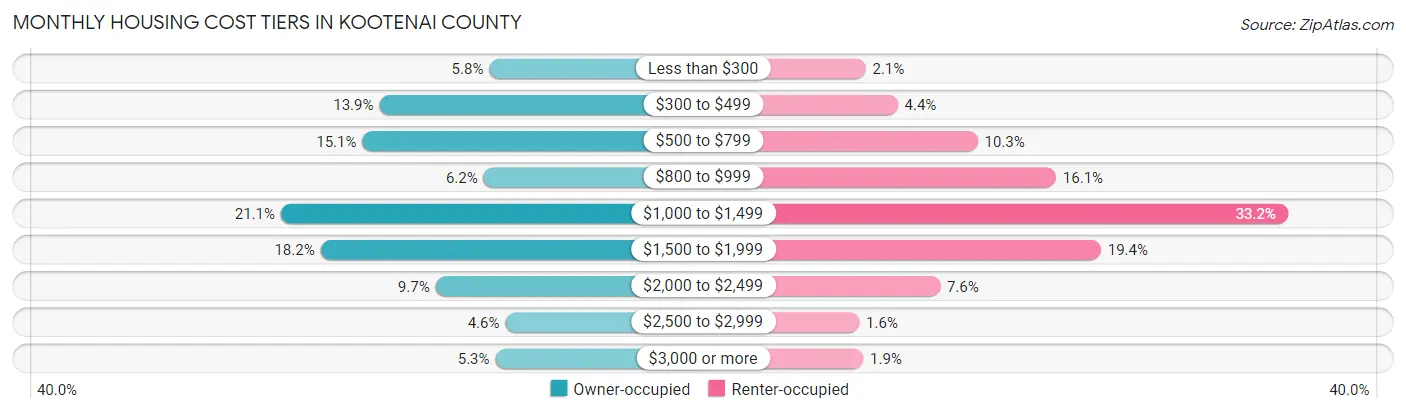
| Monthly Cost | Owner-occupied | Renter-occupied |
| Less than $300 | 2,802 (5.8%) | 384 (2.1%) |
| $300 to $499 | 6,724 (13.9%) | 821 (4.4%) |
| $500 to $799 | 7,334 (15.1%) | 1,913 (10.3%) |
| $800 to $999 | 3,005 (6.2%) | 2,983 (16.1%) |
| $1,000 to $1,499 | 10,237 (21.1%) | 6,150 (33.2%) |
| $1,500 to $1,999 | 8,823 (18.2%) | 3,598 (19.4%) |
| $2,000 to $2,499 | 4,720 (9.7%) | 1,400 (7.5%) |
| $2,500 to $2,999 | 2,229 (4.6%) | 297 (1.6%) |
| $3,000 or more | 2,584 (5.3%) | 351 (1.9%) |
| Total | 48,458 (100.0%) | 18,544 (100.0%) |
Physical Housing Characteristics in Kootenai County
Housing Structures in Kootenai County
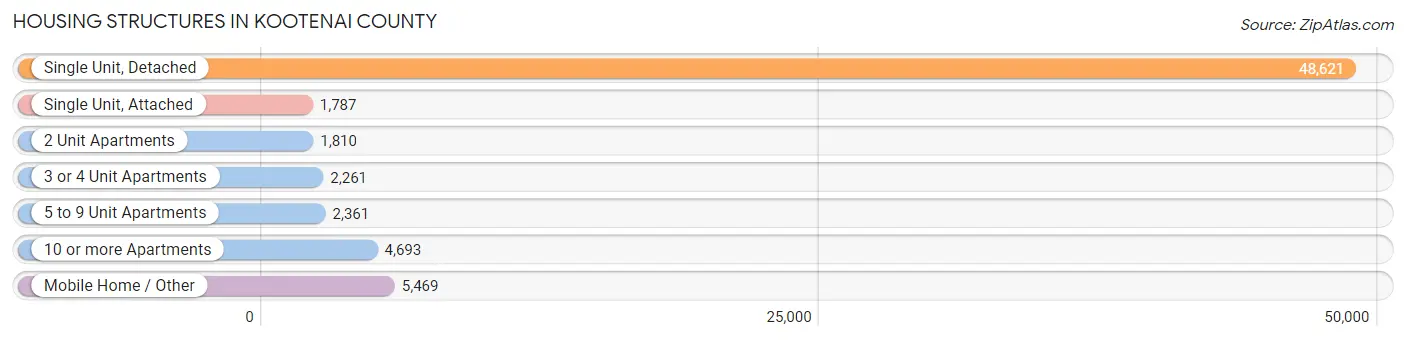
| Structure Type | # Housing Units | % Housing Units |
| Single Unit, Detached | 48,621 | 72.6% |
| Single Unit, Attached | 1,787 | 2.7% |
| 2 Unit Apartments | 1,810 | 2.7% |
| 3 or 4 Unit Apartments | 2,261 | 3.4% |
| 5 to 9 Unit Apartments | 2,361 | 3.5% |
| 10 or more Apartments | 4,693 | 7.0% |
| Mobile Home / Other | 5,469 | 8.2% |
| Total | 67,002 | 100.0% |
Housing Structures by Occupancy in Kootenai County
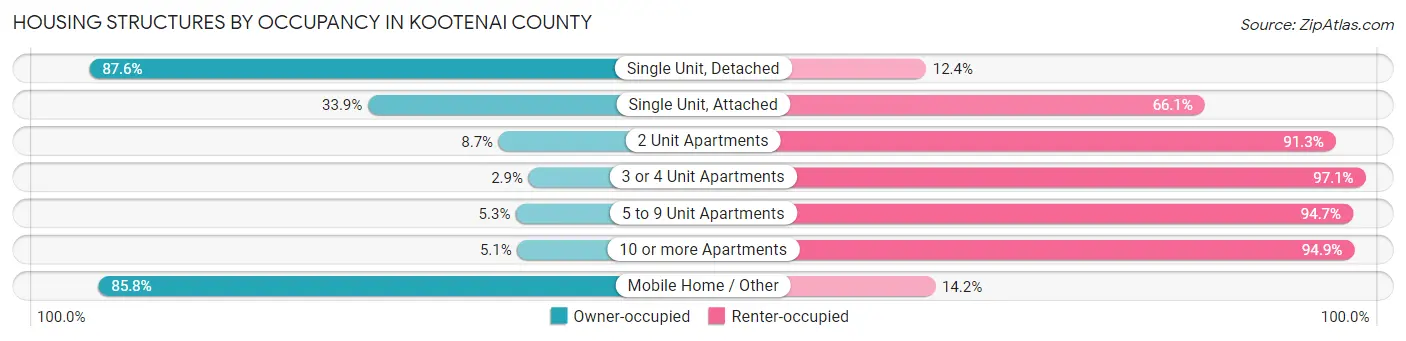
| Structure Type | Owner-occupied | Renter-occupied |
| Single Unit, Detached | 42,573 (87.6%) | 6,048 (12.4%) |
| Single Unit, Attached | 605 (33.9%) | 1,182 (66.1%) |
| 2 Unit Apartments | 157 (8.7%) | 1,653 (91.3%) |
| 3 or 4 Unit Apartments | 66 (2.9%) | 2,195 (97.1%) |
| 5 to 9 Unit Apartments | 126 (5.3%) | 2,235 (94.7%) |
| 10 or more Apartments | 239 (5.1%) | 4,454 (94.9%) |
| Mobile Home / Other | 4,692 (85.8%) | 777 (14.2%) |
| Total | 48,458 (72.3%) | 18,544 (27.7%) |
Housing Structures by Number of Rooms in Kootenai County
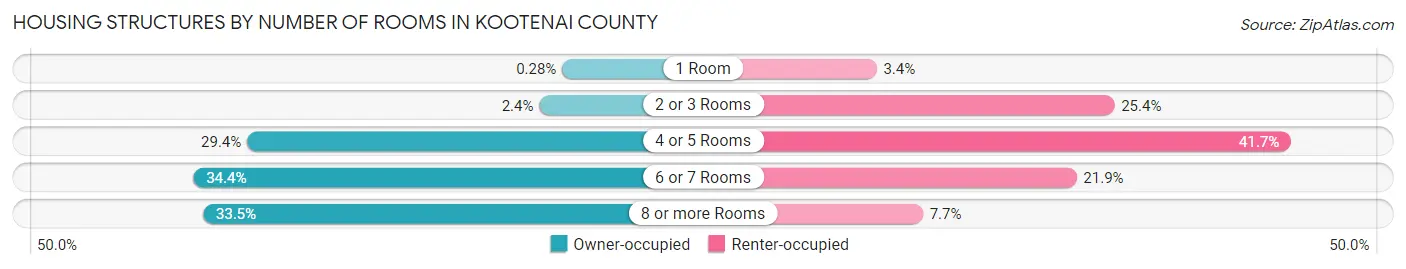
| Number of Rooms | Owner-occupied | Renter-occupied |
| 1 Room | 134 (0.3%) | 626 (3.4%) |
| 2 or 3 Rooms | 1,163 (2.4%) | 4,705 (25.4%) |
| 4 or 5 Rooms | 14,257 (29.4%) | 7,738 (41.7%) |
| 6 or 7 Rooms | 16,668 (34.4%) | 4,055 (21.9%) |
| 8 or more Rooms | 16,236 (33.5%) | 1,420 (7.7%) |
| Total | 48,458 (100.0%) | 18,544 (100.0%) |
Housing Structure by Heating Type in Kootenai County
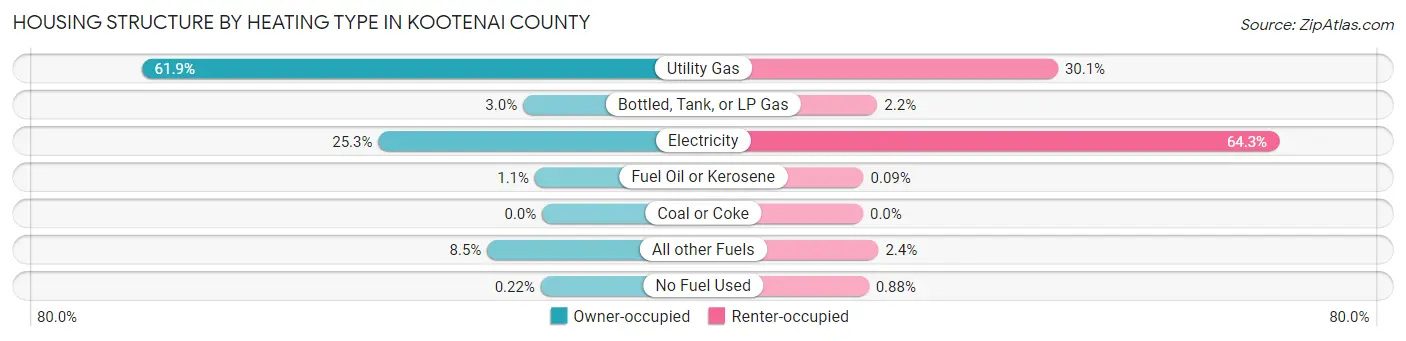
| Heating Type | Owner-occupied | Renter-occupied |
| Utility Gas | 30,002 (61.9%) | 5,587 (30.1%) |
| Bottled, Tank, or LP Gas | 1,428 (2.9%) | 411 (2.2%) |
| Electricity | 12,268 (25.3%) | 11,922 (64.3%) |
| Fuel Oil or Kerosene | 541 (1.1%) | 17 (0.1%) |
| Coal or Coke | 0 (0.0%) | 0 (0.0%) |
| All other Fuels | 4,112 (8.5%) | 443 (2.4%) |
| No Fuel Used | 107 (0.2%) | 164 (0.9%) |
| Total | 48,458 (100.0%) | 18,544 (100.0%) |
Household Vehicle Usage in Kootenai County
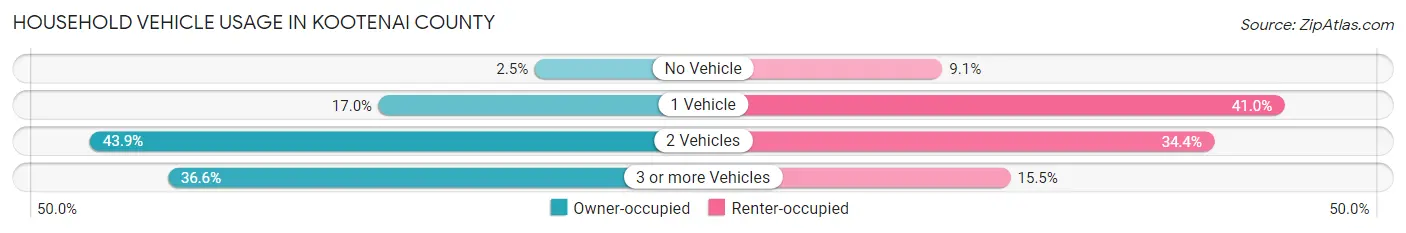
| Vehicles per Household | Owner-occupied | Renter-occupied |
| No Vehicle | 1,188 (2.5%) | 1,688 (9.1%) |
| 1 Vehicle | 8,247 (17.0%) | 7,602 (41.0%) |
| 2 Vehicles | 21,272 (43.9%) | 6,385 (34.4%) |
| 3 or more Vehicles | 17,751 (36.6%) | 2,869 (15.5%) |
| Total | 48,458 (100.0%) | 18,544 (100.0%) |
Real Estate & Mortgages in Kootenai County
Real Estate and Mortgage Overview in Kootenai County
| Characteristic | Without Mortgage | With Mortgage |
| Housing Units | 17,492 | 30,966 |
| Median Property Value | $385,800 | $415,700 |
| Median Household Income | $66,835 | $6,604 |
| Monthly Housing Costs | $486 | $2,542 |
| Real Estate Taxes | $2,013 | $1,233 |
Property Value by Mortgage Status in Kootenai County
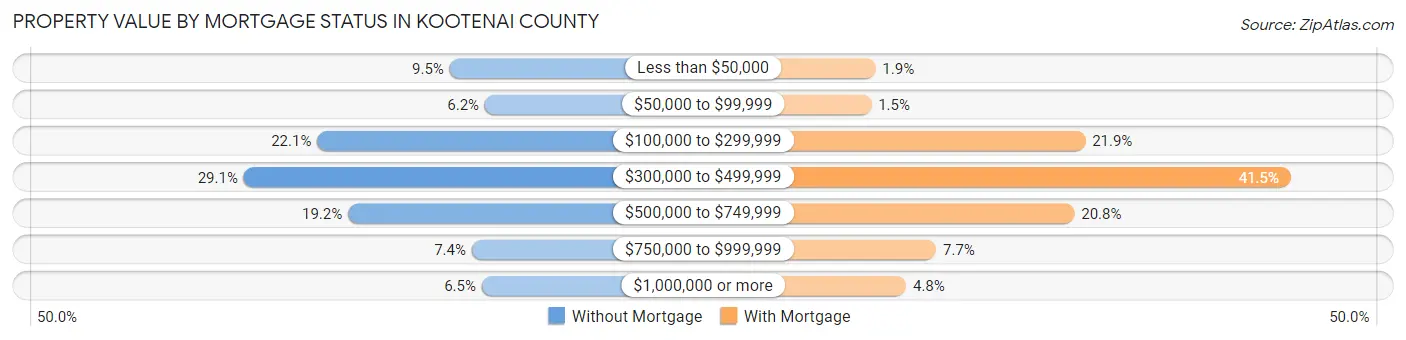
| Property Value | Without Mortgage | With Mortgage |
| Less than $50,000 | 1,665 (9.5%) | 585 (1.9%) |
| $50,000 to $99,999 | 1,077 (6.2%) | 461 (1.5%) |
| $100,000 to $299,999 | 3,871 (22.1%) | 6,772 (21.9%) |
| $300,000 to $499,999 | 5,095 (29.1%) | 12,835 (41.4%) |
| $500,000 to $749,999 | 3,358 (19.2%) | 6,449 (20.8%) |
| $750,000 to $999,999 | 1,296 (7.4%) | 2,374 (7.7%) |
| $1,000,000 or more | 1,130 (6.5%) | 1,490 (4.8%) |
| Total | 17,492 (100.0%) | 30,966 (100.0%) |
Household Income by Mortgage Status in Kootenai County
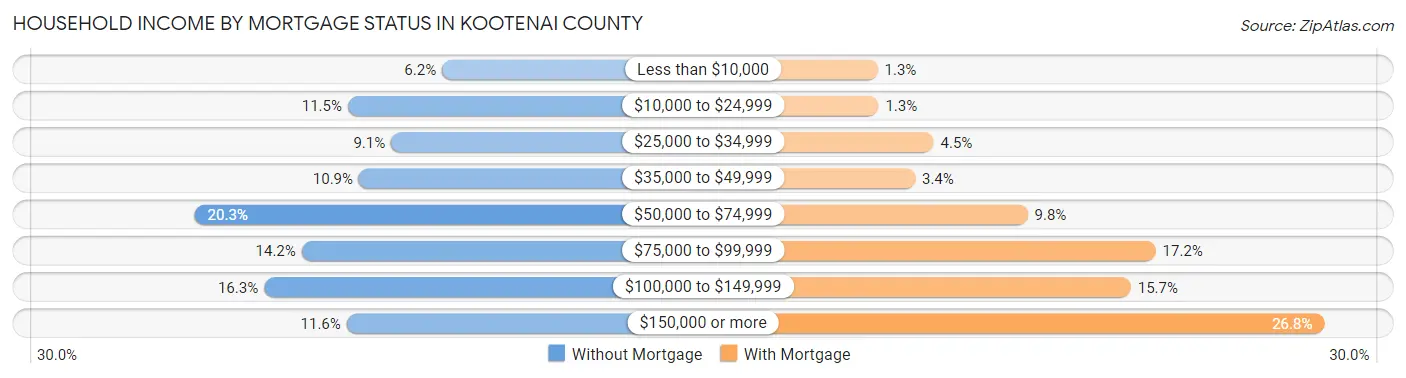
| Household Income | Without Mortgage | With Mortgage |
| Less than $10,000 | 1,075 (6.1%) | 390 (1.3%) |
| $10,000 to $24,999 | 2,016 (11.5%) | 407 (1.3%) |
| $25,000 to $34,999 | 1,584 (9.1%) | 1,382 (4.5%) |
| $35,000 to $49,999 | 1,906 (10.9%) | 1,053 (3.4%) |
| $50,000 to $74,999 | 3,548 (20.3%) | 3,044 (9.8%) |
| $75,000 to $99,999 | 2,479 (14.2%) | 5,312 (17.2%) |
| $100,000 to $149,999 | 2,855 (16.3%) | 4,871 (15.7%) |
| $150,000 or more | 2,029 (11.6%) | 8,293 (26.8%) |
| Total | 17,492 (100.0%) | 30,966 (100.0%) |
Property Value to Household Income Ratio in Kootenai County
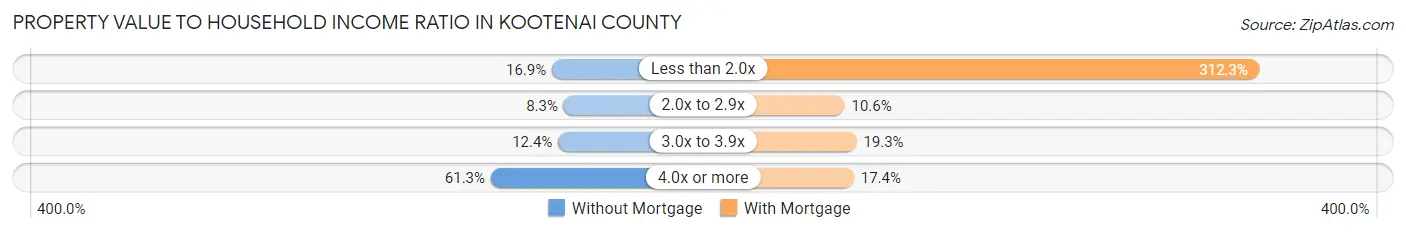
| Value-to-Income Ratio | Without Mortgage | With Mortgage |
| Less than 2.0x | 2,947 (16.9%) | 96,700 (312.3%) |
| 2.0x to 2.9x | 1,453 (8.3%) | 3,290 (10.6%) |
| 3.0x to 3.9x | 2,163 (12.4%) | 5,963 (19.3%) |
| 4.0x or more | 10,717 (61.3%) | 5,373 (17.3%) |
| Total | 17,492 (100.0%) | 30,966 (100.0%) |
Real Estate Taxes by Mortgage Status in Kootenai County
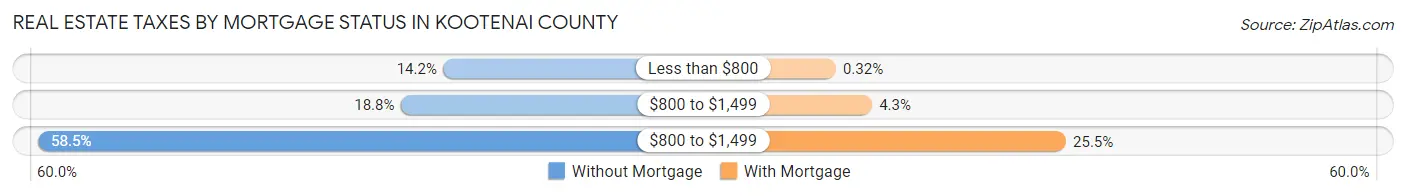
| Property Taxes | Without Mortgage | With Mortgage |
| Less than $800 | 2,481 (14.2%) | 99 (0.3%) |
| $800 to $1,499 | 3,294 (18.8%) | 1,328 (4.3%) |
| $800 to $1,499 | 10,234 (58.5%) | 7,908 (25.5%) |
| Total | 17,492 (100.0%) | 30,966 (100.0%) |
Health & Disability in Kootenai County
Health Insurance Coverage by Age in Kootenai County
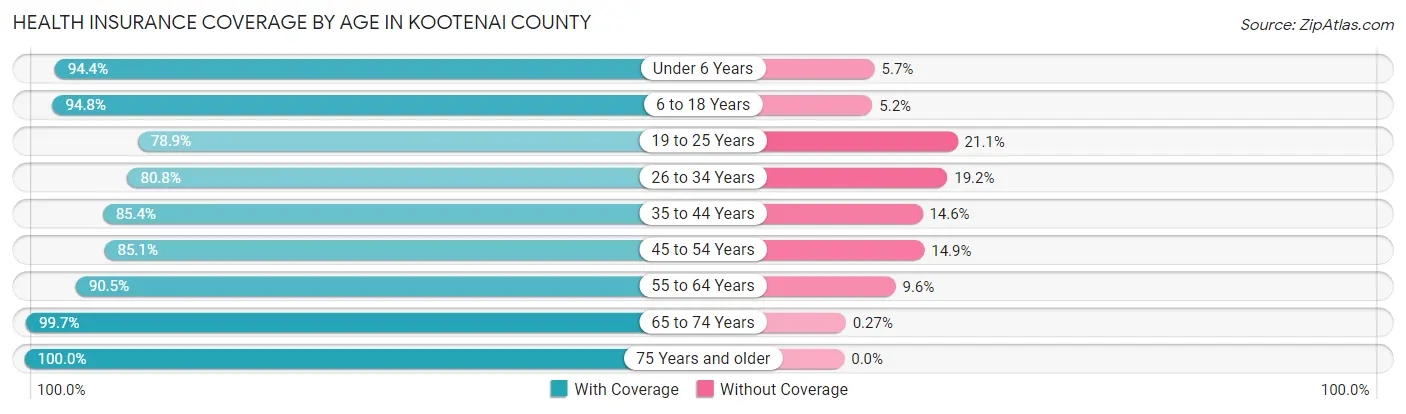
| Age Bracket | With Coverage | Without Coverage |
| Under 6 Years | 11,728 (94.4%) | 702 (5.7%) |
| 6 to 18 Years | 26,896 (94.8%) | 1,485 (5.2%) |
| 19 to 25 Years | 10,216 (78.9%) | 2,737 (21.1%) |
| 26 to 34 Years | 15,960 (80.8%) | 3,796 (19.2%) |
| 35 to 44 Years | 19,001 (85.4%) | 3,240 (14.6%) |
| 45 to 54 Years | 17,097 (85.1%) | 2,998 (14.9%) |
| 55 to 64 Years | 21,046 (90.4%) | 2,221 (9.6%) |
| 65 to 74 Years | 20,230 (99.7%) | 54 (0.3%) |
| 75 Years and older | 12,468 (100.0%) | 0 (0.0%) |
| Total | 154,642 (90.0%) | 17,233 (10.0%) |
Health Insurance Coverage by Citizenship Status in Kootenai County
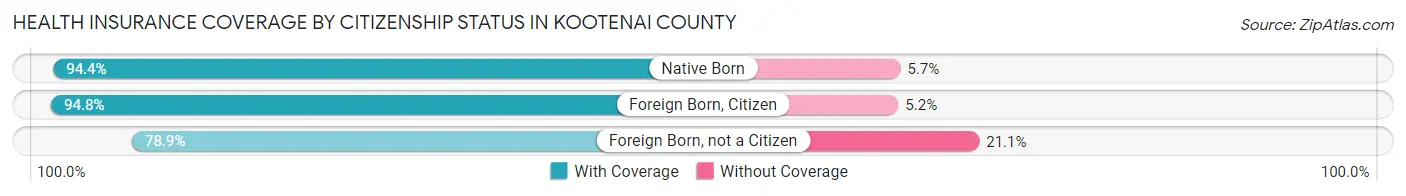
| Citizenship Status | With Coverage | Without Coverage |
| Native Born | 11,728 (94.4%) | 702 (5.7%) |
| Foreign Born, Citizen | 26,896 (94.8%) | 1,485 (5.2%) |
| Foreign Born, not a Citizen | 10,216 (78.9%) | 2,737 (21.1%) |
Health Insurance Coverage by Household Income in Kootenai County
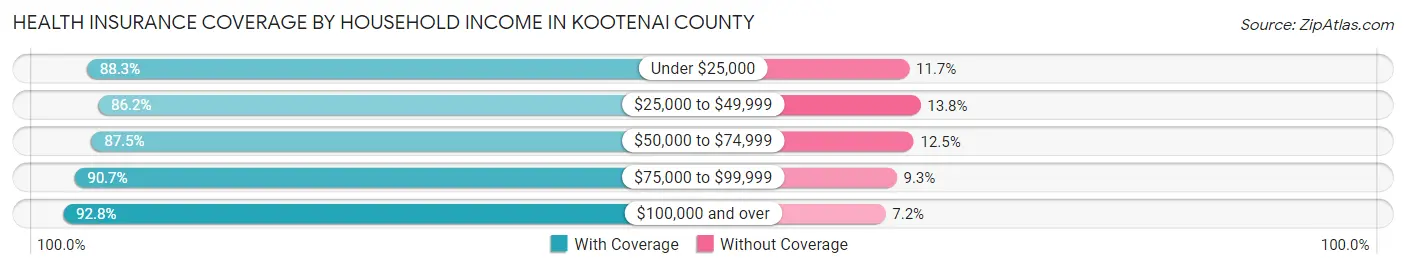
| Household Income | With Coverage | Without Coverage |
| Under $25,000 | 12,265 (88.3%) | 1,620 (11.7%) |
| $25,000 to $49,999 | 24,640 (86.2%) | 3,937 (13.8%) |
| $50,000 to $74,999 | 27,455 (87.5%) | 3,926 (12.5%) |
| $75,000 to $99,999 | 24,940 (90.7%) | 2,564 (9.3%) |
| $100,000 and over | 64,692 (92.8%) | 5,040 (7.2%) |
Public vs Private Health Insurance Coverage by Age in Kootenai County
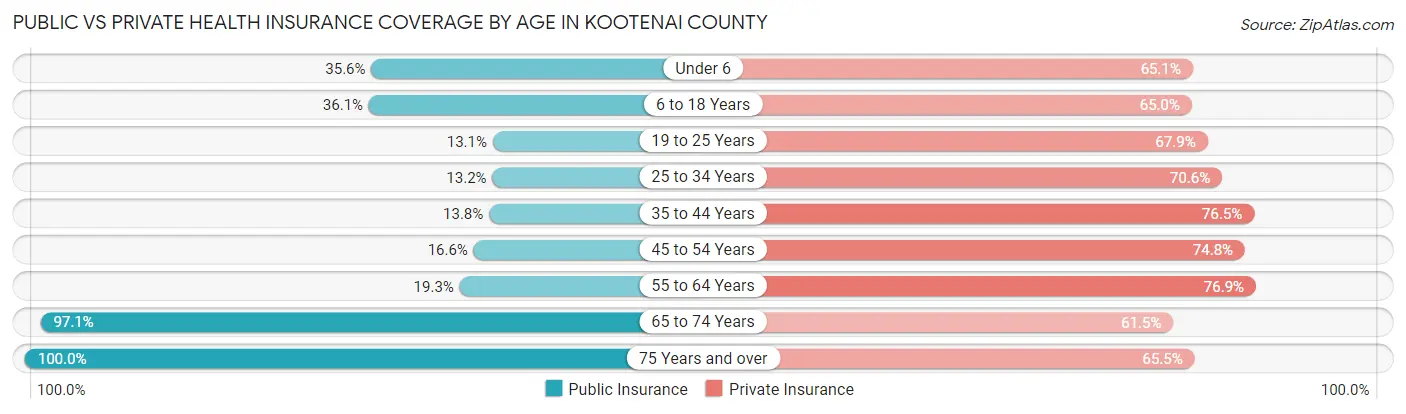
| Age Bracket | Public Insurance | Private Insurance |
| Under 6 | 4,430 (35.6%) | 8,096 (65.1%) |
| 6 to 18 Years | 10,242 (36.1%) | 18,435 (65.0%) |
| 19 to 25 Years | 1,697 (13.1%) | 8,794 (67.9%) |
| 25 to 34 Years | 2,601 (13.2%) | 13,944 (70.6%) |
| 35 to 44 Years | 3,064 (13.8%) | 17,021 (76.5%) |
| 45 to 54 Years | 3,343 (16.6%) | 15,035 (74.8%) |
| 55 to 64 Years | 4,478 (19.3%) | 17,883 (76.9%) |
| 65 to 74 Years | 19,685 (97.1%) | 12,479 (61.5%) |
| 75 Years and over | 12,462 (100.0%) | 8,164 (65.5%) |
| Total | 62,002 (36.1%) | 119,851 (69.7%) |
Disability Status by Sex by Age in Kootenai County
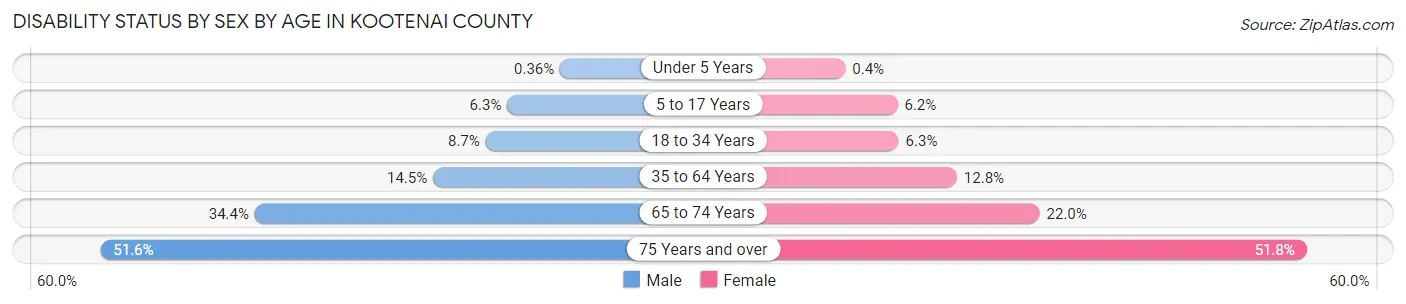
| Age Bracket | Male | Female |
| Under 5 Years | 18 (0.4%) | 19 (0.4%) |
| 5 to 17 Years | 944 (6.2%) | 875 (6.2%) |
| 18 to 34 Years | 1,527 (8.7%) | 1,073 (6.3%) |
| 35 to 64 Years | 4,736 (14.5%) | 4,224 (12.8%) |
| 65 to 74 Years | 3,325 (34.4%) | 2,337 (22.0%) |
| 75 Years and over | 2,950 (51.6%) | 3,493 (51.8%) |
Disability Class by Sex by Age in Kootenai County
Disability Class: Hearing Difficulty
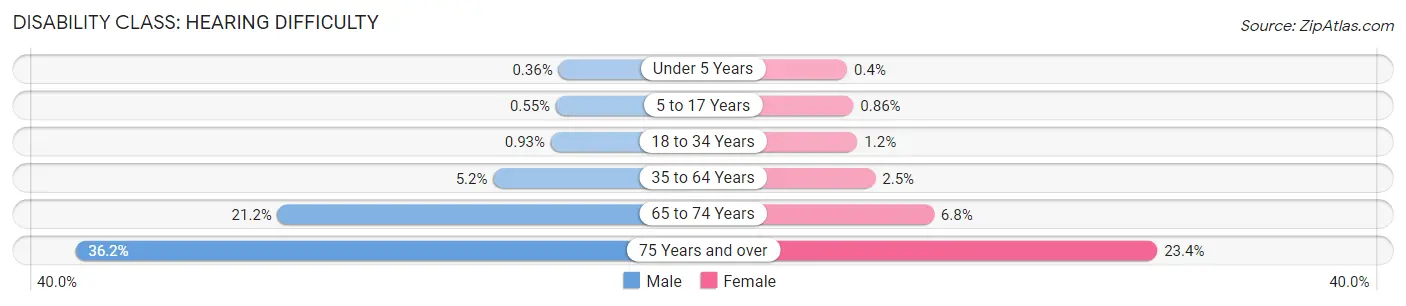
| Age Bracket | Male | Female |
| Under 5 Years | 18 (0.4%) | 19 (0.4%) |
| 5 to 17 Years | 83 (0.5%) | 121 (0.9%) |
| 18 to 34 Years | 164 (0.9%) | 197 (1.2%) |
| 35 to 64 Years | 1,697 (5.2%) | 821 (2.5%) |
| 65 to 74 Years | 2,053 (21.2%) | 725 (6.8%) |
| 75 Years and over | 2,073 (36.2%) | 1,580 (23.4%) |
Disability Class: Vision Difficulty
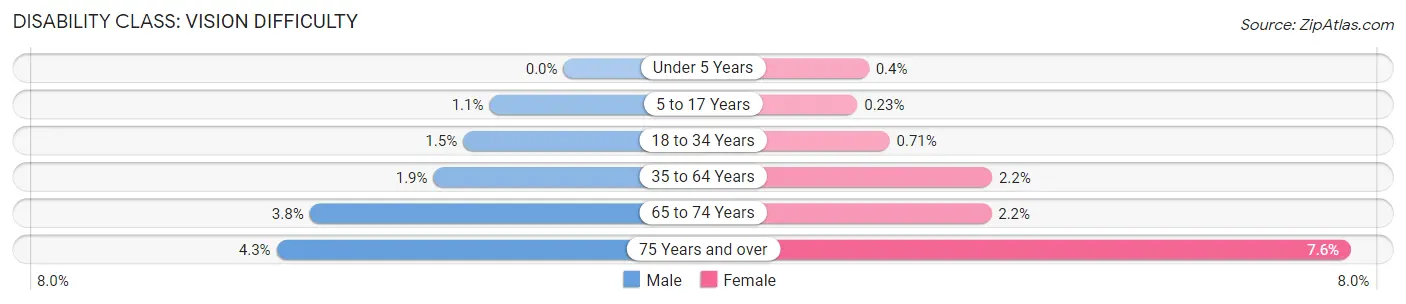
| Age Bracket | Male | Female |
| Under 5 Years | 0 (0.0%) | 19 (0.4%) |
| 5 to 17 Years | 166 (1.1%) | 33 (0.2%) |
| 18 to 34 Years | 262 (1.5%) | 120 (0.7%) |
| 35 to 64 Years | 630 (1.9%) | 735 (2.2%) |
| 65 to 74 Years | 365 (3.8%) | 235 (2.2%) |
| 75 Years and over | 244 (4.3%) | 510 (7.6%) |
Disability Class: Cognitive Difficulty
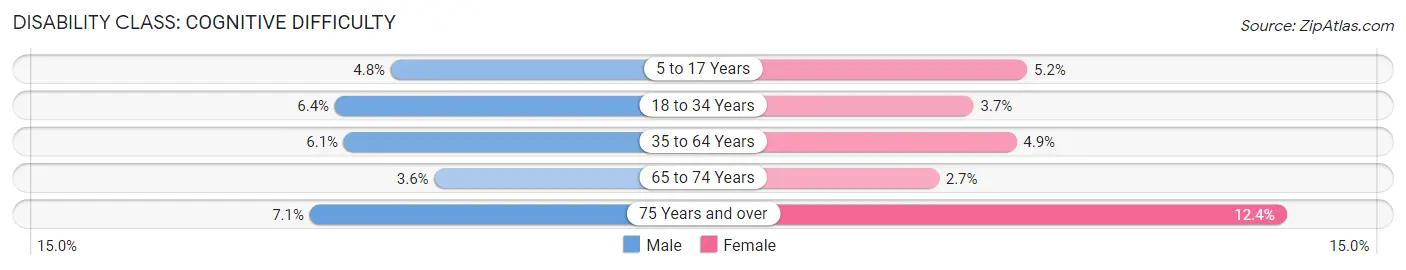
| Age Bracket | Male | Female |
| 5 to 17 Years | 725 (4.8%) | 727 (5.2%) |
| 18 to 34 Years | 1,121 (6.4%) | 622 (3.7%) |
| 35 to 64 Years | 1,996 (6.1%) | 1,601 (4.9%) |
| 65 to 74 Years | 347 (3.6%) | 286 (2.7%) |
| 75 Years and over | 404 (7.1%) | 835 (12.4%) |
Disability Class: Ambulatory Difficulty
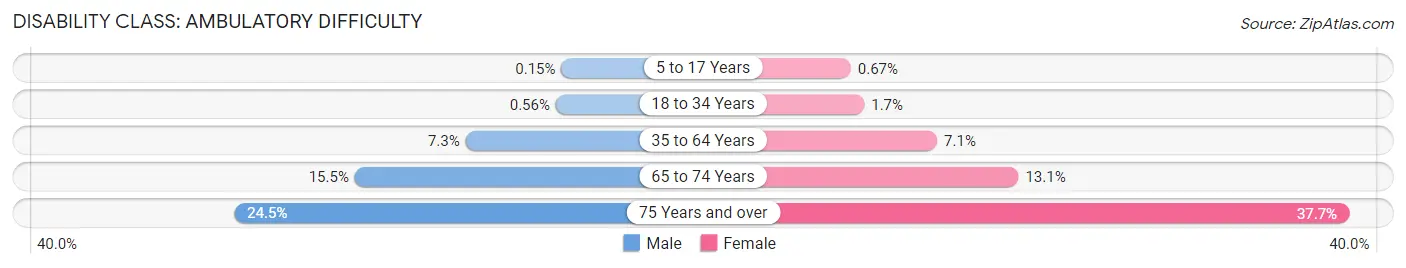
| Age Bracket | Male | Female |
| 5 to 17 Years | 22 (0.2%) | 94 (0.7%) |
| 18 to 34 Years | 99 (0.6%) | 283 (1.7%) |
| 35 to 64 Years | 2,371 (7.3%) | 2,332 (7.1%) |
| 65 to 74 Years | 1,499 (15.5%) | 1,391 (13.1%) |
| 75 Years and over | 1,399 (24.4%) | 2,540 (37.7%) |
Disability Class: Self-Care Difficulty
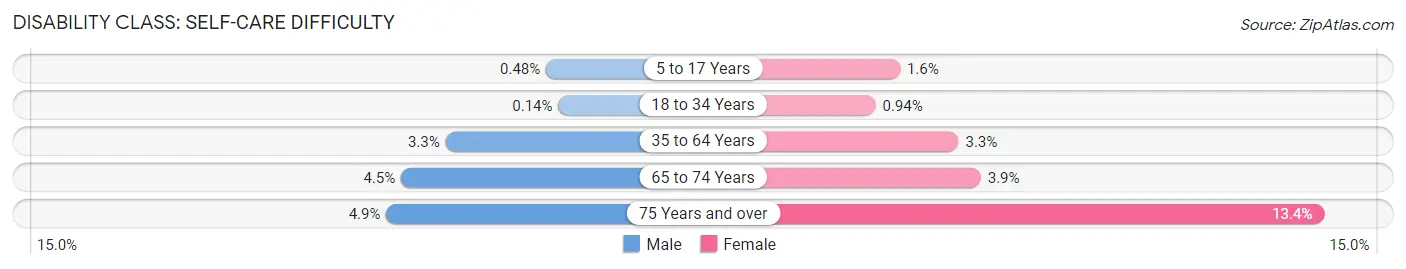
| Age Bracket | Male | Female |
| 5 to 17 Years | 73 (0.5%) | 229 (1.6%) |
| 18 to 34 Years | 25 (0.1%) | 159 (0.9%) |
| 35 to 64 Years | 1,070 (3.3%) | 1,072 (3.3%) |
| 65 to 74 Years | 437 (4.5%) | 410 (3.9%) |
| 75 Years and over | 282 (4.9%) | 906 (13.4%) |
Technology Access in Kootenai County
Computing Device Access in Kootenai County
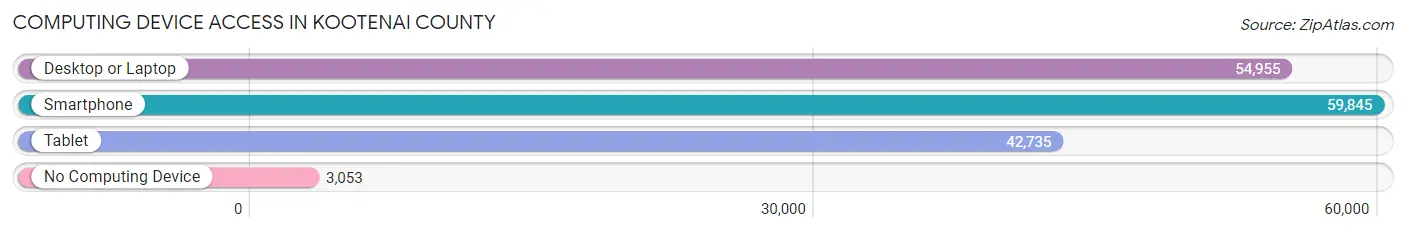
| Device Type | # Households | % Households |
| Desktop or Laptop | 54,955 | 82.0% |
| Smartphone | 59,845 | 89.3% |
| Tablet | 42,735 | 63.8% |
| No Computing Device | 3,053 | 4.6% |
| Total | 67,002 | 100.0% |
Internet Access in Kootenai County
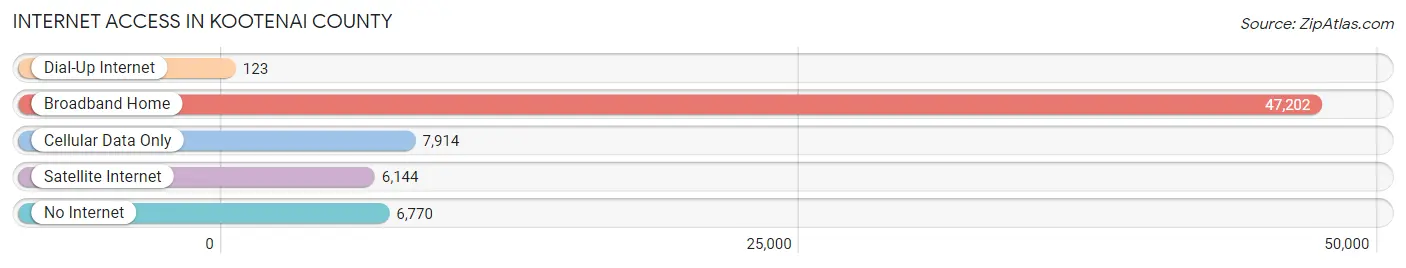
| Internet Type | # Households | % Households |
| Dial-Up Internet | 123 | 0.2% |
| Broadband Home | 47,202 | 70.5% |
| Cellular Data Only | 7,914 | 11.8% |
| Satellite Internet | 6,144 | 9.2% |
| No Internet | 6,770 | 10.1% |
| Total | 67,002 | 100.0% |
Kootenai County Summary
Kootenai County, Idaho is located in the northern part of the state and is bordered by the state of Washington to the west, Shoshone County to the east, and Bonner County to the north. The county seat is Coeur d'Alene, and the largest city is Post Falls. The county was established in 1864 and named after the Kootenai Native American tribe. As of the 2010 census, the population was 138,494, making it the fourth most populous county in Idaho.
Geography
Kootenai County covers an area of 1,902 square miles and is located in the northern part of the state. The county is bordered by the state of Washington to the west, Shoshone County to the east, and Bonner County to the north. The county is divided into two distinct regions: the northern region is mountainous and heavily forested, while the southern region is more open and rolling. The county is home to several lakes, including Coeur d'Alene Lake, Lake Pend Oreille, and Priest Lake. The county also contains several rivers, including the Spokane River, the Coeur d'Alene River, and the St. Joe River.
Climate
Kootenai County has a humid continental climate, with cold winters and warm summers. The average annual temperature is 44°F, with an average high of 68°F in July and an average low of 20°F in January. The average annual precipitation is 28 inches, with most of the precipitation falling in the winter months.
Demographics
As of the 2010 census, the population of Kootenai County was 138,494, making it the fourth most populous county in Idaho. The population is spread out, with the largest city, Coeur d'Alene, having a population of 44,137. The racial makeup of the county is 90.3% White, 1.2% Native American, 1.1% Asian, 0.7% Black or African American, 0.2% Pacific Islander, and 4.5% from two or more races. The median household income is $45,945, and the median family income is $54,945.
Economy
Kootenai County has a diverse economy, with a mix of manufacturing, retail, and service industries. The largest employers in the county are the Kootenai Health System, the Coeur d'Alene School District, and the Kootenai County Sheriff's Office. Other major employers include the Coeur d'Alene Casino, the Coeur d'Alene Resort, and the Coeur d'Alene Tribe. The county is also home to several technology companies, including Hewlett-Packard, Microsoft, and Oracle.
The county is home to several tourist attractions, including Silverwood Theme Park, the Coeur d'Alene Resort, and the Coeur d'Alene Casino. The county is also home to several wineries, including the Coeur d'Alene Cellars and the Pend Oreille Winery.
History
Kootenai County was established in 1864 and named after the Kootenai Native American tribe. The county was originally part of Shoshone County, but was split off in 1864. The county seat was originally located in Cataldo, but was moved to Coeur d'Alene in 1883.
The county was largely rural until the early 20th century, when the timber industry began to boom. The timber industry was the main source of employment in the county until the 1970s, when the industry began to decline. The county has since diversified its economy, with a mix of manufacturing, retail, and service industries.
Kootenai County is home to several Native American tribes, including the Coeur d'Alene Tribe, the Kootenai Tribe of Idaho, and the Kalispel Tribe of Indians. The county is also home to several historical sites, including the Cataldo Mission, the Coeur d'Alene Resort, and the Coeur d'Alene Casino.
Common Questions
What is the Total Population of Kootenai County?
Total Population of Kootenai County is 173,396.
What is the Total Male Population of Kootenai County?
Total Male Population of Kootenai County is 86,516.
What is the Total Female Population of Kootenai County?
Total Female Population of Kootenai County is 86,880.
What is the Ratio of Males per 100 Females in Kootenai County?
There are 99.58 Males per 100 Females in Kootenai County.
What is the Ratio of Females per 100 Males in Kootenai County?
There are 100.42 Females per 100 Males in Kootenai County.
What is the Median Population Age in Kootenai County?
Median Population Age in Kootenai County is 40.7 Years.
What is the Average Family Size in Kootenai County
Average Family Size in Kootenai County is 3.0 People.
What is the Average Household Size in Kootenai County
Average Household Size in Kootenai County is 2.5 People.
What is Per Capita Income in Kootenai County?
Per Capita income in Kootenai County is $36,718.
What is the Median Family Income in Kootenai County?
Median Family Income in Kootenai County is $84,489.
What is the Median Household income in Kootenai County?
Median Household Income in Kootenai County is $71,949.
What is Income or Wage Gap in Kootenai County?
Income or Wage Gap in Kootenai County is 35.1%.
Women in Kootenai County earn 64.9 cents for every dollar earned by a man.
What is Family Income Deficit in Kootenai County?
Family Income Deficit in Kootenai County is $10,129.
Families that are below poverty line in Kootenai County earn $10,129 less on average than the poverty threshold level.
What is Inequality or Gini Index in Kootenai County?
Inequality or Gini Index in Kootenai County is 0.43.
How Large is the Labor Force in Kootenai County?
There are 84,133 People in the Labor Forcein in Kootenai County.
What is the Percentage of People in the Labor Force in Kootenai County?
60.7% of People are in the Labor Force in Kootenai County.
What is the Unemployment Rate in Kootenai County?
Unemployment Rate in Kootenai County is 3.1%.