Jerome County, ID
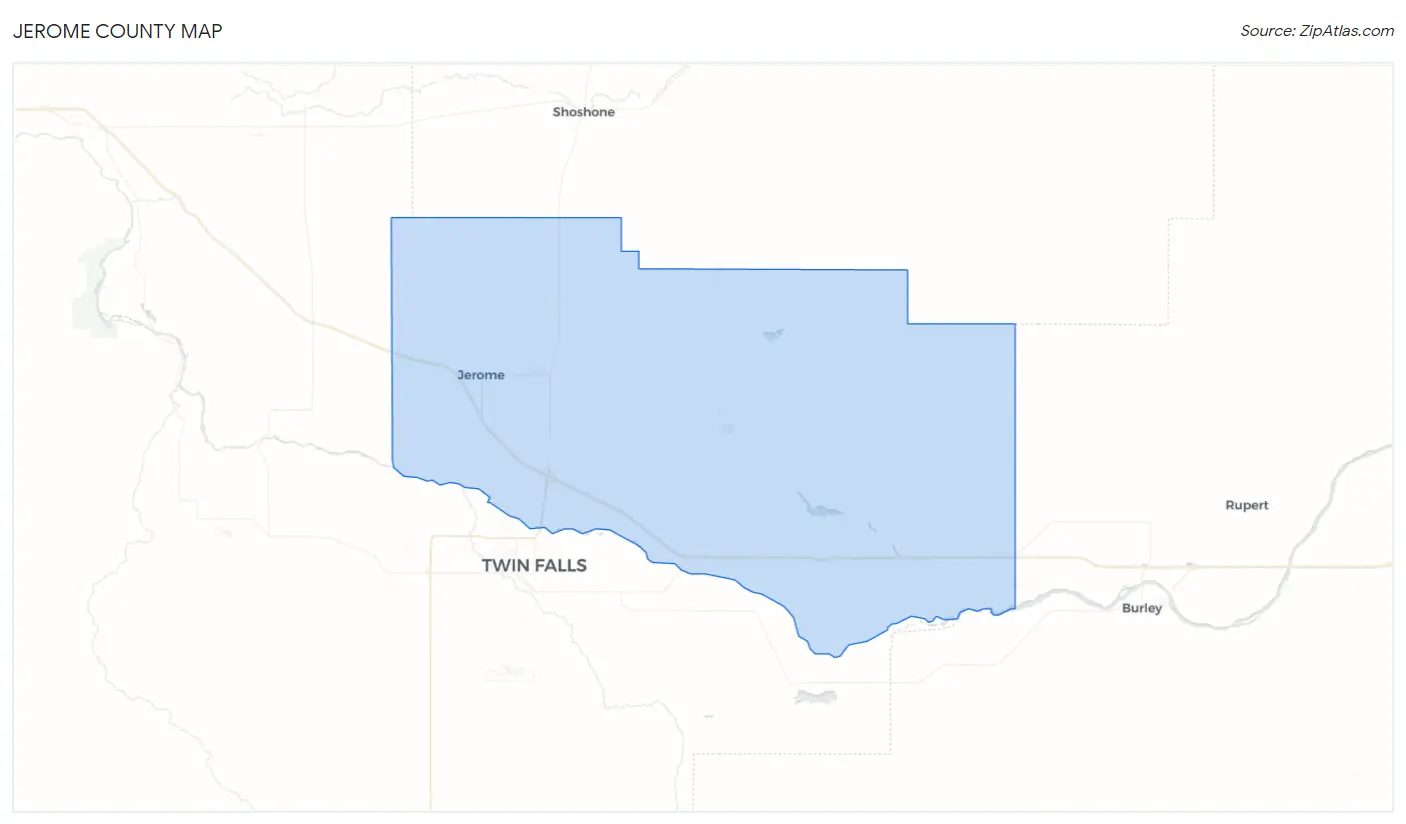
Jerome County Map
Jerome County Overview
24,474
TOTAL POPULATION
12,576
MALE POPULATION
11,898
FEMALE POPULATION
105.70
MALES / 100 FEMALES
94.61
FEMALES / 100 MALES
33.0
MEDIAN AGE
3.4
AVG FAMILY SIZE
3.0
AVG HOUSEHOLD SIZE
$28,266
PER CAPITA INCOME
$69,762
AVG FAMILY INCOME
$67,347
AVG HOUSEHOLD INCOME
50.1%
WAGE / INCOME GAP [ % ]
49.9¢/ $1
WAGE / INCOME GAP [ $ ]
0.43
INEQUALITY / GINI INDEX
11,901
LABOR FORCE [ PEOPLE ]
66.1%
PERCENT IN LABOR FORCE
3.5%
UNEMPLOYMENT RATE
Jerome County Area Codes
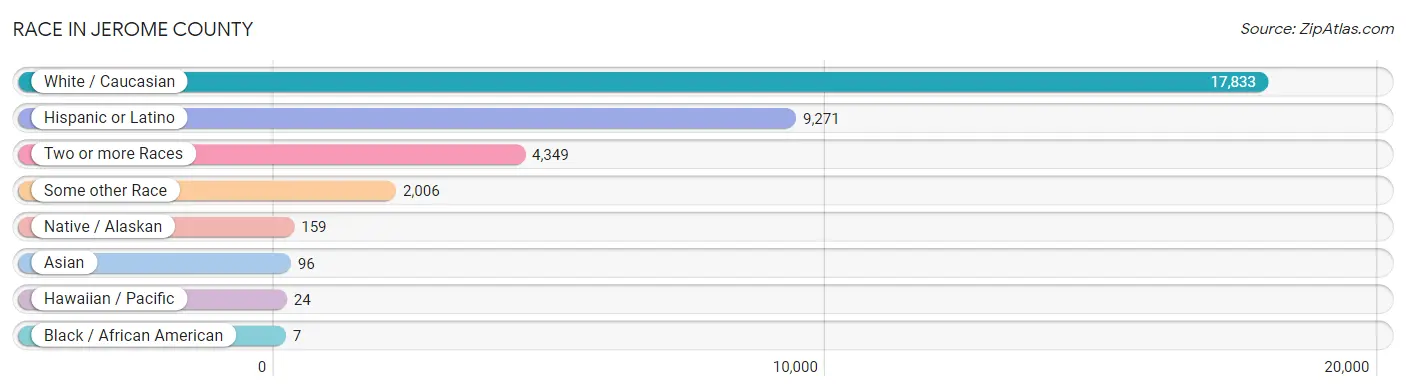
Race in Jerome County
The most populous races in Jerome County are White / Caucasian (17,833 | 72.9%), Hispanic or Latino (9,271 | 37.9%), and Two or more Races (4,349 | 17.8%).
| Race | # Population | % Population |
| Asian | 96 | 0.4% |
| Black / African American | 7 | 0.0% |
| Hawaiian / Pacific | 24 | 0.1% |
| Hispanic or Latino | 9,271 | 37.9% |
| Native / Alaskan | 159 | 0.6% |
| White / Caucasian | 17,833 | 72.9% |
| Two or more Races | 4,349 | 17.8% |
| Some other Race | 2,006 | 8.2% |
| Total | 24,474 | 100.0% |
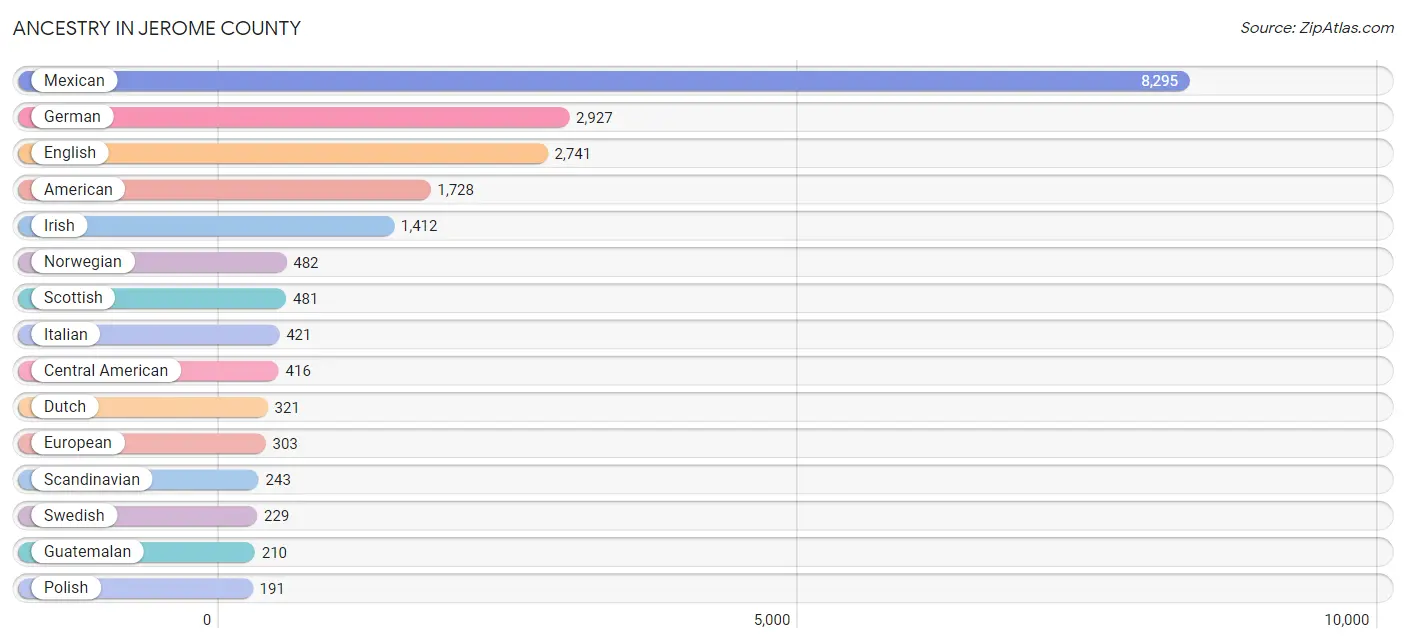
Ancestry in Jerome County
The most populous ancestries reported in Jerome County are Mexican (8,295 | 33.9%), German (2,927 | 12.0%), English (2,741 | 11.2%), American (1,728 | 7.1%), and Irish (1,412 | 5.8%), together accounting for 69.9% of all Jerome County residents.
| Ancestry | # Population | % Population |
| American | 1,728 | 7.1% |
| Apache | 18 | 0.1% |
| Armenian | 15 | 0.1% |
| Austrian | 17 | 0.1% |
| Basque | 27 | 0.1% |
| Bhutanese | 14 | 0.1% |
| Blackfeet | 38 | 0.2% |
| Brazilian | 2 | 0.0% |
| British | 188 | 0.8% |
| Burmese | 118 | 0.5% |
| Central American | 416 | 1.7% |
| Central American Indian | 18 | 0.1% |
| Cherokee | 76 | 0.3% |
| Chilean | 59 | 0.2% |
| Colombian | 29 | 0.1% |
| Cuban | 23 | 0.1% |
| Czech | 103 | 0.4% |
| Czechoslovakian | 9 | 0.0% |
| Danish | 183 | 0.7% |
| Dominican | 33 | 0.1% |
| Dutch | 321 | 1.3% |
| Eastern European | 81 | 0.3% |
| English | 2,741 | 11.2% |
| European | 303 | 1.2% |
| Finnish | 14 | 0.1% |
| French | 165 | 0.7% |
| French Canadian | 12 | 0.1% |
| German | 2,927 | 12.0% |
| Guatemalan | 210 | 0.9% |
| Hopi | 67 | 0.3% |
| Hungarian | 4 | 0.0% |
| Indian (Asian) | 10 | 0.0% |
| Iranian | 22 | 0.1% |
| Irish | 1,412 | 5.8% |
| Italian | 421 | 1.7% |
| Korean | 36 | 0.2% |
| Lithuanian | 35 | 0.1% |
| Mexican | 8,295 | 33.9% |
| Mexican American Indian | 79 | 0.3% |
| Navajo | 13 | 0.1% |
| Nicaraguan | 19 | 0.1% |
| Northern European | 98 | 0.4% |
| Norwegian | 482 | 2.0% |
| Pennsylvania German | 8 | 0.0% |
| Peruvian | 27 | 0.1% |
| Polish | 191 | 0.8% |
| Portuguese | 138 | 0.6% |
| Potawatomi | 23 | 0.1% |
| Puerto Rican | 159 | 0.6% |
| Russian | 16 | 0.1% |
| Salvadoran | 187 | 0.8% |
| Scandinavian | 243 | 1.0% |
| Scotch-Irish | 174 | 0.7% |
| Scottish | 481 | 2.0% |
| Serbian | 31 | 0.1% |
| Slavic | 5 | 0.0% |
| Slovak | 64 | 0.3% |
| South American | 115 | 0.5% |
| Spaniard | 41 | 0.2% |
| Spanish | 2 | 0.0% |
| Swedish | 229 | 0.9% |
| Swiss | 82 | 0.3% |
| Welsh | 52 | 0.2% |
| Yaqui | 18 | 0.1% |
| Yugoslavian | 5 | 0.0% | View All 65 Rows |
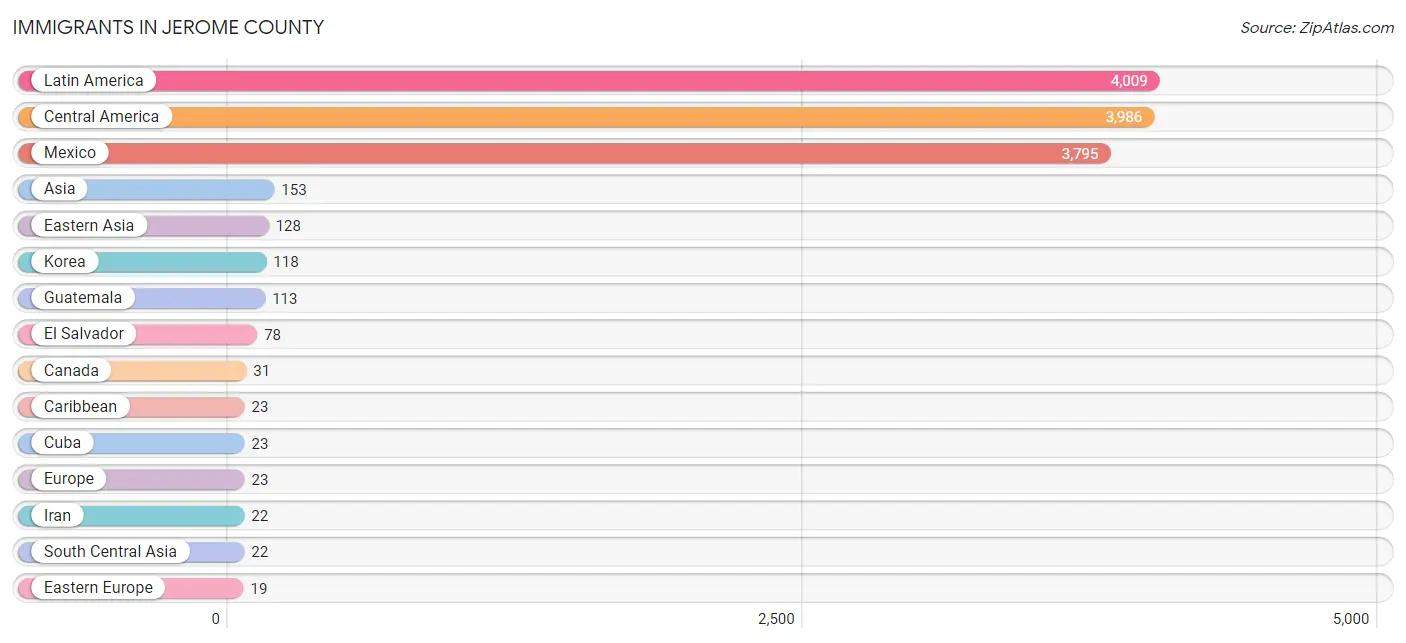
Immigrants in Jerome County
The most numerous immigrant groups reported in Jerome County came from Latin America (4,009 | 16.4%), Central America (3,986 | 16.3%), Mexico (3,795 | 15.5%), Asia (153 | 0.6%), and Eastern Asia (128 | 0.5%), together accounting for 49.3% of all Jerome County residents.
| Immigration Origin | # Population | % Population |
| Asia | 153 | 0.6% |
| Canada | 31 | 0.1% |
| Caribbean | 23 | 0.1% |
| Central America | 3,986 | 16.3% |
| China | 10 | 0.0% |
| Cuba | 23 | 0.1% |
| Eastern Asia | 128 | 0.5% |
| Eastern Europe | 19 | 0.1% |
| El Salvador | 78 | 0.3% |
| Europe | 23 | 0.1% |
| Guatemala | 113 | 0.5% |
| Iran | 22 | 0.1% |
| Italy | 4 | 0.0% |
| Korea | 118 | 0.5% |
| Latin America | 4,009 | 16.4% |
| Mexico | 3,795 | 15.5% |
| Philippines | 3 | 0.0% |
| Serbia | 19 | 0.1% |
| South Central Asia | 22 | 0.1% |
| South Eastern Asia | 3 | 0.0% |
| Southern Europe | 4 | 0.0% | View All 21 Rows |
Sex and Age in Jerome County
Sex and Age in Jerome County
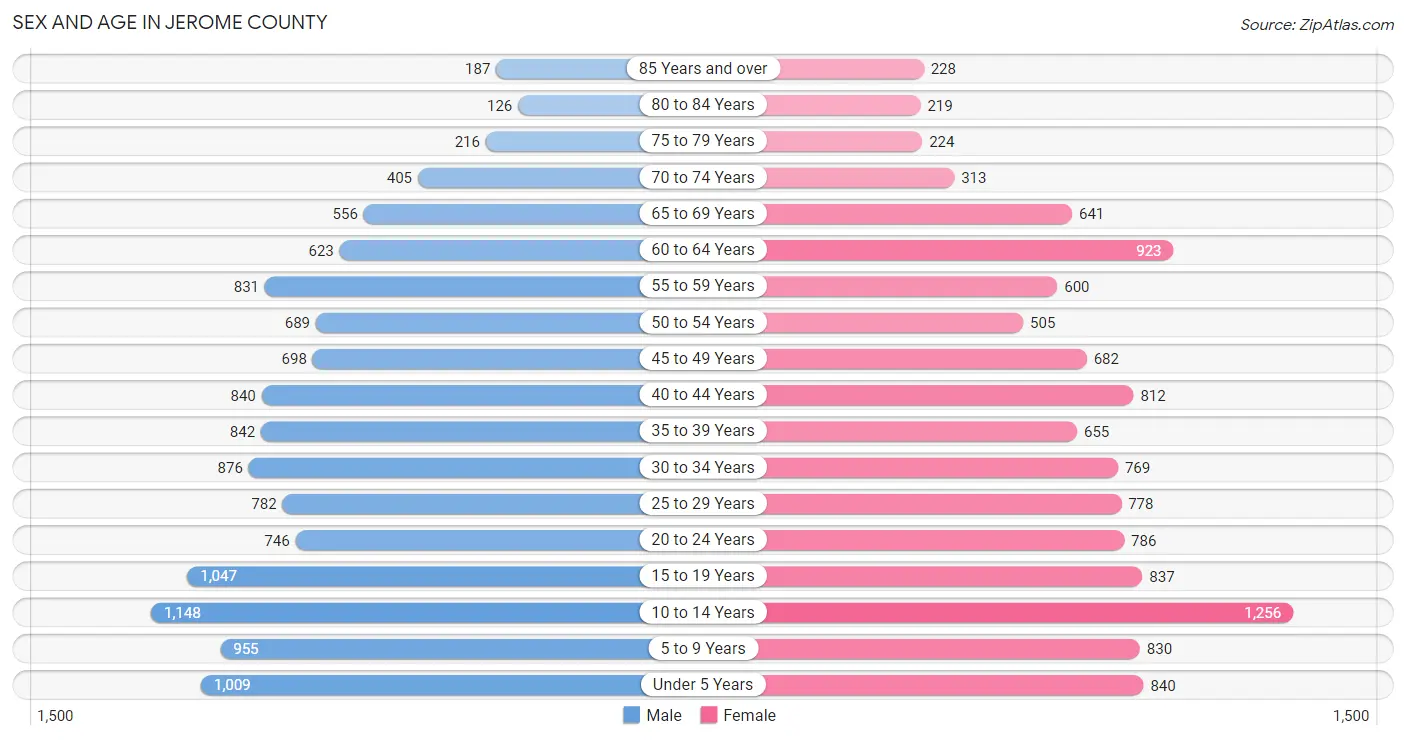
The most populous age groups in Jerome County are 10 to 14 Years (1,148 | 9.1%) for men and 10 to 14 Years (1,256 | 10.6%) for women.
| Age Bracket | Male | Female |
| Under 5 Years | 1,009 (8.0%) | 840 (7.1%) |
| 5 to 9 Years | 955 (7.6%) | 830 (7.0%) |
| 10 to 14 Years | 1,148 (9.1%) | 1,256 (10.6%) |
| 15 to 19 Years | 1,047 (8.3%) | 837 (7.0%) |
| 20 to 24 Years | 746 (5.9%) | 786 (6.6%) |
| 25 to 29 Years | 782 (6.2%) | 778 (6.5%) |
| 30 to 34 Years | 876 (7.0%) | 769 (6.5%) |
| 35 to 39 Years | 842 (6.7%) | 655 (5.5%) |
| 40 to 44 Years | 840 (6.7%) | 812 (6.8%) |
| 45 to 49 Years | 698 (5.6%) | 682 (5.7%) |
| 50 to 54 Years | 689 (5.5%) | 505 (4.2%) |
| 55 to 59 Years | 831 (6.6%) | 600 (5.0%) |
| 60 to 64 Years | 623 (5.0%) | 923 (7.8%) |
| 65 to 69 Years | 556 (4.4%) | 641 (5.4%) |
| 70 to 74 Years | 405 (3.2%) | 313 (2.6%) |
| 75 to 79 Years | 216 (1.7%) | 224 (1.9%) |
| 80 to 84 Years | 126 (1.0%) | 219 (1.8%) |
| 85 Years and over | 187 (1.5%) | 228 (1.9%) |
| Total | 12,576 (100.0%) | 11,898 (100.0%) |
Families and Households in Jerome County
Median Family Size in Jerome County
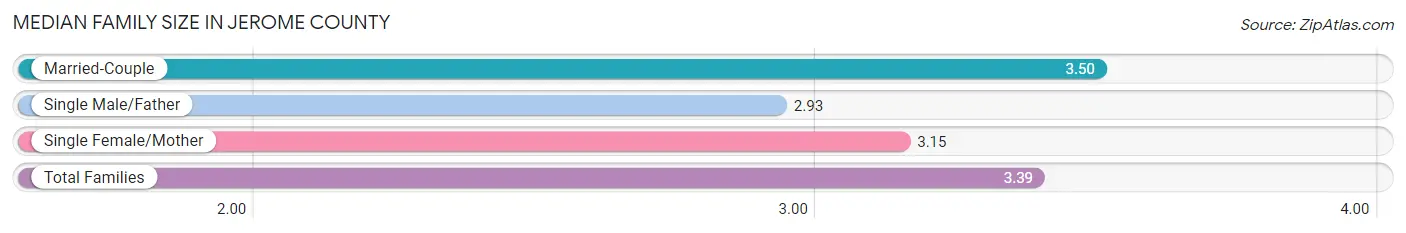
The median family size in Jerome County is 3.39 persons per family, with married-couple families (4,642 | 74.5%) accounting for the largest median family size of 3.5 persons per family. On the other hand, single male/father families (747 | 12.0%) represent the smallest median family size with 2.93 persons per family.
| Family Type | # Families | Family Size |
| Married-Couple | 4,642 (74.5%) | 3.50 |
| Single Male/Father | 747 (12.0%) | 2.93 |
| Single Female/Mother | 839 (13.5%) | 3.15 |
| Total Families | 6,228 (100.0%) | 3.39 |
Median Household Size in Jerome County
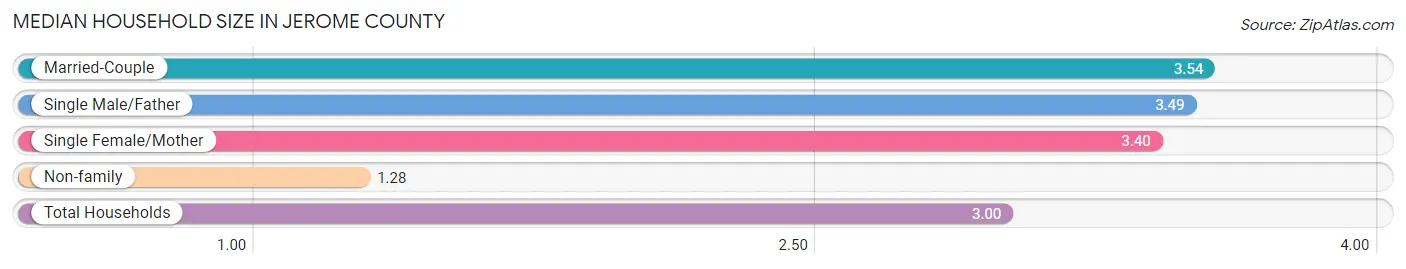
The median household size in Jerome County is 3.00 persons per household, with married-couple households (4,642 | 57.4%) accounting for the largest median household size of 3.54 persons per household. non-family households (1,864 | 23.0%) represent the smallest median household size with 1.28 persons per household.
| Household Type | # Households | Household Size |
| Married-Couple | 4,642 (57.4%) | 3.54 |
| Single Male/Father | 747 (9.2%) | 3.49 |
| Single Female/Mother | 839 (10.4%) | 3.40 |
| Non-family | 1,864 (23.0%) | 1.28 |
| Total Households | 8,092 (100.0%) | 3.00 |
Household Size by Marriage Status in Jerome County
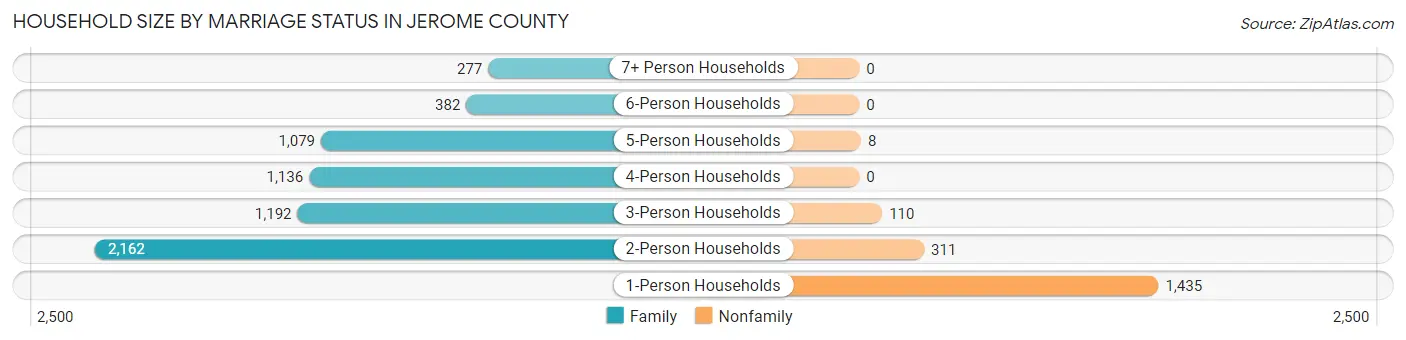
Out of a total of 8,092 households in Jerome County, 6,228 (77.0%) are family households, while 1,864 (23.0%) are nonfamily households. The most numerous type of family households are 2-person households, comprising 2,162, and the most common type of nonfamily households are 1-person households, comprising 1,435.
| Household Size | Family Households | Nonfamily Households |
| 1-Person Households | - | 1,435 (17.7%) |
| 2-Person Households | 2,162 (26.7%) | 311 (3.8%) |
| 3-Person Households | 1,192 (14.7%) | 110 (1.4%) |
| 4-Person Households | 1,136 (14.0%) | 0 (0.0%) |
| 5-Person Households | 1,079 (13.3%) | 8 (0.1%) |
| 6-Person Households | 382 (4.7%) | 0 (0.0%) |
| 7+ Person Households | 277 (3.4%) | 0 (0.0%) |
| Total | 6,228 (77.0%) | 1,864 (23.0%) |
Female Fertility in Jerome County
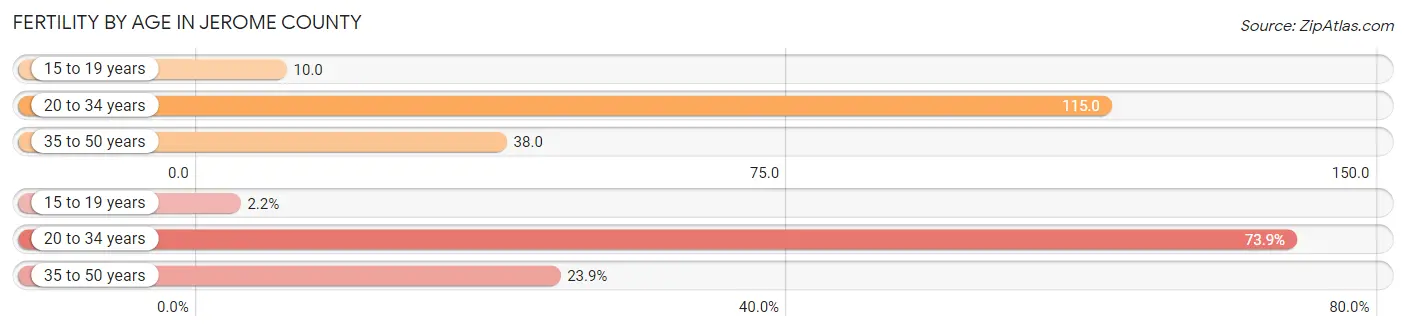
Fertility by Age in Jerome County
Average fertility rate in Jerome County is 67.0 births per 1,000 women. Women in the age bracket of 20 to 34 years have the highest fertility rate with 115.0 births per 1,000 women. Women in the age bracket of 20 to 34 years acount for 73.9% of all women with births.
| Age Bracket | Women with Births | Births / 1,000 Women |
| 15 to 19 years | 8 (2.2%) | 10.0 |
| 20 to 34 years | 269 (73.9%) | 115.0 |
| 35 to 50 years | 87 (23.9%) | 38.0 |
| Total | 364 (100.0%) | 67.0 |
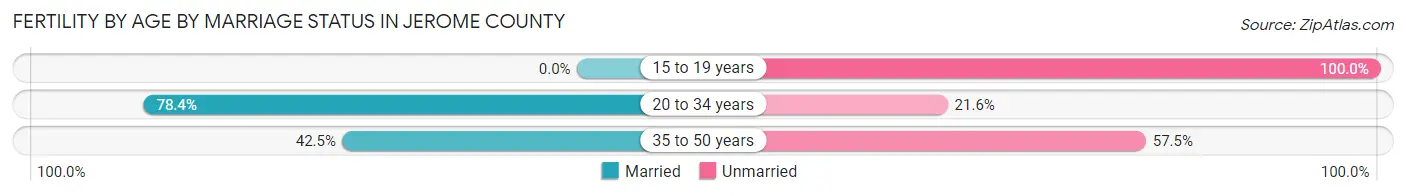
Fertility by Age by Marriage Status in Jerome County
68.1% of women with births (364) in Jerome County are married. The highest percentage of unmarried women with births falls into 15 to 19 years age bracket with 100.0% of them unmarried at the time of birth, while the lowest percentage of unmarried women with births belong to 20 to 34 years age bracket with 21.6% of them unmarried.
| Age Bracket | Married | Unmarried |
| 15 to 19 years | 0 (0.0%) | 8 (100.0%) |
| 20 to 34 years | 211 (78.4%) | 58 (21.6%) |
| 35 to 50 years | 37 (42.5%) | 50 (57.5%) |
| Total | 248 (68.1%) | 116 (31.9%) |
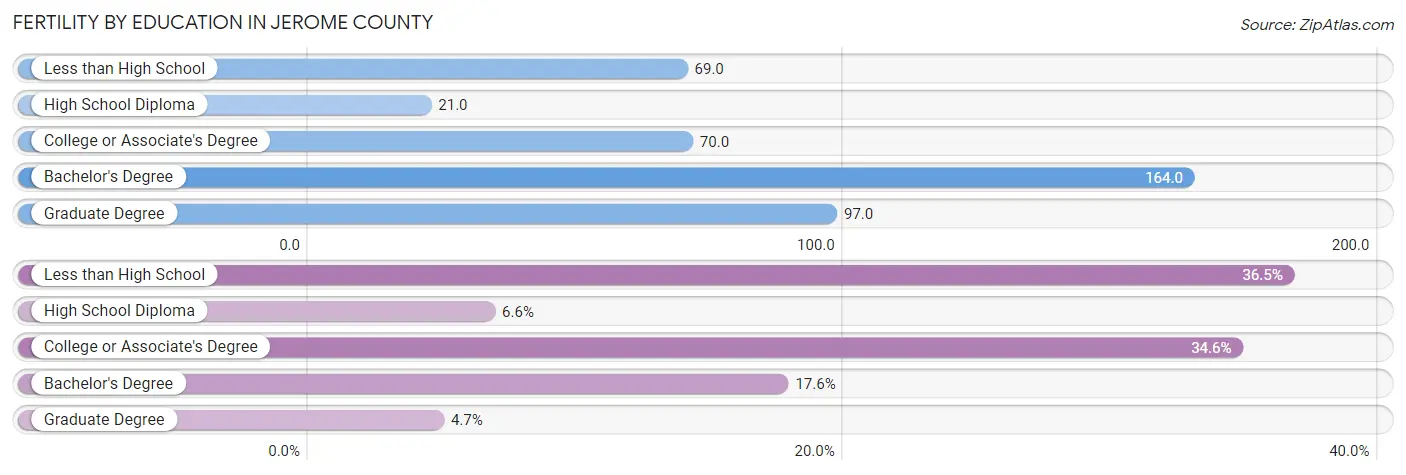
Fertility by Education in Jerome County
Average fertility rate in Jerome County is 67.0 births per 1,000 women. Women with the education attainment of bachelor's degree have the highest fertility rate of 164.0 births per 1,000 women, while women with the education attainment of high school diploma have the lowest fertility at 21.0 births per 1,000 women. Women with the education attainment of less than high school represent 36.5% of all women with births.
| Educational Attainment | Women with Births | Births / 1,000 Women |
| Less than High School | 133 (36.5%) | 69.0 |
| High School Diploma | 24 (6.6%) | 21.0 |
| College or Associate's Degree | 126 (34.6%) | 70.0 |
| Bachelor's Degree | 64 (17.6%) | 164.0 |
| Graduate Degree | 17 (4.7%) | 97.0 |
| Total | 364 (100.0%) | 67.0 |
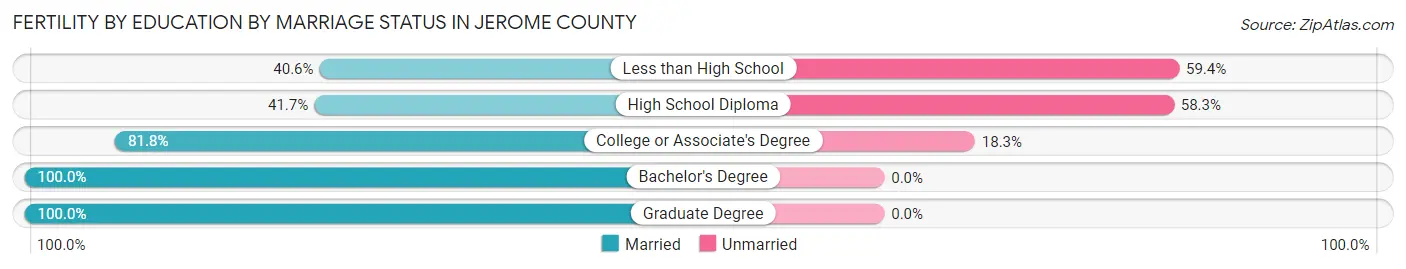
Fertility by Education by Marriage Status in Jerome County
31.9% of women with births in Jerome County are unmarried. Women with the educational attainment of bachelor's degree are most likely to be married with 100.0% of them married at childbirth, while women with the educational attainment of less than high school are least likely to be married with 59.4% of them unmarried at childbirth.
| Educational Attainment | Married | Unmarried |
| Less than High School | 54 (40.6%) | 79 (59.4%) |
| High School Diploma | 10 (41.7%) | 14 (58.3%) |
| College or Associate's Degree | 103 (81.8%) | 23 (18.2%) |
| Bachelor's Degree | 64 (100.0%) | 0 (0.0%) |
| Graduate Degree | 17 (100.0%) | 0 (0.0%) |
| Total | 248 (68.1%) | 116 (31.9%) |
Income in Jerome County
Income Overview in Jerome County
Per Capita Income in Jerome County is $28,266, while median incomes of families and households are $69,762 and $67,347 respectively.
| Characteristic | Number | Measure |
| Per Capita Income | 24,474 | $28,266 |
| Median Family Income | 6,228 | $69,762 |
| Mean Family Income | 6,228 | $90,673 |
| Median Household Income | 8,092 | $67,347 |
| Mean Household Income | 8,092 | $84,105 |
| Income Deficit | 6,228 | $0 |
| Wage / Income Gap (%) | 24,474 | 50.09% |
| Wage / Income Gap ($) | 24,474 | 49.91¢ per $1 |
| Gini / Inequality Index | 24,474 | 0.43 |
Earnings by Sex in Jerome County
Average Earnings in Jerome County are $32,161, $41,265 for men and $20,594 for women, a difference of 50.1%.
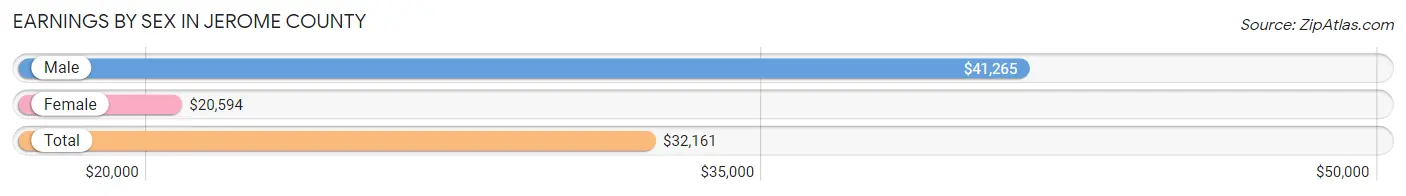
| Sex | Number | Average Earnings |
| Male | 7,250 (57.0%) | $41,265 |
| Female | 5,475 (43.0%) | $20,594 |
| Total | 12,725 (100.0%) | $32,161 |
Earnings by Sex by Income Bracket in Jerome County
The most common earnings brackets in Jerome County are $55,000 to $64,999 for men (808 | 11.1%) and $25,000 to $29,999 for women (503 | 9.2%).
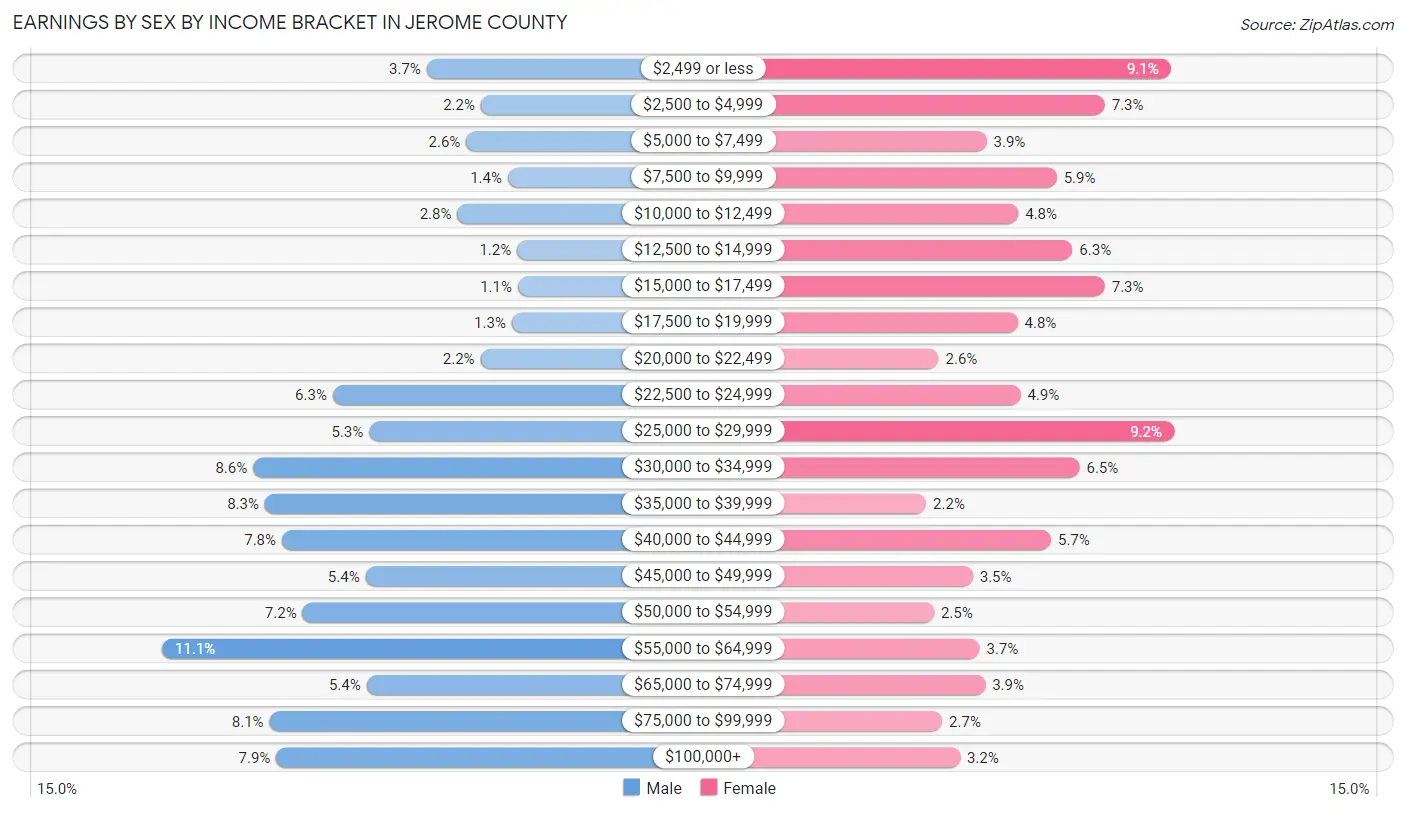
| Income | Male | Female |
| $2,499 or less | 268 (3.7%) | 498 (9.1%) |
| $2,500 to $4,999 | 158 (2.2%) | 397 (7.2%) |
| $5,000 to $7,499 | 188 (2.6%) | 215 (3.9%) |
| $7,500 to $9,999 | 103 (1.4%) | 323 (5.9%) |
| $10,000 to $12,499 | 206 (2.8%) | 264 (4.8%) |
| $12,500 to $14,999 | 84 (1.2%) | 347 (6.3%) |
| $15,000 to $17,499 | 83 (1.1%) | 397 (7.2%) |
| $17,500 to $19,999 | 95 (1.3%) | 263 (4.8%) |
| $20,000 to $22,499 | 159 (2.2%) | 141 (2.6%) |
| $22,500 to $24,999 | 460 (6.3%) | 267 (4.9%) |
| $25,000 to $29,999 | 386 (5.3%) | 503 (9.2%) |
| $30,000 to $34,999 | 622 (8.6%) | 358 (6.5%) |
| $35,000 to $39,999 | 598 (8.3%) | 122 (2.2%) |
| $40,000 to $44,999 | 563 (7.8%) | 314 (5.7%) |
| $45,000 to $49,999 | 393 (5.4%) | 194 (3.5%) |
| $50,000 to $54,999 | 521 (7.2%) | 134 (2.5%) |
| $55,000 to $64,999 | 808 (11.1%) | 204 (3.7%) |
| $65,000 to $74,999 | 391 (5.4%) | 213 (3.9%) |
| $75,000 to $99,999 | 589 (8.1%) | 147 (2.7%) |
| $100,000+ | 575 (7.9%) | 174 (3.2%) |
| Total | 7,250 (100.0%) | 5,475 (100.0%) |
Earnings by Sex by Educational Attainment in Jerome County
Average earnings in Jerome County are $45,435 for men and $24,842 for women, a difference of 45.3%. Men with an educational attainment of graduate degree enjoy the highest average annual earnings of $80,313, while those with high school diploma education earn the least with $39,832. Women with an educational attainment of bachelor's degree earn the most with the average annual earnings of $49,814, while those with high school diploma education have the smallest earnings of $16,895.
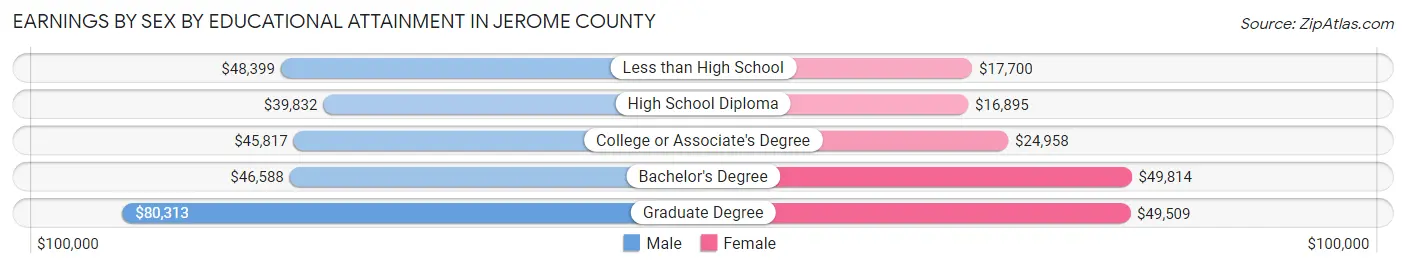
| Educational Attainment | Male Income | Female Income |
| Less than High School | $48,399 | $17,700 |
| High School Diploma | $39,832 | $16,895 |
| College or Associate's Degree | $45,817 | $24,958 |
| Bachelor's Degree | $46,588 | $49,814 |
| Graduate Degree | $80,313 | $49,509 |
| Total | $45,435 | $24,842 |
Family Income in Jerome County
Family Income Brackets in Jerome County
According to the Jerome County family income data, there are 1,532 families falling into the $50,000 to $74,999 income range, which is the most common income bracket and makes up 24.6% of all families. Conversely, the less than $10,000 income bracket is the least frequent group with only 156 families (2.5%) belonging to this category.
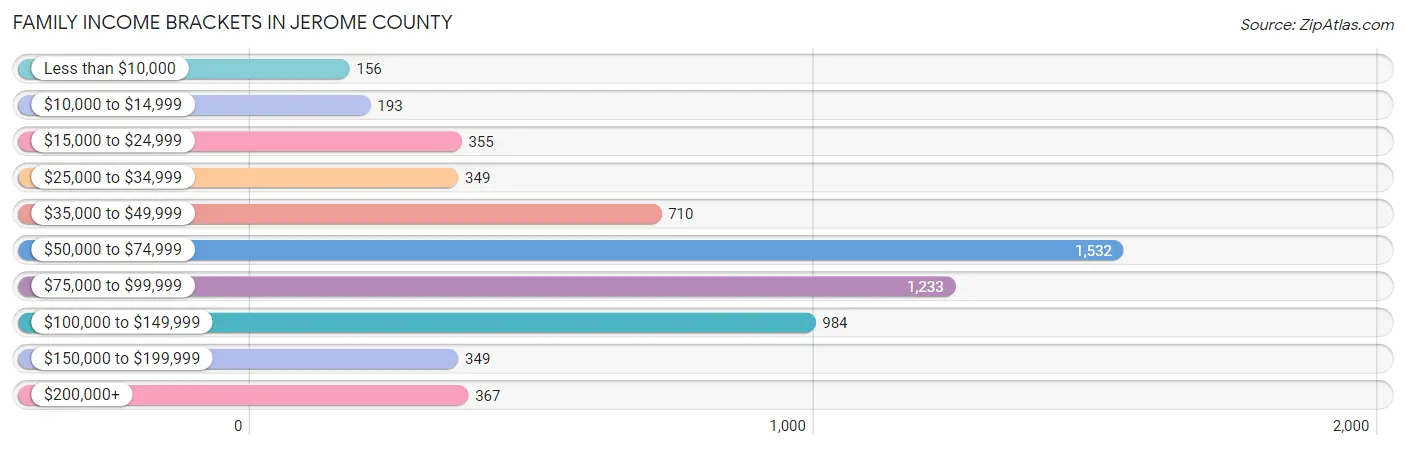
| Income Bracket | # Families | % Families |
| Less than $10,000 | 156 | 2.5% |
| $10,000 to $14,999 | 193 | 3.1% |
| $15,000 to $24,999 | 355 | 5.7% |
| $25,000 to $34,999 | 349 | 5.6% |
| $35,000 to $49,999 | 710 | 11.4% |
| $50,000 to $74,999 | 1,532 | 24.6% |
| $75,000 to $99,999 | 1,233 | 19.8% |
| $100,000 to $149,999 | 984 | 15.8% |
| $150,000 to $199,999 | 349 | 5.6% |
| $200,000+ | 367 | 5.9% |
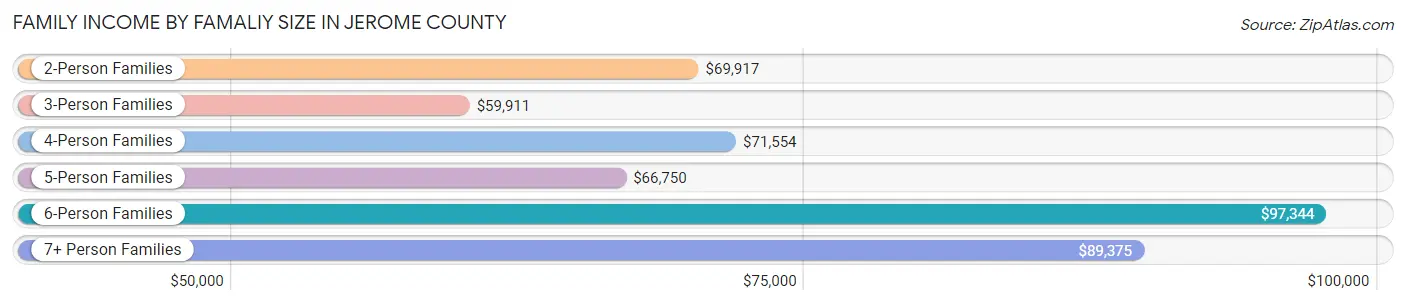
Family Income by Famaliy Size in Jerome County
6-person families (399 | 6.4%) account for the highest median family income in Jerome County with $97,344 per family, while 2-person families (2,350 | 37.7%) have the highest median income of $34,958 per family member.
| Income Bracket | # Families | Median Income |
| 2-Person Families | 2,350 (37.7%) | $69,917 |
| 3-Person Families | 1,244 (20.0%) | $59,911 |
| 4-Person Families | 1,248 (20.0%) | $71,554 |
| 5-Person Families | 756 (12.1%) | $66,750 |
| 6-Person Families | 399 (6.4%) | $97,344 |
| 7+ Person Families | 231 (3.7%) | $89,375 |
| Total | 6,228 (100.0%) | $69,762 |
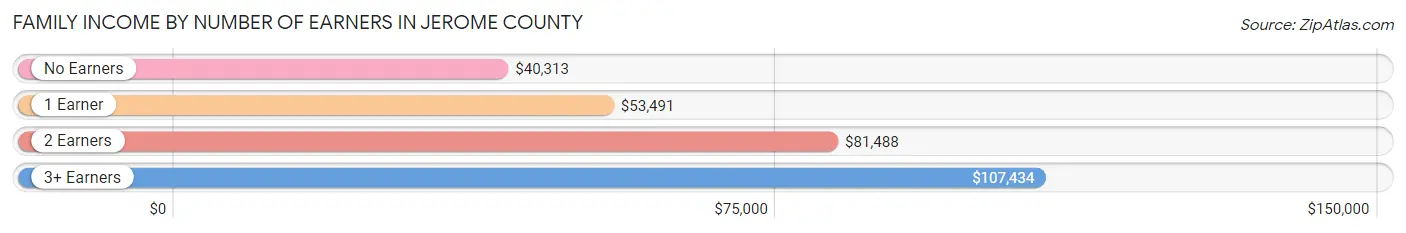
Family Income by Number of Earners in Jerome County
The median family income in Jerome County is $69,762, with families comprising 3+ earners (1,023) having the highest median family income of $107,434, while families with no earners (665) have the lowest median family income of $40,313, accounting for 16.4% and 10.7% of families, respectively.
| Number of Earners | # Families | Median Income |
| No Earners | 665 (10.7%) | $40,313 |
| 1 Earner | 2,199 (35.3%) | $53,491 |
| 2 Earners | 2,341 (37.6%) | $81,488 |
| 3+ Earners | 1,023 (16.4%) | $107,434 |
| Total | 6,228 (100.0%) | $69,762 |
Household Income in Jerome County
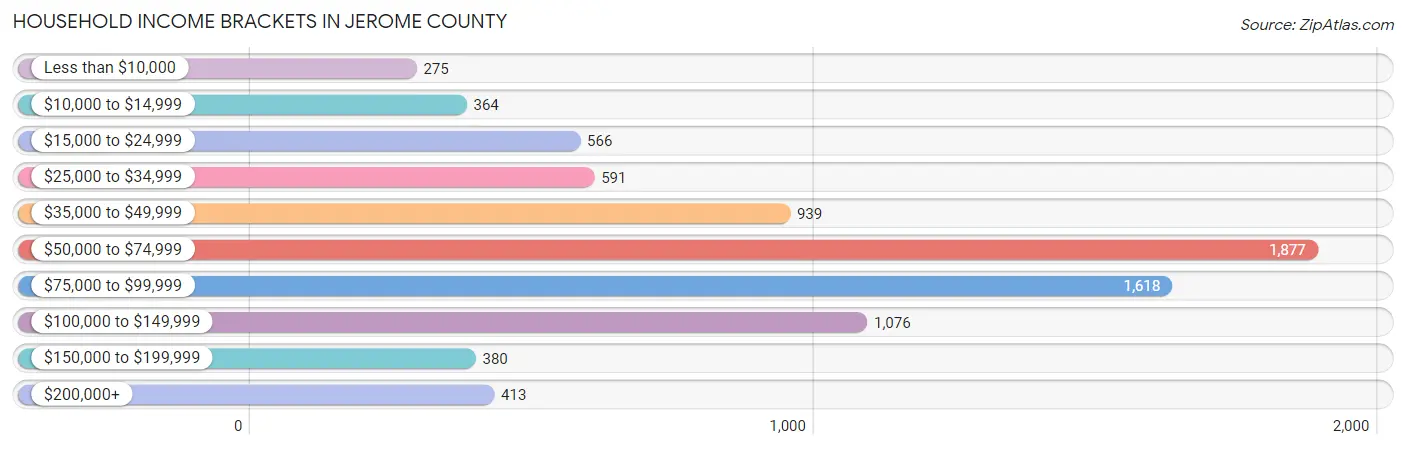
Household Income Brackets in Jerome County
With 1,877 households falling in the category, the $50,000 to $74,999 income range is the most frequent in Jerome County, accounting for 23.2% of all households. In contrast, only 275 households (3.4%) fall into the less than $10,000 income bracket, making it the least populous group.
| Income Bracket | # Households | % Households |
| Less than $10,000 | 275 | 3.4% |
| $10,000 to $14,999 | 364 | 4.5% |
| $15,000 to $24,999 | 566 | 7.0% |
| $25,000 to $34,999 | 591 | 7.3% |
| $35,000 to $49,999 | 939 | 11.6% |
| $50,000 to $74,999 | 1,877 | 23.2% |
| $75,000 to $99,999 | 1,618 | 20.0% |
| $100,000 to $149,999 | 1,076 | 13.3% |
| $150,000 to $199,999 | 380 | 4.7% |
| $200,000+ | 413 | 5.1% |
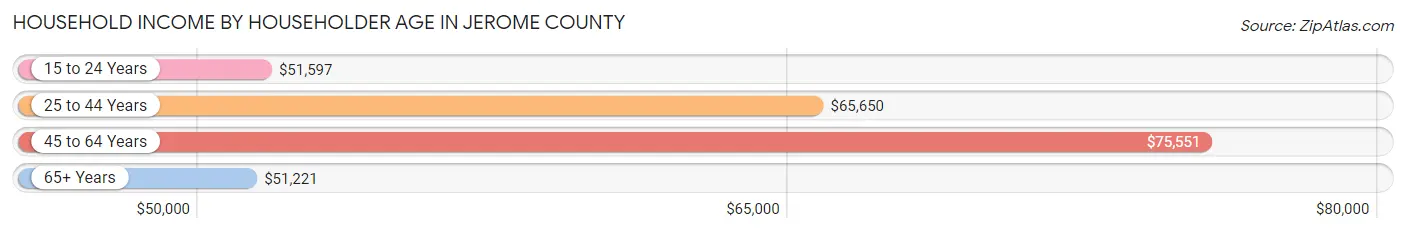
Household Income by Householder Age in Jerome County
The median household income in Jerome County is $67,347, with the highest median household income of $75,551 found in the 45 to 64 years age bracket for the primary householder. A total of 2,799 households (34.6%) fall into this category. Meanwhile, the 65+ years age bracket for the primary householder has the lowest median household income of $51,221, with 1,948 households (24.1%) in this group.
| Income Bracket | # Households | Median Income |
| 15 to 24 Years | 345 (4.3%) | $51,597 |
| 25 to 44 Years | 3,000 (37.1%) | $65,650 |
| 45 to 64 Years | 2,799 (34.6%) | $75,551 |
| 65+ Years | 1,948 (24.1%) | $51,221 |
| Total | 8,092 (100.0%) | $67,347 |
Poverty in Jerome County
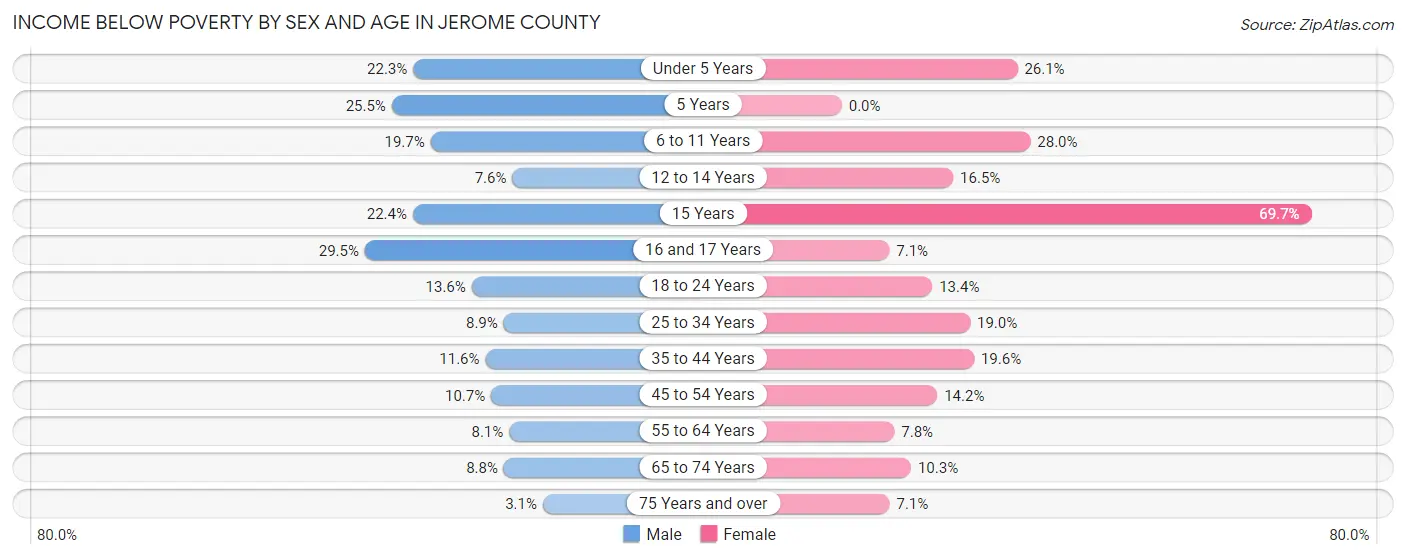
Income Below Poverty by Sex and Age in Jerome County
With 12.8% poverty level for males and 16.9% for females among the residents of Jerome County, 16 and 17 year old males and 15 year old females are the most vulnerable to poverty, with 125 males (29.5%) and 129 females (69.7%) in their respective age groups living below the poverty level.
| Age Bracket | Male | Female |
| Under 5 Years | 220 (22.3%) | 211 (26.1%) |
| 5 Years | 52 (25.5%) | 0 (0.0%) |
| 6 to 11 Years | 224 (19.7%) | 362 (28.0%) |
| 12 to 14 Years | 54 (7.6%) | 109 (16.5%) |
| 15 Years | 55 (22.4%) | 129 (69.7%) |
| 16 and 17 Years | 125 (29.5%) | 31 (7.1%) |
| 18 to 24 Years | 152 (13.6%) | 134 (13.4%) |
| 25 to 34 Years | 145 (8.9%) | 291 (19.0%) |
| 35 to 44 Years | 194 (11.6%) | 288 (19.6%) |
| 45 to 54 Years | 148 (10.7%) | 168 (14.2%) |
| 55 to 64 Years | 117 (8.1%) | 119 (7.8%) |
| 65 to 74 Years | 85 (8.8%) | 98 (10.3%) |
| 75 Years and over | 16 (3.0%) | 44 (7.1%) |
| Total | 1,587 (12.8%) | 1,984 (16.9%) |
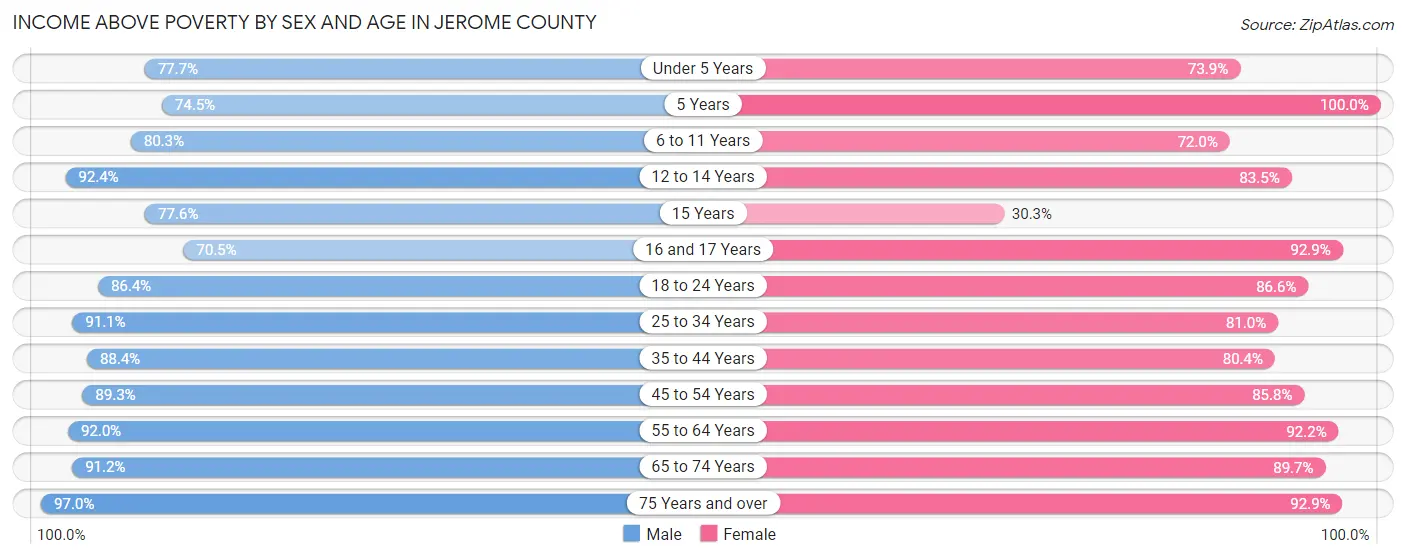
Income Above Poverty by Sex and Age in Jerome County
According to the poverty statistics in Jerome County, males aged 75 years and over and females aged 5 years are the age groups that are most secure financially, with 97.0% of males and 100.0% of females in these age groups living above the poverty line.
| Age Bracket | Male | Female |
| Under 5 Years | 766 (77.7%) | 598 (73.9%) |
| 5 Years | 152 (74.5%) | 111 (100.0%) |
| 6 to 11 Years | 912 (80.3%) | 931 (72.0%) |
| 12 to 14 Years | 658 (92.4%) | 550 (83.5%) |
| 15 Years | 191 (77.6%) | 56 (30.3%) |
| 16 and 17 Years | 299 (70.5%) | 408 (92.9%) |
| 18 to 24 Years | 964 (86.4%) | 864 (86.6%) |
| 25 to 34 Years | 1,489 (91.1%) | 1,237 (81.0%) |
| 35 to 44 Years | 1,481 (88.4%) | 1,179 (80.4%) |
| 45 to 54 Years | 1,230 (89.3%) | 1,018 (85.8%) |
| 55 to 64 Years | 1,337 (91.9%) | 1,404 (92.2%) |
| 65 to 74 Years | 876 (91.2%) | 856 (89.7%) |
| 75 Years and over | 508 (97.0%) | 577 (92.9%) |
| Total | 10,863 (87.3%) | 9,789 (83.2%) |
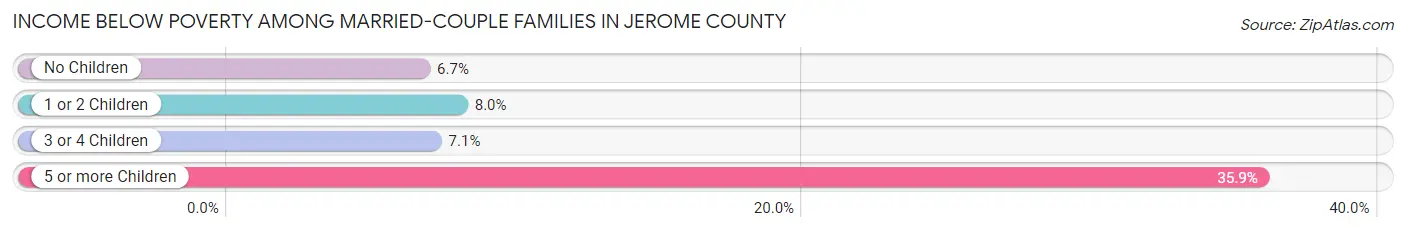
Income Below Poverty Among Married-Couple Families in Jerome County
The poverty statistics for married-couple families in Jerome County show that 7.9% or 365 of the total 4,642 families live below the poverty line. Families with 5 or more children have the highest poverty rate of 35.9%, comprising of 37 families. On the other hand, families with no children have the lowest poverty rate of 6.7%, which includes 148 families.
| Children | Above Poverty | Below Poverty |
| No Children | 2,064 (93.3%) | 148 (6.7%) |
| 1 or 2 Children | 1,518 (92.0%) | 132 (8.0%) |
| 3 or 4 Children | 629 (92.9%) | 48 (7.1%) |
| 5 or more Children | 66 (64.1%) | 37 (35.9%) |
| Total | 4,277 (92.1%) | 365 (7.9%) |
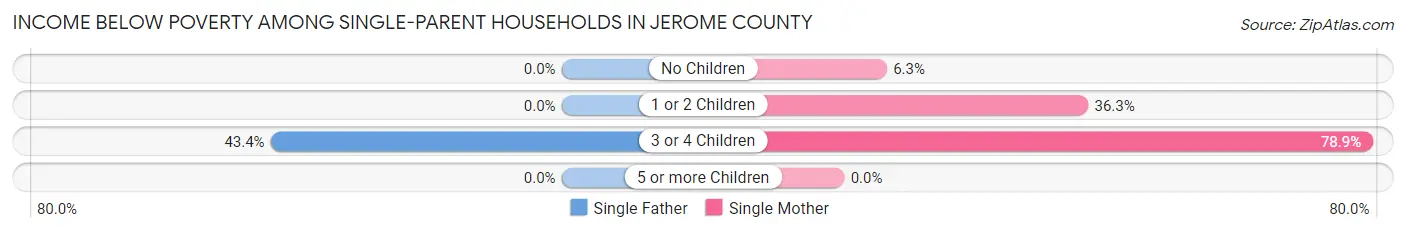
Income Below Poverty Among Single-Parent Households in Jerome County
According to the poverty data in Jerome County, 14.5% or 108 single-father households and 36.6% or 307 single-mother households are living below the poverty line. Among single-father households, those with 3 or 4 children have the highest poverty rate, with 108 households (43.4%) experiencing poverty. Likewise, among single-mother households, those with 3 or 4 children have the highest poverty rate, with 153 households (78.9%) falling below the poverty line.
| Children | Single Father | Single Mother |
| No Children | 0 (0.0%) | 17 (6.3%) |
| 1 or 2 Children | 0 (0.0%) | 137 (36.3%) |
| 3 or 4 Children | 108 (43.4%) | 153 (78.9%) |
| 5 or more Children | 0 (0.0%) | 0 (0.0%) |
| Total | 108 (14.5%) | 307 (36.6%) |
Income Below Poverty Among Married-Couple vs Single-Parent Households in Jerome County
The poverty data for Jerome County shows that 365 of the married-couple family households (7.9%) and 415 of the single-parent households (26.2%) are living below the poverty level. Within the married-couple family households, those with 5 or more children have the highest poverty rate, with 37 households (35.9%) falling below the poverty line. Among the single-parent households, those with 3 or 4 children have the highest poverty rate, with 261 household (58.9%) living below poverty.
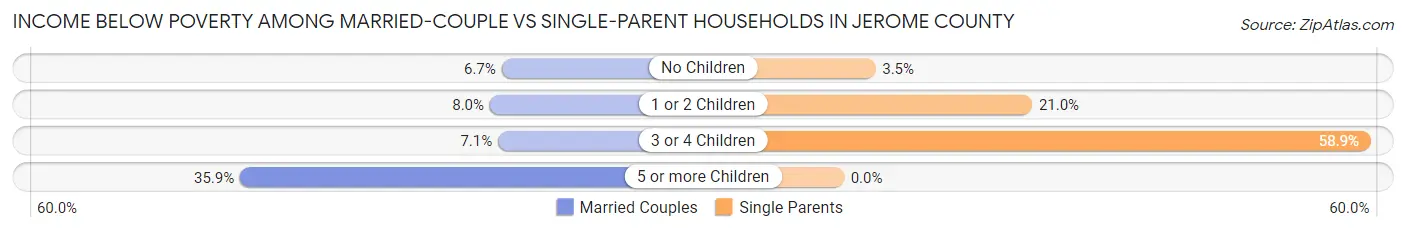
| Children | Married-Couple Families | Single-Parent Households |
| No Children | 148 (6.7%) | 17 (3.5%) |
| 1 or 2 Children | 132 (8.0%) | 137 (21.0%) |
| 3 or 4 Children | 48 (7.1%) | 261 (58.9%) |
| 5 or more Children | 37 (35.9%) | 0 (0.0%) |
| Total | 365 (7.9%) | 415 (26.2%) |
Employment Characteristics in Jerome County
Employment by Class of Employer in Jerome County
Among the 11,337 employed individuals in Jerome County, private company employees (7,880 | 69.5%), local government employees (830 | 7.3%), and self-employed (not incorporated) (787 | 6.9%) make up the most common classes of employment.
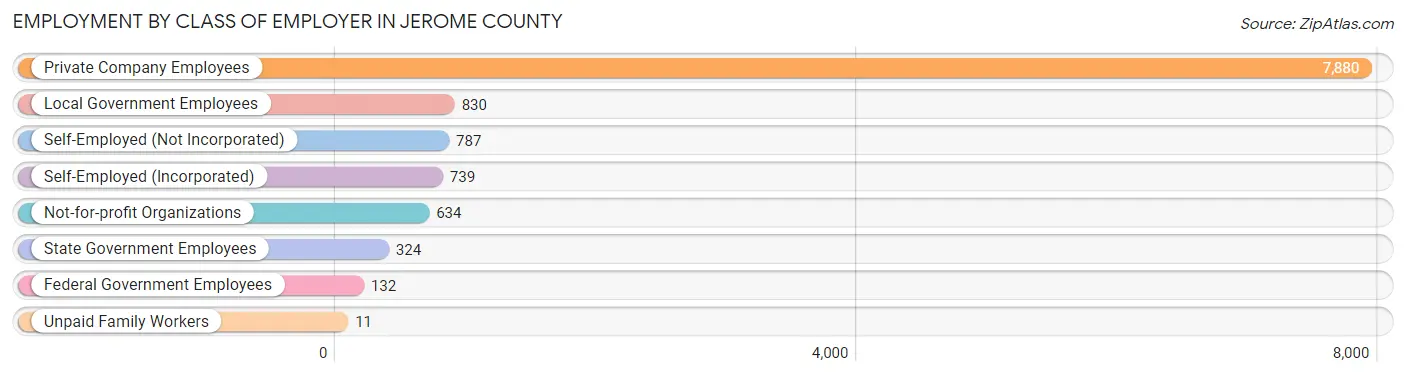
| Employer Class | # Employees | % Employees |
| Private Company Employees | 7,880 | 69.5% |
| Self-Employed (Incorporated) | 739 | 6.5% |
| Self-Employed (Not Incorporated) | 787 | 6.9% |
| Not-for-profit Organizations | 634 | 5.6% |
| Local Government Employees | 830 | 7.3% |
| State Government Employees | 324 | 2.9% |
| Federal Government Employees | 132 | 1.2% |
| Unpaid Family Workers | 11 | 0.1% |
| Total | 11,337 | 100.0% |
Employment Status by Age in Jerome County
According to the labor force statistics for Jerome County, out of the total population over 16 years of age (18,005), 66.1% or 11,901 individuals are in the labor force, with 3.5% or 417 of them unemployed. The age group with the highest labor force participation rate is 20 to 24 years, with 82.2% or 1,259 individuals in the labor force. Within the labor force, the 16 to 19 years age range has the highest percentage of unemployed individuals, with 10.9% or 81 of them being unemployed.
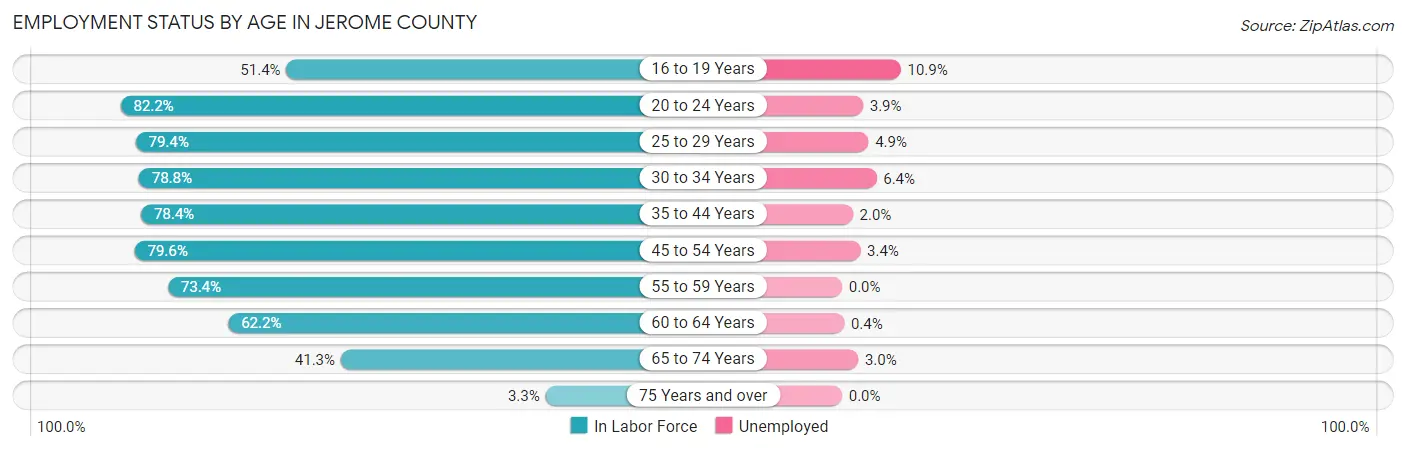
| Age Bracket | In Labor Force | Unemployed |
| 16 to 19 Years | 747 (51.4%) | 81 (10.9%) |
| 20 to 24 Years | 1,259 (82.2%) | 49 (3.9%) |
| 25 to 29 Years | 1,239 (79.4%) | 61 (4.9%) |
| 30 to 34 Years | 1,296 (78.8%) | 83 (6.4%) |
| 35 to 44 Years | 2,469 (78.4%) | 49 (2.0%) |
| 45 to 54 Years | 2,049 (79.6%) | 70 (3.4%) |
| 55 to 59 Years | 1,050 (73.4%) | 0 (0.0%) |
| 60 to 64 Years | 962 (62.2%) | 4 (0.4%) |
| 65 to 74 Years | 791 (41.3%) | 24 (3.0%) |
| 75 Years and over | 40 (3.3%) | 0 (0.0%) |
| Total | 11,901 (66.1%) | 417 (3.5%) |
Employment Status by Educational Attainment in Jerome County
According to labor force statistics for Jerome County, 76.1% of individuals (9,060) out of the total population between 25 and 64 years of age (11,905) are in the labor force, with 2.9% or 263 of them being unemployed. The group with the highest labor force participation rate are those with the educational attainment of bachelor's degree or higher, with 84.6% or 1,266 individuals in the labor force. Within the labor force, individuals with high school diploma education have the highest percentage of unemployment, with 6.5% or 167 of them being unemployed.
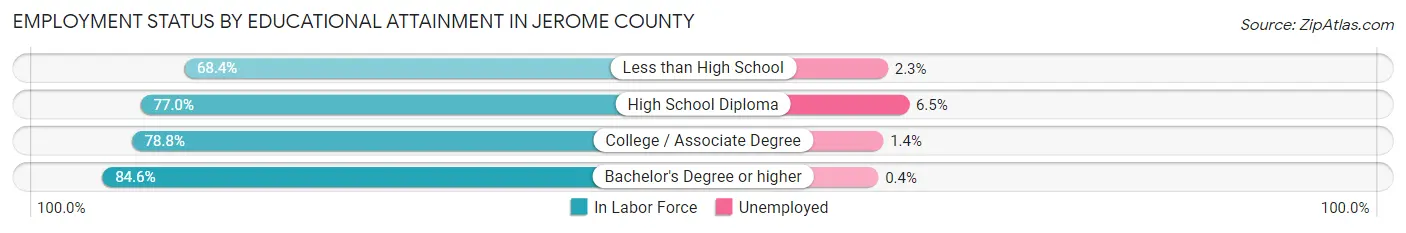
| Educational Attainment | In Labor Force | Unemployed |
| Less than High School | 2,256 (68.4%) | 76 (2.3%) |
| High School Diploma | 2,564 (77.0%) | 216 (6.5%) |
| College / Associate Degree | 2,979 (78.8%) | 53 (1.4%) |
| Bachelor's Degree or higher | 1,266 (84.6%) | 6 (0.4%) |
| Total | 9,060 (76.1%) | 345 (2.9%) |
Employment Occupations by Sex in Jerome County
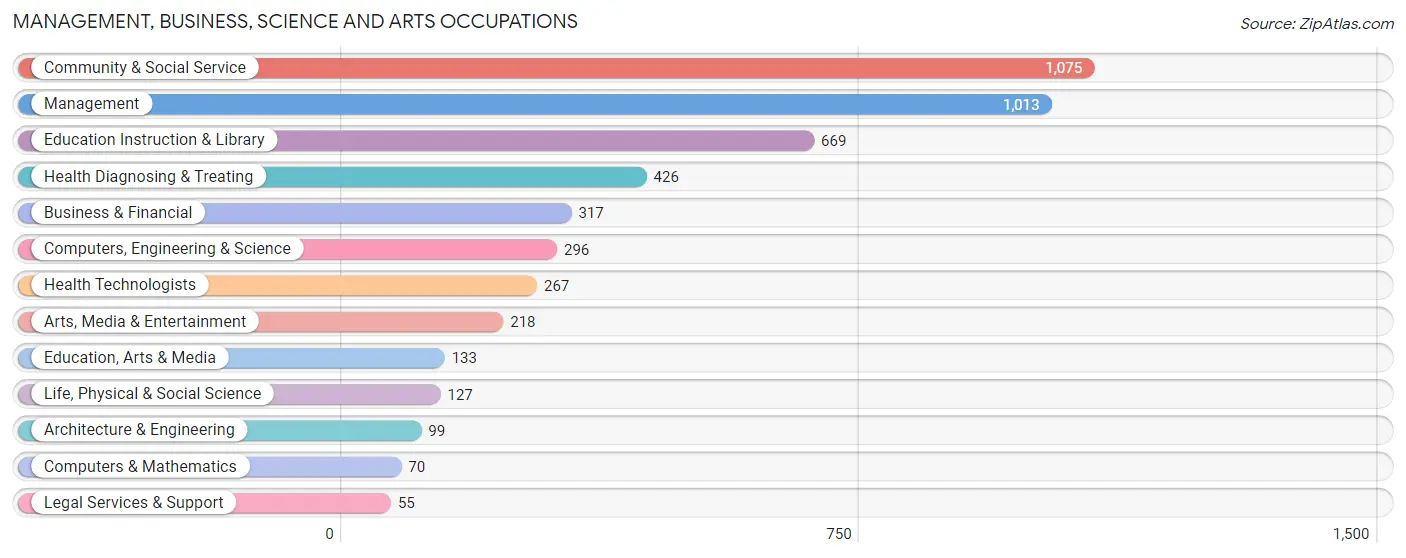
Management, Business, Science and Arts Occupations
The most common Management, Business, Science and Arts occupations in Jerome County are Community & Social Service (1,075 | 9.4%), Management (1,013 | 8.8%), Education Instruction & Library (669 | 5.8%), Health Diagnosing & Treating (426 | 3.7%), and Business & Financial (317 | 2.8%).
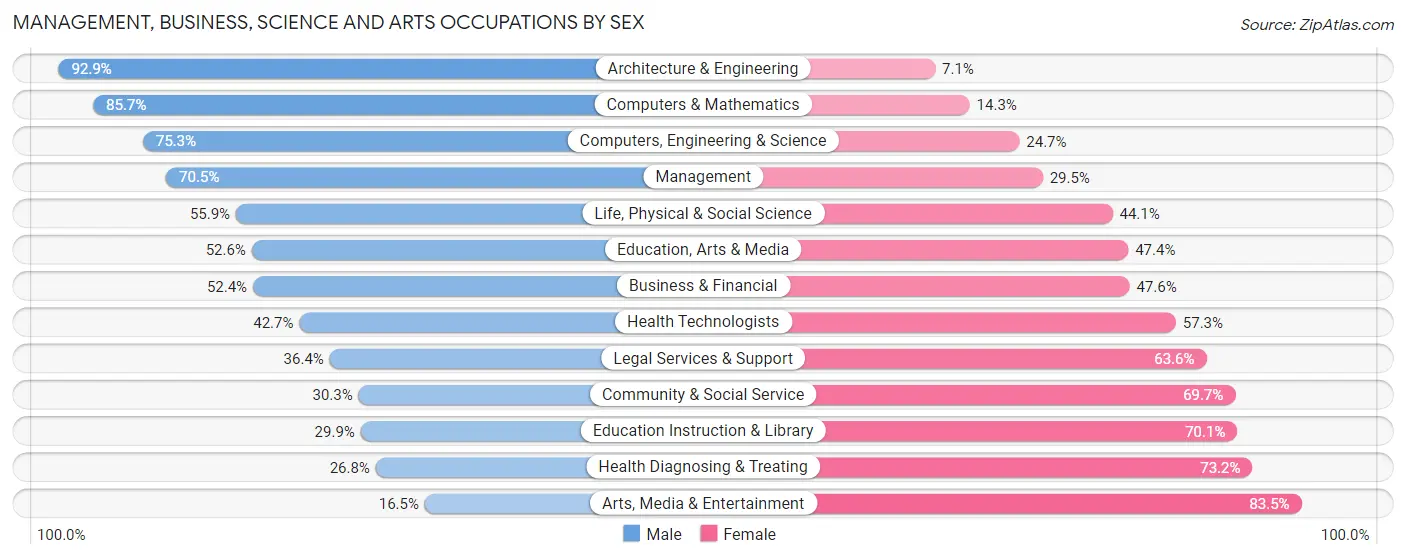
Management, Business, Science and Arts Occupations by Sex
Within the Management, Business, Science and Arts occupations in Jerome County, the most male-oriented occupations are Architecture & Engineering (92.9%), Computers & Mathematics (85.7%), and Computers, Engineering & Science (75.3%), while the most female-oriented occupations are Arts, Media & Entertainment (83.5%), Health Diagnosing & Treating (73.2%), and Education Instruction & Library (70.1%).
| Occupation | Male | Female |
| Management | 714 (70.5%) | 299 (29.5%) |
| Business & Financial | 166 (52.4%) | 151 (47.6%) |
| Computers, Engineering & Science | 223 (75.3%) | 73 (24.7%) |
| Computers & Mathematics | 60 (85.7%) | 10 (14.3%) |
| Architecture & Engineering | 92 (92.9%) | 7 (7.1%) |
| Life, Physical & Social Science | 71 (55.9%) | 56 (44.1%) |
| Community & Social Service | 326 (30.3%) | 749 (69.7%) |
| Education, Arts & Media | 70 (52.6%) | 63 (47.4%) |
| Legal Services & Support | 20 (36.4%) | 35 (63.6%) |
| Education Instruction & Library | 200 (29.9%) | 469 (70.1%) |
| Arts, Media & Entertainment | 36 (16.5%) | 182 (83.5%) |
| Health Diagnosing & Treating | 114 (26.8%) | 312 (73.2%) |
| Health Technologists | 114 (42.7%) | 153 (57.3%) |
| Total (Category) | 1,543 (49.3%) | 1,584 (50.7%) |
| Total (Overall) | 6,774 (59.2%) | 4,679 (40.8%) |
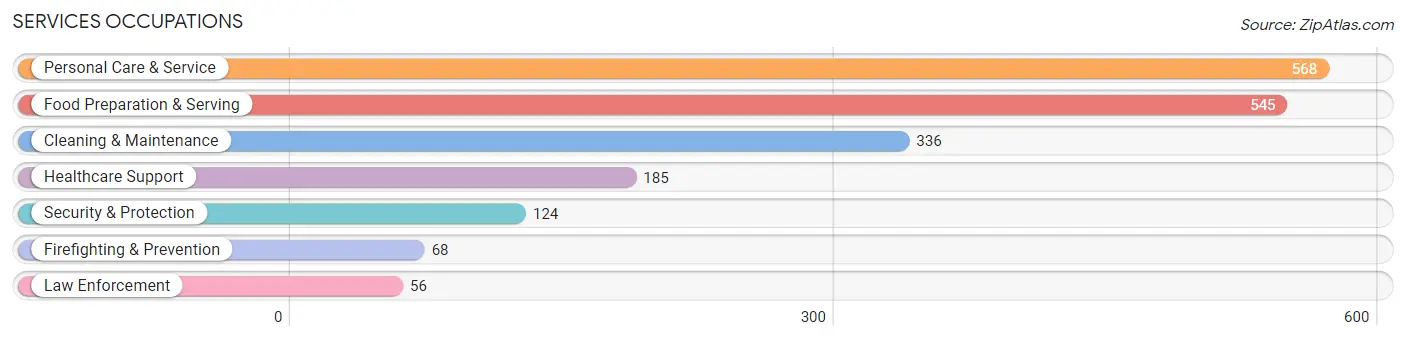
Services Occupations
The most common Services occupations in Jerome County are Personal Care & Service (568 | 5.0%), Food Preparation & Serving (545 | 4.8%), Cleaning & Maintenance (336 | 2.9%), Healthcare Support (185 | 1.6%), and Security & Protection (124 | 1.1%).
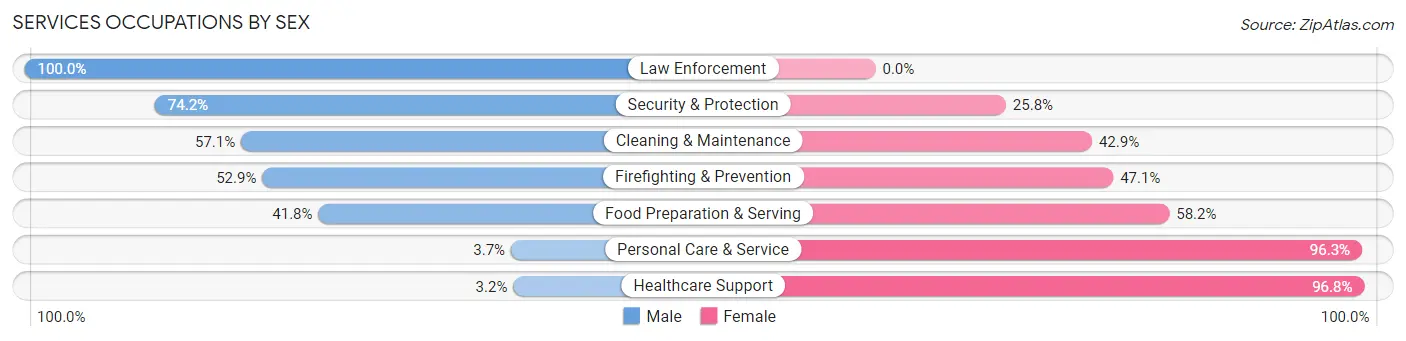
Services Occupations by Sex
Within the Services occupations in Jerome County, the most male-oriented occupations are Law Enforcement (100.0%), Security & Protection (74.2%), and Cleaning & Maintenance (57.1%), while the most female-oriented occupations are Healthcare Support (96.8%), Personal Care & Service (96.3%), and Food Preparation & Serving (58.2%).
| Occupation | Male | Female |
| Healthcare Support | 6 (3.2%) | 179 (96.8%) |
| Security & Protection | 92 (74.2%) | 32 (25.8%) |
| Firefighting & Prevention | 36 (52.9%) | 32 (47.1%) |
| Law Enforcement | 56 (100.0%) | 0 (0.0%) |
| Food Preparation & Serving | 228 (41.8%) | 317 (58.2%) |
| Cleaning & Maintenance | 192 (57.1%) | 144 (42.9%) |
| Personal Care & Service | 21 (3.7%) | 547 (96.3%) |
| Total (Category) | 539 (30.7%) | 1,219 (69.3%) |
| Total (Overall) | 6,774 (59.2%) | 4,679 (40.8%) |
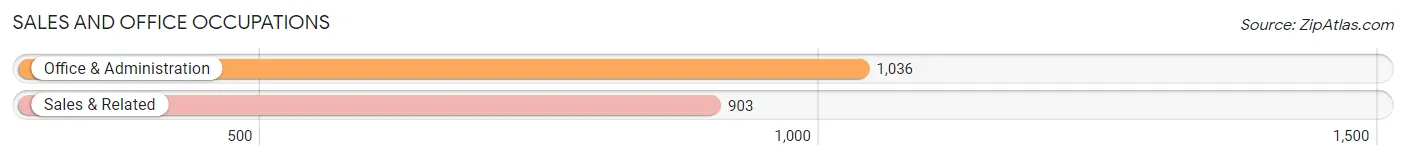
Sales and Office Occupations
The most common Sales and Office occupations in Jerome County are Office & Administration (1,036 | 9.0%), and Sales & Related (903 | 7.9%).
Sales and Office Occupations by Sex
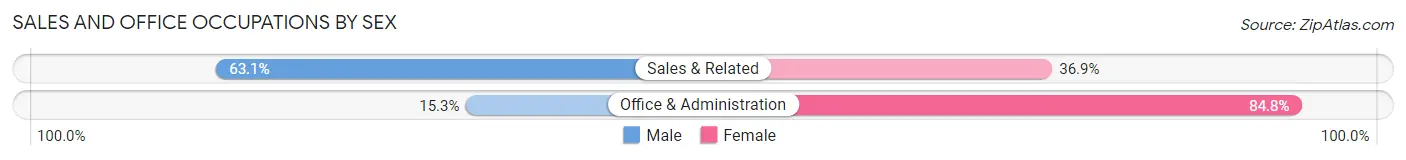
| Occupation | Male | Female |
| Sales & Related | 570 (63.1%) | 333 (36.9%) |
| Office & Administration | 158 (15.2%) | 878 (84.8%) |
| Total (Category) | 728 (37.6%) | 1,211 (62.5%) |
| Total (Overall) | 6,774 (59.2%) | 4,679 (40.8%) |
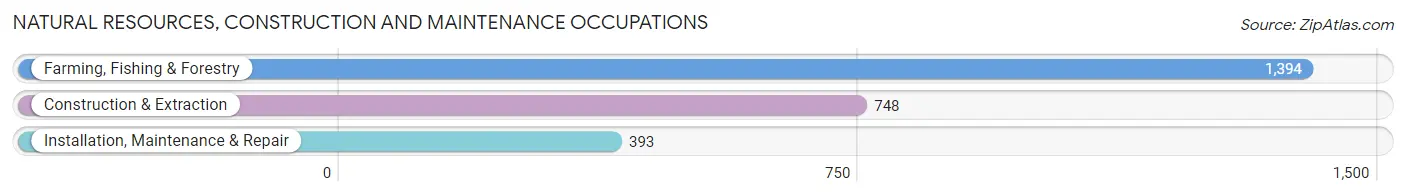
Natural Resources, Construction and Maintenance Occupations
The most common Natural Resources, Construction and Maintenance occupations in Jerome County are Farming, Fishing & Forestry (1,394 | 12.2%), Construction & Extraction (748 | 6.5%), and Installation, Maintenance & Repair (393 | 3.4%).
Natural Resources, Construction and Maintenance Occupations by Sex
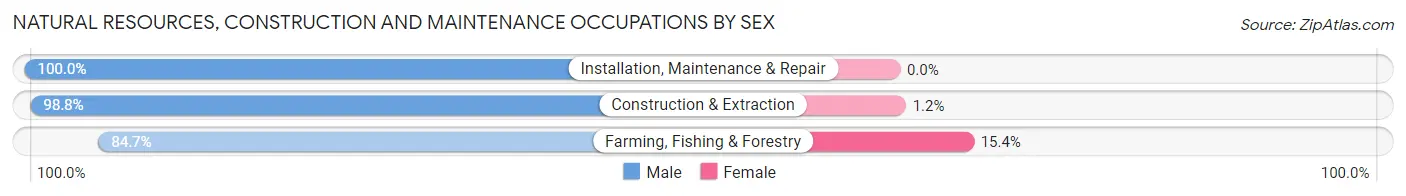
| Occupation | Male | Female |
| Farming, Fishing & Forestry | 1,180 (84.7%) | 214 (15.3%) |
| Construction & Extraction | 739 (98.8%) | 9 (1.2%) |
| Installation, Maintenance & Repair | 393 (100.0%) | 0 (0.0%) |
| Total (Category) | 2,312 (91.2%) | 223 (8.8%) |
| Total (Overall) | 6,774 (59.2%) | 4,679 (40.8%) |
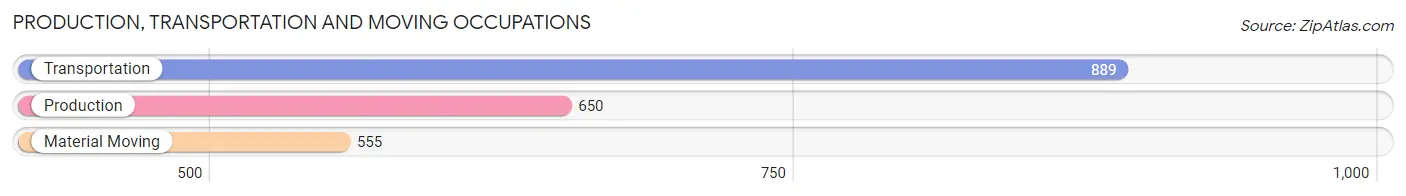
Production, Transportation and Moving Occupations
The most common Production, Transportation and Moving occupations in Jerome County are Transportation (889 | 7.8%), Production (650 | 5.7%), and Material Moving (555 | 4.9%).
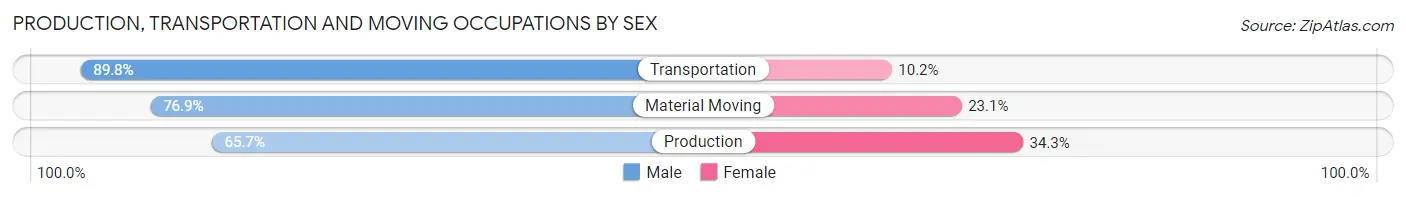
Production, Transportation and Moving Occupations by Sex
| Occupation | Male | Female |
| Production | 427 (65.7%) | 223 (34.3%) |
| Transportation | 798 (89.8%) | 91 (10.2%) |
| Material Moving | 427 (76.9%) | 128 (23.1%) |
| Total (Category) | 1,652 (78.9%) | 442 (21.1%) |
| Total (Overall) | 6,774 (59.2%) | 4,679 (40.8%) |
Employment Industries by Sex in Jerome County
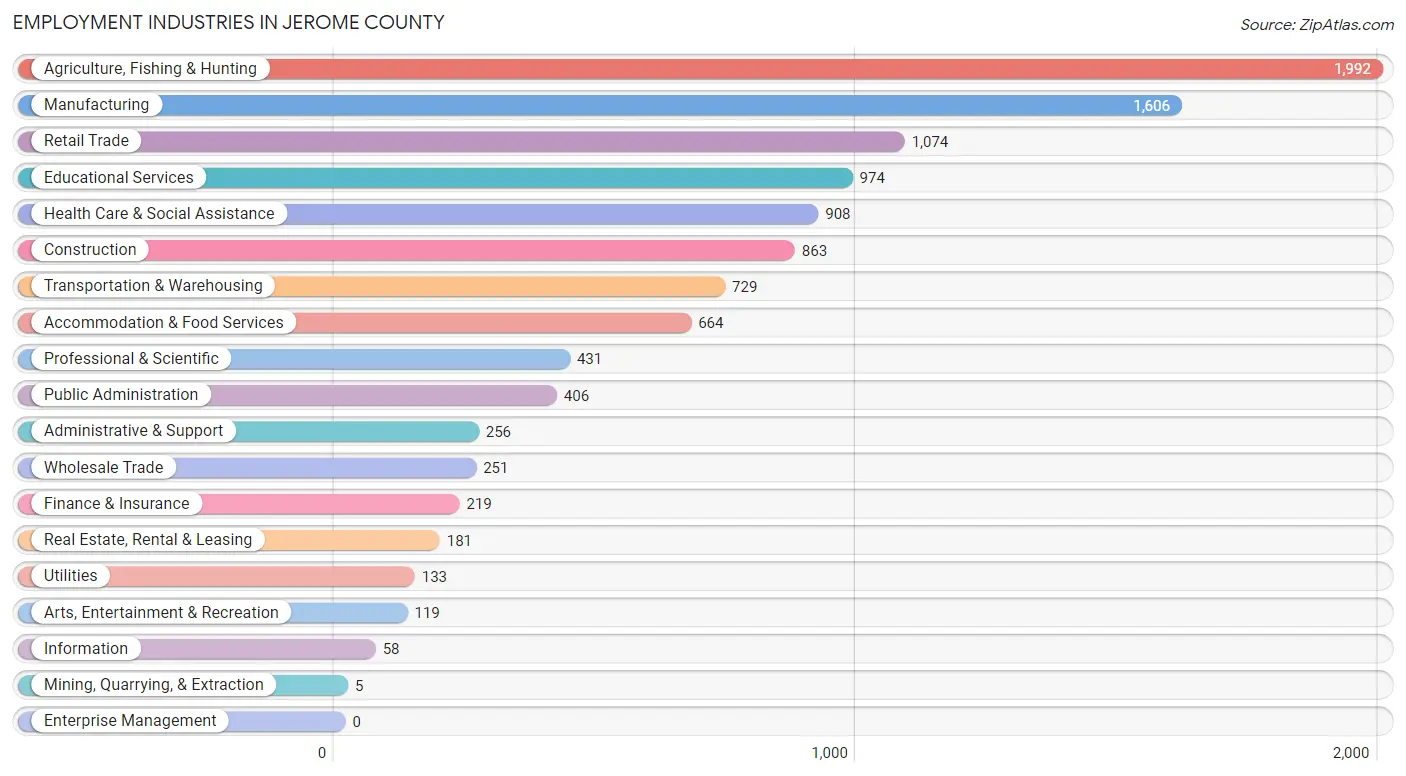
Employment Industries in Jerome County
The major employment industries in Jerome County include Agriculture, Fishing & Hunting (1,992 | 17.4%), Manufacturing (1,606 | 14.0%), Retail Trade (1,074 | 9.4%), Educational Services (974 | 8.5%), and Health Care & Social Assistance (908 | 7.9%).
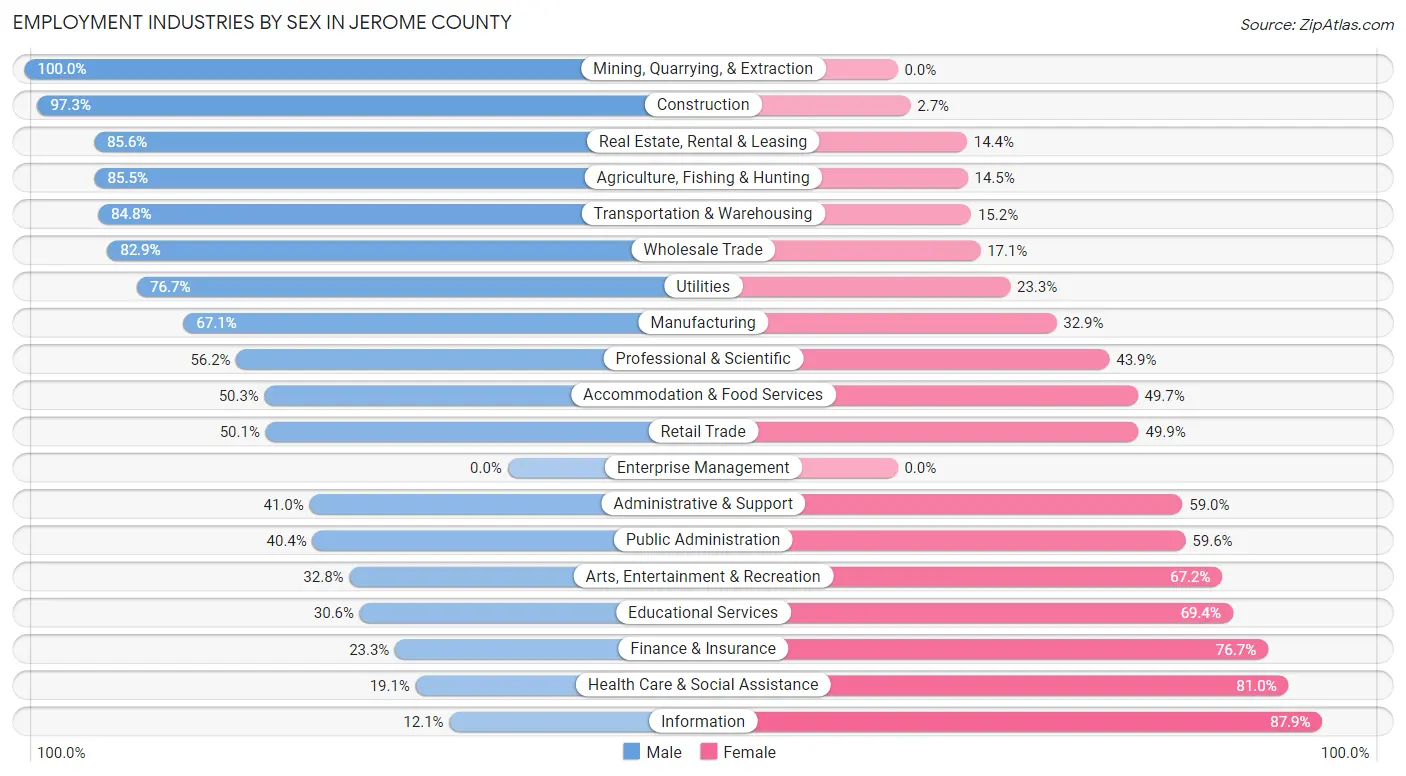
Employment Industries by Sex in Jerome County
The Jerome County industries that see more men than women are Mining, Quarrying, & Extraction (100.0%), Construction (97.3%), and Real Estate, Rental & Leasing (85.6%), whereas the industries that tend to have a higher number of women are Information (87.9%), Health Care & Social Assistance (80.9%), and Finance & Insurance (76.7%).
| Industry | Male | Female |
| Agriculture, Fishing & Hunting | 1,703 (85.5%) | 289 (14.5%) |
| Mining, Quarrying, & Extraction | 5 (100.0%) | 0 (0.0%) |
| Construction | 840 (97.3%) | 23 (2.7%) |
| Manufacturing | 1,078 (67.1%) | 528 (32.9%) |
| Wholesale Trade | 208 (82.9%) | 43 (17.1%) |
| Retail Trade | 538 (50.1%) | 536 (49.9%) |
| Transportation & Warehousing | 618 (84.8%) | 111 (15.2%) |
| Utilities | 102 (76.7%) | 31 (23.3%) |
| Information | 7 (12.1%) | 51 (87.9%) |
| Finance & Insurance | 51 (23.3%) | 168 (76.7%) |
| Real Estate, Rental & Leasing | 155 (85.6%) | 26 (14.4%) |
| Professional & Scientific | 242 (56.1%) | 189 (43.9%) |
| Enterprise Management | 0 (0.0%) | 0 (0.0%) |
| Administrative & Support | 105 (41.0%) | 151 (59.0%) |
| Educational Services | 298 (30.6%) | 676 (69.4%) |
| Health Care & Social Assistance | 173 (19.1%) | 735 (80.9%) |
| Arts, Entertainment & Recreation | 39 (32.8%) | 80 (67.2%) |
| Accommodation & Food Services | 334 (50.3%) | 330 (49.7%) |
| Public Administration | 164 (40.4%) | 242 (59.6%) |
| Total | 6,774 (59.2%) | 4,679 (40.8%) |
Education in Jerome County
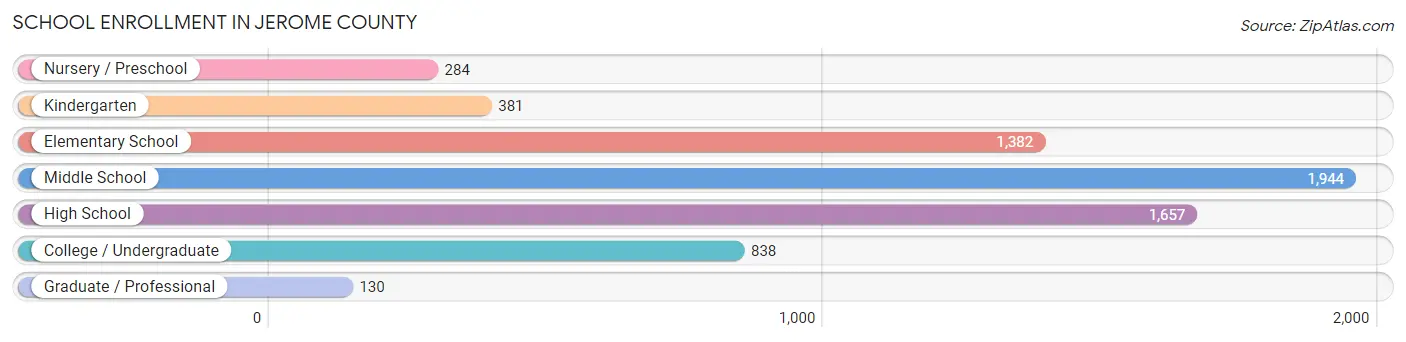
School Enrollment in Jerome County
The most common levels of schooling among the 6,616 students in Jerome County are middle school (1,944 | 29.4%), high school (1,657 | 25.1%), and elementary school (1,382 | 20.9%).
| School Level | # Students | % Students |
| Nursery / Preschool | 284 | 4.3% |
| Kindergarten | 381 | 5.8% |
| Elementary School | 1,382 | 20.9% |
| Middle School | 1,944 | 29.4% |
| High School | 1,657 | 25.1% |
| College / Undergraduate | 838 | 12.7% |
| Graduate / Professional | 130 | 2.0% |
| Total | 6,616 | 100.0% |
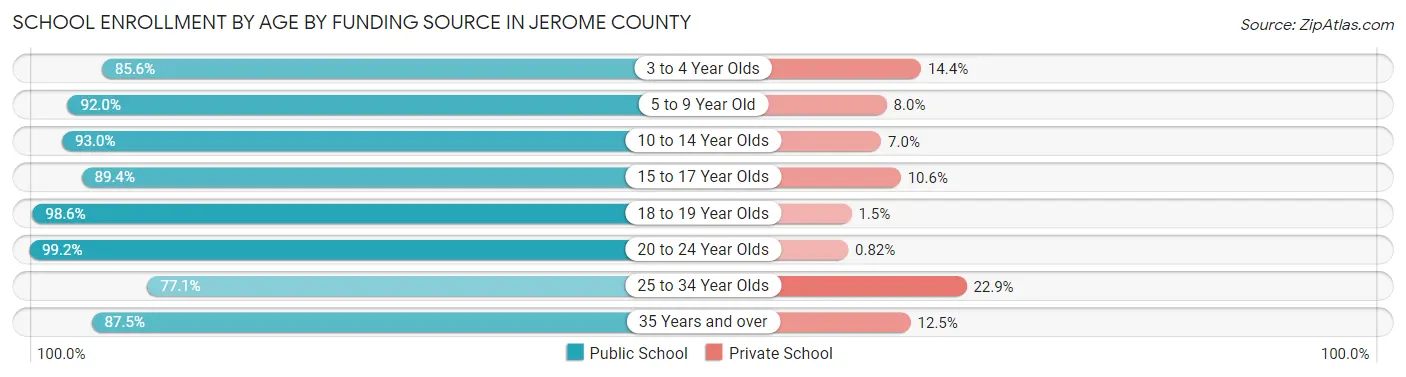
School Enrollment by Age by Funding Source in Jerome County
Out of a total of 6,616 students who are enrolled in schools in Jerome County, 549 (8.3%) attend a private institution, while the remaining 6,067 (91.7%) are enrolled in public schools. The age group of 25 to 34 year olds has the highest likelihood of being enrolled in private schools, with 43 (22.9% in the age bracket) enrolled. Conversely, the age group of 20 to 24 year olds has the lowest likelihood of being enrolled in a private school, with 364 (99.2% in the age bracket) attending a public institution.
| Age Bracket | Public School | Private School |
| 3 to 4 Year Olds | 208 (85.6%) | 35 (14.4%) |
| 5 to 9 Year Old | 1,505 (92.0%) | 131 (8.0%) |
| 10 to 14 Year Olds | 2,158 (93.0%) | 162 (7.0%) |
| 15 to 17 Year Olds | 1,026 (89.4%) | 122 (10.6%) |
| 18 to 19 Year Olds | 340 (98.6%) | 5 (1.5%) |
| 20 to 24 Year Olds | 364 (99.2%) | 3 (0.8%) |
| 25 to 34 Year Olds | 145 (77.1%) | 43 (22.9%) |
| 35 Years and over | 323 (87.5%) | 46 (12.5%) |
| Total | 6,067 (91.7%) | 549 (8.3%) |
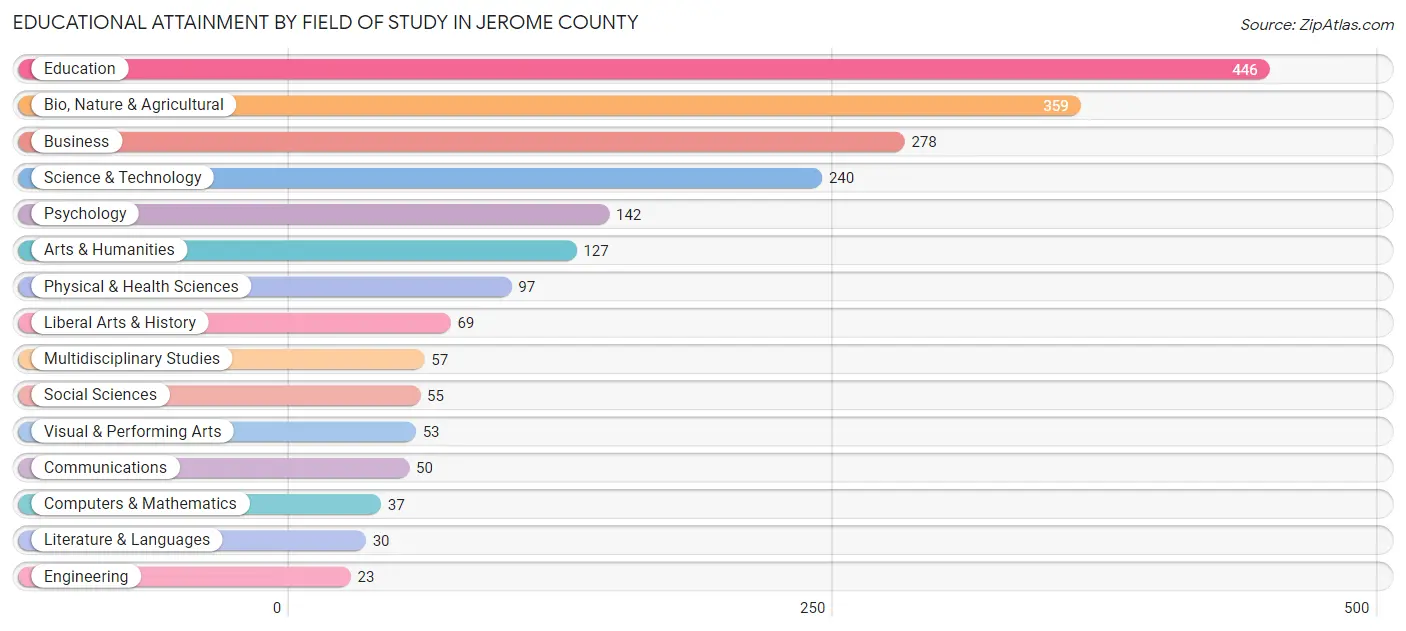
Educational Attainment by Field of Study in Jerome County
Education (446 | 21.6%), bio, nature & agricultural (359 | 17.4%), business (278 | 13.5%), science & technology (240 | 11.6%), and psychology (142 | 6.9%) are the most common fields of study among 2,063 individuals in Jerome County who have obtained a bachelor's degree or higher.
| Field of Study | # Graduates | % Graduates |
| Computers & Mathematics | 37 | 1.8% |
| Bio, Nature & Agricultural | 359 | 17.4% |
| Physical & Health Sciences | 97 | 4.7% |
| Psychology | 142 | 6.9% |
| Social Sciences | 55 | 2.7% |
| Engineering | 23 | 1.1% |
| Multidisciplinary Studies | 57 | 2.8% |
| Science & Technology | 240 | 11.6% |
| Business | 278 | 13.5% |
| Education | 446 | 21.6% |
| Literature & Languages | 30 | 1.5% |
| Liberal Arts & History | 69 | 3.3% |
| Visual & Performing Arts | 53 | 2.6% |
| Communications | 50 | 2.4% |
| Arts & Humanities | 127 | 6.2% |
| Total | 2,063 | 100.0% |
Transportation & Commute in Jerome County
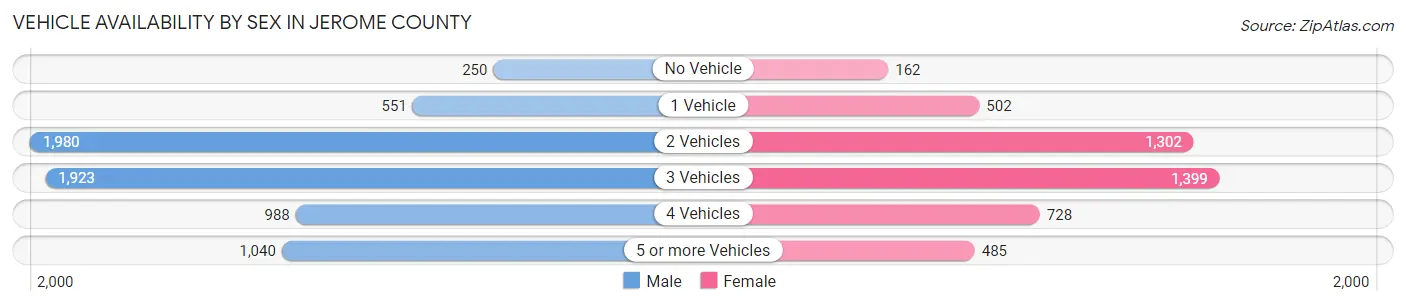
Vehicle Availability by Sex in Jerome County
The most prevalent vehicle ownership categories in Jerome County are males with 2 vehicles (1,980, accounting for 29.4%) and females with 2 vehicles (1,302, making up 43.2%).
| Vehicles Available | Male | Female |
| No Vehicle | 250 (3.7%) | 162 (3.5%) |
| 1 Vehicle | 551 (8.2%) | 502 (11.0%) |
| 2 Vehicles | 1,980 (29.4%) | 1,302 (28.4%) |
| 3 Vehicles | 1,923 (28.6%) | 1,399 (30.6%) |
| 4 Vehicles | 988 (14.7%) | 728 (15.9%) |
| 5 or more Vehicles | 1,040 (15.4%) | 485 (10.6%) |
| Total | 6,732 (100.0%) | 4,578 (100.0%) |
Commute Time in Jerome County
The most frequently occuring commute durations in Jerome County are 5 to 9 minutes (2,411 commuters, 22.3%), 10 to 14 minutes (1,795 commuters, 16.6%), and 15 to 19 minutes (1,592 commuters, 14.7%).
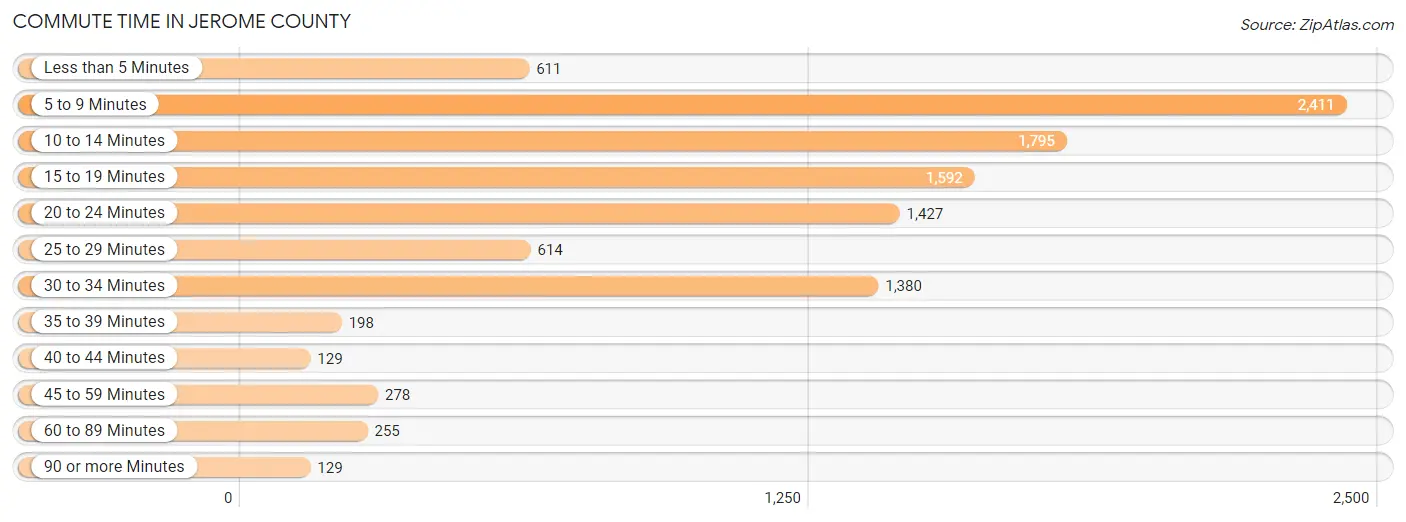
| Commute Time | # Commuters | % Commuters |
| Less than 5 Minutes | 611 | 5.7% |
| 5 to 9 Minutes | 2,411 | 22.3% |
| 10 to 14 Minutes | 1,795 | 16.6% |
| 15 to 19 Minutes | 1,592 | 14.7% |
| 20 to 24 Minutes | 1,427 | 13.2% |
| 25 to 29 Minutes | 614 | 5.7% |
| 30 to 34 Minutes | 1,380 | 12.8% |
| 35 to 39 Minutes | 198 | 1.8% |
| 40 to 44 Minutes | 129 | 1.2% |
| 45 to 59 Minutes | 278 | 2.6% |
| 60 to 89 Minutes | 255 | 2.4% |
| 90 or more Minutes | 129 | 1.2% |
Commute Time by Sex in Jerome County
The most common commute times in Jerome County are 5 to 9 minutes (1,450 commuters, 22.4%) for males and 5 to 9 minutes (961 commuters, 22.2%) for females.
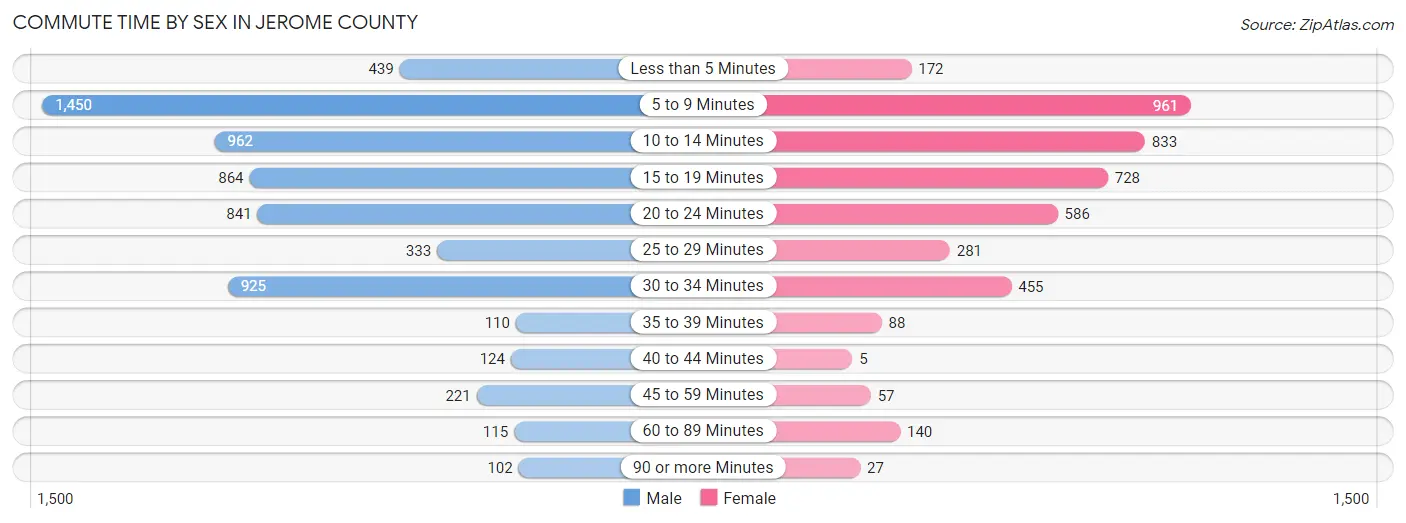
| Commute Time | Male | Female |
| Less than 5 Minutes | 439 (6.8%) | 172 (4.0%) |
| 5 to 9 Minutes | 1,450 (22.4%) | 961 (22.2%) |
| 10 to 14 Minutes | 962 (14.8%) | 833 (19.2%) |
| 15 to 19 Minutes | 864 (13.3%) | 728 (16.8%) |
| 20 to 24 Minutes | 841 (13.0%) | 586 (13.5%) |
| 25 to 29 Minutes | 333 (5.1%) | 281 (6.5%) |
| 30 to 34 Minutes | 925 (14.3%) | 455 (10.5%) |
| 35 to 39 Minutes | 110 (1.7%) | 88 (2.0%) |
| 40 to 44 Minutes | 124 (1.9%) | 5 (0.1%) |
| 45 to 59 Minutes | 221 (3.4%) | 57 (1.3%) |
| 60 to 89 Minutes | 115 (1.8%) | 140 (3.2%) |
| 90 or more Minutes | 102 (1.6%) | 27 (0.6%) |
Time of Departure to Work by Sex in Jerome County
The most frequent times of departure to work in Jerome County are 6:00 AM to 6:29 AM (1,105, 17.0%) for males and 9:00 AM to 9:59 AM (665, 15.3%) for females.
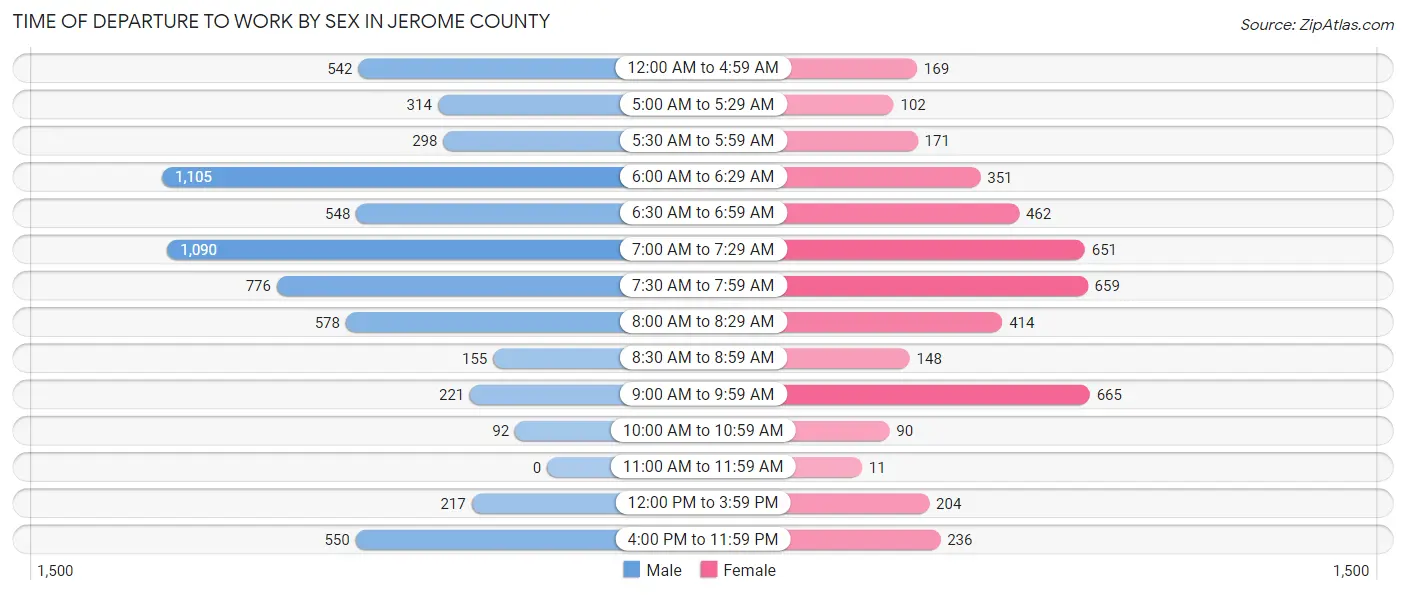
| Time of Departure | Male | Female |
| 12:00 AM to 4:59 AM | 542 (8.4%) | 169 (3.9%) |
| 5:00 AM to 5:29 AM | 314 (4.8%) | 102 (2.4%) |
| 5:30 AM to 5:59 AM | 298 (4.6%) | 171 (4.0%) |
| 6:00 AM to 6:29 AM | 1,105 (17.0%) | 351 (8.1%) |
| 6:30 AM to 6:59 AM | 548 (8.5%) | 462 (10.7%) |
| 7:00 AM to 7:29 AM | 1,090 (16.8%) | 651 (15.0%) |
| 7:30 AM to 7:59 AM | 776 (12.0%) | 659 (15.2%) |
| 8:00 AM to 8:29 AM | 578 (8.9%) | 414 (9.6%) |
| 8:30 AM to 8:59 AM | 155 (2.4%) | 148 (3.4%) |
| 9:00 AM to 9:59 AM | 221 (3.4%) | 665 (15.3%) |
| 10:00 AM to 10:59 AM | 92 (1.4%) | 90 (2.1%) |
| 11:00 AM to 11:59 AM | 0 (0.0%) | 11 (0.3%) |
| 12:00 PM to 3:59 PM | 217 (3.4%) | 204 (4.7%) |
| 4:00 PM to 11:59 PM | 550 (8.5%) | 236 (5.4%) |
| Total | 6,486 (100.0%) | 4,333 (100.0%) |
Housing Occupancy in Jerome County
Occupancy by Ownership in Jerome County
Of the total 8,092 dwellings in Jerome County, owner-occupied units account for 5,910 (73.0%), while renter-occupied units make up 2,182 (27.0%).
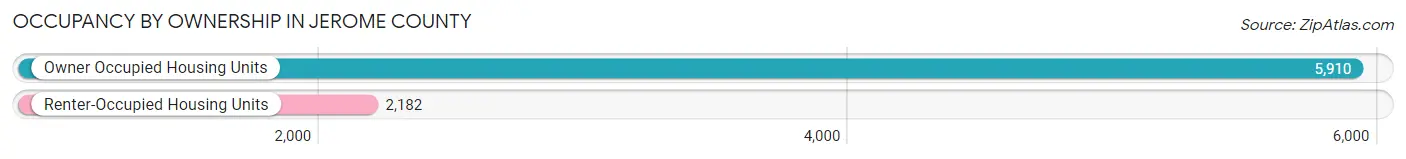
| Occupancy | # Housing Units | % Housing Units |
| Owner Occupied Housing Units | 5,910 | 73.0% |
| Renter-Occupied Housing Units | 2,182 | 27.0% |
| Total Occupied Housing Units | 8,092 | 100.0% |
Occupancy by Household Size in Jerome County
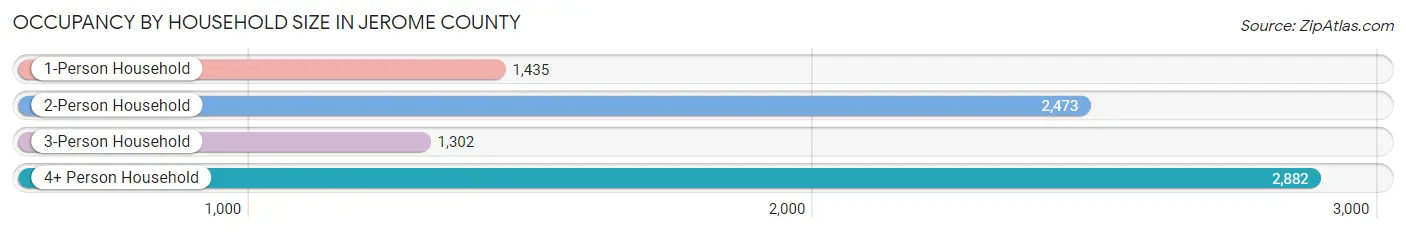
| Household Size | # Housing Units | % Housing Units |
| 1-Person Household | 1,435 | 17.7% |
| 2-Person Household | 2,473 | 30.6% |
| 3-Person Household | 1,302 | 16.1% |
| 4+ Person Household | 2,882 | 35.6% |
| Total Housing Units | 8,092 | 100.0% |
Occupancy by Ownership by Household Size in Jerome County
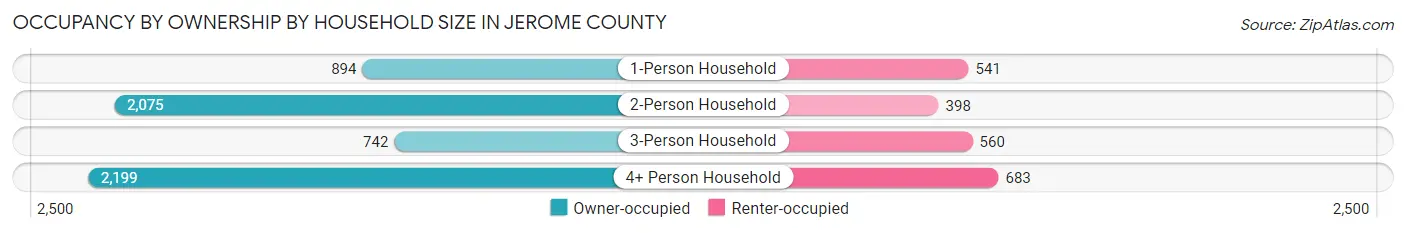
| Household Size | Owner-occupied | Renter-occupied |
| 1-Person Household | 894 (62.3%) | 541 (37.7%) |
| 2-Person Household | 2,075 (83.9%) | 398 (16.1%) |
| 3-Person Household | 742 (57.0%) | 560 (43.0%) |
| 4+ Person Household | 2,199 (76.3%) | 683 (23.7%) |
| Total Housing Units | 5,910 (73.0%) | 2,182 (27.0%) |
Occupancy by Educational Attainment in Jerome County
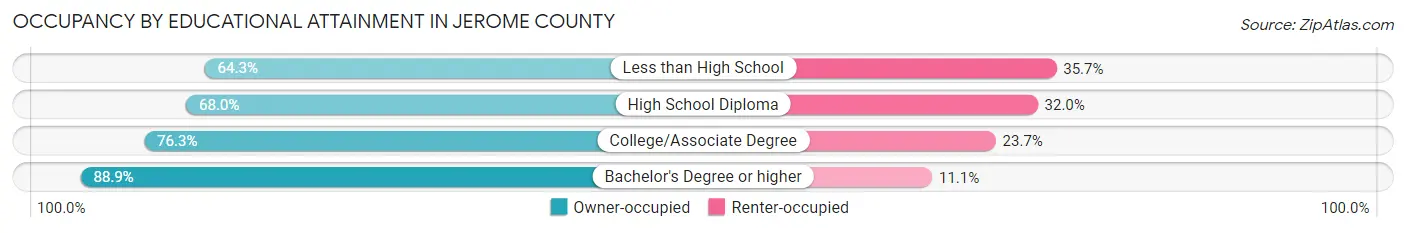
| Household Size | Owner-occupied | Renter-occupied |
| Less than High School | 1,233 (64.3%) | 685 (35.7%) |
| High School Diploma | 1,442 (68.0%) | 679 (32.0%) |
| College/Associate Degree | 2,232 (76.3%) | 693 (23.7%) |
| Bachelor's Degree or higher | 1,003 (88.9%) | 125 (11.1%) |
Occupancy by Age of Householder in Jerome County
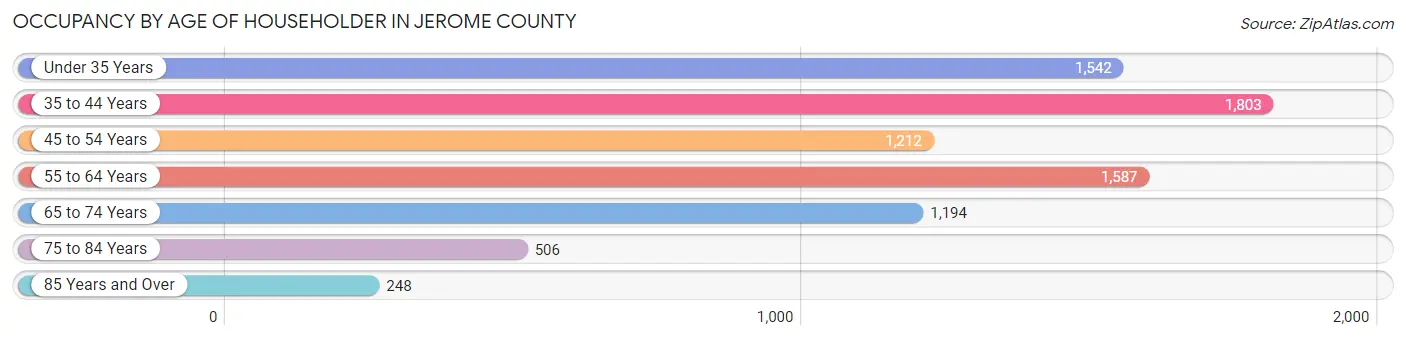
| Age Bracket | # Households | % Households |
| Under 35 Years | 1,542 | 19.1% |
| 35 to 44 Years | 1,803 | 22.3% |
| 45 to 54 Years | 1,212 | 15.0% |
| 55 to 64 Years | 1,587 | 19.6% |
| 65 to 74 Years | 1,194 | 14.8% |
| 75 to 84 Years | 506 | 6.2% |
| 85 Years and Over | 248 | 3.1% |
| Total | 8,092 | 100.0% |
Housing Finances in Jerome County
Median Income by Occupancy in Jerome County
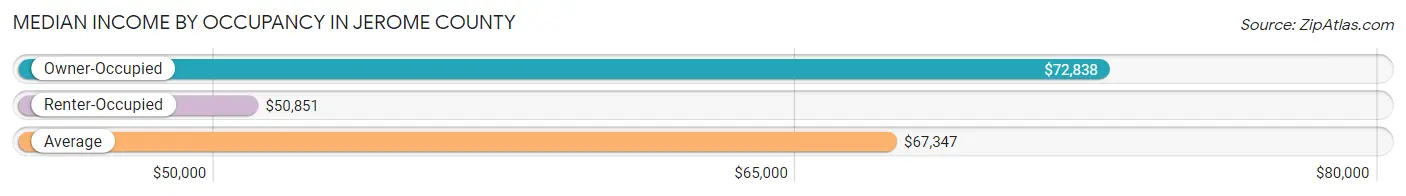
| Occupancy Type | # Households | Median Income |
| Owner-Occupied | 5,910 (73.0%) | $72,838 |
| Renter-Occupied | 2,182 (27.0%) | $50,851 |
| Average | 8,092 (100.0%) | $67,347 |
Occupancy by Householder Income Bracket in Jerome County
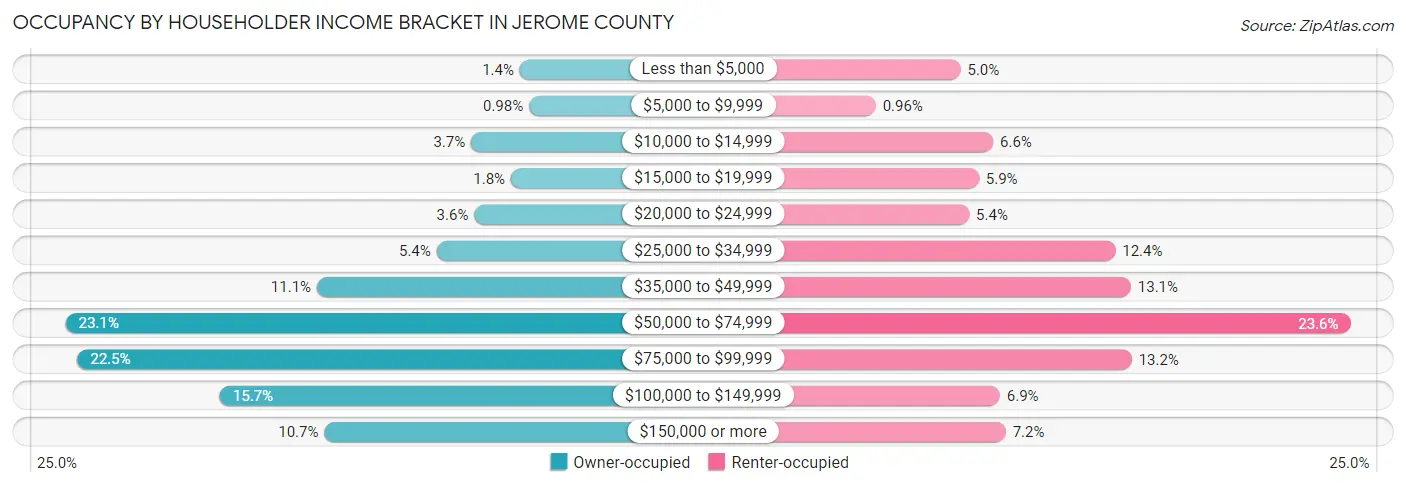
| Income Bracket | Owner-occupied | Renter-occupied |
| Less than $5,000 | 84 (1.4%) | 109 (5.0%) |
| $5,000 to $9,999 | 58 (1.0%) | 21 (1.0%) |
| $10,000 to $14,999 | 221 (3.7%) | 143 (6.6%) |
| $15,000 to $19,999 | 109 (1.8%) | 128 (5.9%) |
| $20,000 to $24,999 | 212 (3.6%) | 118 (5.4%) |
| $25,000 to $34,999 | 318 (5.4%) | 270 (12.4%) |
| $35,000 to $49,999 | 655 (11.1%) | 286 (13.1%) |
| $50,000 to $74,999 | 1,362 (23.1%) | 514 (23.6%) |
| $75,000 to $99,999 | 1,329 (22.5%) | 287 (13.2%) |
| $100,000 to $149,999 | 928 (15.7%) | 150 (6.9%) |
| $150,000 or more | 634 (10.7%) | 156 (7.1%) |
| Total | 5,910 (100.0%) | 2,182 (100.0%) |
Monthly Housing Cost Tiers in Jerome County
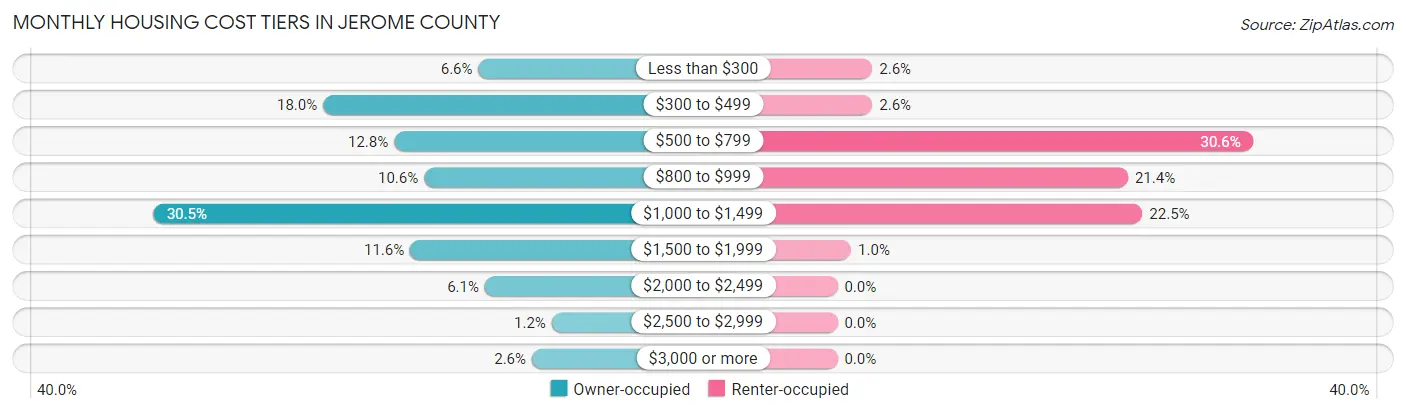
| Monthly Cost | Owner-occupied | Renter-occupied |
| Less than $300 | 389 (6.6%) | 56 (2.6%) |
| $300 to $499 | 1,065 (18.0%) | 56 (2.6%) |
| $500 to $799 | 756 (12.8%) | 667 (30.6%) |
| $800 to $999 | 625 (10.6%) | 467 (21.4%) |
| $1,000 to $1,499 | 1,802 (30.5%) | 490 (22.5%) |
| $1,500 to $1,999 | 686 (11.6%) | 22 (1.0%) |
| $2,000 to $2,499 | 361 (6.1%) | 0 (0.0%) |
| $2,500 to $2,999 | 70 (1.2%) | 0 (0.0%) |
| $3,000 or more | 156 (2.6%) | 0 (0.0%) |
| Total | 5,910 (100.0%) | 2,182 (100.0%) |
Physical Housing Characteristics in Jerome County
Housing Structures in Jerome County
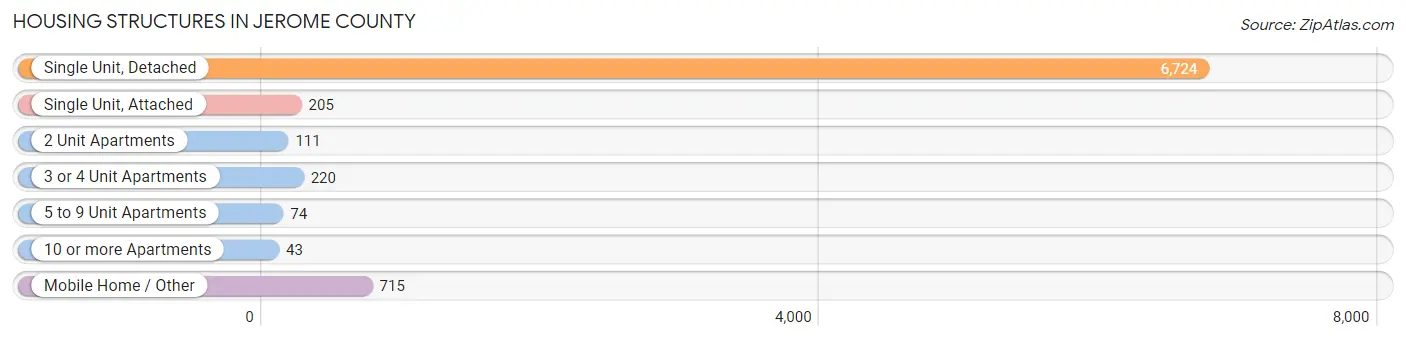
| Structure Type | # Housing Units | % Housing Units |
| Single Unit, Detached | 6,724 | 83.1% |
| Single Unit, Attached | 205 | 2.5% |
| 2 Unit Apartments | 111 | 1.4% |
| 3 or 4 Unit Apartments | 220 | 2.7% |
| 5 to 9 Unit Apartments | 74 | 0.9% |
| 10 or more Apartments | 43 | 0.5% |
| Mobile Home / Other | 715 | 8.8% |
| Total | 8,092 | 100.0% |
Housing Structures by Occupancy in Jerome County
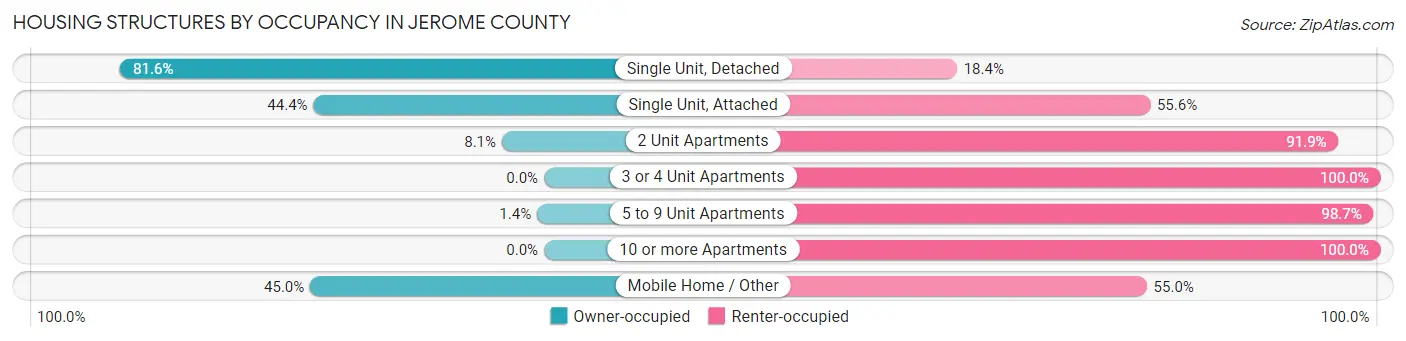
| Structure Type | Owner-occupied | Renter-occupied |
| Single Unit, Detached | 5,487 (81.6%) | 1,237 (18.4%) |
| Single Unit, Attached | 91 (44.4%) | 114 (55.6%) |
| 2 Unit Apartments | 9 (8.1%) | 102 (91.9%) |
| 3 or 4 Unit Apartments | 0 (0.0%) | 220 (100.0%) |
| 5 to 9 Unit Apartments | 1 (1.3%) | 73 (98.7%) |
| 10 or more Apartments | 0 (0.0%) | 43 (100.0%) |
| Mobile Home / Other | 322 (45.0%) | 393 (55.0%) |
| Total | 5,910 (73.0%) | 2,182 (27.0%) |
Housing Structures by Number of Rooms in Jerome County
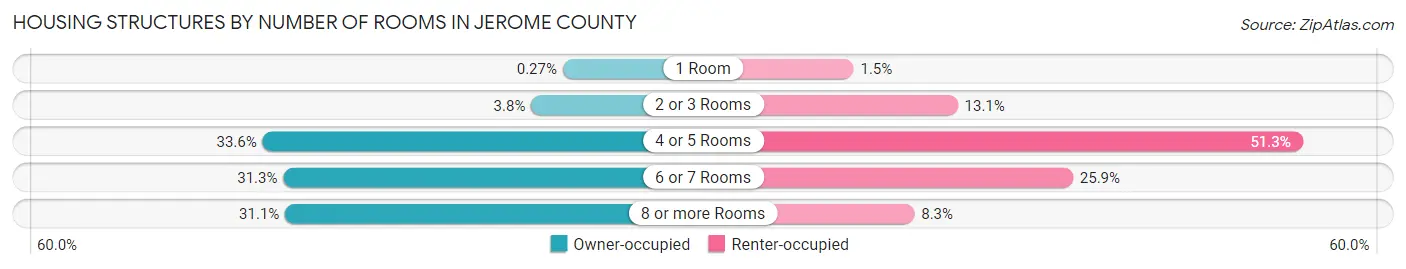
| Number of Rooms | Owner-occupied | Renter-occupied |
| 1 Room | 16 (0.3%) | 33 (1.5%) |
| 2 or 3 Rooms | 223 (3.8%) | 285 (13.1%) |
| 4 or 5 Rooms | 1,985 (33.6%) | 1,120 (51.3%) |
| 6 or 7 Rooms | 1,849 (31.3%) | 564 (25.9%) |
| 8 or more Rooms | 1,837 (31.1%) | 180 (8.3%) |
| Total | 5,910 (100.0%) | 2,182 (100.0%) |
Housing Structure by Heating Type in Jerome County
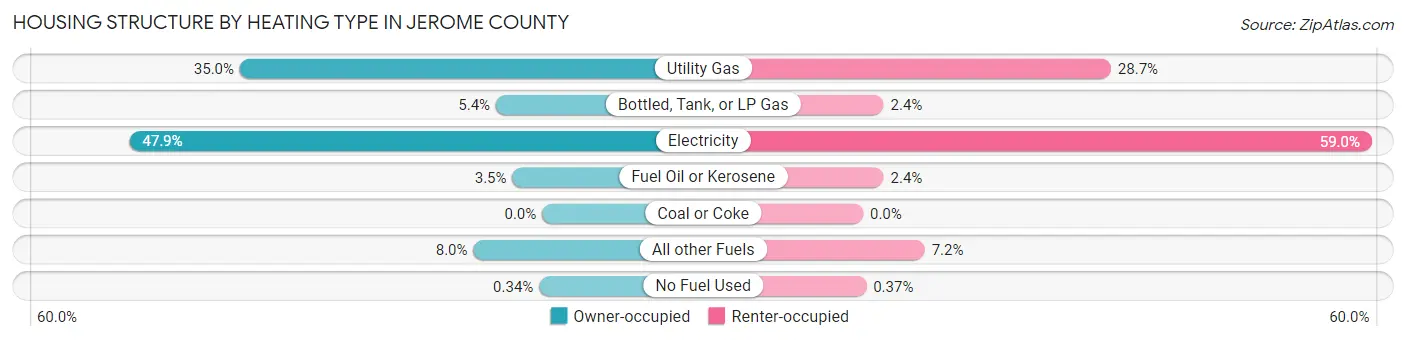
| Heating Type | Owner-occupied | Renter-occupied |
| Utility Gas | 2,071 (35.0%) | 627 (28.7%) |
| Bottled, Tank, or LP Gas | 316 (5.3%) | 52 (2.4%) |
| Electricity | 2,828 (47.8%) | 1,287 (59.0%) |
| Fuel Oil or Kerosene | 204 (3.5%) | 52 (2.4%) |
| Coal or Coke | 0 (0.0%) | 0 (0.0%) |
| All other Fuels | 471 (8.0%) | 156 (7.1%) |
| No Fuel Used | 20 (0.3%) | 8 (0.4%) |
| Total | 5,910 (100.0%) | 2,182 (100.0%) |
Household Vehicle Usage in Jerome County
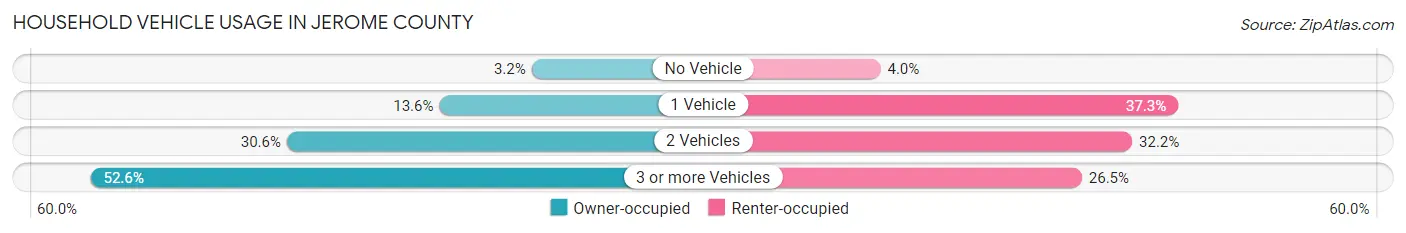
| Vehicles per Household | Owner-occupied | Renter-occupied |
| No Vehicle | 190 (3.2%) | 87 (4.0%) |
| 1 Vehicle | 801 (13.6%) | 814 (37.3%) |
| 2 Vehicles | 1,810 (30.6%) | 702 (32.2%) |
| 3 or more Vehicles | 3,109 (52.6%) | 579 (26.5%) |
| Total | 5,910 (100.0%) | 2,182 (100.0%) |
Real Estate & Mortgages in Jerome County
Real Estate and Mortgage Overview in Jerome County
| Characteristic | Without Mortgage | With Mortgage |
| Housing Units | 2,125 | 3,785 |
| Median Property Value | $243,300 | $229,700 |
| Median Household Income | $62,478 | $375 |
| Monthly Housing Costs | $440 | $156 |
| Real Estate Taxes | $1,497 | $204 |
Property Value by Mortgage Status in Jerome County
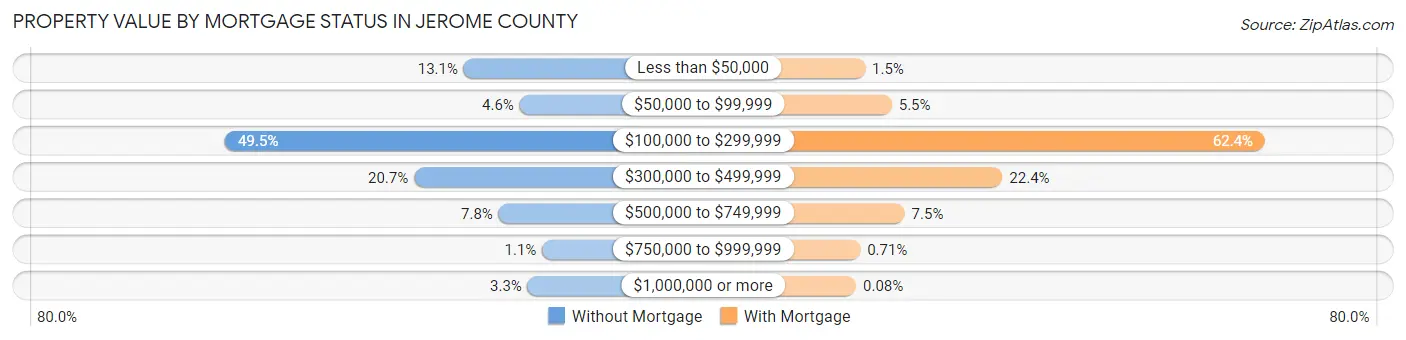
| Property Value | Without Mortgage | With Mortgage |
| Less than $50,000 | 278 (13.1%) | 55 (1.5%) |
| $50,000 to $99,999 | 97 (4.6%) | 209 (5.5%) |
| $100,000 to $299,999 | 1,051 (49.5%) | 2,361 (62.4%) |
| $300,000 to $499,999 | 439 (20.7%) | 847 (22.4%) |
| $500,000 to $749,999 | 165 (7.8%) | 283 (7.5%) |
| $750,000 to $999,999 | 24 (1.1%) | 27 (0.7%) |
| $1,000,000 or more | 71 (3.3%) | 3 (0.1%) |
| Total | 2,125 (100.0%) | 3,785 (100.0%) |
Household Income by Mortgage Status in Jerome County
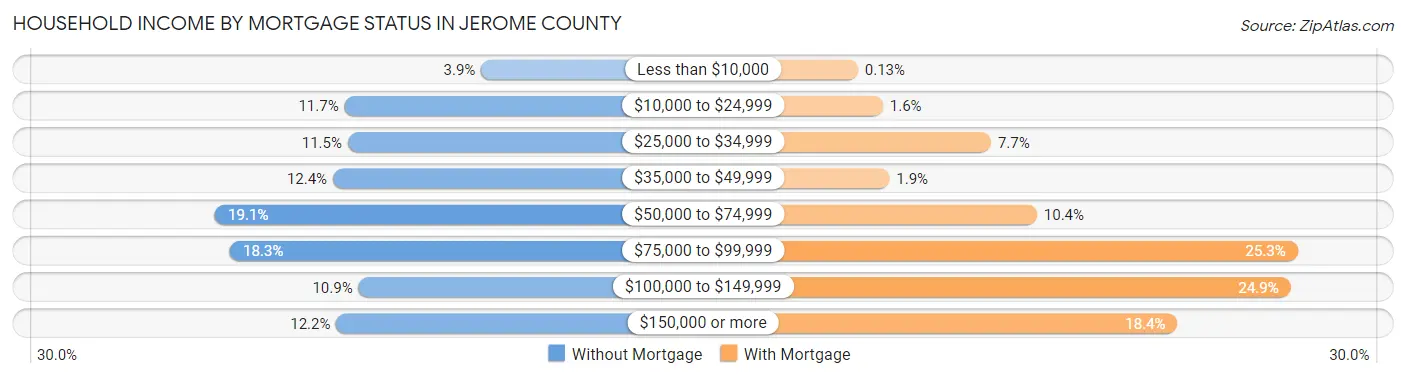
| Household Income | Without Mortgage | With Mortgage |
| Less than $10,000 | 83 (3.9%) | 5 (0.1%) |
| $10,000 to $24,999 | 249 (11.7%) | 59 (1.6%) |
| $25,000 to $34,999 | 245 (11.5%) | 293 (7.7%) |
| $35,000 to $49,999 | 263 (12.4%) | 73 (1.9%) |
| $50,000 to $74,999 | 406 (19.1%) | 392 (10.4%) |
| $75,000 to $99,999 | 388 (18.3%) | 956 (25.3%) |
| $100,000 to $149,999 | 232 (10.9%) | 941 (24.9%) |
| $150,000 or more | 259 (12.2%) | 696 (18.4%) |
| Total | 2,125 (100.0%) | 3,785 (100.0%) |
Property Value to Household Income Ratio in Jerome County
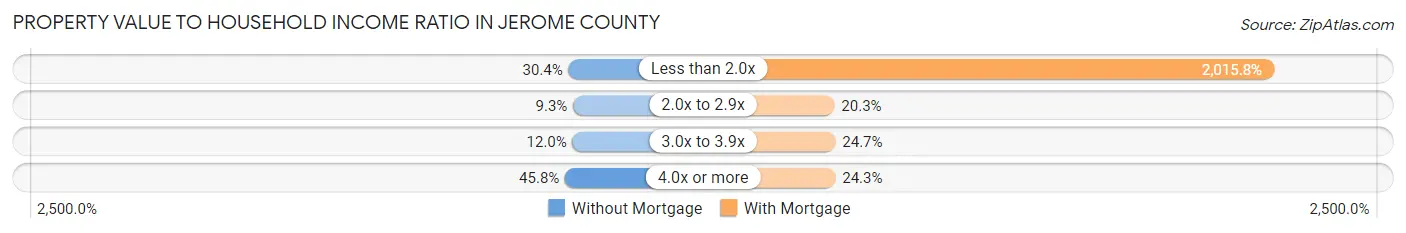
| Value-to-Income Ratio | Without Mortgage | With Mortgage |
| Less than 2.0x | 646 (30.4%) | 76,299 (2,015.8%) |
| 2.0x to 2.9x | 197 (9.3%) | 770 (20.3%) |
| 3.0x to 3.9x | 254 (11.9%) | 936 (24.7%) |
| 4.0x or more | 973 (45.8%) | 920 (24.3%) |
| Total | 2,125 (100.0%) | 3,785 (100.0%) |
Real Estate Taxes by Mortgage Status in Jerome County
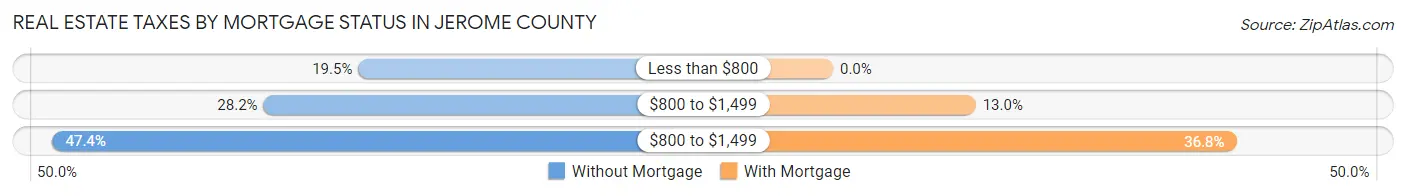
| Property Taxes | Without Mortgage | With Mortgage |
| Less than $800 | 415 (19.5%) | 0 (0.0%) |
| $800 to $1,499 | 599 (28.2%) | 493 (13.0%) |
| $800 to $1,499 | 1,008 (47.4%) | 1,394 (36.8%) |
| Total | 2,125 (100.0%) | 3,785 (100.0%) |
Health & Disability in Jerome County
Health Insurance Coverage by Age in Jerome County
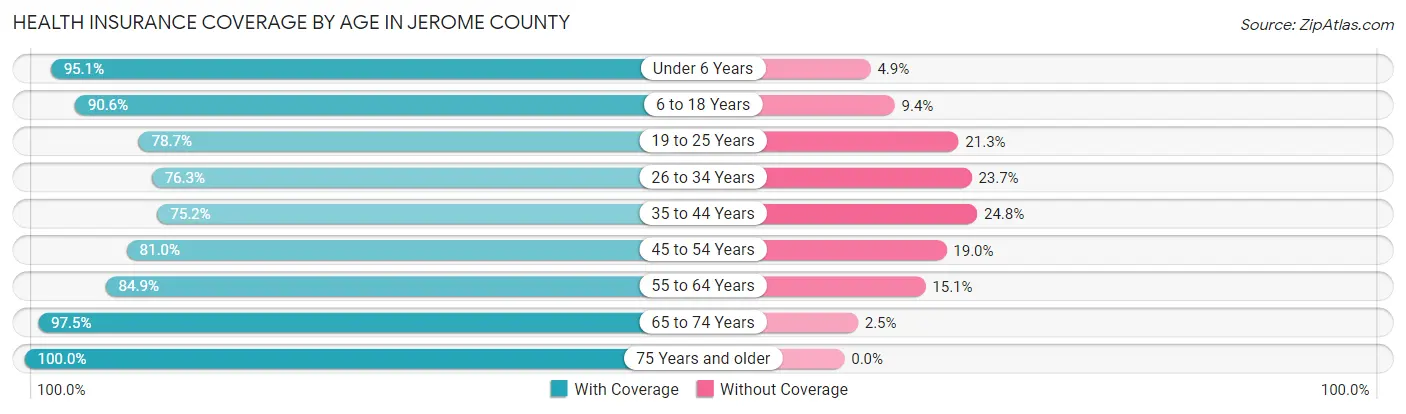
| Age Bracket | With Coverage | Without Coverage |
| Under 6 Years | 2,064 (95.1%) | 106 (4.9%) |
| 6 to 18 Years | 4,994 (90.6%) | 517 (9.4%) |
| 19 to 25 Years | 1,524 (78.7%) | 412 (21.3%) |
| 26 to 34 Years | 2,256 (76.3%) | 701 (23.7%) |
| 35 to 44 Years | 2,364 (75.2%) | 778 (24.8%) |
| 45 to 54 Years | 2,076 (81.0%) | 488 (19.0%) |
| 55 to 64 Years | 2,527 (84.9%) | 450 (15.1%) |
| 65 to 74 Years | 1,867 (97.5%) | 48 (2.5%) |
| 75 Years and older | 1,145 (100.0%) | 0 (0.0%) |
| Total | 20,817 (85.6%) | 3,500 (14.4%) |
Health Insurance Coverage by Citizenship Status in Jerome County
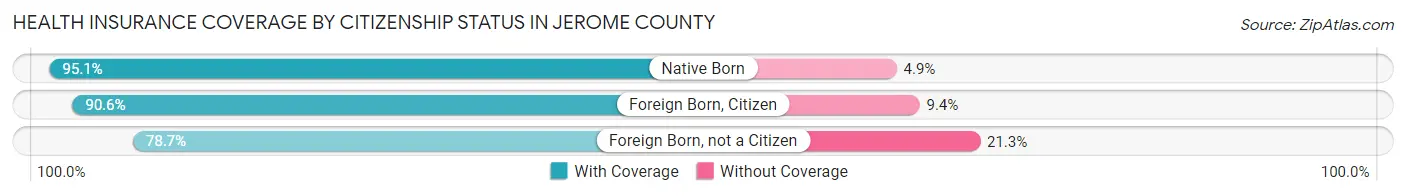
| Citizenship Status | With Coverage | Without Coverage |
| Native Born | 2,064 (95.1%) | 106 (4.9%) |
| Foreign Born, Citizen | 4,994 (90.6%) | 517 (9.4%) |
| Foreign Born, not a Citizen | 1,524 (78.7%) | 412 (21.3%) |
Health Insurance Coverage by Household Income in Jerome County
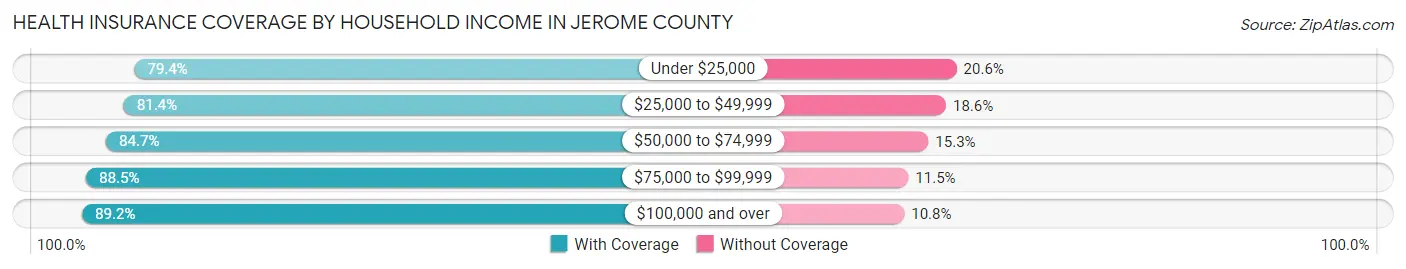
| Household Income | With Coverage | Without Coverage |
| Under $25,000 | 2,068 (79.4%) | 536 (20.6%) |
| $25,000 to $49,999 | 3,234 (81.4%) | 739 (18.6%) |
| $50,000 to $74,999 | 5,054 (84.7%) | 912 (15.3%) |
| $75,000 to $99,999 | 4,345 (88.5%) | 567 (11.5%) |
| $100,000 and over | 6,066 (89.2%) | 733 (10.8%) |
Public vs Private Health Insurance Coverage by Age in Jerome County
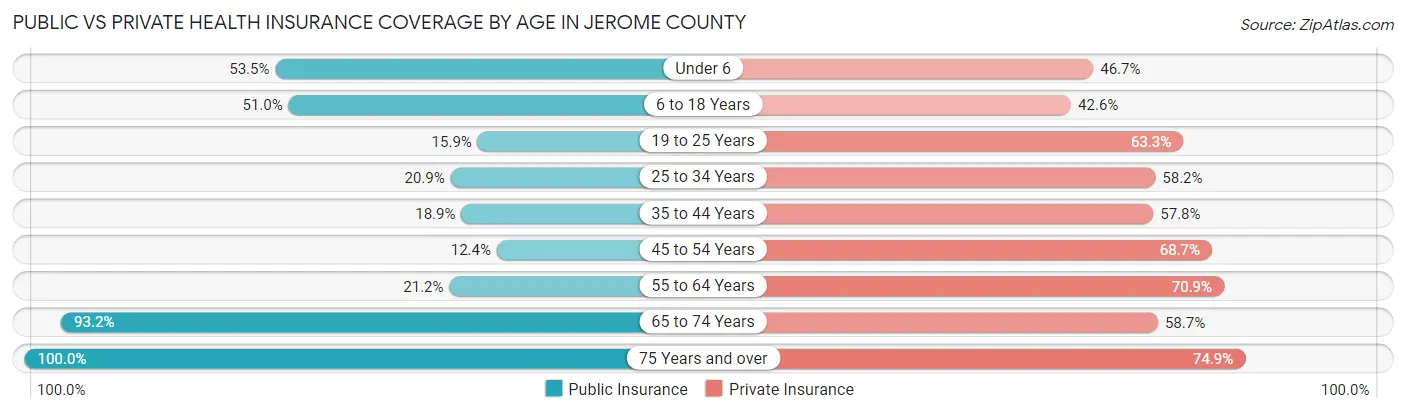
| Age Bracket | Public Insurance | Private Insurance |
| Under 6 | 1,160 (53.5%) | 1,013 (46.7%) |
| 6 to 18 Years | 2,811 (51.0%) | 2,346 (42.6%) |
| 19 to 25 Years | 308 (15.9%) | 1,226 (63.3%) |
| 25 to 34 Years | 619 (20.9%) | 1,721 (58.2%) |
| 35 to 44 Years | 595 (18.9%) | 1,817 (57.8%) |
| 45 to 54 Years | 317 (12.4%) | 1,761 (68.7%) |
| 55 to 64 Years | 630 (21.2%) | 2,111 (70.9%) |
| 65 to 74 Years | 1,785 (93.2%) | 1,124 (58.7%) |
| 75 Years and over | 1,145 (100.0%) | 857 (74.9%) |
| Total | 9,370 (38.5%) | 13,976 (57.5%) |
Disability Status by Sex by Age in Jerome County
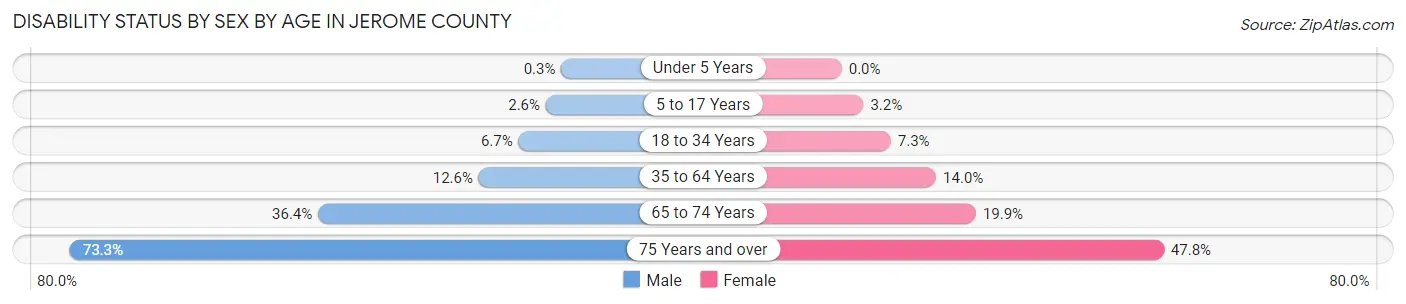
| Age Bracket | Male | Female |
| Under 5 Years | 3 (0.3%) | 0 (0.0%) |
| 5 to 17 Years | 72 (2.6%) | 87 (3.2%) |
| 18 to 34 Years | 181 (6.7%) | 184 (7.3%) |
| 35 to 64 Years | 566 (12.6%) | 585 (14.0%) |
| 65 to 74 Years | 350 (36.4%) | 190 (19.9%) |
| 75 Years and over | 384 (73.3%) | 297 (47.8%) |
Disability Class by Sex by Age in Jerome County
Disability Class: Hearing Difficulty
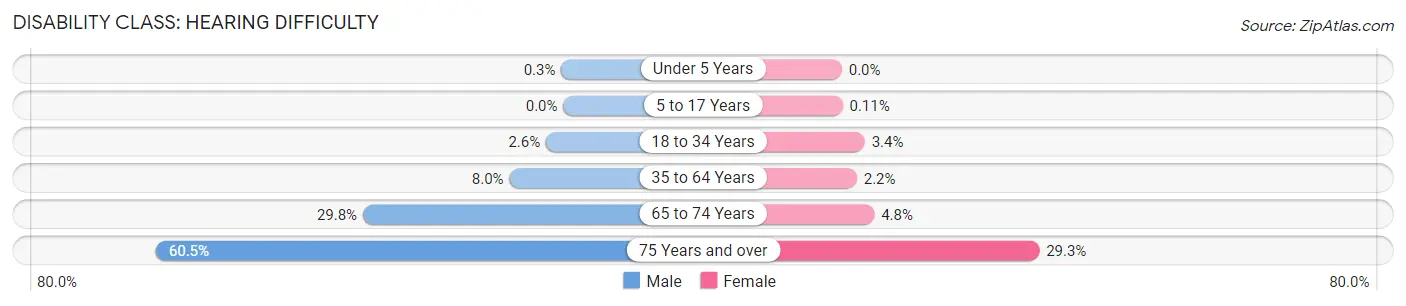
| Age Bracket | Male | Female |
| Under 5 Years | 3 (0.3%) | 0 (0.0%) |
| 5 to 17 Years | 0 (0.0%) | 3 (0.1%) |
| 18 to 34 Years | 70 (2.6%) | 86 (3.4%) |
| 35 to 64 Years | 361 (8.0%) | 93 (2.2%) |
| 65 to 74 Years | 286 (29.8%) | 46 (4.8%) |
| 75 Years and over | 317 (60.5%) | 182 (29.3%) |
Disability Class: Vision Difficulty
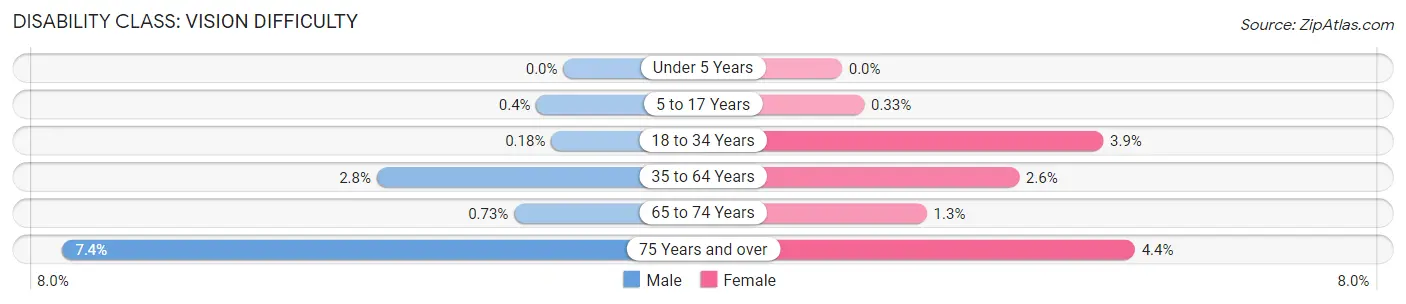
| Age Bracket | Male | Female |
| Under 5 Years | 0 (0.0%) | 0 (0.0%) |
| 5 to 17 Years | 11 (0.4%) | 9 (0.3%) |
| 18 to 34 Years | 5 (0.2%) | 98 (3.9%) |
| 35 to 64 Years | 125 (2.8%) | 110 (2.6%) |
| 65 to 74 Years | 7 (0.7%) | 12 (1.3%) |
| 75 Years and over | 39 (7.4%) | 27 (4.3%) |
Disability Class: Cognitive Difficulty
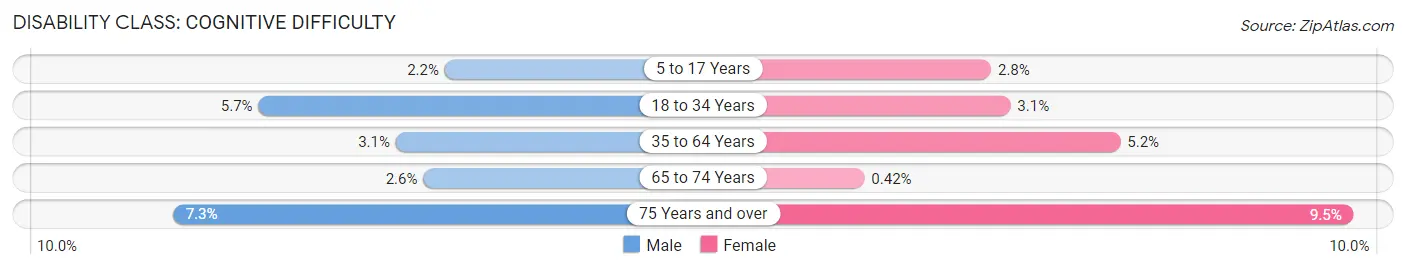
| Age Bracket | Male | Female |
| 5 to 17 Years | 61 (2.2%) | 75 (2.8%) |
| 18 to 34 Years | 154 (5.7%) | 79 (3.1%) |
| 35 to 64 Years | 140 (3.1%) | 216 (5.2%) |
| 65 to 74 Years | 25 (2.6%) | 4 (0.4%) |
| 75 Years and over | 38 (7.2%) | 59 (9.5%) |
Disability Class: Ambulatory Difficulty
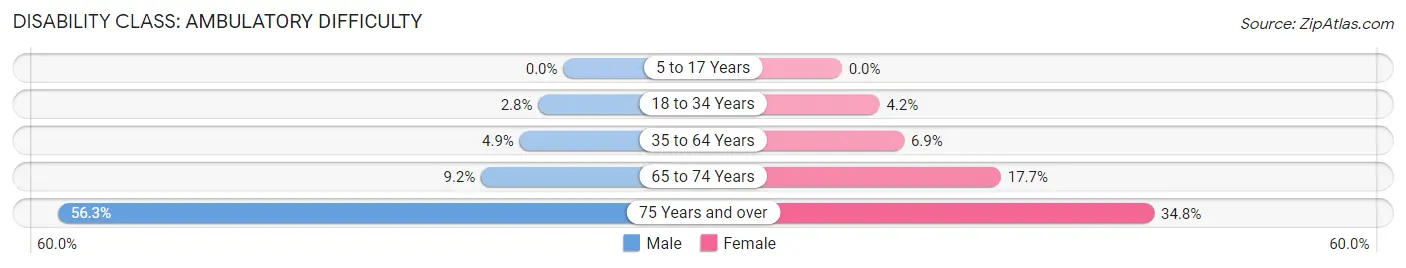
| Age Bracket | Male | Female |
| 5 to 17 Years | 0 (0.0%) | 0 (0.0%) |
| 18 to 34 Years | 76 (2.8%) | 106 (4.2%) |
| 35 to 64 Years | 219 (4.9%) | 289 (6.9%) |
| 65 to 74 Years | 88 (9.2%) | 169 (17.7%) |
| 75 Years and over | 295 (56.3%) | 216 (34.8%) |
Disability Class: Self-Care Difficulty
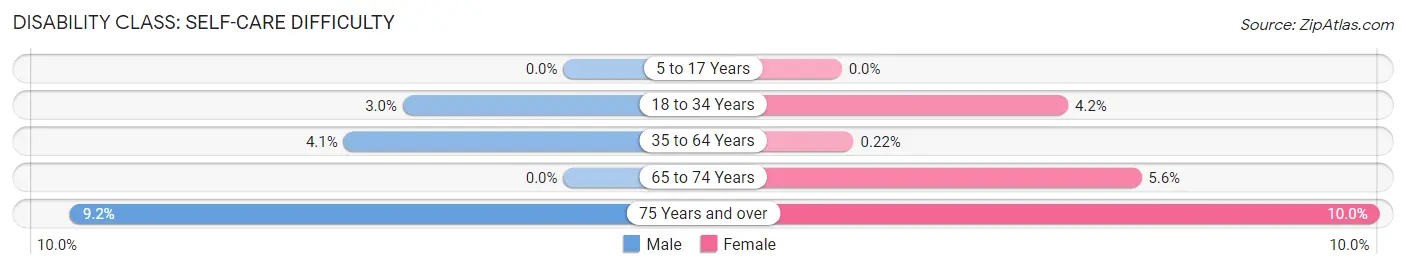
| Age Bracket | Male | Female |
| 5 to 17 Years | 0 (0.0%) | 0 (0.0%) |
| 18 to 34 Years | 81 (3.0%) | 106 (4.2%) |
| 35 to 64 Years | 184 (4.1%) | 9 (0.2%) |
| 65 to 74 Years | 0 (0.0%) | 53 (5.6%) |
| 75 Years and over | 48 (9.2%) | 62 (10.0%) |
Technology Access in Jerome County
Computing Device Access in Jerome County
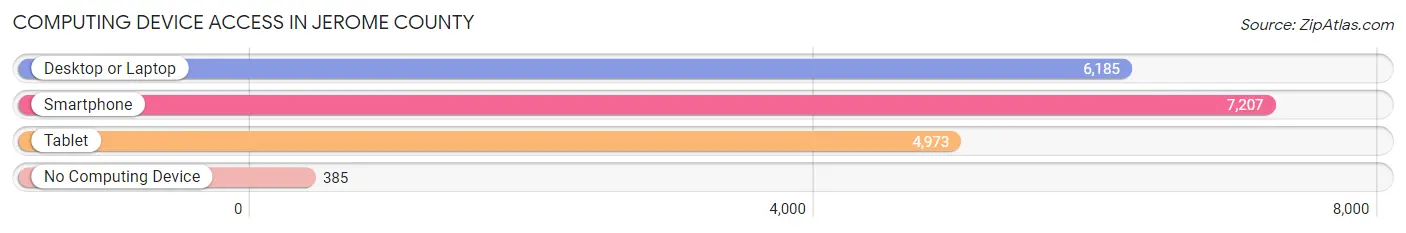
| Device Type | # Households | % Households |
| Desktop or Laptop | 6,185 | 76.4% |
| Smartphone | 7,207 | 89.1% |
| Tablet | 4,973 | 61.5% |
| No Computing Device | 385 | 4.8% |
| Total | 8,092 | 100.0% |
Internet Access in Jerome County
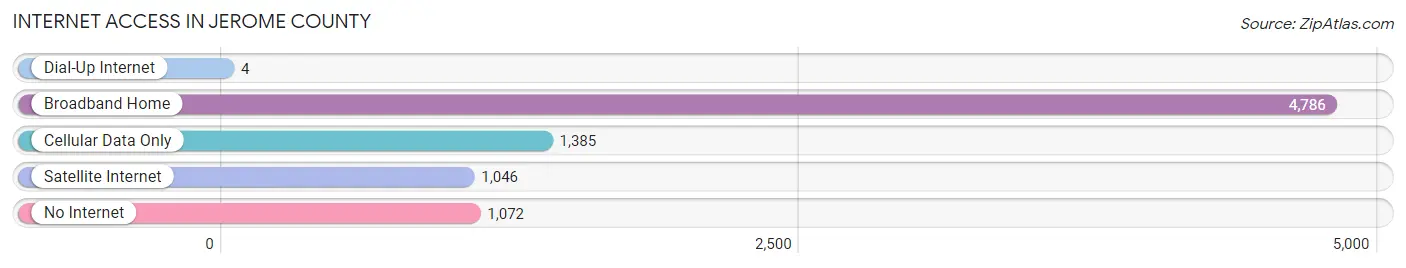
| Internet Type | # Households | % Households |
| Dial-Up Internet | 4 | 0.1% |
| Broadband Home | 4,786 | 59.1% |
| Cellular Data Only | 1,385 | 17.1% |
| Satellite Internet | 1,046 | 12.9% |
| No Internet | 1,072 | 13.3% |
| Total | 8,092 | 100.0% |
Jerome County Summary
Jerome County, Idaho is located in the south-central part of the state and is bordered by Twin Falls County to the north, Gooding County to the east, Lincoln County to the south, and Cassia County to the west. The county seat is Jerome, and the county has a total area of 576 square miles. As of the 2010 census, the population was 22,374, making it the fifth-most populous county in Idaho.
History
The area that is now Jerome County was originally inhabited by the Shoshone and Bannock Native American tribes. The first non-native settlers arrived in the area in the late 1800s, and the county was officially established in 1919. The county was named after Jerome, a small town that was founded in the area in 1883.
Geography
Jerome County is located in the Snake River Plain region of Idaho. The terrain is mostly flat, with some rolling hills in the northern part of the county. The Snake River runs through the county, and there are several small lakes and reservoirs in the area. The climate is semi-arid, with hot summers and cold winters.
Economy
Agriculture is the main economic activity in Jerome County. The county is home to several large farms and ranches, and the main crops grown in the area are potatoes, sugar beets, corn, and wheat. The county also has a thriving dairy industry, and there are several large dairies in the area.
In addition to agriculture, Jerome County also has a growing manufacturing sector. The county is home to several large factories, including a potato processing plant and a sugar beet processing plant. The county also has a growing tourism industry, with several popular attractions, such as the Snake River Canyon and the Thousand Springs State Park.
Demographics
As of the 2010 census, the population of Jerome County was 22,374. The racial makeup of the county was 87.3% White, 0.7% African American, 0.7% Native American, 0.4% Asian, 0.1% Pacific Islander, 8.7% from other races, and 2.1% from two or more races. Hispanic or Latino of any race were 16.2% of the population.
The median household income in Jerome County was $41,945, and the median family income was $48,945. The per capita income was $19,945. About 11.3% of the population was below the poverty line.
The largest cities in Jerome County are Jerome (population 8,837), Twin Falls (population 7,734), and Filer (population 2,845). The county is served by the Jerome School District, which includes seven elementary schools, two middle schools, and one high school.
Common Questions
What is the Total Population of Jerome County?
Total Population of Jerome County is 24,474.
What is the Total Male Population of Jerome County?
Total Male Population of Jerome County is 12,576.
What is the Total Female Population of Jerome County?
Total Female Population of Jerome County is 11,898.
What is the Ratio of Males per 100 Females in Jerome County?
There are 105.70 Males per 100 Females in Jerome County.
What is the Ratio of Females per 100 Males in Jerome County?
There are 94.61 Females per 100 Males in Jerome County.
What is the Median Population Age in Jerome County?
Median Population Age in Jerome County is 33.0 Years.
What is the Average Family Size in Jerome County
Average Family Size in Jerome County is 3.4 People.
What is the Average Household Size in Jerome County
Average Household Size in Jerome County is 3.0 People.
What is Per Capita Income in Jerome County?
Per Capita income in Jerome County is $28,266.
What is the Median Family Income in Jerome County?
Median Family Income in Jerome County is $69,762.
What is the Median Household income in Jerome County?
Median Household Income in Jerome County is $67,347.
What is Income or Wage Gap in Jerome County?
Income or Wage Gap in Jerome County is 50.1%.
Women in Jerome County earn 49.9 cents for every dollar earned by a man.
What is Inequality or Gini Index in Jerome County?
Inequality or Gini Index in Jerome County is 0.43.
How Large is the Labor Force in Jerome County?
There are 11,901 People in the Labor Forcein in Jerome County.
What is the Percentage of People in the Labor Force in Jerome County?
66.1% of People are in the Labor Force in Jerome County.
What is the Unemployment Rate in Jerome County?
Unemployment Rate in Jerome County is 3.5%.