Jefferson County, ID
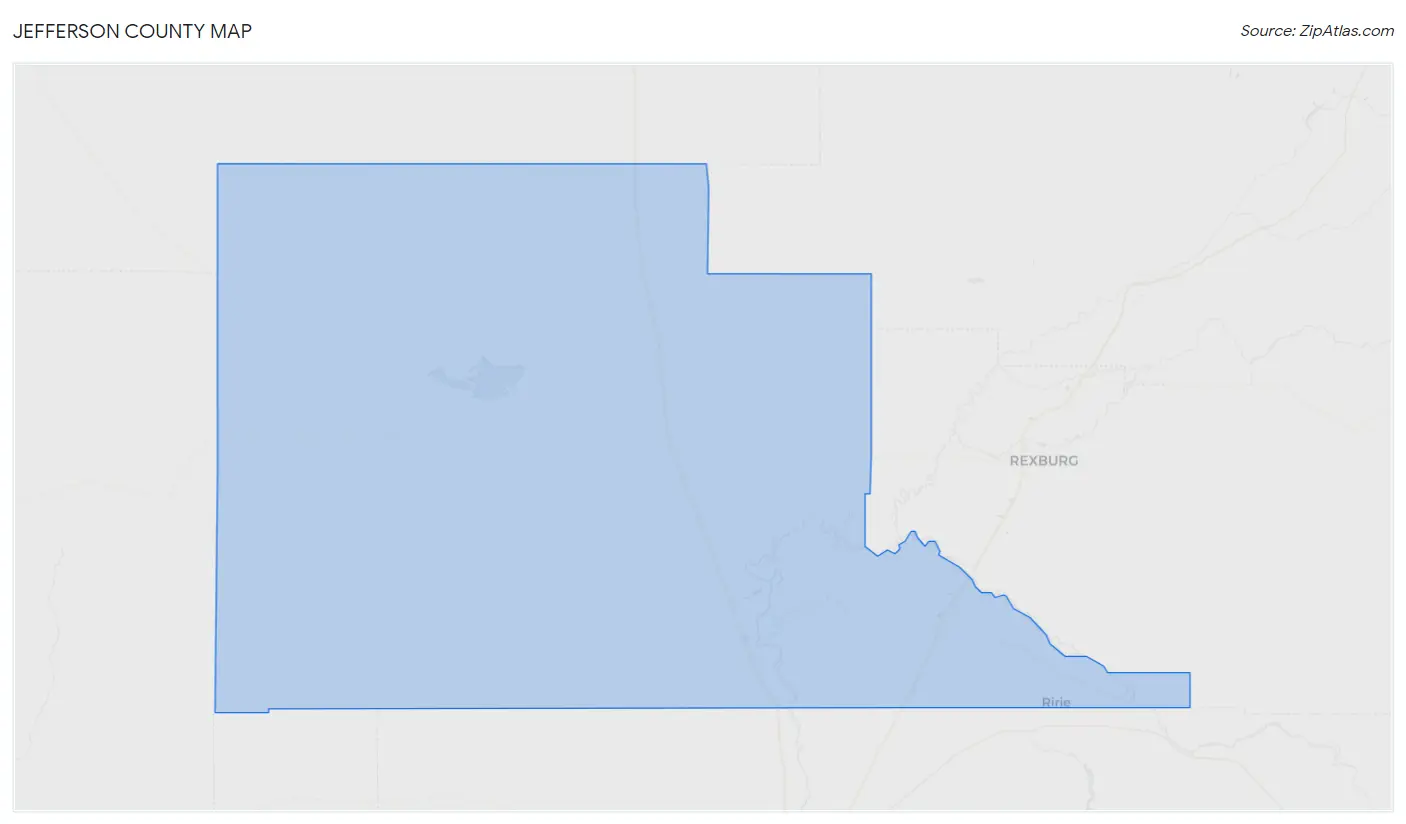
Jefferson County Map
Jefferson County Overview
31,383
TOTAL POPULATION
16,051
MALE POPULATION
15,332
FEMALE POPULATION
104.69
MALES / 100 FEMALES
95.52
FEMALES / 100 MALES
31.7
MEDIAN AGE
3.7
AVG FAMILY SIZE
3.2
AVG HOUSEHOLD SIZE
$29,028
PER CAPITA INCOME
$84,941
AVG FAMILY INCOME
$77,491
AVG HOUSEHOLD INCOME
54.3%
WAGE / INCOME GAP [ % ]
45.7¢/ $1
WAGE / INCOME GAP [ $ ]
$10,320
FAMILY INCOME DEFICIT
0.38
INEQUALITY / GINI INDEX
14,749
LABOR FORCE [ PEOPLE ]
66.4%
PERCENT IN LABOR FORCE
2.4%
UNEMPLOYMENT RATE
Jefferson County Area Codes
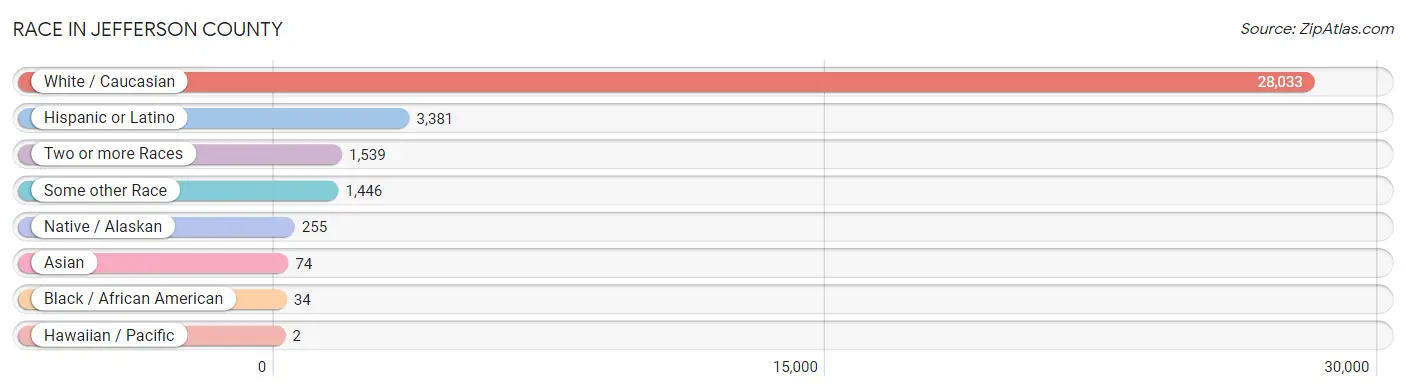
Race in Jefferson County
The most populous races in Jefferson County are White / Caucasian (28,033 | 89.3%), Hispanic or Latino (3,381 | 10.8%), and Two or more Races (1,539 | 4.9%).
| Race | # Population | % Population |
| Asian | 74 | 0.2% |
| Black / African American | 34 | 0.1% |
| Hawaiian / Pacific | 2 | 0.0% |
| Hispanic or Latino | 3,381 | 10.8% |
| Native / Alaskan | 255 | 0.8% |
| White / Caucasian | 28,033 | 89.3% |
| Two or more Races | 1,539 | 4.9% |
| Some other Race | 1,446 | 4.6% |
| Total | 31,383 | 100.0% |
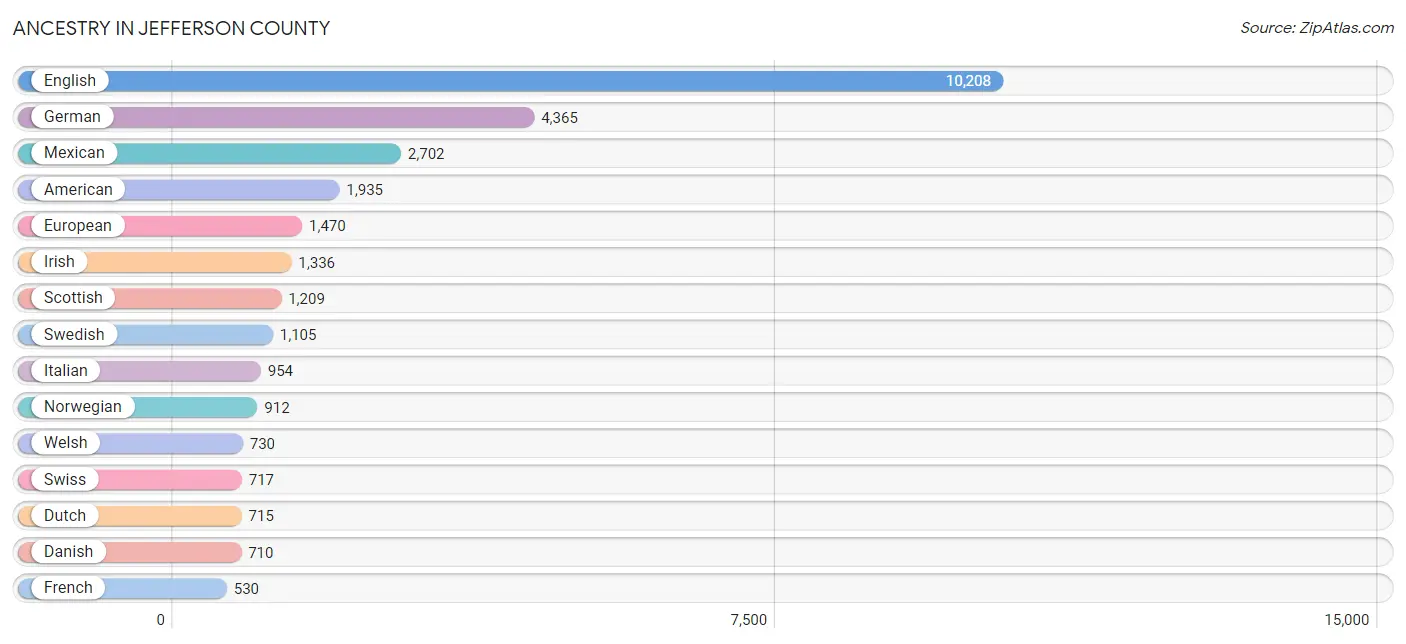
Ancestry in Jefferson County
The most populous ancestries reported in Jefferson County are English (10,208 | 32.5%), German (4,365 | 13.9%), Mexican (2,702 | 8.6%), American (1,935 | 6.2%), and European (1,470 | 4.7%), together accounting for 65.9% of all Jefferson County residents.
| Ancestry | # Population | % Population |
| American | 1,935 | 6.2% |
| Apache | 20 | 0.1% |
| Argentinean | 63 | 0.2% |
| Austrian | 20 | 0.1% |
| Bangladeshi | 36 | 0.1% |
| Basque | 12 | 0.0% |
| Bhutanese | 8 | 0.0% |
| Blackfeet | 2 | 0.0% |
| British | 253 | 0.8% |
| Burmese | 22 | 0.1% |
| Celtic | 60 | 0.2% |
| Cherokee | 104 | 0.3% |
| Chilean | 201 | 0.6% |
| Chippewa | 1 | 0.0% |
| Choctaw | 6 | 0.0% |
| Colville | 20 | 0.1% |
| Croatian | 15 | 0.1% |
| Cuban | 1 | 0.0% |
| Czech | 46 | 0.2% |
| Czechoslovakian | 13 | 0.0% |
| Danish | 710 | 2.3% |
| Dutch | 715 | 2.3% |
| Eastern European | 49 | 0.2% |
| English | 10,208 | 32.5% |
| Ethiopian | 6 | 0.0% |
| European | 1,470 | 4.7% |
| Finnish | 6 | 0.0% |
| French | 530 | 1.7% |
| French American Indian | 2 | 0.0% |
| French Canadian | 25 | 0.1% |
| German | 4,365 | 13.9% |
| Greek | 57 | 0.2% |
| Guamanian / Chamorro | 22 | 0.1% |
| Hungarian | 125 | 0.4% |
| Icelander | 8 | 0.0% |
| Indian (Asian) | 111 | 0.4% |
| Inupiat | 190 | 0.6% |
| Irish | 1,336 | 4.3% |
| Italian | 954 | 3.0% |
| Korean | 139 | 0.4% |
| Luxembourger | 4 | 0.0% |
| Mexican | 2,702 | 8.6% |
| Mexican American Indian | 99 | 0.3% |
| Native Hawaiian | 74 | 0.2% |
| Navajo | 77 | 0.3% |
| Northern European | 88 | 0.3% |
| Norwegian | 912 | 2.9% |
| Polish | 152 | 0.5% |
| Portuguese | 12 | 0.0% |
| Puerto Rican | 38 | 0.1% |
| Puget Sound Salish | 22 | 0.1% |
| Russian | 62 | 0.2% |
| Samoan | 6 | 0.0% |
| Scandinavian | 266 | 0.9% |
| Scotch-Irish | 256 | 0.8% |
| Scottish | 1,209 | 3.8% |
| Serbian | 5 | 0.0% |
| Shoshone | 68 | 0.2% |
| South American | 384 | 1.2% |
| Spaniard | 163 | 0.5% |
| Subsaharan African | 6 | 0.0% |
| Swedish | 1,105 | 3.5% |
| Swiss | 717 | 2.3% |
| Thai | 6 | 0.0% |
| Tongan | 2 | 0.0% |
| Venezuelan | 120 | 0.4% |
| Welsh | 730 | 2.3% | View All 67 Rows |
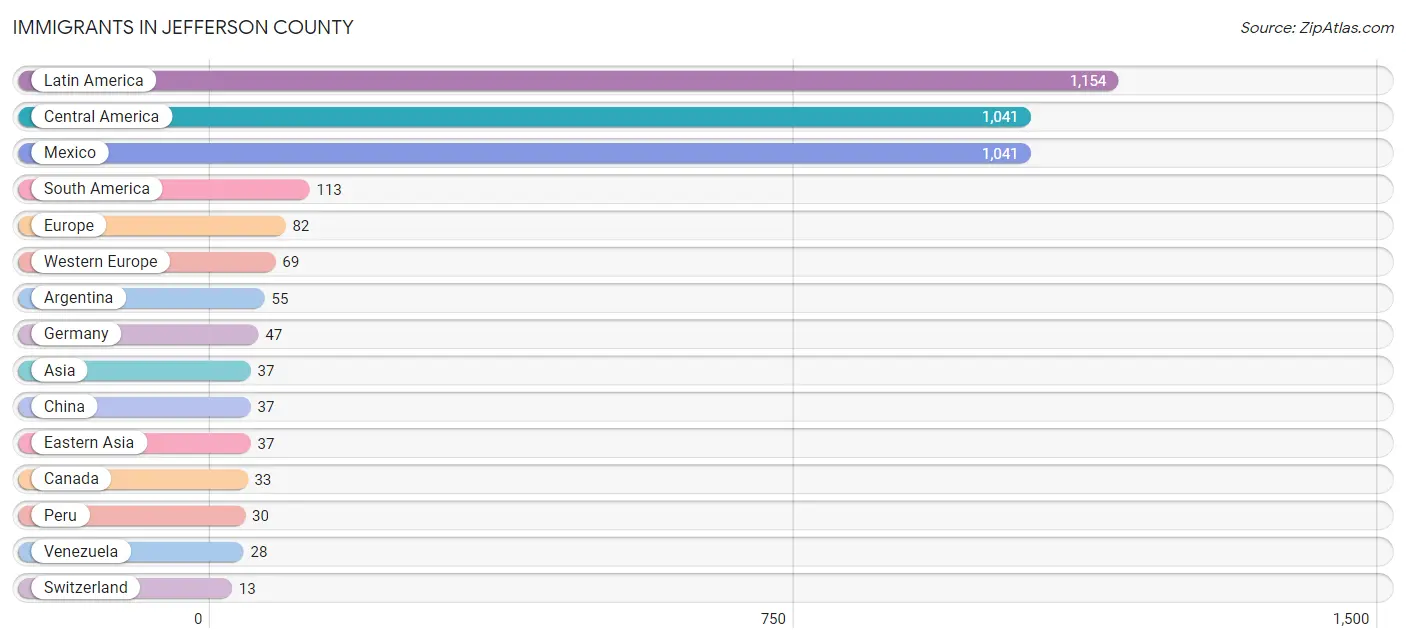
Immigrants in Jefferson County
The most numerous immigrant groups reported in Jefferson County came from Latin America (1,154 | 3.7%), Central America (1,041 | 3.3%), Mexico (1,041 | 3.3%), South America (113 | 0.4%), and Europe (82 | 0.3%), together accounting for 10.9% of all Jefferson County residents.
| Immigration Origin | # Population | % Population |
| Argentina | 55 | 0.2% |
| Asia | 37 | 0.1% |
| Canada | 33 | 0.1% |
| Central America | 1,041 | 3.3% |
| China | 37 | 0.1% |
| Eastern Asia | 37 | 0.1% |
| Eastern Europe | 4 | 0.0% |
| England | 9 | 0.0% |
| Europe | 82 | 0.3% |
| France | 3 | 0.0% |
| Germany | 47 | 0.2% |
| Latin America | 1,154 | 3.7% |
| Mexico | 1,041 | 3.3% |
| Netherlands | 6 | 0.0% |
| Northern Europe | 9 | 0.0% |
| Peru | 30 | 0.1% |
| Poland | 4 | 0.0% |
| South America | 113 | 0.4% |
| Switzerland | 13 | 0.0% |
| Venezuela | 28 | 0.1% |
| Western Europe | 69 | 0.2% | View All 21 Rows |
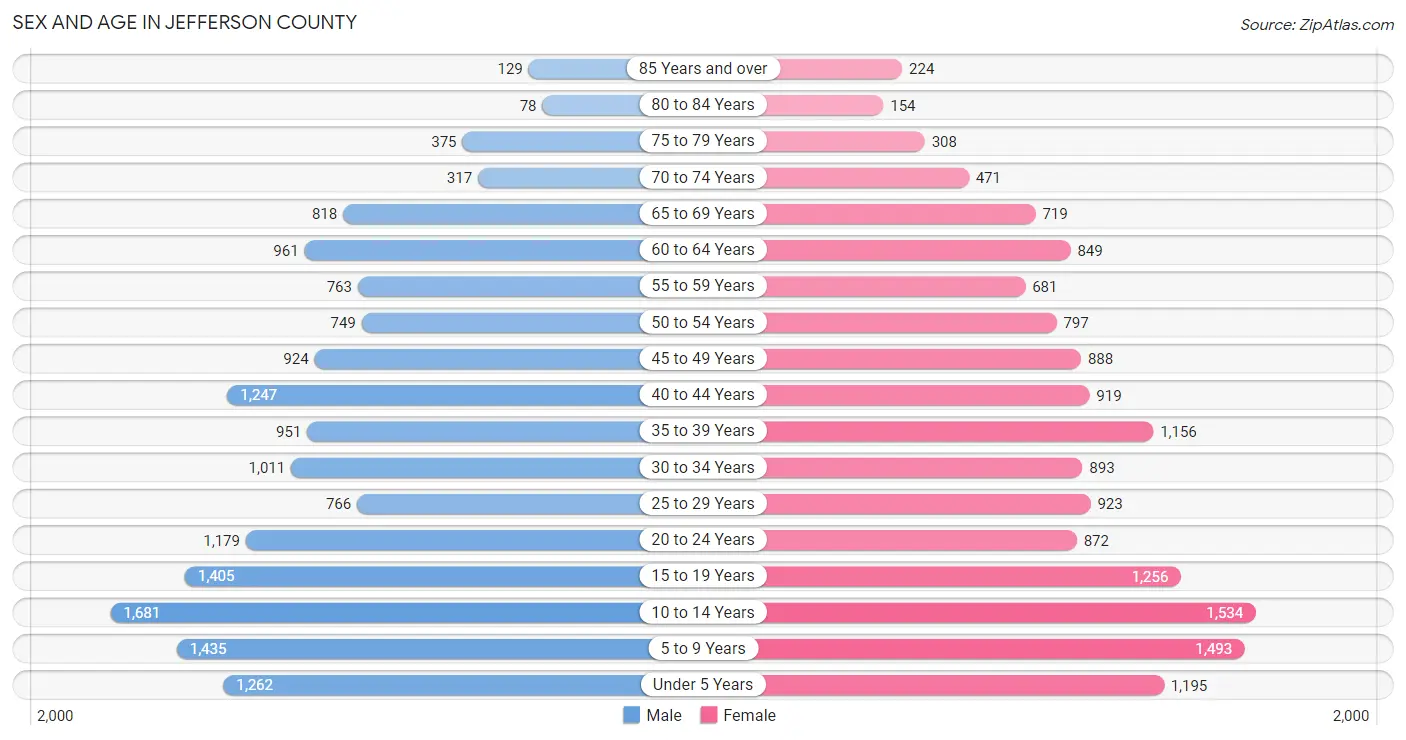
Sex and Age in Jefferson County
Sex and Age in Jefferson County
The most populous age groups in Jefferson County are 10 to 14 Years (1,681 | 10.5%) for men and 10 to 14 Years (1,534 | 10.0%) for women.
| Age Bracket | Male | Female |
| Under 5 Years | 1,262 (7.9%) | 1,195 (7.8%) |
| 5 to 9 Years | 1,435 (8.9%) | 1,493 (9.7%) |
| 10 to 14 Years | 1,681 (10.5%) | 1,534 (10.0%) |
| 15 to 19 Years | 1,405 (8.7%) | 1,256 (8.2%) |
| 20 to 24 Years | 1,179 (7.3%) | 872 (5.7%) |
| 25 to 29 Years | 766 (4.8%) | 923 (6.0%) |
| 30 to 34 Years | 1,011 (6.3%) | 893 (5.8%) |
| 35 to 39 Years | 951 (5.9%) | 1,156 (7.5%) |
| 40 to 44 Years | 1,247 (7.8%) | 919 (6.0%) |
| 45 to 49 Years | 924 (5.8%) | 888 (5.8%) |
| 50 to 54 Years | 749 (4.7%) | 797 (5.2%) |
| 55 to 59 Years | 763 (4.8%) | 681 (4.4%) |
| 60 to 64 Years | 961 (6.0%) | 849 (5.5%) |
| 65 to 69 Years | 818 (5.1%) | 719 (4.7%) |
| 70 to 74 Years | 317 (2.0%) | 471 (3.1%) |
| 75 to 79 Years | 375 (2.3%) | 308 (2.0%) |
| 80 to 84 Years | 78 (0.5%) | 154 (1.0%) |
| 85 Years and over | 129 (0.8%) | 224 (1.5%) |
| Total | 16,051 (100.0%) | 15,332 (100.0%) |
Families and Households in Jefferson County
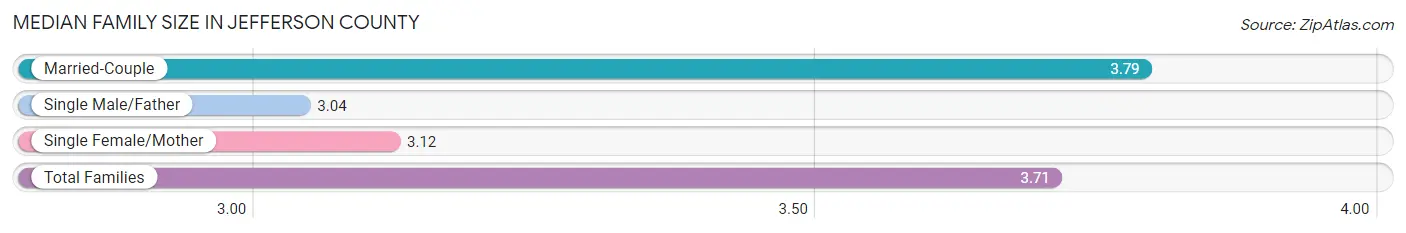
Median Family Size in Jefferson County
The median family size in Jefferson County is 3.71 persons per family, with married-couple families (6,826 | 88.7%) accounting for the largest median family size of 3.79 persons per family. On the other hand, single male/father families (246 | 3.2%) represent the smallest median family size with 3.04 persons per family.
| Family Type | # Families | Family Size |
| Married-Couple | 6,826 (88.7%) | 3.79 |
| Single Male/Father | 246 (3.2%) | 3.04 |
| Single Female/Mother | 624 (8.1%) | 3.12 |
| Total Families | 7,696 (100.0%) | 3.71 |
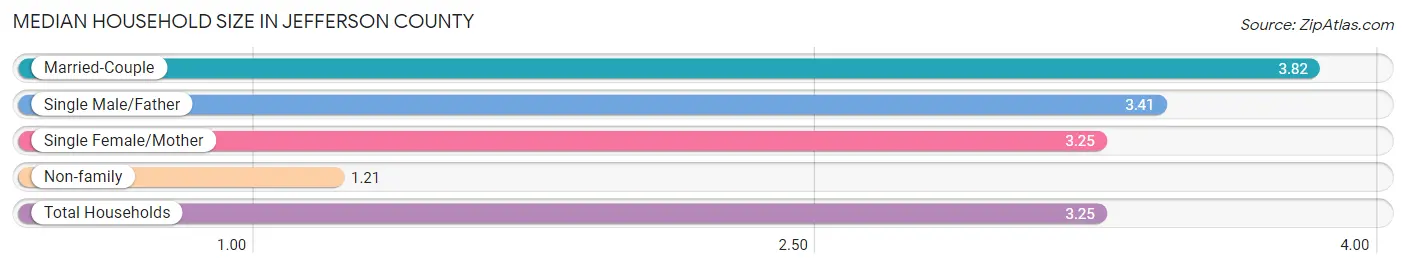
Median Household Size in Jefferson County
The median household size in Jefferson County is 3.25 persons per household, with married-couple households (6,826 | 70.9%) accounting for the largest median household size of 3.82 persons per household. non-family households (1,927 | 20.0%) represent the smallest median household size with 1.21 persons per household.
| Household Type | # Households | Household Size |
| Married-Couple | 6,826 (70.9%) | 3.82 |
| Single Male/Father | 246 (2.6%) | 3.41 |
| Single Female/Mother | 624 (6.5%) | 3.25 |
| Non-family | 1,927 (20.0%) | 1.21 |
| Total Households | 9,623 (100.0%) | 3.25 |
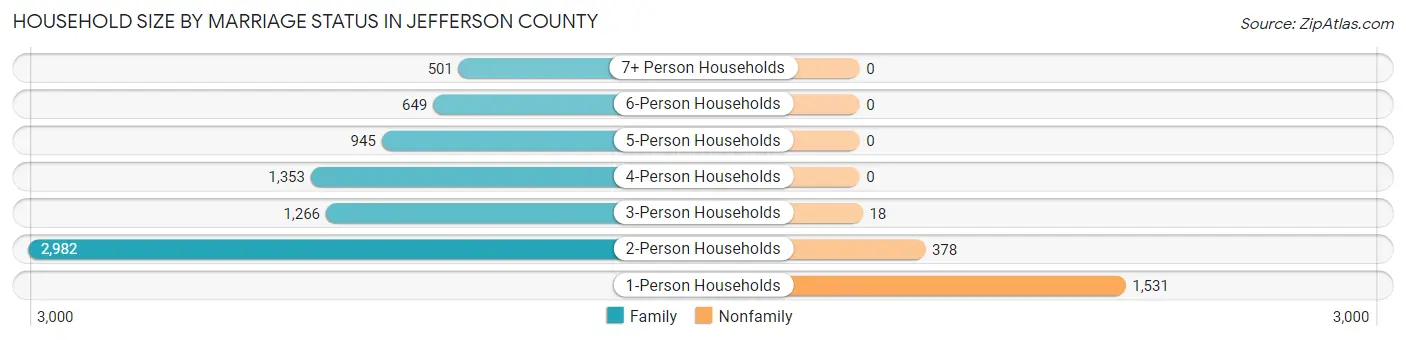
Household Size by Marriage Status in Jefferson County
Out of a total of 9,623 households in Jefferson County, 7,696 (80.0%) are family households, while 1,927 (20.0%) are nonfamily households. The most numerous type of family households are 2-person households, comprising 2,982, and the most common type of nonfamily households are 1-person households, comprising 1,531.
| Household Size | Family Households | Nonfamily Households |
| 1-Person Households | - | 1,531 (15.9%) |
| 2-Person Households | 2,982 (31.0%) | 378 (3.9%) |
| 3-Person Households | 1,266 (13.2%) | 18 (0.2%) |
| 4-Person Households | 1,353 (14.1%) | 0 (0.0%) |
| 5-Person Households | 945 (9.8%) | 0 (0.0%) |
| 6-Person Households | 649 (6.7%) | 0 (0.0%) |
| 7+ Person Households | 501 (5.2%) | 0 (0.0%) |
| Total | 7,696 (80.0%) | 1,927 (20.0%) |
Female Fertility in Jefferson County
Fertility by Age in Jefferson County
Average fertility rate in Jefferson County is 64.0 births per 1,000 women. Women in the age bracket of 20 to 34 years have the highest fertility rate with 133.0 births per 1,000 women. Women in the age bracket of 20 to 34 years acount for 79.7% of all women with births.
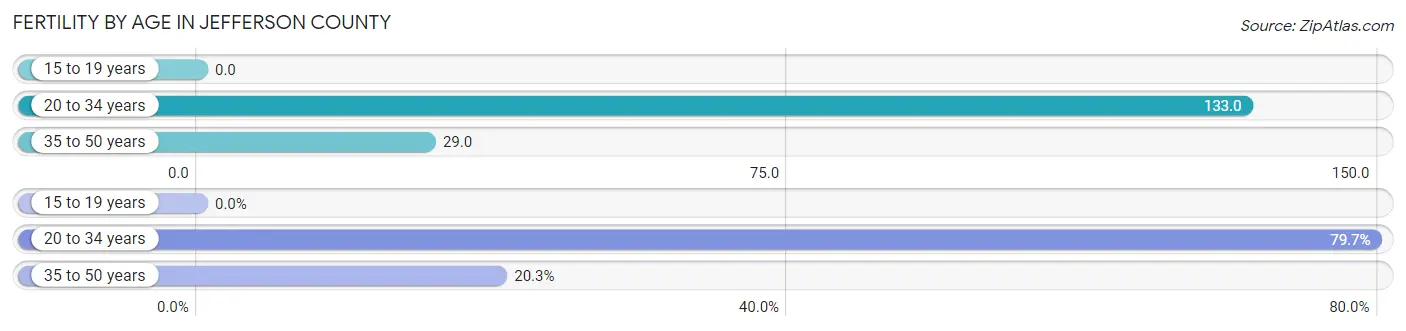
| Age Bracket | Women with Births | Births / 1,000 Women |
| 15 to 19 years | 0 (0.0%) | 0.0 |
| 20 to 34 years | 357 (79.7%) | 133.0 |
| 35 to 50 years | 91 (20.3%) | 29.0 |
| Total | 448 (100.0%) | 64.0 |
Fertility by Age by Marriage Status in Jefferson County
86.6% of women with births (448) in Jefferson County are married. The highest percentage of unmarried women with births falls into 20 to 34 years age bracket with 16.8% of them unmarried at the time of birth, while the lowest percentage of unmarried women with births belong to 35 to 50 years age bracket with 0.0% of them unmarried.
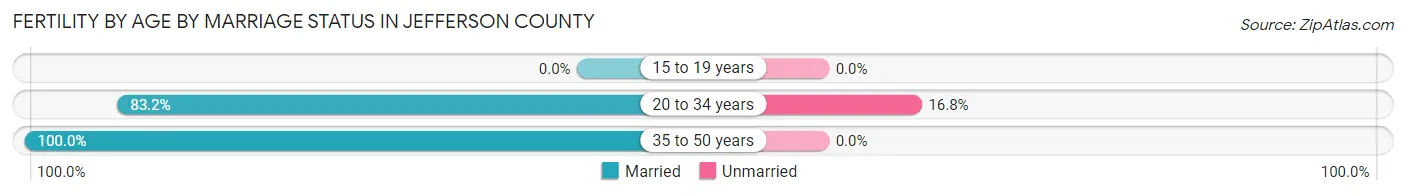
| Age Bracket | Married | Unmarried |
| 15 to 19 years | 0 (0.0%) | 0 (0.0%) |
| 20 to 34 years | 297 (83.2%) | 60 (16.8%) |
| 35 to 50 years | 91 (100.0%) | 0 (0.0%) |
| Total | 388 (86.6%) | 60 (13.4%) |
Fertility by Education in Jefferson County
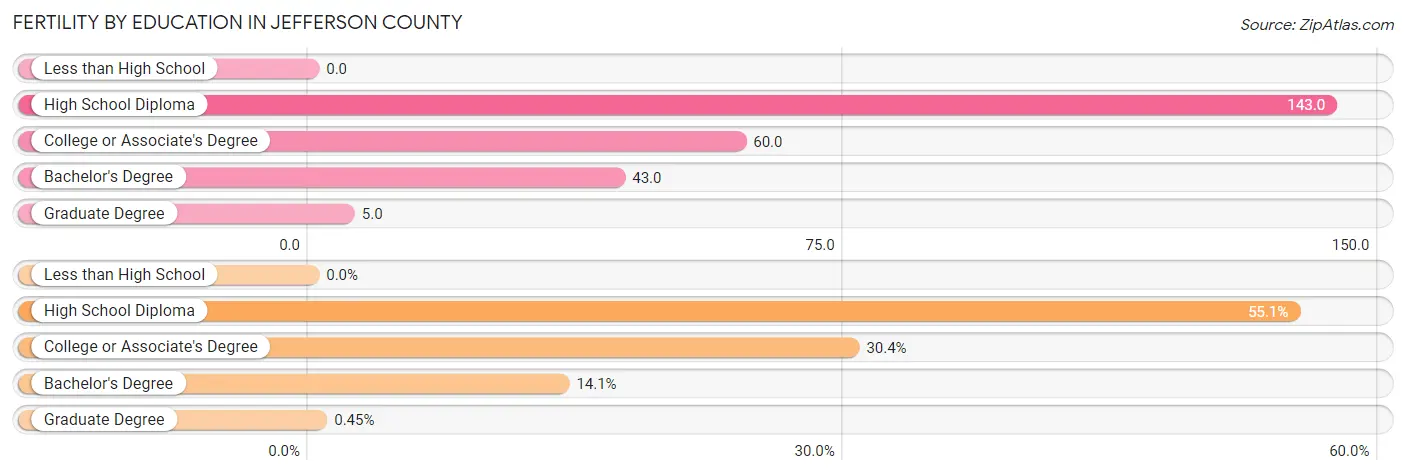
| Educational Attainment | Women with Births | Births / 1,000 Women |
| Less than High School | 0 (0.0%) | 0.0 |
| High School Diploma | 247 (55.1%) | 143.0 |
| College or Associate's Degree | 136 (30.4%) | 60.0 |
| Bachelor's Degree | 63 (14.1%) | 43.0 |
| Graduate Degree | 2 (0.4%) | 5.0 |
| Total | 448 (100.0%) | 64.0 |
Fertility by Education by Marriage Status in Jefferson County
13.4% of women with births in Jefferson County are unmarried. Women with the educational attainment of graduate degree are most likely to be married with 100.0% of them married at childbirth, while women with the educational attainment of high school diploma are least likely to be married with 17.8% of them unmarried at childbirth.
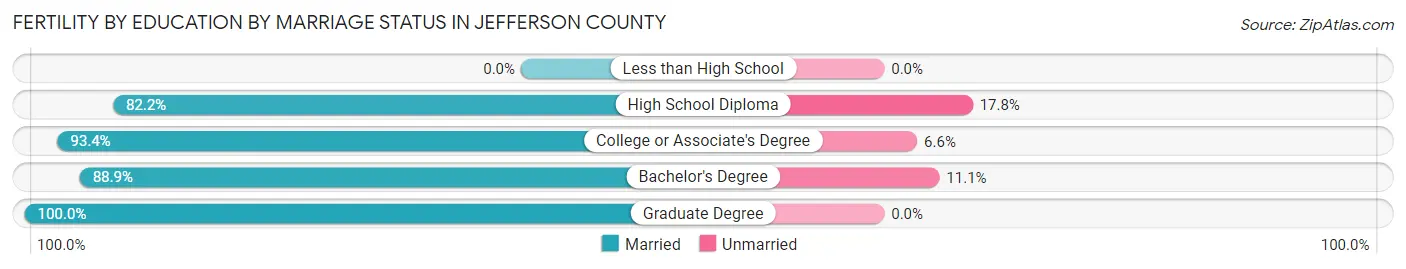
| Educational Attainment | Married | Unmarried |
| Less than High School | 0 (0.0%) | 0 (0.0%) |
| High School Diploma | 203 (82.2%) | 44 (17.8%) |
| College or Associate's Degree | 127 (93.4%) | 9 (6.6%) |
| Bachelor's Degree | 56 (88.9%) | 7 (11.1%) |
| Graduate Degree | 2 (100.0%) | 0 (0.0%) |
| Total | 388 (86.6%) | 60 (13.4%) |
Income in Jefferson County
Income Overview in Jefferson County
Per Capita Income in Jefferson County is $29,028, while median incomes of families and households are $84,941 and $77,491 respectively.
| Characteristic | Number | Measure |
| Per Capita Income | 31,383 | $29,028 |
| Median Family Income | 7,696 | $84,941 |
| Mean Family Income | 7,696 | $99,300 |
| Median Household Income | 9,623 | $77,491 |
| Mean Household Income | 9,623 | $91,003 |
| Income Deficit | 7,696 | $10,320 |
| Wage / Income Gap (%) | 31,383 | 54.28% |
| Wage / Income Gap ($) | 31,383 | 45.72¢ per $1 |
| Gini / Inequality Index | 31,383 | 0.38 |
Earnings by Sex in Jefferson County
Average Earnings in Jefferson County are $34,660, $47,563 for men and $21,748 for women, a difference of 54.3%.
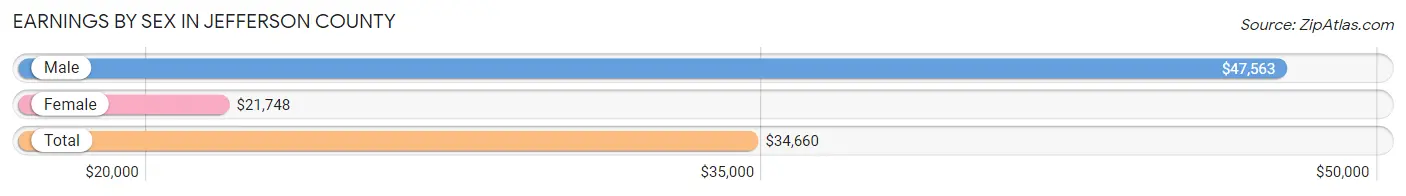
| Sex | Number | Average Earnings |
| Male | 9,347 (58.0%) | $47,563 |
| Female | 6,777 (42.0%) | $21,748 |
| Total | 16,124 (100.0%) | $34,660 |
Earnings by Sex by Income Bracket in Jefferson County
The most common earnings brackets in Jefferson County are $100,000+ for men (1,436 | 15.4%) and $2,499 or less for women (881 | 13.0%).
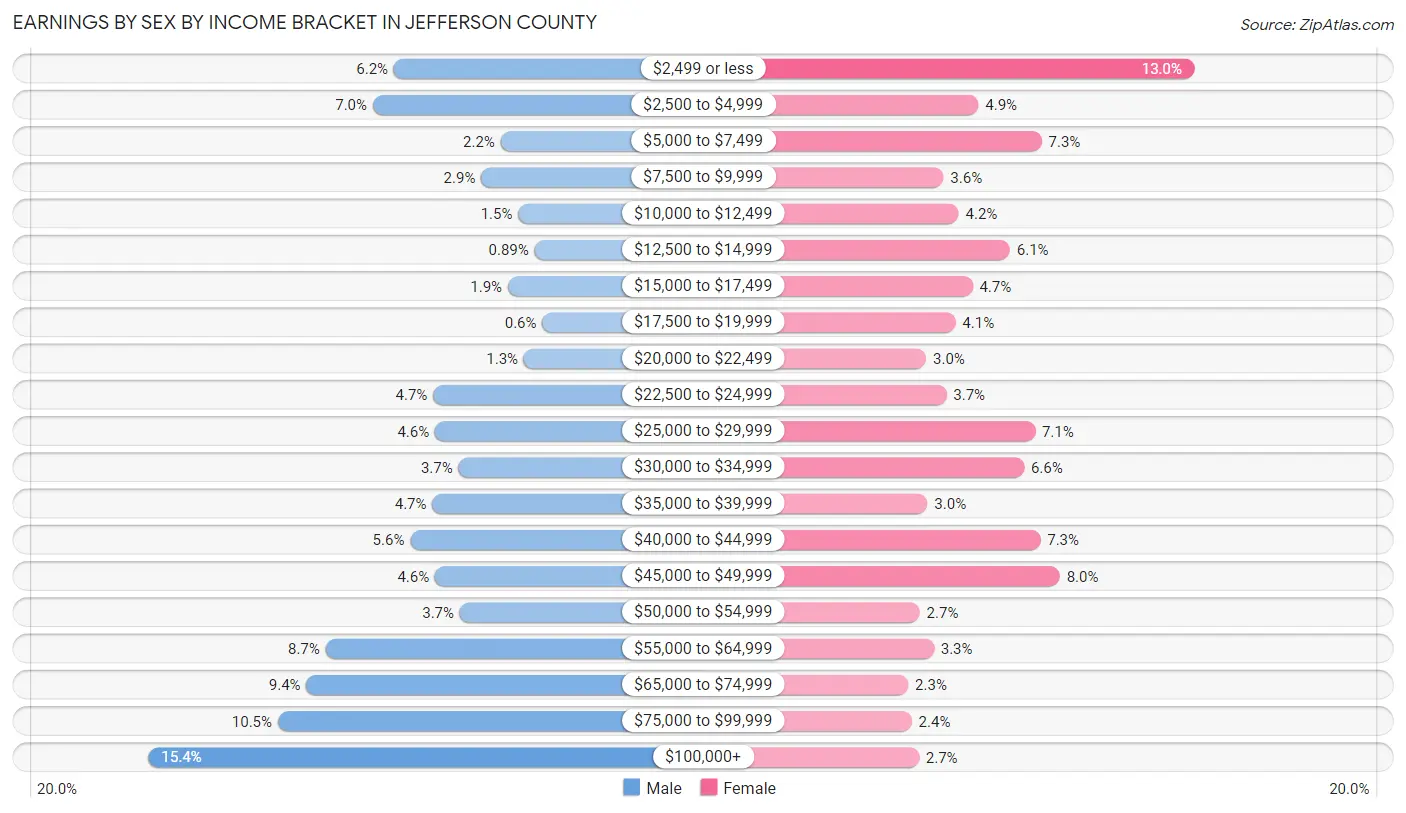
| Income | Male | Female |
| $2,499 or less | 576 (6.2%) | 881 (13.0%) |
| $2,500 to $4,999 | 650 (7.0%) | 334 (4.9%) |
| $5,000 to $7,499 | 202 (2.2%) | 495 (7.3%) |
| $7,500 to $9,999 | 270 (2.9%) | 245 (3.6%) |
| $10,000 to $12,499 | 140 (1.5%) | 284 (4.2%) |
| $12,500 to $14,999 | 83 (0.9%) | 414 (6.1%) |
| $15,000 to $17,499 | 177 (1.9%) | 319 (4.7%) |
| $17,500 to $19,999 | 56 (0.6%) | 276 (4.1%) |
| $20,000 to $22,499 | 121 (1.3%) | 201 (3.0%) |
| $22,500 to $24,999 | 438 (4.7%) | 253 (3.7%) |
| $25,000 to $29,999 | 432 (4.6%) | 478 (7.0%) |
| $30,000 to $34,999 | 350 (3.7%) | 450 (6.6%) |
| $35,000 to $39,999 | 441 (4.7%) | 205 (3.0%) |
| $40,000 to $44,999 | 519 (5.6%) | 491 (7.2%) |
| $45,000 to $49,999 | 432 (4.6%) | 541 (8.0%) |
| $50,000 to $54,999 | 345 (3.7%) | 185 (2.7%) |
| $55,000 to $64,999 | 815 (8.7%) | 221 (3.3%) |
| $65,000 to $74,999 | 882 (9.4%) | 156 (2.3%) |
| $75,000 to $99,999 | 982 (10.5%) | 165 (2.4%) |
| $100,000+ | 1,436 (15.4%) | 183 (2.7%) |
| Total | 9,347 (100.0%) | 6,777 (100.0%) |
Earnings by Sex by Educational Attainment in Jefferson County
Average earnings in Jefferson County are $58,924 for men and $27,912 for women, a difference of 52.6%. Men with an educational attainment of graduate degree enjoy the highest average annual earnings of $70,142, while those with high school diploma education earn the least with $45,729. Women with an educational attainment of graduate degree earn the most with the average annual earnings of $46,447, while those with less than high school education have the smallest earnings of $15,846.
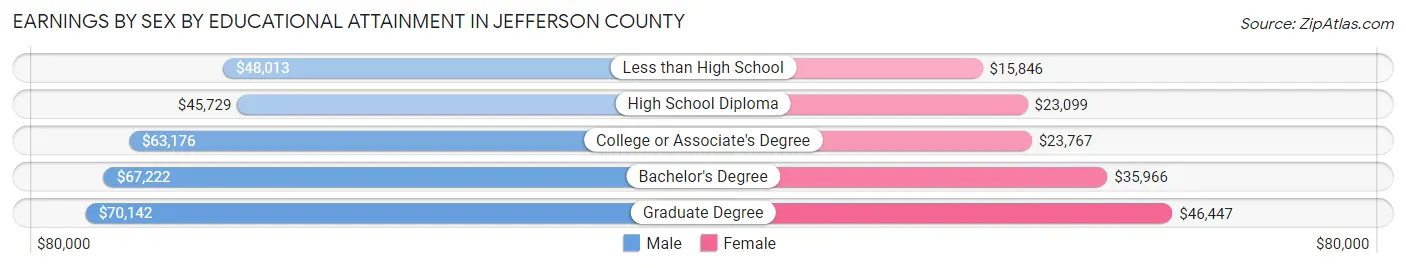
| Educational Attainment | Male Income | Female Income |
| Less than High School | $48,013 | $15,846 |
| High School Diploma | $45,729 | $23,099 |
| College or Associate's Degree | $63,176 | $23,767 |
| Bachelor's Degree | $67,222 | $35,966 |
| Graduate Degree | $70,142 | $46,447 |
| Total | $58,924 | $27,912 |
Family Income in Jefferson County
Family Income Brackets in Jefferson County
According to the Jefferson County family income data, there are 1,901 families falling into the $100,000 to $149,999 income range, which is the most common income bracket and makes up 24.7% of all families. Conversely, the $10,000 to $14,999 income bracket is the least frequent group with only 62 families (0.8%) belonging to this category.
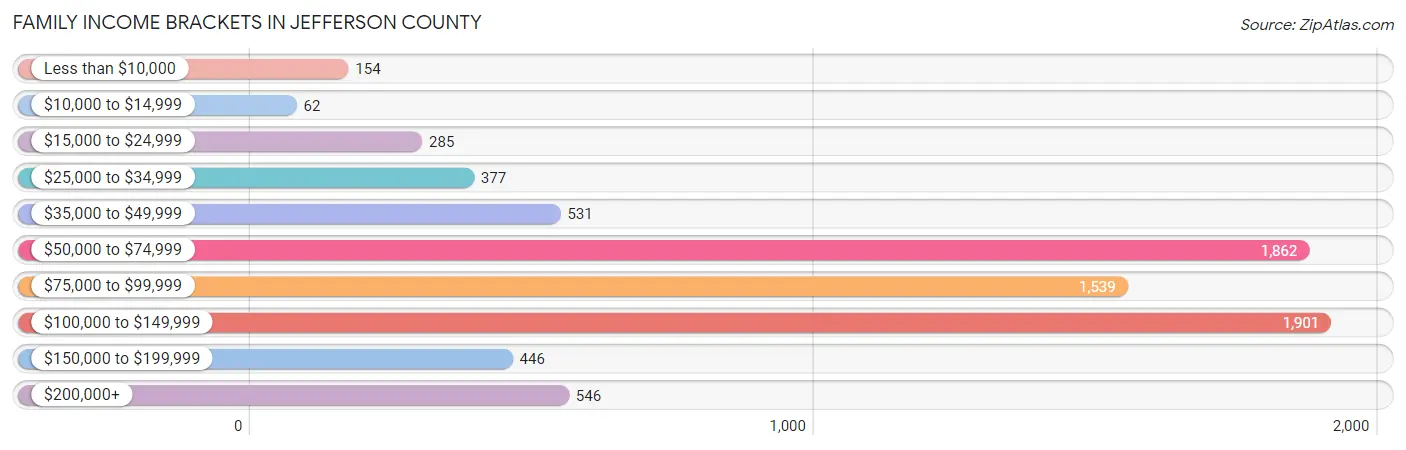
| Income Bracket | # Families | % Families |
| Less than $10,000 | 154 | 2.0% |
| $10,000 to $14,999 | 62 | 0.8% |
| $15,000 to $24,999 | 285 | 3.7% |
| $25,000 to $34,999 | 377 | 4.9% |
| $35,000 to $49,999 | 531 | 6.9% |
| $50,000 to $74,999 | 1,862 | 24.2% |
| $75,000 to $99,999 | 1,539 | 20.0% |
| $100,000 to $149,999 | 1,901 | 24.7% |
| $150,000 to $199,999 | 446 | 5.8% |
| $200,000+ | 546 | 7.1% |
Family Income by Famaliy Size in Jefferson County
3-person families (1,281 | 16.7%) account for the highest median family income in Jefferson County with $102,210 per family, while 2-person families (3,036 | 39.5%) have the highest median income of $37,601 per family member.
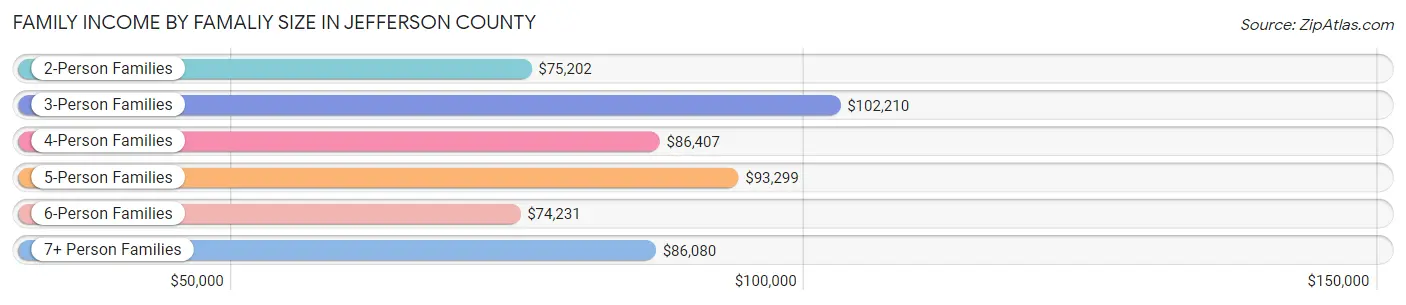
| Income Bracket | # Families | Median Income |
| 2-Person Families | 3,036 (39.5%) | $75,202 |
| 3-Person Families | 1,281 (16.7%) | $102,210 |
| 4-Person Families | 1,349 (17.5%) | $86,407 |
| 5-Person Families | 953 (12.4%) | $93,299 |
| 6-Person Families | 612 (8.0%) | $74,231 |
| 7+ Person Families | 465 (6.0%) | $86,080 |
| Total | 7,696 (100.0%) | $84,941 |
Family Income by Number of Earners in Jefferson County
The median family income in Jefferson County is $84,941, with families comprising 3+ earners (1,388) having the highest median family income of $115,906, while families with no earners (801) have the lowest median family income of $61,587, accounting for 18.0% and 10.4% of families, respectively.
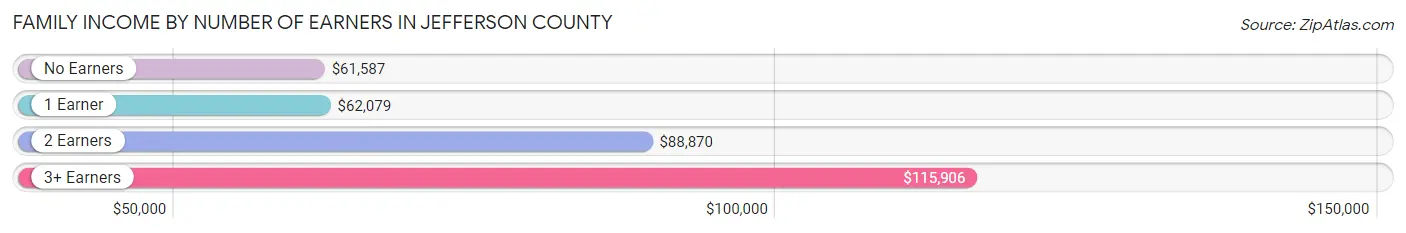
| Number of Earners | # Families | Median Income |
| No Earners | 801 (10.4%) | $61,587 |
| 1 Earner | 2,168 (28.2%) | $62,079 |
| 2 Earners | 3,339 (43.4%) | $88,870 |
| 3+ Earners | 1,388 (18.0%) | $115,906 |
| Total | 7,696 (100.0%) | $84,941 |
Household Income in Jefferson County
Household Income Brackets in Jefferson County
With 2,117 households falling in the category, the $50,000 to $74,999 income range is the most frequent in Jefferson County, accounting for 22.0% of all households. In contrast, only 192 households (2.0%) fall into the $10,000 to $14,999 income bracket, making it the least populous group.
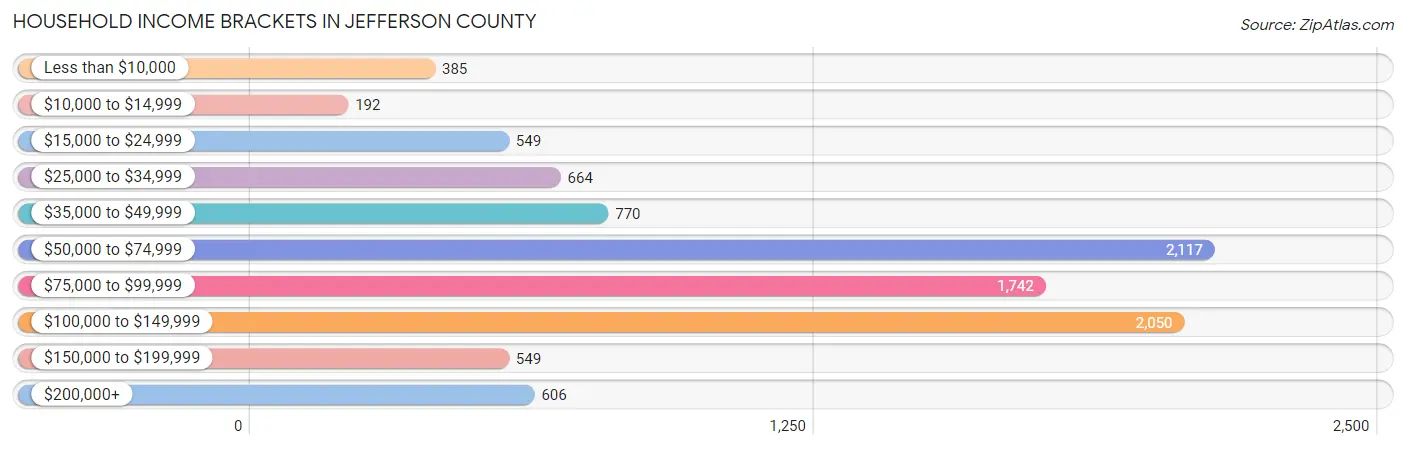
| Income Bracket | # Households | % Households |
| Less than $10,000 | 385 | 4.0% |
| $10,000 to $14,999 | 192 | 2.0% |
| $15,000 to $24,999 | 549 | 5.7% |
| $25,000 to $34,999 | 664 | 6.9% |
| $35,000 to $49,999 | 770 | 8.0% |
| $50,000 to $74,999 | 2,117 | 22.0% |
| $75,000 to $99,999 | 1,742 | 18.1% |
| $100,000 to $149,999 | 2,050 | 21.3% |
| $150,000 to $199,999 | 549 | 5.7% |
| $200,000+ | 606 | 6.3% |
Household Income by Householder Age in Jefferson County
The median household income in Jefferson County is $77,491, with the highest median household income of $95,625 found in the 45 to 64 years age bracket for the primary householder. A total of 3,430 households (35.6%) fall into this category. Meanwhile, the 65+ years age bracket for the primary householder has the lowest median household income of $55,000, with 2,200 households (22.9%) in this group.
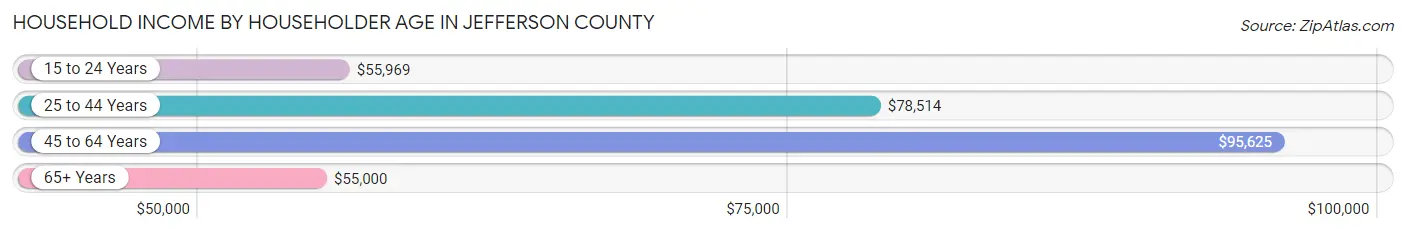
| Income Bracket | # Households | Median Income |
| 15 to 24 Years | 372 (3.9%) | $55,969 |
| 25 to 44 Years | 3,621 (37.6%) | $78,514 |
| 45 to 64 Years | 3,430 (35.6%) | $95,625 |
| 65+ Years | 2,200 (22.9%) | $55,000 |
| Total | 9,623 (100.0%) | $77,491 |
Poverty in Jefferson County
Income Below Poverty by Sex and Age in Jefferson County
With 8.3% poverty level for males and 9.6% for females among the residents of Jefferson County, under 5 year old males and 5 year old females are the most vulnerable to poverty, with 264 males (21.3%) and 90 females (41.3%) in their respective age groups living below the poverty level.
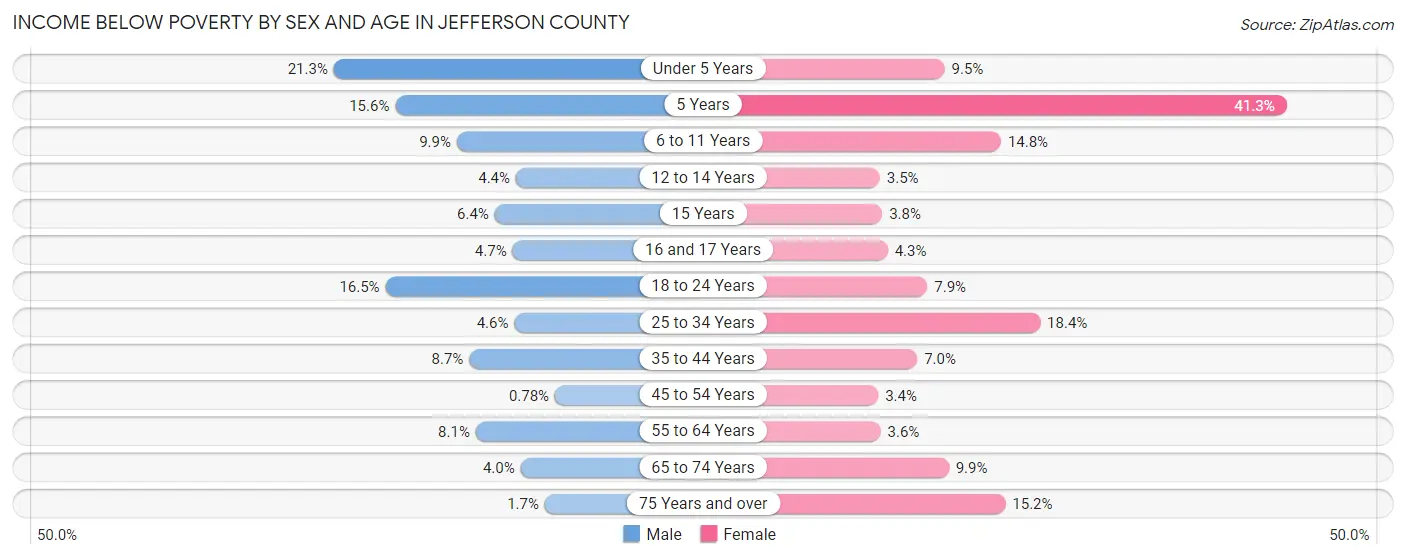
| Age Bracket | Male | Female |
| Under 5 Years | 264 (21.3%) | 114 (9.5%) |
| 5 Years | 39 (15.6%) | 90 (41.3%) |
| 6 to 11 Years | 187 (9.9%) | 285 (14.8%) |
| 12 to 14 Years | 43 (4.4%) | 31 (3.5%) |
| 15 Years | 16 (6.4%) | 12 (3.7%) |
| 16 and 17 Years | 34 (4.7%) | 25 (4.3%) |
| 18 to 24 Years | 266 (16.5%) | 97 (7.9%) |
| 25 to 34 Years | 80 (4.5%) | 333 (18.4%) |
| 35 to 44 Years | 190 (8.7%) | 145 (7.0%) |
| 45 to 54 Years | 13 (0.8%) | 57 (3.4%) |
| 55 to 64 Years | 140 (8.1%) | 55 (3.6%) |
| 65 to 74 Years | 45 (4.0%) | 118 (9.9%) |
| 75 Years and over | 10 (1.7%) | 102 (15.2%) |
| Total | 1,327 (8.3%) | 1,464 (9.6%) |
Income Above Poverty by Sex and Age in Jefferson County
According to the poverty statistics in Jefferson County, males aged 45 to 54 years and females aged 45 to 54 years are the age groups that are most secure financially, with 99.2% of males and 96.6% of females in these age groups living above the poverty line.
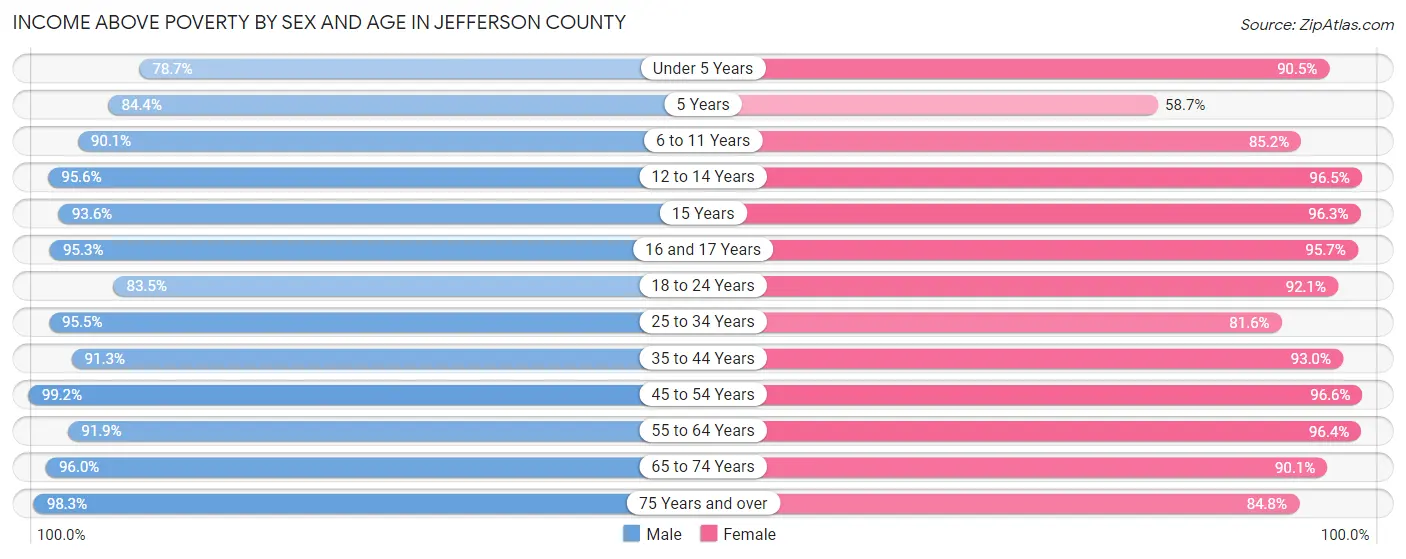
| Age Bracket | Male | Female |
| Under 5 Years | 975 (78.7%) | 1,081 (90.5%) |
| 5 Years | 211 (84.4%) | 128 (58.7%) |
| 6 to 11 Years | 1,704 (90.1%) | 1,645 (85.2%) |
| 12 to 14 Years | 932 (95.6%) | 848 (96.5%) |
| 15 Years | 235 (93.6%) | 308 (96.3%) |
| 16 and 17 Years | 687 (95.3%) | 562 (95.7%) |
| 18 to 24 Years | 1,345 (83.5%) | 1,124 (92.1%) |
| 25 to 34 Years | 1,678 (95.5%) | 1,476 (81.6%) |
| 35 to 44 Years | 1,984 (91.3%) | 1,927 (93.0%) |
| 45 to 54 Years | 1,655 (99.2%) | 1,628 (96.6%) |
| 55 to 64 Years | 1,581 (91.9%) | 1,473 (96.4%) |
| 65 to 74 Years | 1,089 (96.0%) | 1,072 (90.1%) |
| 75 Years and over | 572 (98.3%) | 570 (84.8%) |
| Total | 14,648 (91.7%) | 13,842 (90.4%) |
Income Below Poverty Among Married-Couple Families in Jefferson County
The poverty statistics for married-couple families in Jefferson County show that 4.7% or 320 of the total 6,826 families live below the poverty line. Families with 3 or 4 children have the highest poverty rate of 12.4%, comprising of 145 families. On the other hand, families with no children have the lowest poverty rate of 2.1%, which includes 67 families.
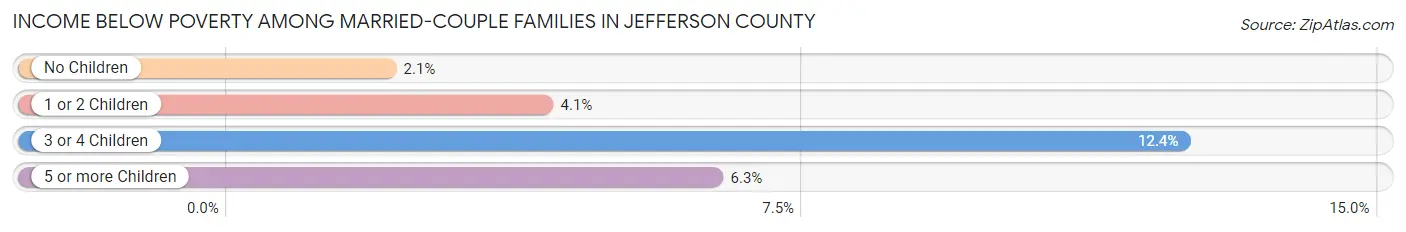
| Children | Above Poverty | Below Poverty |
| No Children | 3,166 (97.9%) | 67 (2.1%) |
| 1 or 2 Children | 1,978 (95.9%) | 85 (4.1%) |
| 3 or 4 Children | 1,022 (87.6%) | 145 (12.4%) |
| 5 or more Children | 340 (93.7%) | 23 (6.3%) |
| Total | 6,506 (95.3%) | 320 (4.7%) |
Income Below Poverty Among Single-Parent Households in Jefferson County
According to the poverty data in Jefferson County, 5.7% or 14 single-father households and 28.5% or 178 single-mother households are living below the poverty line. Among single-father households, those with 1 or 2 children have the highest poverty rate, with 14 households (9.9%) experiencing poverty. Likewise, among single-mother households, those with 3 or 4 children have the highest poverty rate, with 72 households (80.0%) falling below the poverty line.
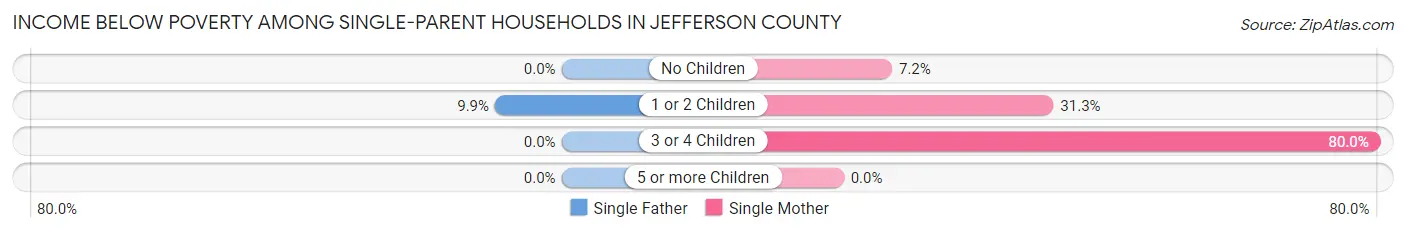
| Children | Single Father | Single Mother |
| No Children | 0 (0.0%) | 16 (7.2%) |
| 1 or 2 Children | 14 (9.9%) | 90 (31.2%) |
| 3 or 4 Children | 0 (0.0%) | 72 (80.0%) |
| 5 or more Children | 0 (0.0%) | 0 (0.0%) |
| Total | 14 (5.7%) | 178 (28.5%) |
Income Below Poverty Among Married-Couple vs Single-Parent Households in Jefferson County
The poverty data for Jefferson County shows that 320 of the married-couple family households (4.7%) and 192 of the single-parent households (22.1%) are living below the poverty level. Within the married-couple family households, those with 3 or 4 children have the highest poverty rate, with 145 households (12.4%) falling below the poverty line. Among the single-parent households, those with 3 or 4 children have the highest poverty rate, with 72 household (52.5%) living below poverty.
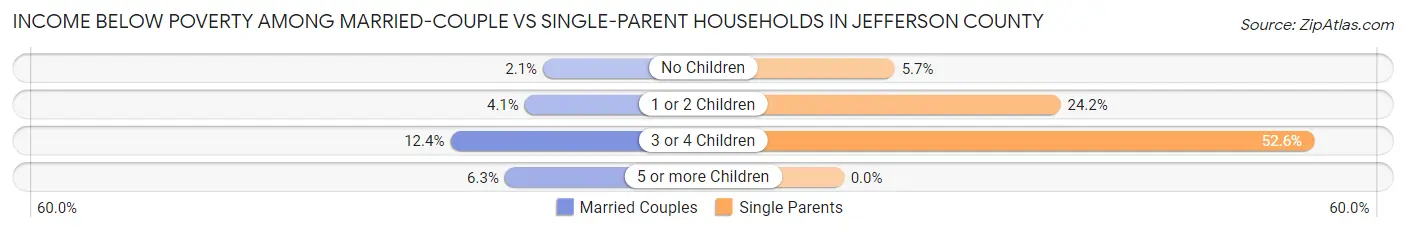
| Children | Married-Couple Families | Single-Parent Households |
| No Children | 67 (2.1%) | 16 (5.7%) |
| 1 or 2 Children | 85 (4.1%) | 104 (24.2%) |
| 3 or 4 Children | 145 (12.4%) | 72 (52.5%) |
| 5 or more Children | 23 (6.3%) | 0 (0.0%) |
| Total | 320 (4.7%) | 192 (22.1%) |
Employment Characteristics in Jefferson County
Employment by Class of Employer in Jefferson County
Among the 14,151 employed individuals in Jefferson County, private company employees (8,625 | 61.0%), local government employees (1,495 | 10.6%), and self-employed (not incorporated) (1,119 | 7.9%) make up the most common classes of employment.
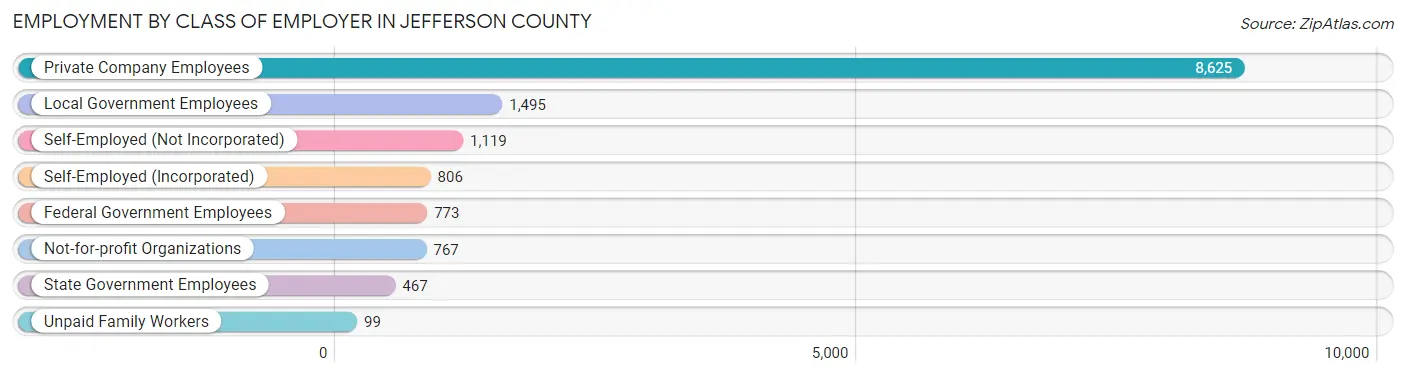
| Employer Class | # Employees | % Employees |
| Private Company Employees | 8,625 | 61.0% |
| Self-Employed (Incorporated) | 806 | 5.7% |
| Self-Employed (Not Incorporated) | 1,119 | 7.9% |
| Not-for-profit Organizations | 767 | 5.4% |
| Local Government Employees | 1,495 | 10.6% |
| State Government Employees | 467 | 3.3% |
| Federal Government Employees | 773 | 5.5% |
| Unpaid Family Workers | 99 | 0.7% |
| Total | 14,151 | 100.0% |
Employment Status by Age in Jefferson County
According to the labor force statistics for Jefferson County, out of the total population over 16 years of age (22,212), 66.4% or 14,749 individuals are in the labor force, with 2.4% or 354 of them unemployed. The age group with the highest labor force participation rate is 45 to 54 years, with 87.6% or 2,942 individuals in the labor force. Within the labor force, the 65 to 74 years age range has the highest percentage of unemployed individuals, with 7.2% or 46 of them being unemployed.
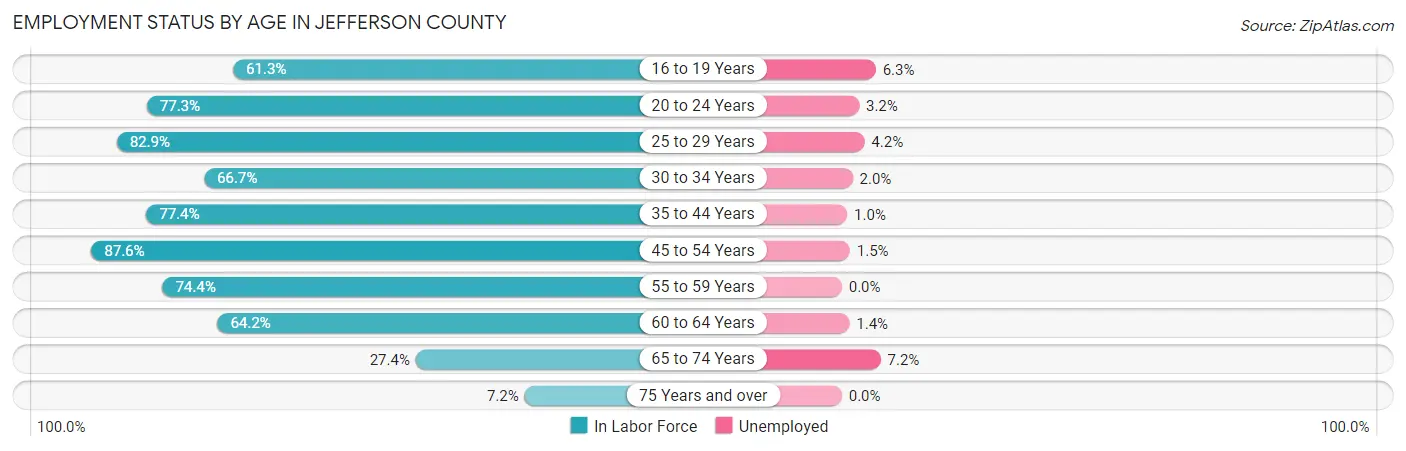
| Age Bracket | In Labor Force | Unemployed |
| 16 to 19 Years | 1,281 (61.3%) | 81 (6.3%) |
| 20 to 24 Years | 1,585 (77.3%) | 51 (3.2%) |
| 25 to 29 Years | 1,400 (82.9%) | 59 (4.2%) |
| 30 to 34 Years | 1,270 (66.7%) | 25 (2.0%) |
| 35 to 44 Years | 3,307 (77.4%) | 33 (1.0%) |
| 45 to 54 Years | 2,942 (87.6%) | 44 (1.5%) |
| 55 to 59 Years | 1,074 (74.4%) | 0 (0.0%) |
| 60 to 64 Years | 1,162 (64.2%) | 16 (1.4%) |
| 65 to 74 Years | 637 (27.4%) | 46 (7.2%) |
| 75 Years and over | 91 (7.2%) | 0 (0.0%) |
| Total | 14,749 (66.4%) | 354 (2.4%) |
Employment Status by Educational Attainment in Jefferson County
According to labor force statistics for Jefferson County, 77.1% of individuals (11,163) out of the total population between 25 and 64 years of age (14,478) are in the labor force, with 1.6% or 179 of them being unemployed. The group with the highest labor force participation rate are those with the educational attainment of bachelor's degree or higher, with 83.2% or 3,274 individuals in the labor force. Within the labor force, individuals with high school diploma education have the highest percentage of unemployment, with 3.7% or 101 of them being unemployed.
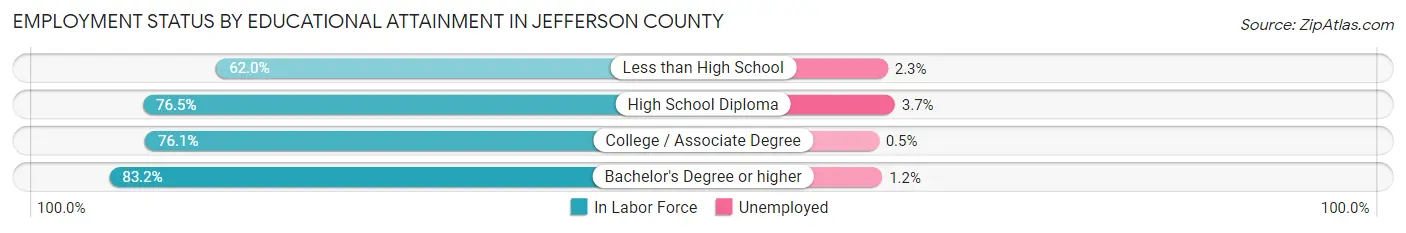
| Educational Attainment | In Labor Force | Unemployed |
| Less than High School | 682 (62.0%) | 25 (2.3%) |
| High School Diploma | 2,723 (76.5%) | 132 (3.7%) |
| College / Associate Degree | 4,477 (76.1%) | 29 (0.5%) |
| Bachelor's Degree or higher | 3,274 (83.2%) | 47 (1.2%) |
| Total | 11,163 (77.1%) | 232 (1.6%) |
Employment Occupations by Sex in Jefferson County
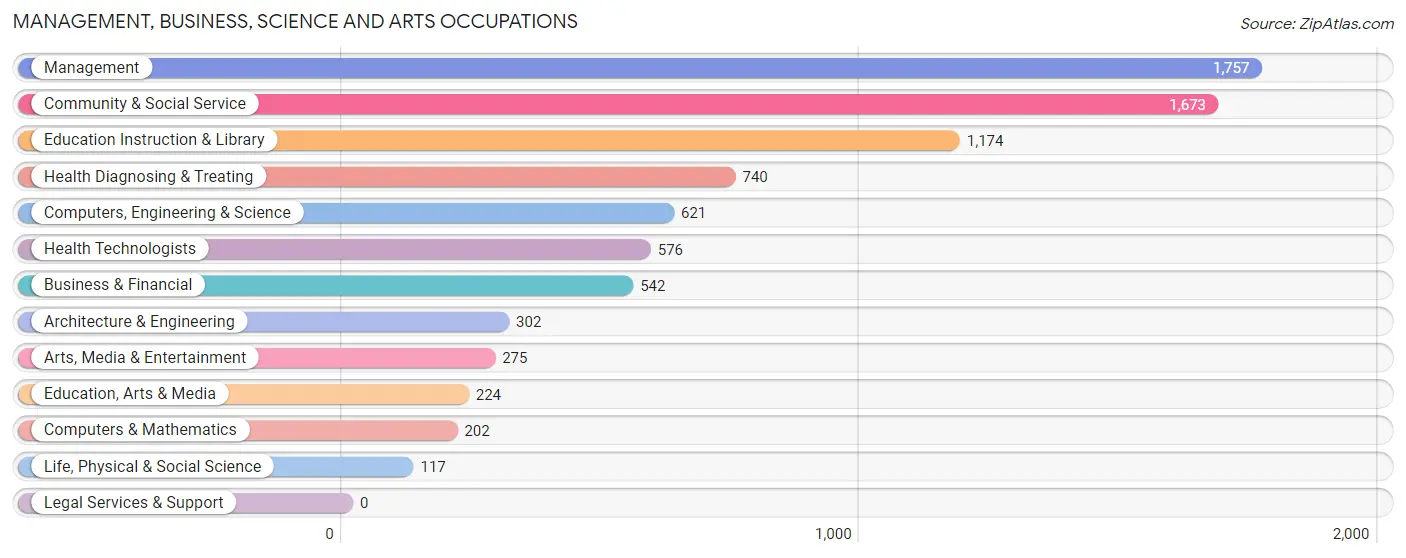
Management, Business, Science and Arts Occupations
The most common Management, Business, Science and Arts occupations in Jefferson County are Management (1,757 | 12.2%), Community & Social Service (1,673 | 11.6%), Education Instruction & Library (1,174 | 8.2%), Health Diagnosing & Treating (740 | 5.1%), and Computers, Engineering & Science (621 | 4.3%).
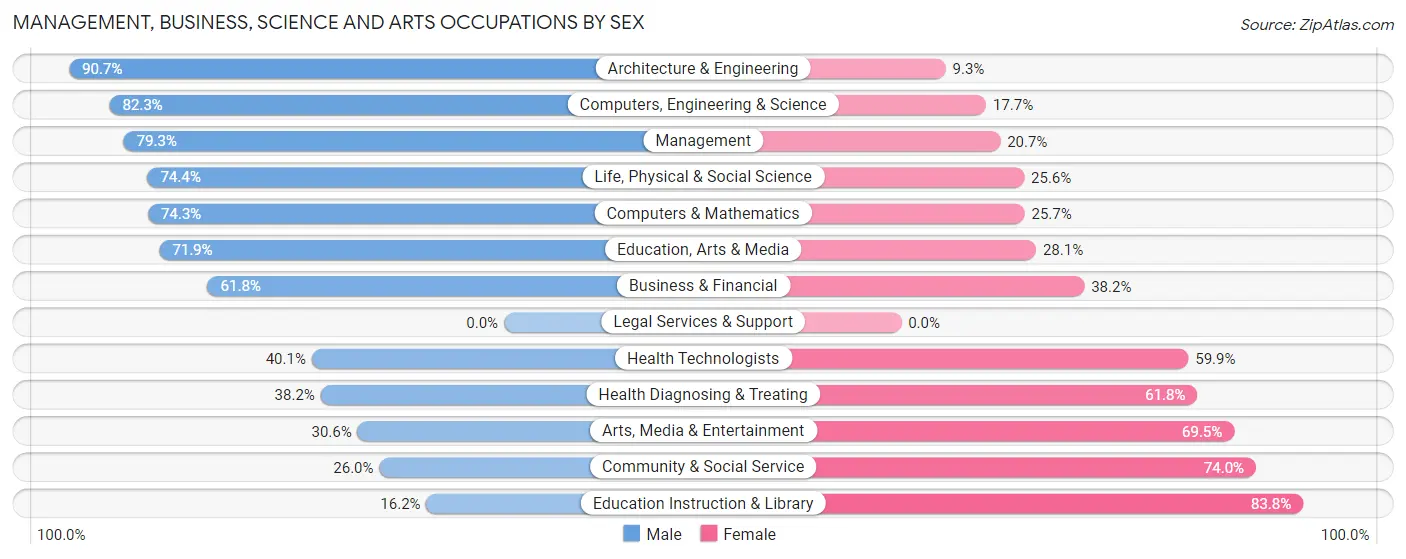
Management, Business, Science and Arts Occupations by Sex
Within the Management, Business, Science and Arts occupations in Jefferson County, the most male-oriented occupations are Architecture & Engineering (90.7%), Computers, Engineering & Science (82.3%), and Management (79.3%), while the most female-oriented occupations are Education Instruction & Library (83.8%), Community & Social Service (74.0%), and Arts, Media & Entertainment (69.5%).
| Occupation | Male | Female |
| Management | 1,394 (79.3%) | 363 (20.7%) |
| Business & Financial | 335 (61.8%) | 207 (38.2%) |
| Computers, Engineering & Science | 511 (82.3%) | 110 (17.7%) |
| Computers & Mathematics | 150 (74.3%) | 52 (25.7%) |
| Architecture & Engineering | 274 (90.7%) | 28 (9.3%) |
| Life, Physical & Social Science | 87 (74.4%) | 30 (25.6%) |
| Community & Social Service | 435 (26.0%) | 1,238 (74.0%) |
| Education, Arts & Media | 161 (71.9%) | 63 (28.1%) |
| Legal Services & Support | 0 (0.0%) | 0 (0.0%) |
| Education Instruction & Library | 190 (16.2%) | 984 (83.8%) |
| Arts, Media & Entertainment | 84 (30.5%) | 191 (69.5%) |
| Health Diagnosing & Treating | 283 (38.2%) | 457 (61.8%) |
| Health Technologists | 231 (40.1%) | 345 (59.9%) |
| Total (Category) | 2,958 (55.5%) | 2,375 (44.5%) |
| Total (Overall) | 8,760 (60.8%) | 5,640 (39.2%) |
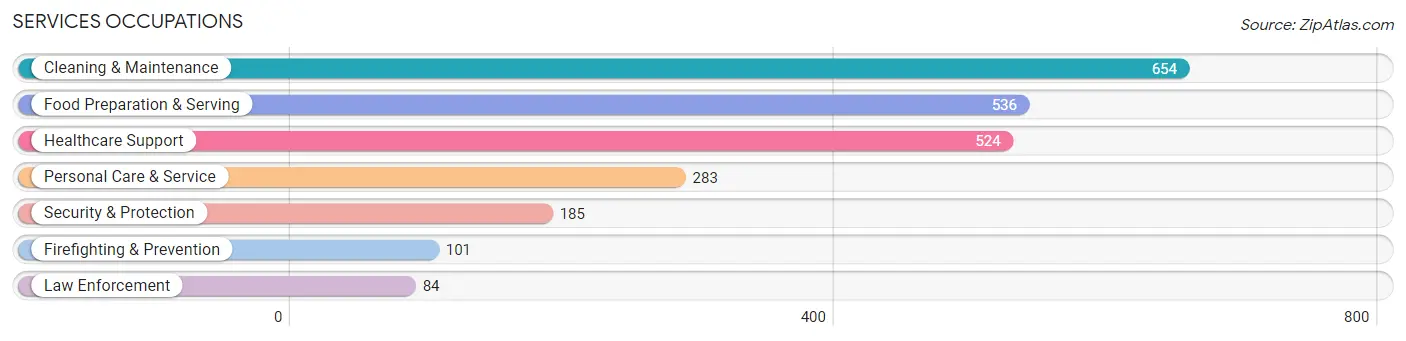
Services Occupations
The most common Services occupations in Jefferson County are Cleaning & Maintenance (654 | 4.5%), Food Preparation & Serving (536 | 3.7%), Healthcare Support (524 | 3.6%), Personal Care & Service (283 | 2.0%), and Security & Protection (185 | 1.3%).
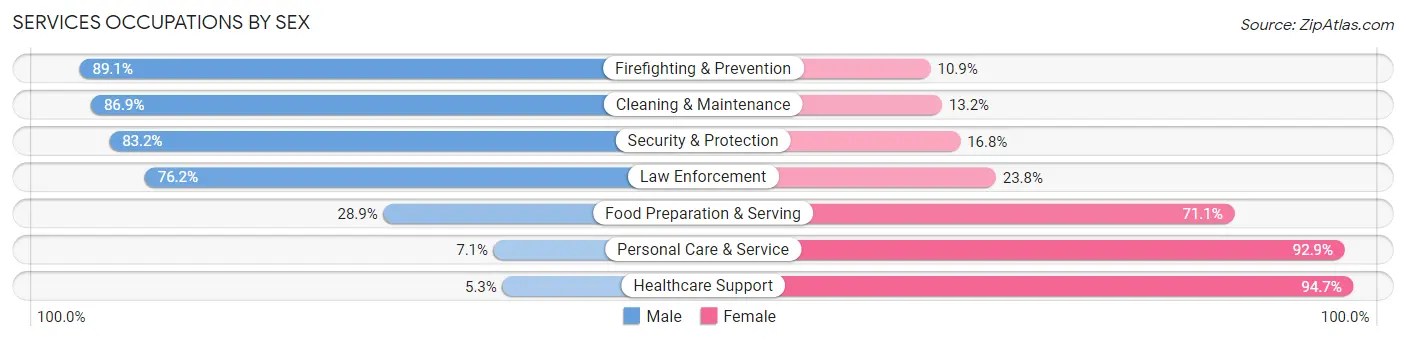
Services Occupations by Sex
Within the Services occupations in Jefferson County, the most male-oriented occupations are Firefighting & Prevention (89.1%), Cleaning & Maintenance (86.9%), and Security & Protection (83.2%), while the most female-oriented occupations are Healthcare Support (94.7%), Personal Care & Service (92.9%), and Food Preparation & Serving (71.1%).
| Occupation | Male | Female |
| Healthcare Support | 28 (5.3%) | 496 (94.7%) |
| Security & Protection | 154 (83.2%) | 31 (16.8%) |
| Firefighting & Prevention | 90 (89.1%) | 11 (10.9%) |
| Law Enforcement | 64 (76.2%) | 20 (23.8%) |
| Food Preparation & Serving | 155 (28.9%) | 381 (71.1%) |
| Cleaning & Maintenance | 568 (86.9%) | 86 (13.2%) |
| Personal Care & Service | 20 (7.1%) | 263 (92.9%) |
| Total (Category) | 925 (42.4%) | 1,257 (57.6%) |
| Total (Overall) | 8,760 (60.8%) | 5,640 (39.2%) |
Sales and Office Occupations
The most common Sales and Office occupations in Jefferson County are Sales & Related (1,296 | 9.0%), and Office & Administration (1,287 | 8.9%).

Sales and Office Occupations by Sex
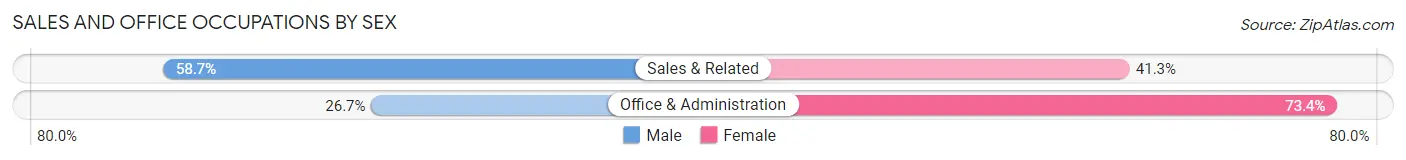
| Occupation | Male | Female |
| Sales & Related | 761 (58.7%) | 535 (41.3%) |
| Office & Administration | 343 (26.7%) | 944 (73.4%) |
| Total (Category) | 1,104 (42.7%) | 1,479 (57.3%) |
| Total (Overall) | 8,760 (60.8%) | 5,640 (39.2%) |
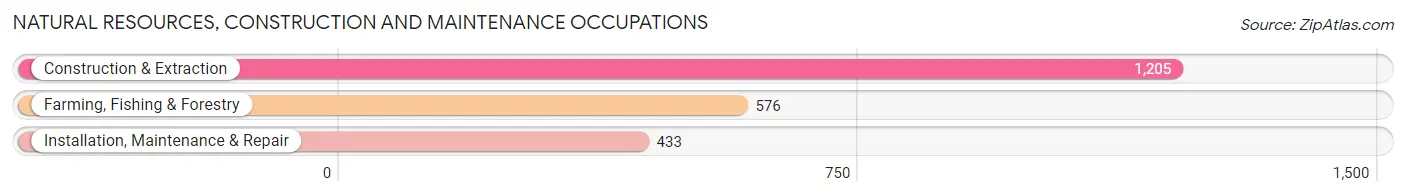
Natural Resources, Construction and Maintenance Occupations
The most common Natural Resources, Construction and Maintenance occupations in Jefferson County are Construction & Extraction (1,205 | 8.4%), Farming, Fishing & Forestry (576 | 4.0%), and Installation, Maintenance & Repair (433 | 3.0%).
Natural Resources, Construction and Maintenance Occupations by Sex
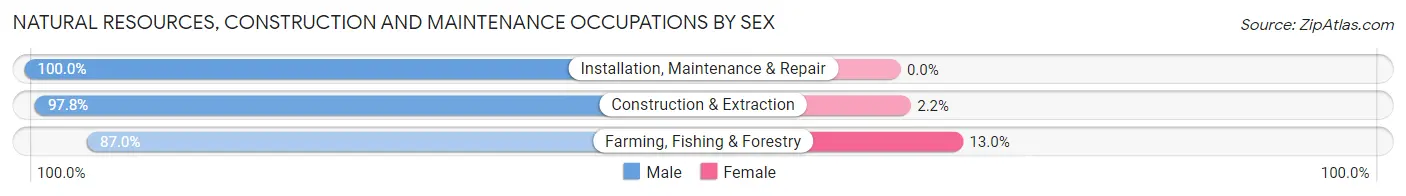
| Occupation | Male | Female |
| Farming, Fishing & Forestry | 501 (87.0%) | 75 (13.0%) |
| Construction & Extraction | 1,179 (97.8%) | 26 (2.2%) |
| Installation, Maintenance & Repair | 433 (100.0%) | 0 (0.0%) |
| Total (Category) | 2,113 (95.4%) | 101 (4.6%) |
| Total (Overall) | 8,760 (60.8%) | 5,640 (39.2%) |
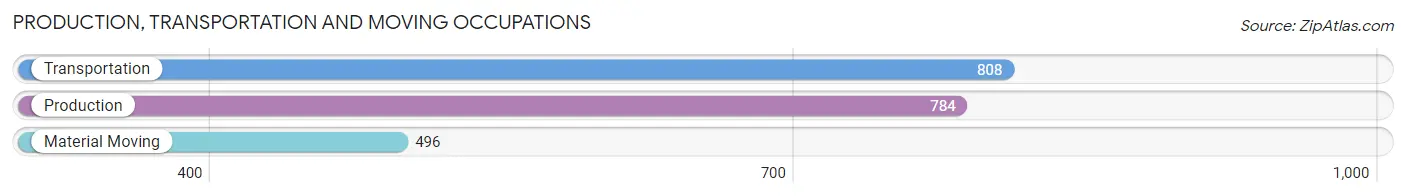
Production, Transportation and Moving Occupations
The most common Production, Transportation and Moving occupations in Jefferson County are Transportation (808 | 5.6%), Production (784 | 5.4%), and Material Moving (496 | 3.4%).
Production, Transportation and Moving Occupations by Sex
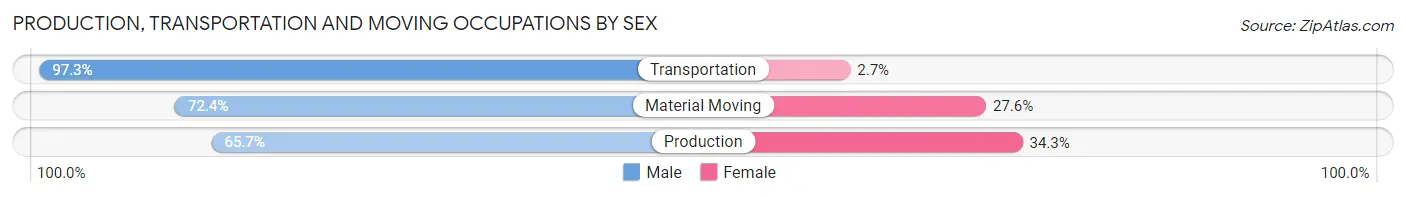
| Occupation | Male | Female |
| Production | 515 (65.7%) | 269 (34.3%) |
| Transportation | 786 (97.3%) | 22 (2.7%) |
| Material Moving | 359 (72.4%) | 137 (27.6%) |
| Total (Category) | 1,660 (79.5%) | 428 (20.5%) |
| Total (Overall) | 8,760 (60.8%) | 5,640 (39.2%) |
Employment Industries by Sex in Jefferson County
Employment Industries in Jefferson County
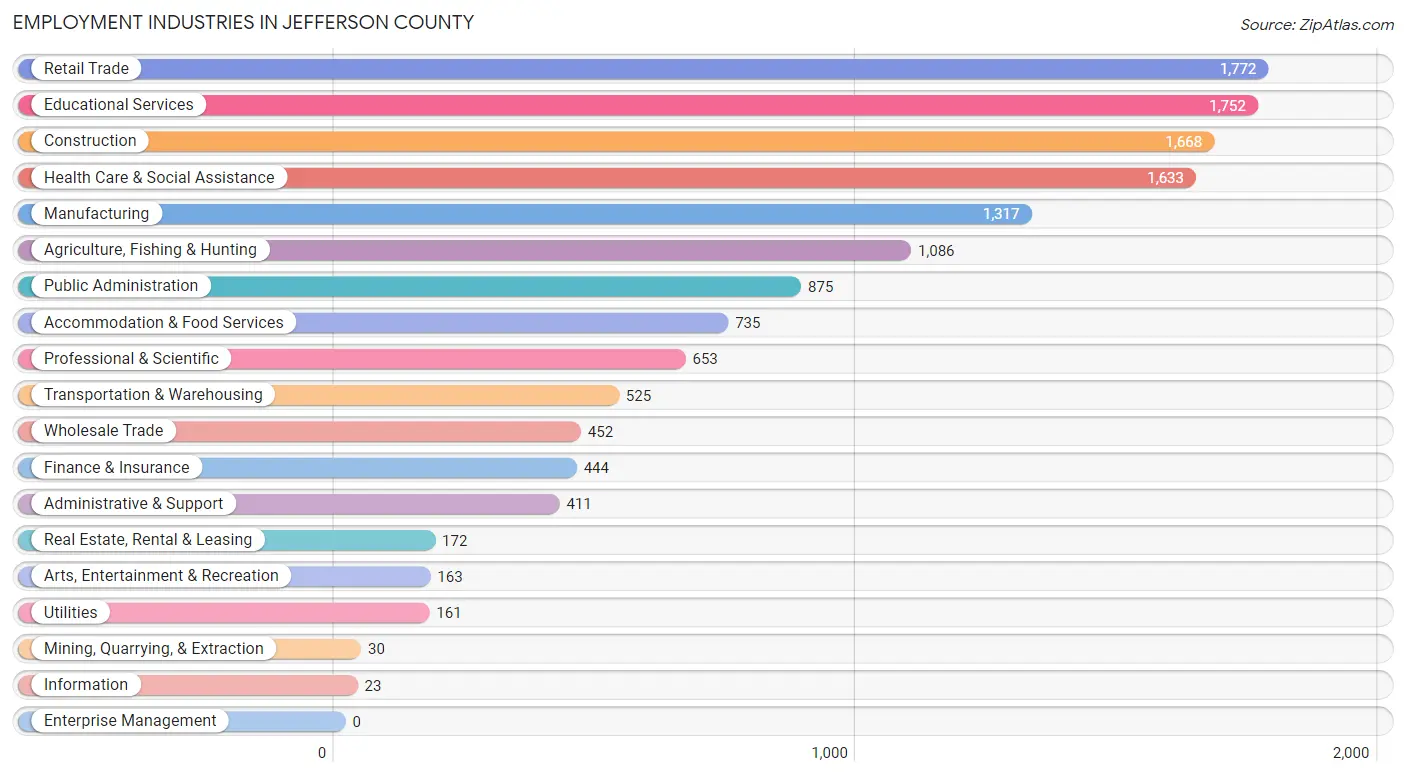
The major employment industries in Jefferson County include Retail Trade (1,772 | 12.3%), Educational Services (1,752 | 12.2%), Construction (1,668 | 11.6%), Health Care & Social Assistance (1,633 | 11.3%), and Manufacturing (1,317 | 9.1%).
Employment Industries by Sex in Jefferson County
The Jefferson County industries that see more men than women are Mining, Quarrying, & Extraction (100.0%), Wholesale Trade (94.3%), and Agriculture, Fishing & Hunting (91.3%), whereas the industries that tend to have a higher number of women are Information (100.0%), Health Care & Social Assistance (75.3%), and Educational Services (73.0%).
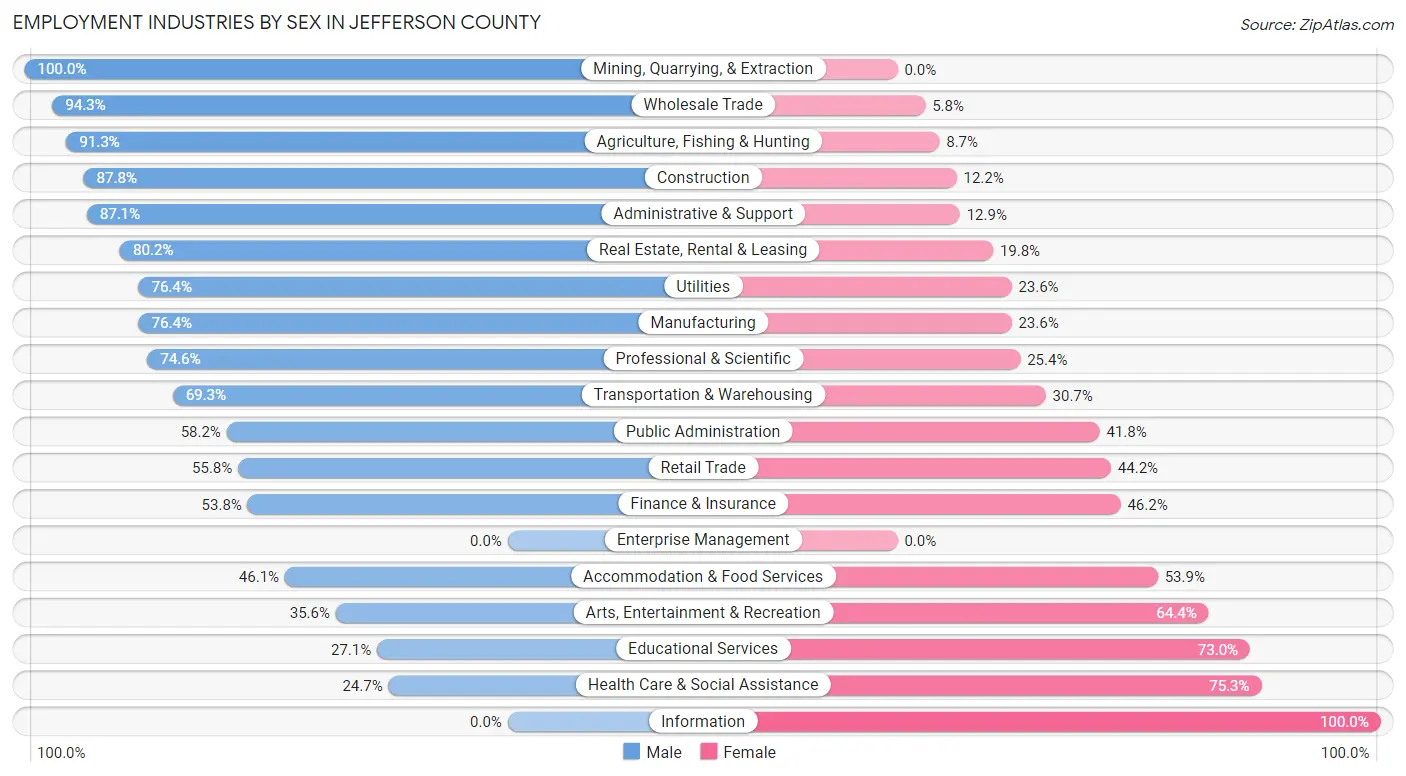
| Industry | Male | Female |
| Agriculture, Fishing & Hunting | 992 (91.3%) | 94 (8.7%) |
| Mining, Quarrying, & Extraction | 30 (100.0%) | 0 (0.0%) |
| Construction | 1,464 (87.8%) | 204 (12.2%) |
| Manufacturing | 1,006 (76.4%) | 311 (23.6%) |
| Wholesale Trade | 426 (94.3%) | 26 (5.8%) |
| Retail Trade | 989 (55.8%) | 783 (44.2%) |
| Transportation & Warehousing | 364 (69.3%) | 161 (30.7%) |
| Utilities | 123 (76.4%) | 38 (23.6%) |
| Information | 0 (0.0%) | 23 (100.0%) |
| Finance & Insurance | 239 (53.8%) | 205 (46.2%) |
| Real Estate, Rental & Leasing | 138 (80.2%) | 34 (19.8%) |
| Professional & Scientific | 487 (74.6%) | 166 (25.4%) |
| Enterprise Management | 0 (0.0%) | 0 (0.0%) |
| Administrative & Support | 358 (87.1%) | 53 (12.9%) |
| Educational Services | 474 (27.1%) | 1,278 (73.0%) |
| Health Care & Social Assistance | 403 (24.7%) | 1,230 (75.3%) |
| Arts, Entertainment & Recreation | 58 (35.6%) | 105 (64.4%) |
| Accommodation & Food Services | 339 (46.1%) | 396 (53.9%) |
| Public Administration | 509 (58.2%) | 366 (41.8%) |
| Total | 8,760 (60.8%) | 5,640 (39.2%) |
Education in Jefferson County
School Enrollment in Jefferson County
The most common levels of schooling among the 10,141 students in Jefferson County are middle school (2,652 | 26.2%), high school (2,380 | 23.5%), and elementary school (2,310 | 22.8%).
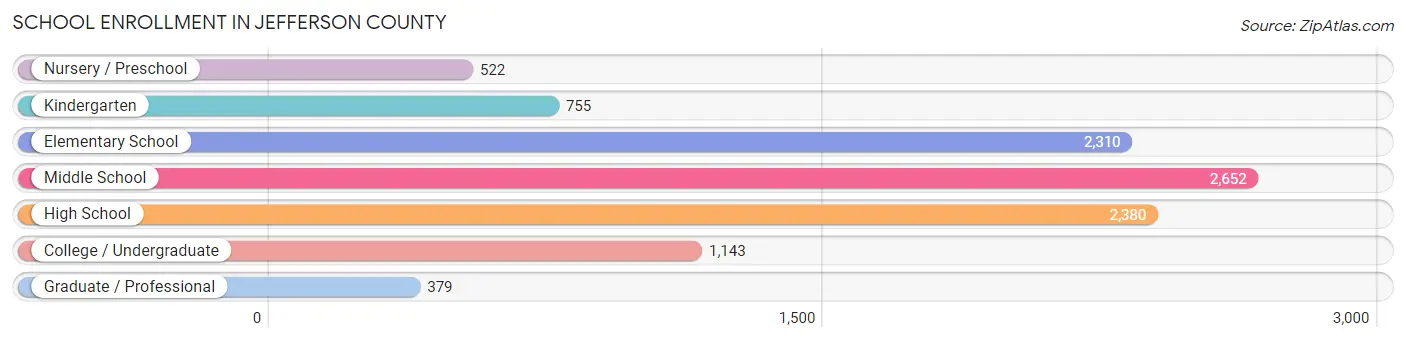
| School Level | # Students | % Students |
| Nursery / Preschool | 522 | 5.1% |
| Kindergarten | 755 | 7.4% |
| Elementary School | 2,310 | 22.8% |
| Middle School | 2,652 | 26.2% |
| High School | 2,380 | 23.5% |
| College / Undergraduate | 1,143 | 11.3% |
| Graduate / Professional | 379 | 3.7% |
| Total | 10,141 | 100.0% |
School Enrollment by Age by Funding Source in Jefferson County
Out of a total of 10,141 students who are enrolled in schools in Jefferson County, 2,211 (21.8%) attend a private institution, while the remaining 7,930 (78.2%) are enrolled in public schools. The age group of 20 to 24 year olds has the highest likelihood of being enrolled in private schools, with 285 (61.6% in the age bracket) enrolled. Conversely, the age group of 15 to 17 year olds has the lowest likelihood of being enrolled in a private school, with 1,685 (92.5% in the age bracket) attending a public institution.
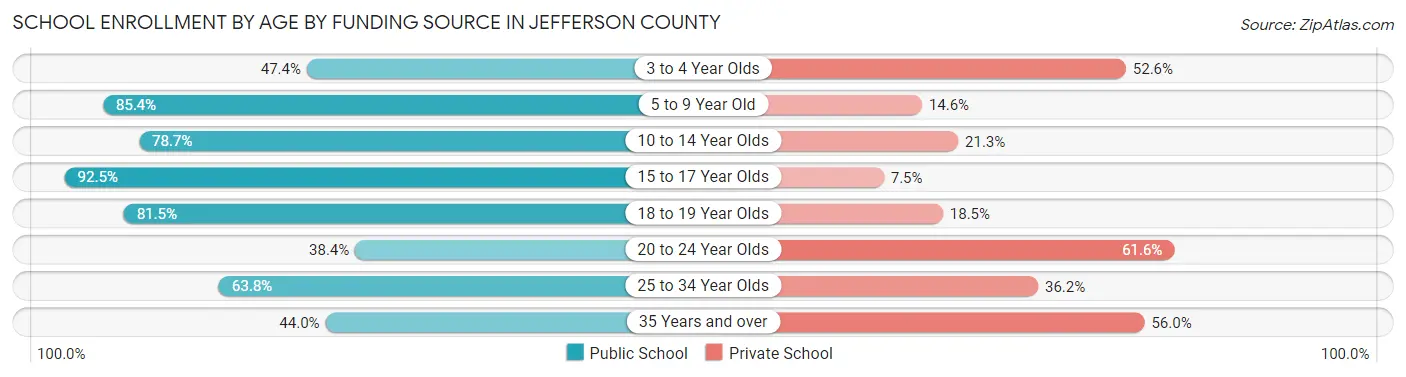
| Age Bracket | Public School | Private School |
| 3 to 4 Year Olds | 213 (47.4%) | 236 (52.6%) |
| 5 to 9 Year Old | 2,407 (85.4%) | 411 (14.6%) |
| 10 to 14 Year Olds | 2,487 (78.7%) | 674 (21.3%) |
| 15 to 17 Year Olds | 1,685 (92.5%) | 136 (7.5%) |
| 18 to 19 Year Olds | 521 (81.5%) | 118 (18.5%) |
| 20 to 24 Year Olds | 178 (38.4%) | 285 (61.6%) |
| 25 to 34 Year Olds | 282 (63.8%) | 160 (36.2%) |
| 35 Years and over | 153 (44.0%) | 195 (56.0%) |
| Total | 7,930 (78.2%) | 2,211 (21.8%) |
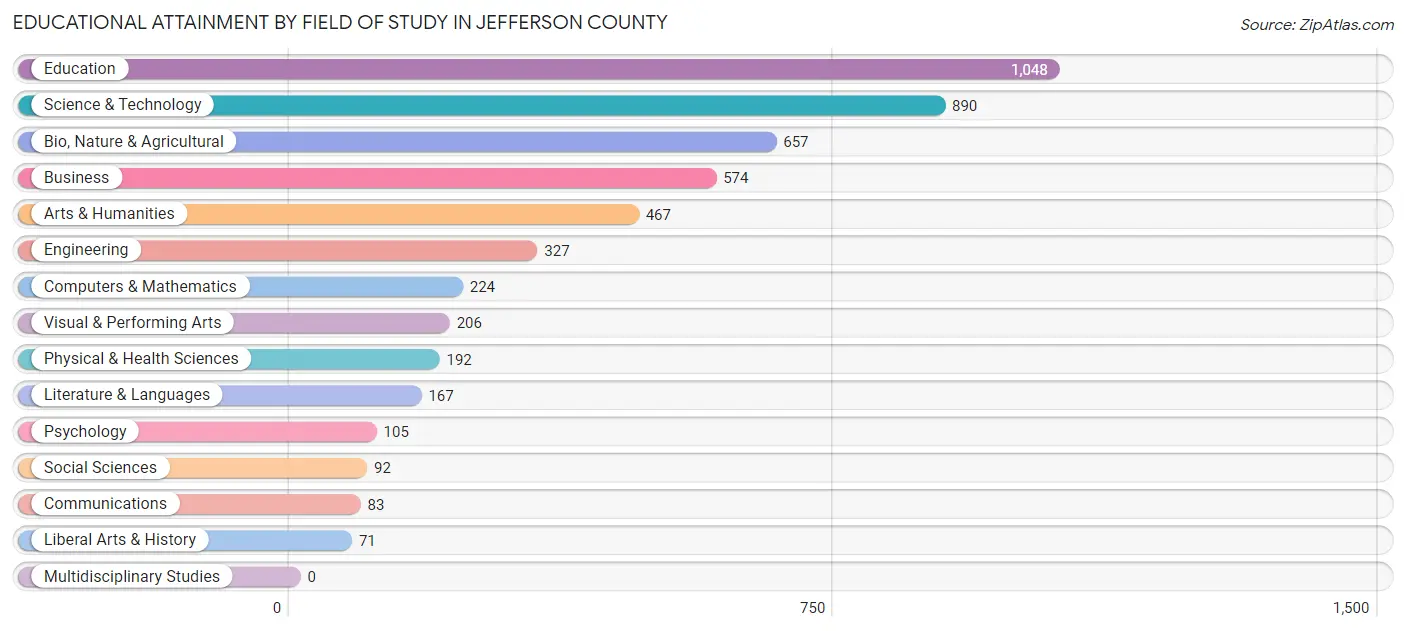
Educational Attainment by Field of Study in Jefferson County
Education (1,048 | 20.5%), science & technology (890 | 17.4%), bio, nature & agricultural (657 | 12.9%), business (574 | 11.3%), and arts & humanities (467 | 9.1%) are the most common fields of study among 5,103 individuals in Jefferson County who have obtained a bachelor's degree or higher.
| Field of Study | # Graduates | % Graduates |
| Computers & Mathematics | 224 | 4.4% |
| Bio, Nature & Agricultural | 657 | 12.9% |
| Physical & Health Sciences | 192 | 3.8% |
| Psychology | 105 | 2.1% |
| Social Sciences | 92 | 1.8% |
| Engineering | 327 | 6.4% |
| Multidisciplinary Studies | 0 | 0.0% |
| Science & Technology | 890 | 17.4% |
| Business | 574 | 11.3% |
| Education | 1,048 | 20.5% |
| Literature & Languages | 167 | 3.3% |
| Liberal Arts & History | 71 | 1.4% |
| Visual & Performing Arts | 206 | 4.0% |
| Communications | 83 | 1.6% |
| Arts & Humanities | 467 | 9.1% |
| Total | 5,103 | 100.0% |
Transportation & Commute in Jefferson County
Vehicle Availability by Sex in Jefferson County
The most prevalent vehicle ownership categories in Jefferson County are males with 3 vehicles (3,121, accounting for 36.0%) and females with 3 vehicles (1,958, making up 57.0%).
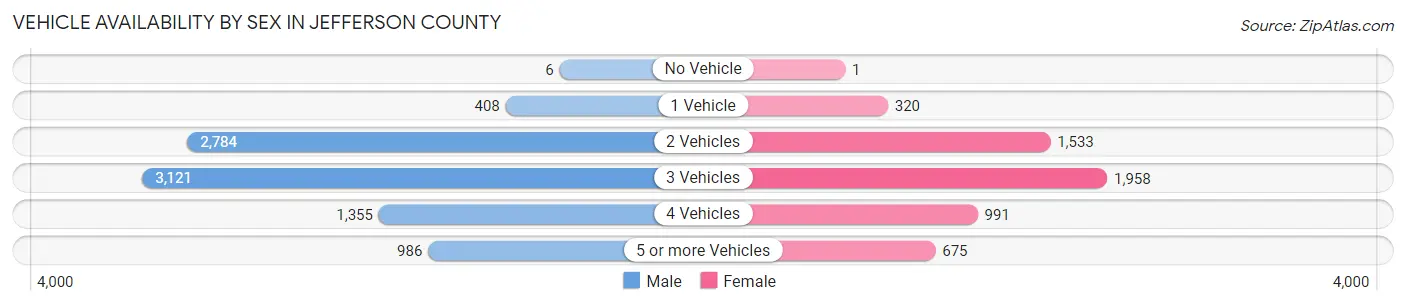
| Vehicles Available | Male | Female |
| No Vehicle | 6 (0.1%) | 1 (0.0%) |
| 1 Vehicle | 408 (4.7%) | 320 (5.8%) |
| 2 Vehicles | 2,784 (32.2%) | 1,533 (28.0%) |
| 3 Vehicles | 3,121 (36.0%) | 1,958 (35.7%) |
| 4 Vehicles | 1,355 (15.7%) | 991 (18.1%) |
| 5 or more Vehicles | 986 (11.4%) | 675 (12.3%) |
| Total | 8,660 (100.0%) | 5,478 (100.0%) |
Commute Time in Jefferson County
The most frequently occuring commute durations in Jefferson County are 20 to 24 minutes (3,070 commuters, 23.3%), 30 to 34 minutes (1,795 commuters, 13.6%), and 15 to 19 minutes (1,637 commuters, 12.4%).
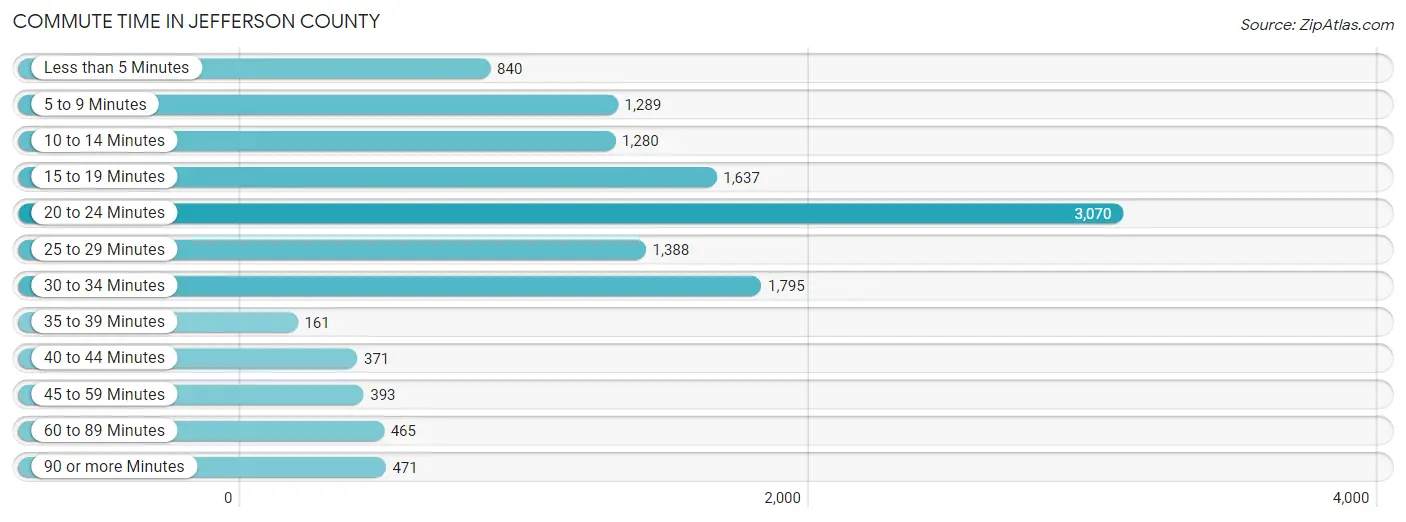
| Commute Time | # Commuters | % Commuters |
| Less than 5 Minutes | 840 | 6.4% |
| 5 to 9 Minutes | 1,289 | 9.8% |
| 10 to 14 Minutes | 1,280 | 9.7% |
| 15 to 19 Minutes | 1,637 | 12.4% |
| 20 to 24 Minutes | 3,070 | 23.3% |
| 25 to 29 Minutes | 1,388 | 10.5% |
| 30 to 34 Minutes | 1,795 | 13.6% |
| 35 to 39 Minutes | 161 | 1.2% |
| 40 to 44 Minutes | 371 | 2.8% |
| 45 to 59 Minutes | 393 | 3.0% |
| 60 to 89 Minutes | 465 | 3.5% |
| 90 or more Minutes | 471 | 3.6% |
Commute Time by Sex in Jefferson County
The most common commute times in Jefferson County are 20 to 24 minutes (1,947 commuters, 24.0%) for males and 20 to 24 minutes (1,123 commuters, 22.3%) for females.
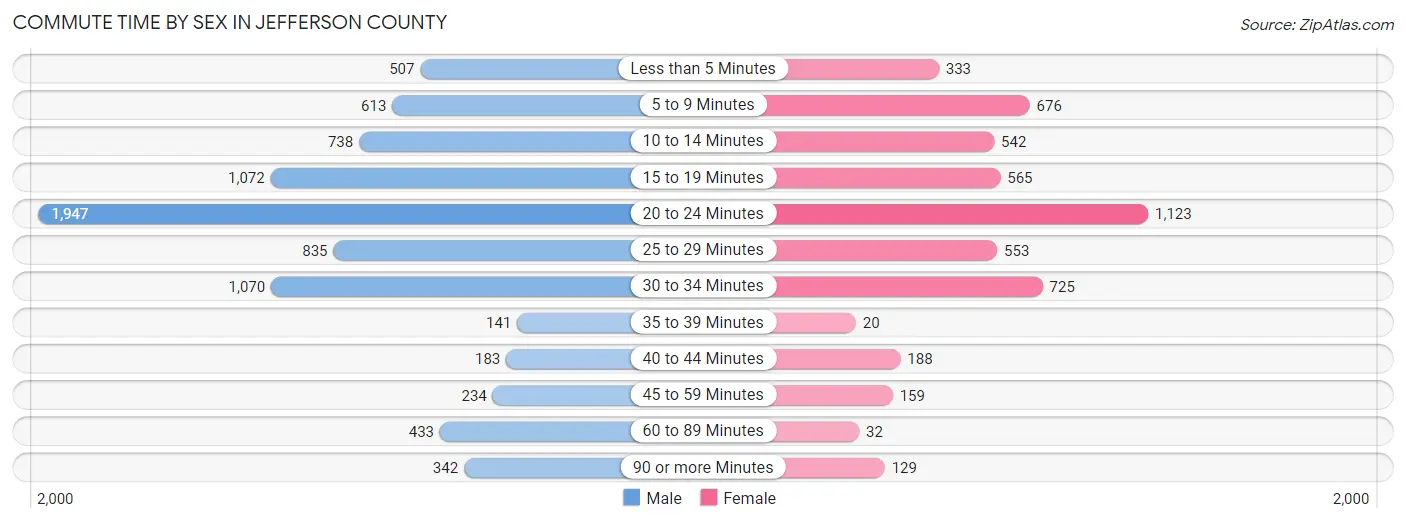
| Commute Time | Male | Female |
| Less than 5 Minutes | 507 (6.2%) | 333 (6.6%) |
| 5 to 9 Minutes | 613 (7.5%) | 676 (13.4%) |
| 10 to 14 Minutes | 738 (9.1%) | 542 (10.7%) |
| 15 to 19 Minutes | 1,072 (13.2%) | 565 (11.2%) |
| 20 to 24 Minutes | 1,947 (24.0%) | 1,123 (22.3%) |
| 25 to 29 Minutes | 835 (10.3%) | 553 (11.0%) |
| 30 to 34 Minutes | 1,070 (13.2%) | 725 (14.4%) |
| 35 to 39 Minutes | 141 (1.7%) | 20 (0.4%) |
| 40 to 44 Minutes | 183 (2.3%) | 188 (3.7%) |
| 45 to 59 Minutes | 234 (2.9%) | 159 (3.2%) |
| 60 to 89 Minutes | 433 (5.3%) | 32 (0.6%) |
| 90 or more Minutes | 342 (4.2%) | 129 (2.6%) |
Time of Departure to Work by Sex in Jefferson County
The most frequent times of departure to work in Jefferson County are 7:30 AM to 7:59 AM (1,339, 16.5%) for males and 7:00 AM to 7:29 AM (917, 18.2%) for females.
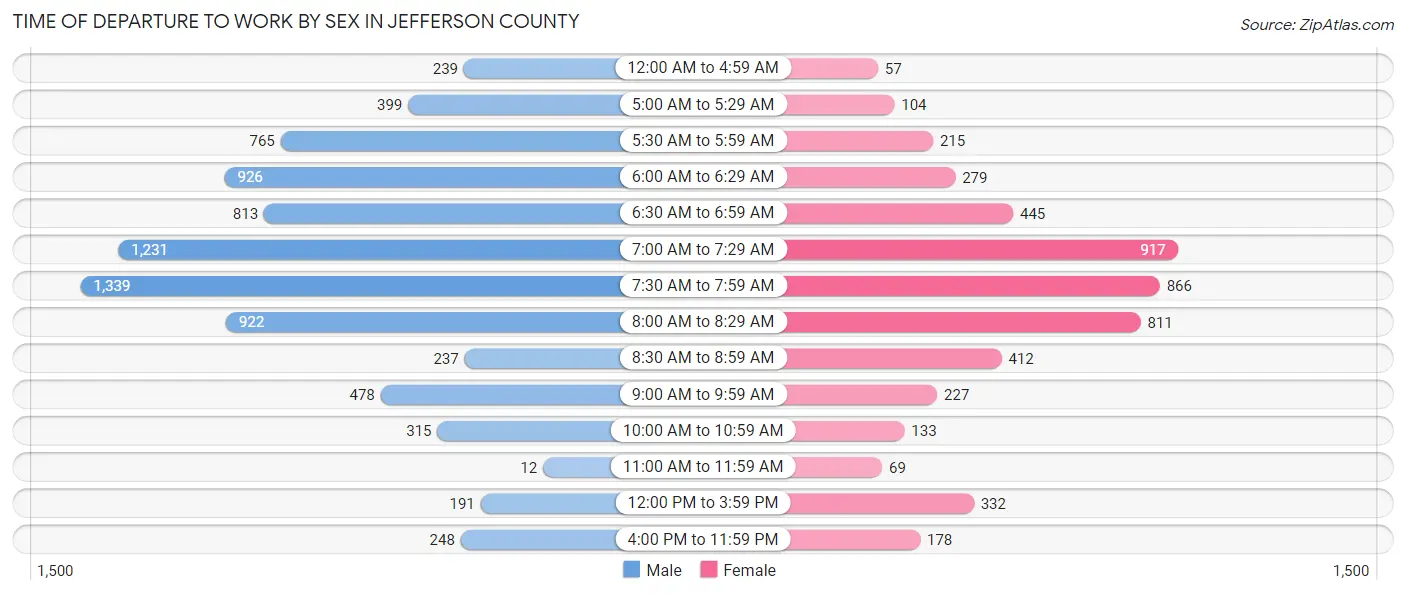
| Time of Departure | Male | Female |
| 12:00 AM to 4:59 AM | 239 (2.9%) | 57 (1.1%) |
| 5:00 AM to 5:29 AM | 399 (4.9%) | 104 (2.1%) |
| 5:30 AM to 5:59 AM | 765 (9.4%) | 215 (4.3%) |
| 6:00 AM to 6:29 AM | 926 (11.4%) | 279 (5.5%) |
| 6:30 AM to 6:59 AM | 813 (10.0%) | 445 (8.8%) |
| 7:00 AM to 7:29 AM | 1,231 (15.2%) | 917 (18.2%) |
| 7:30 AM to 7:59 AM | 1,339 (16.5%) | 866 (17.2%) |
| 8:00 AM to 8:29 AM | 922 (11.4%) | 811 (16.1%) |
| 8:30 AM to 8:59 AM | 237 (2.9%) | 412 (8.2%) |
| 9:00 AM to 9:59 AM | 478 (5.9%) | 227 (4.5%) |
| 10:00 AM to 10:59 AM | 315 (3.9%) | 133 (2.6%) |
| 11:00 AM to 11:59 AM | 12 (0.2%) | 69 (1.4%) |
| 12:00 PM to 3:59 PM | 191 (2.4%) | 332 (6.6%) |
| 4:00 PM to 11:59 PM | 248 (3.1%) | 178 (3.5%) |
| Total | 8,115 (100.0%) | 5,045 (100.0%) |
Housing Occupancy in Jefferson County
Occupancy by Ownership in Jefferson County
Of the total 9,623 dwellings in Jefferson County, owner-occupied units account for 7,925 (82.4%), while renter-occupied units make up 1,698 (17.6%).
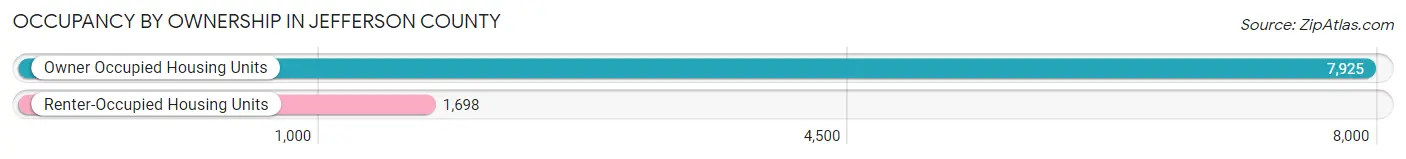
| Occupancy | # Housing Units | % Housing Units |
| Owner Occupied Housing Units | 7,925 | 82.4% |
| Renter-Occupied Housing Units | 1,698 | 17.6% |
| Total Occupied Housing Units | 9,623 | 100.0% |
Occupancy by Household Size in Jefferson County
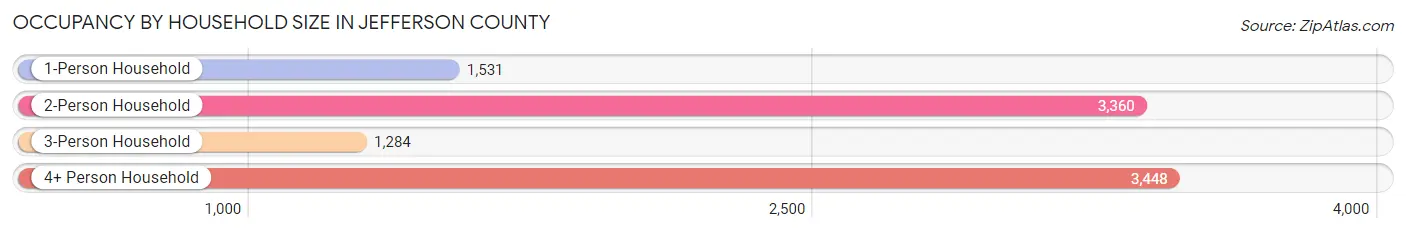
| Household Size | # Housing Units | % Housing Units |
| 1-Person Household | 1,531 | 15.9% |
| 2-Person Household | 3,360 | 34.9% |
| 3-Person Household | 1,284 | 13.3% |
| 4+ Person Household | 3,448 | 35.8% |
| Total Housing Units | 9,623 | 100.0% |
Occupancy by Ownership by Household Size in Jefferson County
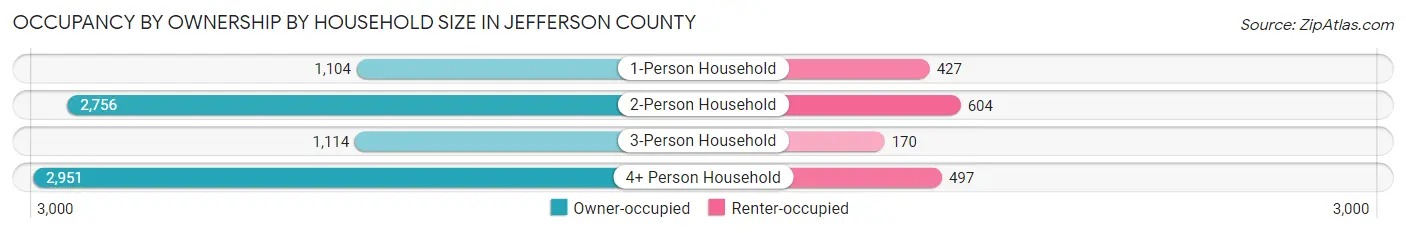
| Household Size | Owner-occupied | Renter-occupied |
| 1-Person Household | 1,104 (72.1%) | 427 (27.9%) |
| 2-Person Household | 2,756 (82.0%) | 604 (18.0%) |
| 3-Person Household | 1,114 (86.8%) | 170 (13.2%) |
| 4+ Person Household | 2,951 (85.6%) | 497 (14.4%) |
| Total Housing Units | 7,925 (82.4%) | 1,698 (17.6%) |
Occupancy by Educational Attainment in Jefferson County
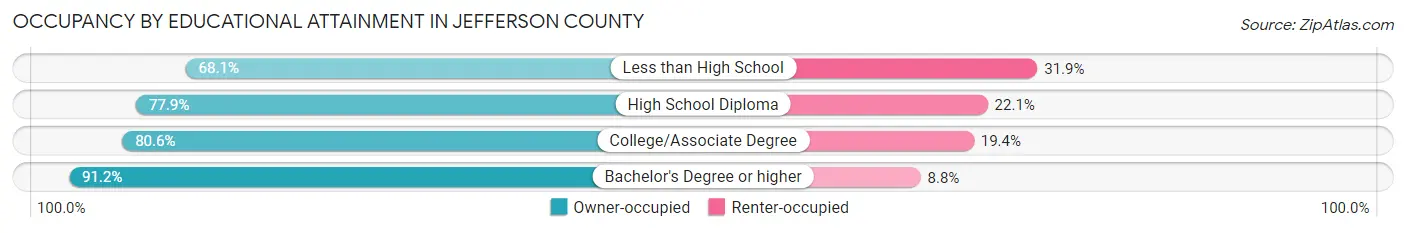
| Household Size | Owner-occupied | Renter-occupied |
| Less than High School | 490 (68.1%) | 230 (31.9%) |
| High School Diploma | 1,843 (77.9%) | 523 (22.1%) |
| College/Associate Degree | 2,819 (80.6%) | 677 (19.4%) |
| Bachelor's Degree or higher | 2,773 (91.2%) | 268 (8.8%) |
Occupancy by Age of Householder in Jefferson County
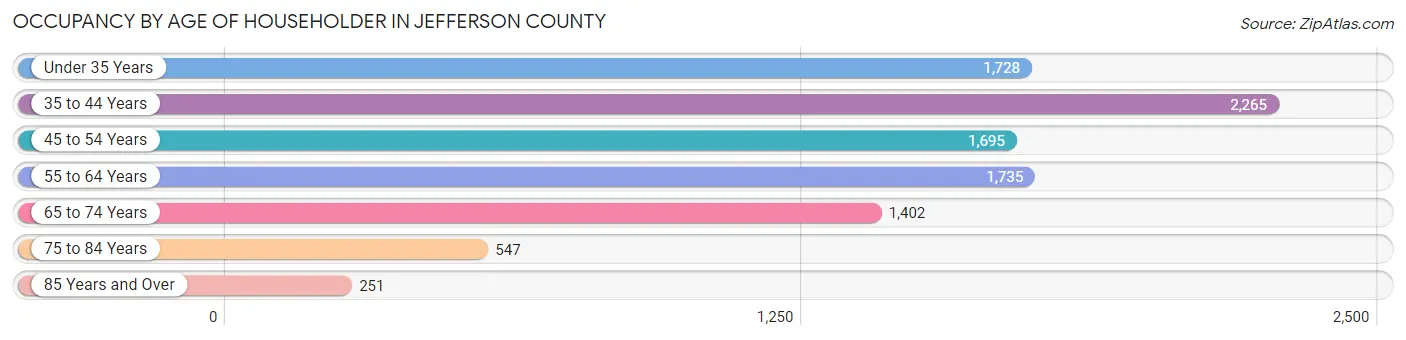
| Age Bracket | # Households | % Households |
| Under 35 Years | 1,728 | 18.0% |
| 35 to 44 Years | 2,265 | 23.5% |
| 45 to 54 Years | 1,695 | 17.6% |
| 55 to 64 Years | 1,735 | 18.0% |
| 65 to 74 Years | 1,402 | 14.6% |
| 75 to 84 Years | 547 | 5.7% |
| 85 Years and Over | 251 | 2.6% |
| Total | 9,623 | 100.0% |
Housing Finances in Jefferson County
Median Income by Occupancy in Jefferson County
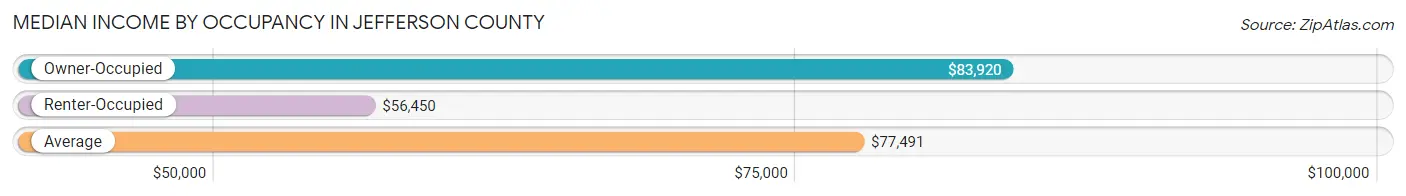
| Occupancy Type | # Households | Median Income |
| Owner-Occupied | 7,925 (82.4%) | $83,920 |
| Renter-Occupied | 1,698 (17.6%) | $56,450 |
| Average | 9,623 (100.0%) | $77,491 |
Occupancy by Householder Income Bracket in Jefferson County
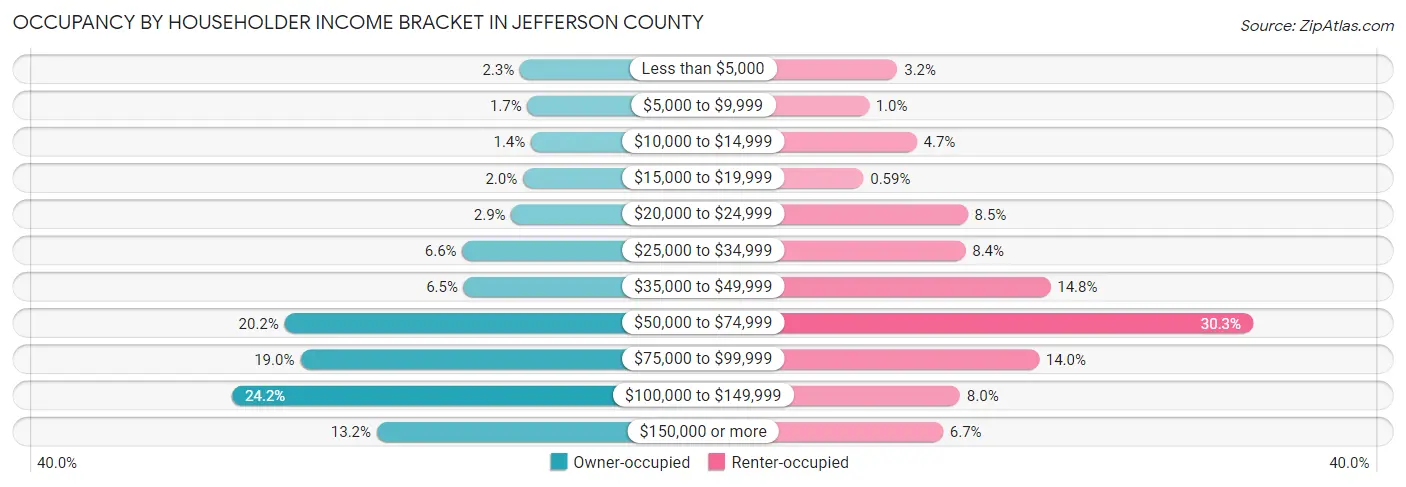
| Income Bracket | Owner-occupied | Renter-occupied |
| Less than $5,000 | 178 (2.2%) | 54 (3.2%) |
| $5,000 to $9,999 | 133 (1.7%) | 17 (1.0%) |
| $10,000 to $14,999 | 112 (1.4%) | 79 (4.6%) |
| $15,000 to $19,999 | 160 (2.0%) | 10 (0.6%) |
| $20,000 to $24,999 | 231 (2.9%) | 145 (8.5%) |
| $25,000 to $34,999 | 526 (6.6%) | 142 (8.4%) |
| $35,000 to $49,999 | 518 (6.5%) | 252 (14.8%) |
| $50,000 to $74,999 | 1,600 (20.2%) | 514 (30.3%) |
| $75,000 to $99,999 | 1,506 (19.0%) | 237 (14.0%) |
| $100,000 to $149,999 | 1,918 (24.2%) | 135 (8.0%) |
| $150,000 or more | 1,043 (13.2%) | 113 (6.7%) |
| Total | 7,925 (100.0%) | 1,698 (100.0%) |
Monthly Housing Cost Tiers in Jefferson County
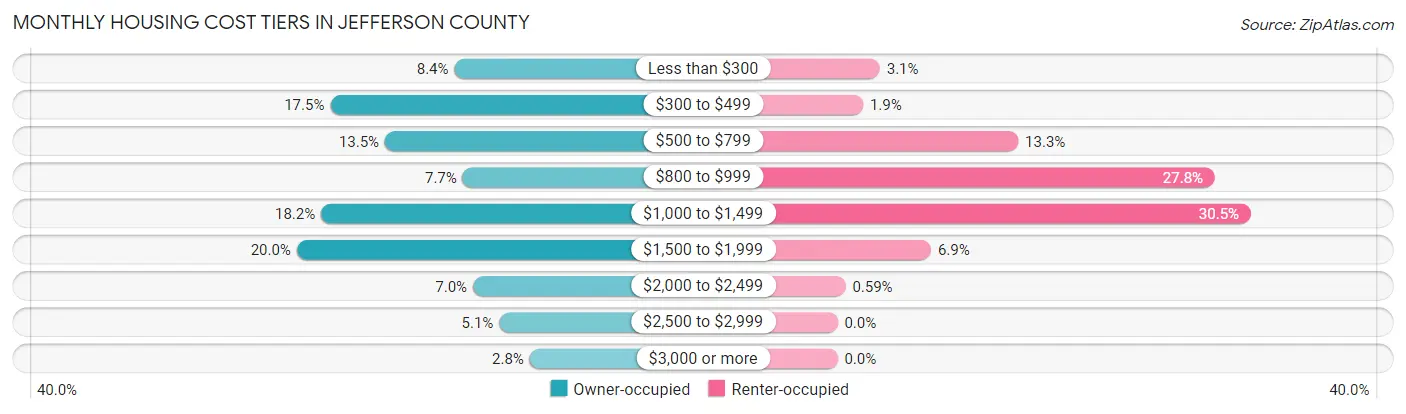
| Monthly Cost | Owner-occupied | Renter-occupied |
| Less than $300 | 662 (8.4%) | 53 (3.1%) |
| $300 to $499 | 1,386 (17.5%) | 32 (1.9%) |
| $500 to $799 | 1,067 (13.5%) | 226 (13.3%) |
| $800 to $999 | 613 (7.7%) | 472 (27.8%) |
| $1,000 to $1,499 | 1,440 (18.2%) | 517 (30.4%) |
| $1,500 to $1,999 | 1,582 (20.0%) | 117 (6.9%) |
| $2,000 to $2,499 | 553 (7.0%) | 10 (0.6%) |
| $2,500 to $2,999 | 400 (5.1%) | 0 (0.0%) |
| $3,000 or more | 222 (2.8%) | 0 (0.0%) |
| Total | 7,925 (100.0%) | 1,698 (100.0%) |
Physical Housing Characteristics in Jefferson County
Housing Structures in Jefferson County
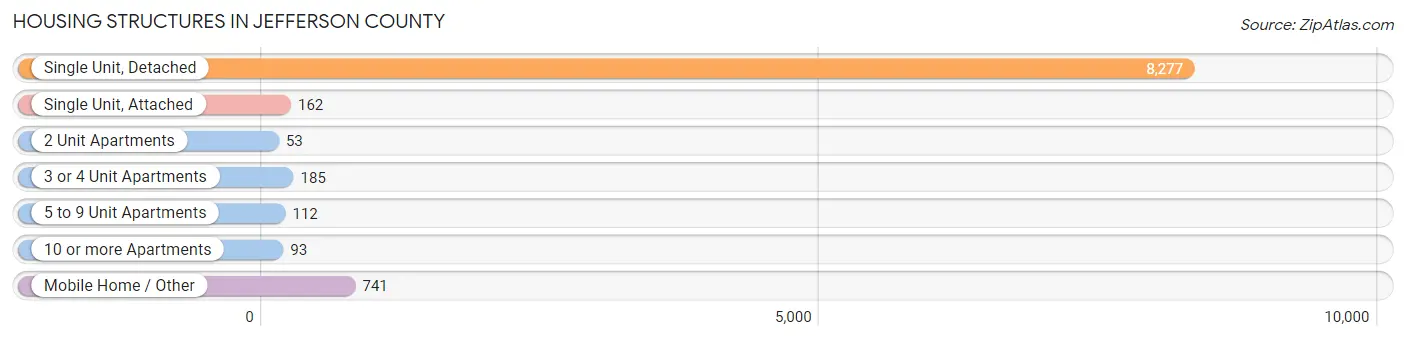
| Structure Type | # Housing Units | % Housing Units |
| Single Unit, Detached | 8,277 | 86.0% |
| Single Unit, Attached | 162 | 1.7% |
| 2 Unit Apartments | 53 | 0.5% |
| 3 or 4 Unit Apartments | 185 | 1.9% |
| 5 to 9 Unit Apartments | 112 | 1.2% |
| 10 or more Apartments | 93 | 1.0% |
| Mobile Home / Other | 741 | 7.7% |
| Total | 9,623 | 100.0% |
Housing Structures by Occupancy in Jefferson County
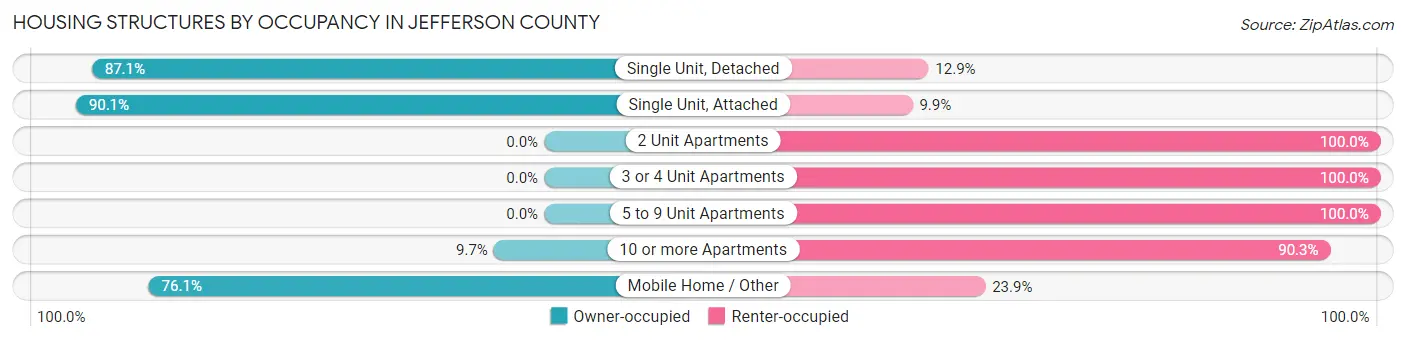
| Structure Type | Owner-occupied | Renter-occupied |
| Single Unit, Detached | 7,206 (87.1%) | 1,071 (12.9%) |
| Single Unit, Attached | 146 (90.1%) | 16 (9.9%) |
| 2 Unit Apartments | 0 (0.0%) | 53 (100.0%) |
| 3 or 4 Unit Apartments | 0 (0.0%) | 185 (100.0%) |
| 5 to 9 Unit Apartments | 0 (0.0%) | 112 (100.0%) |
| 10 or more Apartments | 9 (9.7%) | 84 (90.3%) |
| Mobile Home / Other | 564 (76.1%) | 177 (23.9%) |
| Total | 7,925 (82.4%) | 1,698 (17.6%) |
Housing Structures by Number of Rooms in Jefferson County
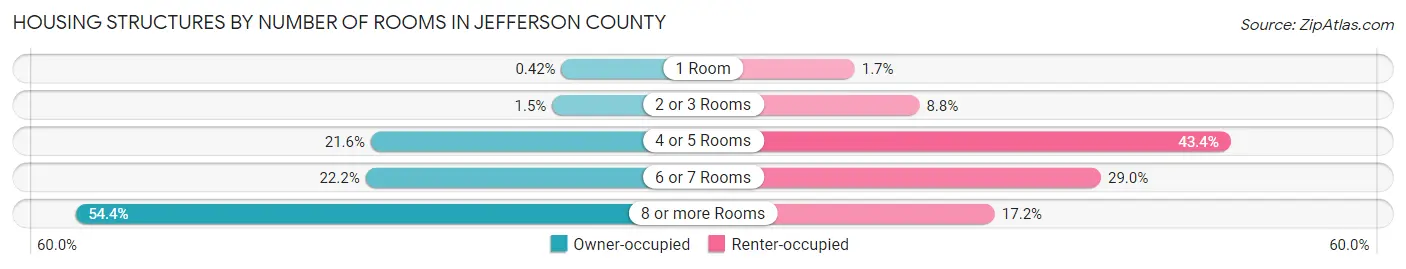
| Number of Rooms | Owner-occupied | Renter-occupied |
| 1 Room | 33 (0.4%) | 28 (1.7%) |
| 2 or 3 Rooms | 115 (1.5%) | 150 (8.8%) |
| 4 or 5 Rooms | 1,710 (21.6%) | 736 (43.3%) |
| 6 or 7 Rooms | 1,757 (22.2%) | 492 (29.0%) |
| 8 or more Rooms | 4,310 (54.4%) | 292 (17.2%) |
| Total | 7,925 (100.0%) | 1,698 (100.0%) |
Housing Structure by Heating Type in Jefferson County
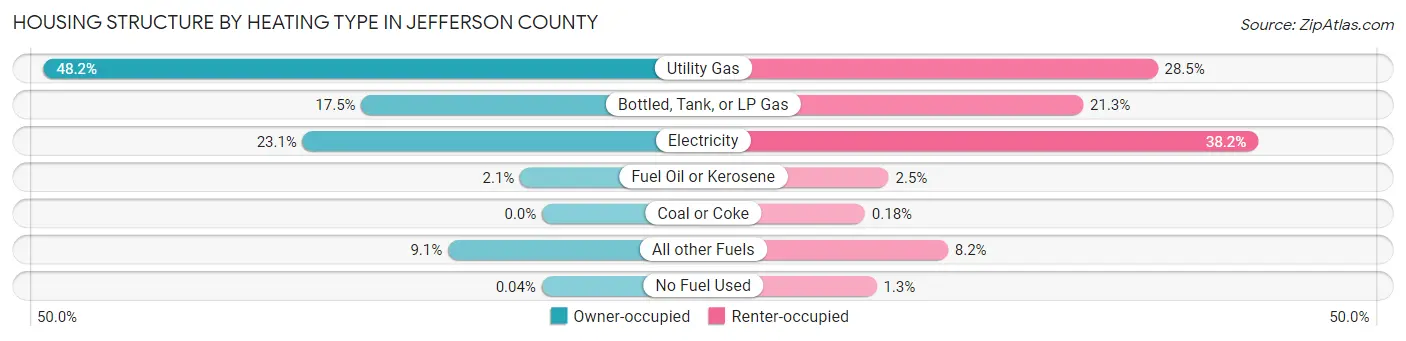
| Heating Type | Owner-occupied | Renter-occupied |
| Utility Gas | 3,817 (48.2%) | 483 (28.4%) |
| Bottled, Tank, or LP Gas | 1,384 (17.5%) | 361 (21.3%) |
| Electricity | 1,833 (23.1%) | 648 (38.2%) |
| Fuel Oil or Kerosene | 168 (2.1%) | 42 (2.5%) |
| Coal or Coke | 0 (0.0%) | 3 (0.2%) |
| All other Fuels | 720 (9.1%) | 139 (8.2%) |
| No Fuel Used | 3 (0.0%) | 22 (1.3%) |
| Total | 7,925 (100.0%) | 1,698 (100.0%) |
Household Vehicle Usage in Jefferson County
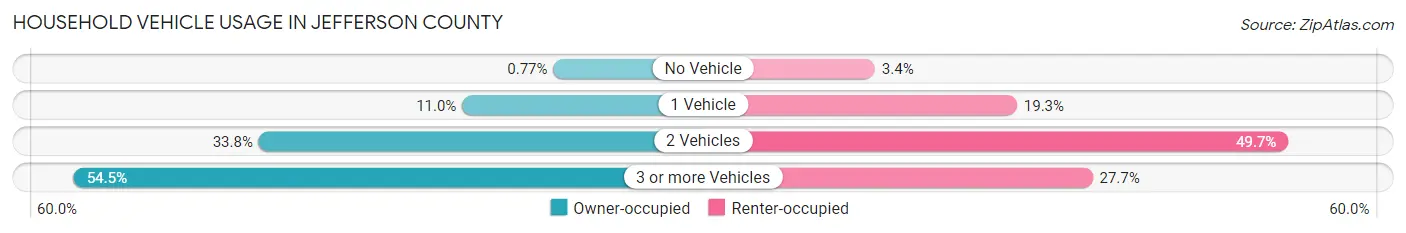
| Vehicles per Household | Owner-occupied | Renter-occupied |
| No Vehicle | 61 (0.8%) | 57 (3.4%) |
| 1 Vehicle | 870 (11.0%) | 327 (19.3%) |
| 2 Vehicles | 2,676 (33.8%) | 843 (49.6%) |
| 3 or more Vehicles | 4,318 (54.5%) | 471 (27.7%) |
| Total | 7,925 (100.0%) | 1,698 (100.0%) |
Real Estate & Mortgages in Jefferson County
Real Estate and Mortgage Overview in Jefferson County
| Characteristic | Without Mortgage | With Mortgage |
| Housing Units | 2,827 | 5,098 |
| Median Property Value | $215,400 | $333,400 |
| Median Household Income | $74,555 | $678 |
| Monthly Housing Costs | $411 | $222 |
| Real Estate Taxes | $1,240 | $136 |
Property Value by Mortgage Status in Jefferson County
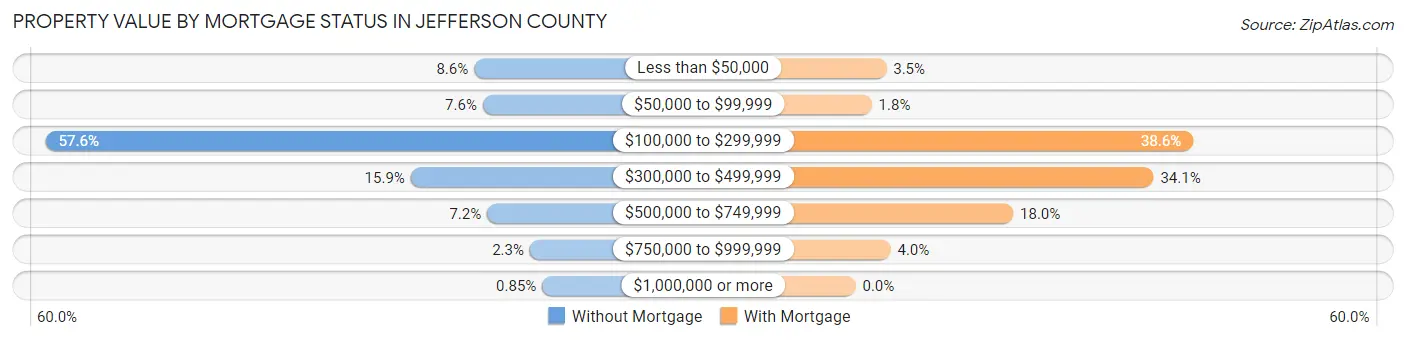
| Property Value | Without Mortgage | With Mortgage |
| Less than $50,000 | 244 (8.6%) | 179 (3.5%) |
| $50,000 to $99,999 | 216 (7.6%) | 94 (1.8%) |
| $100,000 to $299,999 | 1,628 (57.6%) | 1,967 (38.6%) |
| $300,000 to $499,999 | 449 (15.9%) | 1,736 (34.1%) |
| $500,000 to $749,999 | 202 (7.1%) | 918 (18.0%) |
| $750,000 to $999,999 | 64 (2.3%) | 204 (4.0%) |
| $1,000,000 or more | 24 (0.9%) | 0 (0.0%) |
| Total | 2,827 (100.0%) | 5,098 (100.0%) |
Household Income by Mortgage Status in Jefferson County
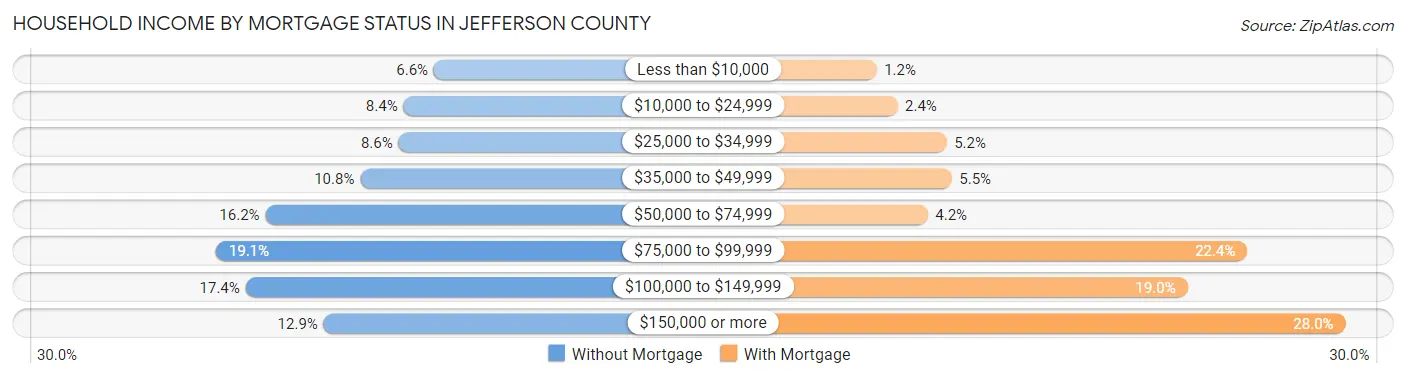
| Household Income | Without Mortgage | With Mortgage |
| Less than $10,000 | 187 (6.6%) | 63 (1.2%) |
| $10,000 to $24,999 | 236 (8.4%) | 124 (2.4%) |
| $25,000 to $34,999 | 244 (8.6%) | 267 (5.2%) |
| $35,000 to $49,999 | 306 (10.8%) | 282 (5.5%) |
| $50,000 to $74,999 | 459 (16.2%) | 212 (4.2%) |
| $75,000 to $99,999 | 539 (19.1%) | 1,141 (22.4%) |
| $100,000 to $149,999 | 491 (17.4%) | 967 (19.0%) |
| $150,000 or more | 365 (12.9%) | 1,427 (28.0%) |
| Total | 2,827 (100.0%) | 5,098 (100.0%) |
Property Value to Household Income Ratio in Jefferson County
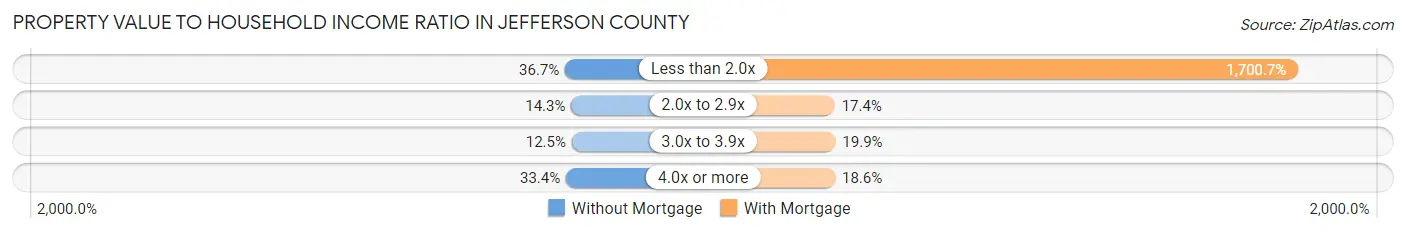
| Value-to-Income Ratio | Without Mortgage | With Mortgage |
| Less than 2.0x | 1,037 (36.7%) | 86,702 (1,700.7%) |
| 2.0x to 2.9x | 403 (14.3%) | 885 (17.4%) |
| 3.0x to 3.9x | 352 (12.4%) | 1,013 (19.9%) |
| 4.0x or more | 943 (33.4%) | 949 (18.6%) |
| Total | 2,827 (100.0%) | 5,098 (100.0%) |
Real Estate Taxes by Mortgage Status in Jefferson County
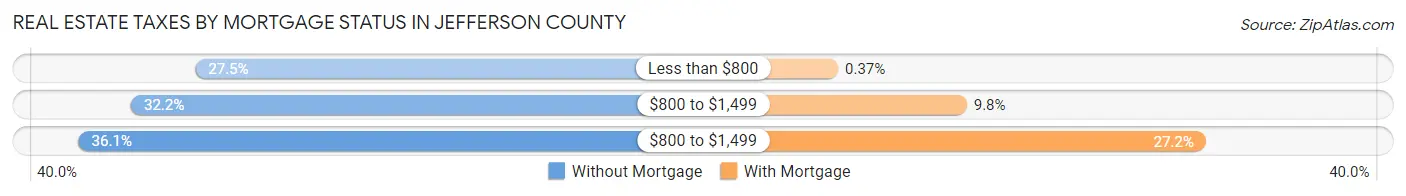
| Property Taxes | Without Mortgage | With Mortgage |
| Less than $800 | 778 (27.5%) | 19 (0.4%) |
| $800 to $1,499 | 911 (32.2%) | 498 (9.8%) |
| $800 to $1,499 | 1,019 (36.0%) | 1,388 (27.2%) |
| Total | 2,827 (100.0%) | 5,098 (100.0%) |
Health & Disability in Jefferson County
Health Insurance Coverage by Age in Jefferson County
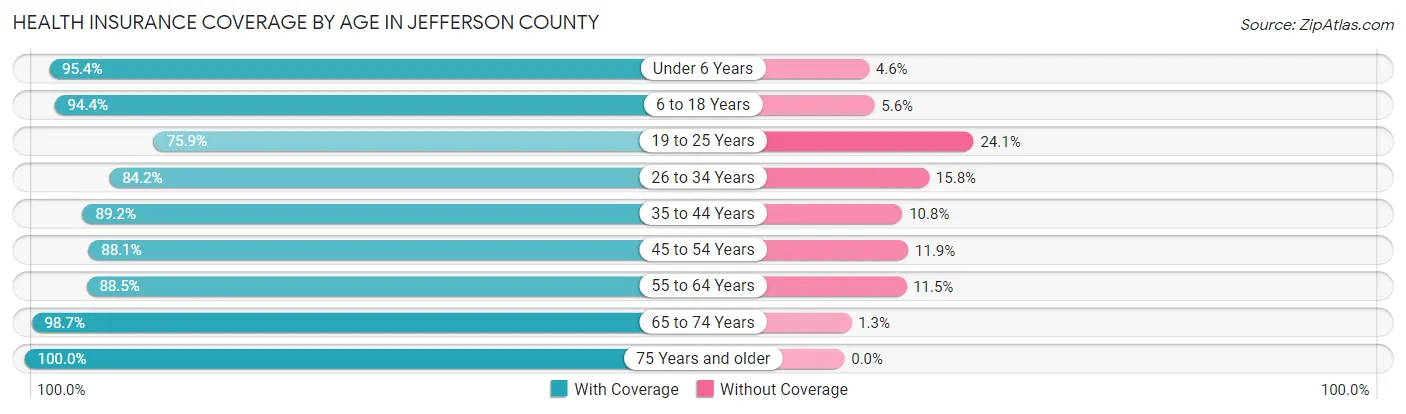
| Age Bracket | With Coverage | Without Coverage |
| Under 6 Years | 2,791 (95.4%) | 134 (4.6%) |
| 6 to 18 Years | 7,588 (94.4%) | 451 (5.6%) |
| 19 to 25 Years | 2,026 (75.9%) | 643 (24.1%) |
| 26 to 34 Years | 2,733 (84.2%) | 512 (15.8%) |
| 35 to 44 Years | 3,787 (89.2%) | 459 (10.8%) |
| 45 to 54 Years | 2,954 (88.1%) | 399 (11.9%) |
| 55 to 64 Years | 2,874 (88.5%) | 375 (11.5%) |
| 65 to 74 Years | 2,294 (98.7%) | 30 (1.3%) |
| 75 Years and older | 1,254 (100.0%) | 0 (0.0%) |
| Total | 28,301 (90.4%) | 3,003 (9.6%) |
Health Insurance Coverage by Citizenship Status in Jefferson County
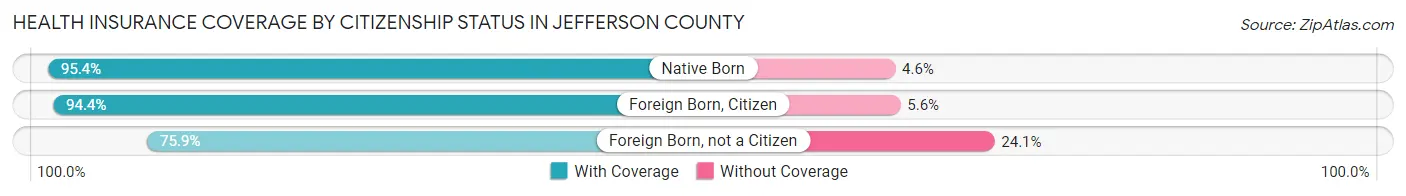
| Citizenship Status | With Coverage | Without Coverage |
| Native Born | 2,791 (95.4%) | 134 (4.6%) |
| Foreign Born, Citizen | 7,588 (94.4%) | 451 (5.6%) |
| Foreign Born, not a Citizen | 2,026 (75.9%) | 643 (24.1%) |
Health Insurance Coverage by Household Income in Jefferson County
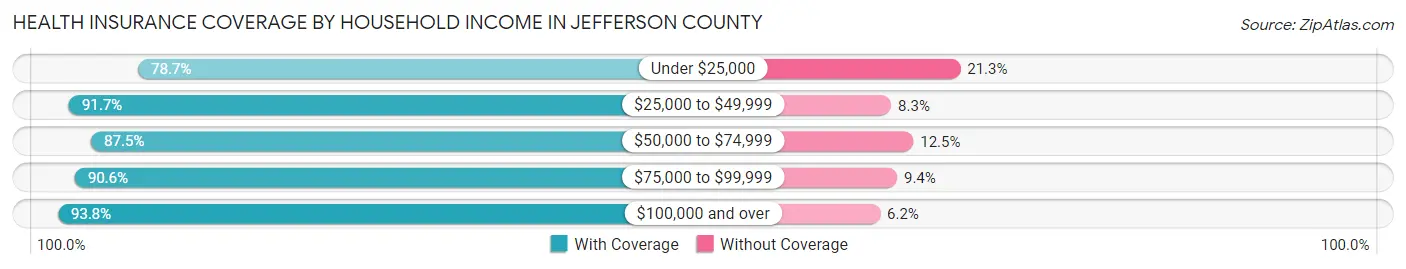
| Household Income | With Coverage | Without Coverage |
| Under $25,000 | 1,688 (78.7%) | 456 (21.3%) |
| $25,000 to $49,999 | 3,444 (91.7%) | 312 (8.3%) |
| $50,000 to $74,999 | 6,227 (87.5%) | 886 (12.5%) |
| $75,000 to $99,999 | 5,690 (90.6%) | 591 (9.4%) |
| $100,000 and over | 11,247 (93.8%) | 748 (6.2%) |
Public vs Private Health Insurance Coverage by Age in Jefferson County
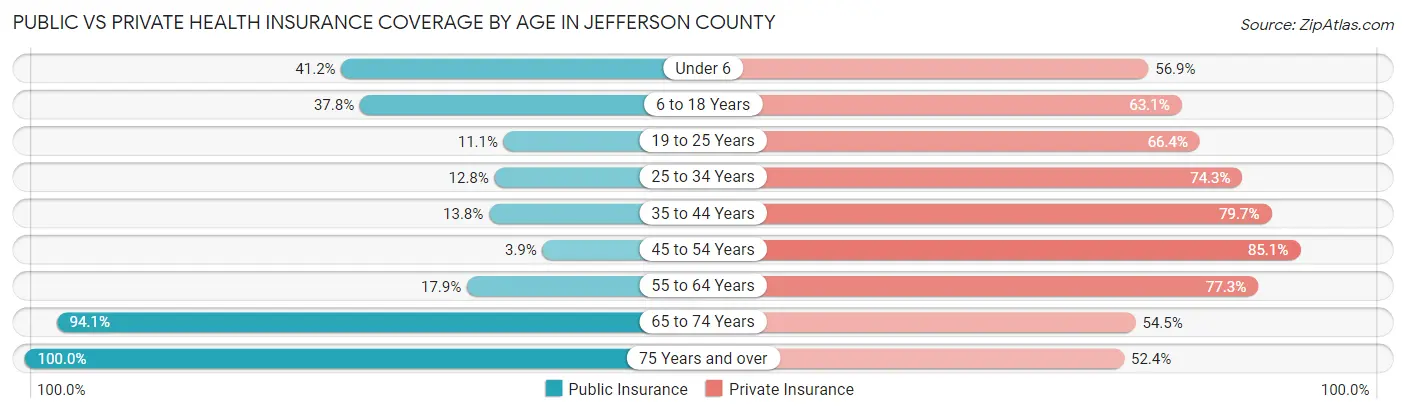
| Age Bracket | Public Insurance | Private Insurance |
| Under 6 | 1,205 (41.2%) | 1,664 (56.9%) |
| 6 to 18 Years | 3,035 (37.8%) | 5,069 (63.1%) |
| 19 to 25 Years | 295 (11.1%) | 1,773 (66.4%) |
| 25 to 34 Years | 414 (12.8%) | 2,412 (74.3%) |
| 35 to 44 Years | 585 (13.8%) | 3,384 (79.7%) |
| 45 to 54 Years | 129 (3.8%) | 2,852 (85.1%) |
| 55 to 64 Years | 581 (17.9%) | 2,510 (77.2%) |
| 65 to 74 Years | 2,186 (94.1%) | 1,267 (54.5%) |
| 75 Years and over | 1,254 (100.0%) | 657 (52.4%) |
| Total | 9,684 (30.9%) | 21,588 (69.0%) |
Disability Status by Sex by Age in Jefferson County
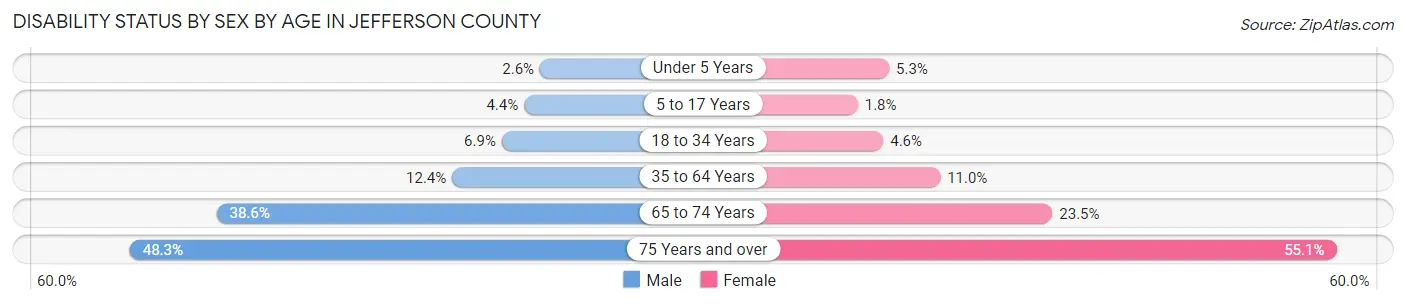
| Age Bracket | Male | Female |
| Under 5 Years | 33 (2.6%) | 63 (5.3%) |
| 5 to 17 Years | 179 (4.4%) | 70 (1.8%) |
| 18 to 34 Years | 231 (6.9%) | 140 (4.6%) |
| 35 to 64 Years | 689 (12.4%) | 579 (11.0%) |
| 65 to 74 Years | 438 (38.6%) | 279 (23.4%) |
| 75 Years and over | 281 (48.3%) | 370 (55.1%) |
Disability Class by Sex by Age in Jefferson County
Disability Class: Hearing Difficulty
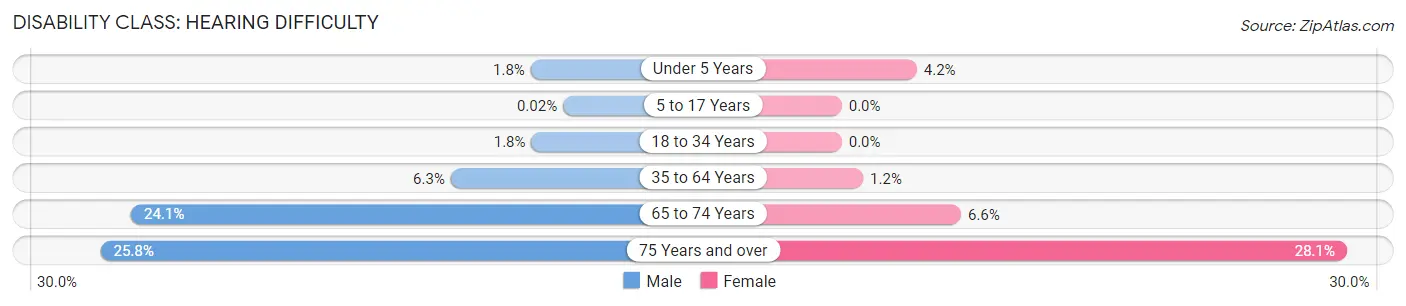
| Age Bracket | Male | Female |
| Under 5 Years | 23 (1.8%) | 50 (4.2%) |
| 5 to 17 Years | 1 (0.0%) | 0 (0.0%) |
| 18 to 34 Years | 60 (1.8%) | 0 (0.0%) |
| 35 to 64 Years | 349 (6.3%) | 63 (1.2%) |
| 65 to 74 Years | 273 (24.1%) | 79 (6.6%) |
| 75 Years and over | 150 (25.8%) | 189 (28.1%) |
Disability Class: Vision Difficulty
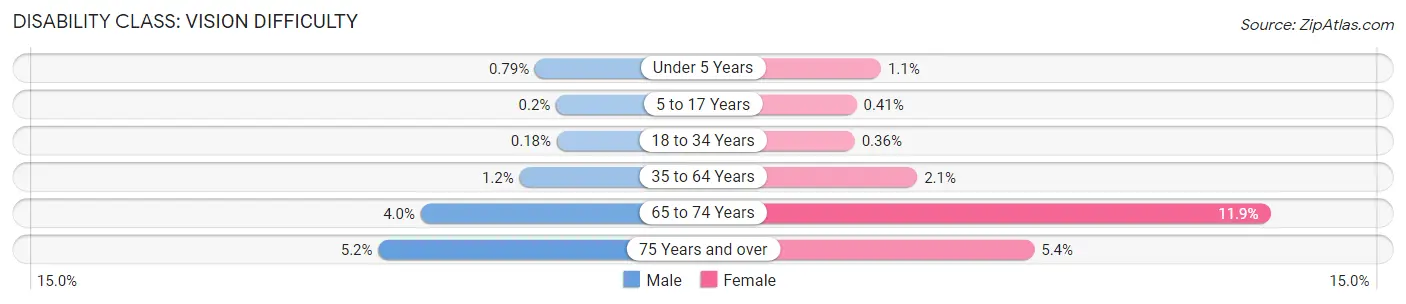
| Age Bracket | Male | Female |
| Under 5 Years | 10 (0.8%) | 13 (1.1%) |
| 5 to 17 Years | 8 (0.2%) | 16 (0.4%) |
| 18 to 34 Years | 6 (0.2%) | 11 (0.4%) |
| 35 to 64 Years | 68 (1.2%) | 111 (2.1%) |
| 65 to 74 Years | 45 (4.0%) | 142 (11.9%) |
| 75 Years and over | 30 (5.1%) | 36 (5.4%) |
Disability Class: Cognitive Difficulty
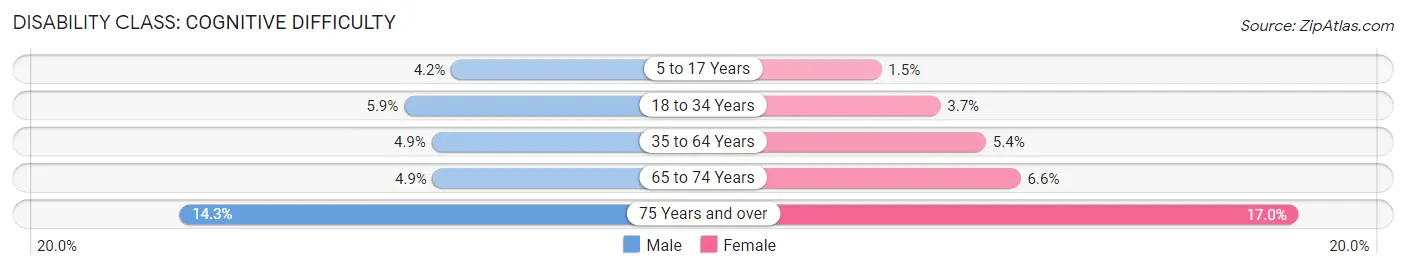
| Age Bracket | Male | Female |
| 5 to 17 Years | 170 (4.2%) | 58 (1.5%) |
| 18 to 34 Years | 199 (5.9%) | 111 (3.7%) |
| 35 to 64 Years | 272 (4.9%) | 283 (5.3%) |
| 65 to 74 Years | 55 (4.9%) | 79 (6.6%) |
| 75 Years and over | 83 (14.3%) | 114 (17.0%) |
Disability Class: Ambulatory Difficulty
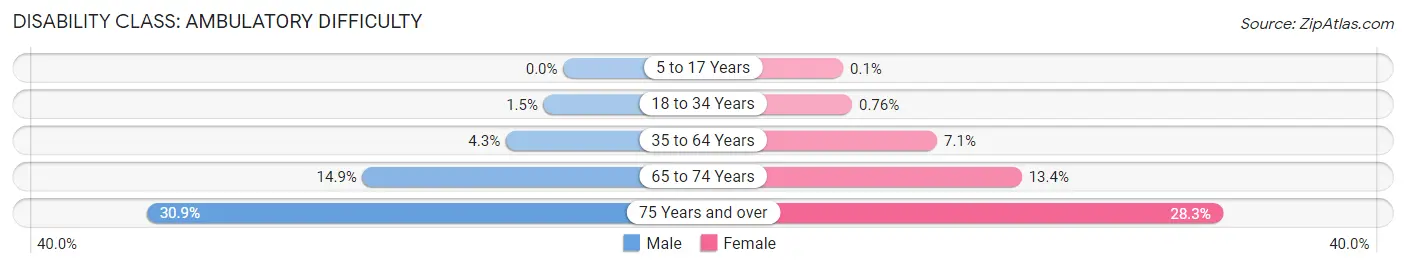
| Age Bracket | Male | Female |
| 5 to 17 Years | 0 (0.0%) | 4 (0.1%) |
| 18 to 34 Years | 49 (1.5%) | 23 (0.8%) |
| 35 to 64 Years | 237 (4.3%) | 374 (7.1%) |
| 65 to 74 Years | 169 (14.9%) | 159 (13.4%) |
| 75 Years and over | 180 (30.9%) | 190 (28.3%) |
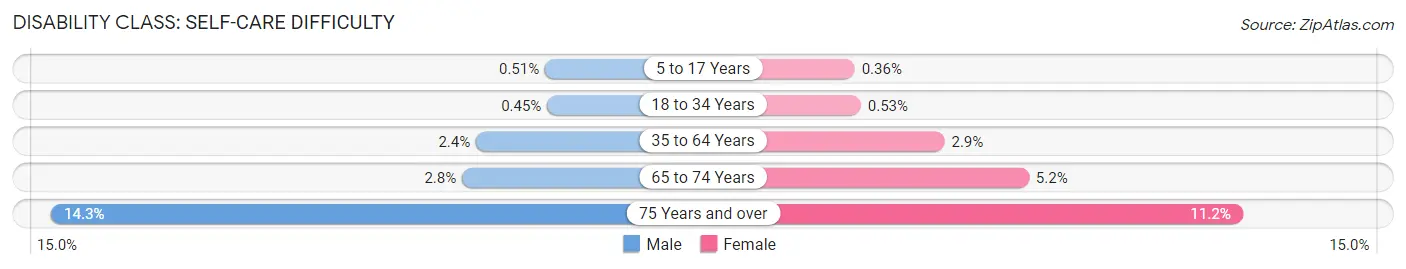
Disability Class: Self-Care Difficulty
| Age Bracket | Male | Female |
| 5 to 17 Years | 21 (0.5%) | 14 (0.4%) |
| 18 to 34 Years | 15 (0.4%) | 16 (0.5%) |
| 35 to 64 Years | 135 (2.4%) | 151 (2.9%) |
| 65 to 74 Years | 32 (2.8%) | 62 (5.2%) |
| 75 Years and over | 83 (14.3%) | 75 (11.2%) |
Technology Access in Jefferson County
Computing Device Access in Jefferson County
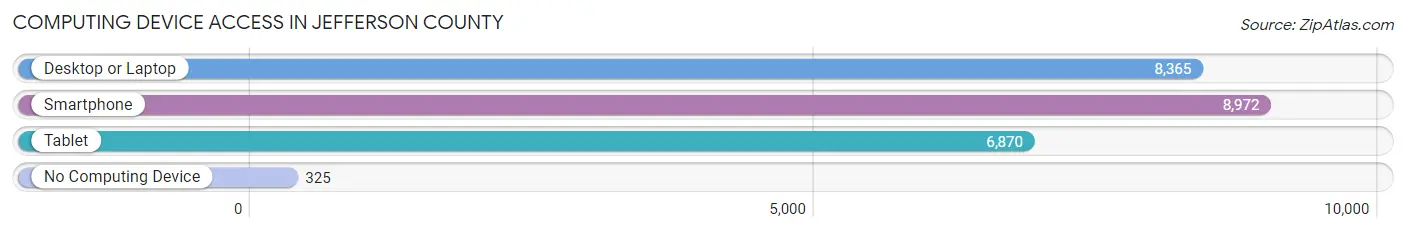
| Device Type | # Households | % Households |
| Desktop or Laptop | 8,365 | 86.9% |
| Smartphone | 8,972 | 93.2% |
| Tablet | 6,870 | 71.4% |
| No Computing Device | 325 | 3.4% |
| Total | 9,623 | 100.0% |
Internet Access in Jefferson County
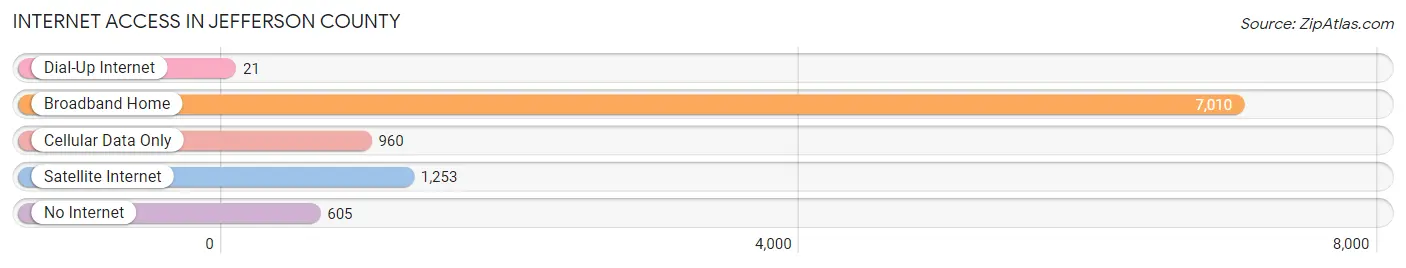
| Internet Type | # Households | % Households |
| Dial-Up Internet | 21 | 0.2% |
| Broadband Home | 7,010 | 72.9% |
| Cellular Data Only | 960 | 10.0% |
| Satellite Internet | 1,253 | 13.0% |
| No Internet | 605 | 6.3% |
| Total | 9,623 | 100.0% |
Jefferson County Summary
Jefferson County, Idaho is located in the southeastern corner of the state and is bordered by Madison County to the north, Fremont County to the east, and Teton County to the south. The county seat is Rigby, and the largest city is Rigby. The county was established in 1875 and named after Thomas Jefferson, the third president of the United States.
Geography
Jefferson County covers an area of 1,717 square miles and is located in the Snake River Plain region of Idaho. The county is mostly flat, with the exception of the foothills of the Teton Range in the south. The Snake River runs through the county, and there are several small lakes and reservoirs. The climate is semi-arid, with hot summers and cold winters.
The county is home to several wildlife refuges, including the Grays Lake National Wildlife Refuge, the Red Rock Lakes National Wildlife Refuge, and the Camas National Wildlife Refuge. There are also several state parks, including the Harriman State Park, the Henrys Lake State Park, and the Teton Reservoir State Park.
Economy
The economy of Jefferson County is largely based on agriculture and tourism. The county is home to several large farms, which produce a variety of crops, including potatoes, wheat, barley, and hay. The county is also home to several large dairies, which produce milk, cheese, and other dairy products.
Tourism is an important part of the economy, with visitors coming to the county to enjoy the natural beauty of the area. The county is home to several ski resorts, including Grand Targhee Resort and Jackson Hole Mountain Resort. There are also several national parks and monuments in the area, including Yellowstone National Park and Grand Teton National Park.
Demographics
As of the 2010 census, the population of Jefferson County was 26,140. The population is mostly white (94.3%), with small percentages of Native American (2.2%), Asian (1.2%), and African American (0.5%) populations. The median household income is $45,845, and the median home value is $164,400.
The county is served by the Jefferson County School District, which includes seven elementary schools, two middle schools, and two high schools. The county is also home to several higher education institutions, including Brigham Young University-Idaho and Idaho State University.
Conclusion
Jefferson County, Idaho is a rural county located in the southeastern corner of the state. The county is home to several large farms and dairies, as well as several ski resorts and national parks. The population is mostly white, with small percentages of Native American, Asian, and African American populations. The economy is largely based on agriculture and tourism, and the county is served by the Jefferson County School District.
Common Questions
What is the Total Population of Jefferson County?
Total Population of Jefferson County is 31,383.
What is the Total Male Population of Jefferson County?
Total Male Population of Jefferson County is 16,051.
What is the Total Female Population of Jefferson County?
Total Female Population of Jefferson County is 15,332.
What is the Ratio of Males per 100 Females in Jefferson County?
There are 104.69 Males per 100 Females in Jefferson County.
What is the Ratio of Females per 100 Males in Jefferson County?
There are 95.52 Females per 100 Males in Jefferson County.
What is the Median Population Age in Jefferson County?
Median Population Age in Jefferson County is 31.7 Years.
What is the Average Family Size in Jefferson County
Average Family Size in Jefferson County is 3.7 People.
What is the Average Household Size in Jefferson County
Average Household Size in Jefferson County is 3.2 People.
What is Per Capita Income in Jefferson County?
Per Capita income in Jefferson County is $29,028.
What is the Median Family Income in Jefferson County?
Median Family Income in Jefferson County is $84,941.
What is the Median Household income in Jefferson County?
Median Household Income in Jefferson County is $77,491.
What is Income or Wage Gap in Jefferson County?
Income or Wage Gap in Jefferson County is 54.3%.
Women in Jefferson County earn 45.7 cents for every dollar earned by a man.
What is Family Income Deficit in Jefferson County?
Family Income Deficit in Jefferson County is $10,320.
Families that are below poverty line in Jefferson County earn $10,320 less on average than the poverty threshold level.
What is Inequality or Gini Index in Jefferson County?
Inequality or Gini Index in Jefferson County is 0.38.
How Large is the Labor Force in Jefferson County?
There are 14,749 People in the Labor Forcein in Jefferson County.
What is the Percentage of People in the Labor Force in Jefferson County?
66.4% of People are in the Labor Force in Jefferson County.
What is the Unemployment Rate in Jefferson County?
Unemployment Rate in Jefferson County is 2.4%.