Gooding County, ID
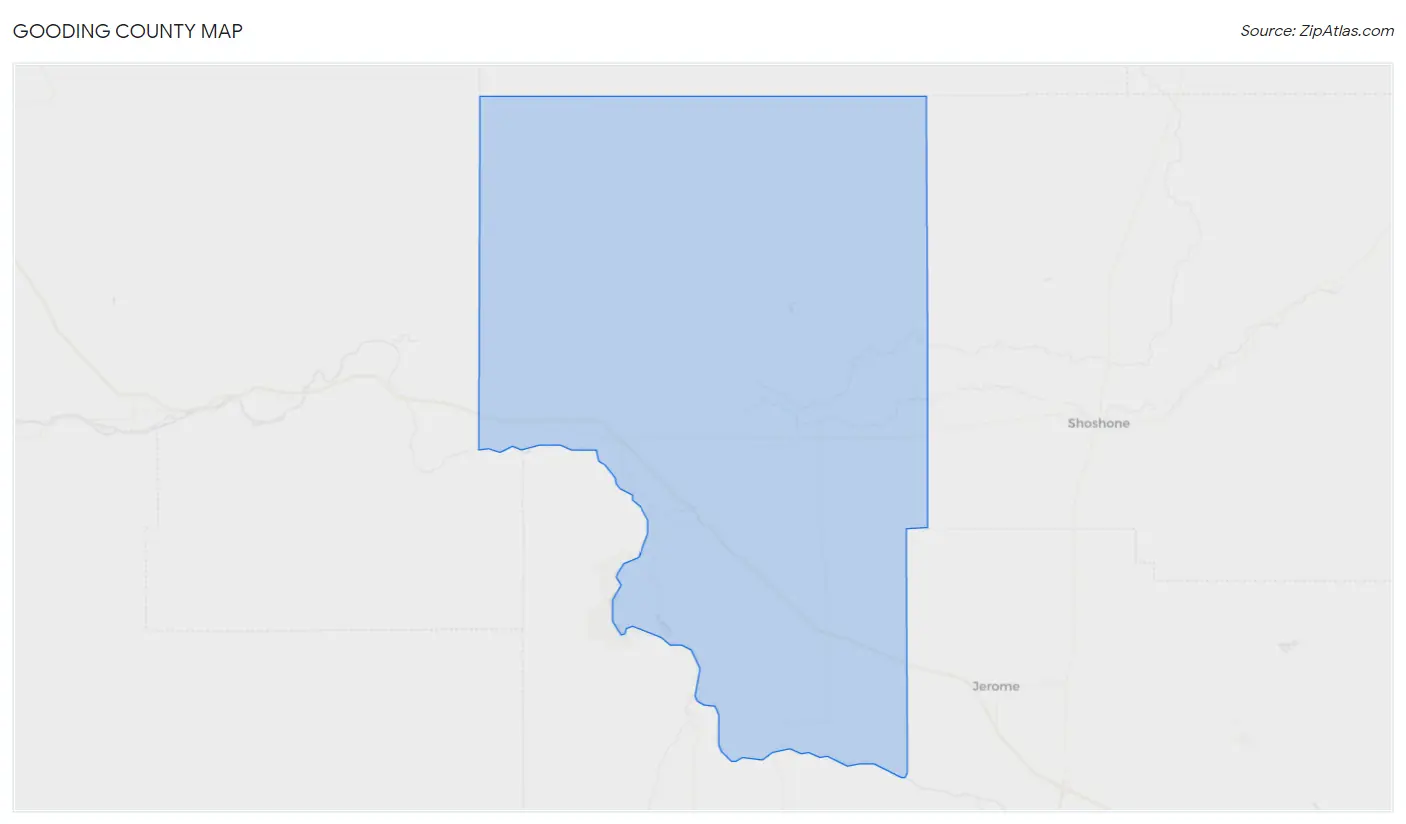
Gooding County Map
Gooding County Overview
15,520
TOTAL POPULATION
7,917
MALE POPULATION
7,603
FEMALE POPULATION
104.13
MALES / 100 FEMALES
96.03
FEMALES / 100 MALES
38.3
MEDIAN AGE
3.5
AVG FAMILY SIZE
2.9
AVG HOUSEHOLD SIZE
$29,147
PER CAPITA INCOME
$73,696
AVG FAMILY INCOME
$60,938
AVG HOUSEHOLD INCOME
37.7%
WAGE / INCOME GAP [ % ]
62.3¢/ $1
WAGE / INCOME GAP [ $ ]
0.45
INEQUALITY / GINI INDEX
7,444
LABOR FORCE [ PEOPLE ]
62.8%
PERCENT IN LABOR FORCE
3.5%
UNEMPLOYMENT RATE
Gooding County Area Codes
Race in Gooding County
The most populous races in Gooding County are White / Caucasian (12,127 | 78.1%), Hispanic or Latino (4,630 | 29.8%), and Some other Race (1,586 | 10.2%).
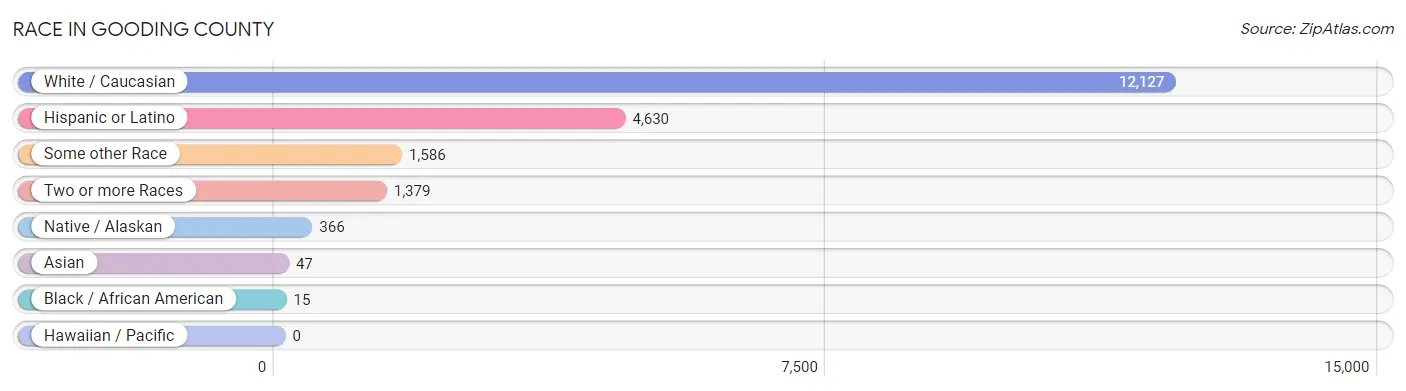
| Race | # Population | % Population |
| Asian | 47 | 0.3% |
| Black / African American | 15 | 0.1% |
| Hawaiian / Pacific | 0 | 0.0% |
| Hispanic or Latino | 4,630 | 29.8% |
| Native / Alaskan | 366 | 2.4% |
| White / Caucasian | 12,127 | 78.1% |
| Two or more Races | 1,379 | 8.9% |
| Some other Race | 1,586 | 10.2% |
| Total | 15,520 | 100.0% |
Ancestry in Gooding County
The most populous ancestries reported in Gooding County are Mexican (4,376 | 28.2%), English (2,230 | 14.4%), German (1,826 | 11.8%), Irish (1,028 | 6.6%), and American (821 | 5.3%), together accounting for 66.3% of all Gooding County residents.
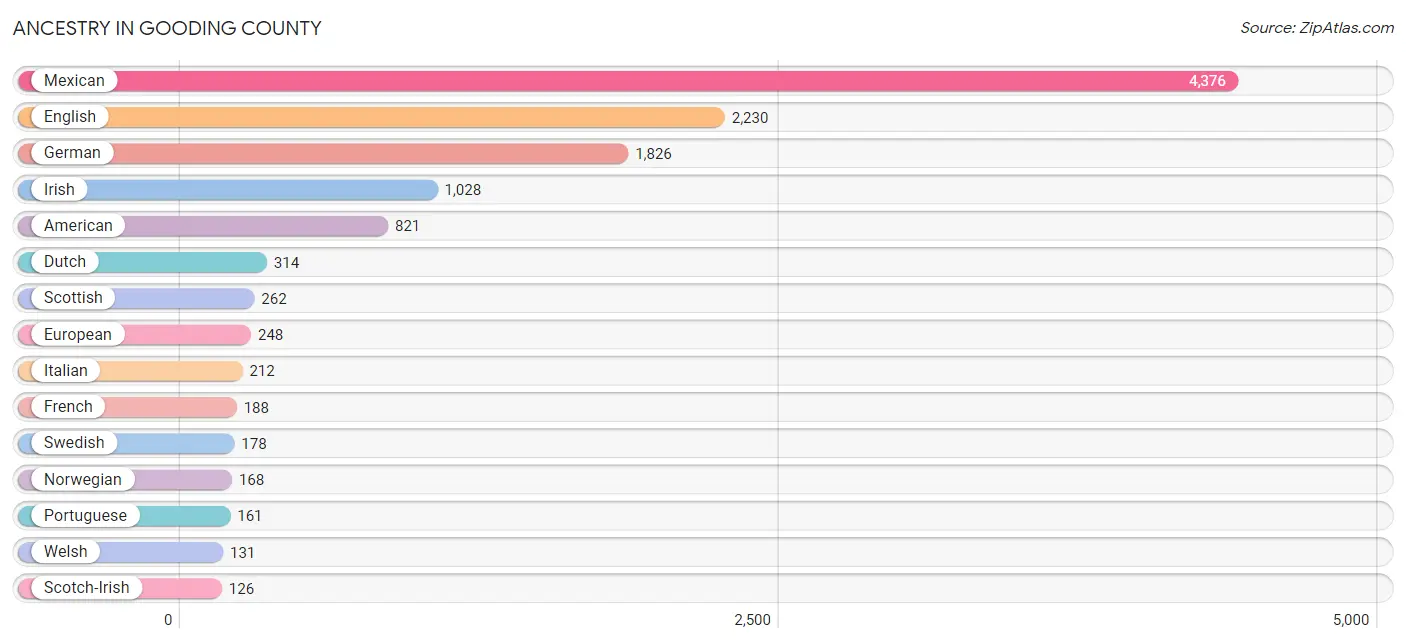
| Ancestry | # Population | % Population |
| American | 821 | 5.3% |
| Arab | 2 | 0.0% |
| Argentinean | 1 | 0.0% |
| Armenian | 6 | 0.0% |
| Australian | 6 | 0.0% |
| Basque | 123 | 0.8% |
| Belgian | 2 | 0.0% |
| Bhutanese | 15 | 0.1% |
| Bolivian | 1 | 0.0% |
| Brazilian | 1 | 0.0% |
| British | 19 | 0.1% |
| Canadian | 8 | 0.1% |
| Central American | 47 | 0.3% |
| Cherokee | 37 | 0.2% |
| Chickasaw | 2 | 0.0% |
| Chilean | 36 | 0.2% |
| Colombian | 16 | 0.1% |
| Colville | 61 | 0.4% |
| Czech | 36 | 0.2% |
| Czechoslovakian | 21 | 0.1% |
| Danish | 82 | 0.5% |
| Delaware | 8 | 0.1% |
| Dutch | 314 | 2.0% |
| English | 2,230 | 14.4% |
| European | 248 | 1.6% |
| Finnish | 94 | 0.6% |
| French | 188 | 1.2% |
| French Canadian | 36 | 0.2% |
| German | 1,826 | 11.8% |
| Greek | 45 | 0.3% |
| Guatemalan | 47 | 0.3% |
| Indian (Asian) | 10 | 0.1% |
| Irish | 1,028 | 6.6% |
| Italian | 212 | 1.4% |
| Korean | 10 | 0.1% |
| Mexican | 4,376 | 28.2% |
| Mexican American Indian | 64 | 0.4% |
| Navajo | 22 | 0.1% |
| Norwegian | 168 | 1.1% |
| Peruvian | 46 | 0.3% |
| Polish | 21 | 0.1% |
| Portuguese | 161 | 1.0% |
| Romanian | 1 | 0.0% |
| Russian | 39 | 0.3% |
| Scandinavian | 38 | 0.2% |
| Scotch-Irish | 126 | 0.8% |
| Scottish | 262 | 1.7% |
| Shoshone | 54 | 0.4% |
| Sioux | 7 | 0.1% |
| South American | 100 | 0.6% |
| South American Indian | 1 | 0.0% |
| Spaniard | 11 | 0.1% |
| Spanish | 59 | 0.4% |
| Subsaharan African | 7 | 0.1% |
| Swedish | 178 | 1.1% |
| Swiss | 58 | 0.4% |
| Thai | 18 | 0.1% |
| Ukrainian | 4 | 0.0% |
| Welsh | 131 | 0.8% |
| Yakama | 2 | 0.0% |
| Yaqui | 38 | 0.2% |
| Yugoslavian | 20 | 0.1% | View All 62 Rows |
Immigrants in Gooding County
The most numerous immigrant groups reported in Gooding County came from Latin America (1,773 | 11.4%), Central America (1,652 | 10.6%), Mexico (1,605 | 10.3%), South America (121 | 0.8%), and Peru (84 | 0.5%), together accounting for 33.7% of all Gooding County residents.
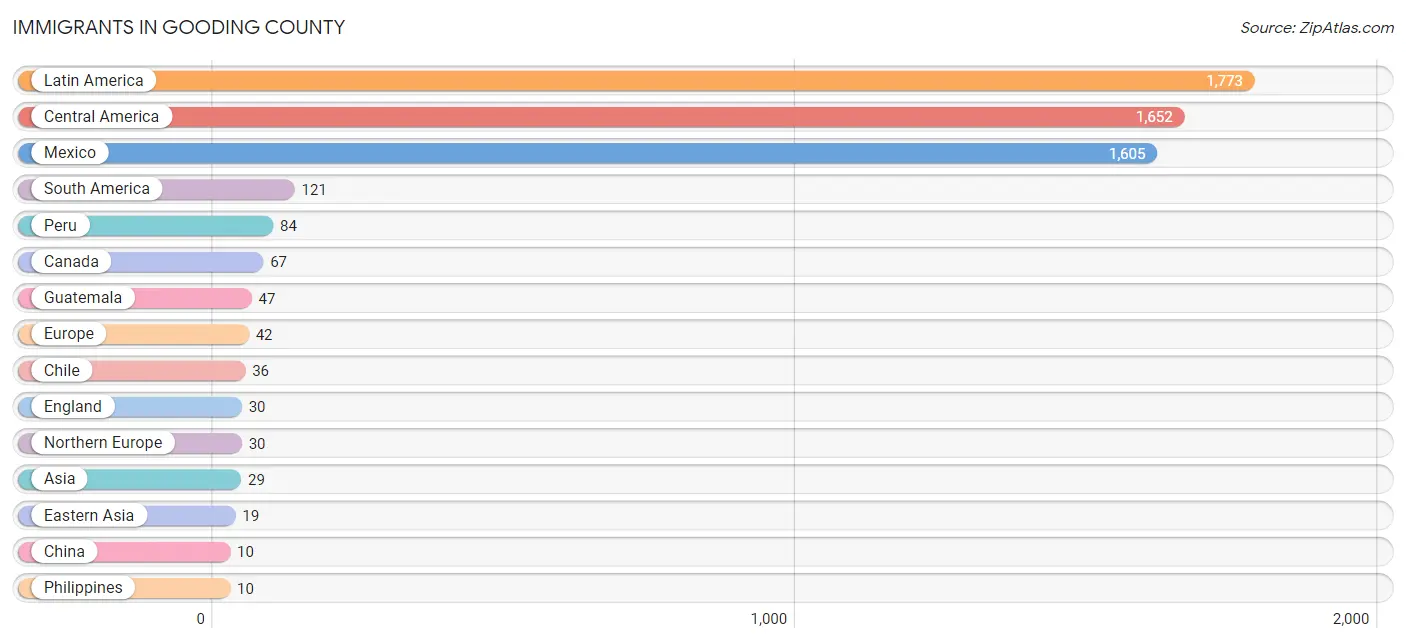
| Immigration Origin | # Population | % Population |
| Asia | 29 | 0.2% |
| Australia | 6 | 0.0% |
| Brazil | 1 | 0.0% |
| Canada | 67 | 0.4% |
| Central America | 1,652 | 10.6% |
| Chile | 36 | 0.2% |
| China | 10 | 0.1% |
| Eastern Asia | 19 | 0.1% |
| England | 30 | 0.2% |
| Europe | 42 | 0.3% |
| Germany | 5 | 0.0% |
| Guatemala | 47 | 0.3% |
| Japan | 9 | 0.1% |
| Latin America | 1,773 | 11.4% |
| Mexico | 1,605 | 10.3% |
| Northern Europe | 30 | 0.2% |
| Oceania | 6 | 0.0% |
| Peru | 84 | 0.5% |
| Philippines | 10 | 0.1% |
| Portugal | 7 | 0.1% |
| South America | 121 | 0.8% |
| South Eastern Asia | 10 | 0.1% |
| Southern Europe | 7 | 0.1% |
| Western Europe | 5 | 0.0% | View All 24 Rows |
Sex and Age in Gooding County
Sex and Age in Gooding County
The most populous age groups in Gooding County are 5 to 9 Years (621 | 7.8%) for men and 10 to 14 Years (754 | 9.9%) for women.
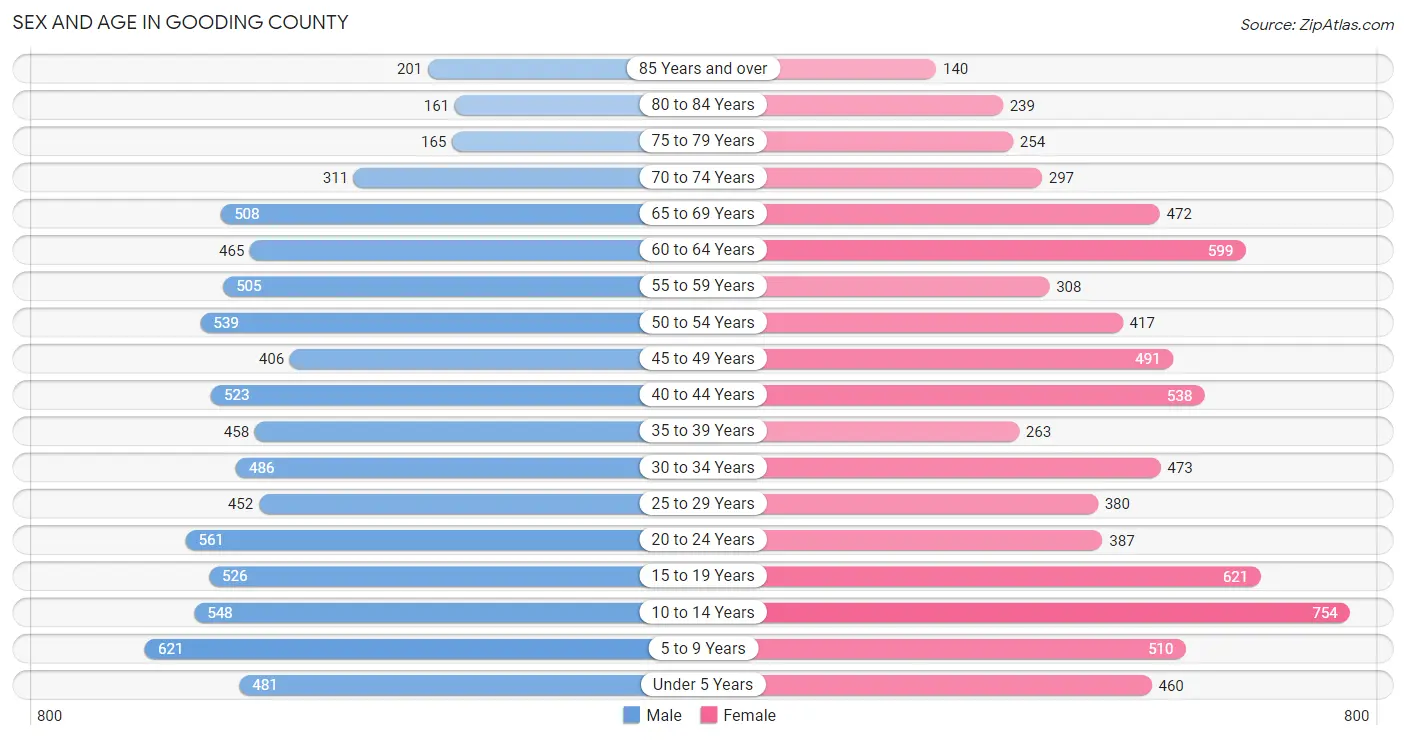
| Age Bracket | Male | Female |
| Under 5 Years | 481 (6.1%) | 460 (6.0%) |
| 5 to 9 Years | 621 (7.8%) | 510 (6.7%) |
| 10 to 14 Years | 548 (6.9%) | 754 (9.9%) |
| 15 to 19 Years | 526 (6.6%) | 621 (8.2%) |
| 20 to 24 Years | 561 (7.1%) | 387 (5.1%) |
| 25 to 29 Years | 452 (5.7%) | 380 (5.0%) |
| 30 to 34 Years | 486 (6.1%) | 473 (6.2%) |
| 35 to 39 Years | 458 (5.8%) | 263 (3.5%) |
| 40 to 44 Years | 523 (6.6%) | 538 (7.1%) |
| 45 to 49 Years | 406 (5.1%) | 491 (6.5%) |
| 50 to 54 Years | 539 (6.8%) | 417 (5.5%) |
| 55 to 59 Years | 505 (6.4%) | 308 (4.1%) |
| 60 to 64 Years | 465 (5.9%) | 599 (7.9%) |
| 65 to 69 Years | 508 (6.4%) | 472 (6.2%) |
| 70 to 74 Years | 311 (3.9%) | 297 (3.9%) |
| 75 to 79 Years | 165 (2.1%) | 254 (3.3%) |
| 80 to 84 Years | 161 (2.0%) | 239 (3.1%) |
| 85 Years and over | 201 (2.5%) | 140 (1.8%) |
| Total | 7,917 (100.0%) | 7,603 (100.0%) |
Families and Households in Gooding County
Median Family Size in Gooding County
The median family size in Gooding County is 3.48 persons per family, with married-couple families (2,948 | 79.9%) accounting for the largest median family size of 3.55 persons per family. On the other hand, single male/father families (350 | 9.5%) represent the smallest median family size with 2.87 persons per family.
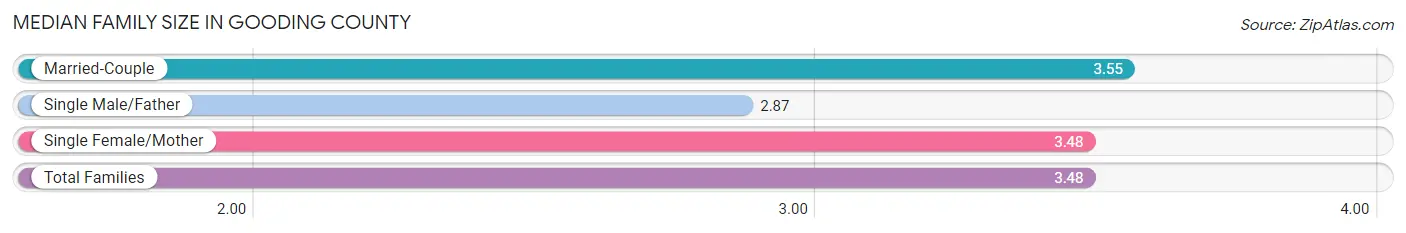
| Family Type | # Families | Family Size |
| Married-Couple | 2,948 (79.9%) | 3.55 |
| Single Male/Father | 350 (9.5%) | 2.87 |
| Single Female/Mother | 390 (10.6%) | 3.48 |
| Total Families | 3,688 (100.0%) | 3.48 |
Median Household Size in Gooding County
The median household size in Gooding County is 2.85 persons per household, with married-couple households (2,948 | 54.5%) accounting for the largest median household size of 3.61 persons per household. non-family households (1,725 | 31.9%) represent the smallest median household size with 1.31 persons per household.
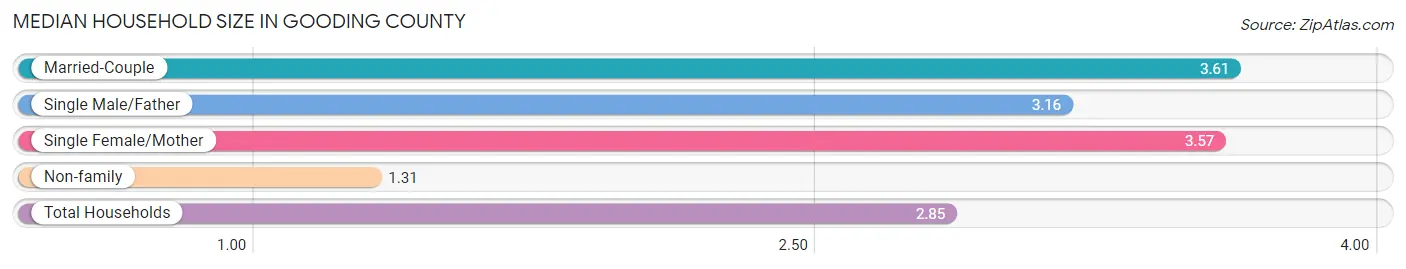
| Household Type | # Households | Household Size |
| Married-Couple | 2,948 (54.5%) | 3.61 |
| Single Male/Father | 350 (6.5%) | 3.16 |
| Single Female/Mother | 390 (7.2%) | 3.57 |
| Non-family | 1,725 (31.9%) | 1.31 |
| Total Households | 5,413 (100.0%) | 2.85 |
Household Size by Marriage Status in Gooding County
Out of a total of 5,413 households in Gooding County, 3,688 (68.1%) are family households, while 1,725 (31.9%) are nonfamily households. The most numerous type of family households are 2-person households, comprising 1,756, and the most common type of nonfamily households are 1-person households, comprising 1,409.
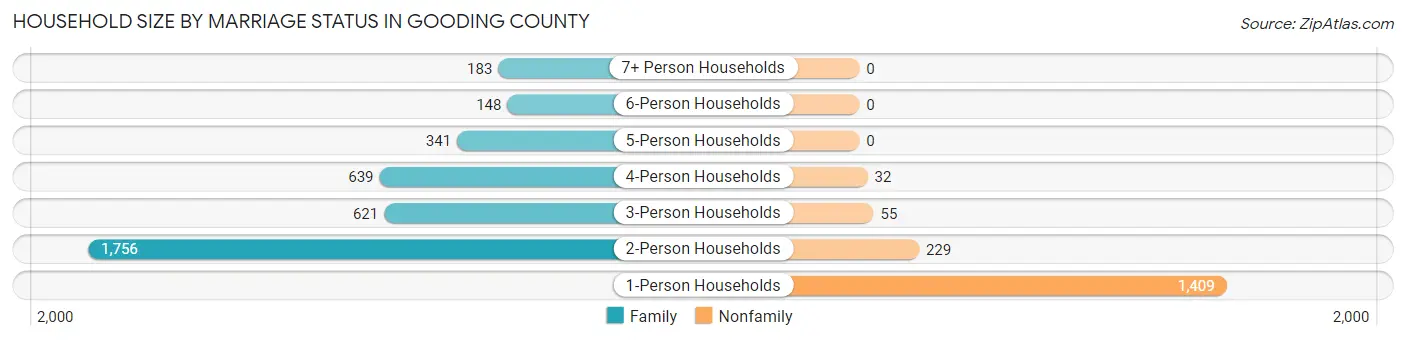
| Household Size | Family Households | Nonfamily Households |
| 1-Person Households | - | 1,409 (26.0%) |
| 2-Person Households | 1,756 (32.4%) | 229 (4.2%) |
| 3-Person Households | 621 (11.5%) | 55 (1.0%) |
| 4-Person Households | 639 (11.8%) | 32 (0.6%) |
| 5-Person Households | 341 (6.3%) | 0 (0.0%) |
| 6-Person Households | 148 (2.7%) | 0 (0.0%) |
| 7+ Person Households | 183 (3.4%) | 0 (0.0%) |
| Total | 3,688 (68.1%) | 1,725 (31.9%) |
Female Fertility in Gooding County
Fertility by Age in Gooding County
Average fertility rate in Gooding County is 101.0 births per 1,000 women. Women in the age bracket of 20 to 34 years have the highest fertility rate with 162.0 births per 1,000 women. Women in the age bracket of 20 to 34 years acount for 62.6% of all women with births.
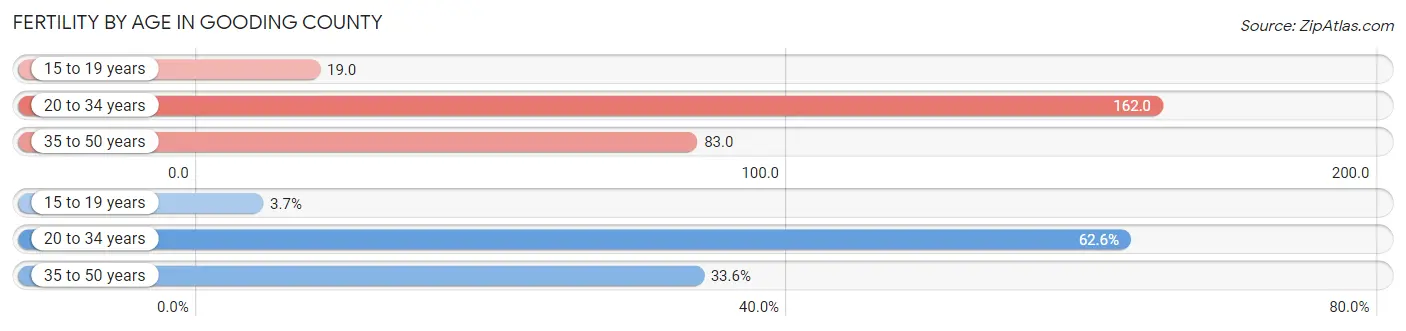
| Age Bracket | Women with Births | Births / 1,000 Women |
| 15 to 19 years | 12 (3.7%) | 19.0 |
| 20 to 34 years | 201 (62.6%) | 162.0 |
| 35 to 50 years | 108 (33.6%) | 83.0 |
| Total | 321 (100.0%) | 101.0 |
Fertility by Age by Marriage Status in Gooding County
88.2% of women with births (321) in Gooding County are married. The highest percentage of unmarried women with births falls into 15 to 19 years age bracket with 100.0% of them unmarried at the time of birth, while the lowest percentage of unmarried women with births belong to 35 to 50 years age bracket with 6.5% of them unmarried.
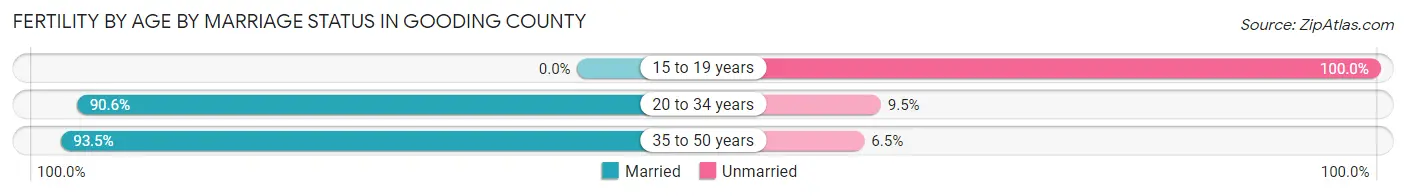
| Age Bracket | Married | Unmarried |
| 15 to 19 years | 0 (0.0%) | 12 (100.0%) |
| 20 to 34 years | 182 (90.5%) | 19 (9.5%) |
| 35 to 50 years | 101 (93.5%) | 7 (6.5%) |
| Total | 283 (88.2%) | 38 (11.8%) |
Fertility by Education in Gooding County
Average fertility rate in Gooding County is 101.0 births per 1,000 women. Women with the education attainment of graduate degree have the highest fertility rate of 571.0 births per 1,000 women, while women with the education attainment of college or associate's degree have the lowest fertility at 28.0 births per 1,000 women. Women with the education attainment of less than high school represent 46.1% of all women with births.
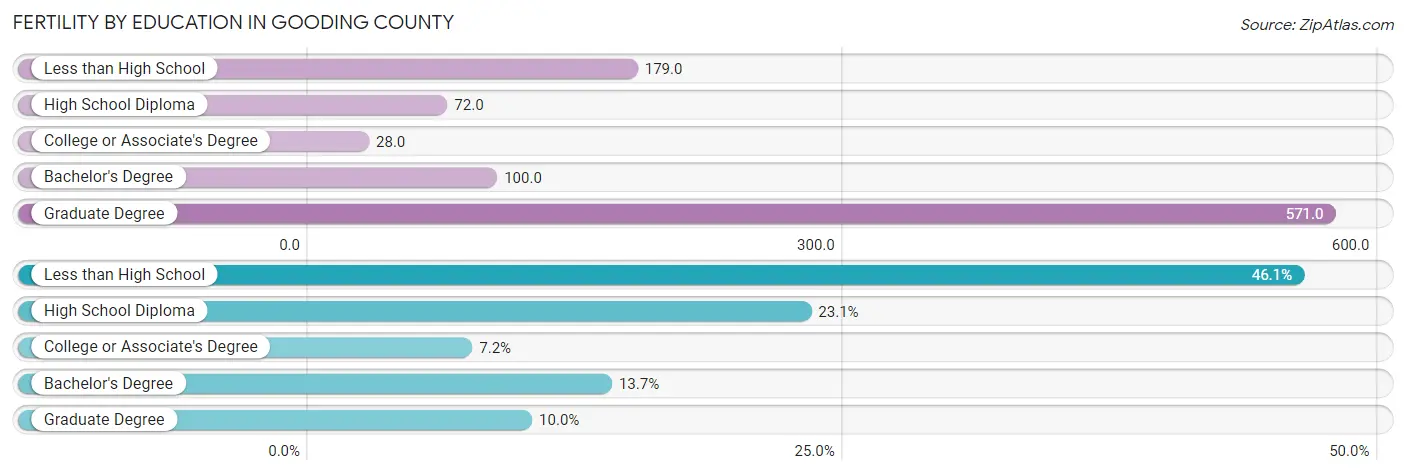
| Educational Attainment | Women with Births | Births / 1,000 Women |
| Less than High School | 148 (46.1%) | 179.0 |
| High School Diploma | 74 (23.1%) | 72.0 |
| College or Associate's Degree | 23 (7.2%) | 28.0 |
| Bachelor's Degree | 44 (13.7%) | 100.0 |
| Graduate Degree | 32 (10.0%) | 571.0 |
| Total | 321 (100.0%) | 101.0 |
Fertility by Education by Marriage Status in Gooding County
11.8% of women with births in Gooding County are unmarried. Women with the educational attainment of bachelor's degree are most likely to be married with 100.0% of them married at childbirth, while women with the educational attainment of college or associate's degree are least likely to be married with 26.1% of them unmarried at childbirth.
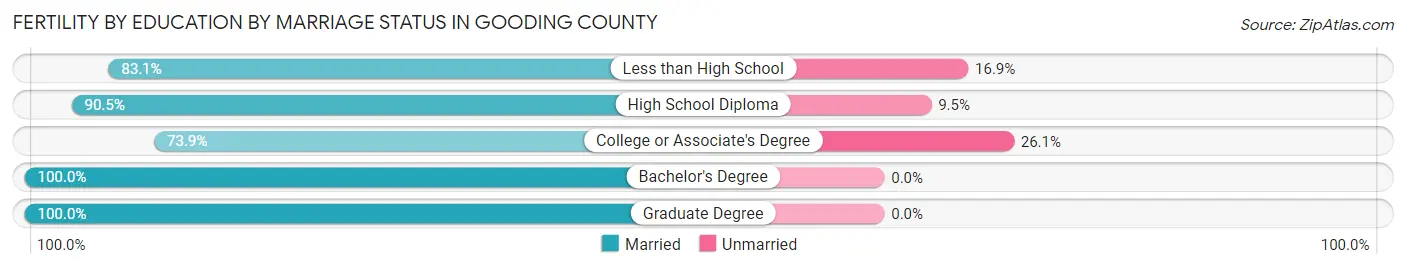
| Educational Attainment | Married | Unmarried |
| Less than High School | 123 (83.1%) | 25 (16.9%) |
| High School Diploma | 67 (90.5%) | 7 (9.5%) |
| College or Associate's Degree | 17 (73.9%) | 6 (26.1%) |
| Bachelor's Degree | 44 (100.0%) | 0 (0.0%) |
| Graduate Degree | 32 (100.0%) | 0 (0.0%) |
| Total | 283 (88.2%) | 38 (11.8%) |
Income in Gooding County
Income Overview in Gooding County
Per Capita Income in Gooding County is $29,147, while median incomes of families and households are $73,696 and $60,938 respectively.
| Characteristic | Number | Measure |
| Per Capita Income | 15,520 | $29,147 |
| Median Family Income | 3,688 | $73,696 |
| Mean Family Income | 3,688 | $86,262 |
| Median Household Income | 5,413 | $60,938 |
| Mean Household Income | 5,413 | $78,884 |
| Income Deficit | 3,688 | $0 |
| Wage / Income Gap (%) | 15,520 | 37.73% |
| Wage / Income Gap ($) | 15,520 | 62.27¢ per $1 |
| Gini / Inequality Index | 15,520 | 0.45 |
Earnings by Sex in Gooding County
Average Earnings in Gooding County are $32,967, $37,372 for men and $23,272 for women, a difference of 37.7%.
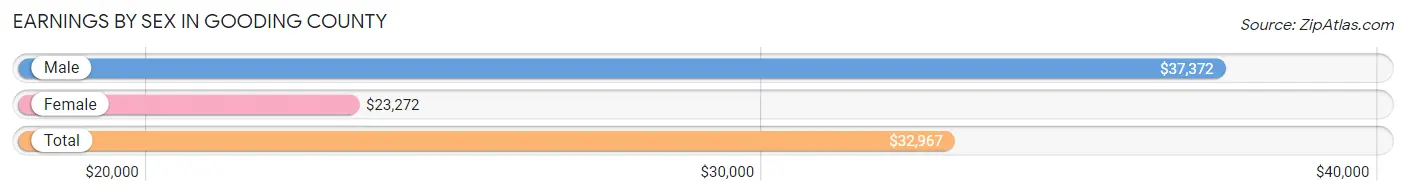
| Sex | Number | Average Earnings |
| Male | 4,460 (57.7%) | $37,372 |
| Female | 3,264 (42.3%) | $23,272 |
| Total | 7,724 (100.0%) | $32,967 |
Earnings by Sex by Income Bracket in Gooding County
The most common earnings brackets in Gooding County are $30,000 to $34,999 for men (432 | 9.7%) and $22,500 to $24,999 for women (337 | 10.3%).
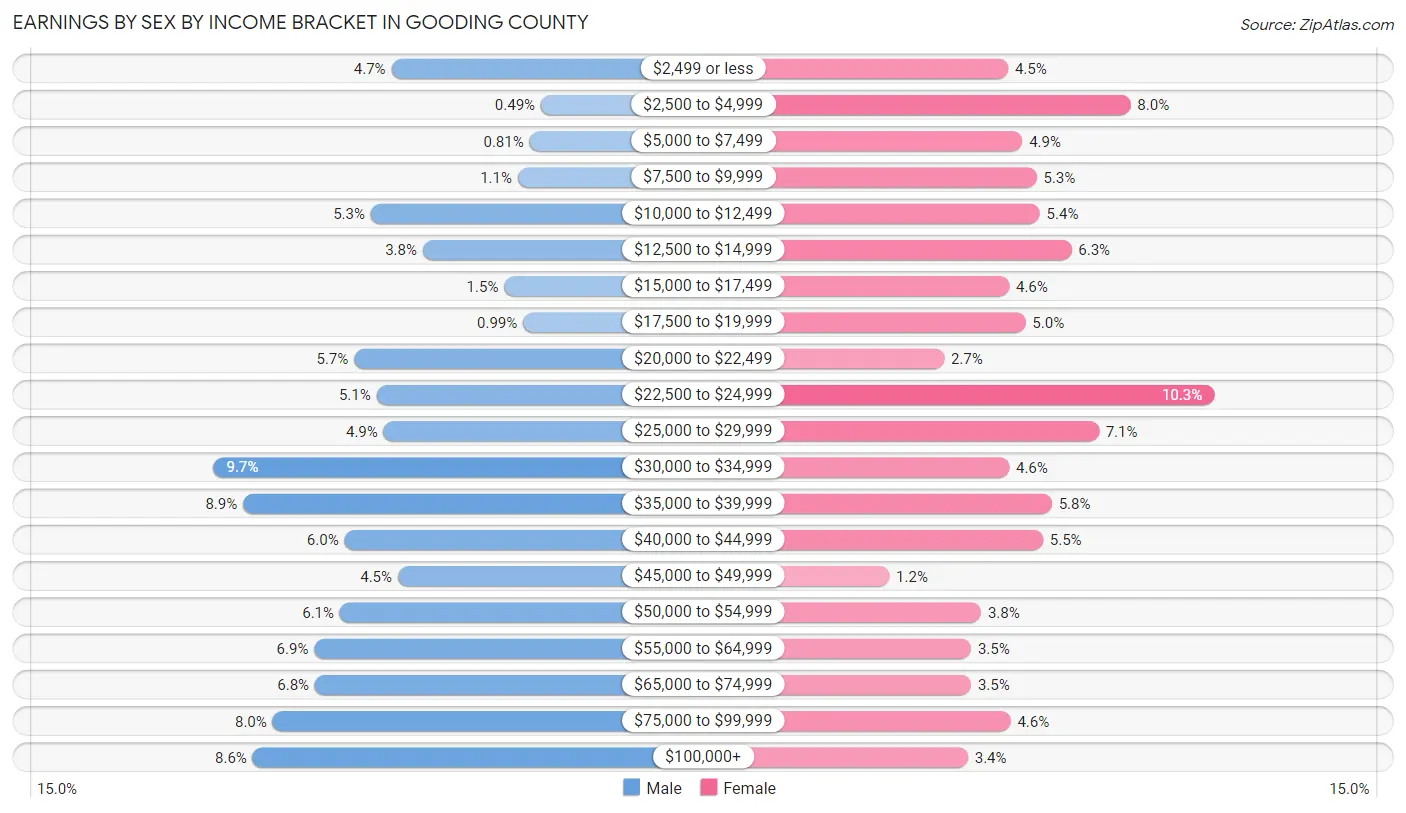
| Income | Male | Female |
| $2,499 or less | 209 (4.7%) | 148 (4.5%) |
| $2,500 to $4,999 | 22 (0.5%) | 260 (8.0%) |
| $5,000 to $7,499 | 36 (0.8%) | 161 (4.9%) |
| $7,500 to $9,999 | 51 (1.1%) | 174 (5.3%) |
| $10,000 to $12,499 | 235 (5.3%) | 177 (5.4%) |
| $12,500 to $14,999 | 170 (3.8%) | 206 (6.3%) |
| $15,000 to $17,499 | 68 (1.5%) | 149 (4.6%) |
| $17,500 to $19,999 | 44 (1.0%) | 164 (5.0%) |
| $20,000 to $22,499 | 256 (5.7%) | 89 (2.7%) |
| $22,500 to $24,999 | 228 (5.1%) | 337 (10.3%) |
| $25,000 to $29,999 | 219 (4.9%) | 231 (7.1%) |
| $30,000 to $34,999 | 432 (9.7%) | 149 (4.6%) |
| $35,000 to $39,999 | 395 (8.9%) | 188 (5.8%) |
| $40,000 to $44,999 | 268 (6.0%) | 180 (5.5%) |
| $45,000 to $49,999 | 201 (4.5%) | 39 (1.2%) |
| $50,000 to $54,999 | 274 (6.1%) | 123 (3.8%) |
| $55,000 to $64,999 | 306 (6.9%) | 114 (3.5%) |
| $65,000 to $74,999 | 305 (6.8%) | 114 (3.5%) |
| $75,000 to $99,999 | 358 (8.0%) | 150 (4.6%) |
| $100,000+ | 383 (8.6%) | 111 (3.4%) |
| Total | 4,460 (100.0%) | 3,264 (100.0%) |
Earnings by Sex by Educational Attainment in Gooding County
Average earnings in Gooding County are $41,850 for men and $25,431 for women, a difference of 39.2%. Men with an educational attainment of bachelor's degree enjoy the highest average annual earnings of $67,647, while those with less than high school education earn the least with $37,204. Women with an educational attainment of bachelor's degree earn the most with the average annual earnings of $41,429, while those with high school diploma education have the smallest earnings of $19,174.
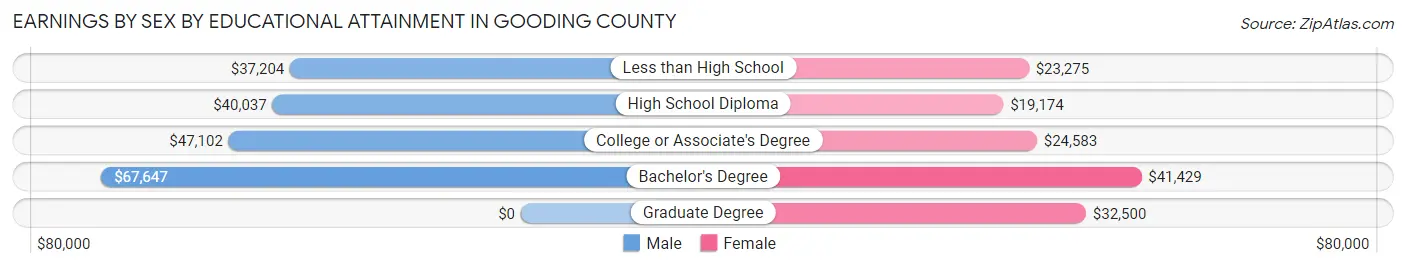
| Educational Attainment | Male Income | Female Income |
| Less than High School | $37,204 | $23,275 |
| High School Diploma | $40,037 | $19,174 |
| College or Associate's Degree | $47,102 | $24,583 |
| Bachelor's Degree | $67,647 | $41,429 |
| Graduate Degree | - | - |
| Total | $41,850 | $25,431 |
Family Income in Gooding County
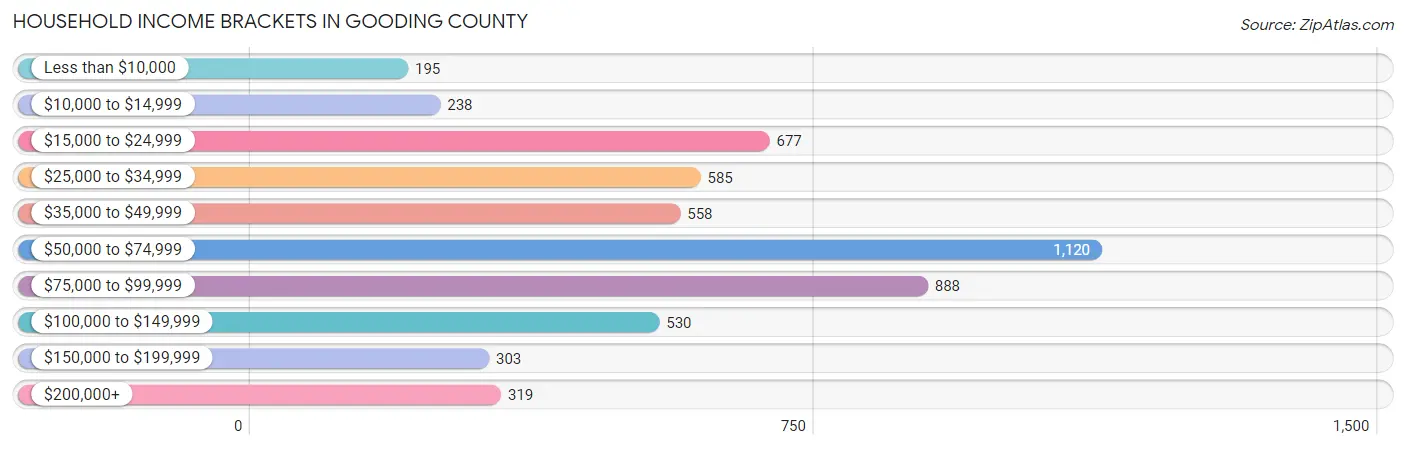
Family Income Brackets in Gooding County
According to the Gooding County family income data, there are 782 families falling into the $50,000 to $74,999 income range, which is the most common income bracket and makes up 21.2% of all families. Conversely, the less than $10,000 income bracket is the least frequent group with only 81 families (2.2%) belonging to this category.
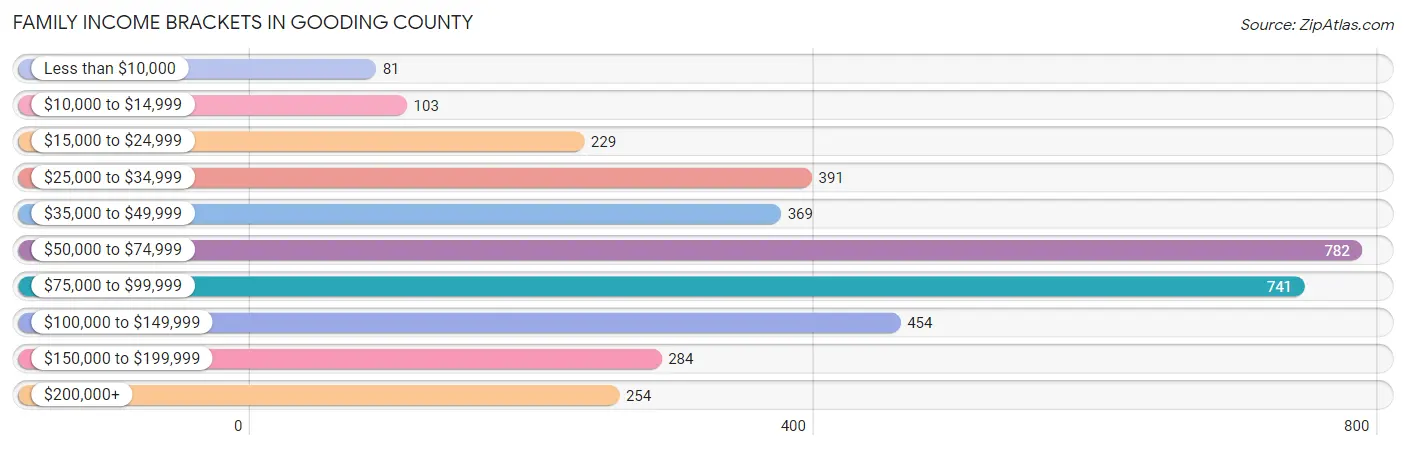
| Income Bracket | # Families | % Families |
| Less than $10,000 | 81 | 2.2% |
| $10,000 to $14,999 | 103 | 2.8% |
| $15,000 to $24,999 | 229 | 6.2% |
| $25,000 to $34,999 | 391 | 10.6% |
| $35,000 to $49,999 | 369 | 10.0% |
| $50,000 to $74,999 | 782 | 21.2% |
| $75,000 to $99,999 | 741 | 20.1% |
| $100,000 to $149,999 | 454 | 12.3% |
| $150,000 to $199,999 | 284 | 7.7% |
| $200,000+ | 254 | 6.9% |
Family Income by Famaliy Size in Gooding County
7+ person families (169 | 4.6%) account for the highest median family income in Gooding County with $213,322 per family, while 2-person families (1,845 | 50.0%) have the highest median income of $36,316 per family member.
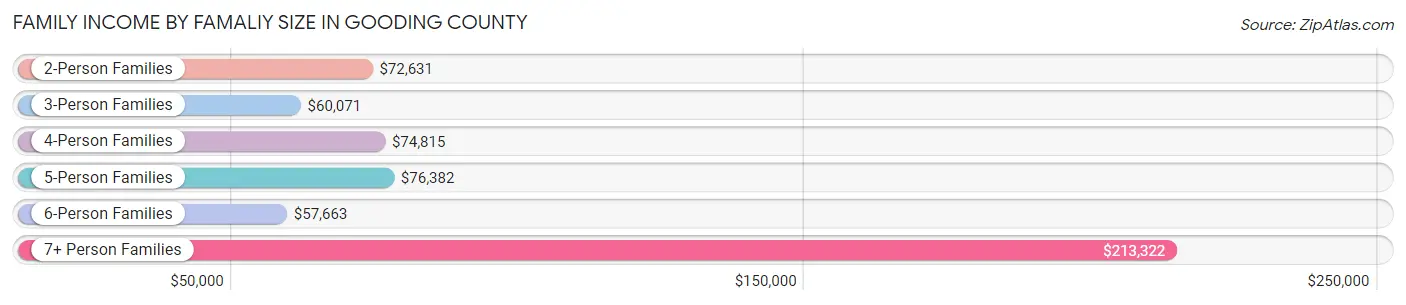
| Income Bracket | # Families | Median Income |
| 2-Person Families | 1,845 (50.0%) | $72,631 |
| 3-Person Families | 650 (17.6%) | $60,071 |
| 4-Person Families | 532 (14.4%) | $74,815 |
| 5-Person Families | 345 (9.3%) | $76,382 |
| 6-Person Families | 147 (4.0%) | $57,663 |
| 7+ Person Families | 169 (4.6%) | $213,322 |
| Total | 3,688 (100.0%) | $73,696 |
Family Income by Number of Earners in Gooding County
The median family income in Gooding County is $73,696, with families comprising 3+ earners (373) having the highest median family income of $109,514, while families with no earners (546) have the lowest median family income of $34,479, accounting for 10.1% and 14.8% of families, respectively.
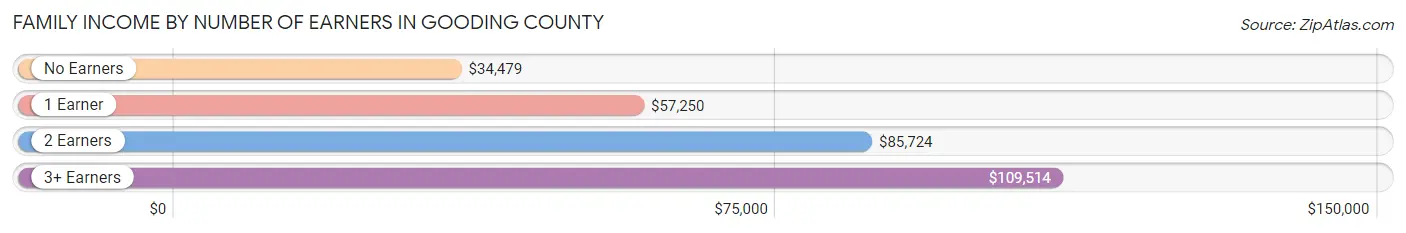
| Number of Earners | # Families | Median Income |
| No Earners | 546 (14.8%) | $34,479 |
| 1 Earner | 1,120 (30.4%) | $57,250 |
| 2 Earners | 1,649 (44.7%) | $85,724 |
| 3+ Earners | 373 (10.1%) | $109,514 |
| Total | 3,688 (100.0%) | $73,696 |
Household Income in Gooding County
Household Income Brackets in Gooding County
With 1,120 households falling in the category, the $50,000 to $74,999 income range is the most frequent in Gooding County, accounting for 20.7% of all households. In contrast, only 195 households (3.6%) fall into the less than $10,000 income bracket, making it the least populous group.
| Income Bracket | # Households | % Households |
| Less than $10,000 | 195 | 3.6% |
| $10,000 to $14,999 | 238 | 4.4% |
| $15,000 to $24,999 | 677 | 12.5% |
| $25,000 to $34,999 | 585 | 10.8% |
| $35,000 to $49,999 | 558 | 10.3% |
| $50,000 to $74,999 | 1,120 | 20.7% |
| $75,000 to $99,999 | 888 | 16.4% |
| $100,000 to $149,999 | 530 | 9.8% |
| $150,000 to $199,999 | 303 | 5.6% |
| $200,000+ | 319 | 5.9% |
Household Income by Householder Age in Gooding County
The median household income in Gooding County is $60,938, with the highest median household income of $73,790 found in the 25 to 44 years age bracket for the primary householder. A total of 1,536 households (28.4%) fall into this category. Meanwhile, the 15 to 24 years age bracket for the primary householder has the lowest median household income of $0, with 178 households (3.3%) in this group.
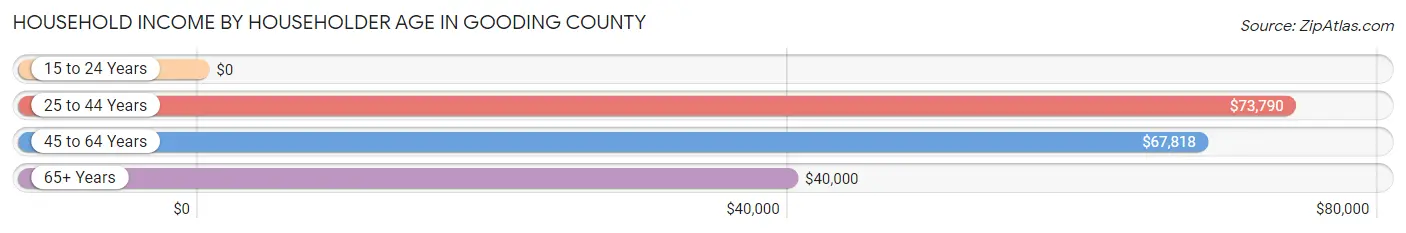
| Income Bracket | # Households | Median Income |
| 15 to 24 Years | 178 (3.3%) | $0 |
| 25 to 44 Years | 1,536 (28.4%) | $73,790 |
| 45 to 64 Years | 1,951 (36.0%) | $67,818 |
| 65+ Years | 1,748 (32.3%) | $40,000 |
| Total | 5,413 (100.0%) | $60,938 |
Poverty in Gooding County
Income Below Poverty by Sex and Age in Gooding County
With 10.3% poverty level for males and 16.4% for females among the residents of Gooding County, under 5 year old males and 5 year old females are the most vulnerable to poverty, with 135 males (28.1%) and 66 females (68.0%) in their respective age groups living below the poverty level.
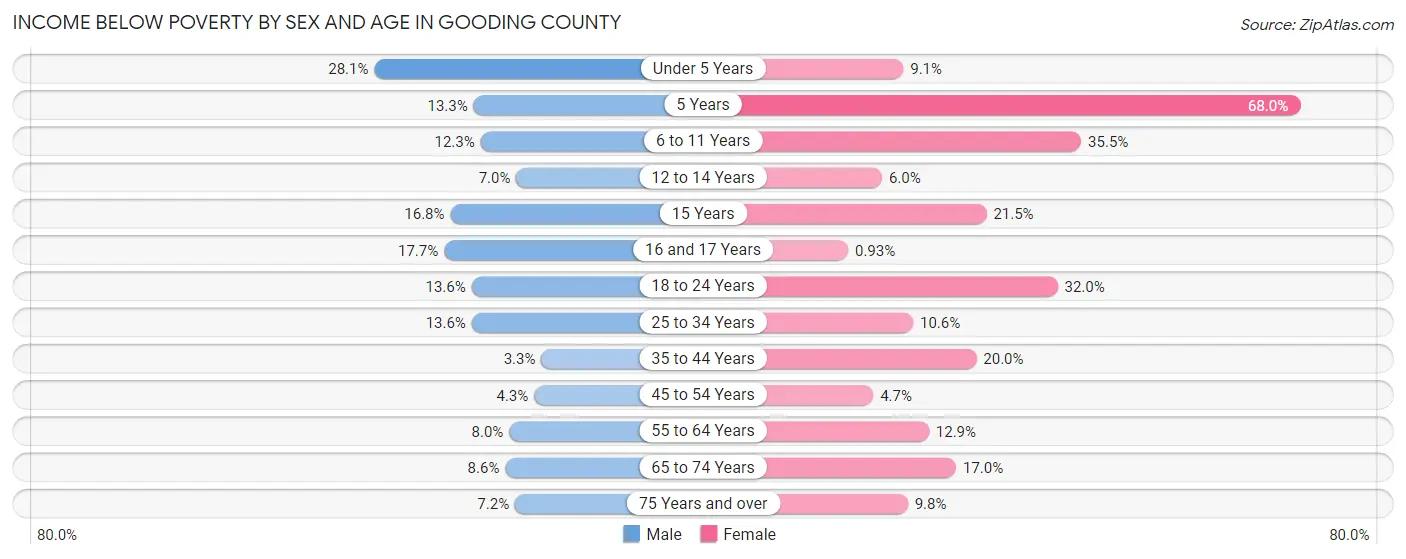
| Age Bracket | Male | Female |
| Under 5 Years | 135 (28.1%) | 42 (9.1%) |
| 5 Years | 2 (13.3%) | 66 (68.0%) |
| 6 to 11 Years | 105 (12.3%) | 269 (35.5%) |
| 12 to 14 Years | 16 (7.0%) | 24 (6.0%) |
| 15 Years | 24 (16.8%) | 32 (21.5%) |
| 16 and 17 Years | 42 (17.7%) | 2 (0.9%) |
| 18 to 24 Years | 95 (13.6%) | 206 (32.0%) |
| 25 to 34 Years | 126 (13.6%) | 90 (10.6%) |
| 35 to 44 Years | 32 (3.3%) | 160 (20.0%) |
| 45 to 54 Years | 41 (4.3%) | 42 (4.7%) |
| 55 to 64 Years | 78 (8.0%) | 117 (12.9%) |
| 65 to 74 Years | 70 (8.6%) | 130 (17.0%) |
| 75 Years and over | 37 (7.2%) | 60 (9.8%) |
| Total | 803 (10.3%) | 1,240 (16.4%) |
Income Above Poverty by Sex and Age in Gooding County
According to the poverty statistics in Gooding County, males aged 35 to 44 years and females aged 16 and 17 years are the age groups that are most secure financially, with 96.7% of males and 99.1% of females in these age groups living above the poverty line.
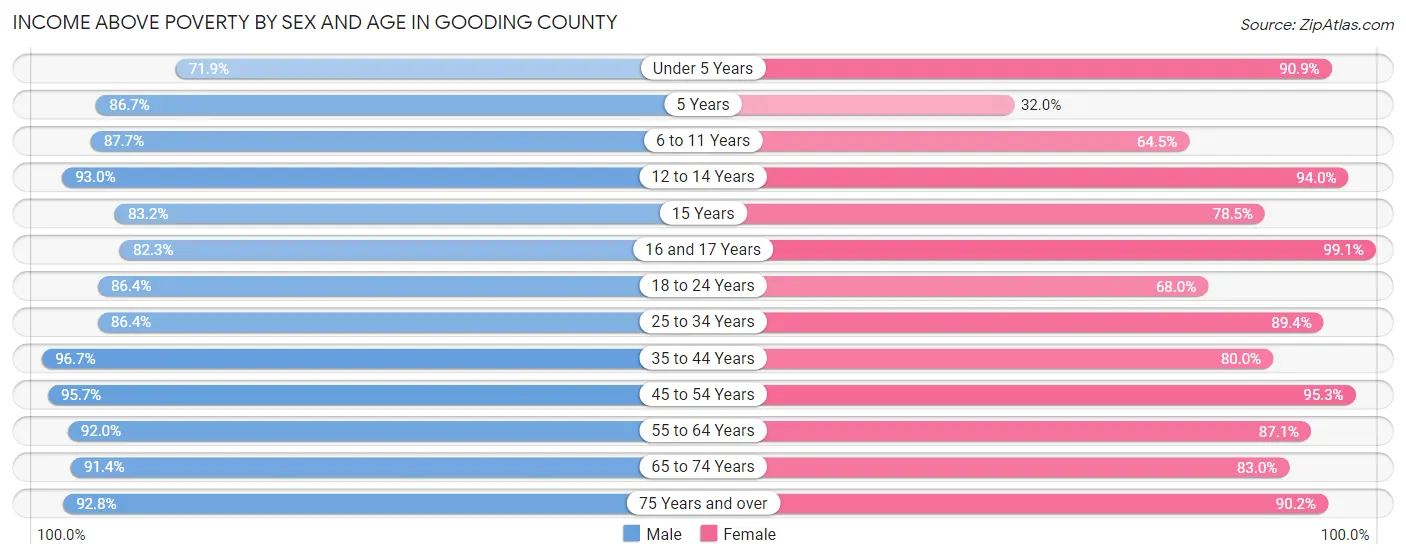
| Age Bracket | Male | Female |
| Under 5 Years | 346 (71.9%) | 418 (90.9%) |
| 5 Years | 13 (86.7%) | 31 (32.0%) |
| 6 to 11 Years | 749 (87.7%) | 488 (64.5%) |
| 12 to 14 Years | 213 (93.0%) | 378 (94.0%) |
| 15 Years | 119 (83.2%) | 117 (78.5%) |
| 16 and 17 Years | 195 (82.3%) | 212 (99.1%) |
| 18 to 24 Years | 602 (86.4%) | 437 (68.0%) |
| 25 to 34 Years | 800 (86.4%) | 761 (89.4%) |
| 35 to 44 Years | 945 (96.7%) | 641 (80.0%) |
| 45 to 54 Years | 903 (95.7%) | 857 (95.3%) |
| 55 to 64 Years | 892 (92.0%) | 788 (87.1%) |
| 65 to 74 Years | 741 (91.4%) | 636 (83.0%) |
| 75 Years and over | 478 (92.8%) | 553 (90.2%) |
| Total | 6,996 (89.7%) | 6,317 (83.6%) |
Income Below Poverty Among Married-Couple Families in Gooding County
The poverty statistics for married-couple families in Gooding County show that 6.0% or 176 of the total 2,948 families live below the poverty line. Families with 5 or more children have the highest poverty rate of 22.2%, comprising of 20 families. On the other hand, families with no children have the lowest poverty rate of 3.6%, which includes 63 families.
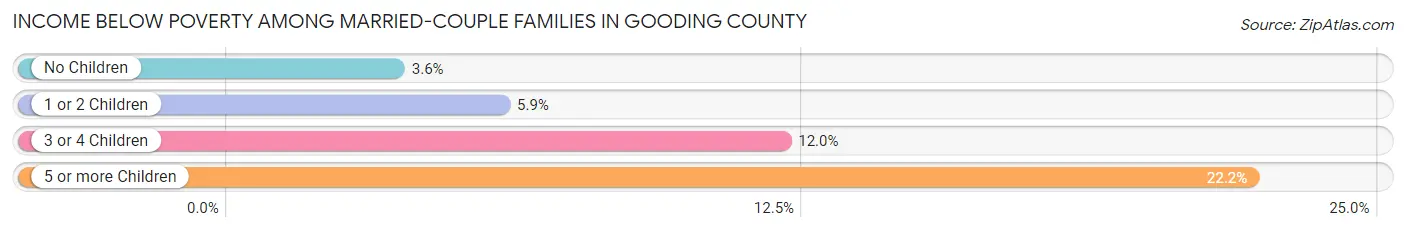
| Children | Above Poverty | Below Poverty |
| No Children | 1,671 (96.4%) | 63 (3.6%) |
| 1 or 2 Children | 651 (94.1%) | 41 (5.9%) |
| 3 or 4 Children | 380 (88.0%) | 52 (12.0%) |
| 5 or more Children | 70 (77.8%) | 20 (22.2%) |
| Total | 2,772 (94.0%) | 176 (6.0%) |
Income Below Poverty Among Single-Parent Households in Gooding County
According to the poverty data in Gooding County, 3.4% or 12 single-father households and 41.8% or 163 single-mother households are living below the poverty line. Among single-father households, those with 3 or 4 children have the highest poverty rate, with 10 households (11.4%) experiencing poverty. Likewise, among single-mother households, those with 3 or 4 children have the highest poverty rate, with 36 households (94.7%) falling below the poverty line.
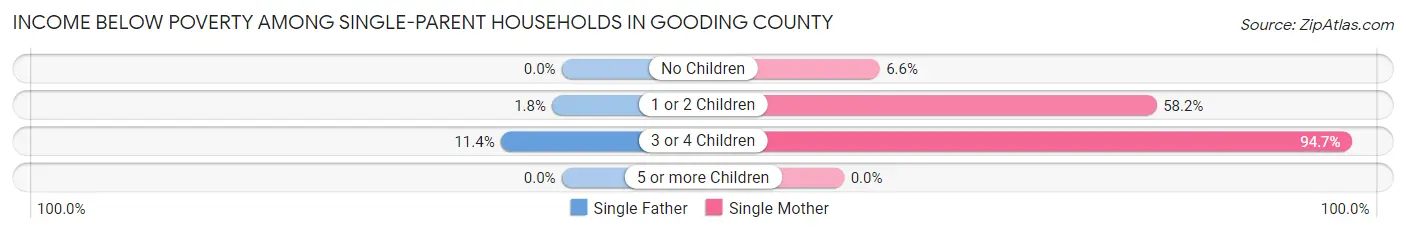
| Children | Single Father | Single Mother |
| No Children | 0 (0.0%) | 10 (6.6%) |
| 1 or 2 Children | 2 (1.8%) | 117 (58.2%) |
| 3 or 4 Children | 10 (11.4%) | 36 (94.7%) |
| 5 or more Children | 0 (0.0%) | 0 (0.0%) |
| Total | 12 (3.4%) | 163 (41.8%) |
Income Below Poverty Among Married-Couple vs Single-Parent Households in Gooding County
The poverty data for Gooding County shows that 176 of the married-couple family households (6.0%) and 175 of the single-parent households (23.6%) are living below the poverty level. Within the married-couple family households, those with 5 or more children have the highest poverty rate, with 20 households (22.2%) falling below the poverty line. Among the single-parent households, those with 1 or 2 children have the highest poverty rate, with 119 household (38.1%) living below poverty.
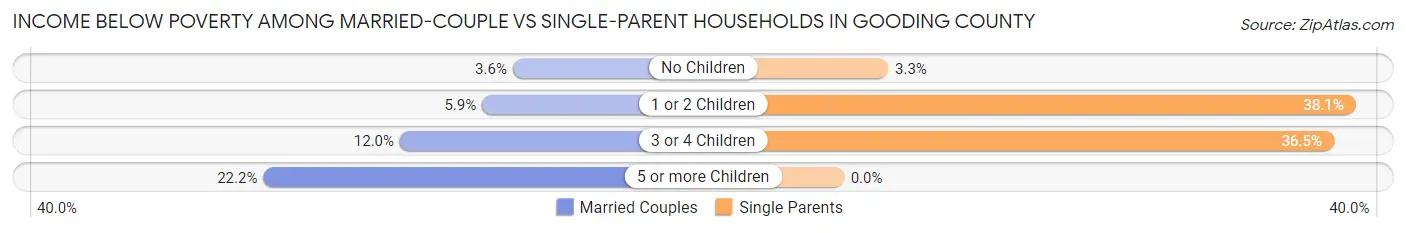
| Children | Married-Couple Families | Single-Parent Households |
| No Children | 63 (3.6%) | 10 (3.3%) |
| 1 or 2 Children | 41 (5.9%) | 119 (38.1%) |
| 3 or 4 Children | 52 (12.0%) | 46 (36.5%) |
| 5 or more Children | 20 (22.2%) | 0 (0.0%) |
| Total | 176 (6.0%) | 175 (23.6%) |
Employment Characteristics in Gooding County
Employment by Class of Employer in Gooding County
Among the 7,018 employed individuals in Gooding County, private company employees (4,322 | 61.6%), self-employed (not incorporated) (676 | 9.6%), and self-employed (incorporated) (647 | 9.2%) make up the most common classes of employment.
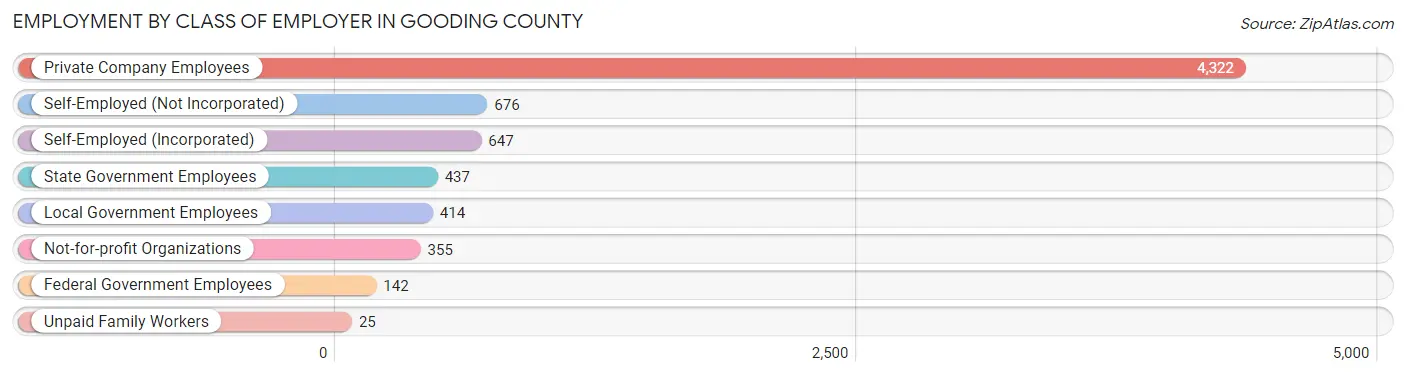
| Employer Class | # Employees | % Employees |
| Private Company Employees | 4,322 | 61.6% |
| Self-Employed (Incorporated) | 647 | 9.2% |
| Self-Employed (Not Incorporated) | 676 | 9.6% |
| Not-for-profit Organizations | 355 | 5.1% |
| Local Government Employees | 414 | 5.9% |
| State Government Employees | 437 | 6.2% |
| Federal Government Employees | 142 | 2.0% |
| Unpaid Family Workers | 25 | 0.4% |
| Total | 7,018 | 100.0% |
Employment Status by Age in Gooding County
According to the labor force statistics for Gooding County, out of the total population over 16 years of age (11,853), 62.8% or 7,444 individuals are in the labor force, with 3.5% or 261 of them unemployed. The age group with the highest labor force participation rate is 55 to 59 years, with 82.3% or 669 individuals in the labor force. Within the labor force, the 16 to 19 years age range has the highest percentage of unemployed individuals, with 22.6% or 121 of them being unemployed.
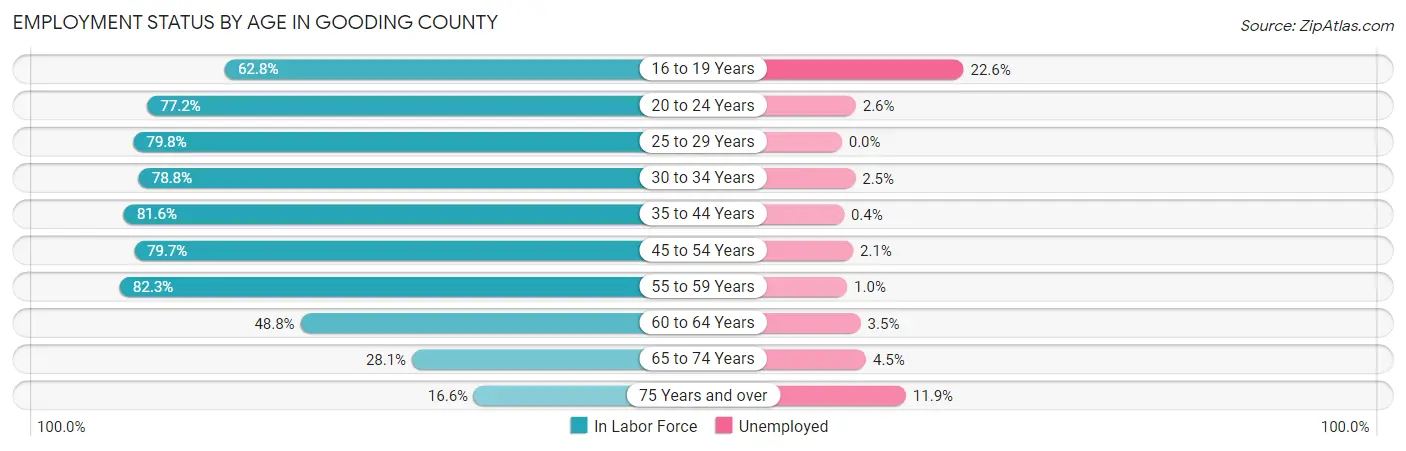
| Age Bracket | In Labor Force | Unemployed |
| 16 to 19 Years | 536 (62.8%) | 121 (22.6%) |
| 20 to 24 Years | 732 (77.2%) | 19 (2.6%) |
| 25 to 29 Years | 664 (79.8%) | 0 (0.0%) |
| 30 to 34 Years | 756 (78.8%) | 19 (2.5%) |
| 35 to 44 Years | 1,454 (81.6%) | 6 (0.4%) |
| 45 to 54 Years | 1,477 (79.7%) | 31 (2.1%) |
| 55 to 59 Years | 669 (82.3%) | 7 (1.0%) |
| 60 to 64 Years | 519 (48.8%) | 18 (3.5%) |
| 65 to 74 Years | 446 (28.1%) | 20 (4.5%) |
| 75 Years and over | 193 (16.6%) | 23 (11.9%) |
| Total | 7,444 (62.8%) | 261 (3.5%) |
Employment Status by Educational Attainment in Gooding County
According to labor force statistics for Gooding County, 75.9% of individuals (5,543) out of the total population between 25 and 64 years of age (7,303) are in the labor force, with 1.5% or 83 of them being unemployed. The group with the highest labor force participation rate are those with the educational attainment of bachelor's degree or higher, with 90.3% or 956 individuals in the labor force. Within the labor force, individuals with high school diploma education have the highest percentage of unemployment, with 2.7% or 48 of them being unemployed.
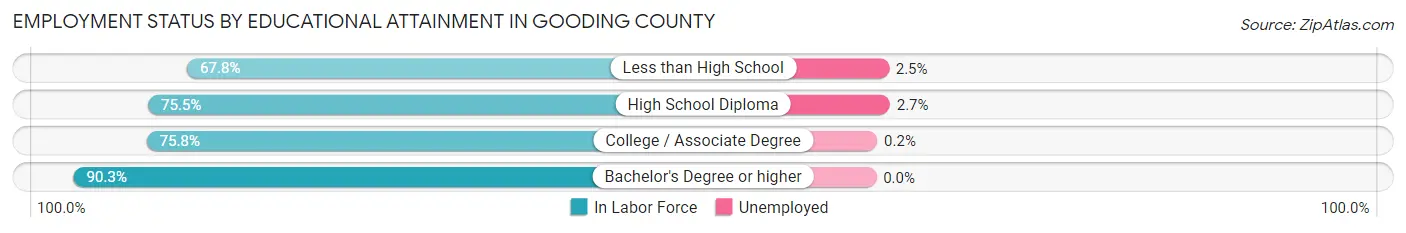
| Educational Attainment | In Labor Force | Unemployed |
| Less than High School | 1,188 (67.8%) | 44 (2.5%) |
| High School Diploma | 1,793 (75.5%) | 64 (2.7%) |
| College / Associate Degree | 1,605 (75.8%) | 4 (0.2%) |
| Bachelor's Degree or higher | 956 (90.3%) | 0 (0.0%) |
| Total | 5,543 (75.9%) | 110 (1.5%) |
Employment Occupations by Sex in Gooding County
Management, Business, Science and Arts Occupations
The most common Management, Business, Science and Arts occupations in Gooding County are Management (1,119 | 15.6%), Community & Social Service (473 | 6.6%), Education Instruction & Library (407 | 5.7%), Health Diagnosing & Treating (157 | 2.2%), and Business & Financial (156 | 2.2%).
Management, Business, Science and Arts Occupations by Sex
Within the Management, Business, Science and Arts occupations in Gooding County, the most male-oriented occupations are Computers & Mathematics (100.0%), Arts, Media & Entertainment (100.0%), and Health Technologists (67.9%), while the most female-oriented occupations are Life, Physical & Social Science (100.0%), Legal Services & Support (100.0%), and Education Instruction & Library (94.4%).
| Occupation | Male | Female |
| Management | 669 (59.8%) | 450 (40.2%) |
| Business & Financial | 33 (21.1%) | 123 (78.8%) |
| Computers, Engineering & Science | 28 (43.8%) | 36 (56.2%) |
| Computers & Mathematics | 22 (100.0%) | 0 (0.0%) |
| Architecture & Engineering | 6 (21.4%) | 22 (78.6%) |
| Life, Physical & Social Science | 0 (0.0%) | 14 (100.0%) |
| Community & Social Service | 63 (13.3%) | 410 (86.7%) |
| Education, Arts & Media | 4 (40.0%) | 6 (60.0%) |
| Legal Services & Support | 0 (0.0%) | 20 (100.0%) |
| Education Instruction & Library | 23 (5.7%) | 384 (94.4%) |
| Arts, Media & Entertainment | 36 (100.0%) | 0 (0.0%) |
| Health Diagnosing & Treating | 83 (52.9%) | 74 (47.1%) |
| Health Technologists | 74 (67.9%) | 35 (32.1%) |
| Total (Category) | 876 (44.5%) | 1,093 (55.5%) |
| Total (Overall) | 4,153 (57.8%) | 3,031 (42.2%) |
Services Occupations
The most common Services occupations in Gooding County are Cleaning & Maintenance (444 | 6.2%), Healthcare Support (281 | 3.9%), Food Preparation & Serving (272 | 3.8%), Security & Protection (129 | 1.8%), and Law Enforcement (74 | 1.0%).
Services Occupations by Sex
Within the Services occupations in Gooding County, the most male-oriented occupations are Security & Protection (100.0%), Firefighting & Prevention (100.0%), and Law Enforcement (100.0%), while the most female-oriented occupations are Healthcare Support (100.0%), Food Preparation & Serving (88.2%), and Personal Care & Service (62.7%).
| Occupation | Male | Female |
| Healthcare Support | 0 (0.0%) | 281 (100.0%) |
| Security & Protection | 129 (100.0%) | 0 (0.0%) |
| Firefighting & Prevention | 55 (100.0%) | 0 (0.0%) |
| Law Enforcement | 74 (100.0%) | 0 (0.0%) |
| Food Preparation & Serving | 32 (11.8%) | 240 (88.2%) |
| Cleaning & Maintenance | 167 (37.6%) | 277 (62.4%) |
| Personal Care & Service | 25 (37.3%) | 42 (62.7%) |
| Total (Category) | 353 (29.6%) | 840 (70.4%) |
| Total (Overall) | 4,153 (57.8%) | 3,031 (42.2%) |
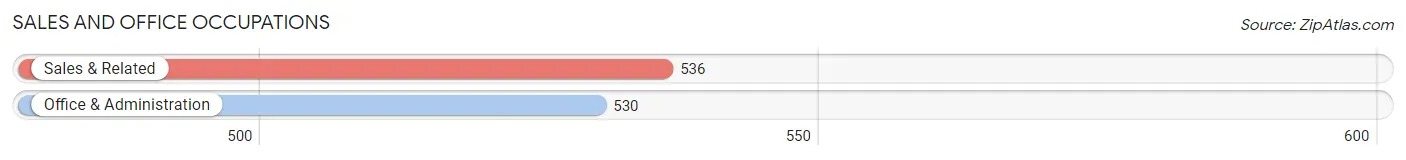
Sales and Office Occupations
The most common Sales and Office occupations in Gooding County are Sales & Related (536 | 7.5%), and Office & Administration (530 | 7.4%).
Sales and Office Occupations by Sex
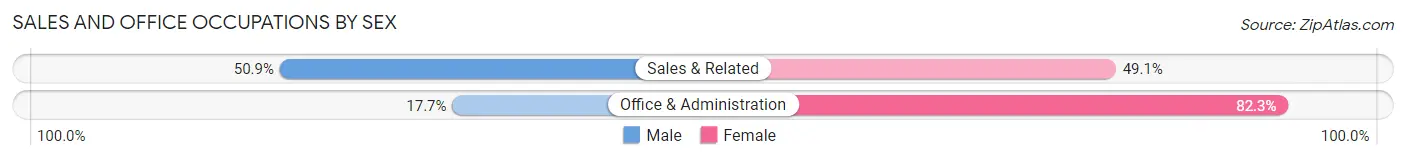
| Occupation | Male | Female |
| Sales & Related | 273 (50.9%) | 263 (49.1%) |
| Office & Administration | 94 (17.7%) | 436 (82.3%) |
| Total (Category) | 367 (34.4%) | 699 (65.6%) |
| Total (Overall) | 4,153 (57.8%) | 3,031 (42.2%) |
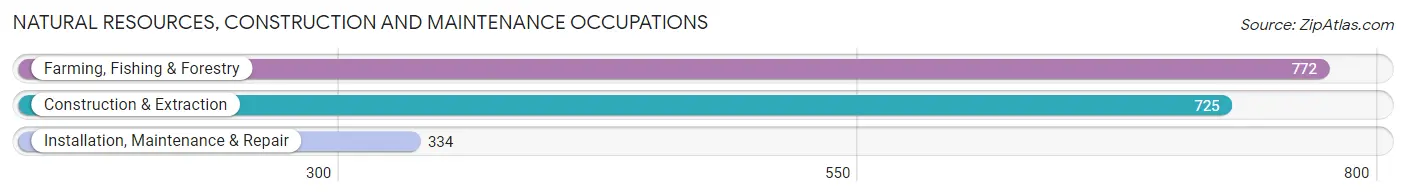
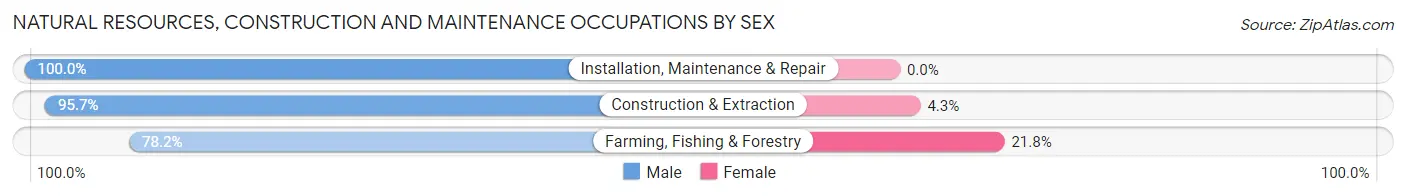
Natural Resources, Construction and Maintenance Occupations
The most common Natural Resources, Construction and Maintenance occupations in Gooding County are Farming, Fishing & Forestry (772 | 10.7%), Construction & Extraction (725 | 10.1%), and Installation, Maintenance & Repair (334 | 4.6%).
Natural Resources, Construction and Maintenance Occupations by Sex
| Occupation | Male | Female |
| Farming, Fishing & Forestry | 604 (78.2%) | 168 (21.8%) |
| Construction & Extraction | 694 (95.7%) | 31 (4.3%) |
| Installation, Maintenance & Repair | 334 (100.0%) | 0 (0.0%) |
| Total (Category) | 1,632 (89.1%) | 199 (10.9%) |
| Total (Overall) | 4,153 (57.8%) | 3,031 (42.2%) |
Production, Transportation and Moving Occupations
The most common Production, Transportation and Moving occupations in Gooding County are Material Moving (414 | 5.8%), Transportation (406 | 5.7%), and Production (305 | 4.3%).
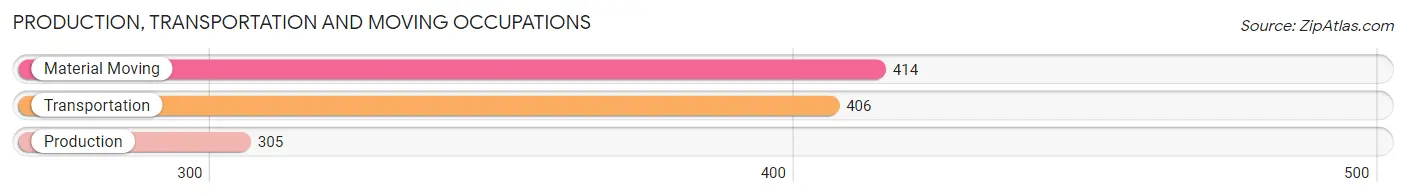
Production, Transportation and Moving Occupations by Sex
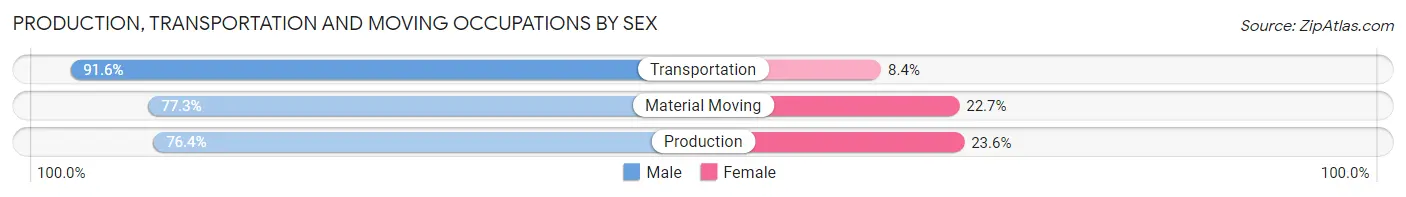
| Occupation | Male | Female |
| Production | 233 (76.4%) | 72 (23.6%) |
| Transportation | 372 (91.6%) | 34 (8.4%) |
| Material Moving | 320 (77.3%) | 94 (22.7%) |
| Total (Category) | 925 (82.2%) | 200 (17.8%) |
| Total (Overall) | 4,153 (57.8%) | 3,031 (42.2%) |
Employment Industries by Sex in Gooding County
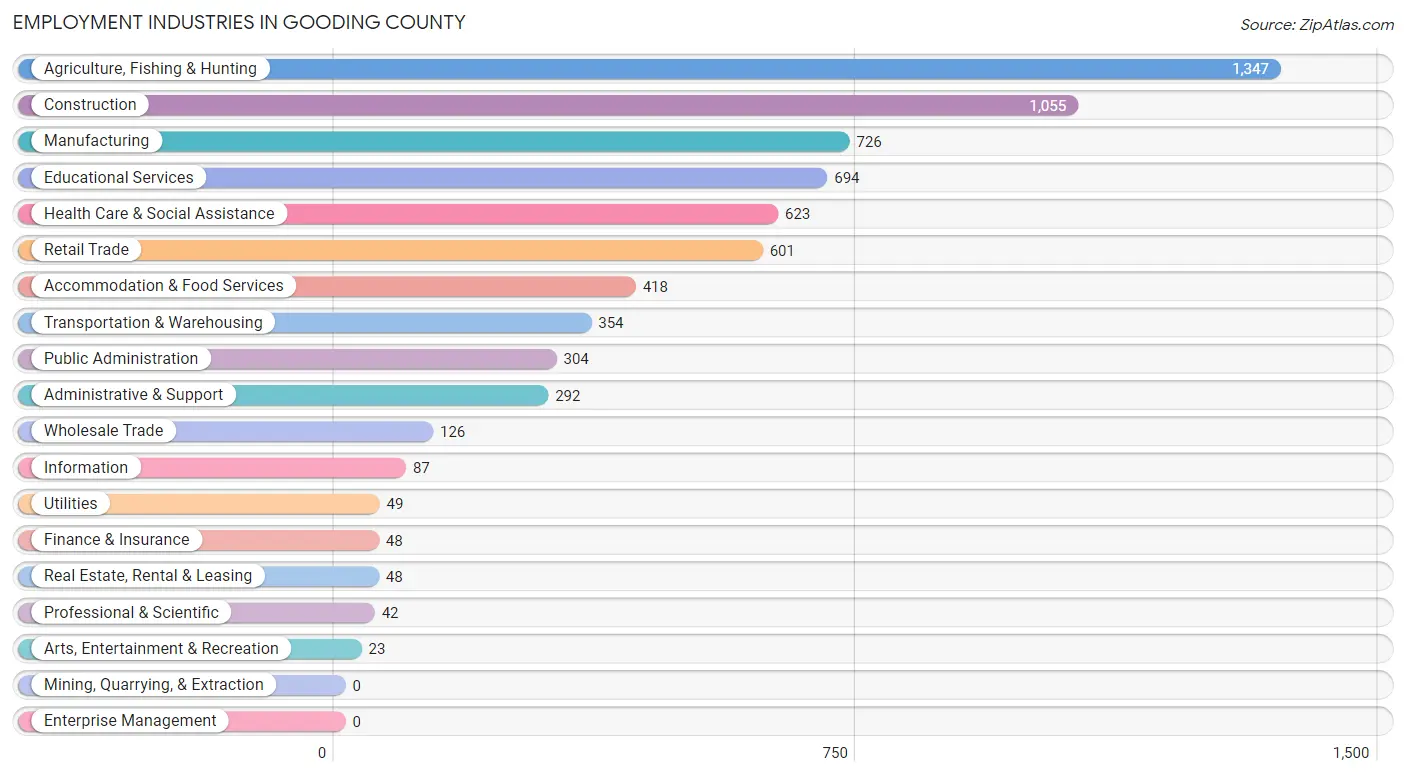
Employment Industries in Gooding County
The major employment industries in Gooding County include Agriculture, Fishing & Hunting (1,347 | 18.8%), Construction (1,055 | 14.7%), Manufacturing (726 | 10.1%), Educational Services (694 | 9.7%), and Health Care & Social Assistance (623 | 8.7%).
Employment Industries by Sex in Gooding County
The Gooding County industries that see more men than women are Utilities (100.0%), Arts, Entertainment & Recreation (100.0%), and Construction (91.4%), whereas the industries that tend to have a higher number of women are Health Care & Social Assistance (80.4%), Professional & Scientific (78.6%), and Educational Services (77.4%).
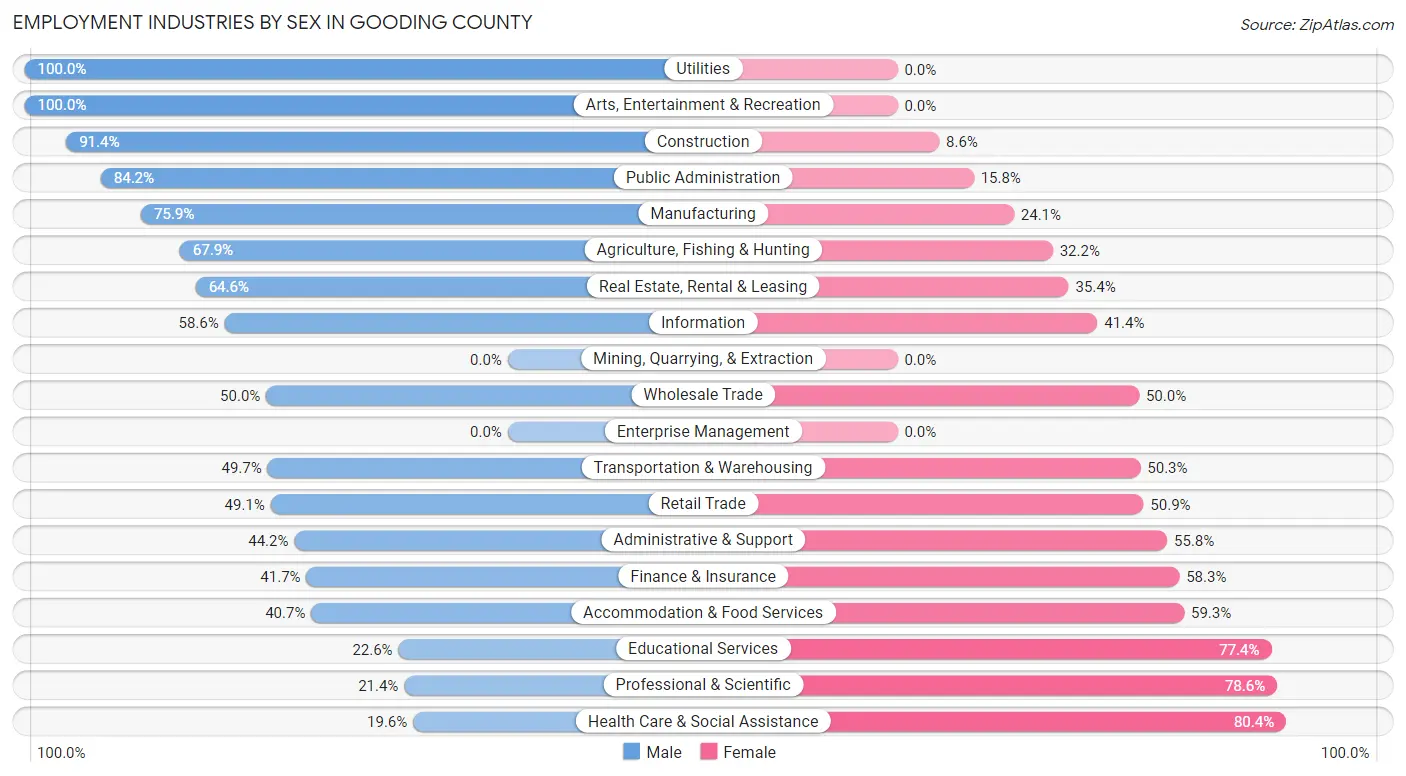
| Industry | Male | Female |
| Agriculture, Fishing & Hunting | 914 (67.8%) | 433 (32.2%) |
| Mining, Quarrying, & Extraction | 0 (0.0%) | 0 (0.0%) |
| Construction | 964 (91.4%) | 91 (8.6%) |
| Manufacturing | 551 (75.9%) | 175 (24.1%) |
| Wholesale Trade | 63 (50.0%) | 63 (50.0%) |
| Retail Trade | 295 (49.1%) | 306 (50.9%) |
| Transportation & Warehousing | 176 (49.7%) | 178 (50.3%) |
| Utilities | 49 (100.0%) | 0 (0.0%) |
| Information | 51 (58.6%) | 36 (41.4%) |
| Finance & Insurance | 20 (41.7%) | 28 (58.3%) |
| Real Estate, Rental & Leasing | 31 (64.6%) | 17 (35.4%) |
| Professional & Scientific | 9 (21.4%) | 33 (78.6%) |
| Enterprise Management | 0 (0.0%) | 0 (0.0%) |
| Administrative & Support | 129 (44.2%) | 163 (55.8%) |
| Educational Services | 157 (22.6%) | 537 (77.4%) |
| Health Care & Social Assistance | 122 (19.6%) | 501 (80.4%) |
| Arts, Entertainment & Recreation | 23 (100.0%) | 0 (0.0%) |
| Accommodation & Food Services | 170 (40.7%) | 248 (59.3%) |
| Public Administration | 256 (84.2%) | 48 (15.8%) |
| Total | 4,153 (57.8%) | 3,031 (42.2%) |
Education in Gooding County
School Enrollment in Gooding County
The most common levels of schooling among the 3,923 students in Gooding County are elementary school (1,249 | 31.8%), middle school (917 | 23.4%), and high school (896 | 22.8%).
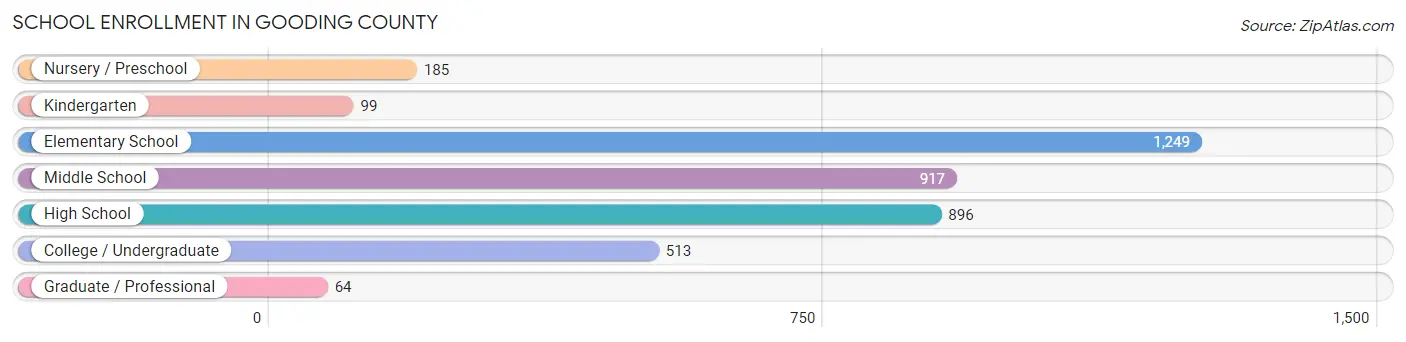
| School Level | # Students | % Students |
| Nursery / Preschool | 185 | 4.7% |
| Kindergarten | 99 | 2.5% |
| Elementary School | 1,249 | 31.8% |
| Middle School | 917 | 23.4% |
| High School | 896 | 22.8% |
| College / Undergraduate | 513 | 13.1% |
| Graduate / Professional | 64 | 1.6% |
| Total | 3,923 | 100.0% |
School Enrollment by Age by Funding Source in Gooding County
Out of a total of 3,923 students who are enrolled in schools in Gooding County, 616 (15.7%) attend a private institution, while the remaining 3,307 (84.3%) are enrolled in public schools. The age group of 25 to 34 year olds has the highest likelihood of being enrolled in private schools, with 25 (34.7% in the age bracket) enrolled. Conversely, the age group of 20 to 24 year olds has the lowest likelihood of being enrolled in a private school, with 219 (99.1% in the age bracket) attending a public institution.
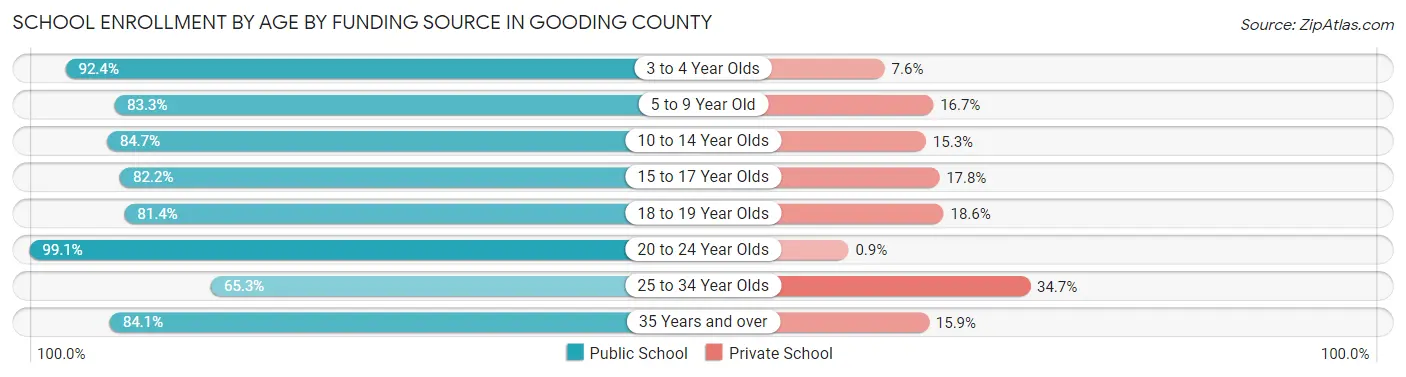
| Age Bracket | Public School | Private School |
| 3 to 4 Year Olds | 109 (92.4%) | 9 (7.6%) |
| 5 to 9 Year Old | 939 (83.3%) | 188 (16.7%) |
| 10 to 14 Year Olds | 1,072 (84.7%) | 194 (15.3%) |
| 15 to 17 Year Olds | 550 (82.2%) | 119 (17.8%) |
| 18 to 19 Year Olds | 197 (81.4%) | 45 (18.6%) |
| 20 to 24 Year Olds | 219 (99.1%) | 2 (0.9%) |
| 25 to 34 Year Olds | 47 (65.3%) | 25 (34.7%) |
| 35 Years and over | 175 (84.1%) | 33 (15.9%) |
| Total | 3,307 (84.3%) | 616 (15.7%) |
Educational Attainment by Field of Study in Gooding County
Education (379 | 21.9%), bio, nature & agricultural (248 | 14.3%), business (207 | 12.0%), arts & humanities (154 | 8.9%), and social sciences (148 | 8.6%) are the most common fields of study among 1,729 individuals in Gooding County who have obtained a bachelor's degree or higher.
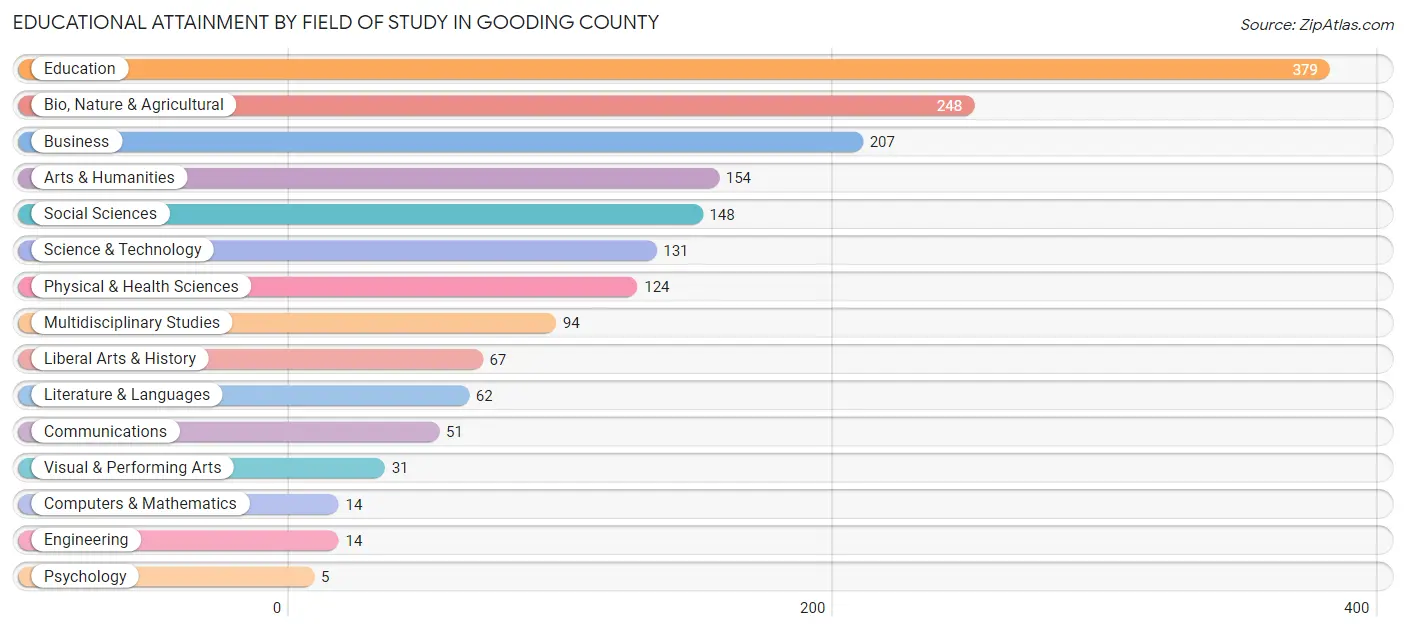
| Field of Study | # Graduates | % Graduates |
| Computers & Mathematics | 14 | 0.8% |
| Bio, Nature & Agricultural | 248 | 14.3% |
| Physical & Health Sciences | 124 | 7.2% |
| Psychology | 5 | 0.3% |
| Social Sciences | 148 | 8.6% |
| Engineering | 14 | 0.8% |
| Multidisciplinary Studies | 94 | 5.4% |
| Science & Technology | 131 | 7.6% |
| Business | 207 | 12.0% |
| Education | 379 | 21.9% |
| Literature & Languages | 62 | 3.6% |
| Liberal Arts & History | 67 | 3.9% |
| Visual & Performing Arts | 31 | 1.8% |
| Communications | 51 | 2.9% |
| Arts & Humanities | 154 | 8.9% |
| Total | 1,729 | 100.0% |
Transportation & Commute in Gooding County
Vehicle Availability by Sex in Gooding County
The most prevalent vehicle ownership categories in Gooding County are males with 2 vehicles (1,312, accounting for 32.1%) and females with 2 vehicles (816, making up 44.8%).
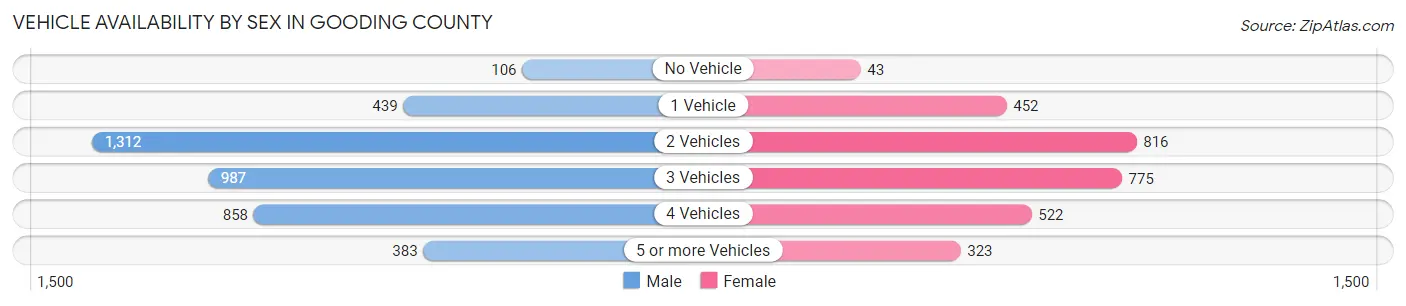
| Vehicles Available | Male | Female |
| No Vehicle | 106 (2.6%) | 43 (1.5%) |
| 1 Vehicle | 439 (10.7%) | 452 (15.4%) |
| 2 Vehicles | 1,312 (32.1%) | 816 (27.8%) |
| 3 Vehicles | 987 (24.2%) | 775 (26.4%) |
| 4 Vehicles | 858 (21.0%) | 522 (17.8%) |
| 5 or more Vehicles | 383 (9.4%) | 323 (11.0%) |
| Total | 4,085 (100.0%) | 2,931 (100.0%) |
Commute Time in Gooding County
The most frequently occuring commute durations in Gooding County are 5 to 9 minutes (1,227 commuters, 19.6%), 10 to 14 minutes (916 commuters, 14.6%), and 30 to 34 minutes (783 commuters, 12.5%).

| Commute Time | # Commuters | % Commuters |
| Less than 5 Minutes | 638 | 10.2% |
| 5 to 9 Minutes | 1,227 | 19.6% |
| 10 to 14 Minutes | 916 | 14.6% |
| 15 to 19 Minutes | 493 | 7.9% |
| 20 to 24 Minutes | 770 | 12.3% |
| 25 to 29 Minutes | 259 | 4.1% |
| 30 to 34 Minutes | 783 | 12.5% |
| 35 to 39 Minutes | 75 | 1.2% |
| 40 to 44 Minutes | 152 | 2.4% |
| 45 to 59 Minutes | 592 | 9.5% |
| 60 to 89 Minutes | 195 | 3.1% |
| 90 or more Minutes | 160 | 2.6% |
Commute Time by Sex in Gooding County
The most common commute times in Gooding County are 5 to 9 minutes (631 commuters, 16.3%) for males and 5 to 9 minutes (596 commuters, 25.0%) for females.
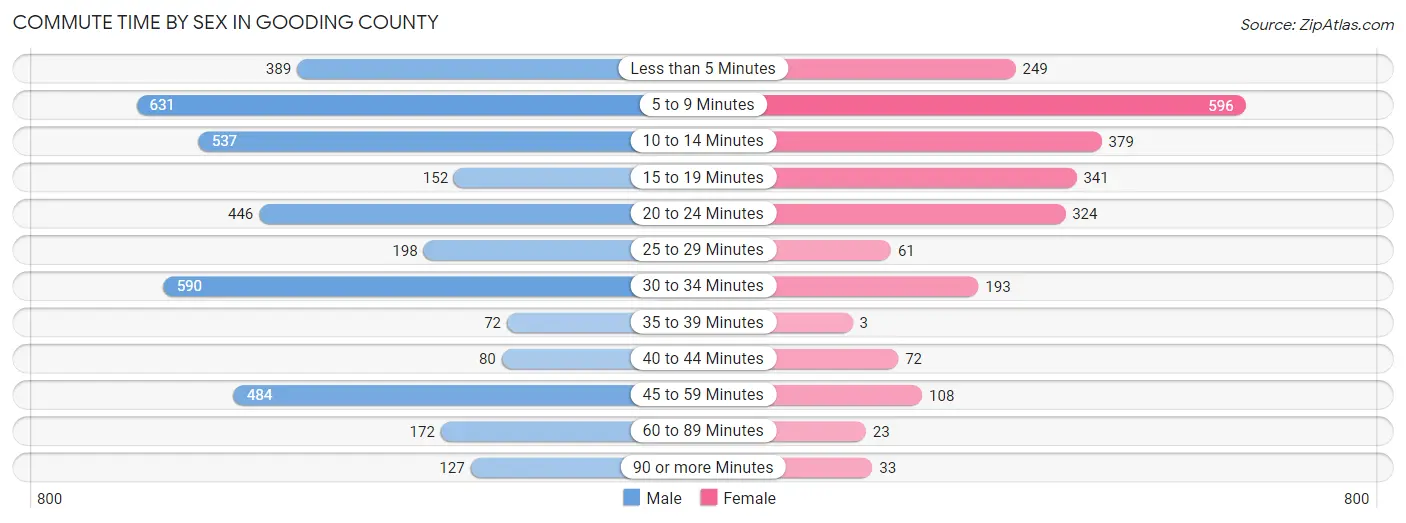
| Commute Time | Male | Female |
| Less than 5 Minutes | 389 (10.0%) | 249 (10.4%) |
| 5 to 9 Minutes | 631 (16.3%) | 596 (25.0%) |
| 10 to 14 Minutes | 537 (13.9%) | 379 (15.9%) |
| 15 to 19 Minutes | 152 (3.9%) | 341 (14.3%) |
| 20 to 24 Minutes | 446 (11.5%) | 324 (13.6%) |
| 25 to 29 Minutes | 198 (5.1%) | 61 (2.6%) |
| 30 to 34 Minutes | 590 (15.2%) | 193 (8.1%) |
| 35 to 39 Minutes | 72 (1.9%) | 3 (0.1%) |
| 40 to 44 Minutes | 80 (2.1%) | 72 (3.0%) |
| 45 to 59 Minutes | 484 (12.5%) | 108 (4.5%) |
| 60 to 89 Minutes | 172 (4.4%) | 23 (1.0%) |
| 90 or more Minutes | 127 (3.3%) | 33 (1.4%) |
Time of Departure to Work by Sex in Gooding County
The most frequent times of departure to work in Gooding County are 6:00 AM to 6:29 AM (594, 15.3%) for males and 7:00 AM to 7:29 AM (412, 17.3%) for females.
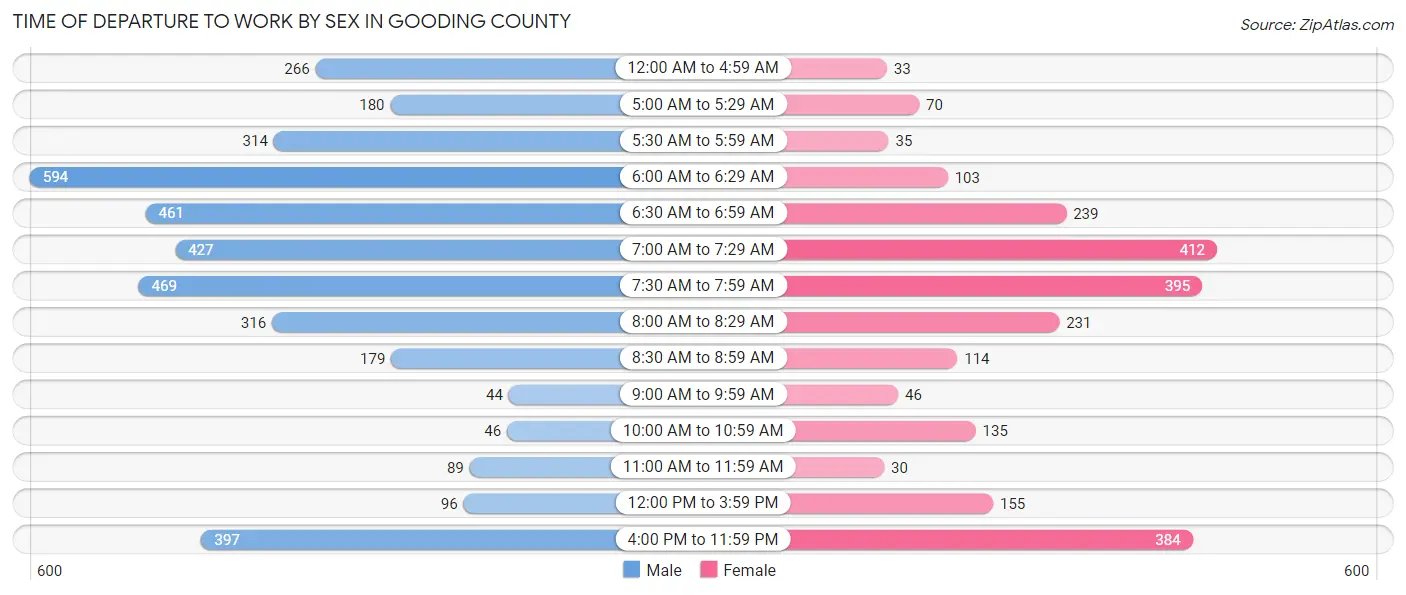
| Time of Departure | Male | Female |
| 12:00 AM to 4:59 AM | 266 (6.9%) | 33 (1.4%) |
| 5:00 AM to 5:29 AM | 180 (4.6%) | 70 (2.9%) |
| 5:30 AM to 5:59 AM | 314 (8.1%) | 35 (1.5%) |
| 6:00 AM to 6:29 AM | 594 (15.3%) | 103 (4.3%) |
| 6:30 AM to 6:59 AM | 461 (11.9%) | 239 (10.0%) |
| 7:00 AM to 7:29 AM | 427 (11.0%) | 412 (17.3%) |
| 7:30 AM to 7:59 AM | 469 (12.1%) | 395 (16.6%) |
| 8:00 AM to 8:29 AM | 316 (8.2%) | 231 (9.7%) |
| 8:30 AM to 8:59 AM | 179 (4.6%) | 114 (4.8%) |
| 9:00 AM to 9:59 AM | 44 (1.1%) | 46 (1.9%) |
| 10:00 AM to 10:59 AM | 46 (1.2%) | 135 (5.7%) |
| 11:00 AM to 11:59 AM | 89 (2.3%) | 30 (1.3%) |
| 12:00 PM to 3:59 PM | 96 (2.5%) | 155 (6.5%) |
| 4:00 PM to 11:59 PM | 397 (10.2%) | 384 (16.1%) |
| Total | 3,878 (100.0%) | 2,382 (100.0%) |
Housing Occupancy in Gooding County
Occupancy by Ownership in Gooding County
Of the total 5,413 dwellings in Gooding County, owner-occupied units account for 3,905 (72.1%), while renter-occupied units make up 1,508 (27.9%).
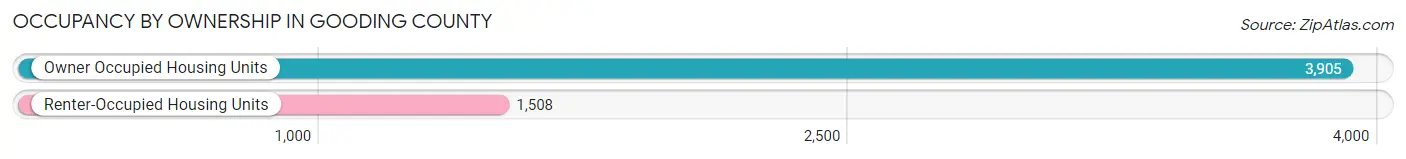
| Occupancy | # Housing Units | % Housing Units |
| Owner Occupied Housing Units | 3,905 | 72.1% |
| Renter-Occupied Housing Units | 1,508 | 27.9% |
| Total Occupied Housing Units | 5,413 | 100.0% |
Occupancy by Household Size in Gooding County
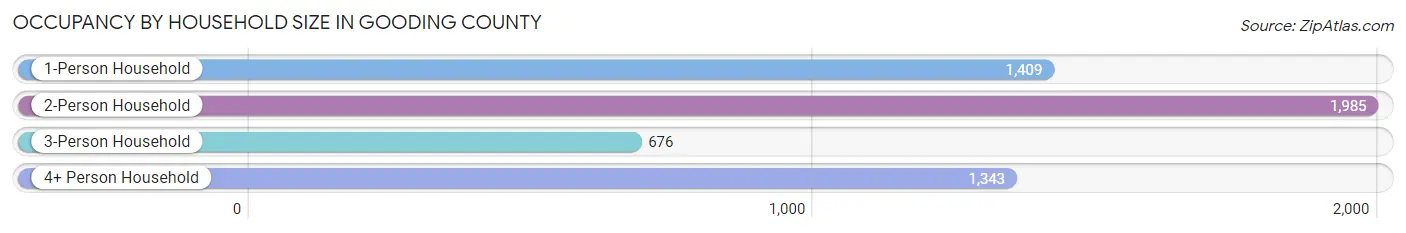
| Household Size | # Housing Units | % Housing Units |
| 1-Person Household | 1,409 | 26.0% |
| 2-Person Household | 1,985 | 36.7% |
| 3-Person Household | 676 | 12.5% |
| 4+ Person Household | 1,343 | 24.8% |
| Total Housing Units | 5,413 | 100.0% |
Occupancy by Ownership by Household Size in Gooding County
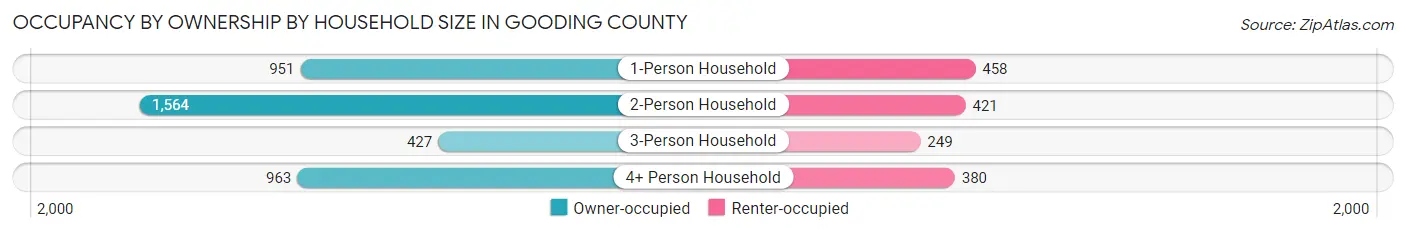
| Household Size | Owner-occupied | Renter-occupied |
| 1-Person Household | 951 (67.5%) | 458 (32.5%) |
| 2-Person Household | 1,564 (78.8%) | 421 (21.2%) |
| 3-Person Household | 427 (63.2%) | 249 (36.8%) |
| 4+ Person Household | 963 (71.7%) | 380 (28.3%) |
| Total Housing Units | 3,905 (72.1%) | 1,508 (27.9%) |
Occupancy by Educational Attainment in Gooding County
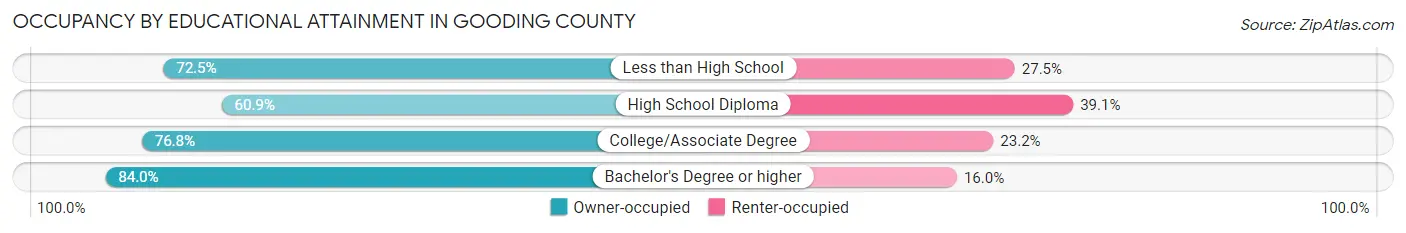
| Household Size | Owner-occupied | Renter-occupied |
| Less than High School | 659 (72.5%) | 250 (27.5%) |
| High School Diploma | 1,087 (60.9%) | 697 (39.1%) |
| College/Associate Degree | 1,331 (76.8%) | 403 (23.2%) |
| Bachelor's Degree or higher | 828 (84.0%) | 158 (16.0%) |
Occupancy by Age of Householder in Gooding County
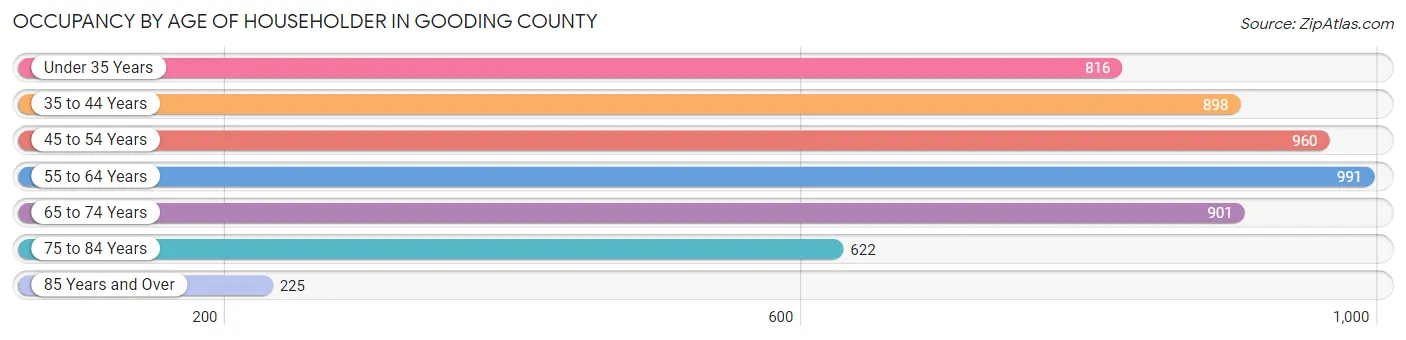
| Age Bracket | # Households | % Households |
| Under 35 Years | 816 | 15.1% |
| 35 to 44 Years | 898 | 16.6% |
| 45 to 54 Years | 960 | 17.7% |
| 55 to 64 Years | 991 | 18.3% |
| 65 to 74 Years | 901 | 16.7% |
| 75 to 84 Years | 622 | 11.5% |
| 85 Years and Over | 225 | 4.2% |
| Total | 5,413 | 100.0% |
Housing Finances in Gooding County
Median Income by Occupancy in Gooding County
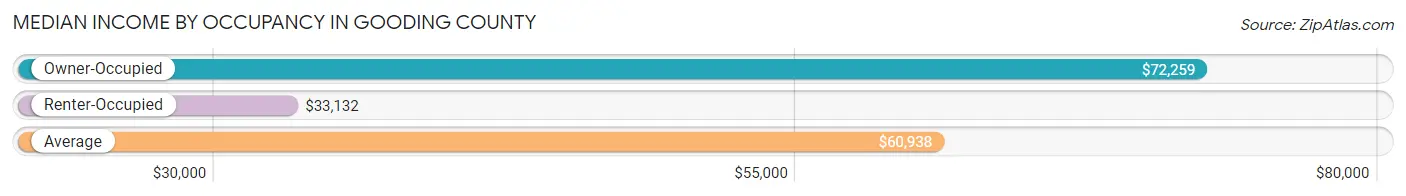
| Occupancy Type | # Households | Median Income |
| Owner-Occupied | 3,905 (72.1%) | $72,259 |
| Renter-Occupied | 1,508 (27.9%) | $33,132 |
| Average | 5,413 (100.0%) | $60,938 |
Occupancy by Householder Income Bracket in Gooding County
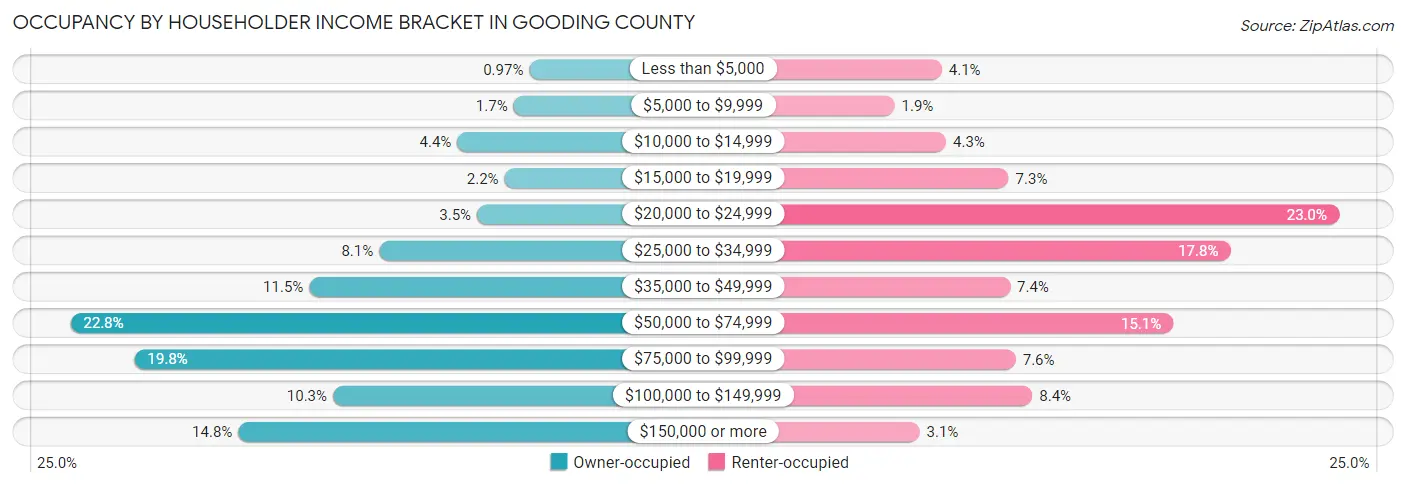
| Income Bracket | Owner-occupied | Renter-occupied |
| Less than $5,000 | 38 (1.0%) | 62 (4.1%) |
| $5,000 to $9,999 | 67 (1.7%) | 28 (1.9%) |
| $10,000 to $14,999 | 172 (4.4%) | 65 (4.3%) |
| $15,000 to $19,999 | 84 (2.1%) | 110 (7.3%) |
| $20,000 to $24,999 | 135 (3.5%) | 347 (23.0%) |
| $25,000 to $34,999 | 317 (8.1%) | 269 (17.8%) |
| $35,000 to $49,999 | 447 (11.5%) | 111 (7.4%) |
| $50,000 to $74,999 | 891 (22.8%) | 228 (15.1%) |
| $75,000 to $99,999 | 772 (19.8%) | 115 (7.6%) |
| $100,000 to $149,999 | 403 (10.3%) | 127 (8.4%) |
| $150,000 or more | 579 (14.8%) | 46 (3.0%) |
| Total | 3,905 (100.0%) | 1,508 (100.0%) |
Monthly Housing Cost Tiers in Gooding County
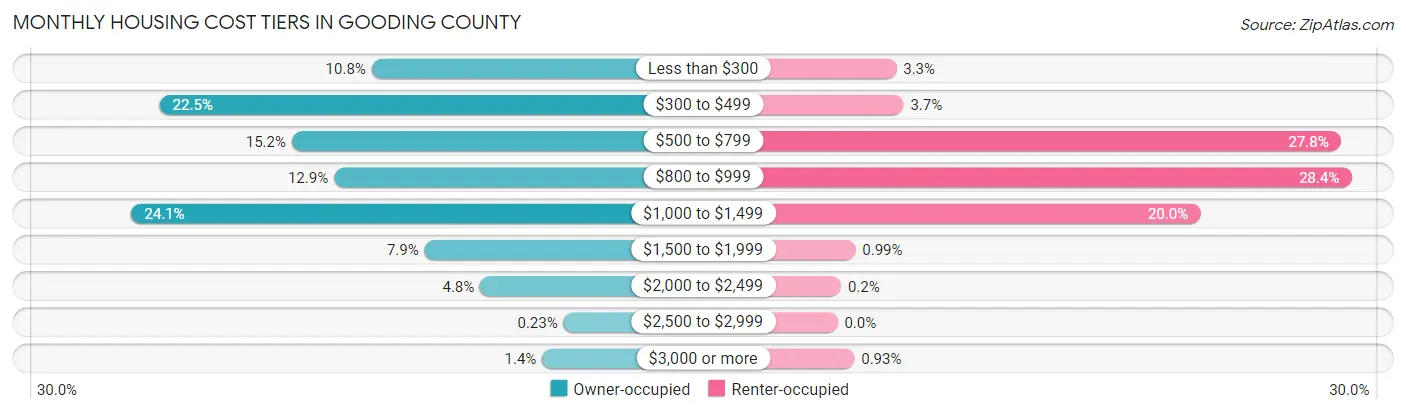
| Monthly Cost | Owner-occupied | Renter-occupied |
| Less than $300 | 423 (10.8%) | 49 (3.3%) |
| $300 to $499 | 880 (22.5%) | 55 (3.6%) |
| $500 to $799 | 595 (15.2%) | 419 (27.8%) |
| $800 to $999 | 504 (12.9%) | 428 (28.4%) |
| $1,000 to $1,499 | 941 (24.1%) | 302 (20.0%) |
| $1,500 to $1,999 | 309 (7.9%) | 15 (1.0%) |
| $2,000 to $2,499 | 189 (4.8%) | 3 (0.2%) |
| $2,500 to $2,999 | 9 (0.2%) | 0 (0.0%) |
| $3,000 or more | 55 (1.4%) | 14 (0.9%) |
| Total | 3,905 (100.0%) | 1,508 (100.0%) |
Physical Housing Characteristics in Gooding County
Housing Structures in Gooding County
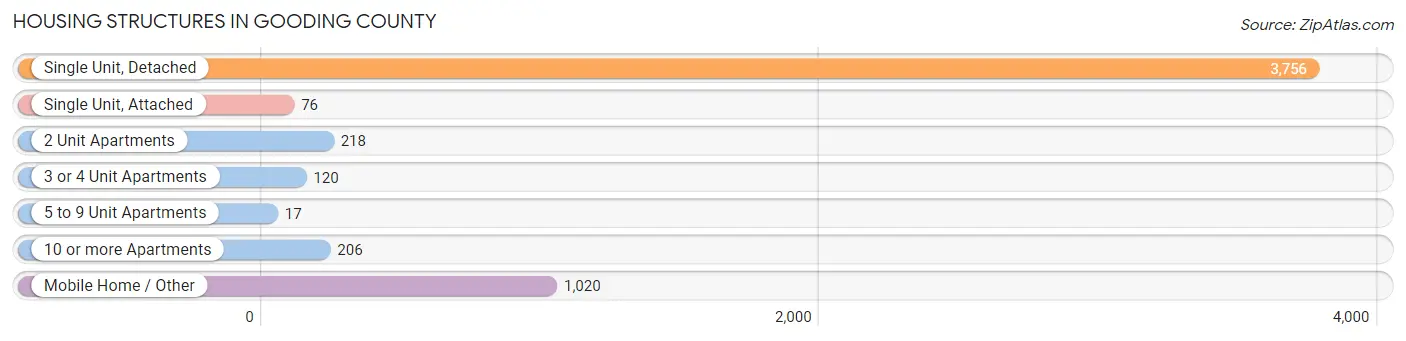
| Structure Type | # Housing Units | % Housing Units |
| Single Unit, Detached | 3,756 | 69.4% |
| Single Unit, Attached | 76 | 1.4% |
| 2 Unit Apartments | 218 | 4.0% |
| 3 or 4 Unit Apartments | 120 | 2.2% |
| 5 to 9 Unit Apartments | 17 | 0.3% |
| 10 or more Apartments | 206 | 3.8% |
| Mobile Home / Other | 1,020 | 18.8% |
| Total | 5,413 | 100.0% |
Housing Structures by Occupancy in Gooding County
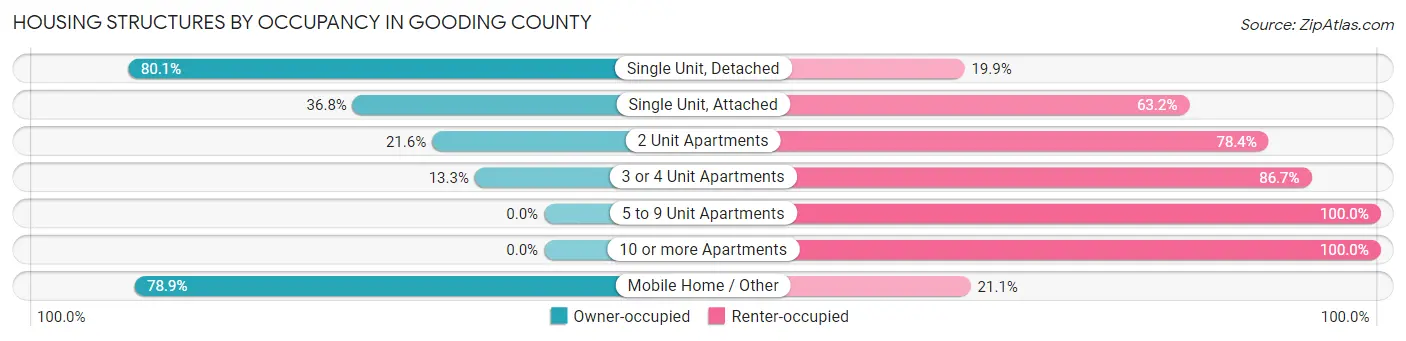
| Structure Type | Owner-occupied | Renter-occupied |
| Single Unit, Detached | 3,009 (80.1%) | 747 (19.9%) |
| Single Unit, Attached | 28 (36.8%) | 48 (63.2%) |
| 2 Unit Apartments | 47 (21.6%) | 171 (78.4%) |
| 3 or 4 Unit Apartments | 16 (13.3%) | 104 (86.7%) |
| 5 to 9 Unit Apartments | 0 (0.0%) | 17 (100.0%) |
| 10 or more Apartments | 0 (0.0%) | 206 (100.0%) |
| Mobile Home / Other | 805 (78.9%) | 215 (21.1%) |
| Total | 3,905 (72.1%) | 1,508 (27.9%) |
Housing Structures by Number of Rooms in Gooding County
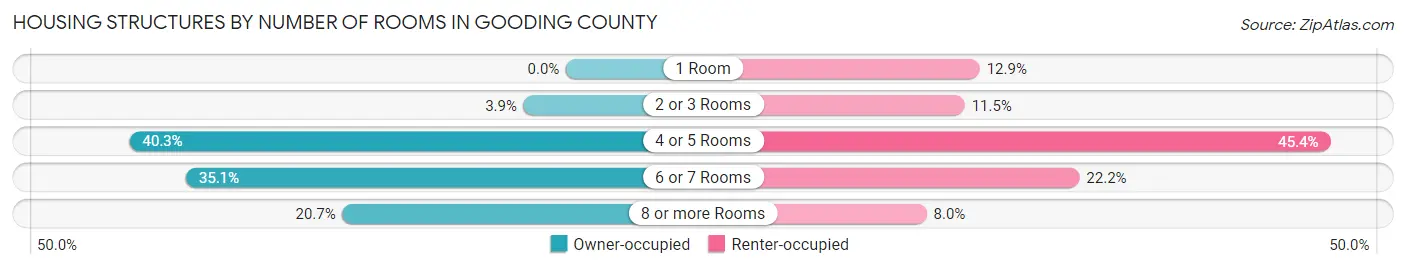
| Number of Rooms | Owner-occupied | Renter-occupied |
| 1 Room | 0 (0.0%) | 195 (12.9%) |
| 2 or 3 Rooms | 153 (3.9%) | 174 (11.5%) |
| 4 or 5 Rooms | 1,574 (40.3%) | 684 (45.4%) |
| 6 or 7 Rooms | 1,370 (35.1%) | 334 (22.2%) |
| 8 or more Rooms | 808 (20.7%) | 121 (8.0%) |
| Total | 3,905 (100.0%) | 1,508 (100.0%) |
Housing Structure by Heating Type in Gooding County
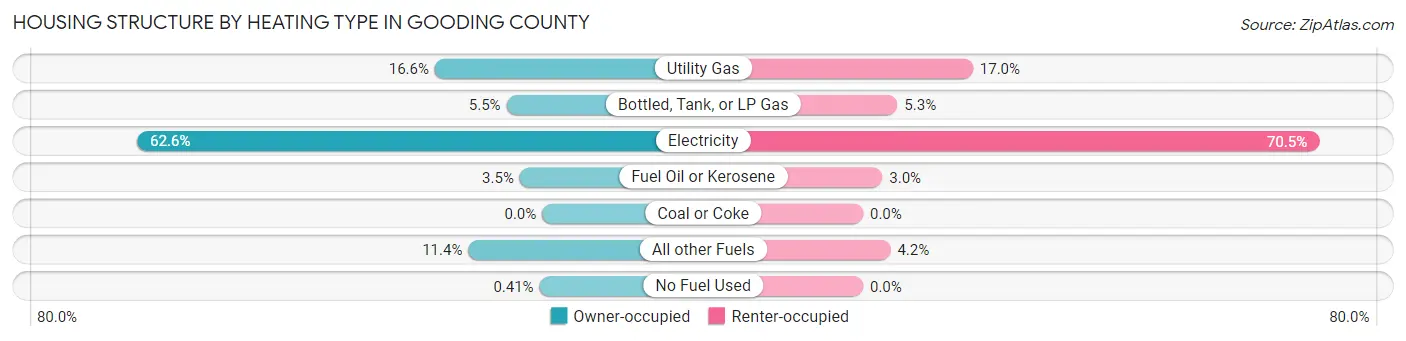
| Heating Type | Owner-occupied | Renter-occupied |
| Utility Gas | 648 (16.6%) | 256 (17.0%) |
| Bottled, Tank, or LP Gas | 215 (5.5%) | 80 (5.3%) |
| Electricity | 2,445 (62.6%) | 1,063 (70.5%) |
| Fuel Oil or Kerosene | 135 (3.5%) | 45 (3.0%) |
| Coal or Coke | 0 (0.0%) | 0 (0.0%) |
| All other Fuels | 446 (11.4%) | 64 (4.2%) |
| No Fuel Used | 16 (0.4%) | 0 (0.0%) |
| Total | 3,905 (100.0%) | 1,508 (100.0%) |
Household Vehicle Usage in Gooding County
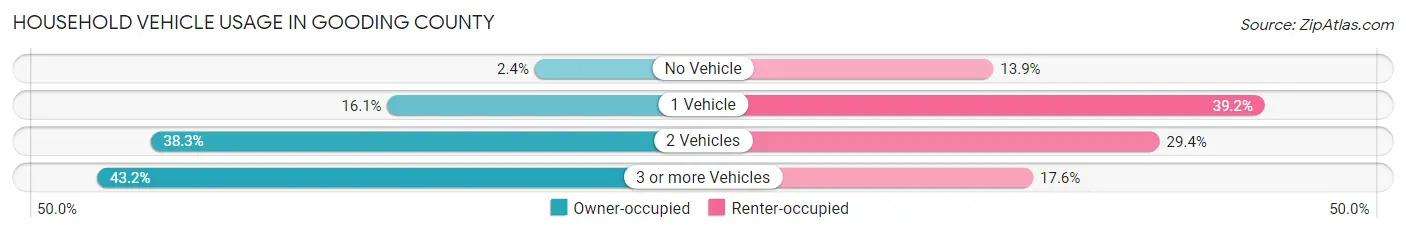
| Vehicles per Household | Owner-occupied | Renter-occupied |
| No Vehicle | 93 (2.4%) | 209 (13.9%) |
| 1 Vehicle | 630 (16.1%) | 591 (39.2%) |
| 2 Vehicles | 1,494 (38.3%) | 443 (29.4%) |
| 3 or more Vehicles | 1,688 (43.2%) | 265 (17.6%) |
| Total | 3,905 (100.0%) | 1,508 (100.0%) |
Real Estate & Mortgages in Gooding County
Real Estate and Mortgage Overview in Gooding County
| Characteristic | Without Mortgage | With Mortgage |
| Housing Units | 1,552 | 2,353 |
| Median Property Value | $198,200 | $197,600 |
| Median Household Income | $64,333 | $384 |
| Monthly Housing Costs | $390 | $48 |
| Real Estate Taxes | $1,120 | $104 |
Property Value by Mortgage Status in Gooding County
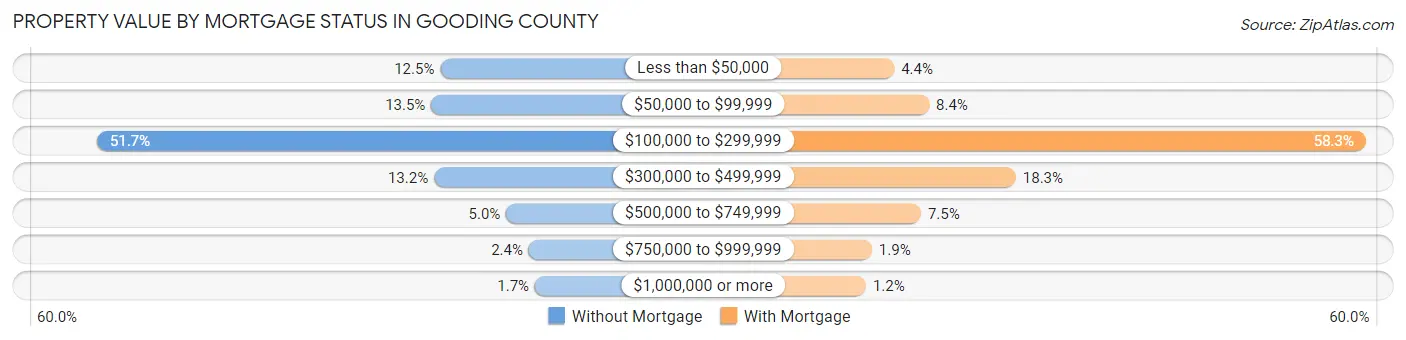
| Property Value | Without Mortgage | With Mortgage |
| Less than $50,000 | 194 (12.5%) | 104 (4.4%) |
| $50,000 to $99,999 | 210 (13.5%) | 198 (8.4%) |
| $100,000 to $299,999 | 803 (51.7%) | 1,372 (58.3%) |
| $300,000 to $499,999 | 205 (13.2%) | 431 (18.3%) |
| $500,000 to $749,999 | 77 (5.0%) | 176 (7.5%) |
| $750,000 to $999,999 | 37 (2.4%) | 44 (1.9%) |
| $1,000,000 or more | 26 (1.7%) | 28 (1.2%) |
| Total | 1,552 (100.0%) | 2,353 (100.0%) |
Household Income by Mortgage Status in Gooding County
| Household Income | Without Mortgage | With Mortgage |
| Less than $10,000 | 46 (3.0%) | 134 (5.7%) |
| $10,000 to $24,999 | 218 (14.1%) | 59 (2.5%) |
| $25,000 to $34,999 | 227 (14.6%) | 173 (7.3%) |
| $35,000 to $49,999 | 194 (12.5%) | 90 (3.8%) |
| $50,000 to $74,999 | 294 (18.9%) | 253 (10.7%) |
| $75,000 to $99,999 | 277 (17.8%) | 597 (25.4%) |
| $100,000 to $149,999 | 101 (6.5%) | 495 (21.0%) |
| $150,000 or more | 195 (12.6%) | 302 (12.8%) |
| Total | 1,552 (100.0%) | 2,353 (100.0%) |
Property Value to Household Income Ratio in Gooding County
| Value-to-Income Ratio | Without Mortgage | With Mortgage |
| Less than 2.0x | 577 (37.2%) | 75,225 (3,197.0%) |
| 2.0x to 2.9x | 278 (17.9%) | 859 (36.5%) |
| 3.0x to 3.9x | 133 (8.6%) | 530 (22.5%) |
| 4.0x or more | 560 (36.1%) | 202 (8.6%) |
| Total | 1,552 (100.0%) | 2,353 (100.0%) |
Real Estate Taxes by Mortgage Status in Gooding County
| Property Taxes | Without Mortgage | With Mortgage |
| Less than $800 | 507 (32.7%) | 15 (0.6%) |
| $800 to $1,499 | 496 (32.0%) | 702 (29.8%) |
| $800 to $1,499 | 468 (30.1%) | 942 (40.0%) |
| Total | 1,552 (100.0%) | 2,353 (100.0%) |
Health & Disability in Gooding County
Health Insurance Coverage by Age in Gooding County
| Age Bracket | With Coverage | Without Coverage |
| Under 6 Years | 920 (87.4%) | 133 (12.6%) |
| 6 to 18 Years | 2,836 (86.2%) | 454 (13.8%) |
| 19 to 25 Years | 707 (54.6%) | 587 (45.4%) |
| 26 to 34 Years | 1,228 (77.0%) | 367 (23.0%) |
| 35 to 44 Years | 1,168 (65.7%) | 610 (34.3%) |
| 45 to 54 Years | 1,234 (67.0%) | 609 (33.0%) |
| 55 to 64 Years | 1,703 (90.8%) | 172 (9.2%) |
| 65 to 74 Years | 1,557 (98.7%) | 20 (1.3%) |
| 75 Years and older | 1,128 (100.0%) | 0 (0.0%) |
| Total | 12,481 (80.9%) | 2,952 (19.1%) |
Health Insurance Coverage by Citizenship Status in Gooding County
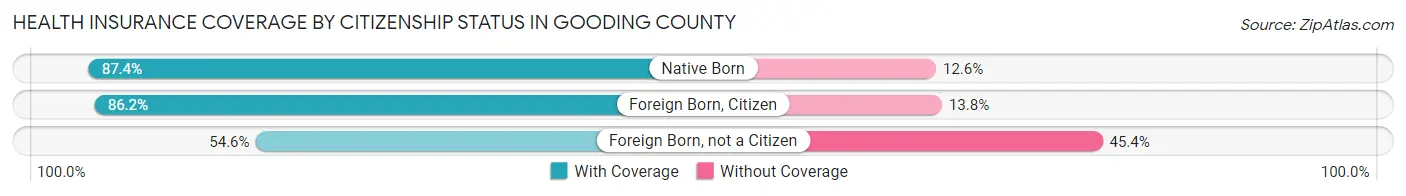
| Citizenship Status | With Coverage | Without Coverage |
| Native Born | 920 (87.4%) | 133 (12.6%) |
| Foreign Born, Citizen | 2,836 (86.2%) | 454 (13.8%) |
| Foreign Born, not a Citizen | 707 (54.6%) | 587 (45.4%) |
Health Insurance Coverage by Household Income in Gooding County
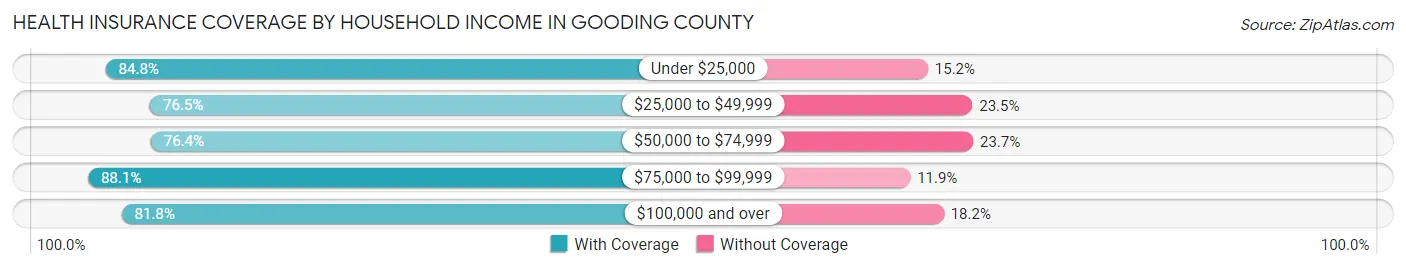
| Household Income | With Coverage | Without Coverage |
| Under $25,000 | 1,680 (84.8%) | 301 (15.2%) |
| $25,000 to $49,999 | 2,341 (76.5%) | 720 (23.5%) |
| $50,000 to $74,999 | 2,767 (76.3%) | 857 (23.6%) |
| $75,000 to $99,999 | 2,144 (88.1%) | 289 (11.9%) |
| $100,000 and over | 3,528 (81.8%) | 783 (18.2%) |
Public vs Private Health Insurance Coverage by Age in Gooding County
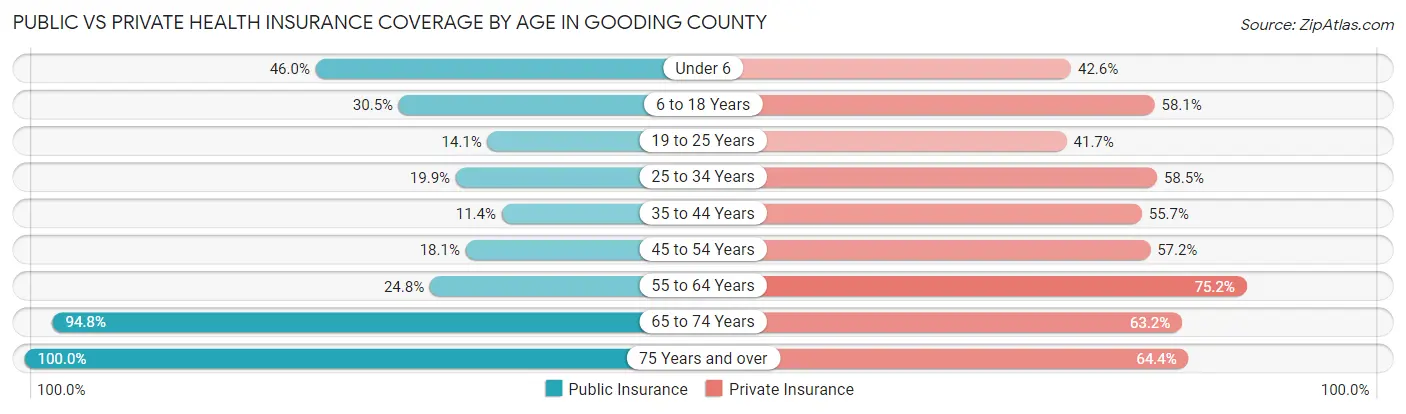
| Age Bracket | Public Insurance | Private Insurance |
| Under 6 | 484 (46.0%) | 448 (42.5%) |
| 6 to 18 Years | 1,004 (30.5%) | 1,910 (58.1%) |
| 19 to 25 Years | 182 (14.1%) | 540 (41.7%) |
| 25 to 34 Years | 318 (19.9%) | 933 (58.5%) |
| 35 to 44 Years | 203 (11.4%) | 990 (55.7%) |
| 45 to 54 Years | 334 (18.1%) | 1,055 (57.2%) |
| 55 to 64 Years | 464 (24.7%) | 1,409 (75.1%) |
| 65 to 74 Years | 1,495 (94.8%) | 996 (63.2%) |
| 75 Years and over | 1,128 (100.0%) | 726 (64.4%) |
| Total | 5,612 (36.4%) | 9,007 (58.4%) |
Disability Status by Sex by Age in Gooding County
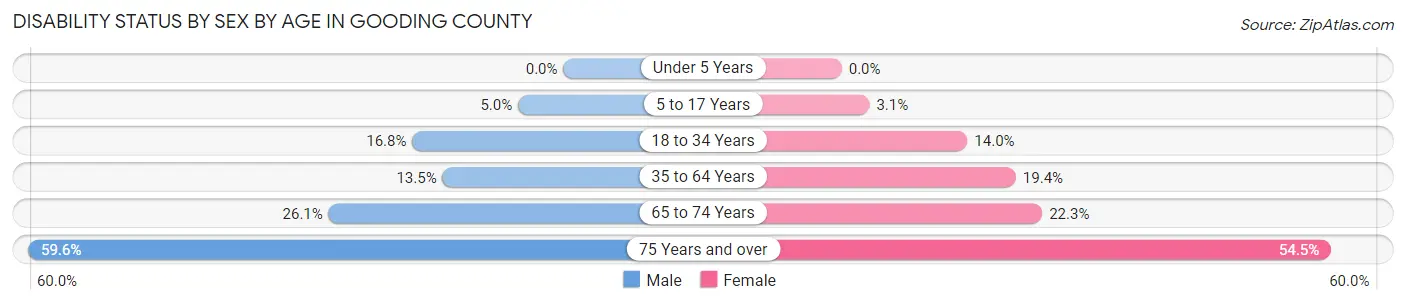
| Age Bracket | Male | Female |
| Under 5 Years | 0 (0.0%) | 0 (0.0%) |
| 5 to 17 Years | 78 (5.0%) | 50 (3.1%) |
| 18 to 34 Years | 273 (16.8%) | 209 (14.0%) |
| 35 to 64 Years | 389 (13.5%) | 505 (19.4%) |
| 65 to 74 Years | 212 (26.1%) | 171 (22.3%) |
| 75 Years and over | 307 (59.6%) | 334 (54.5%) |
Disability Class by Sex by Age in Gooding County
Disability Class: Hearing Difficulty
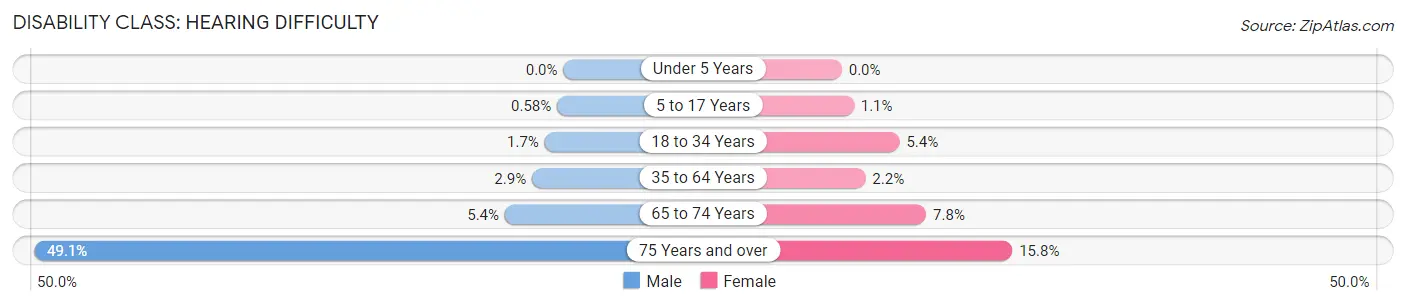
| Age Bracket | Male | Female |
| Under 5 Years | 0 (0.0%) | 0 (0.0%) |
| 5 to 17 Years | 9 (0.6%) | 18 (1.1%) |
| 18 to 34 Years | 28 (1.7%) | 80 (5.3%) |
| 35 to 64 Years | 84 (2.9%) | 57 (2.2%) |
| 65 to 74 Years | 44 (5.4%) | 60 (7.8%) |
| 75 Years and over | 253 (49.1%) | 97 (15.8%) |
Disability Class: Vision Difficulty
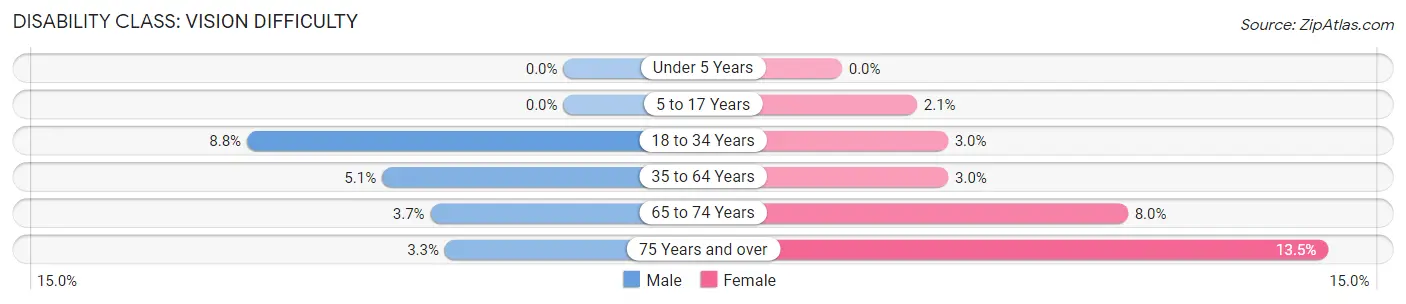
| Age Bracket | Male | Female |
| Under 5 Years | 0 (0.0%) | 0 (0.0%) |
| 5 to 17 Years | 0 (0.0%) | 34 (2.1%) |
| 18 to 34 Years | 143 (8.8%) | 44 (2.9%) |
| 35 to 64 Years | 146 (5.1%) | 77 (3.0%) |
| 65 to 74 Years | 30 (3.7%) | 61 (8.0%) |
| 75 Years and over | 17 (3.3%) | 83 (13.5%) |
Disability Class: Cognitive Difficulty
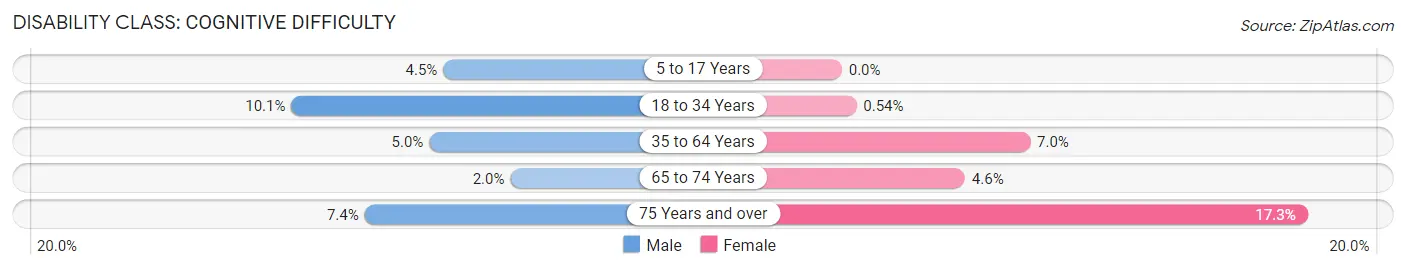
| Age Bracket | Male | Female |
| 5 to 17 Years | 69 (4.5%) | 0 (0.0%) |
| 18 to 34 Years | 164 (10.1%) | 8 (0.5%) |
| 35 to 64 Years | 144 (5.0%) | 182 (7.0%) |
| 65 to 74 Years | 16 (2.0%) | 35 (4.6%) |
| 75 Years and over | 38 (7.4%) | 106 (17.3%) |
Disability Class: Ambulatory Difficulty
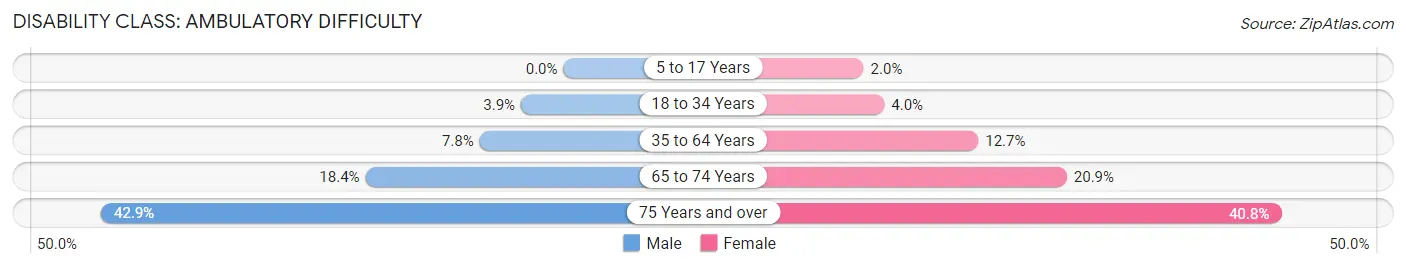
| Age Bracket | Male | Female |
| 5 to 17 Years | 0 (0.0%) | 33 (2.0%) |
| 18 to 34 Years | 64 (3.9%) | 59 (4.0%) |
| 35 to 64 Years | 225 (7.8%) | 330 (12.7%) |
| 65 to 74 Years | 149 (18.4%) | 160 (20.9%) |
| 75 Years and over | 221 (42.9%) | 250 (40.8%) |
Disability Class: Self-Care Difficulty
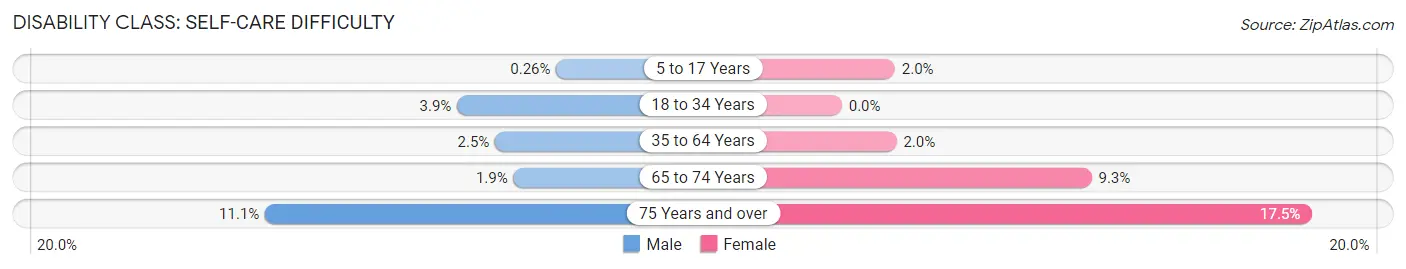
| Age Bracket | Male | Female |
| 5 to 17 Years | 4 (0.3%) | 32 (2.0%) |
| 18 to 34 Years | 64 (3.9%) | 0 (0.0%) |
| 35 to 64 Years | 73 (2.5%) | 53 (2.0%) |
| 65 to 74 Years | 15 (1.8%) | 71 (9.3%) |
| 75 Years and over | 57 (11.1%) | 107 (17.5%) |
Technology Access in Gooding County
Computing Device Access in Gooding County
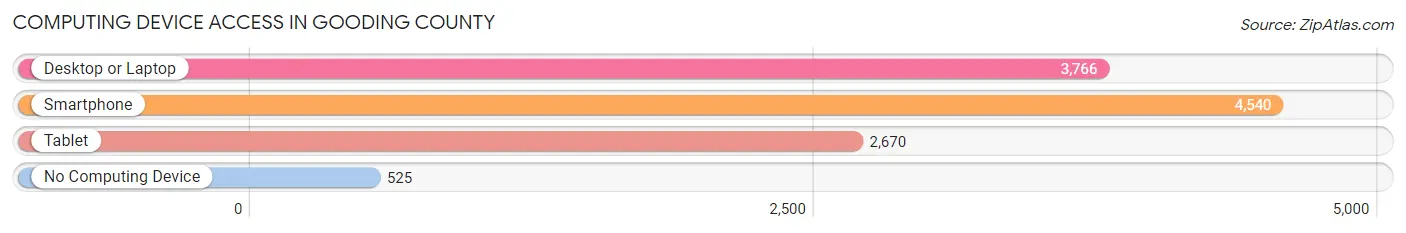
| Device Type | # Households | % Households |
| Desktop or Laptop | 3,766 | 69.6% |
| Smartphone | 4,540 | 83.9% |
| Tablet | 2,670 | 49.3% |
| No Computing Device | 525 | 9.7% |
| Total | 5,413 | 100.0% |
Internet Access in Gooding County
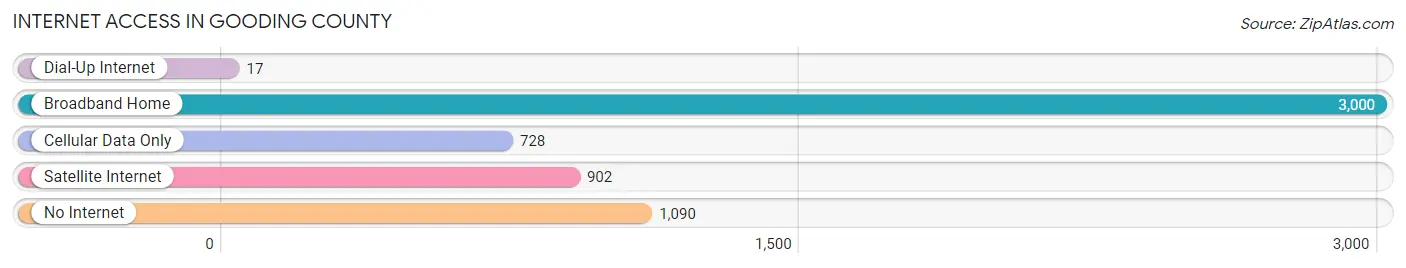
| Internet Type | # Households | % Households |
| Dial-Up Internet | 17 | 0.3% |
| Broadband Home | 3,000 | 55.4% |
| Cellular Data Only | 728 | 13.5% |
| Satellite Internet | 902 | 16.7% |
| No Internet | 1,090 | 20.1% |
| Total | 5,413 | 100.0% |
Gooding County Summary
Gooding County is located in the south-central region of Idaho, and is bordered by Lincoln County to the north, Twin Falls County to the east, Elmore County to the south, and Camas County to the west. The county seat is Gooding, and the county has a total area of 1,845 square miles.
Geography
Gooding County is located in the Snake River Plain, a large area of flat terrain that stretches across southern Idaho. The county is mostly covered by rolling hills and plains, with some areas of higher elevation in the north and east. The Snake River runs through the county, and there are several small lakes and reservoirs in the area. The climate is semi-arid, with hot summers and cold winters.
Economy
Agriculture is the main economic activity in Gooding County. The county is home to a variety of crops, including wheat, barley, alfalfa, potatoes, and sugar beets. Livestock production is also important, with cattle, sheep, and hogs being raised in the area. The county also has a growing tourism industry, with visitors coming to enjoy the area’s outdoor recreation opportunities.
Demographics
As of the 2010 census, Gooding County had a population of 15,464. The population is mostly white (90.2%), with small percentages of Hispanic (4.2%), Native American (2.2%), and Asian (1.2%) residents. The median household income is $41,945, and the median age is 37.
History
Gooding County was established in 1913, and was named after former Idaho Governor Frank Gooding. The county was originally populated by Native American tribes, including the Shoshone, Bannock, and Nez Perce. The area was first explored by Europeans in the early 1800s, and was later settled by Mormon pioneers in the late 1800s. The county was primarily an agricultural area until the early 1900s, when the construction of the Oregon Short Line Railroad brought new economic opportunities to the area. The county has since grown and developed, and today is home to a variety of industries and businesses.
Common Questions
What is the Total Population of Gooding County?
Total Population of Gooding County is 15,520.
What is the Total Male Population of Gooding County?
Total Male Population of Gooding County is 7,917.
What is the Total Female Population of Gooding County?
Total Female Population of Gooding County is 7,603.
What is the Ratio of Males per 100 Females in Gooding County?
There are 104.13 Males per 100 Females in Gooding County.
What is the Ratio of Females per 100 Males in Gooding County?
There are 96.03 Females per 100 Males in Gooding County.
What is the Median Population Age in Gooding County?
Median Population Age in Gooding County is 38.3 Years.
What is the Average Family Size in Gooding County
Average Family Size in Gooding County is 3.5 People.
What is the Average Household Size in Gooding County
Average Household Size in Gooding County is 2.9 People.
What is Per Capita Income in Gooding County?
Per Capita income in Gooding County is $29,147.
What is the Median Family Income in Gooding County?
Median Family Income in Gooding County is $73,696.
What is the Median Household income in Gooding County?
Median Household Income in Gooding County is $60,938.
What is Income or Wage Gap in Gooding County?
Income or Wage Gap in Gooding County is 37.7%.
Women in Gooding County earn 62.3 cents for every dollar earned by a man.
What is Inequality or Gini Index in Gooding County?
Inequality or Gini Index in Gooding County is 0.45.
How Large is the Labor Force in Gooding County?
There are 7,444 People in the Labor Forcein in Gooding County.
What is the Percentage of People in the Labor Force in Gooding County?
62.8% of People are in the Labor Force in Gooding County.
What is the Unemployment Rate in Gooding County?
Unemployment Rate in Gooding County is 3.5%.