Gem County, ID
Gem County Map
Gem County Overview
19,250
TOTAL POPULATION
9,776
MALE POPULATION
9,474
FEMALE POPULATION
103.19
MALES / 100 FEMALES
96.91
FEMALES / 100 MALES
44.0
MEDIAN AGE
3.0
AVG FAMILY SIZE
2.6
AVG HOUSEHOLD SIZE
$33,032
PER CAPITA INCOME
$72,847
AVG FAMILY INCOME
$65,204
AVG HOUSEHOLD INCOME
43.9%
WAGE / INCOME GAP [ % ]
56.1¢/ $1
WAGE / INCOME GAP [ $ ]
0.43
INEQUALITY / GINI INDEX
8,847
LABOR FORCE [ PEOPLE ]
57.3%
PERCENT IN LABOR FORCE
2.8%
UNEMPLOYMENT RATE
Gem County Area Codes
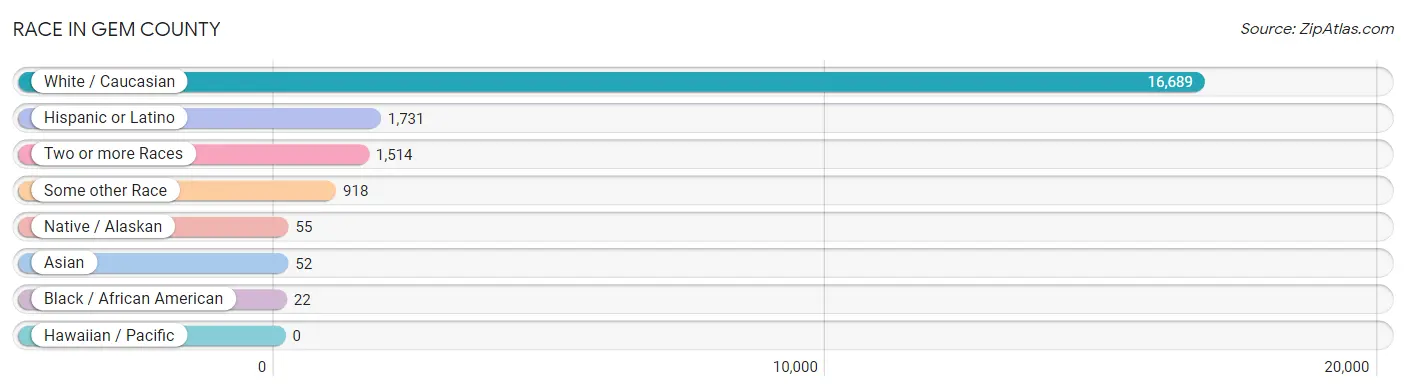
Race in Gem County
The most populous races in Gem County are White / Caucasian (16,689 | 86.7%), Hispanic or Latino (1,731 | 9.0%), and Two or more Races (1,514 | 7.9%).
| Race | # Population | % Population |
| Asian | 52 | 0.3% |
| Black / African American | 22 | 0.1% |
| Hawaiian / Pacific | 0 | 0.0% |
| Hispanic or Latino | 1,731 | 9.0% |
| Native / Alaskan | 55 | 0.3% |
| White / Caucasian | 16,689 | 86.7% |
| Two or more Races | 1,514 | 7.9% |
| Some other Race | 918 | 4.8% |
| Total | 19,250 | 100.0% |
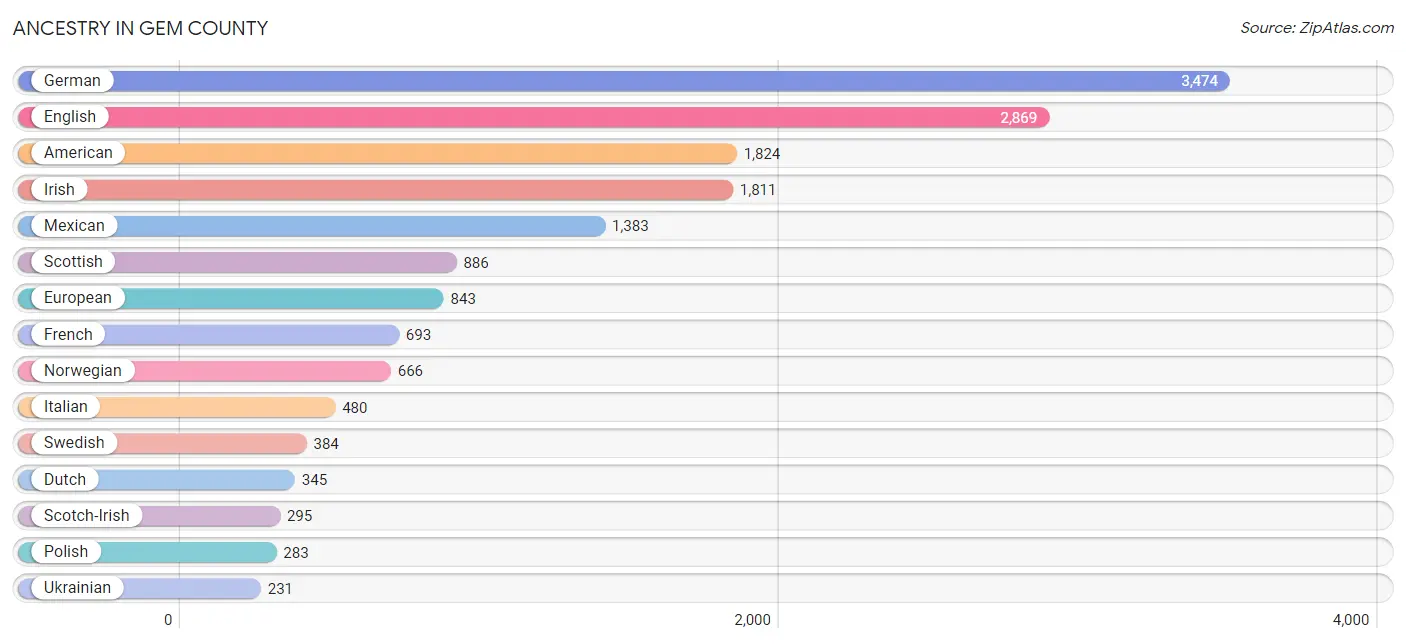
Ancestry in Gem County
The most populous ancestries reported in Gem County are German (3,474 | 18.0%), English (2,869 | 14.9%), American (1,824 | 9.5%), Irish (1,811 | 9.4%), and Mexican (1,383 | 7.2%), together accounting for 59.0% of all Gem County residents.
| Ancestry | # Population | % Population |
| African | 11 | 0.1% |
| American | 1,824 | 9.5% |
| Armenian | 10 | 0.1% |
| Austrian | 10 | 0.1% |
| Basque | 213 | 1.1% |
| Bhutanese | 130 | 0.7% |
| British | 217 | 1.1% |
| Burmese | 16 | 0.1% |
| Canadian | 11 | 0.1% |
| Celtic | 88 | 0.5% |
| Central American | 99 | 0.5% |
| Central American Indian | 19 | 0.1% |
| Cherokee | 71 | 0.4% |
| Cheyenne | 17 | 0.1% |
| Croatian | 43 | 0.2% |
| Cuban | 27 | 0.1% |
| Czech | 46 | 0.2% |
| Danish | 211 | 1.1% |
| Dutch | 345 | 1.8% |
| Dutch West Indian | 11 | 0.1% |
| English | 2,869 | 14.9% |
| European | 843 | 4.4% |
| Finnish | 85 | 0.4% |
| French | 693 | 3.6% |
| French Canadian | 67 | 0.4% |
| German | 3,474 | 18.0% |
| Greek | 162 | 0.8% |
| Guatemalan | 81 | 0.4% |
| Haitian | 13 | 0.1% |
| Hungarian | 14 | 0.1% |
| Indian (Asian) | 50 | 0.3% |
| Irish | 1,811 | 9.4% |
| Italian | 480 | 2.5% |
| Korean | 64 | 0.3% |
| Mexican | 1,383 | 7.2% |
| Mexican American Indian | 13 | 0.1% |
| Native Hawaiian | 127 | 0.7% |
| Northern European | 219 | 1.1% |
| Norwegian | 666 | 3.5% |
| Peruvian | 147 | 0.8% |
| Polish | 283 | 1.5% |
| Portuguese | 74 | 0.4% |
| Puget Sound Salish | 12 | 0.1% |
| Romanian | 9 | 0.1% |
| Russian | 218 | 1.1% |
| Salvadoran | 18 | 0.1% |
| Samoan | 27 | 0.1% |
| Scandinavian | 201 | 1.0% |
| Scotch-Irish | 295 | 1.5% |
| Scottish | 886 | 4.6% |
| Shoshone | 1 | 0.0% |
| Sioux | 23 | 0.1% |
| South American | 147 | 0.8% |
| Spaniard | 56 | 0.3% |
| Sri Lankan | 11 | 0.1% |
| Subsaharan African | 11 | 0.1% |
| Swedish | 384 | 2.0% |
| Swiss | 127 | 0.7% |
| Ukrainian | 231 | 1.2% |
| Welsh | 134 | 0.7% |
| Yaqui | 11 | 0.1% |
| Yugoslavian | 2 | 0.0% | View All 62 Rows |
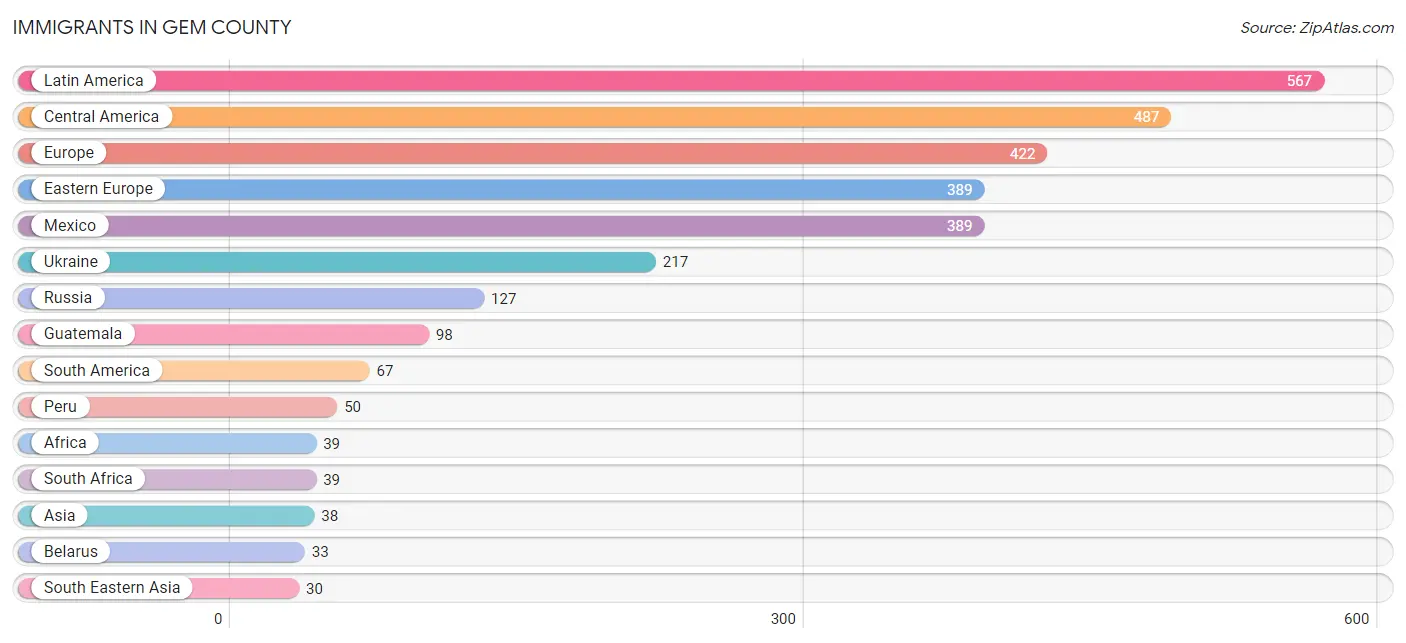
Immigrants in Gem County
The most numerous immigrant groups reported in Gem County came from Latin America (567 | 2.9%), Central America (487 | 2.5%), Europe (422 | 2.2%), Eastern Europe (389 | 2.0%), and Mexico (389 | 2.0%), together accounting for 11.7% of all Gem County residents.
| Immigration Origin | # Population | % Population |
| Africa | 39 | 0.2% |
| Asia | 38 | 0.2% |
| Belarus | 33 | 0.2% |
| Bosnia and Herzegovina | 2 | 0.0% |
| Brazil | 17 | 0.1% |
| Canada | 19 | 0.1% |
| Caribbean | 13 | 0.1% |
| Central America | 487 | 2.5% |
| Eastern Asia | 8 | 0.0% |
| Eastern Europe | 389 | 2.0% |
| Europe | 422 | 2.2% |
| Germany | 28 | 0.2% |
| Guatemala | 98 | 0.5% |
| Haiti | 13 | 0.1% |
| Japan | 8 | 0.0% |
| Latin America | 567 | 2.9% |
| Mexico | 389 | 2.0% |
| Peru | 50 | 0.3% |
| Philippines | 19 | 0.1% |
| Russia | 127 | 0.7% |
| South Africa | 39 | 0.2% |
| South America | 67 | 0.4% |
| South Eastern Asia | 30 | 0.2% |
| Southern Europe | 5 | 0.0% |
| Spain | 5 | 0.0% |
| Ukraine | 217 | 1.1% |
| Vietnam | 11 | 0.1% |
| Western Europe | 28 | 0.2% | View All 28 Rows |
Sex and Age in Gem County
Sex and Age in Gem County
The most populous age groups in Gem County are 60 to 64 Years (861 | 8.8%) for men and 60 to 64 Years (867 | 9.1%) for women.
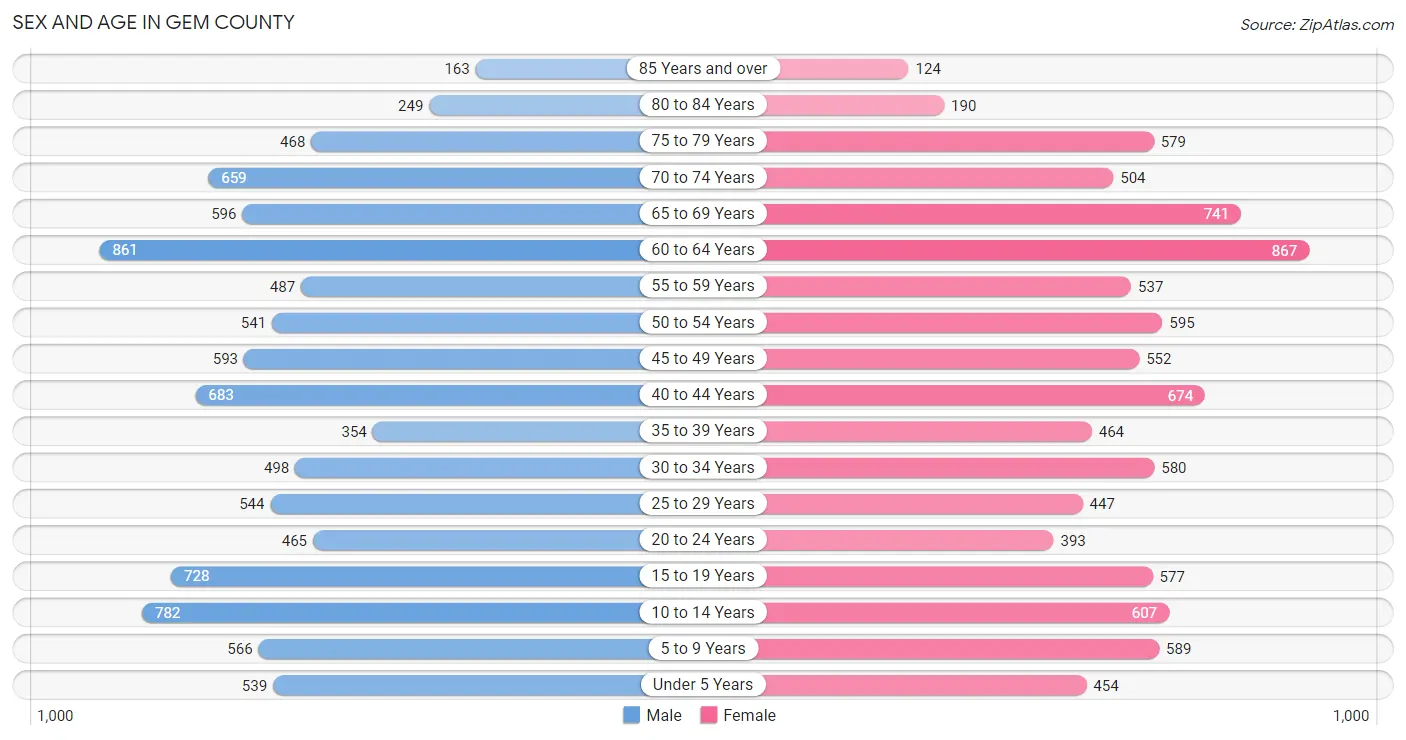
| Age Bracket | Male | Female |
| Under 5 Years | 539 (5.5%) | 454 (4.8%) |
| 5 to 9 Years | 566 (5.8%) | 589 (6.2%) |
| 10 to 14 Years | 782 (8.0%) | 607 (6.4%) |
| 15 to 19 Years | 728 (7.4%) | 577 (6.1%) |
| 20 to 24 Years | 465 (4.8%) | 393 (4.2%) |
| 25 to 29 Years | 544 (5.6%) | 447 (4.7%) |
| 30 to 34 Years | 498 (5.1%) | 580 (6.1%) |
| 35 to 39 Years | 354 (3.6%) | 464 (4.9%) |
| 40 to 44 Years | 683 (7.0%) | 674 (7.1%) |
| 45 to 49 Years | 593 (6.1%) | 552 (5.8%) |
| 50 to 54 Years | 541 (5.5%) | 595 (6.3%) |
| 55 to 59 Years | 487 (5.0%) | 537 (5.7%) |
| 60 to 64 Years | 861 (8.8%) | 867 (9.1%) |
| 65 to 69 Years | 596 (6.1%) | 741 (7.8%) |
| 70 to 74 Years | 659 (6.7%) | 504 (5.3%) |
| 75 to 79 Years | 468 (4.8%) | 579 (6.1%) |
| 80 to 84 Years | 249 (2.5%) | 190 (2.0%) |
| 85 Years and over | 163 (1.7%) | 124 (1.3%) |
| Total | 9,776 (100.0%) | 9,474 (100.0%) |
Families and Households in Gem County
Median Family Size in Gem County
The median family size in Gem County is 2.98 persons per family, with married-couple families (4,058 | 76.6%) accounting for the largest median family size of 3.1 persons per family. On the other hand, single male/father families (478 | 9.0%) represent the smallest median family size with 2.27 persons per family.
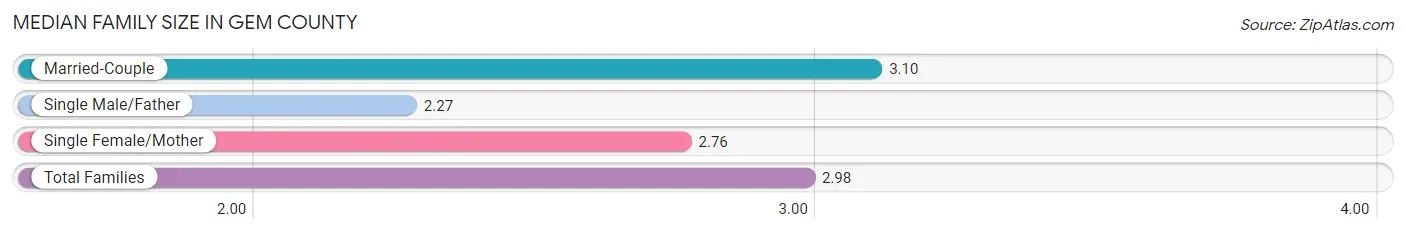
| Family Type | # Families | Family Size |
| Married-Couple | 4,058 (76.6%) | 3.10 |
| Single Male/Father | 478 (9.0%) | 2.27 |
| Single Female/Mother | 761 (14.4%) | 2.76 |
| Total Families | 5,297 (100.0%) | 2.98 |
Median Household Size in Gem County
The median household size in Gem County is 2.64 persons per household, with single male/father households (478 | 6.6%) accounting for the largest median household size of 3.29 persons per household. non-family households (1,899 | 26.4%) represent the smallest median household size with 1.14 persons per household.
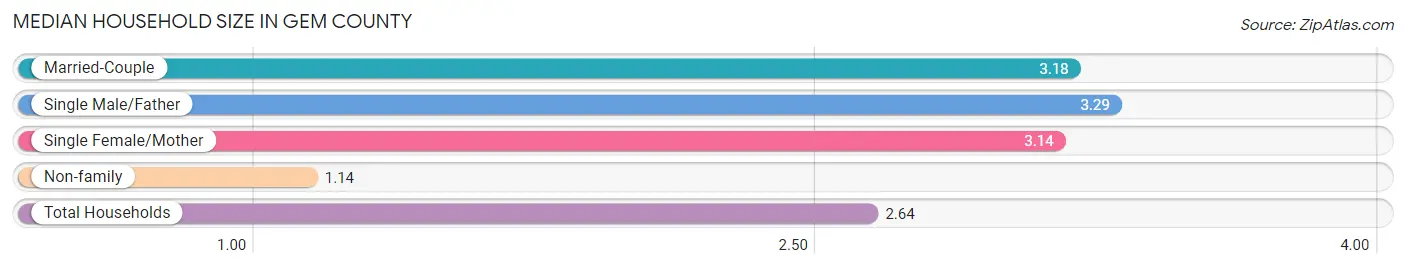
| Household Type | # Households | Household Size |
| Married-Couple | 4,058 (56.4%) | 3.18 |
| Single Male/Father | 478 (6.6%) | 3.29 |
| Single Female/Mother | 761 (10.6%) | 3.14 |
| Non-family | 1,899 (26.4%) | 1.14 |
| Total Households | 7,196 (100.0%) | 2.64 |
Household Size by Marriage Status in Gem County
Out of a total of 7,196 households in Gem County, 5,297 (73.6%) are family households, while 1,899 (26.4%) are nonfamily households. The most numerous type of family households are 2-person households, comprising 2,629, and the most common type of nonfamily households are 1-person households, comprising 1,671.
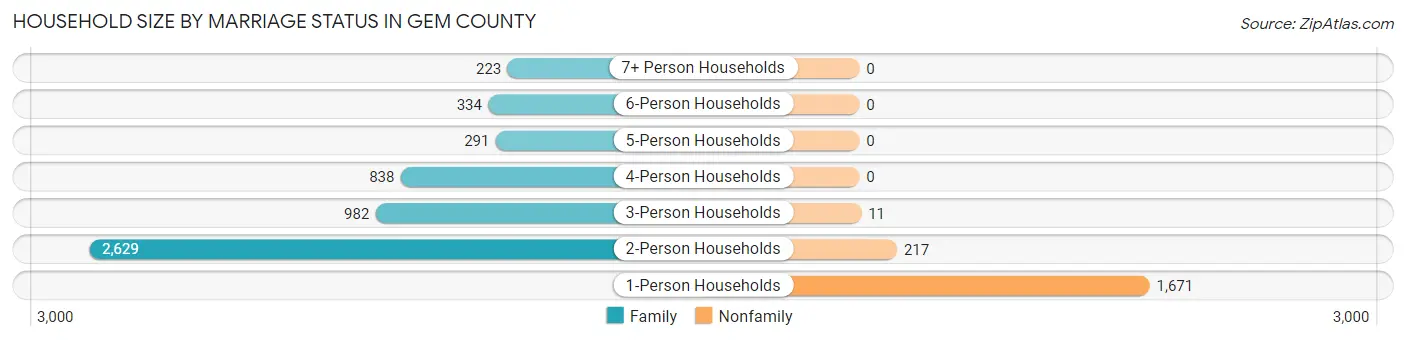
| Household Size | Family Households | Nonfamily Households |
| 1-Person Households | - | 1,671 (23.2%) |
| 2-Person Households | 2,629 (36.5%) | 217 (3.0%) |
| 3-Person Households | 982 (13.7%) | 11 (0.2%) |
| 4-Person Households | 838 (11.7%) | 0 (0.0%) |
| 5-Person Households | 291 (4.0%) | 0 (0.0%) |
| 6-Person Households | 334 (4.6%) | 0 (0.0%) |
| 7+ Person Households | 223 (3.1%) | 0 (0.0%) |
| Total | 5,297 (73.6%) | 1,899 (26.4%) |
Female Fertility in Gem County
Fertility by Age in Gem County
Average fertility rate in Gem County is 53.0 births per 1,000 women. Women in the age bracket of 20 to 34 years have the highest fertility rate with 77.0 births per 1,000 women. Women in the age bracket of 20 to 34 years acount for 54.0% of all women with births.
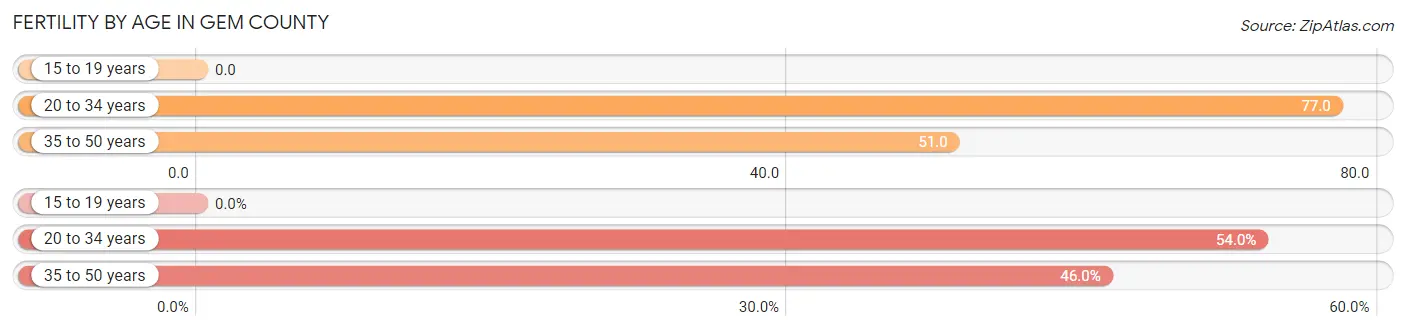
| Age Bracket | Women with Births | Births / 1,000 Women |
| 15 to 19 years | 0 (0.0%) | 0.0 |
| 20 to 34 years | 109 (54.0%) | 77.0 |
| 35 to 50 years | 93 (46.0%) | 51.0 |
| Total | 202 (100.0%) | 53.0 |
Fertility by Age by Marriage Status in Gem County
88.6% of women with births (202) in Gem County are married. The highest percentage of unmarried women with births falls into 20 to 34 years age bracket with 21.1% of them unmarried at the time of birth, while the lowest percentage of unmarried women with births belong to 35 to 50 years age bracket with 0.0% of them unmarried.
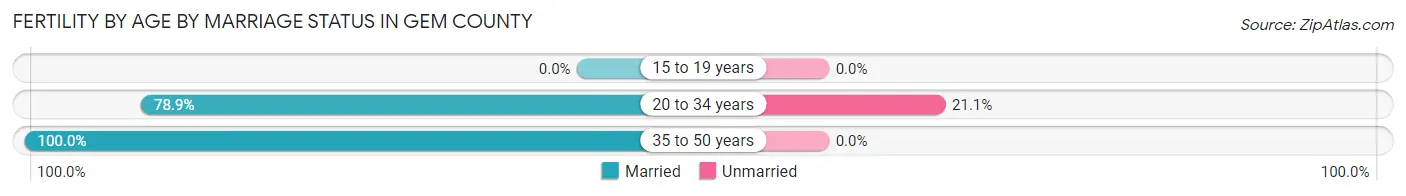
| Age Bracket | Married | Unmarried |
| 15 to 19 years | 0 (0.0%) | 0 (0.0%) |
| 20 to 34 years | 86 (78.9%) | 23 (21.1%) |
| 35 to 50 years | 93 (100.0%) | 0 (0.0%) |
| Total | 179 (88.6%) | 23 (11.4%) |
Fertility by Education in Gem County
Average fertility rate in Gem County is 53.0 births per 1,000 women. Women with the education attainment of graduate degree have the highest fertility rate of 277.0 births per 1,000 women, while women with the education attainment of college or associate's degree have the lowest fertility at 26.0 births per 1,000 women. Women with the education attainment of high school diploma represent 38.1% of all women with births.
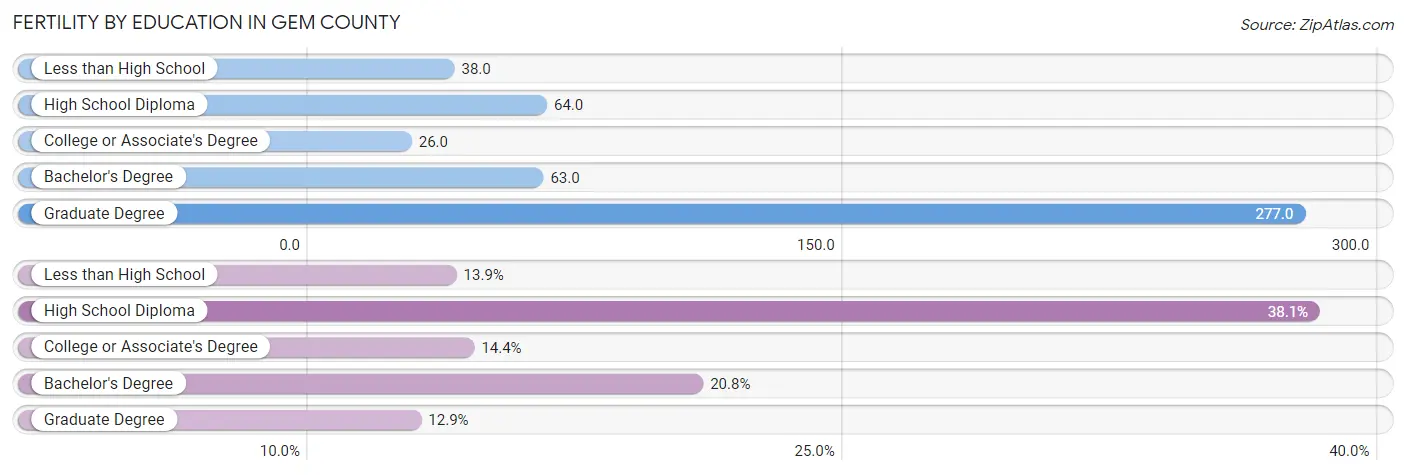
| Educational Attainment | Women with Births | Births / 1,000 Women |
| Less than High School | 28 (13.9%) | 38.0 |
| High School Diploma | 77 (38.1%) | 64.0 |
| College or Associate's Degree | 29 (14.4%) | 26.0 |
| Bachelor's Degree | 42 (20.8%) | 63.0 |
| Graduate Degree | 26 (12.9%) | 277.0 |
| Total | 202 (100.0%) | 53.0 |
Fertility by Education by Marriage Status in Gem County
11.4% of women with births in Gem County are unmarried. Women with the educational attainment of less than high school are most likely to be married with 100.0% of them married at childbirth, while women with the educational attainment of high school diploma are least likely to be married with 29.9% of them unmarried at childbirth.
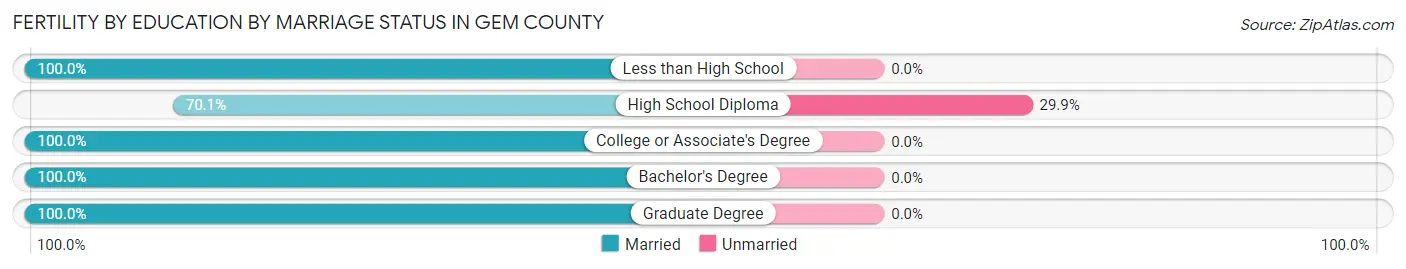
| Educational Attainment | Married | Unmarried |
| Less than High School | 28 (100.0%) | 0 (0.0%) |
| High School Diploma | 54 (70.1%) | 23 (29.9%) |
| College or Associate's Degree | 29 (100.0%) | 0 (0.0%) |
| Bachelor's Degree | 42 (100.0%) | 0 (0.0%) |
| Graduate Degree | 26 (100.0%) | 0 (0.0%) |
| Total | 179 (88.6%) | 23 (11.4%) |
Income in Gem County
Income Overview in Gem County
Per Capita Income in Gem County is $33,032, while median incomes of families and households are $72,847 and $65,204 respectively.
| Characteristic | Number | Measure |
| Per Capita Income | 19,250 | $33,032 |
| Median Family Income | 5,297 | $72,847 |
| Mean Family Income | 5,297 | $92,078 |
| Median Household Income | 7,196 | $65,204 |
| Mean Household Income | 7,196 | $83,872 |
| Income Deficit | 5,297 | $0 |
| Wage / Income Gap (%) | 19,250 | 43.94% |
| Wage / Income Gap ($) | 19,250 | 56.06¢ per $1 |
| Gini / Inequality Index | 19,250 | 0.43 |
Earnings by Sex in Gem County
Average Earnings in Gem County are $32,074, $42,155 for men and $23,630 for women, a difference of 43.9%.
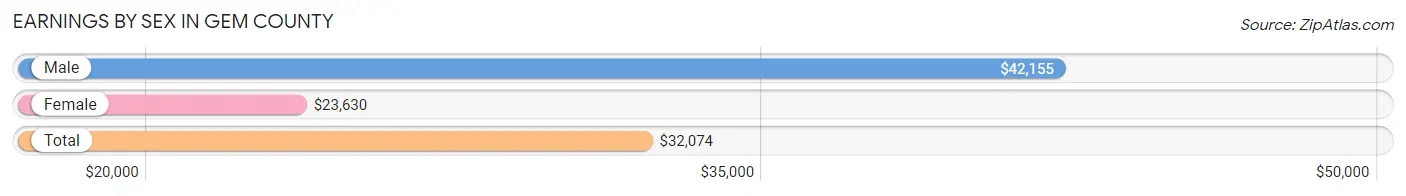
| Sex | Number | Average Earnings |
| Male | 4,994 (52.3%) | $42,155 |
| Female | 4,561 (47.7%) | $23,630 |
| Total | 9,555 (100.0%) | $32,074 |
Earnings by Sex by Income Bracket in Gem County
The most common earnings brackets in Gem County are $100,000+ for men (664 | 13.3%) and $2,499 or less for women (547 | 12.0%).
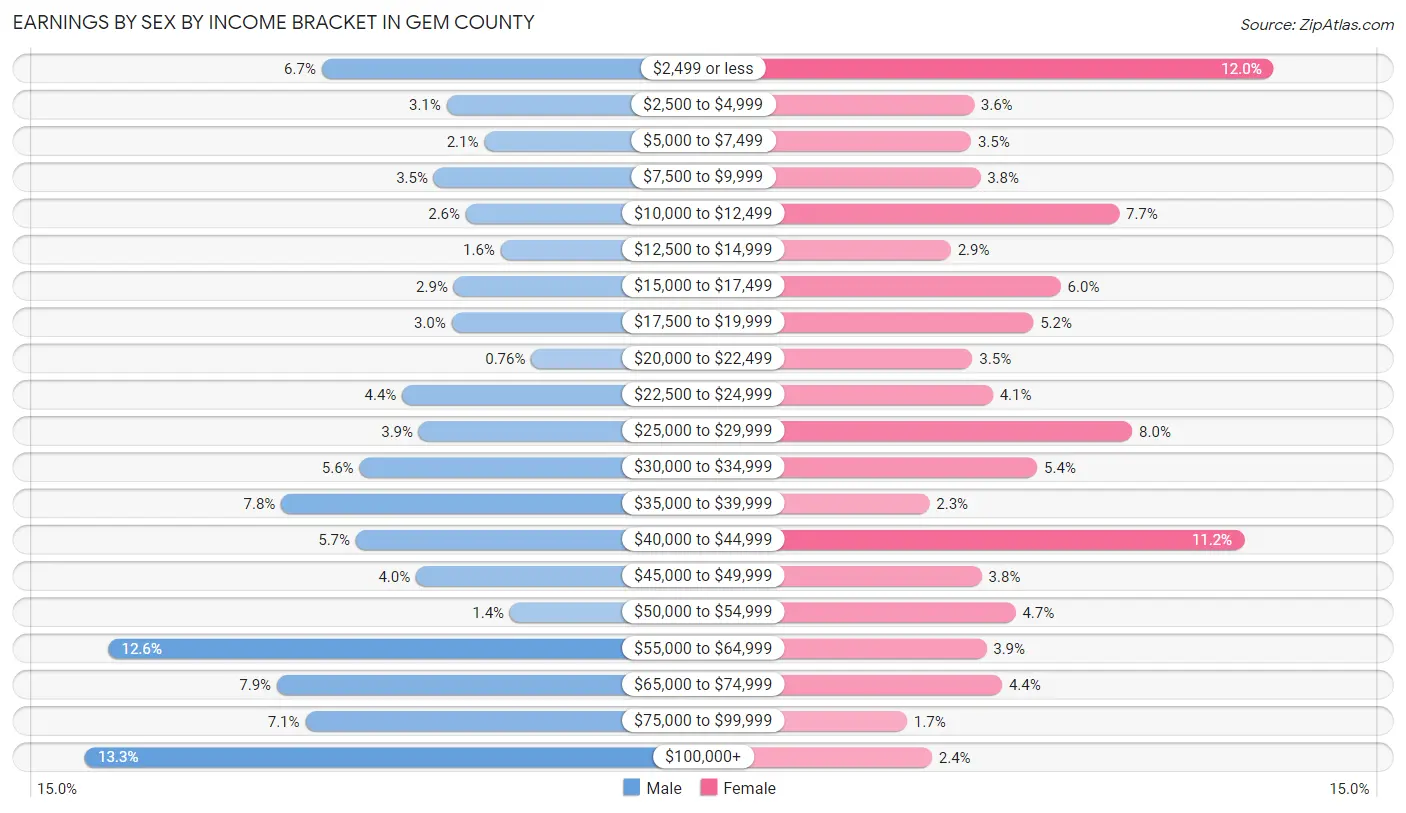
| Income | Male | Female |
| $2,499 or less | 332 (6.7%) | 547 (12.0%) |
| $2,500 to $4,999 | 157 (3.1%) | 163 (3.6%) |
| $5,000 to $7,499 | 104 (2.1%) | 159 (3.5%) |
| $7,500 to $9,999 | 175 (3.5%) | 171 (3.7%) |
| $10,000 to $12,499 | 130 (2.6%) | 349 (7.6%) |
| $12,500 to $14,999 | 81 (1.6%) | 133 (2.9%) |
| $15,000 to $17,499 | 147 (2.9%) | 274 (6.0%) |
| $17,500 to $19,999 | 150 (3.0%) | 239 (5.2%) |
| $20,000 to $22,499 | 38 (0.8%) | 161 (3.5%) |
| $22,500 to $24,999 | 219 (4.4%) | 187 (4.1%) |
| $25,000 to $29,999 | 196 (3.9%) | 366 (8.0%) |
| $30,000 to $34,999 | 279 (5.6%) | 244 (5.3%) |
| $35,000 to $39,999 | 389 (7.8%) | 106 (2.3%) |
| $40,000 to $44,999 | 284 (5.7%) | 509 (11.2%) |
| $45,000 to $49,999 | 200 (4.0%) | 173 (3.8%) |
| $50,000 to $54,999 | 68 (1.4%) | 216 (4.7%) |
| $55,000 to $64,999 | 631 (12.6%) | 179 (3.9%) |
| $65,000 to $74,999 | 395 (7.9%) | 199 (4.4%) |
| $75,000 to $99,999 | 355 (7.1%) | 77 (1.7%) |
| $100,000+ | 664 (13.3%) | 109 (2.4%) |
| Total | 4,994 (100.0%) | 4,561 (100.0%) |
Earnings by Sex by Educational Attainment in Gem County
Average earnings in Gem County are $53,523 for men and $28,345 for women, a difference of 47.0%. Men with an educational attainment of graduate degree enjoy the highest average annual earnings of $68,243, while those with less than high school education earn the least with $41,141. Women with an educational attainment of graduate degree earn the most with the average annual earnings of $43,854, while those with high school diploma education have the smallest earnings of $21,059.
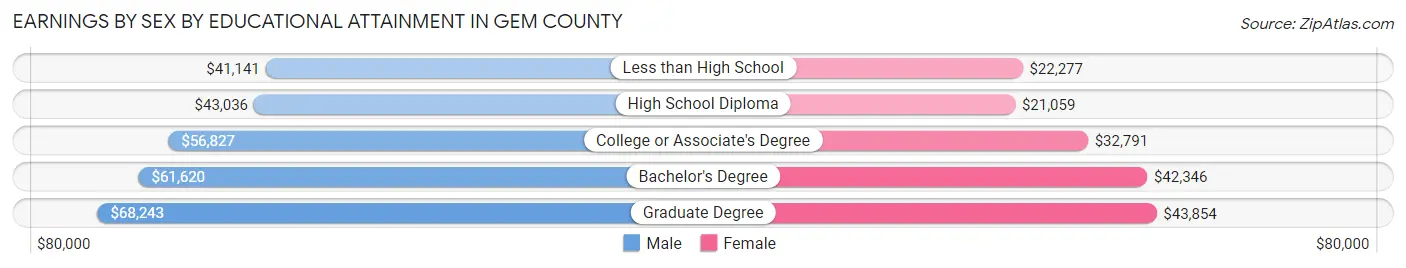
| Educational Attainment | Male Income | Female Income |
| Less than High School | $41,141 | $22,277 |
| High School Diploma | $43,036 | $21,059 |
| College or Associate's Degree | $56,827 | $32,791 |
| Bachelor's Degree | $61,620 | $42,346 |
| Graduate Degree | $68,243 | $43,854 |
| Total | $53,523 | $28,345 |
Family Income in Gem County
Family Income Brackets in Gem County
According to the Gem County family income data, there are 1,451 families falling into the $50,000 to $74,999 income range, which is the most common income bracket and makes up 27.4% of all families. Conversely, the less than $10,000 income bracket is the least frequent group with only 58 families (1.1%) belonging to this category.
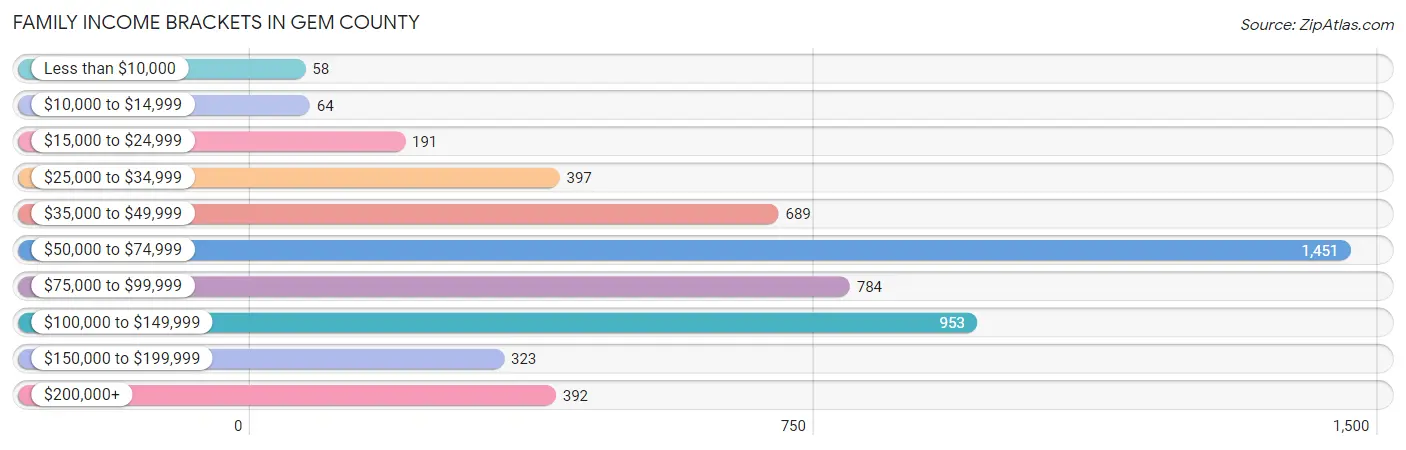
| Income Bracket | # Families | % Families |
| Less than $10,000 | 58 | 1.1% |
| $10,000 to $14,999 | 64 | 1.2% |
| $15,000 to $24,999 | 191 | 3.6% |
| $25,000 to $34,999 | 397 | 7.5% |
| $35,000 to $49,999 | 689 | 13.0% |
| $50,000 to $74,999 | 1,451 | 27.4% |
| $75,000 to $99,999 | 784 | 14.8% |
| $100,000 to $149,999 | 953 | 18.0% |
| $150,000 to $199,999 | 323 | 6.1% |
| $200,000+ | 392 | 7.4% |
Family Income by Famaliy Size in Gem County
7+ person families (117 | 2.2%) account for the highest median family income in Gem County with $147,188 per family, while 2-person families (2,944 | 55.6%) have the highest median income of $34,365 per family member.
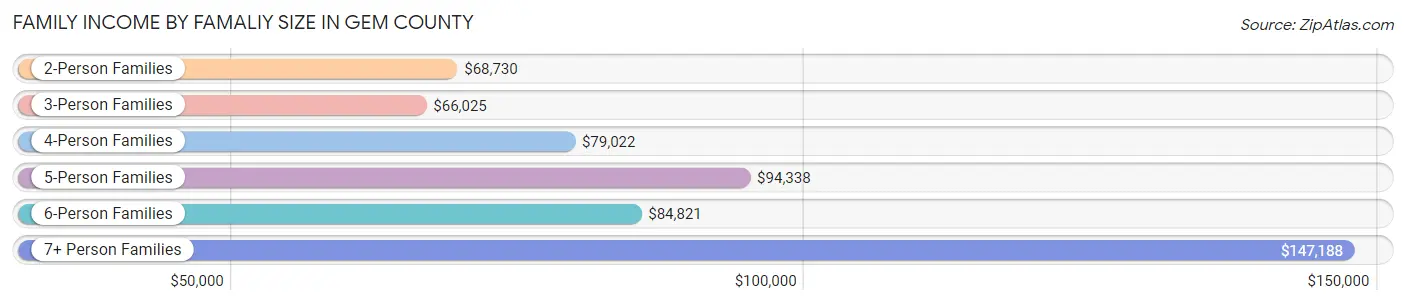
| Income Bracket | # Families | Median Income |
| 2-Person Families | 2,944 (55.6%) | $68,730 |
| 3-Person Families | 1,019 (19.2%) | $66,025 |
| 4-Person Families | 674 (12.7%) | $79,022 |
| 5-Person Families | 191 (3.6%) | $94,338 |
| 6-Person Families | 352 (6.7%) | $84,821 |
| 7+ Person Families | 117 (2.2%) | $147,188 |
| Total | 5,297 (100.0%) | $72,847 |
Family Income by Number of Earners in Gem County
The median family income in Gem County is $72,847, with families comprising 3+ earners (584) having the highest median family income of $100,132, while families with 1 earner (1,740) have the lowest median family income of $59,068, accounting for 11.0% and 32.9% of families, respectively.
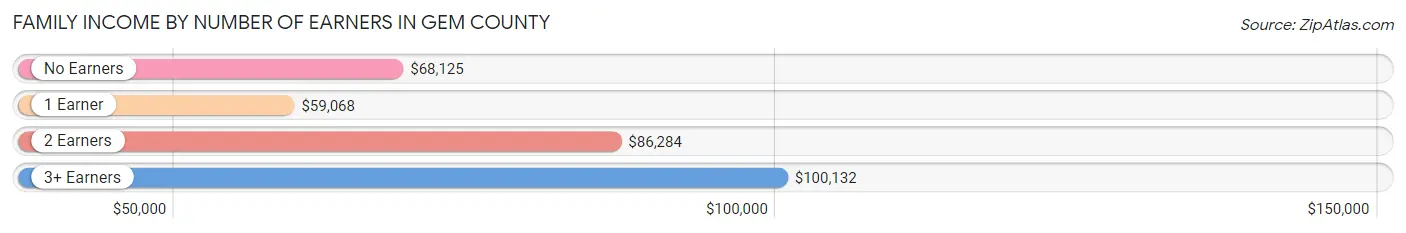
| Number of Earners | # Families | Median Income |
| No Earners | 985 (18.6%) | $68,125 |
| 1 Earner | 1,740 (32.9%) | $59,068 |
| 2 Earners | 1,988 (37.5%) | $86,284 |
| 3+ Earners | 584 (11.0%) | $100,132 |
| Total | 5,297 (100.0%) | $72,847 |
Household Income in Gem County
Household Income Brackets in Gem County
With 1,785 households falling in the category, the $50,000 to $74,999 income range is the most frequent in Gem County, accounting for 24.8% of all households. In contrast, only 273 households (3.8%) fall into the $10,000 to $14,999 income bracket, making it the least populous group.
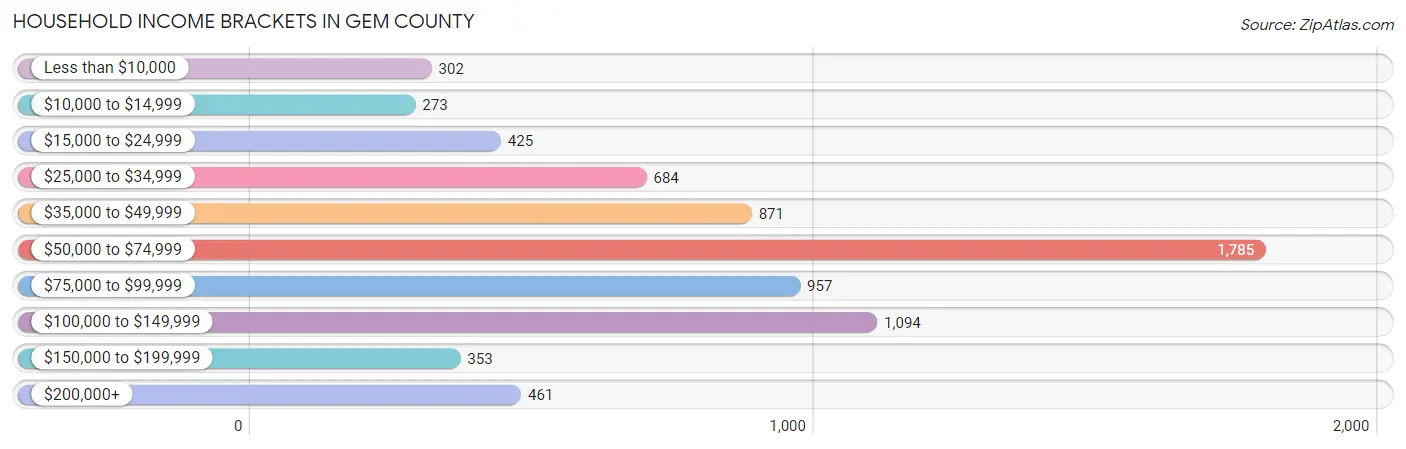
| Income Bracket | # Households | % Households |
| Less than $10,000 | 302 | 4.2% |
| $10,000 to $14,999 | 273 | 3.8% |
| $15,000 to $24,999 | 425 | 5.9% |
| $25,000 to $34,999 | 684 | 9.5% |
| $35,000 to $49,999 | 871 | 12.1% |
| $50,000 to $74,999 | 1,785 | 24.8% |
| $75,000 to $99,999 | 957 | 13.3% |
| $100,000 to $149,999 | 1,094 | 15.2% |
| $150,000 to $199,999 | 353 | 4.9% |
| $200,000+ | 461 | 6.4% |
Household Income by Householder Age in Gem County
The median household income in Gem County is $65,204, with the highest median household income of $75,425 found in the 45 to 64 years age bracket for the primary householder. A total of 2,647 households (36.8%) fall into this category. Meanwhile, the 65+ years age bracket for the primary householder has the lowest median household income of $47,724, with 2,594 households (36.0%) in this group.
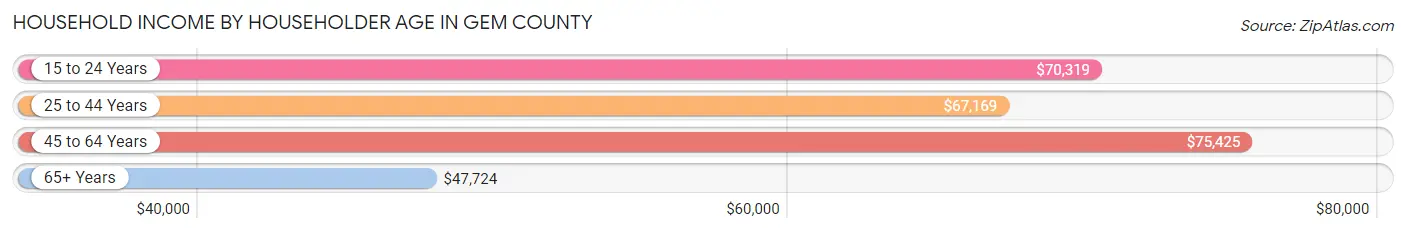
| Income Bracket | # Households | Median Income |
| 15 to 24 Years | 171 (2.4%) | $70,319 |
| 25 to 44 Years | 1,784 (24.8%) | $67,169 |
| 45 to 64 Years | 2,647 (36.8%) | $75,425 |
| 65+ Years | 2,594 (36.0%) | $47,724 |
| Total | 7,196 (100.0%) | $65,204 |
Poverty in Gem County
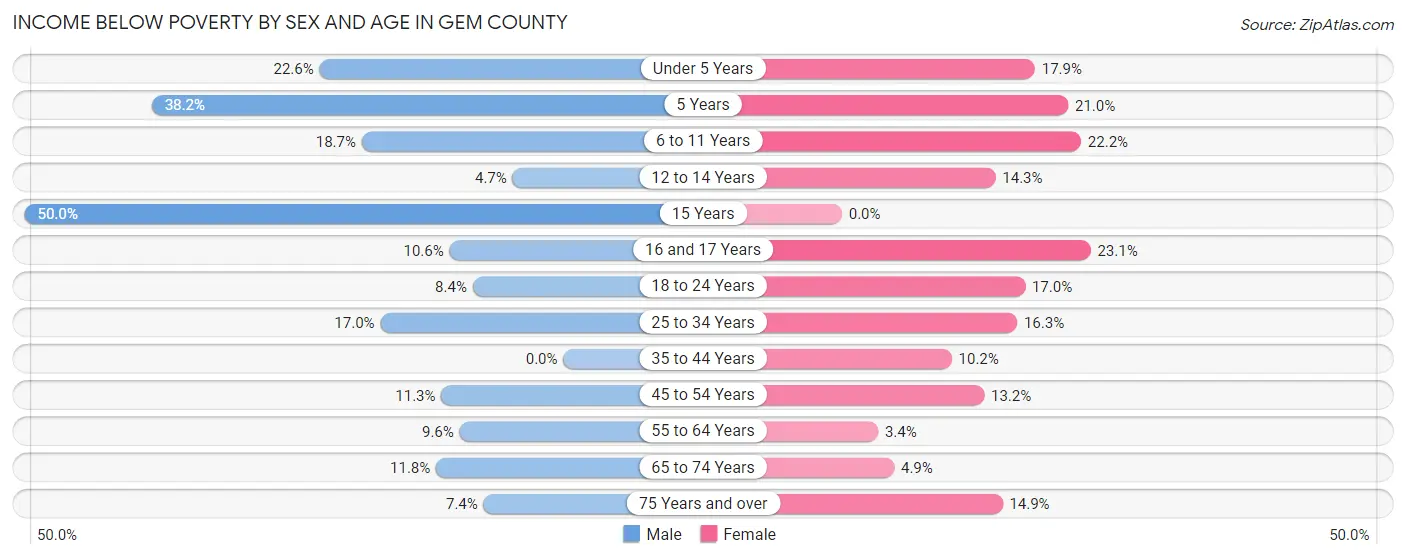
Income Below Poverty by Sex and Age in Gem County
With 11.5% poverty level for males and 12.0% for females among the residents of Gem County, 15 year old males and 16 and 17 year old females are the most vulnerable to poverty, with 55 males (50.0%) and 48 females (23.1%) in their respective age groups living below the poverty level.
| Age Bracket | Male | Female |
| Under 5 Years | 122 (22.6%) | 79 (17.9%) |
| 5 Years | 34 (38.2%) | 21 (21.0%) |
| 6 to 11 Years | 119 (18.7%) | 156 (22.2%) |
| 12 to 14 Years | 17 (4.7%) | 56 (14.2%) |
| 15 Years | 55 (50.0%) | 0 (0.0%) |
| 16 and 17 Years | 32 (10.6%) | 48 (23.1%) |
| 18 to 24 Years | 65 (8.4%) | 102 (17.0%) |
| 25 to 34 Years | 173 (17.0%) | 167 (16.3%) |
| 35 to 44 Years | 0 (0.0%) | 115 (10.2%) |
| 45 to 54 Years | 128 (11.3%) | 151 (13.2%) |
| 55 to 64 Years | 128 (9.6%) | 47 (3.4%) |
| 65 to 74 Years | 148 (11.8%) | 60 (4.9%) |
| 75 Years and over | 62 (7.4%) | 119 (14.9%) |
| Total | 1,083 (11.5%) | 1,121 (12.0%) |
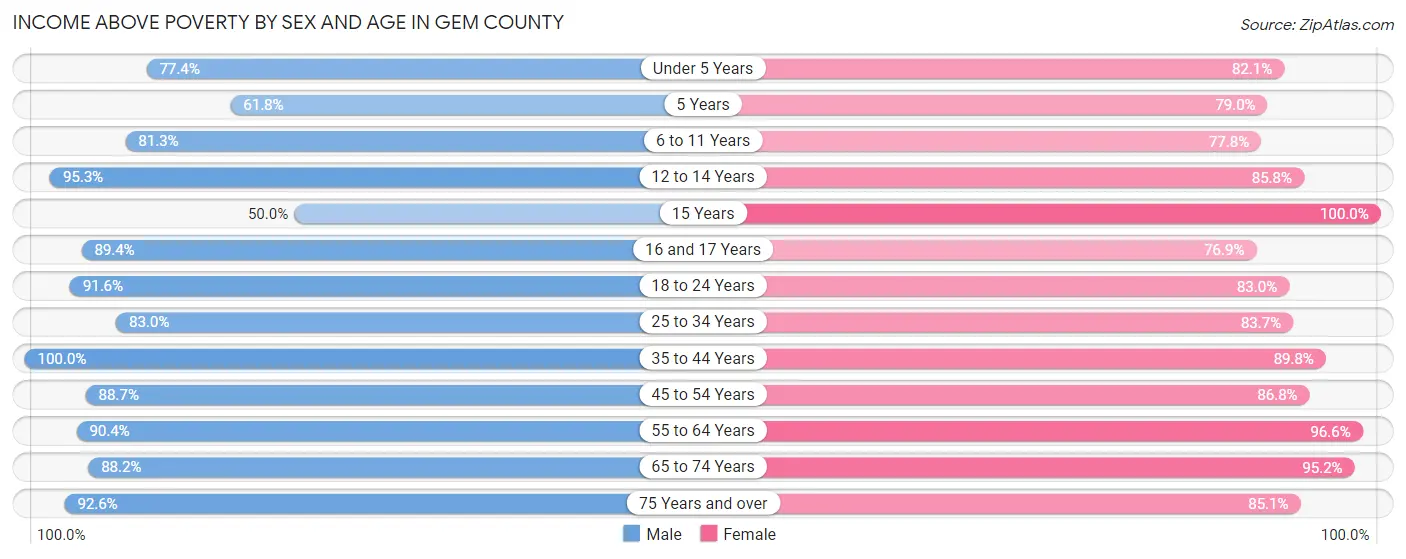
Income Above Poverty by Sex and Age in Gem County
According to the poverty statistics in Gem County, males aged 35 to 44 years and females aged 15 years are the age groups that are most secure financially, with 100.0% of males and 100.0% of females in these age groups living above the poverty line.
| Age Bracket | Male | Female |
| Under 5 Years | 417 (77.4%) | 362 (82.1%) |
| 5 Years | 55 (61.8%) | 79 (79.0%) |
| 6 to 11 Years | 517 (81.3%) | 547 (77.8%) |
| 12 to 14 Years | 344 (95.3%) | 337 (85.8%) |
| 15 Years | 55 (50.0%) | 162 (100.0%) |
| 16 and 17 Years | 271 (89.4%) | 160 (76.9%) |
| 18 to 24 Years | 708 (91.6%) | 498 (83.0%) |
| 25 to 34 Years | 846 (83.0%) | 860 (83.7%) |
| 35 to 44 Years | 1,026 (100.0%) | 1,014 (89.8%) |
| 45 to 54 Years | 1,003 (88.7%) | 993 (86.8%) |
| 55 to 64 Years | 1,201 (90.4%) | 1,353 (96.6%) |
| 65 to 74 Years | 1,105 (88.2%) | 1,176 (95.2%) |
| 75 Years and over | 776 (92.6%) | 679 (85.1%) |
| Total | 8,324 (88.5%) | 8,220 (88.0%) |
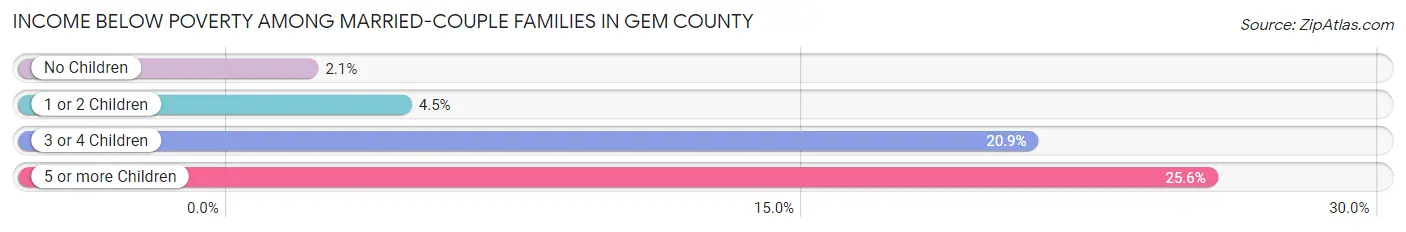
Income Below Poverty Among Married-Couple Families in Gem County
The poverty statistics for married-couple families in Gem County show that 4.5% or 184 of the total 4,058 families live below the poverty line. Families with 5 or more children have the highest poverty rate of 25.6%, comprising of 11 families. On the other hand, families with no children have the lowest poverty rate of 2.1%, which includes 58 families.
| Children | Above Poverty | Below Poverty |
| No Children | 2,699 (97.9%) | 58 (2.1%) |
| 1 or 2 Children | 863 (95.5%) | 41 (4.5%) |
| 3 or 4 Children | 280 (79.1%) | 74 (20.9%) |
| 5 or more Children | 32 (74.4%) | 11 (25.6%) |
| Total | 3,874 (95.5%) | 184 (4.5%) |
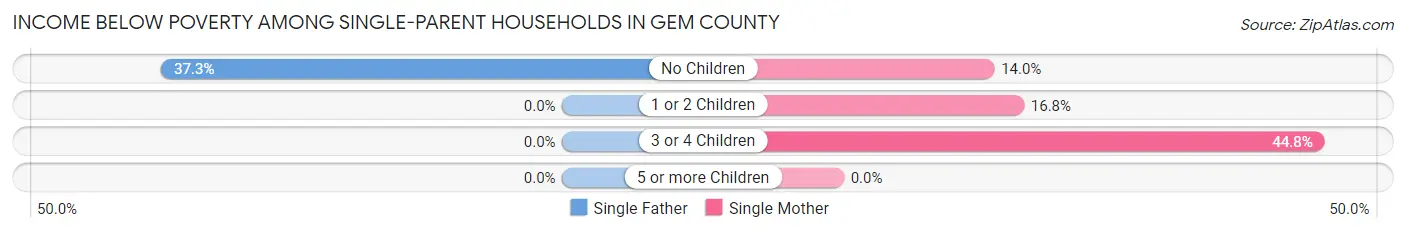
Income Below Poverty Among Single-Parent Households in Gem County
According to the poverty data in Gem County, 9.2% or 44 single-father households and 18.3% or 139 single-mother households are living below the poverty line. Among single-father households, those with no children have the highest poverty rate, with 44 households (37.3%) experiencing poverty. Likewise, among single-mother households, those with 3 or 4 children have the highest poverty rate, with 30 households (44.8%) falling below the poverty line.
| Children | Single Father | Single Mother |
| No Children | 44 (37.3%) | 38 (14.0%) |
| 1 or 2 Children | 0 (0.0%) | 71 (16.8%) |
| 3 or 4 Children | 0 (0.0%) | 30 (44.8%) |
| 5 or more Children | 0 (0.0%) | 0 (0.0%) |
| Total | 44 (9.2%) | 139 (18.3%) |
Income Below Poverty Among Married-Couple vs Single-Parent Households in Gem County
The poverty data for Gem County shows that 184 of the married-couple family households (4.5%) and 183 of the single-parent households (14.8%) are living below the poverty level. Within the married-couple family households, those with 5 or more children have the highest poverty rate, with 11 households (25.6%) falling below the poverty line. Among the single-parent households, those with 3 or 4 children have the highest poverty rate, with 30 household (37.5%) living below poverty.
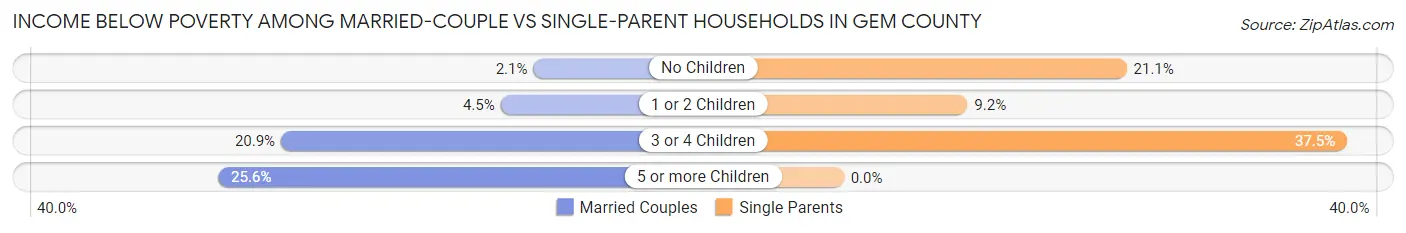
| Children | Married-Couple Families | Single-Parent Households |
| No Children | 58 (2.1%) | 82 (21.1%) |
| 1 or 2 Children | 41 (4.5%) | 71 (9.2%) |
| 3 or 4 Children | 74 (20.9%) | 30 (37.5%) |
| 5 or more Children | 11 (25.6%) | 0 (0.0%) |
| Total | 184 (4.5%) | 183 (14.8%) |
Employment Characteristics in Gem County
Employment by Class of Employer in Gem County
Among the 8,321 employed individuals in Gem County, private company employees (5,356 | 64.4%), local government employees (806 | 9.7%), and self-employed (not incorporated) (786 | 9.5%) make up the most common classes of employment.
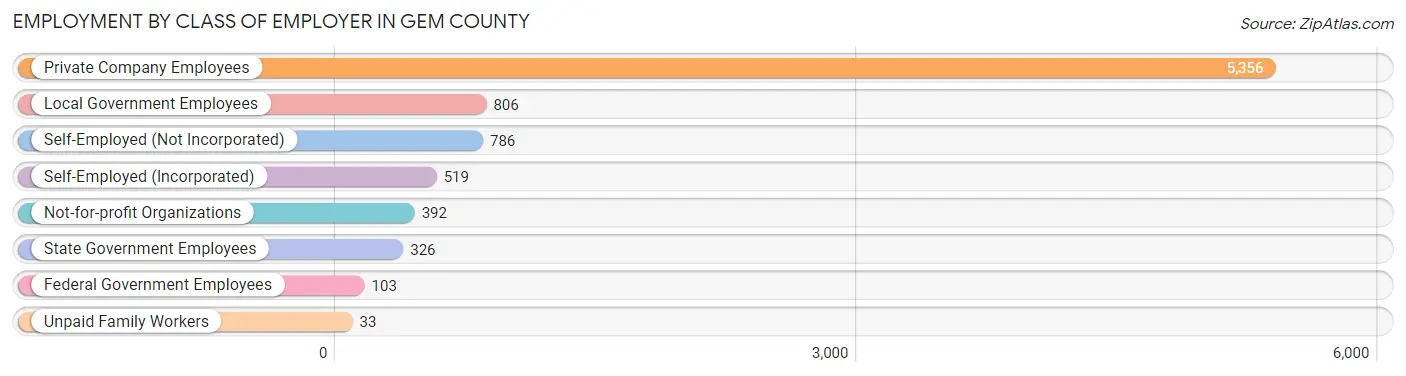
| Employer Class | # Employees | % Employees |
| Private Company Employees | 5,356 | 64.4% |
| Self-Employed (Incorporated) | 519 | 6.2% |
| Self-Employed (Not Incorporated) | 786 | 9.5% |
| Not-for-profit Organizations | 392 | 4.7% |
| Local Government Employees | 806 | 9.7% |
| State Government Employees | 326 | 3.9% |
| Federal Government Employees | 103 | 1.2% |
| Unpaid Family Workers | 33 | 0.4% |
| Total | 8,321 | 100.0% |
Employment Status by Age in Gem County
According to the labor force statistics for Gem County, out of the total population over 16 years of age (15,440), 57.3% or 8,847 individuals are in the labor force, with 2.8% or 248 of them unemployed. The age group with the highest labor force participation rate is 20 to 24 years, with 89.2% or 765 individuals in the labor force. Within the labor force, the 35 to 44 years age range has the highest percentage of unemployed individuals, with 6.0% or 106 of them being unemployed.
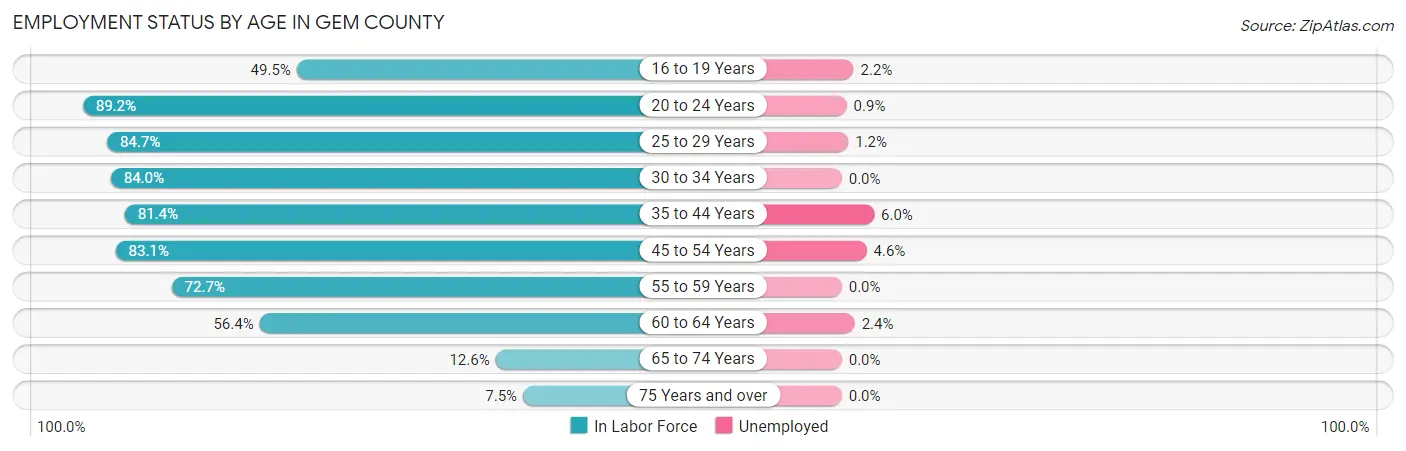
| Age Bracket | In Labor Force | Unemployed |
| 16 to 19 Years | 511 (49.5%) | 11 (2.2%) |
| 20 to 24 Years | 765 (89.2%) | 7 (0.9%) |
| 25 to 29 Years | 839 (84.7%) | 10 (1.2%) |
| 30 to 34 Years | 906 (84.0%) | 0 (0.0%) |
| 35 to 44 Years | 1,770 (81.4%) | 106 (6.0%) |
| 45 to 54 Years | 1,896 (83.1%) | 87 (4.6%) |
| 55 to 59 Years | 744 (72.7%) | 0 (0.0%) |
| 60 to 64 Years | 975 (56.4%) | 23 (2.4%) |
| 65 to 74 Years | 315 (12.6%) | 0 (0.0%) |
| 75 Years and over | 133 (7.5%) | 0 (0.0%) |
| Total | 8,847 (57.3%) | 248 (2.8%) |
Employment Status by Educational Attainment in Gem County
According to labor force statistics for Gem County, 76.8% of individuals (7,125) out of the total population between 25 and 64 years of age (9,277) are in the labor force, with 3.2% or 228 of them being unemployed. The group with the highest labor force participation rate are those with the educational attainment of bachelor's degree or higher, with 83.3% or 1,763 individuals in the labor force. Within the labor force, individuals with high school diploma education have the highest percentage of unemployment, with 7.2% or 173 of them being unemployed.
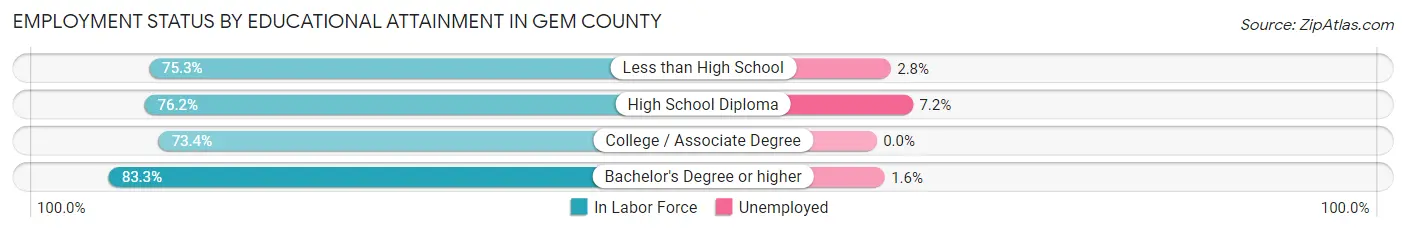
| Educational Attainment | In Labor Force | Unemployed |
| Less than High School | 819 (75.3%) | 30 (2.8%) |
| High School Diploma | 2,406 (76.2%) | 227 (7.2%) |
| College / Associate Degree | 2,140 (73.4%) | 0 (0.0%) |
| Bachelor's Degree or higher | 1,763 (83.3%) | 34 (1.6%) |
| Total | 7,125 (76.8%) | 297 (3.2%) |
Employment Occupations by Sex in Gem County
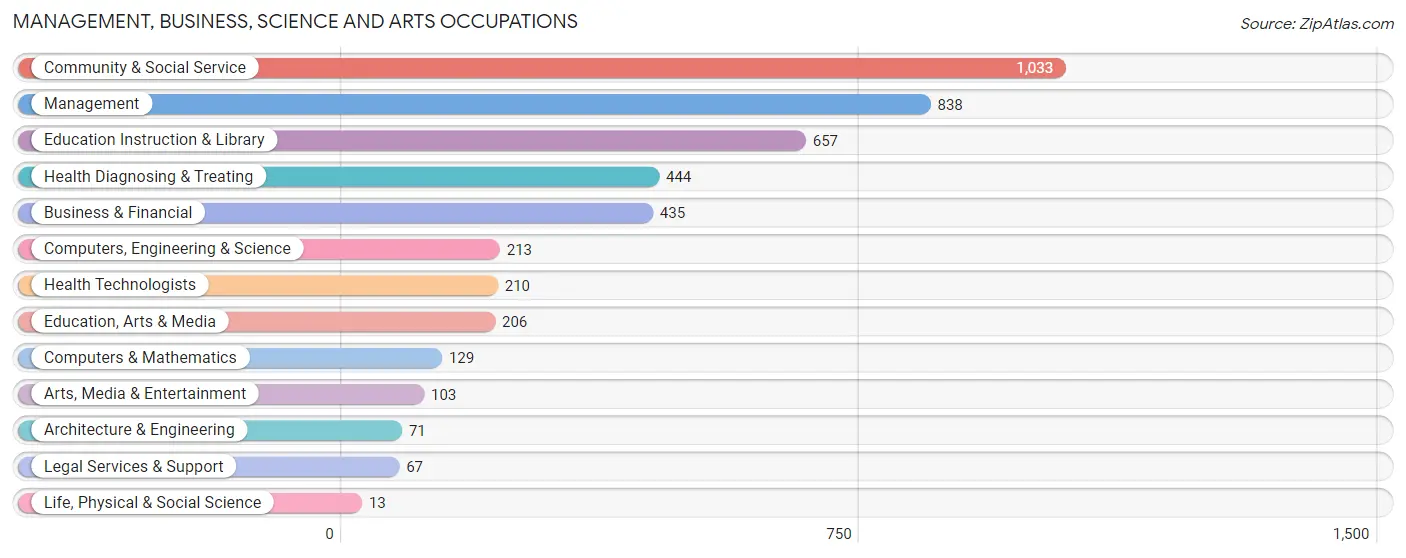
Management, Business, Science and Arts Occupations
The most common Management, Business, Science and Arts occupations in Gem County are Community & Social Service (1,033 | 12.0%), Management (838 | 9.7%), Education Instruction & Library (657 | 7.6%), Health Diagnosing & Treating (444 | 5.2%), and Business & Financial (435 | 5.1%).
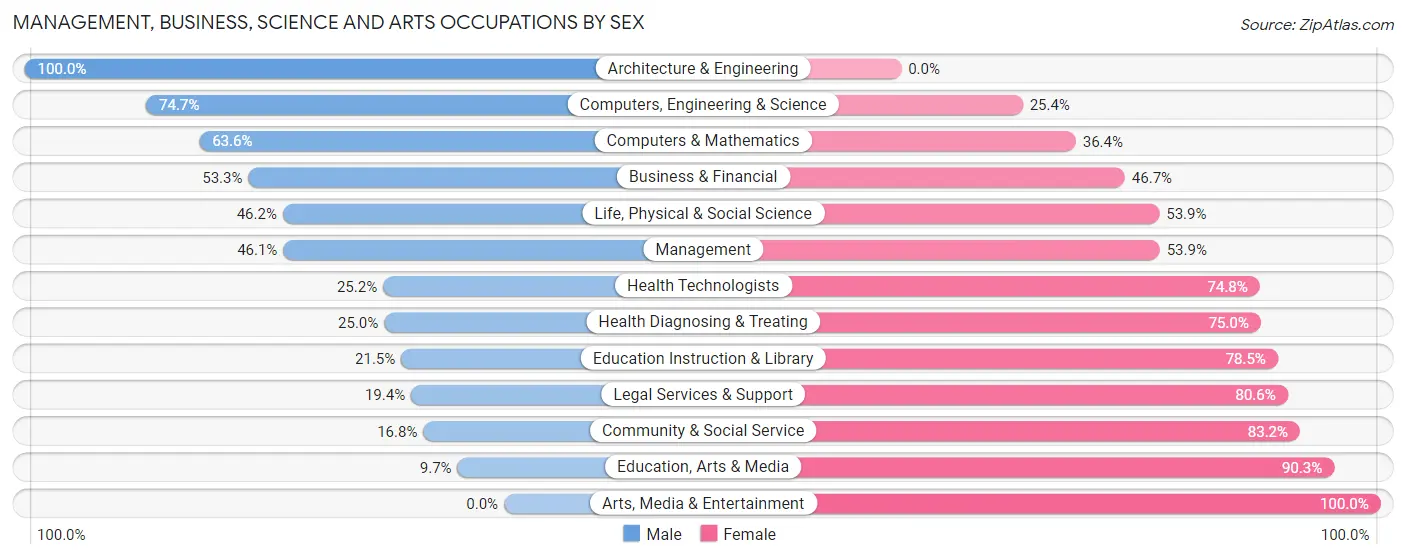
Management, Business, Science and Arts Occupations by Sex
Within the Management, Business, Science and Arts occupations in Gem County, the most male-oriented occupations are Architecture & Engineering (100.0%), Computers, Engineering & Science (74.7%), and Computers & Mathematics (63.6%), while the most female-oriented occupations are Arts, Media & Entertainment (100.0%), Education, Arts & Media (90.3%), and Community & Social Service (83.2%).
| Occupation | Male | Female |
| Management | 386 (46.1%) | 452 (53.9%) |
| Business & Financial | 232 (53.3%) | 203 (46.7%) |
| Computers, Engineering & Science | 159 (74.7%) | 54 (25.4%) |
| Computers & Mathematics | 82 (63.6%) | 47 (36.4%) |
| Architecture & Engineering | 71 (100.0%) | 0 (0.0%) |
| Life, Physical & Social Science | 6 (46.2%) | 7 (53.8%) |
| Community & Social Service | 174 (16.8%) | 859 (83.2%) |
| Education, Arts & Media | 20 (9.7%) | 186 (90.3%) |
| Legal Services & Support | 13 (19.4%) | 54 (80.6%) |
| Education Instruction & Library | 141 (21.5%) | 516 (78.5%) |
| Arts, Media & Entertainment | 0 (0.0%) | 103 (100.0%) |
| Health Diagnosing & Treating | 111 (25.0%) | 333 (75.0%) |
| Health Technologists | 53 (25.2%) | 157 (74.8%) |
| Total (Category) | 1,062 (35.8%) | 1,901 (64.2%) |
| Total (Overall) | 4,541 (52.7%) | 4,067 (47.2%) |
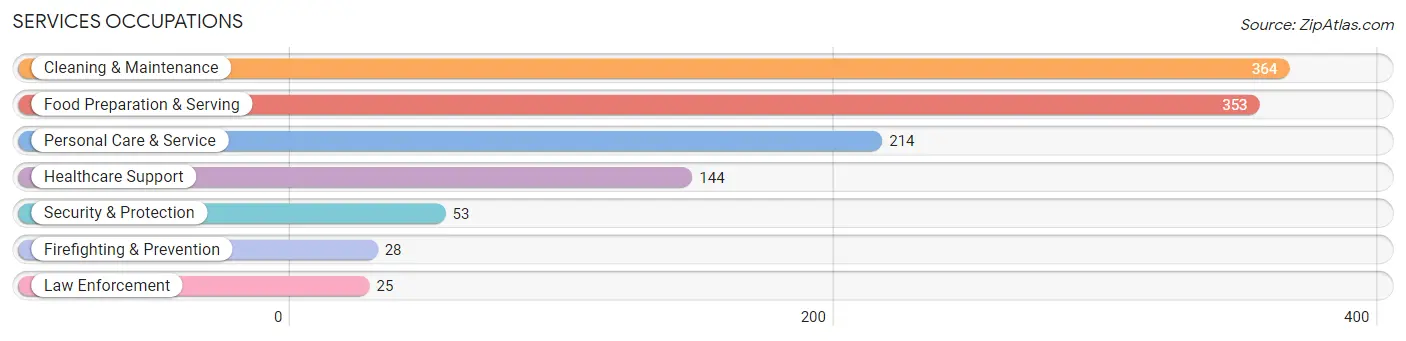
Services Occupations
The most common Services occupations in Gem County are Cleaning & Maintenance (364 | 4.2%), Food Preparation & Serving (353 | 4.1%), Personal Care & Service (214 | 2.5%), Healthcare Support (144 | 1.7%), and Security & Protection (53 | 0.6%).
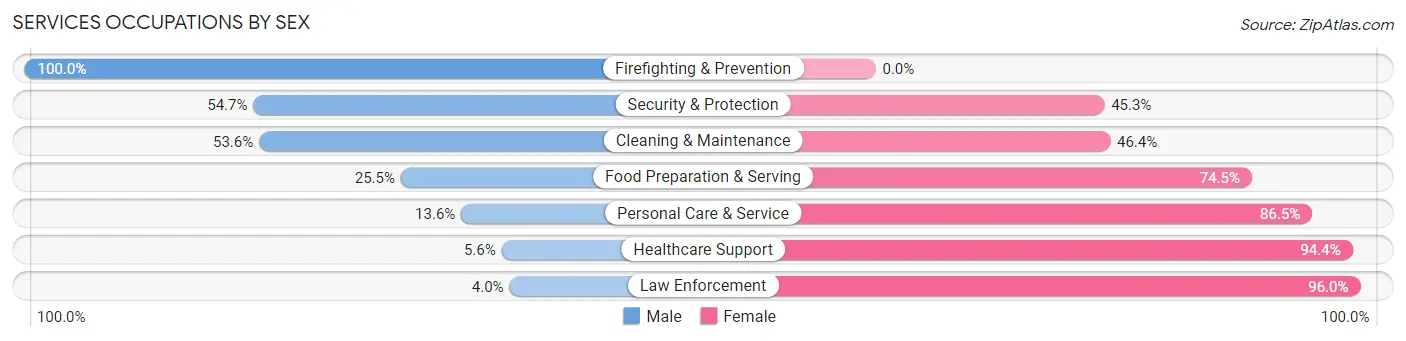
Services Occupations by Sex
Within the Services occupations in Gem County, the most male-oriented occupations are Firefighting & Prevention (100.0%), Security & Protection (54.7%), and Cleaning & Maintenance (53.6%), while the most female-oriented occupations are Law Enforcement (96.0%), Healthcare Support (94.4%), and Personal Care & Service (86.5%).
| Occupation | Male | Female |
| Healthcare Support | 8 (5.6%) | 136 (94.4%) |
| Security & Protection | 29 (54.7%) | 24 (45.3%) |
| Firefighting & Prevention | 28 (100.0%) | 0 (0.0%) |
| Law Enforcement | 1 (4.0%) | 24 (96.0%) |
| Food Preparation & Serving | 90 (25.5%) | 263 (74.5%) |
| Cleaning & Maintenance | 195 (53.6%) | 169 (46.4%) |
| Personal Care & Service | 29 (13.6%) | 185 (86.5%) |
| Total (Category) | 351 (31.1%) | 777 (68.9%) |
| Total (Overall) | 4,541 (52.7%) | 4,067 (47.2%) |
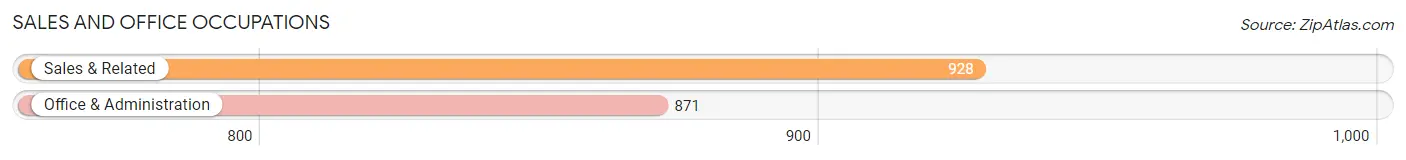
Sales and Office Occupations
The most common Sales and Office occupations in Gem County are Sales & Related (928 | 10.8%), and Office & Administration (871 | 10.1%).
Sales and Office Occupations by Sex
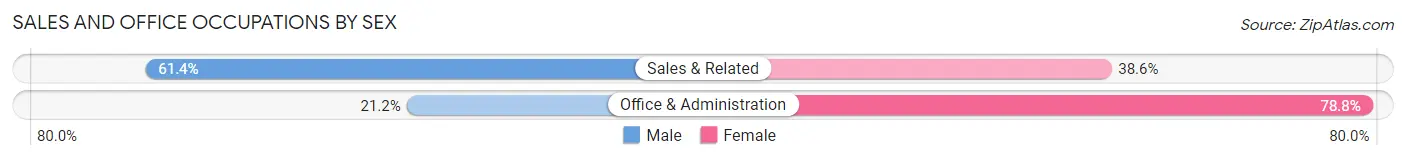
| Occupation | Male | Female |
| Sales & Related | 570 (61.4%) | 358 (38.6%) |
| Office & Administration | 185 (21.2%) | 686 (78.8%) |
| Total (Category) | 755 (42.0%) | 1,044 (58.0%) |
| Total (Overall) | 4,541 (52.7%) | 4,067 (47.2%) |
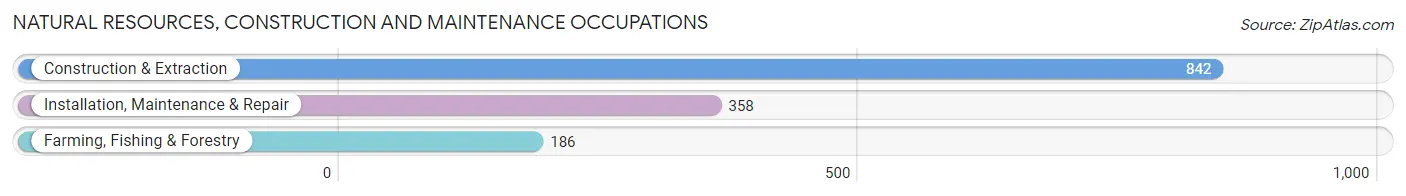
Natural Resources, Construction and Maintenance Occupations
The most common Natural Resources, Construction and Maintenance occupations in Gem County are Construction & Extraction (842 | 9.8%), Installation, Maintenance & Repair (358 | 4.2%), and Farming, Fishing & Forestry (186 | 2.2%).
Natural Resources, Construction and Maintenance Occupations by Sex
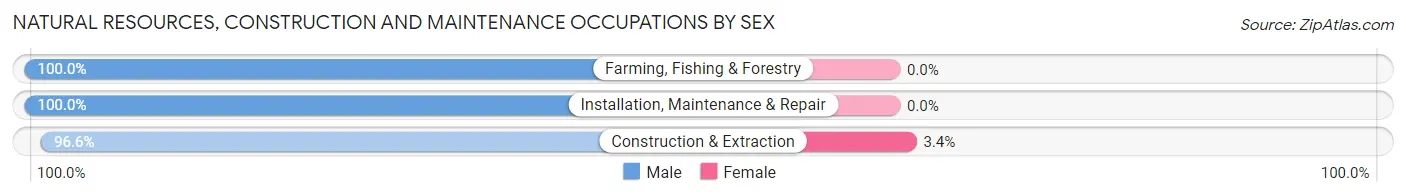
| Occupation | Male | Female |
| Farming, Fishing & Forestry | 186 (100.0%) | 0 (0.0%) |
| Construction & Extraction | 813 (96.6%) | 29 (3.4%) |
| Installation, Maintenance & Repair | 358 (100.0%) | 0 (0.0%) |
| Total (Category) | 1,357 (97.9%) | 29 (2.1%) |
| Total (Overall) | 4,541 (52.7%) | 4,067 (47.2%) |
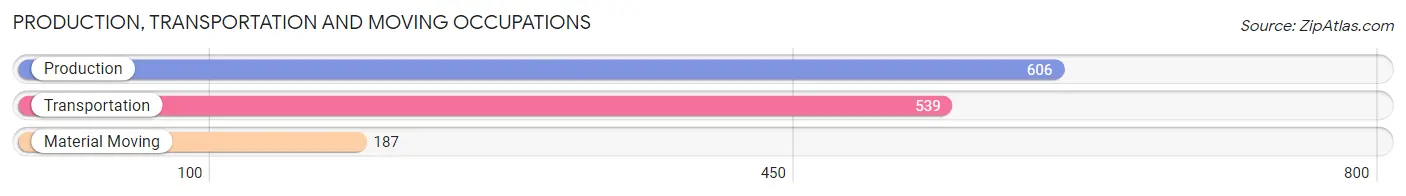
Production, Transportation and Moving Occupations
The most common Production, Transportation and Moving occupations in Gem County are Production (606 | 7.0%), Transportation (539 | 6.3%), and Material Moving (187 | 2.2%).
Production, Transportation and Moving Occupations by Sex
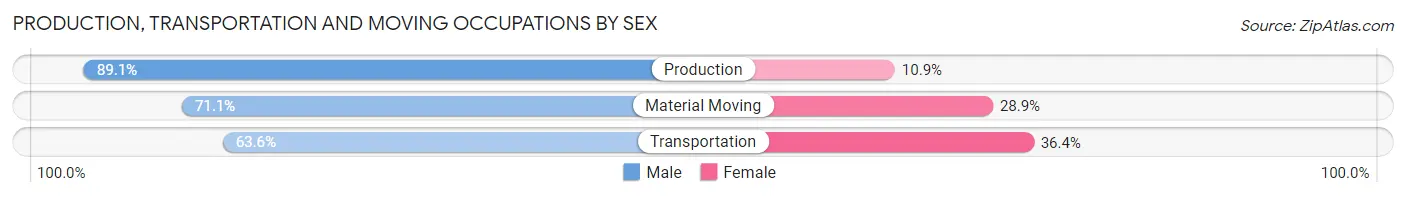
| Occupation | Male | Female |
| Production | 540 (89.1%) | 66 (10.9%) |
| Transportation | 343 (63.6%) | 196 (36.4%) |
| Material Moving | 133 (71.1%) | 54 (28.9%) |
| Total (Category) | 1,016 (76.3%) | 316 (23.7%) |
| Total (Overall) | 4,541 (52.7%) | 4,067 (47.2%) |
Employment Industries by Sex in Gem County
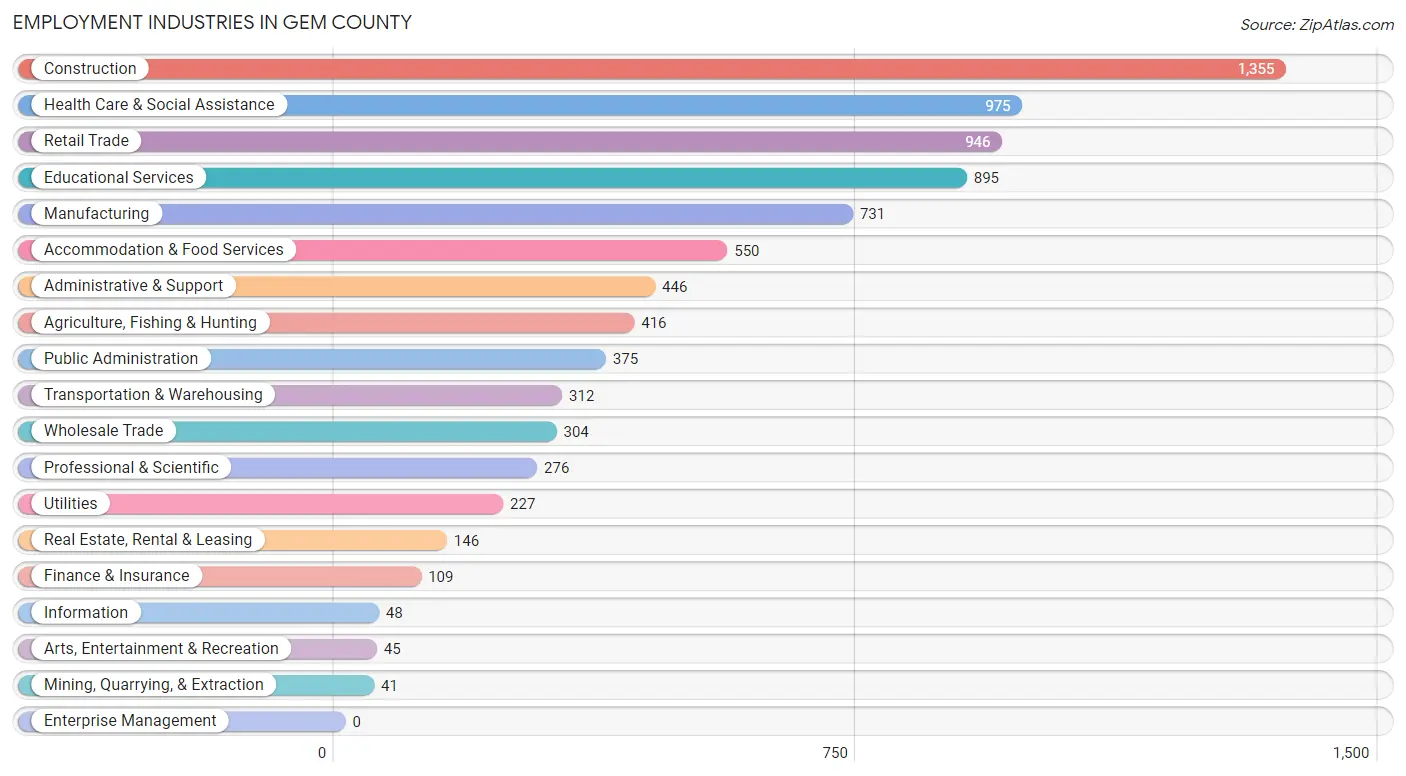
Employment Industries in Gem County
The major employment industries in Gem County include Construction (1,355 | 15.7%), Health Care & Social Assistance (975 | 11.3%), Retail Trade (946 | 11.0%), Educational Services (895 | 10.4%), and Manufacturing (731 | 8.5%).
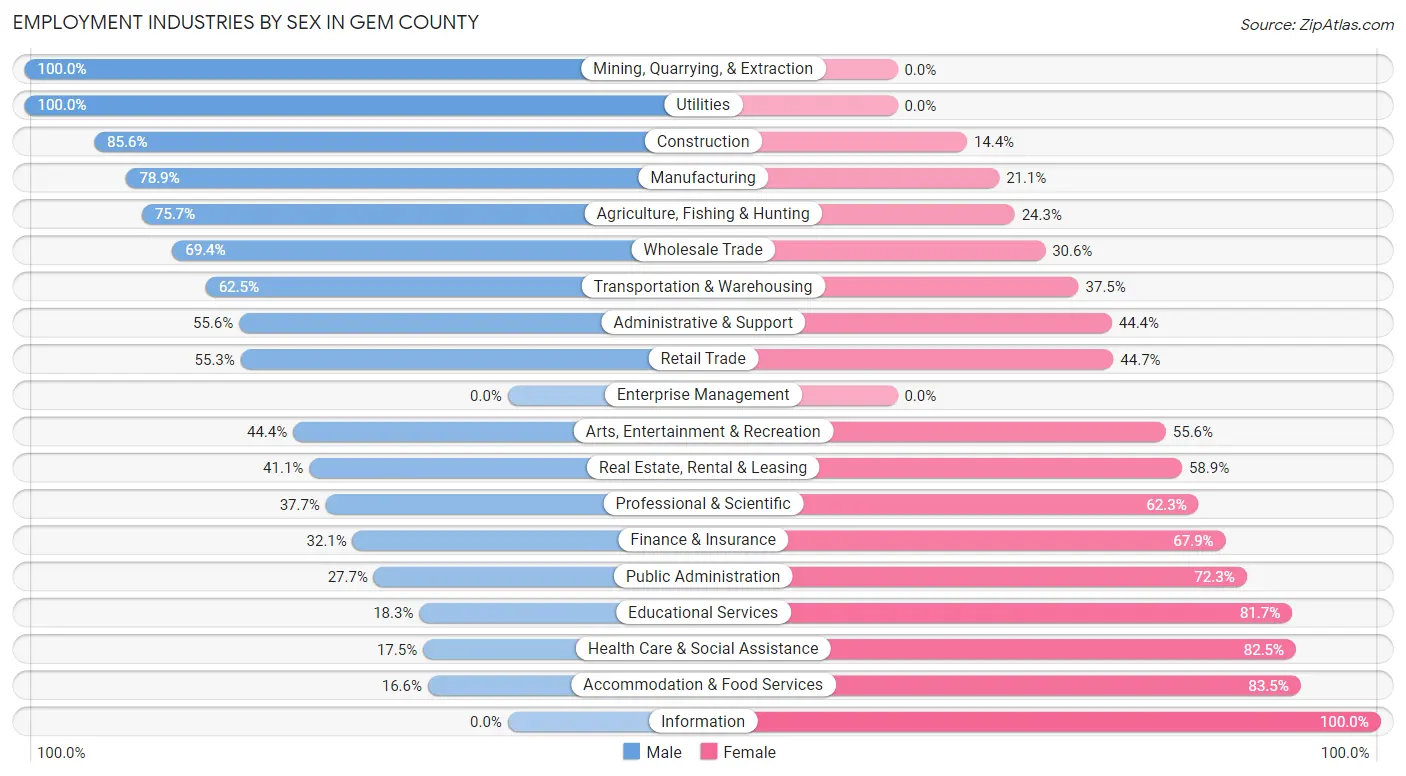
Employment Industries by Sex in Gem County
The Gem County industries that see more men than women are Mining, Quarrying, & Extraction (100.0%), Utilities (100.0%), and Construction (85.6%), whereas the industries that tend to have a higher number of women are Information (100.0%), Accommodation & Food Services (83.5%), and Health Care & Social Assistance (82.5%).
| Industry | Male | Female |
| Agriculture, Fishing & Hunting | 315 (75.7%) | 101 (24.3%) |
| Mining, Quarrying, & Extraction | 41 (100.0%) | 0 (0.0%) |
| Construction | 1,160 (85.6%) | 195 (14.4%) |
| Manufacturing | 577 (78.9%) | 154 (21.1%) |
| Wholesale Trade | 211 (69.4%) | 93 (30.6%) |
| Retail Trade | 523 (55.3%) | 423 (44.7%) |
| Transportation & Warehousing | 195 (62.5%) | 117 (37.5%) |
| Utilities | 227 (100.0%) | 0 (0.0%) |
| Information | 0 (0.0%) | 48 (100.0%) |
| Finance & Insurance | 35 (32.1%) | 74 (67.9%) |
| Real Estate, Rental & Leasing | 60 (41.1%) | 86 (58.9%) |
| Professional & Scientific | 104 (37.7%) | 172 (62.3%) |
| Enterprise Management | 0 (0.0%) | 0 (0.0%) |
| Administrative & Support | 248 (55.6%) | 198 (44.4%) |
| Educational Services | 164 (18.3%) | 731 (81.7%) |
| Health Care & Social Assistance | 171 (17.5%) | 804 (82.5%) |
| Arts, Entertainment & Recreation | 20 (44.4%) | 25 (55.6%) |
| Accommodation & Food Services | 91 (16.6%) | 459 (83.5%) |
| Public Administration | 104 (27.7%) | 271 (72.3%) |
| Total | 4,541 (52.7%) | 4,067 (47.2%) |
Education in Gem County
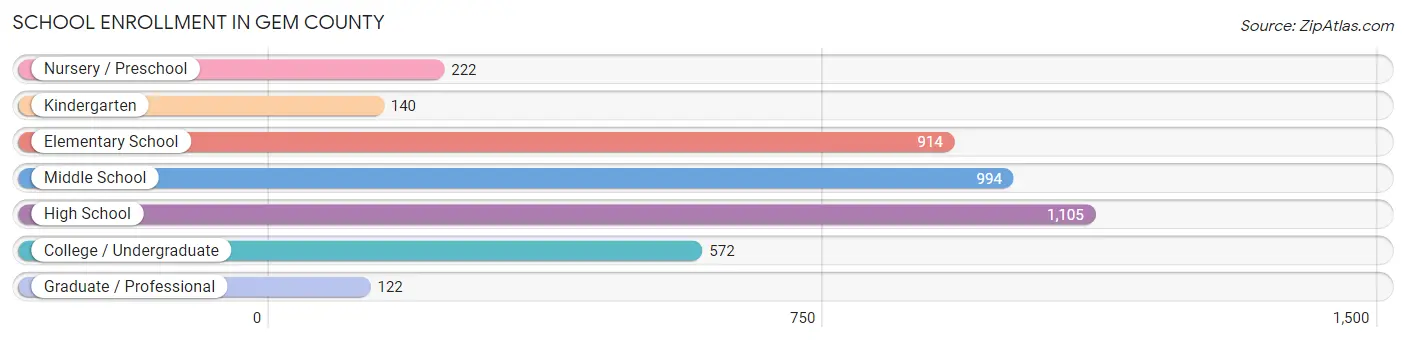
School Enrollment in Gem County
The most common levels of schooling among the 4,069 students in Gem County are high school (1,105 | 27.2%), middle school (994 | 24.4%), and elementary school (914 | 22.5%).
| School Level | # Students | % Students |
| Nursery / Preschool | 222 | 5.5% |
| Kindergarten | 140 | 3.4% |
| Elementary School | 914 | 22.5% |
| Middle School | 994 | 24.4% |
| High School | 1,105 | 27.2% |
| College / Undergraduate | 572 | 14.1% |
| Graduate / Professional | 122 | 3.0% |
| Total | 4,069 | 100.0% |
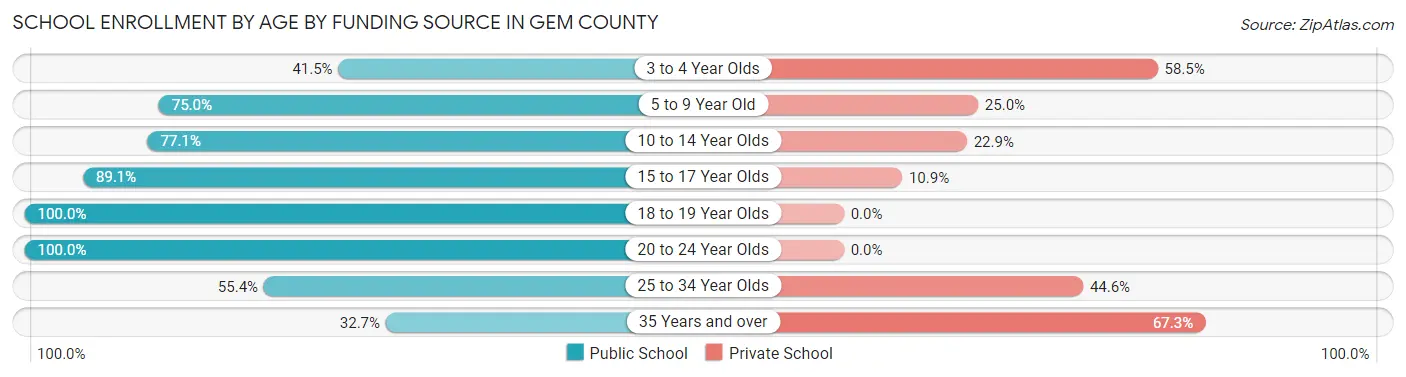
School Enrollment by Age by Funding Source in Gem County
Out of a total of 4,069 students who are enrolled in schools in Gem County, 944 (23.2%) attend a private institution, while the remaining 3,125 (76.8%) are enrolled in public schools. The age group of 35 years and over has the highest likelihood of being enrolled in private schools, with 144 (67.3% in the age bracket) enrolled. Conversely, the age group of 18 to 19 year olds has the lowest likelihood of being enrolled in a private school, with 159 (100.0% in the age bracket) attending a public institution.
| Age Bracket | Public School | Private School |
| 3 to 4 Year Olds | 54 (41.5%) | 76 (58.5%) |
| 5 to 9 Year Old | 762 (75.0%) | 254 (25.0%) |
| 10 to 14 Year Olds | 1,036 (77.1%) | 308 (22.9%) |
| 15 to 17 Year Olds | 673 (89.1%) | 82 (10.9%) |
| 18 to 19 Year Olds | 159 (100.0%) | 0 (0.0%) |
| 20 to 24 Year Olds | 276 (100.0%) | 0 (0.0%) |
| 25 to 34 Year Olds | 97 (55.4%) | 78 (44.6%) |
| 35 Years and over | 70 (32.7%) | 144 (67.3%) |
| Total | 3,125 (76.8%) | 944 (23.2%) |
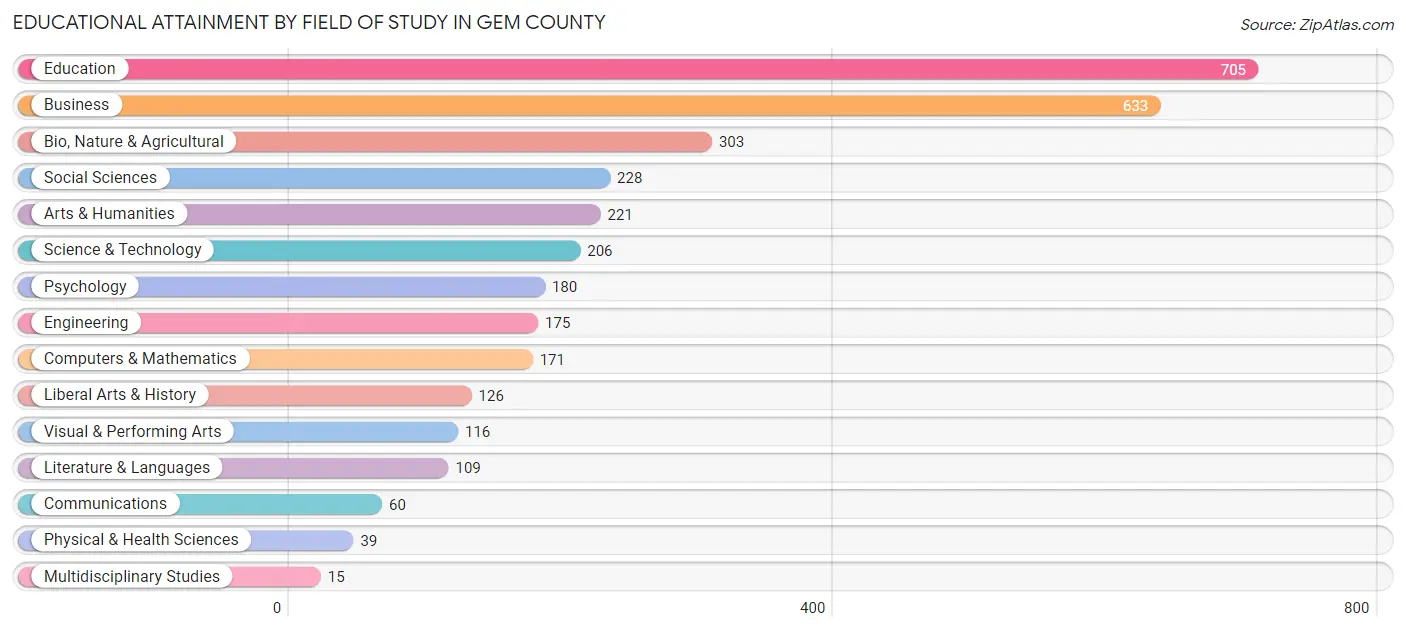
Educational Attainment by Field of Study in Gem County
Education (705 | 21.4%), business (633 | 19.3%), bio, nature & agricultural (303 | 9.2%), social sciences (228 | 6.9%), and arts & humanities (221 | 6.7%) are the most common fields of study among 3,287 individuals in Gem County who have obtained a bachelor's degree or higher.
| Field of Study | # Graduates | % Graduates |
| Computers & Mathematics | 171 | 5.2% |
| Bio, Nature & Agricultural | 303 | 9.2% |
| Physical & Health Sciences | 39 | 1.2% |
| Psychology | 180 | 5.5% |
| Social Sciences | 228 | 6.9% |
| Engineering | 175 | 5.3% |
| Multidisciplinary Studies | 15 | 0.5% |
| Science & Technology | 206 | 6.3% |
| Business | 633 | 19.3% |
| Education | 705 | 21.4% |
| Literature & Languages | 109 | 3.3% |
| Liberal Arts & History | 126 | 3.8% |
| Visual & Performing Arts | 116 | 3.5% |
| Communications | 60 | 1.8% |
| Arts & Humanities | 221 | 6.7% |
| Total | 3,287 | 100.0% |
Transportation & Commute in Gem County
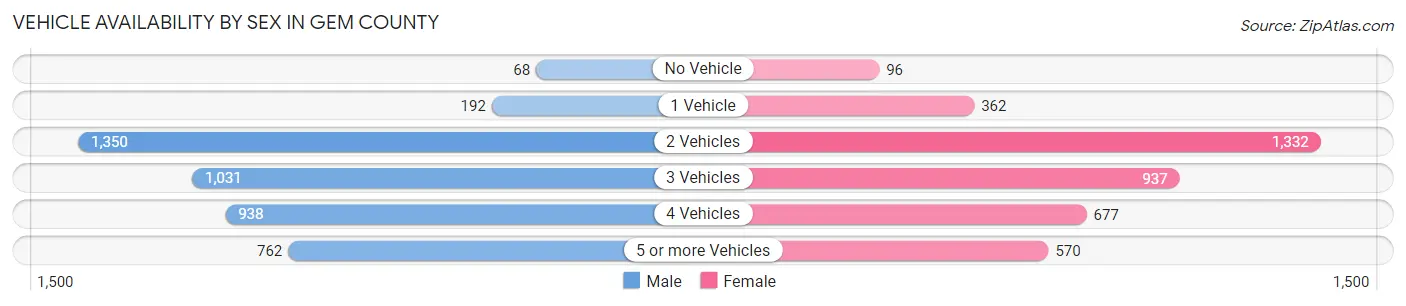
Vehicle Availability by Sex in Gem County
The most prevalent vehicle ownership categories in Gem County are males with 2 vehicles (1,350, accounting for 31.1%) and females with 2 vehicles (1,332, making up 34.0%).
| Vehicles Available | Male | Female |
| No Vehicle | 68 (1.6%) | 96 (2.4%) |
| 1 Vehicle | 192 (4.4%) | 362 (9.1%) |
| 2 Vehicles | 1,350 (31.1%) | 1,332 (33.5%) |
| 3 Vehicles | 1,031 (23.7%) | 937 (23.6%) |
| 4 Vehicles | 938 (21.6%) | 677 (17.0%) |
| 5 or more Vehicles | 762 (17.5%) | 570 (14.3%) |
| Total | 4,341 (100.0%) | 3,974 (100.0%) |
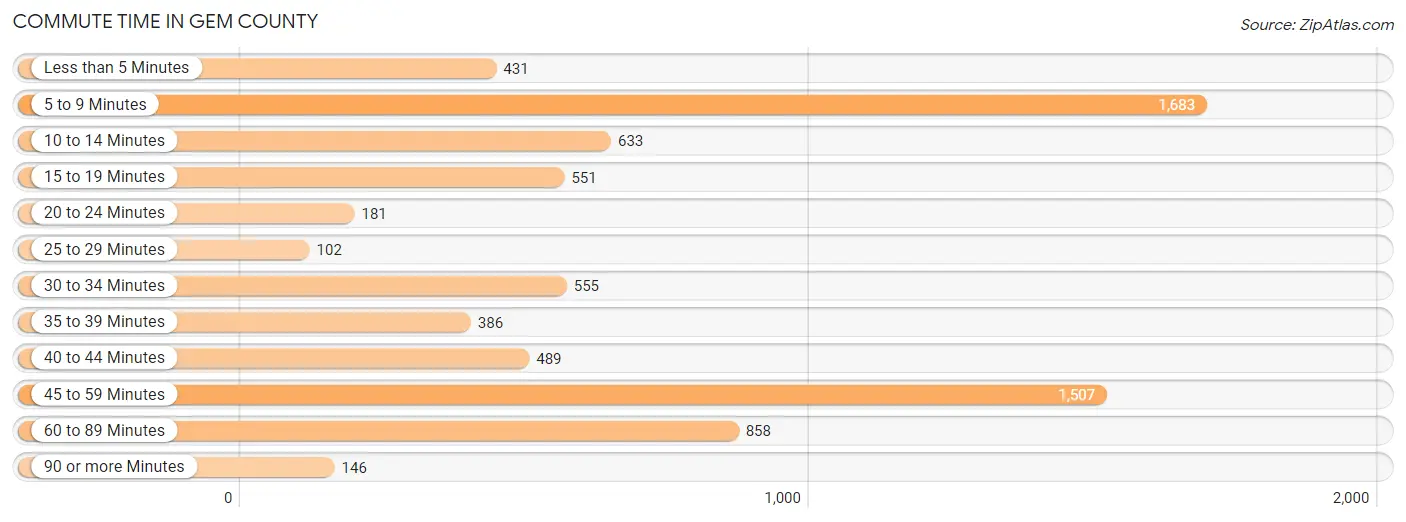
Commute Time in Gem County
The most frequently occuring commute durations in Gem County are 5 to 9 minutes (1,683 commuters, 22.4%), 45 to 59 minutes (1,507 commuters, 20.0%), and 60 to 89 minutes (858 commuters, 11.4%).
| Commute Time | # Commuters | % Commuters |
| Less than 5 Minutes | 431 | 5.7% |
| 5 to 9 Minutes | 1,683 | 22.4% |
| 10 to 14 Minutes | 633 | 8.4% |
| 15 to 19 Minutes | 551 | 7.3% |
| 20 to 24 Minutes | 181 | 2.4% |
| 25 to 29 Minutes | 102 | 1.4% |
| 30 to 34 Minutes | 555 | 7.4% |
| 35 to 39 Minutes | 386 | 5.1% |
| 40 to 44 Minutes | 489 | 6.5% |
| 45 to 59 Minutes | 1,507 | 20.0% |
| 60 to 89 Minutes | 858 | 11.4% |
| 90 or more Minutes | 146 | 1.9% |
Commute Time by Sex in Gem County
The most common commute times in Gem County are 45 to 59 minutes (846 commuters, 22.0%) for males and 5 to 9 minutes (1,014 commuters, 27.6%) for females.
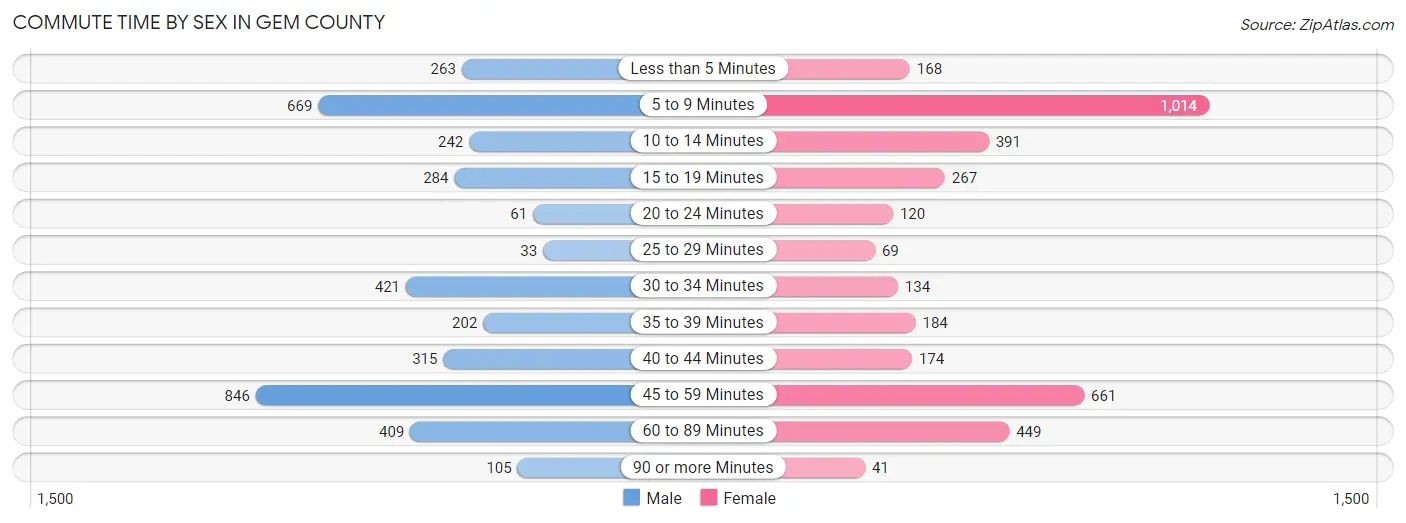
| Commute Time | Male | Female |
| Less than 5 Minutes | 263 (6.8%) | 168 (4.6%) |
| 5 to 9 Minutes | 669 (17.4%) | 1,014 (27.6%) |
| 10 to 14 Minutes | 242 (6.3%) | 391 (10.6%) |
| 15 to 19 Minutes | 284 (7.4%) | 267 (7.3%) |
| 20 to 24 Minutes | 61 (1.6%) | 120 (3.3%) |
| 25 to 29 Minutes | 33 (0.9%) | 69 (1.9%) |
| 30 to 34 Minutes | 421 (10.9%) | 134 (3.6%) |
| 35 to 39 Minutes | 202 (5.2%) | 184 (5.0%) |
| 40 to 44 Minutes | 315 (8.2%) | 174 (4.7%) |
| 45 to 59 Minutes | 846 (22.0%) | 661 (18.0%) |
| 60 to 89 Minutes | 409 (10.6%) | 449 (12.2%) |
| 90 or more Minutes | 105 (2.7%) | 41 (1.1%) |
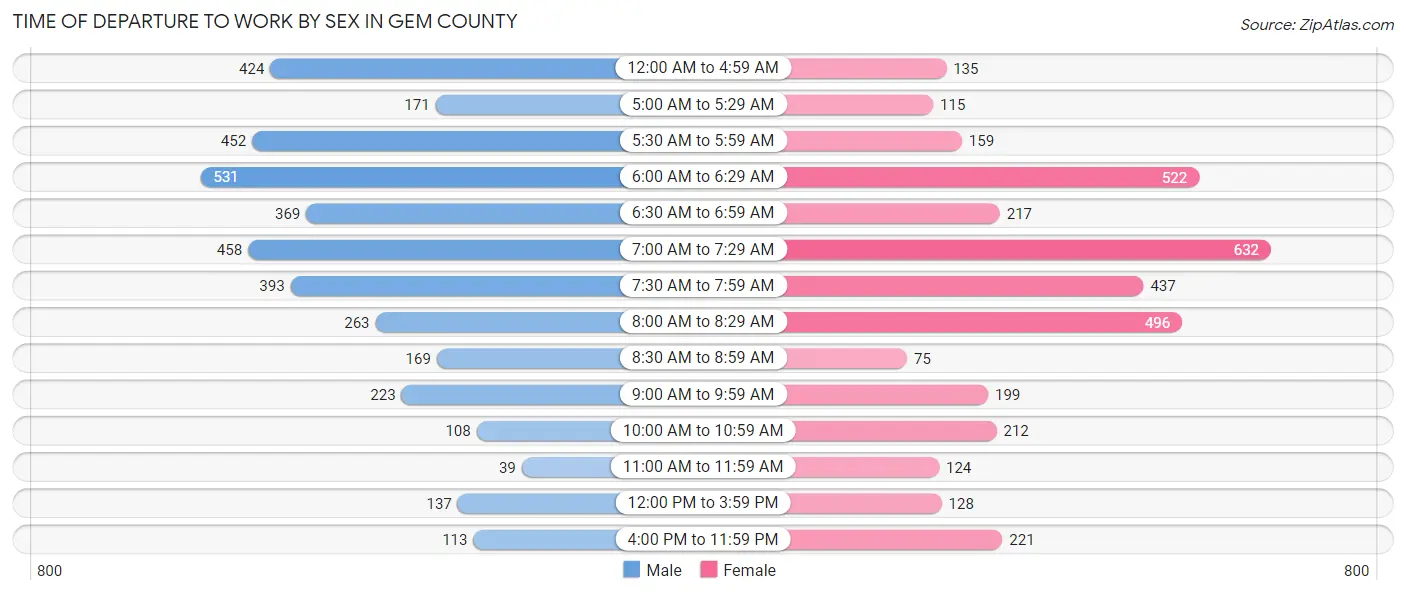
Time of Departure to Work by Sex in Gem County
The most frequent times of departure to work in Gem County are 6:00 AM to 6:29 AM (531, 13.8%) for males and 7:00 AM to 7:29 AM (632, 17.2%) for females.
| Time of Departure | Male | Female |
| 12:00 AM to 4:59 AM | 424 (11.0%) | 135 (3.7%) |
| 5:00 AM to 5:29 AM | 171 (4.4%) | 115 (3.1%) |
| 5:30 AM to 5:59 AM | 452 (11.7%) | 159 (4.3%) |
| 6:00 AM to 6:29 AM | 531 (13.8%) | 522 (14.2%) |
| 6:30 AM to 6:59 AM | 369 (9.6%) | 217 (5.9%) |
| 7:00 AM to 7:29 AM | 458 (11.9%) | 632 (17.2%) |
| 7:30 AM to 7:59 AM | 393 (10.2%) | 437 (11.9%) |
| 8:00 AM to 8:29 AM | 263 (6.8%) | 496 (13.5%) |
| 8:30 AM to 8:59 AM | 169 (4.4%) | 75 (2.0%) |
| 9:00 AM to 9:59 AM | 223 (5.8%) | 199 (5.4%) |
| 10:00 AM to 10:59 AM | 108 (2.8%) | 212 (5.8%) |
| 11:00 AM to 11:59 AM | 39 (1.0%) | 124 (3.4%) |
| 12:00 PM to 3:59 PM | 137 (3.6%) | 128 (3.5%) |
| 4:00 PM to 11:59 PM | 113 (2.9%) | 221 (6.0%) |
| Total | 3,850 (100.0%) | 3,672 (100.0%) |
Housing Occupancy in Gem County
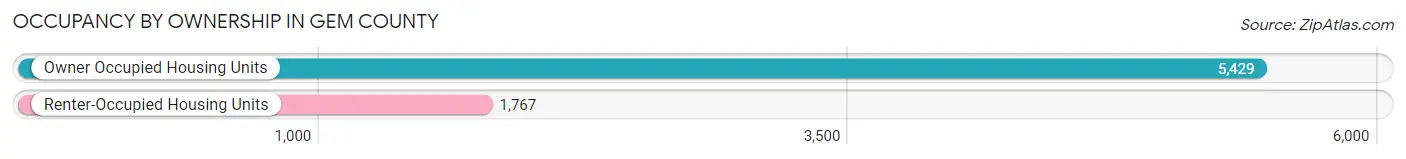
Occupancy by Ownership in Gem County
Of the total 7,196 dwellings in Gem County, owner-occupied units account for 5,429 (75.4%), while renter-occupied units make up 1,767 (24.6%).
| Occupancy | # Housing Units | % Housing Units |
| Owner Occupied Housing Units | 5,429 | 75.4% |
| Renter-Occupied Housing Units | 1,767 | 24.6% |
| Total Occupied Housing Units | 7,196 | 100.0% |
Occupancy by Household Size in Gem County
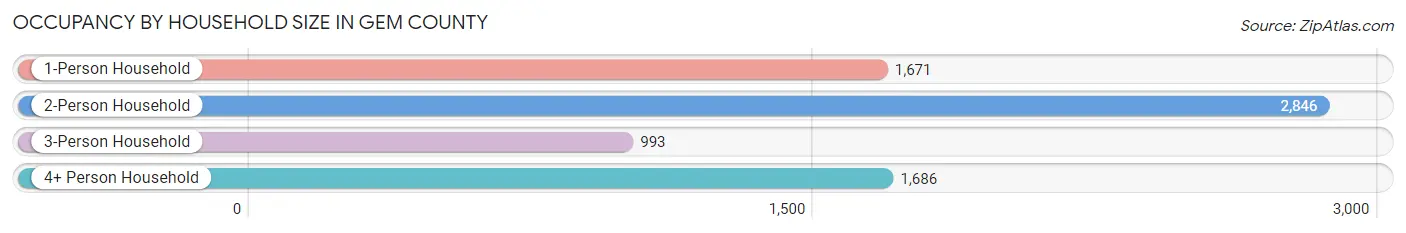
| Household Size | # Housing Units | % Housing Units |
| 1-Person Household | 1,671 | 23.2% |
| 2-Person Household | 2,846 | 39.6% |
| 3-Person Household | 993 | 13.8% |
| 4+ Person Household | 1,686 | 23.4% |
| Total Housing Units | 7,196 | 100.0% |
Occupancy by Ownership by Household Size in Gem County
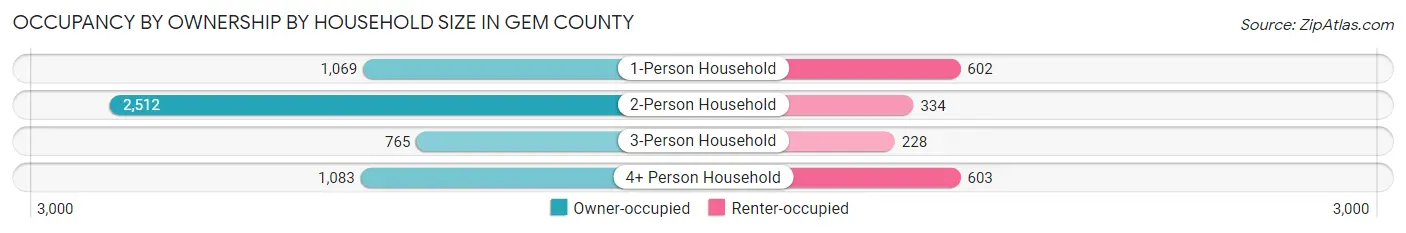
| Household Size | Owner-occupied | Renter-occupied |
| 1-Person Household | 1,069 (64.0%) | 602 (36.0%) |
| 2-Person Household | 2,512 (88.3%) | 334 (11.7%) |
| 3-Person Household | 765 (77.0%) | 228 (23.0%) |
| 4+ Person Household | 1,083 (64.2%) | 603 (35.8%) |
| Total Housing Units | 5,429 (75.4%) | 1,767 (24.6%) |
Occupancy by Educational Attainment in Gem County
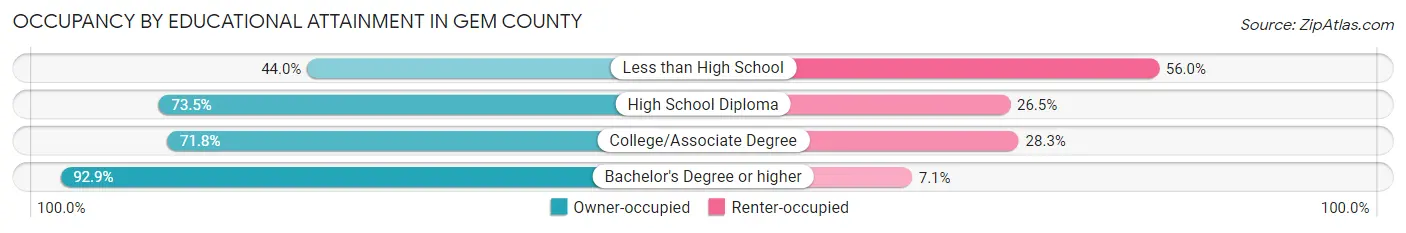
| Household Size | Owner-occupied | Renter-occupied |
| Less than High School | 237 (44.0%) | 302 (56.0%) |
| High School Diploma | 1,481 (73.5%) | 535 (26.5%) |
| College/Associate Degree | 2,039 (71.8%) | 803 (28.2%) |
| Bachelor's Degree or higher | 1,672 (92.9%) | 127 (7.1%) |
Occupancy by Age of Householder in Gem County
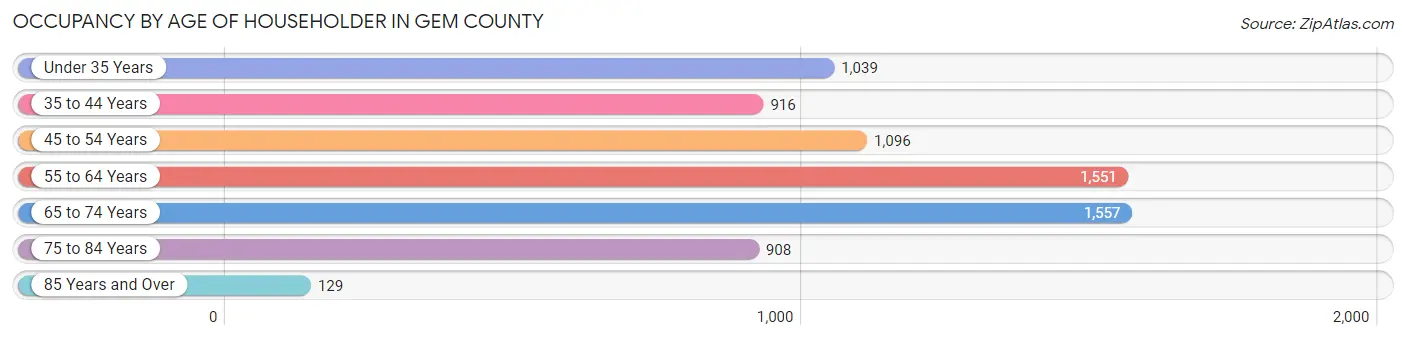
| Age Bracket | # Households | % Households |
| Under 35 Years | 1,039 | 14.4% |
| 35 to 44 Years | 916 | 12.7% |
| 45 to 54 Years | 1,096 | 15.2% |
| 55 to 64 Years | 1,551 | 21.5% |
| 65 to 74 Years | 1,557 | 21.6% |
| 75 to 84 Years | 908 | 12.6% |
| 85 Years and Over | 129 | 1.8% |
| Total | 7,196 | 100.0% |
Housing Finances in Gem County
Median Income by Occupancy in Gem County
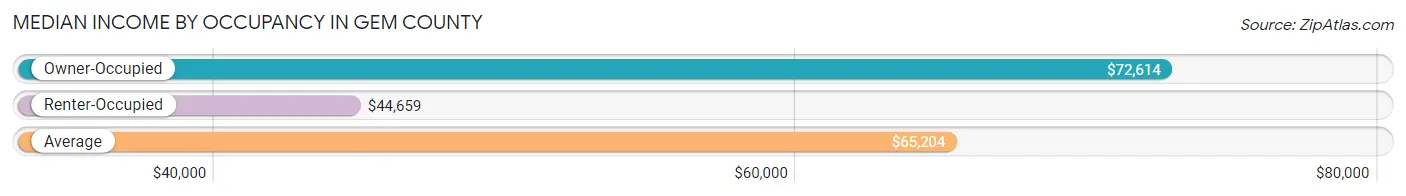
| Occupancy Type | # Households | Median Income |
| Owner-Occupied | 5,429 (75.4%) | $72,614 |
| Renter-Occupied | 1,767 (24.6%) | $44,659 |
| Average | 7,196 (100.0%) | $65,204 |
Occupancy by Householder Income Bracket in Gem County
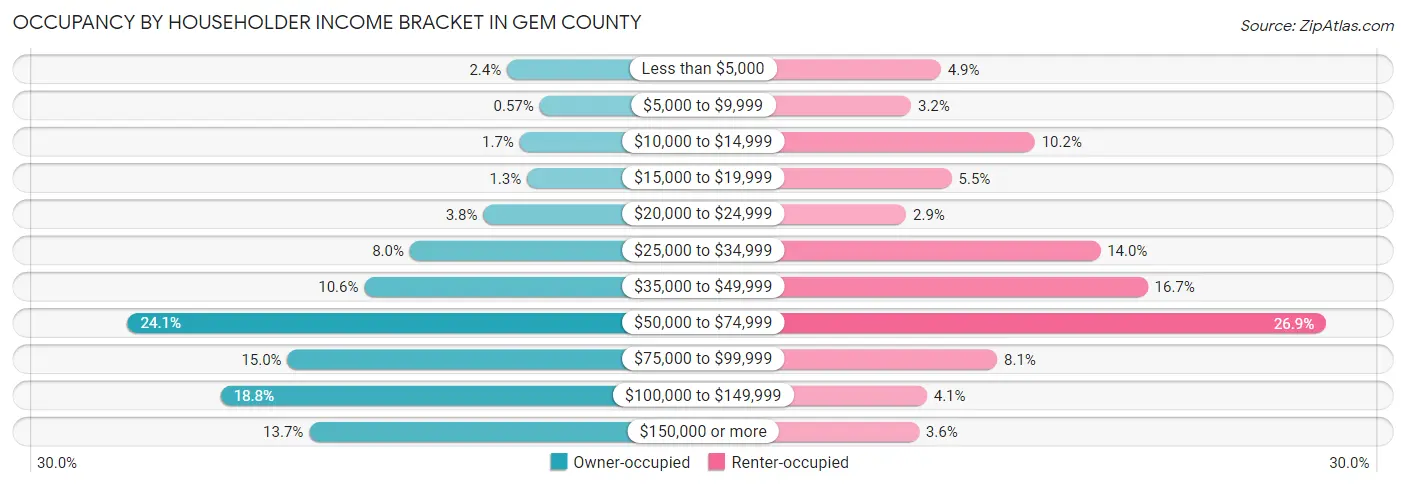
| Income Bracket | Owner-occupied | Renter-occupied |
| Less than $5,000 | 132 (2.4%) | 86 (4.9%) |
| $5,000 to $9,999 | 31 (0.6%) | 56 (3.2%) |
| $10,000 to $14,999 | 93 (1.7%) | 181 (10.2%) |
| $15,000 to $19,999 | 70 (1.3%) | 97 (5.5%) |
| $20,000 to $24,999 | 206 (3.8%) | 51 (2.9%) |
| $25,000 to $34,999 | 434 (8.0%) | 247 (14.0%) |
| $35,000 to $49,999 | 575 (10.6%) | 295 (16.7%) |
| $50,000 to $74,999 | 1,309 (24.1%) | 475 (26.9%) |
| $75,000 to $99,999 | 813 (15.0%) | 143 (8.1%) |
| $100,000 to $149,999 | 1,020 (18.8%) | 72 (4.1%) |
| $150,000 or more | 746 (13.7%) | 64 (3.6%) |
| Total | 5,429 (100.0%) | 1,767 (100.0%) |
Monthly Housing Cost Tiers in Gem County
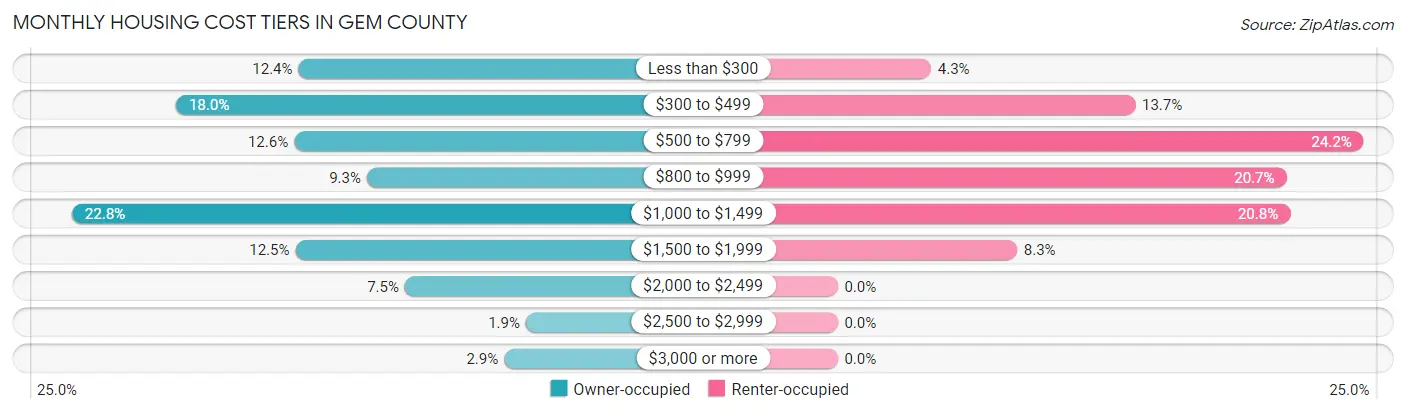
| Monthly Cost | Owner-occupied | Renter-occupied |
| Less than $300 | 673 (12.4%) | 76 (4.3%) |
| $300 to $499 | 979 (18.0%) | 242 (13.7%) |
| $500 to $799 | 684 (12.6%) | 428 (24.2%) |
| $800 to $999 | 502 (9.2%) | 365 (20.7%) |
| $1,000 to $1,499 | 1,239 (22.8%) | 368 (20.8%) |
| $1,500 to $1,999 | 681 (12.5%) | 146 (8.3%) |
| $2,000 to $2,499 | 407 (7.5%) | 0 (0.0%) |
| $2,500 to $2,999 | 105 (1.9%) | 0 (0.0%) |
| $3,000 or more | 159 (2.9%) | 0 (0.0%) |
| Total | 5,429 (100.0%) | 1,767 (100.0%) |
Physical Housing Characteristics in Gem County
Housing Structures in Gem County
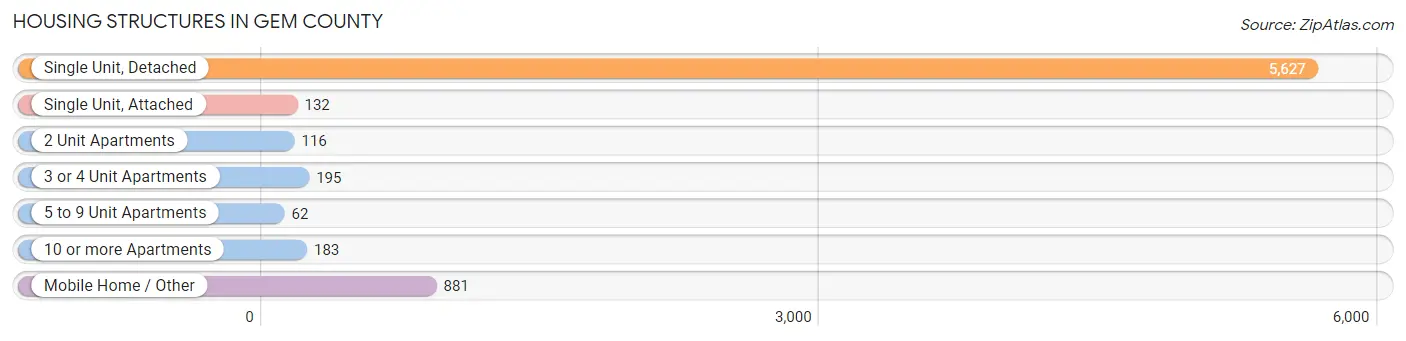
| Structure Type | # Housing Units | % Housing Units |
| Single Unit, Detached | 5,627 | 78.2% |
| Single Unit, Attached | 132 | 1.8% |
| 2 Unit Apartments | 116 | 1.6% |
| 3 or 4 Unit Apartments | 195 | 2.7% |
| 5 to 9 Unit Apartments | 62 | 0.9% |
| 10 or more Apartments | 183 | 2.5% |
| Mobile Home / Other | 881 | 12.2% |
| Total | 7,196 | 100.0% |
Housing Structures by Occupancy in Gem County
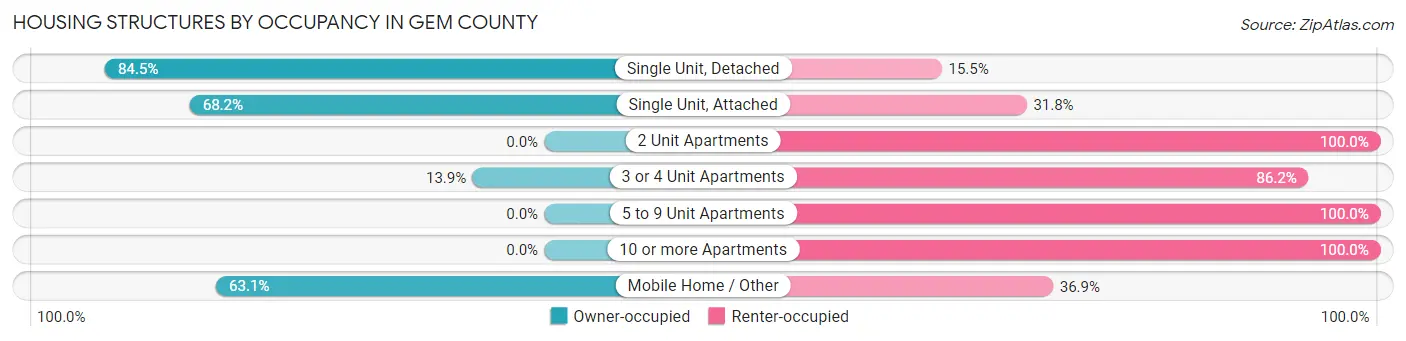
| Structure Type | Owner-occupied | Renter-occupied |
| Single Unit, Detached | 4,756 (84.5%) | 871 (15.5%) |
| Single Unit, Attached | 90 (68.2%) | 42 (31.8%) |
| 2 Unit Apartments | 0 (0.0%) | 116 (100.0%) |
| 3 or 4 Unit Apartments | 27 (13.9%) | 168 (86.2%) |
| 5 to 9 Unit Apartments | 0 (0.0%) | 62 (100.0%) |
| 10 or more Apartments | 0 (0.0%) | 183 (100.0%) |
| Mobile Home / Other | 556 (63.1%) | 325 (36.9%) |
| Total | 5,429 (75.4%) | 1,767 (24.6%) |
Housing Structures by Number of Rooms in Gem County
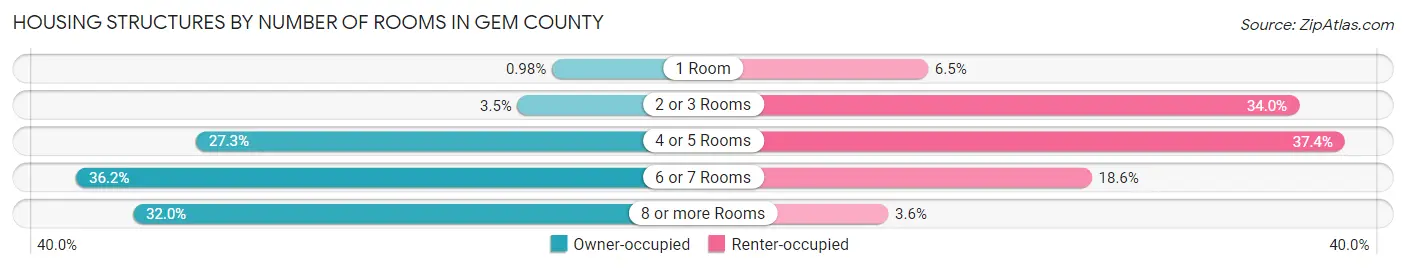
| Number of Rooms | Owner-occupied | Renter-occupied |
| 1 Room | 53 (1.0%) | 115 (6.5%) |
| 2 or 3 Rooms | 191 (3.5%) | 600 (34.0%) |
| 4 or 5 Rooms | 1,484 (27.3%) | 660 (37.3%) |
| 6 or 7 Rooms | 1,965 (36.2%) | 329 (18.6%) |
| 8 or more Rooms | 1,736 (32.0%) | 63 (3.6%) |
| Total | 5,429 (100.0%) | 1,767 (100.0%) |
Housing Structure by Heating Type in Gem County
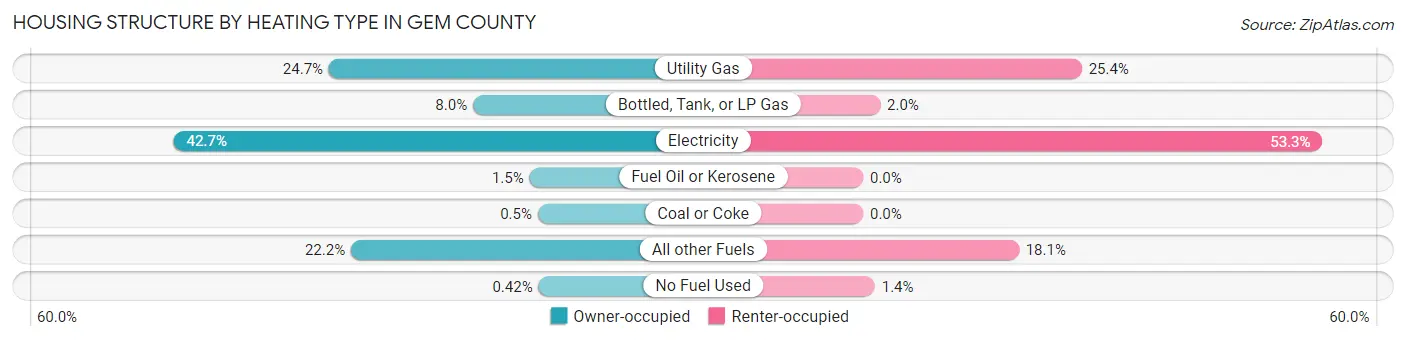
| Heating Type | Owner-occupied | Renter-occupied |
| Utility Gas | 1,342 (24.7%) | 448 (25.4%) |
| Bottled, Tank, or LP Gas | 435 (8.0%) | 35 (2.0%) |
| Electricity | 2,320 (42.7%) | 941 (53.2%) |
| Fuel Oil or Kerosene | 79 (1.5%) | 0 (0.0%) |
| Coal or Coke | 27 (0.5%) | 0 (0.0%) |
| All other Fuels | 1,203 (22.2%) | 319 (18.0%) |
| No Fuel Used | 23 (0.4%) | 24 (1.4%) |
| Total | 5,429 (100.0%) | 1,767 (100.0%) |
Household Vehicle Usage in Gem County
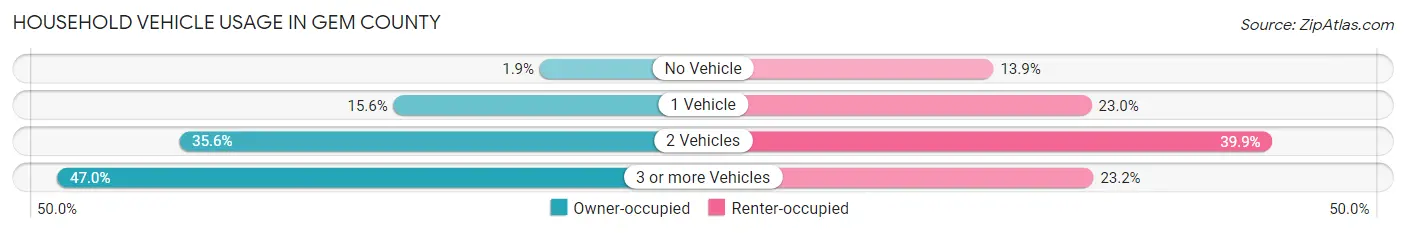
| Vehicles per Household | Owner-occupied | Renter-occupied |
| No Vehicle | 103 (1.9%) | 245 (13.9%) |
| 1 Vehicle | 845 (15.6%) | 407 (23.0%) |
| 2 Vehicles | 1,931 (35.6%) | 705 (39.9%) |
| 3 or more Vehicles | 2,550 (47.0%) | 410 (23.2%) |
| Total | 5,429 (100.0%) | 1,767 (100.0%) |
Real Estate & Mortgages in Gem County
Real Estate and Mortgage Overview in Gem County
| Characteristic | Without Mortgage | With Mortgage |
| Housing Units | 2,168 | 3,261 |
| Median Property Value | $303,900 | $334,700 |
| Median Household Income | $57,792 | $580 |
| Monthly Housing Costs | $356 | $152 |
| Real Estate Taxes | $1,292 | $182 |
Property Value by Mortgage Status in Gem County
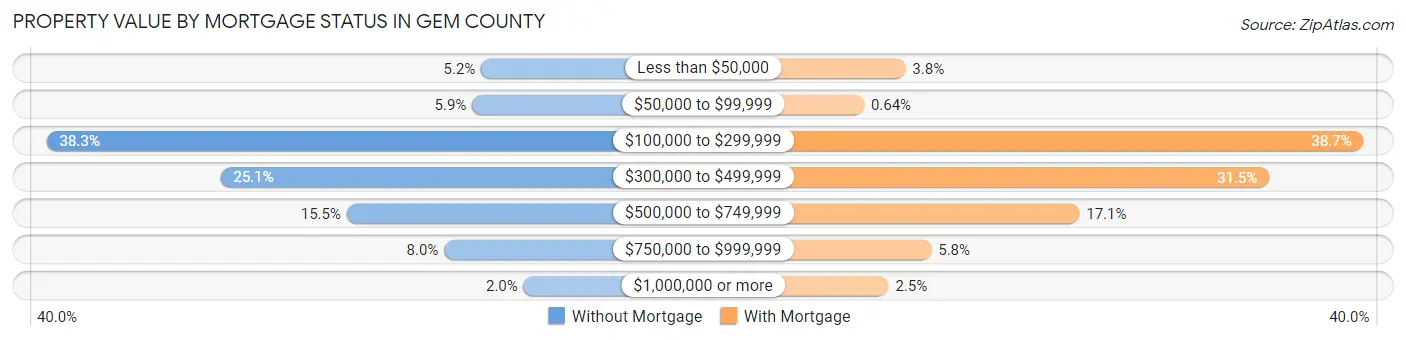
| Property Value | Without Mortgage | With Mortgage |
| Less than $50,000 | 113 (5.2%) | 124 (3.8%) |
| $50,000 to $99,999 | 128 (5.9%) | 21 (0.6%) |
| $100,000 to $299,999 | 831 (38.3%) | 1,262 (38.7%) |
| $300,000 to $499,999 | 544 (25.1%) | 1,028 (31.5%) |
| $500,000 to $749,999 | 335 (15.4%) | 556 (17.1%) |
| $750,000 to $999,999 | 174 (8.0%) | 188 (5.8%) |
| $1,000,000 or more | 43 (2.0%) | 82 (2.5%) |
| Total | 2,168 (100.0%) | 3,261 (100.0%) |
Household Income by Mortgage Status in Gem County
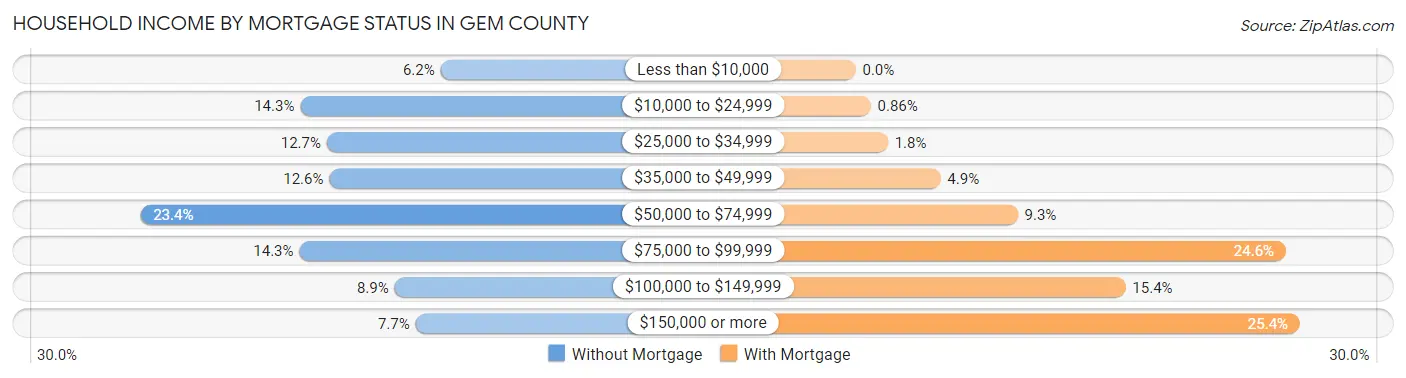
| Household Income | Without Mortgage | With Mortgage |
| Less than $10,000 | 135 (6.2%) | 0 (0.0%) |
| $10,000 to $24,999 | 309 (14.2%) | 28 (0.9%) |
| $25,000 to $34,999 | 276 (12.7%) | 60 (1.8%) |
| $35,000 to $49,999 | 273 (12.6%) | 158 (4.9%) |
| $50,000 to $74,999 | 507 (23.4%) | 302 (9.3%) |
| $75,000 to $99,999 | 310 (14.3%) | 802 (24.6%) |
| $100,000 to $149,999 | 192 (8.9%) | 503 (15.4%) |
| $150,000 or more | 166 (7.7%) | 828 (25.4%) |
| Total | 2,168 (100.0%) | 3,261 (100.0%) |
Property Value to Household Income Ratio in Gem County
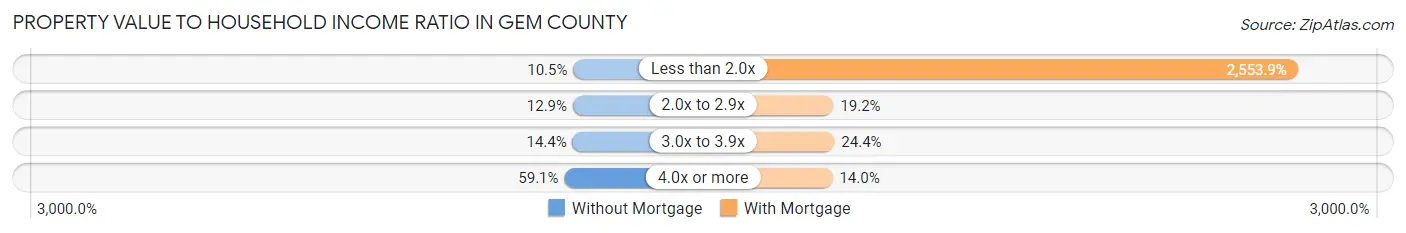
| Value-to-Income Ratio | Without Mortgage | With Mortgage |
| Less than 2.0x | 228 (10.5%) | 83,281 (2,553.8%) |
| 2.0x to 2.9x | 280 (12.9%) | 626 (19.2%) |
| 3.0x to 3.9x | 312 (14.4%) | 795 (24.4%) |
| 4.0x or more | 1,282 (59.1%) | 455 (14.0%) |
| Total | 2,168 (100.0%) | 3,261 (100.0%) |
Real Estate Taxes by Mortgage Status in Gem County
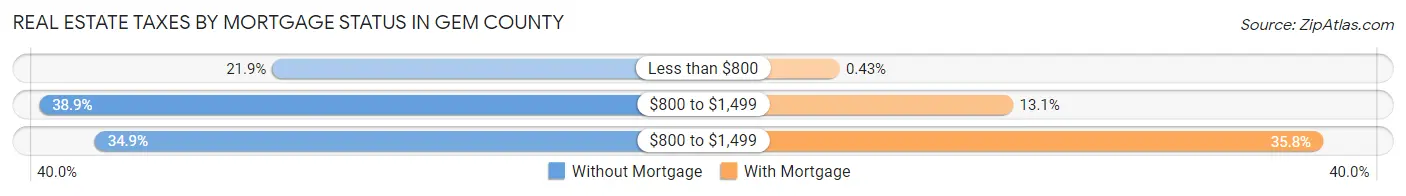
| Property Taxes | Without Mortgage | With Mortgage |
| Less than $800 | 475 (21.9%) | 14 (0.4%) |
| $800 to $1,499 | 844 (38.9%) | 428 (13.1%) |
| $800 to $1,499 | 756 (34.9%) | 1,167 (35.8%) |
| Total | 2,168 (100.0%) | 3,261 (100.0%) |
Health & Disability in Gem County
Health Insurance Coverage by Age in Gem County
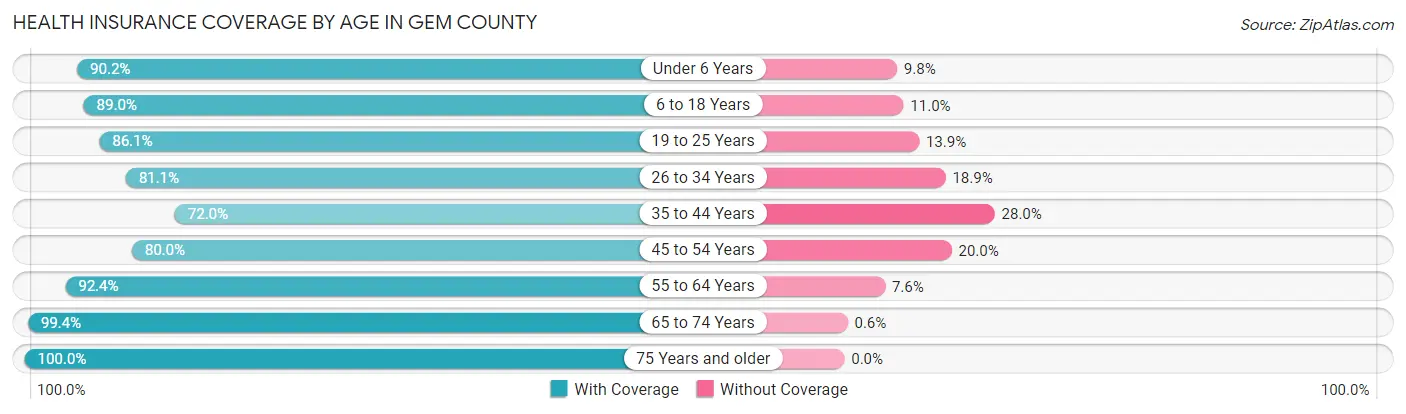
| Age Bracket | With Coverage | Without Coverage |
| Under 6 Years | 1,159 (90.2%) | 126 (9.8%) |
| 6 to 18 Years | 3,083 (89.0%) | 382 (11.0%) |
| 19 to 25 Years | 989 (86.1%) | 160 (13.9%) |
| 26 to 34 Years | 1,492 (81.1%) | 347 (18.9%) |
| 35 to 44 Years | 1,551 (72.0%) | 604 (28.0%) |
| 45 to 54 Years | 1,820 (80.0%) | 455 (20.0%) |
| 55 to 64 Years | 2,522 (92.4%) | 207 (7.6%) |
| 65 to 74 Years | 2,474 (99.4%) | 15 (0.6%) |
| 75 Years and older | 1,636 (100.0%) | 0 (0.0%) |
| Total | 16,726 (87.9%) | 2,296 (12.1%) |
Health Insurance Coverage by Citizenship Status in Gem County
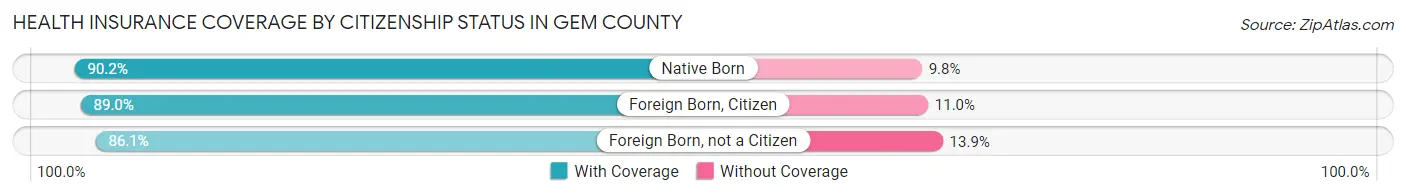
| Citizenship Status | With Coverage | Without Coverage |
| Native Born | 1,159 (90.2%) | 126 (9.8%) |
| Foreign Born, Citizen | 3,083 (89.0%) | 382 (11.0%) |
| Foreign Born, not a Citizen | 989 (86.1%) | 160 (13.9%) |
Health Insurance Coverage by Household Income in Gem County
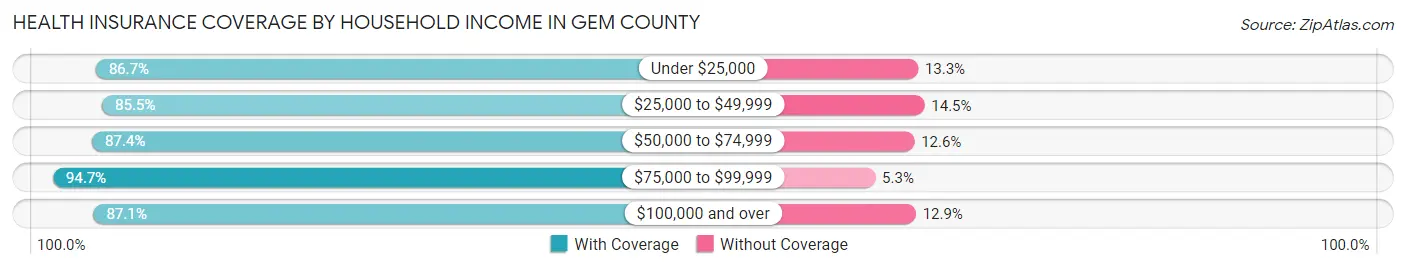
| Household Income | With Coverage | Without Coverage |
| Under $25,000 | 1,339 (86.7%) | 206 (13.3%) |
| $25,000 to $49,999 | 2,618 (85.5%) | 445 (14.5%) |
| $50,000 to $74,999 | 4,089 (87.4%) | 591 (12.6%) |
| $75,000 to $99,999 | 2,550 (94.7%) | 143 (5.3%) |
| $100,000 and over | 6,127 (87.1%) | 908 (12.9%) |
Public vs Private Health Insurance Coverage by Age in Gem County
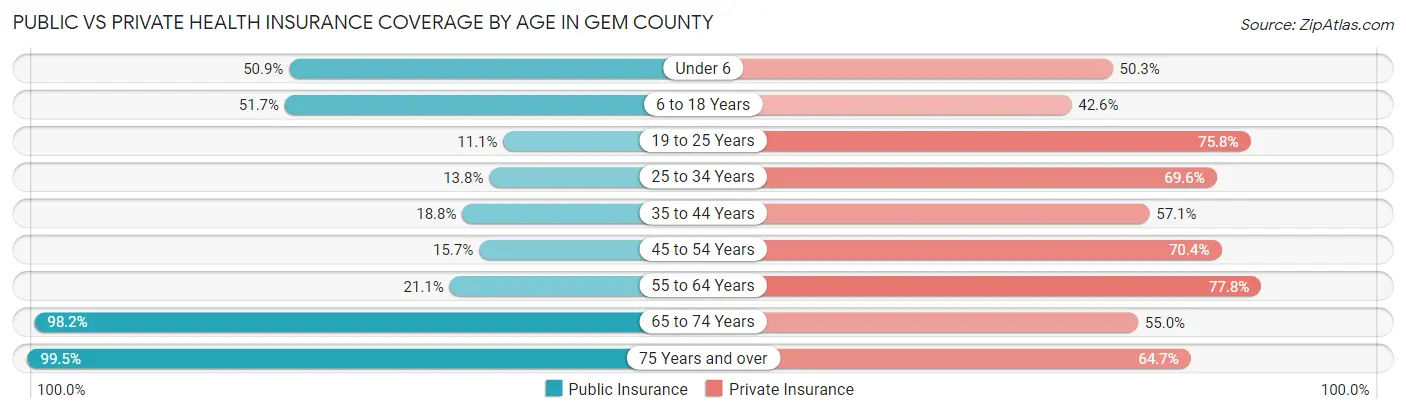
| Age Bracket | Public Insurance | Private Insurance |
| Under 6 | 654 (50.9%) | 646 (50.3%) |
| 6 to 18 Years | 1,791 (51.7%) | 1,476 (42.6%) |
| 19 to 25 Years | 128 (11.1%) | 871 (75.8%) |
| 25 to 34 Years | 253 (13.8%) | 1,279 (69.6%) |
| 35 to 44 Years | 404 (18.8%) | 1,230 (57.1%) |
| 45 to 54 Years | 356 (15.7%) | 1,602 (70.4%) |
| 55 to 64 Years | 576 (21.1%) | 2,124 (77.8%) |
| 65 to 74 Years | 2,444 (98.2%) | 1,368 (55.0%) |
| 75 Years and over | 1,627 (99.5%) | 1,059 (64.7%) |
| Total | 8,233 (43.3%) | 11,655 (61.3%) |
Disability Status by Sex by Age in Gem County
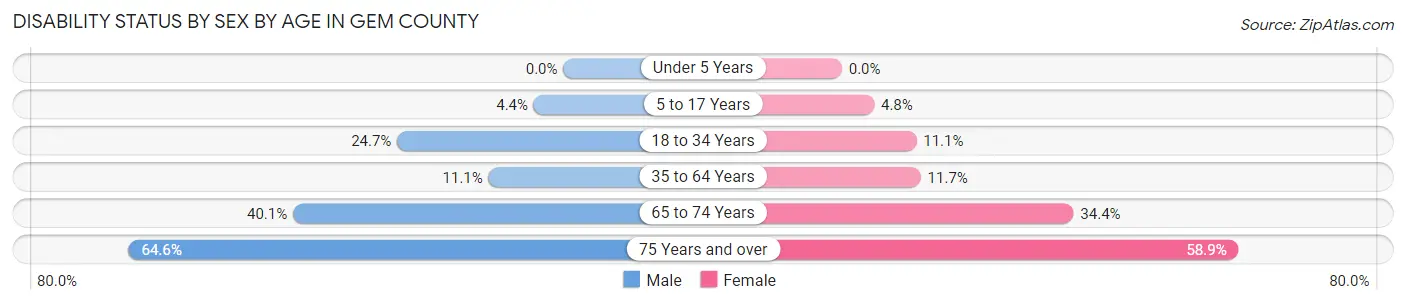
| Age Bracket | Male | Female |
| Under 5 Years | 0 (0.0%) | 0 (0.0%) |
| 5 to 17 Years | 77 (4.4%) | 75 (4.8%) |
| 18 to 34 Years | 442 (24.7%) | 180 (11.1%) |
| 35 to 64 Years | 387 (11.1%) | 430 (11.7%) |
| 65 to 74 Years | 503 (40.1%) | 425 (34.4%) |
| 75 Years and over | 541 (64.6%) | 470 (58.9%) |
Disability Class by Sex by Age in Gem County
Disability Class: Hearing Difficulty
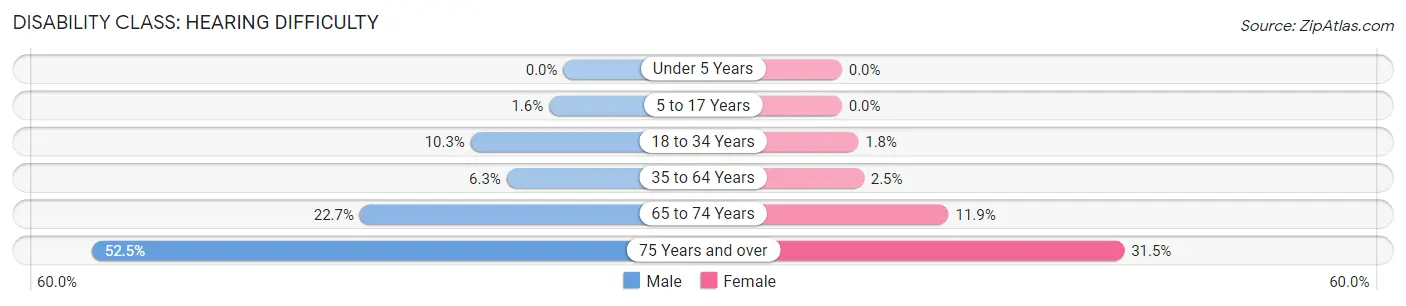
| Age Bracket | Male | Female |
| Under 5 Years | 0 (0.0%) | 0 (0.0%) |
| 5 to 17 Years | 28 (1.6%) | 0 (0.0%) |
| 18 to 34 Years | 185 (10.3%) | 30 (1.8%) |
| 35 to 64 Years | 220 (6.3%) | 90 (2.5%) |
| 65 to 74 Years | 284 (22.7%) | 147 (11.9%) |
| 75 Years and over | 440 (52.5%) | 251 (31.5%) |
Disability Class: Vision Difficulty
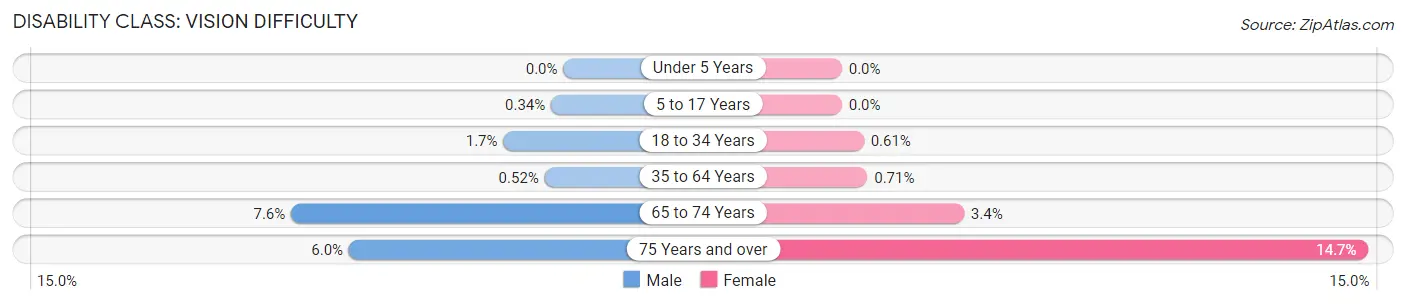
| Age Bracket | Male | Female |
| Under 5 Years | 0 (0.0%) | 0 (0.0%) |
| 5 to 17 Years | 6 (0.3%) | 0 (0.0%) |
| 18 to 34 Years | 30 (1.7%) | 10 (0.6%) |
| 35 to 64 Years | 18 (0.5%) | 26 (0.7%) |
| 65 to 74 Years | 95 (7.6%) | 42 (3.4%) |
| 75 Years and over | 50 (6.0%) | 117 (14.7%) |
Disability Class: Cognitive Difficulty
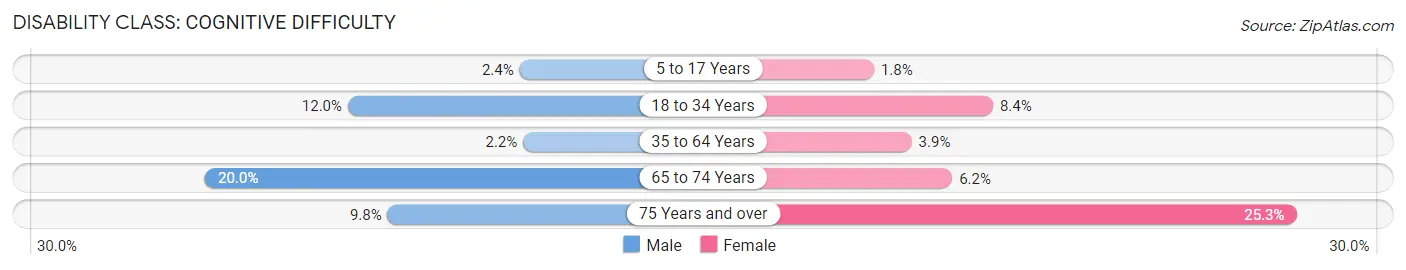
| Age Bracket | Male | Female |
| 5 to 17 Years | 43 (2.4%) | 28 (1.8%) |
| 18 to 34 Years | 215 (12.0%) | 137 (8.4%) |
| 35 to 64 Years | 78 (2.2%) | 143 (3.9%) |
| 65 to 74 Years | 250 (20.0%) | 76 (6.1%) |
| 75 Years and over | 82 (9.8%) | 202 (25.3%) |
Disability Class: Ambulatory Difficulty
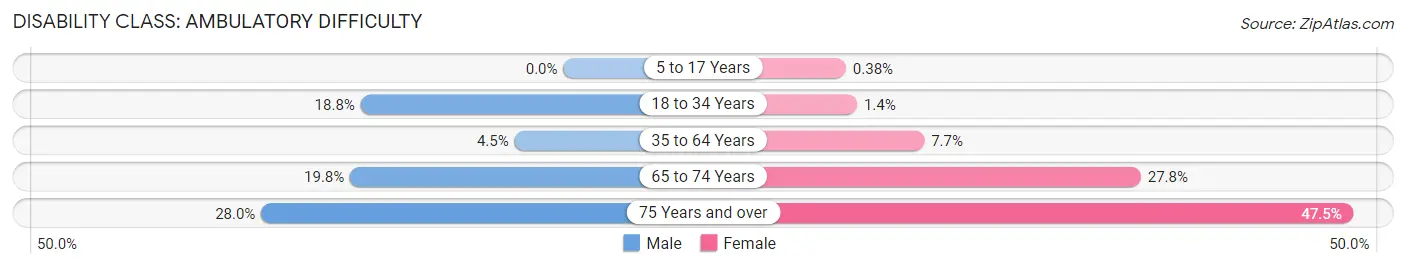
| Age Bracket | Male | Female |
| 5 to 17 Years | 0 (0.0%) | 6 (0.4%) |
| 18 to 34 Years | 337 (18.8%) | 23 (1.4%) |
| 35 to 64 Years | 158 (4.5%) | 281 (7.6%) |
| 65 to 74 Years | 248 (19.8%) | 343 (27.8%) |
| 75 Years and over | 235 (28.0%) | 379 (47.5%) |
Disability Class: Self-Care Difficulty
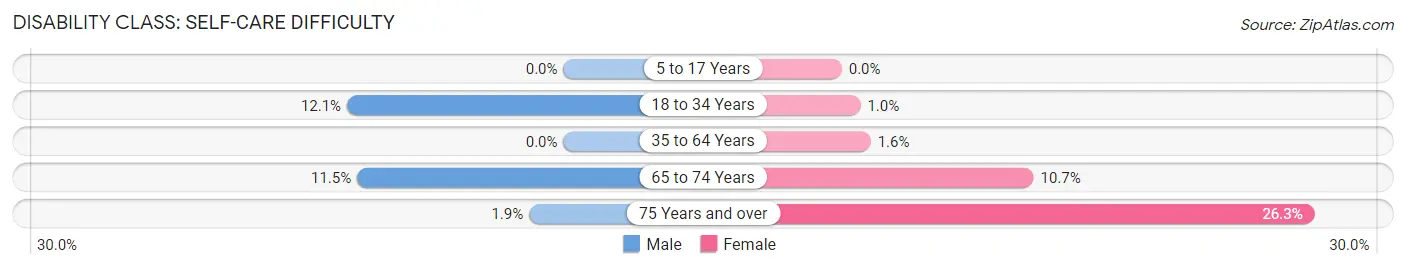
| Age Bracket | Male | Female |
| 5 to 17 Years | 0 (0.0%) | 0 (0.0%) |
| 18 to 34 Years | 216 (12.0%) | 17 (1.0%) |
| 35 to 64 Years | 0 (0.0%) | 59 (1.6%) |
| 65 to 74 Years | 144 (11.5%) | 132 (10.7%) |
| 75 Years and over | 16 (1.9%) | 210 (26.3%) |
Technology Access in Gem County
Computing Device Access in Gem County
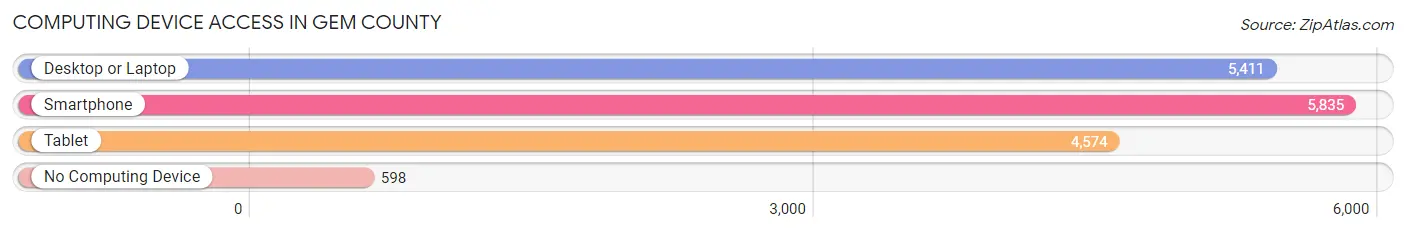
| Device Type | # Households | % Households |
| Desktop or Laptop | 5,411 | 75.2% |
| Smartphone | 5,835 | 81.1% |
| Tablet | 4,574 | 63.6% |
| No Computing Device | 598 | 8.3% |
| Total | 7,196 | 100.0% |
Internet Access in Gem County
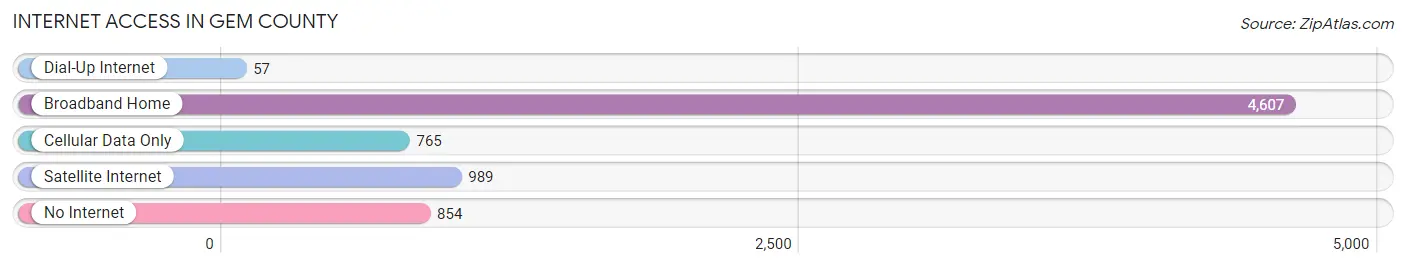
| Internet Type | # Households | % Households |
| Dial-Up Internet | 57 | 0.8% |
| Broadband Home | 4,607 | 64.0% |
| Cellular Data Only | 765 | 10.6% |
| Satellite Internet | 989 | 13.7% |
| No Internet | 854 | 11.9% |
| Total | 7,196 | 100.0% |
Gem County Summary
Gem County is located in the southwestern region of Idaho, and is bordered by Ada County to the north, Payette County to the east, Canyon County to the south, and Owyhee County to the west. The county seat is Emmett, and the largest city is Emmett. Gem County has a total area of 576 square miles, of which 575 square miles is land and 1 square mile is water.
Geography
Gem County is located in the western part of the state of Idaho, and is part of the Boise Metropolitan Statistical Area. The county is situated in the foothills of the Boise Mountains, and is characterized by rolling hills and valleys. The highest point in the county is the summit of Squaw Butte, which rises to an elevation of 5,906 feet. The county is drained by the Payette River, which flows through the county from north to south.
The climate of Gem County is generally dry and semi-arid, with hot summers and cold winters. The average annual precipitation is about 12 inches, with most of the precipitation occurring in the winter months.
Economy
Gem County has a diverse economy, with a mix of agriculture, manufacturing, and services. The county is home to several large agricultural operations, including potato farms, dairy farms, and cattle ranches. The county is also home to several manufacturing companies, including a large paper mill and a furniture factory.
The county is also home to several service-based businesses, including restaurants, hotels, and retail stores. The county is also home to several government offices, including the Gem County Courthouse and the Gem County Sheriff's Office.
Demographics
As of the 2010 census, Gem County had a population of 16,719. The racial makeup of the county was 90.3% White, 0.4% African American, 0.7% Native American, 0.7% Asian, 0.1% Pacific Islander, 5.7% from other races, and 2.1% from two or more races. Hispanic or Latino of any race were 11.2% of the population.
The median income for a household in Gem County was $41,945, and the median income for a family was $50,945. The per capita income for the county was $20,945. About 11.2% of families and 14.2% of the population were below the poverty line, including 18.2% of those under age 18 and 8.2% of those age 65 or over.
Gem County is served by the Emmett Independent School District, which includes four elementary schools, one middle school, and one high school. The county is also home to several private schools, including a Catholic school and a Christian school. The county is also home to the College of Western Idaho, which offers a variety of degree and certificate programs.
Common Questions
What is the Total Population of Gem County?
Total Population of Gem County is 19,250.
What is the Total Male Population of Gem County?
Total Male Population of Gem County is 9,776.
What is the Total Female Population of Gem County?
Total Female Population of Gem County is 9,474.
What is the Ratio of Males per 100 Females in Gem County?
There are 103.19 Males per 100 Females in Gem County.
What is the Ratio of Females per 100 Males in Gem County?
There are 96.91 Females per 100 Males in Gem County.
What is the Median Population Age in Gem County?
Median Population Age in Gem County is 44.0 Years.
What is the Average Family Size in Gem County
Average Family Size in Gem County is 3.0 People.
What is the Average Household Size in Gem County
Average Household Size in Gem County is 2.6 People.
What is Per Capita Income in Gem County?
Per Capita income in Gem County is $33,032.
What is the Median Family Income in Gem County?
Median Family Income in Gem County is $72,847.
What is the Median Household income in Gem County?
Median Household Income in Gem County is $65,204.
What is Income or Wage Gap in Gem County?
Income or Wage Gap in Gem County is 43.9%.
Women in Gem County earn 56.1 cents for every dollar earned by a man.
What is Inequality or Gini Index in Gem County?
Inequality or Gini Index in Gem County is 0.43.
How Large is the Labor Force in Gem County?
There are 8,847 People in the Labor Forcein in Gem County.
What is the Percentage of People in the Labor Force in Gem County?
57.3% of People are in the Labor Force in Gem County.
What is the Unemployment Rate in Gem County?
Unemployment Rate in Gem County is 2.8%.