Fremont County, ID
Fremont County Map

Fremont County Overview
13,519
TOTAL POPULATION
7,028
MALE POPULATION
6,491
FEMALE POPULATION
108.27
MALES / 100 FEMALES
92.36
FEMALES / 100 MALES
39.0
MEDIAN AGE
3.4
AVG FAMILY SIZE
3.0
AVG HOUSEHOLD SIZE
$27,427
PER CAPITA INCOME
$75,162
AVG FAMILY INCOME
$67,015
AVG HOUSEHOLD INCOME
39.3%
WAGE / INCOME GAP [ % ]
60.7¢/ $1
WAGE / INCOME GAP [ $ ]
$9,897
FAMILY INCOME DEFICIT
0.38
INEQUALITY / GINI INDEX
6,078
LABOR FORCE [ PEOPLE ]
56.8%
PERCENT IN LABOR FORCE
4.5%
UNEMPLOYMENT RATE
Fremont County Area Codes
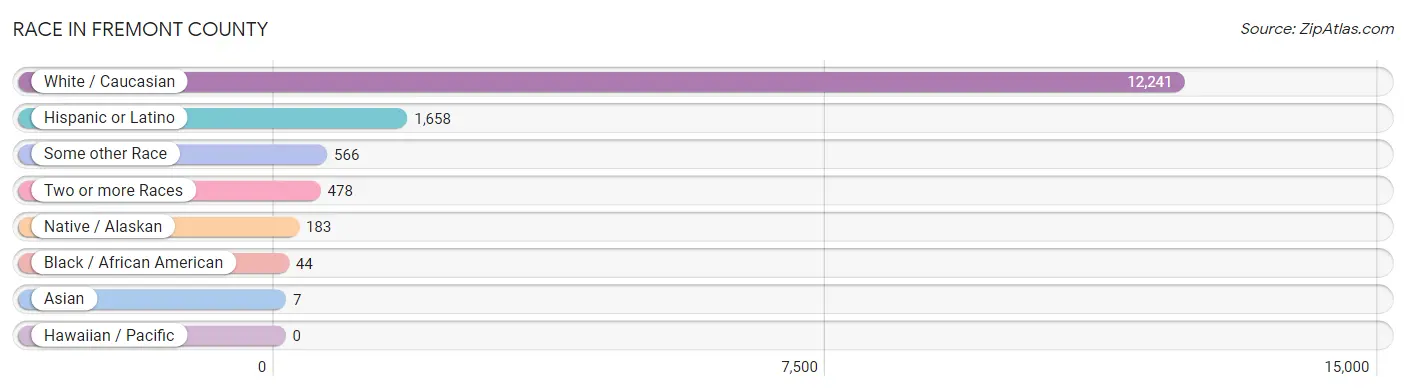
Race in Fremont County
The most populous races in Fremont County are White / Caucasian (12,241 | 90.5%), Hispanic or Latino (1,658 | 12.3%), and Some other Race (566 | 4.2%).
| Race | # Population | % Population |
| Asian | 7 | 0.1% |
| Black / African American | 44 | 0.3% |
| Hawaiian / Pacific | 0 | 0.0% |
| Hispanic or Latino | 1,658 | 12.3% |
| Native / Alaskan | 183 | 1.3% |
| White / Caucasian | 12,241 | 90.5% |
| Two or more Races | 478 | 3.5% |
| Some other Race | 566 | 4.2% |
| Total | 13,519 | 100.0% |
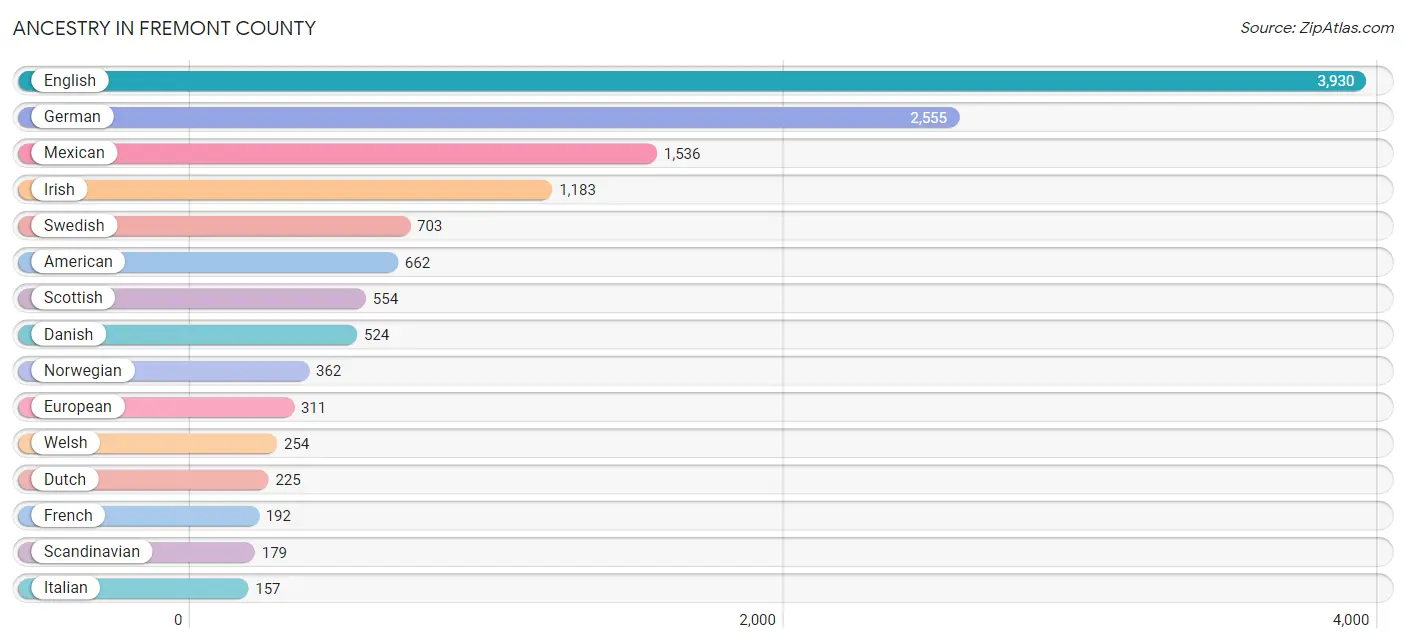
Ancestry in Fremont County
The most populous ancestries reported in Fremont County are English (3,930 | 29.1%), German (2,555 | 18.9%), Mexican (1,536 | 11.4%), Irish (1,183 | 8.7%), and Swedish (703 | 5.2%), together accounting for 73.3% of all Fremont County residents.
| Ancestry | # Population | % Population |
| African | 9 | 0.1% |
| American | 662 | 4.9% |
| Apache | 2 | 0.0% |
| Australian | 5 | 0.0% |
| Austrian | 11 | 0.1% |
| Basque | 34 | 0.3% |
| Bhutanese | 14 | 0.1% |
| British | 39 | 0.3% |
| Burmese | 5 | 0.0% |
| Canadian | 52 | 0.4% |
| Central American | 2 | 0.0% |
| Cherokee | 40 | 0.3% |
| Creek | 4 | 0.0% |
| Croatian | 7 | 0.1% |
| Danish | 524 | 3.9% |
| Dutch | 225 | 1.7% |
| English | 3,930 | 29.1% |
| Ethiopian | 5 | 0.0% |
| European | 311 | 2.3% |
| French | 192 | 1.4% |
| French Canadian | 8 | 0.1% |
| German | 2,555 | 18.9% |
| Greek | 7 | 0.1% |
| Honduran | 2 | 0.0% |
| Hopi | 31 | 0.2% |
| Icelander | 9 | 0.1% |
| Irish | 1,183 | 8.7% |
| Italian | 157 | 1.2% |
| Jamaican | 2 | 0.0% |
| Korean | 2 | 0.0% |
| Lithuanian | 15 | 0.1% |
| Macedonian | 3 | 0.0% |
| Mexican | 1,536 | 11.4% |
| Mexican American Indian | 35 | 0.3% |
| Northern European | 14 | 0.1% |
| Norwegian | 362 | 2.7% |
| Polish | 90 | 0.7% |
| Portuguese | 51 | 0.4% |
| Puerto Rican | 57 | 0.4% |
| Russian | 79 | 0.6% |
| Samoan | 11 | 0.1% |
| Scandinavian | 179 | 1.3% |
| Scotch-Irish | 93 | 0.7% |
| Scottish | 554 | 4.1% |
| Serbian | 5 | 0.0% |
| Shoshone | 2 | 0.0% |
| Sioux | 2 | 0.0% |
| South African | 10 | 0.1% |
| South American | 13 | 0.1% |
| Spaniard | 22 | 0.2% |
| Spanish | 5 | 0.0% |
| Subsaharan African | 24 | 0.2% |
| Swedish | 703 | 5.2% |
| Swiss | 136 | 1.0% |
| Turkish | 24 | 0.2% |
| Ute | 27 | 0.2% |
| Venezuelan | 13 | 0.1% |
| Welsh | 254 | 1.9% | View All 58 Rows |
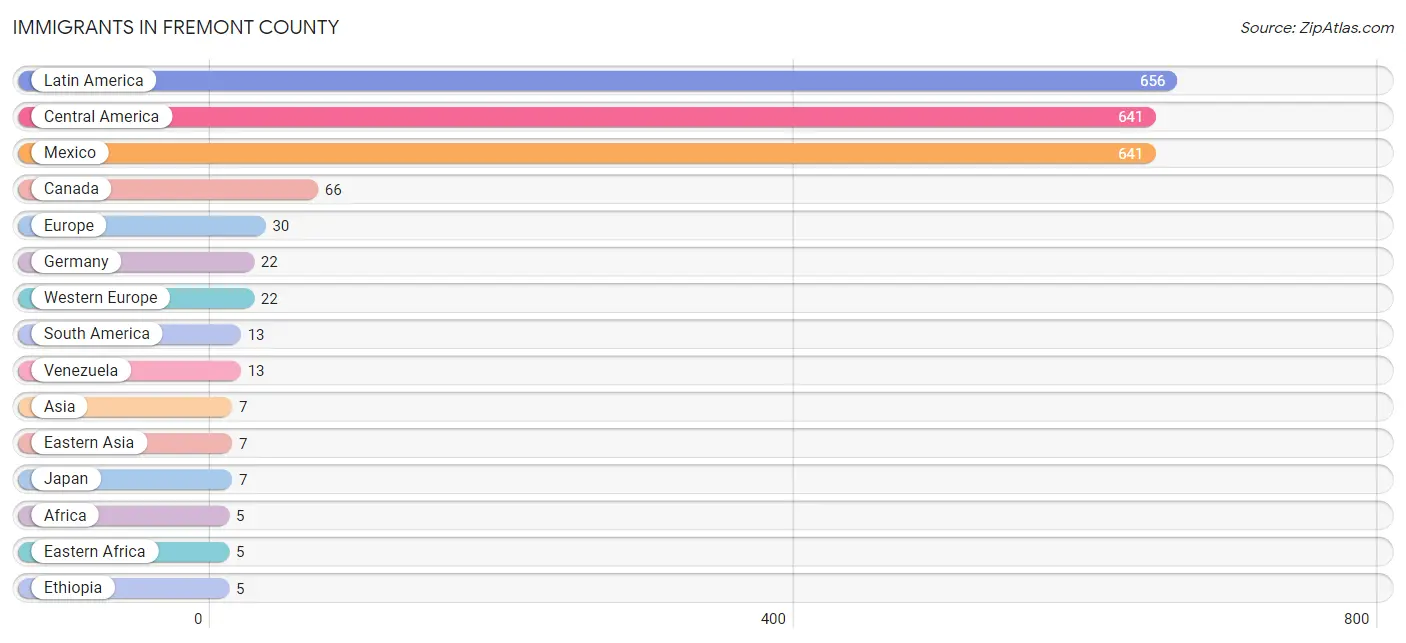
Immigrants in Fremont County
The most numerous immigrant groups reported in Fremont County came from Latin America (656 | 4.9%), Central America (641 | 4.7%), Mexico (641 | 4.7%), Canada (66 | 0.5%), and Europe (30 | 0.2%), together accounting for 15.0% of all Fremont County residents.
| Immigration Origin | # Population | % Population |
| Africa | 5 | 0.0% |
| Asia | 7 | 0.1% |
| Canada | 66 | 0.5% |
| Caribbean | 2 | 0.0% |
| Central America | 641 | 4.7% |
| Eastern Africa | 5 | 0.0% |
| Eastern Asia | 7 | 0.1% |
| Eastern Europe | 3 | 0.0% |
| Ethiopia | 5 | 0.0% |
| Europe | 30 | 0.2% |
| Germany | 22 | 0.2% |
| Jamaica | 2 | 0.0% |
| Japan | 7 | 0.1% |
| Latin America | 656 | 4.9% |
| Mexico | 641 | 4.7% |
| North Macedonia | 3 | 0.0% |
| South America | 13 | 0.1% |
| Southern Europe | 5 | 0.0% |
| Spain | 5 | 0.0% |
| Venezuela | 13 | 0.1% |
| Western Europe | 22 | 0.2% | View All 21 Rows |
Sex and Age in Fremont County
Sex and Age in Fremont County
The most populous age groups in Fremont County are 40 to 44 Years (629 | 8.9%) for men and 10 to 14 Years (491 | 7.6%) for women.

| Age Bracket | Male | Female |
| Under 5 Years | 399 (5.7%) | 415 (6.4%) |
| 5 to 9 Years | 452 (6.4%) | 420 (6.5%) |
| 10 to 14 Years | 457 (6.5%) | 491 (7.6%) |
| 15 to 19 Years | 559 (8.0%) | 456 (7.0%) |
| 20 to 24 Years | 380 (5.4%) | 430 (6.6%) |
| 25 to 29 Years | 436 (6.2%) | 418 (6.4%) |
| 30 to 34 Years | 463 (6.6%) | 374 (5.8%) |
| 35 to 39 Years | 293 (4.2%) | 442 (6.8%) |
| 40 to 44 Years | 629 (8.9%) | 340 (5.2%) |
| 45 to 49 Years | 464 (6.6%) | 396 (6.1%) |
| 50 to 54 Years | 359 (5.1%) | 335 (5.2%) |
| 55 to 59 Years | 451 (6.4%) | 426 (6.6%) |
| 60 to 64 Years | 478 (6.8%) | 356 (5.5%) |
| 65 to 69 Years | 354 (5.0%) | 411 (6.3%) |
| 70 to 74 Years | 381 (5.4%) | 296 (4.6%) |
| 75 to 79 Years | 237 (3.4%) | 205 (3.2%) |
| 80 to 84 Years | 130 (1.8%) | 157 (2.4%) |
| 85 Years and over | 106 (1.5%) | 123 (1.9%) |
| Total | 7,028 (100.0%) | 6,491 (100.0%) |
Families and Households in Fremont County
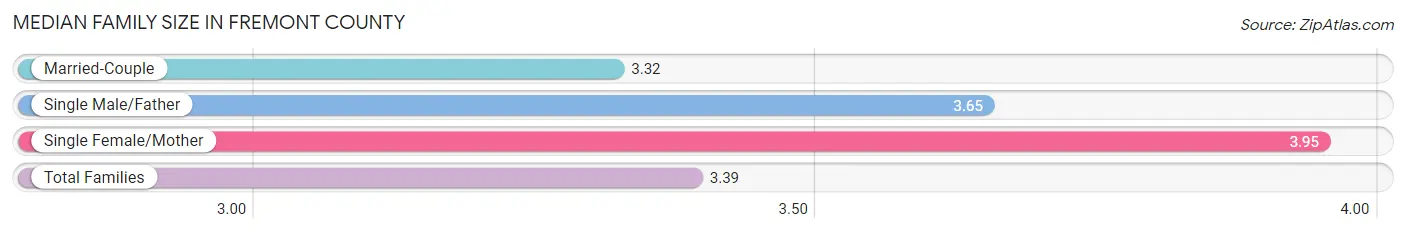
Median Family Size in Fremont County
The median family size in Fremont County is 3.39 persons per family, with single female/mother families (305 | 8.9%) accounting for the largest median family size of 3.95 persons per family. On the other hand, married-couple families (2,989 | 87.6%) represent the smallest median family size with 3.32 persons per family.
| Family Type | # Families | Family Size |
| Married-Couple | 2,989 (87.6%) | 3.32 |
| Single Male/Father | 117 (3.4%) | 3.65 |
| Single Female/Mother | 305 (8.9%) | 3.95 |
| Total Families | 3,411 (100.0%) | 3.39 |
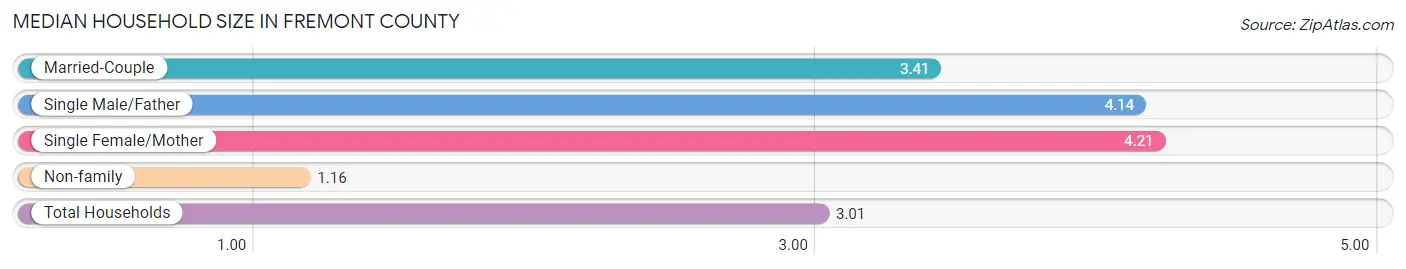
Median Household Size in Fremont County
The median household size in Fremont County is 3.01 persons per household, with single female/mother households (305 | 7.1%) accounting for the largest median household size of 4.21 persons per household. non-family households (909 | 21.0%) represent the smallest median household size with 1.16 persons per household.
| Household Type | # Households | Household Size |
| Married-Couple | 2,989 (69.2%) | 3.41 |
| Single Male/Father | 117 (2.7%) | 4.14 |
| Single Female/Mother | 305 (7.1%) | 4.21 |
| Non-family | 909 (21.0%) | 1.16 |
| Total Households | 4,320 (100.0%) | 3.01 |
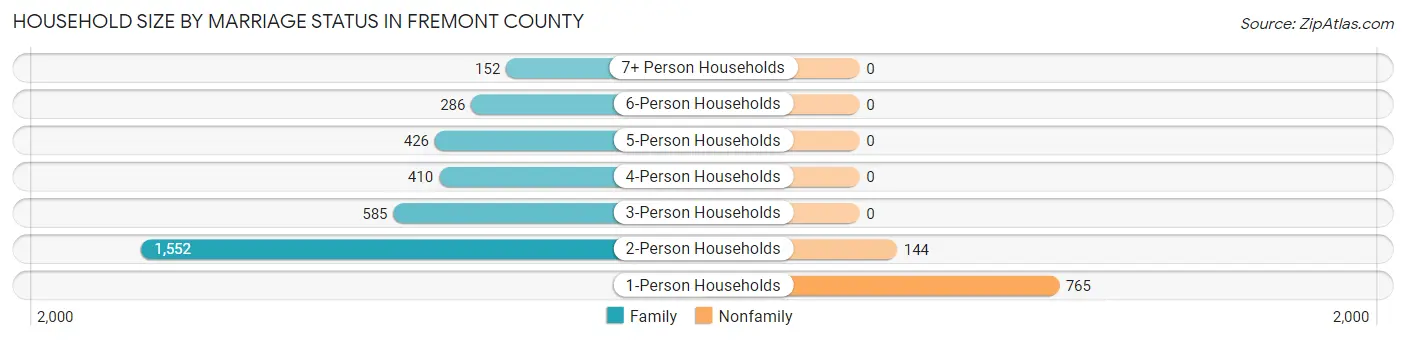
Household Size by Marriage Status in Fremont County
Out of a total of 4,320 households in Fremont County, 3,411 (79.0%) are family households, while 909 (21.0%) are nonfamily households. The most numerous type of family households are 2-person households, comprising 1,552, and the most common type of nonfamily households are 1-person households, comprising 765.
| Household Size | Family Households | Nonfamily Households |
| 1-Person Households | - | 765 (17.7%) |
| 2-Person Households | 1,552 (35.9%) | 144 (3.3%) |
| 3-Person Households | 585 (13.5%) | 0 (0.0%) |
| 4-Person Households | 410 (9.5%) | 0 (0.0%) |
| 5-Person Households | 426 (9.9%) | 0 (0.0%) |
| 6-Person Households | 286 (6.6%) | 0 (0.0%) |
| 7+ Person Households | 152 (3.5%) | 0 (0.0%) |
| Total | 3,411 (79.0%) | 909 (21.0%) |
Female Fertility in Fremont County
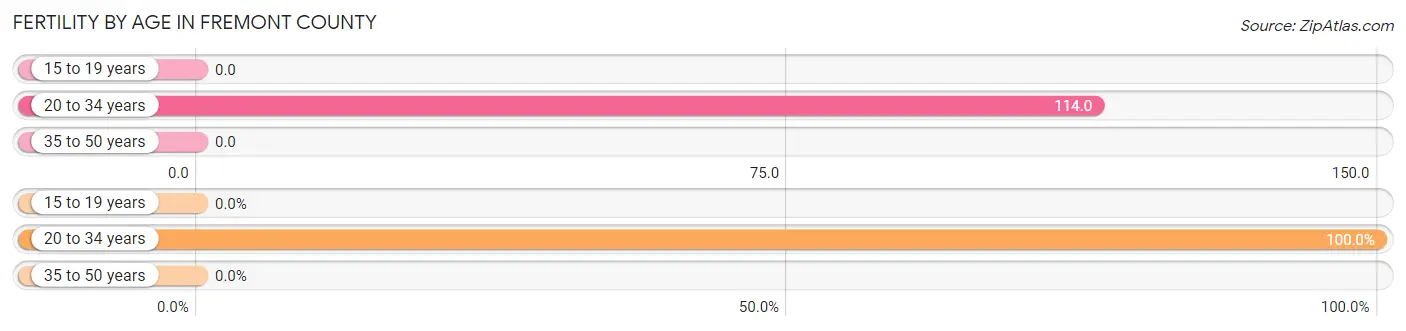
Fertility by Age in Fremont County
Average fertility rate in Fremont County is 48.0 births per 1,000 women. Women in the age bracket of 20 to 34 years have the highest fertility rate with 114.0 births per 1,000 women. Women in the age bracket of 20 to 34 years acount for 100.0% of all women with births.
| Age Bracket | Women with Births | Births / 1,000 Women |
| 15 to 19 years | 0 (0.0%) | 0.0 |
| 20 to 34 years | 139 (100.0%) | 114.0 |
| 35 to 50 years | 0 (0.0%) | 0.0 |
| Total | 139 (100.0%) | 48.0 |
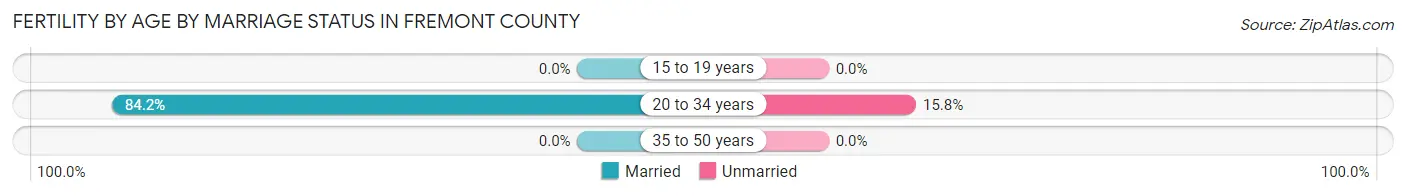
Fertility by Age by Marriage Status in Fremont County
84.2% of women with births (139) in Fremont County are married. The highest percentage of unmarried women with births falls into 20 to 34 years age bracket with 15.8% of them unmarried at the time of birth, while the lowest percentage of unmarried women with births belong to 20 to 34 years age bracket with 15.8% of them unmarried.
| Age Bracket | Married | Unmarried |
| 15 to 19 years | 0 (0.0%) | 0 (0.0%) |
| 20 to 34 years | 117 (84.2%) | 22 (15.8%) |
| 35 to 50 years | 0 (0.0%) | 0 (0.0%) |
| Total | 117 (84.2%) | 22 (15.8%) |
Fertility by Education in Fremont County
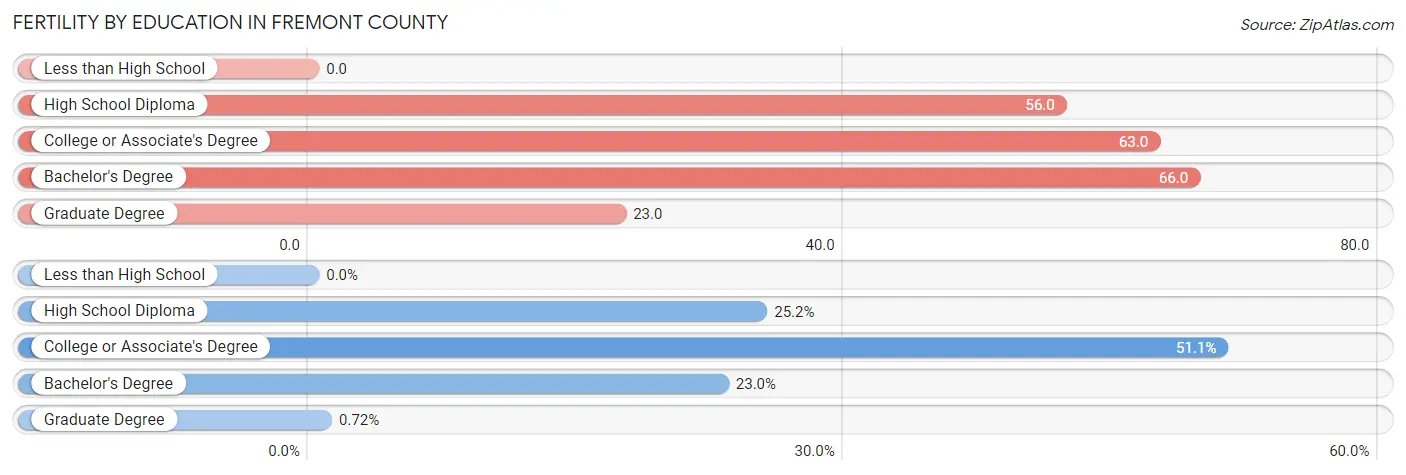
| Educational Attainment | Women with Births | Births / 1,000 Women |
| Less than High School | 0 (0.0%) | 0.0 |
| High School Diploma | 35 (25.2%) | 56.0 |
| College or Associate's Degree | 71 (51.1%) | 63.0 |
| Bachelor's Degree | 32 (23.0%) | 66.0 |
| Graduate Degree | 1 (0.7%) | 23.0 |
| Total | 139 (100.0%) | 48.0 |
Fertility by Education by Marriage Status in Fremont County
15.8% of women with births in Fremont County are unmarried. Women with the educational attainment of bachelor's degree are most likely to be married with 100.0% of them married at childbirth, while women with the educational attainment of high school diploma are least likely to be married with 28.6% of them unmarried at childbirth.
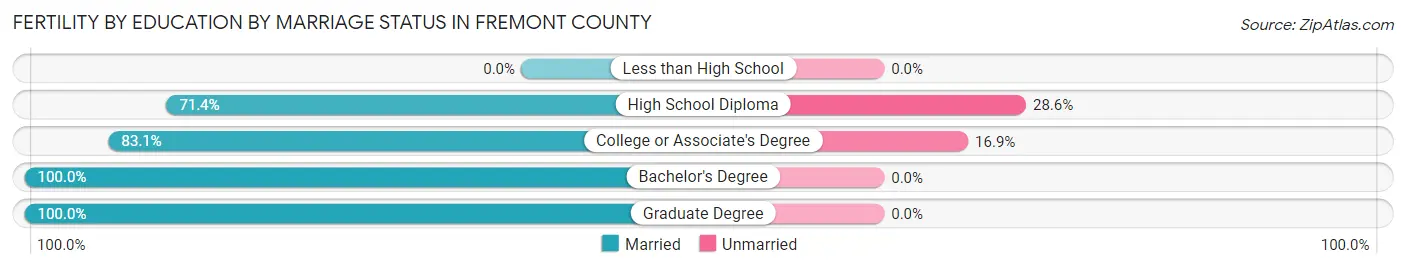
| Educational Attainment | Married | Unmarried |
| Less than High School | 0 (0.0%) | 0 (0.0%) |
| High School Diploma | 25 (71.4%) | 10 (28.6%) |
| College or Associate's Degree | 59 (83.1%) | 12 (16.9%) |
| Bachelor's Degree | 32 (100.0%) | 0 (0.0%) |
| Graduate Degree | 1 (100.0%) | 0 (0.0%) |
| Total | 117 (84.2%) | 22 (15.8%) |
Income in Fremont County
Income Overview in Fremont County
Per Capita Income in Fremont County is $27,427, while median incomes of families and households are $75,162 and $67,015 respectively.
| Characteristic | Number | Measure |
| Per Capita Income | 13,519 | $27,427 |
| Median Family Income | 3,411 | $75,162 |
| Mean Family Income | 3,411 | $83,948 |
| Median Household Income | 4,320 | $67,015 |
| Mean Household Income | 4,320 | $78,960 |
| Income Deficit | 3,411 | $9,897 |
| Wage / Income Gap (%) | 13,519 | 39.34% |
| Wage / Income Gap ($) | 13,519 | 60.66¢ per $1 |
| Gini / Inequality Index | 13,519 | 0.38 |
Earnings by Sex in Fremont County
Average Earnings in Fremont County are $30,600, $37,668 for men and $22,850 for women, a difference of 39.3%.
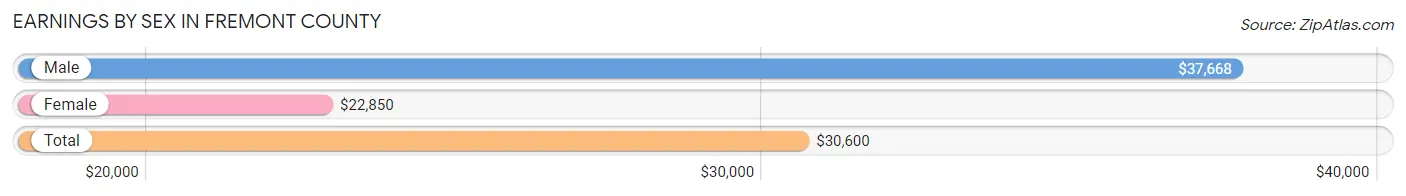
| Sex | Number | Average Earnings |
| Male | 3,905 (58.1%) | $37,668 |
| Female | 2,819 (41.9%) | $22,850 |
| Total | 6,724 (100.0%) | $30,600 |
Earnings by Sex by Income Bracket in Fremont County
The most common earnings brackets in Fremont County are $100,000+ for men (370 | 9.5%) and $25,000 to $29,999 for women (290 | 10.3%).
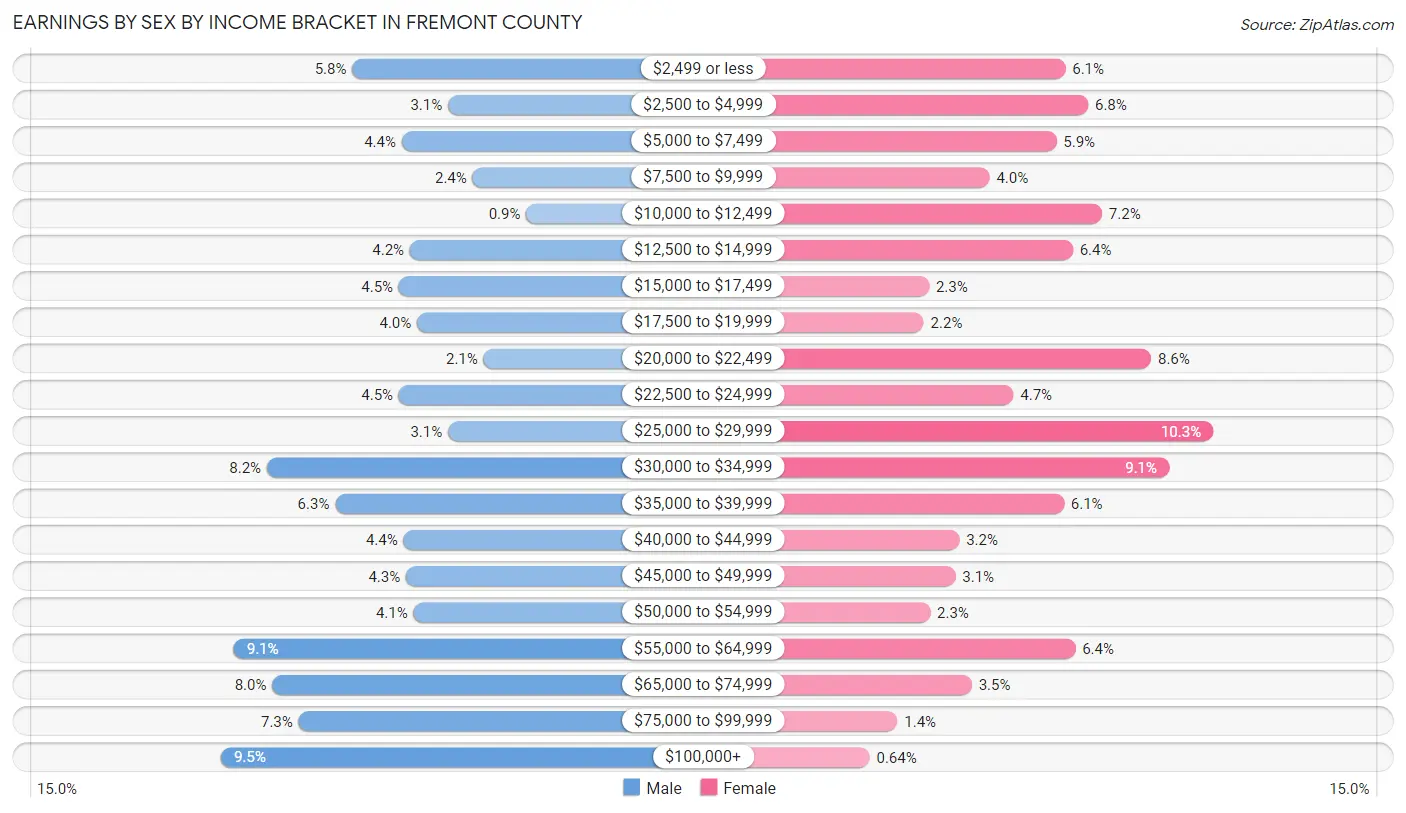
| Income | Male | Female |
| $2,499 or less | 226 (5.8%) | 173 (6.1%) |
| $2,500 to $4,999 | 121 (3.1%) | 191 (6.8%) |
| $5,000 to $7,499 | 172 (4.4%) | 166 (5.9%) |
| $7,500 to $9,999 | 94 (2.4%) | 113 (4.0%) |
| $10,000 to $12,499 | 35 (0.9%) | 202 (7.2%) |
| $12,500 to $14,999 | 163 (4.2%) | 179 (6.4%) |
| $15,000 to $17,499 | 175 (4.5%) | 65 (2.3%) |
| $17,500 to $19,999 | 155 (4.0%) | 61 (2.2%) |
| $20,000 to $22,499 | 82 (2.1%) | 241 (8.6%) |
| $22,500 to $24,999 | 175 (4.5%) | 132 (4.7%) |
| $25,000 to $29,999 | 121 (3.1%) | 290 (10.3%) |
| $30,000 to $34,999 | 320 (8.2%) | 255 (9.0%) |
| $35,000 to $39,999 | 245 (6.3%) | 172 (6.1%) |
| $40,000 to $44,999 | 170 (4.3%) | 89 (3.2%) |
| $45,000 to $49,999 | 167 (4.3%) | 86 (3.0%) |
| $50,000 to $54,999 | 159 (4.1%) | 66 (2.3%) |
| $55,000 to $64,999 | 356 (9.1%) | 181 (6.4%) |
| $65,000 to $74,999 | 314 (8.0%) | 99 (3.5%) |
| $75,000 to $99,999 | 285 (7.3%) | 40 (1.4%) |
| $100,000+ | 370 (9.5%) | 18 (0.6%) |
| Total | 3,905 (100.0%) | 2,819 (100.0%) |
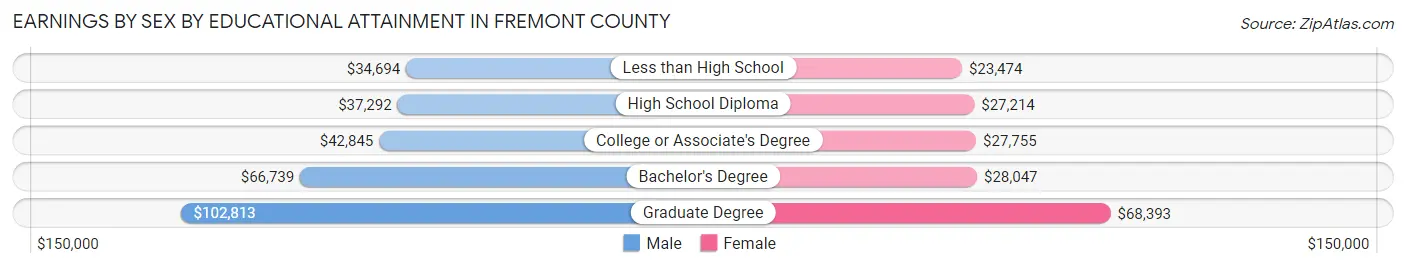
Earnings by Sex by Educational Attainment in Fremont County
Average earnings in Fremont County are $42,807 for men and $27,167 for women, a difference of 36.5%. Men with an educational attainment of graduate degree enjoy the highest average annual earnings of $102,813, while those with less than high school education earn the least with $34,694. Women with an educational attainment of graduate degree earn the most with the average annual earnings of $68,393, while those with less than high school education have the smallest earnings of $23,474.
| Educational Attainment | Male Income | Female Income |
| Less than High School | $34,694 | $23,474 |
| High School Diploma | $37,292 | $27,214 |
| College or Associate's Degree | $42,845 | $27,755 |
| Bachelor's Degree | $66,739 | $28,047 |
| Graduate Degree | $102,813 | $68,393 |
| Total | $42,807 | $27,167 |
Family Income in Fremont County
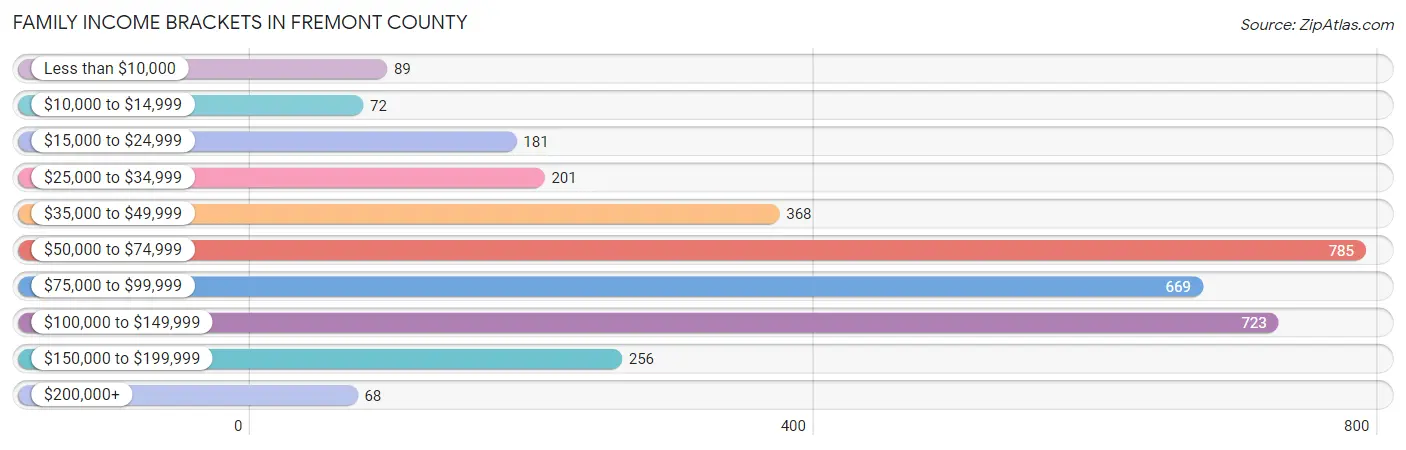
Family Income Brackets in Fremont County
According to the Fremont County family income data, there are 785 families falling into the $50,000 to $74,999 income range, which is the most common income bracket and makes up 23.0% of all families. Conversely, the $200,000+ income bracket is the least frequent group with only 68 families (2.0%) belonging to this category.
| Income Bracket | # Families | % Families |
| Less than $10,000 | 89 | 2.6% |
| $10,000 to $14,999 | 72 | 2.1% |
| $15,000 to $24,999 | 181 | 5.3% |
| $25,000 to $34,999 | 201 | 5.9% |
| $35,000 to $49,999 | 368 | 10.8% |
| $50,000 to $74,999 | 785 | 23.0% |
| $75,000 to $99,999 | 669 | 19.6% |
| $100,000 to $149,999 | 723 | 21.2% |
| $150,000 to $199,999 | 256 | 7.5% |
| $200,000+ | 68 | 2.0% |
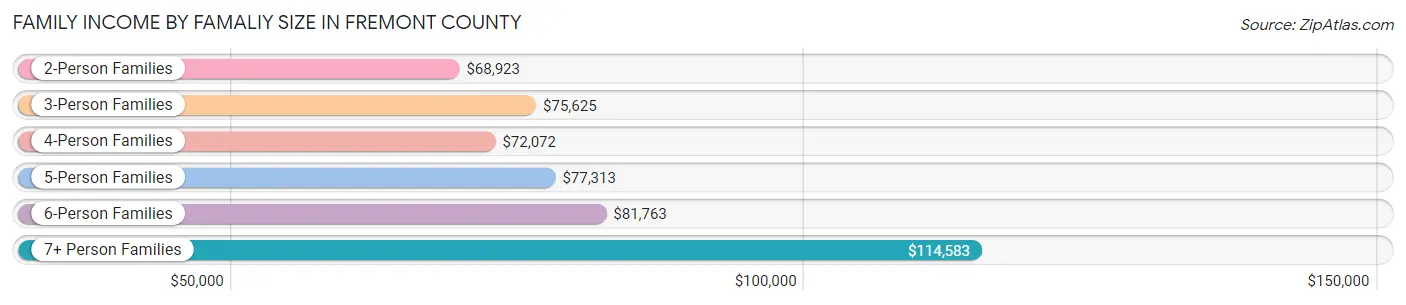
Family Income by Famaliy Size in Fremont County
7+ person families (130 | 3.8%) account for the highest median family income in Fremont County with $114,583 per family, while 2-person families (1,582 | 46.4%) have the highest median income of $34,462 per family member.
| Income Bracket | # Families | Median Income |
| 2-Person Families | 1,582 (46.4%) | $68,923 |
| 3-Person Families | 623 (18.3%) | $75,625 |
| 4-Person Families | 467 (13.7%) | $72,072 |
| 5-Person Families | 348 (10.2%) | $77,313 |
| 6-Person Families | 261 (7.6%) | $81,763 |
| 7+ Person Families | 130 (3.8%) | $114,583 |
| Total | 3,411 (100.0%) | $75,162 |
Family Income by Number of Earners in Fremont County
The median family income in Fremont County is $75,162, with families comprising 2 earners (1,538) having the highest median family income of $85,938, while families with no earners (643) have the lowest median family income of $47,303, accounting for 45.1% and 18.9% of families, respectively.

| Number of Earners | # Families | Median Income |
| No Earners | 643 (18.9%) | $47,303 |
| 1 Earner | 857 (25.1%) | $58,924 |
| 2 Earners | 1,538 (45.1%) | $85,938 |
| 3+ Earners | 373 (10.9%) | $82,969 |
| Total | 3,411 (100.0%) | $75,162 |
Household Income in Fremont County
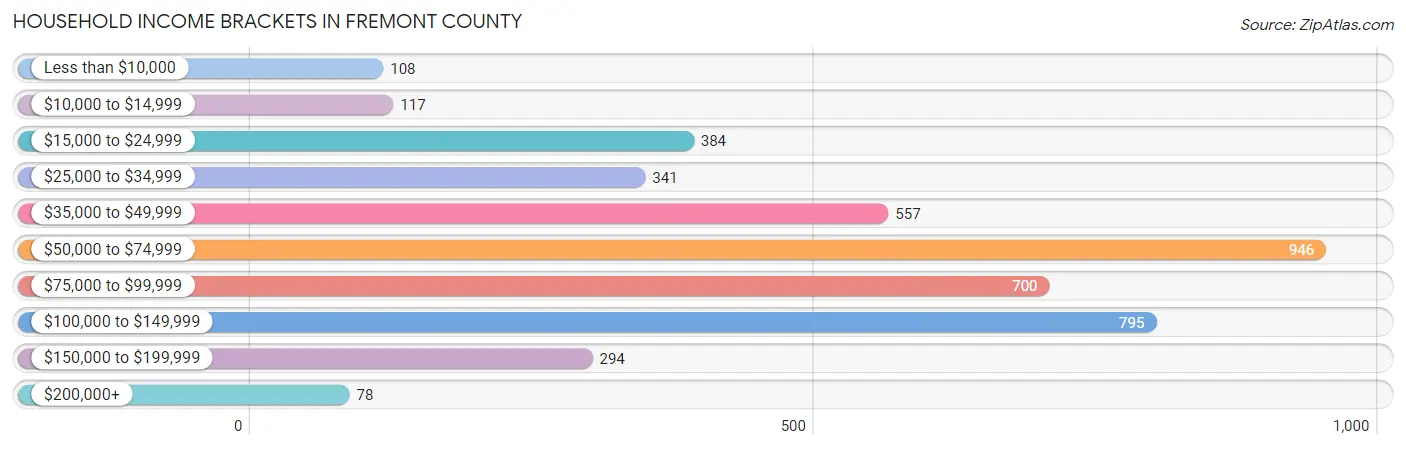
Household Income Brackets in Fremont County
With 946 households falling in the category, the $50,000 to $74,999 income range is the most frequent in Fremont County, accounting for 21.9% of all households. In contrast, only 78 households (1.8%) fall into the $200,000+ income bracket, making it the least populous group.
| Income Bracket | # Households | % Households |
| Less than $10,000 | 108 | 2.5% |
| $10,000 to $14,999 | 117 | 2.7% |
| $15,000 to $24,999 | 384 | 8.9% |
| $25,000 to $34,999 | 341 | 7.9% |
| $35,000 to $49,999 | 557 | 12.9% |
| $50,000 to $74,999 | 946 | 21.9% |
| $75,000 to $99,999 | 700 | 16.2% |
| $100,000 to $149,999 | 795 | 18.4% |
| $150,000 to $199,999 | 294 | 6.8% |
| $200,000+ | 78 | 1.8% |
Household Income by Householder Age in Fremont County
The median household income in Fremont County is $67,015, with the highest median household income of $75,572 found in the 45 to 64 years age bracket for the primary householder. A total of 1,620 households (37.5%) fall into this category. Meanwhile, the 15 to 24 years age bracket for the primary householder has the lowest median household income of $47,500, with 94 households (2.2%) in this group.
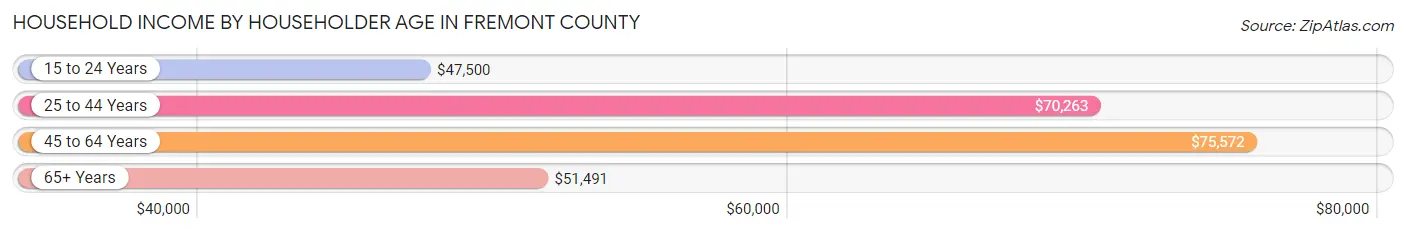
| Income Bracket | # Households | Median Income |
| 15 to 24 Years | 94 (2.2%) | $47,500 |
| 25 to 44 Years | 1,246 (28.8%) | $70,263 |
| 45 to 64 Years | 1,620 (37.5%) | $75,572 |
| 65+ Years | 1,360 (31.5%) | $51,491 |
| Total | 4,320 (100.0%) | $67,015 |
Poverty in Fremont County
Income Below Poverty by Sex and Age in Fremont County
With 8.6% poverty level for males and 14.3% for females among the residents of Fremont County, 16 and 17 year old males and under 5 year old females are the most vulnerable to poverty, with 41 males (19.5%) and 128 females (32.2%) in their respective age groups living below the poverty level.
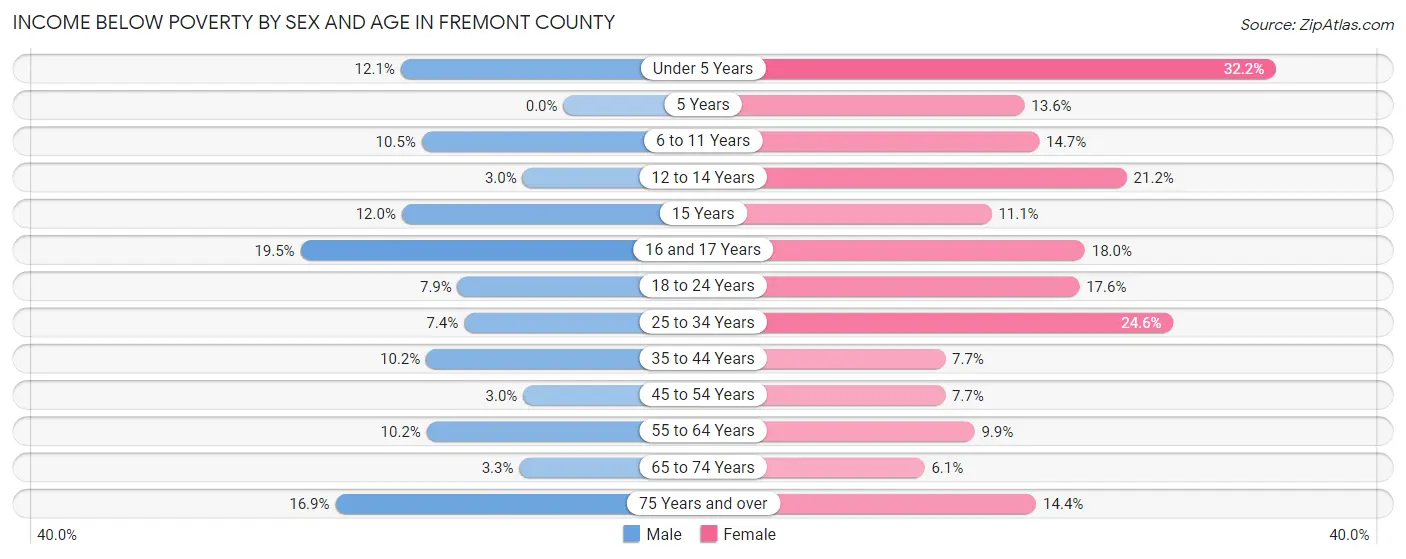
| Age Bracket | Male | Female |
| Under 5 Years | 47 (12.1%) | 128 (32.2%) |
| 5 Years | 0 (0.0%) | 16 (13.6%) |
| 6 to 11 Years | 61 (10.5%) | 75 (14.6%) |
| 12 to 14 Years | 8 (3.0%) | 55 (21.1%) |
| 15 Years | 6 (12.0%) | 11 (11.1%) |
| 16 and 17 Years | 41 (19.5%) | 35 (18.0%) |
| 18 to 24 Years | 43 (7.9%) | 101 (17.6%) |
| 25 to 34 Years | 57 (7.4%) | 195 (24.6%) |
| 35 to 44 Years | 84 (10.2%) | 60 (7.7%) |
| 45 to 54 Years | 23 (3.0%) | 56 (7.7%) |
| 55 to 64 Years | 93 (10.2%) | 77 (9.9%) |
| 65 to 74 Years | 24 (3.3%) | 43 (6.1%) |
| 75 Years and over | 75 (16.9%) | 70 (14.4%) |
| Total | 562 (8.6%) | 922 (14.3%) |
Income Above Poverty by Sex and Age in Fremont County
According to the poverty statistics in Fremont County, males aged 5 years and females aged 65 to 74 years are the age groups that are most secure financially, with 100.0% of males and 93.9% of females in these age groups living above the poverty line.

| Age Bracket | Male | Female |
| Under 5 Years | 342 (87.9%) | 269 (67.8%) |
| 5 Years | 51 (100.0%) | 102 (86.4%) |
| 6 to 11 Years | 519 (89.5%) | 437 (85.4%) |
| 12 to 14 Years | 256 (97.0%) | 205 (78.8%) |
| 15 Years | 44 (88.0%) | 88 (88.9%) |
| 16 and 17 Years | 169 (80.5%) | 159 (82.0%) |
| 18 to 24 Years | 505 (92.1%) | 472 (82.4%) |
| 25 to 34 Years | 716 (92.6%) | 597 (75.4%) |
| 35 to 44 Years | 740 (89.8%) | 722 (92.3%) |
| 45 to 54 Years | 750 (97.0%) | 675 (92.3%) |
| 55 to 64 Years | 823 (89.8%) | 705 (90.1%) |
| 65 to 74 Years | 711 (96.7%) | 657 (93.9%) |
| 75 Years and over | 368 (83.1%) | 415 (85.6%) |
| Total | 5,994 (91.4%) | 5,503 (85.7%) |
Income Below Poverty Among Married-Couple Families in Fremont County
The poverty statistics for married-couple families in Fremont County show that 6.7% or 201 of the total 2,989 families live below the poverty line. Families with 3 or 4 children have the highest poverty rate of 8.6%, comprising of 41 families. On the other hand, families with no children have the lowest poverty rate of 5.6%, which includes 96 families.
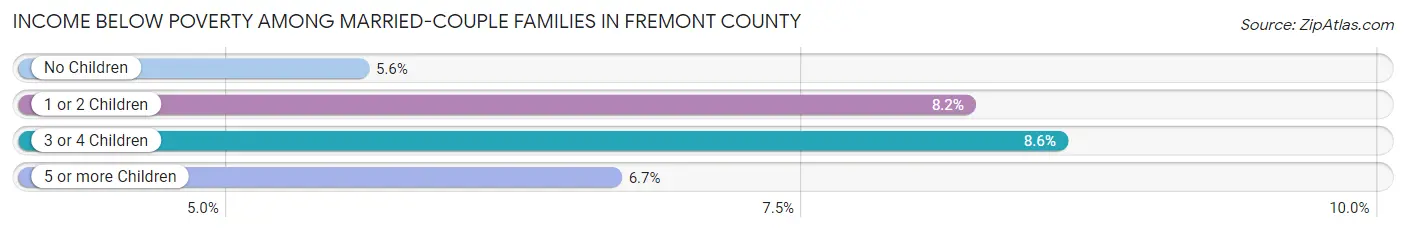
| Children | Above Poverty | Below Poverty |
| No Children | 1,629 (94.4%) | 96 (5.6%) |
| 1 or 2 Children | 682 (91.8%) | 61 (8.2%) |
| 3 or 4 Children | 435 (91.4%) | 41 (8.6%) |
| 5 or more Children | 42 (93.3%) | 3 (6.7%) |
| Total | 2,788 (93.3%) | 201 (6.7%) |
Income Below Poverty Among Single-Parent Households in Fremont County
According to the poverty data in Fremont County, 26.5% or 31 single-father households and 28.8% or 88 single-mother households are living below the poverty line. Among single-father households, those with 3 or 4 children have the highest poverty rate, with 9 households (100.0%) experiencing poverty. Likewise, among single-mother households, those with 5 or more children have the highest poverty rate, with 5 households (100.0%) falling below the poverty line.
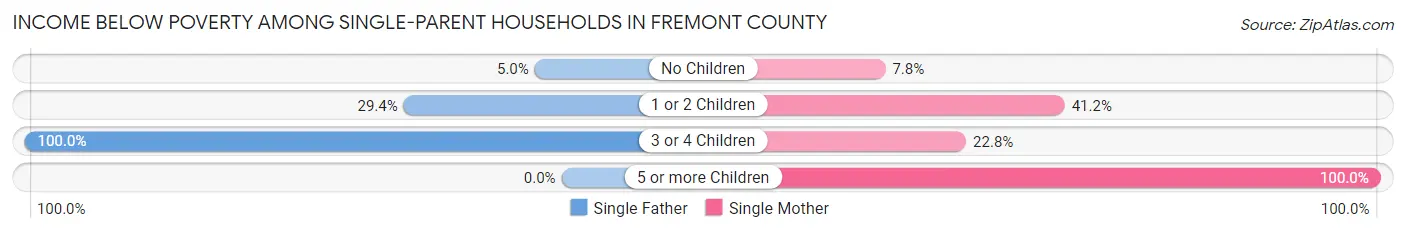
| Children | Single Father | Single Mother |
| No Children | 2 (5.0%) | 7 (7.8%) |
| 1 or 2 Children | 20 (29.4%) | 63 (41.2%) |
| 3 or 4 Children | 9 (100.0%) | 13 (22.8%) |
| 5 or more Children | 0 (0.0%) | 5 (100.0%) |
| Total | 31 (26.5%) | 88 (28.8%) |
Income Below Poverty Among Married-Couple vs Single-Parent Households in Fremont County
The poverty data for Fremont County shows that 201 of the married-couple family households (6.7%) and 119 of the single-parent households (28.2%) are living below the poverty level. Within the married-couple family households, those with 3 or 4 children have the highest poverty rate, with 41 households (8.6%) falling below the poverty line. Among the single-parent households, those with 5 or more children have the highest poverty rate, with 5 household (100.0%) living below poverty.
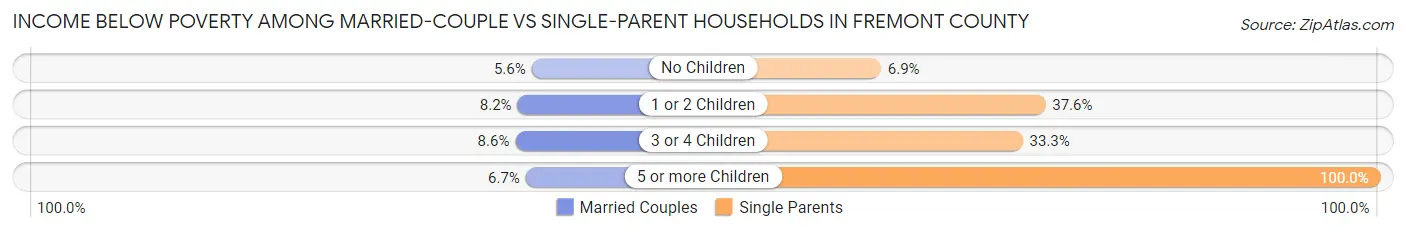
| Children | Married-Couple Families | Single-Parent Households |
| No Children | 96 (5.6%) | 9 (6.9%) |
| 1 or 2 Children | 61 (8.2%) | 83 (37.6%) |
| 3 or 4 Children | 41 (8.6%) | 22 (33.3%) |
| 5 or more Children | 3 (6.7%) | 5 (100.0%) |
| Total | 201 (6.7%) | 119 (28.2%) |
Employment Characteristics in Fremont County
Employment by Class of Employer in Fremont County
Among the 5,718 employed individuals in Fremont County, private company employees (3,535 | 61.8%), local government employees (541 | 9.5%), and self-employed (not incorporated) (405 | 7.1%) make up the most common classes of employment.
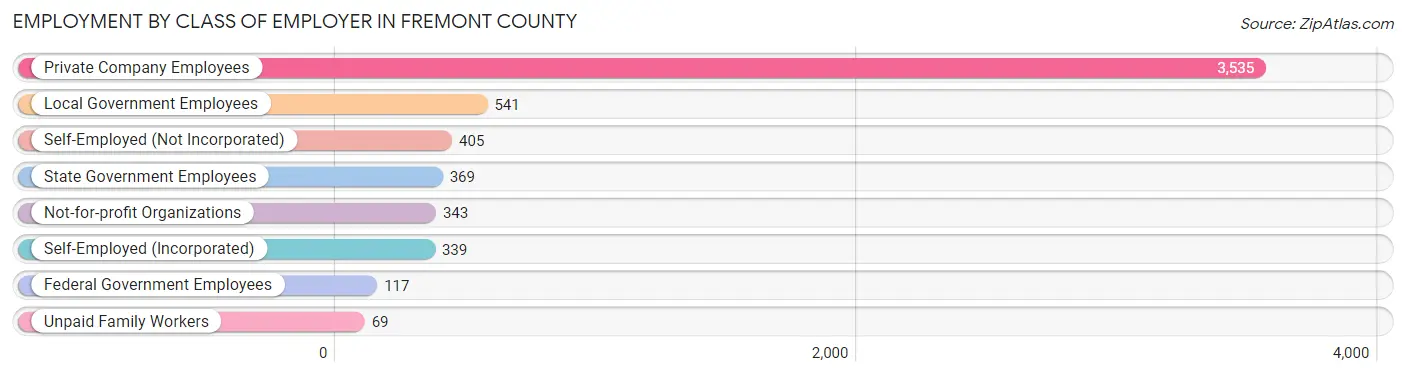
| Employer Class | # Employees | % Employees |
| Private Company Employees | 3,535 | 61.8% |
| Self-Employed (Incorporated) | 339 | 5.9% |
| Self-Employed (Not Incorporated) | 405 | 7.1% |
| Not-for-profit Organizations | 343 | 6.0% |
| Local Government Employees | 541 | 9.5% |
| State Government Employees | 369 | 6.5% |
| Federal Government Employees | 117 | 2.1% |
| Unpaid Family Workers | 69 | 1.2% |
| Total | 5,718 | 100.0% |
Employment Status by Age in Fremont County
According to the labor force statistics for Fremont County, out of the total population over 16 years of age (10,701), 56.8% or 6,078 individuals are in the labor force, with 4.5% or 274 of them unemployed. The age group with the highest labor force participation rate is 30 to 34 years, with 79.8% or 668 individuals in the labor force. Within the labor force, the 16 to 19 years age range has the highest percentage of unemployed individuals, with 12.8% or 52 of them being unemployed.

| Age Bracket | In Labor Force | Unemployed |
| 16 to 19 Years | 406 (48.9%) | 52 (12.8%) |
| 20 to 24 Years | 638 (78.8%) | 59 (9.2%) |
| 25 to 29 Years | 552 (64.6%) | 36 (6.5%) |
| 30 to 34 Years | 668 (79.8%) | 11 (1.6%) |
| 35 to 44 Years | 1,229 (72.1%) | 22 (1.8%) |
| 45 to 54 Years | 1,138 (73.2%) | 55 (4.8%) |
| 55 to 59 Years | 562 (64.1%) | 29 (5.2%) |
| 60 to 64 Years | 541 (64.9%) | 5 (0.9%) |
| 65 to 74 Years | 261 (18.1%) | 0 (0.0%) |
| 75 Years and over | 79 (8.2%) | 6 (7.6%) |
| Total | 6,078 (56.8%) | 274 (4.5%) |
Employment Status by Educational Attainment in Fremont County
According to labor force statistics for Fremont County, 70.4% of individuals (4,689) out of the total population between 25 and 64 years of age (6,660) are in the labor force, with 3.4% or 159 of them being unemployed. The group with the highest labor force participation rate are those with the educational attainment of bachelor's degree or higher, with 88.6% or 1,111 individuals in the labor force. Within the labor force, individuals with high school diploma education have the highest percentage of unemployment, with 6.9% or 91 of them being unemployed.
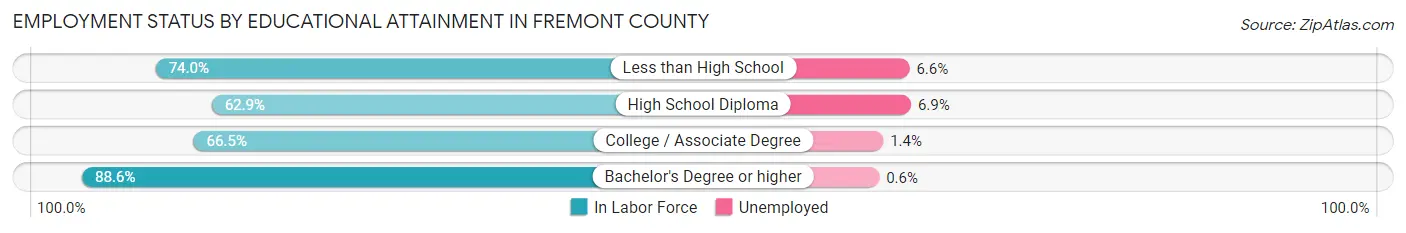
| Educational Attainment | In Labor Force | Unemployed |
| Less than High School | 558 (74.0%) | 50 (6.6%) |
| High School Diploma | 1,316 (62.9%) | 144 (6.9%) |
| College / Associate Degree | 1,702 (66.5%) | 36 (1.4%) |
| Bachelor's Degree or higher | 1,111 (88.6%) | 8 (0.6%) |
| Total | 4,689 (70.4%) | 226 (3.4%) |
Employment Occupations by Sex in Fremont County
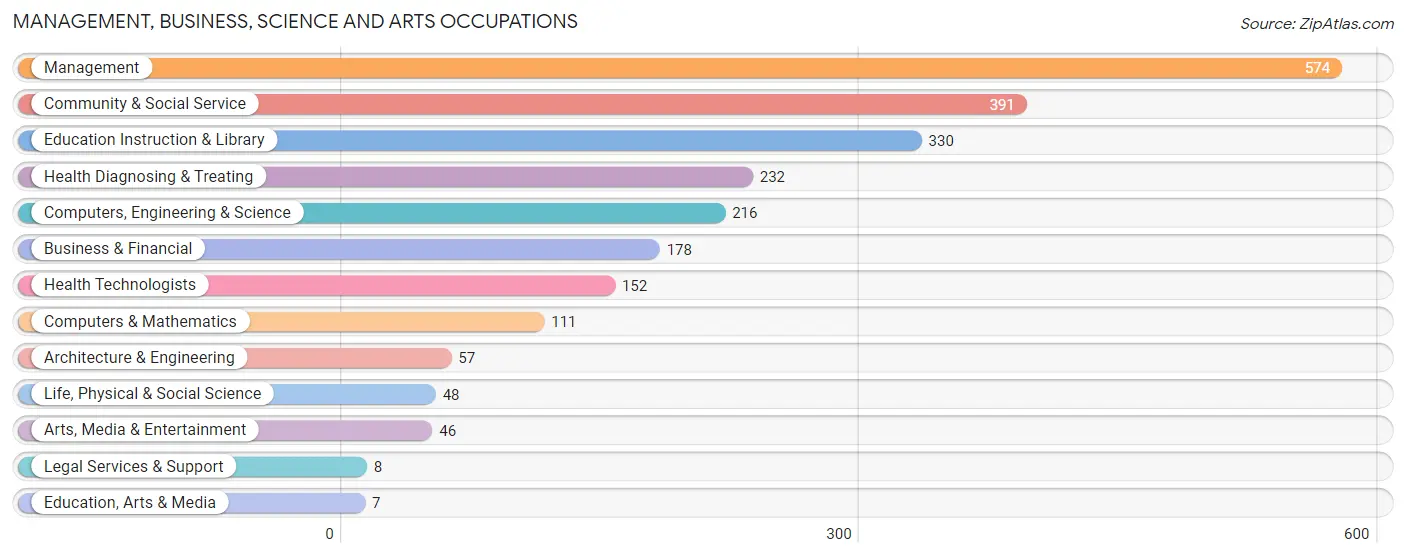
Management, Business, Science and Arts Occupations
The most common Management, Business, Science and Arts occupations in Fremont County are Management (574 | 9.9%), Community & Social Service (391 | 6.7%), Education Instruction & Library (330 | 5.7%), Health Diagnosing & Treating (232 | 4.0%), and Computers, Engineering & Science (216 | 3.7%).
Management, Business, Science and Arts Occupations by Sex
Within the Management, Business, Science and Arts occupations in Fremont County, the most male-oriented occupations are Computers & Mathematics (100.0%), Architecture & Engineering (100.0%), and Computers, Engineering & Science (98.6%), while the most female-oriented occupations are Education, Arts & Media (100.0%), Legal Services & Support (100.0%), and Health Technologists (84.9%).
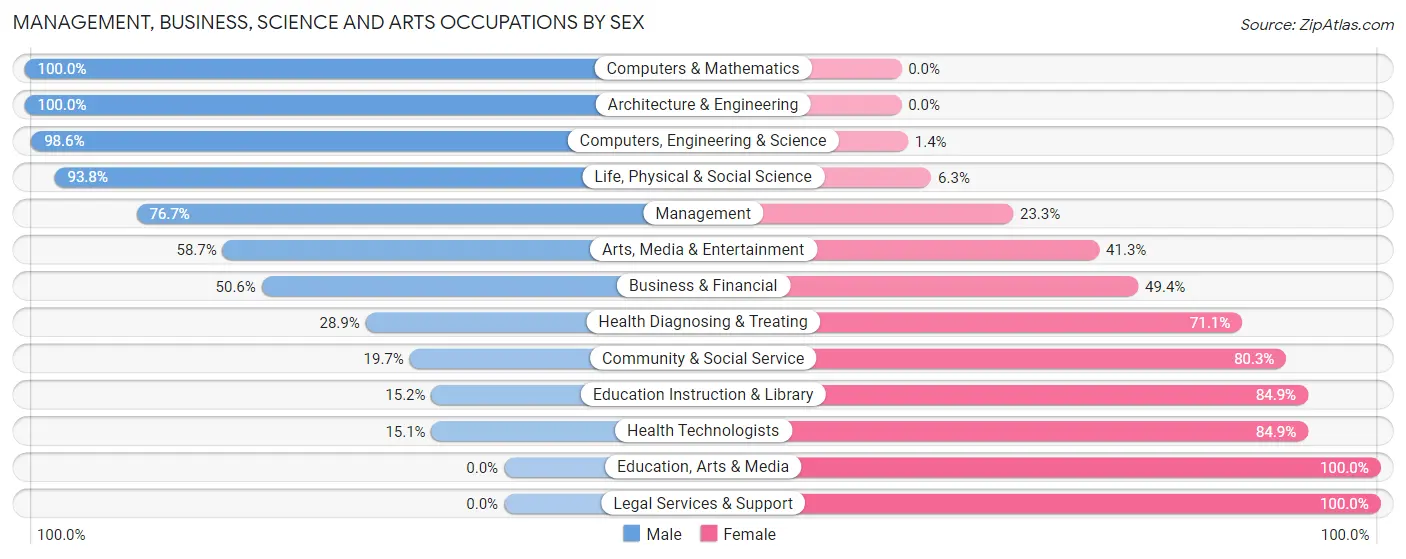
| Occupation | Male | Female |
| Management | 440 (76.7%) | 134 (23.3%) |
| Business & Financial | 90 (50.6%) | 88 (49.4%) |
| Computers, Engineering & Science | 213 (98.6%) | 3 (1.4%) |
| Computers & Mathematics | 111 (100.0%) | 0 (0.0%) |
| Architecture & Engineering | 57 (100.0%) | 0 (0.0%) |
| Life, Physical & Social Science | 45 (93.8%) | 3 (6.2%) |
| Community & Social Service | 77 (19.7%) | 314 (80.3%) |
| Education, Arts & Media | 0 (0.0%) | 7 (100.0%) |
| Legal Services & Support | 0 (0.0%) | 8 (100.0%) |
| Education Instruction & Library | 50 (15.1%) | 280 (84.9%) |
| Arts, Media & Entertainment | 27 (58.7%) | 19 (41.3%) |
| Health Diagnosing & Treating | 67 (28.9%) | 165 (71.1%) |
| Health Technologists | 23 (15.1%) | 129 (84.9%) |
| Total (Category) | 887 (55.7%) | 704 (44.3%) |
| Total (Overall) | 3,375 (58.2%) | 2,423 (41.8%) |
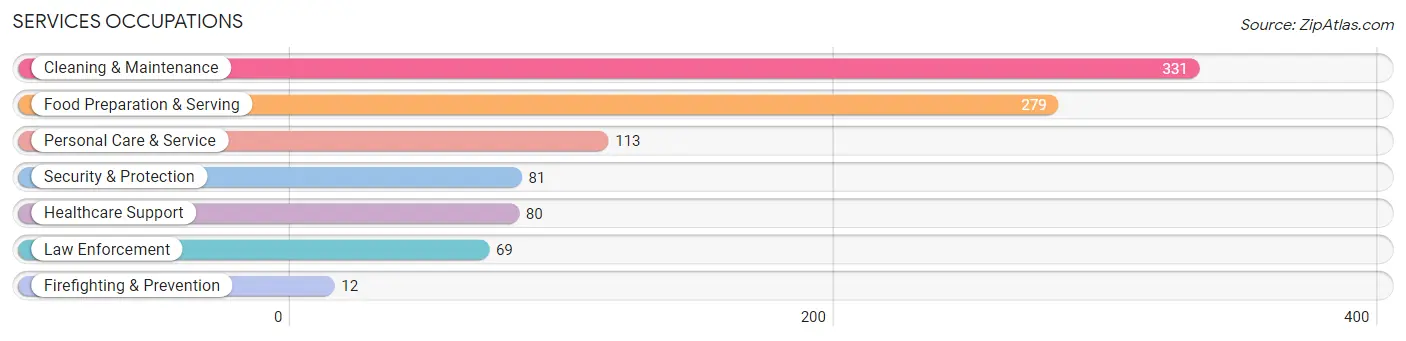
Services Occupations
The most common Services occupations in Fremont County are Cleaning & Maintenance (331 | 5.7%), Food Preparation & Serving (279 | 4.8%), Personal Care & Service (113 | 1.9%), Security & Protection (81 | 1.4%), and Healthcare Support (80 | 1.4%).
Services Occupations by Sex
Within the Services occupations in Fremont County, the most male-oriented occupations are Security & Protection (100.0%), Firefighting & Prevention (100.0%), and Law Enforcement (100.0%), while the most female-oriented occupations are Personal Care & Service (71.7%), Food Preparation & Serving (69.2%), and Healthcare Support (67.5%).
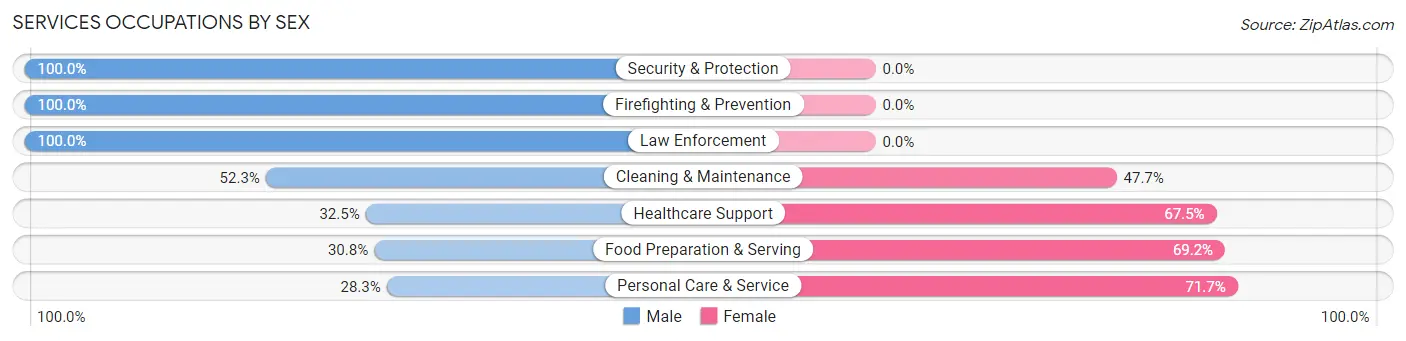
| Occupation | Male | Female |
| Healthcare Support | 26 (32.5%) | 54 (67.5%) |
| Security & Protection | 81 (100.0%) | 0 (0.0%) |
| Firefighting & Prevention | 12 (100.0%) | 0 (0.0%) |
| Law Enforcement | 69 (100.0%) | 0 (0.0%) |
| Food Preparation & Serving | 86 (30.8%) | 193 (69.2%) |
| Cleaning & Maintenance | 173 (52.3%) | 158 (47.7%) |
| Personal Care & Service | 32 (28.3%) | 81 (71.7%) |
| Total (Category) | 398 (45.0%) | 486 (55.0%) |
| Total (Overall) | 3,375 (58.2%) | 2,423 (41.8%) |
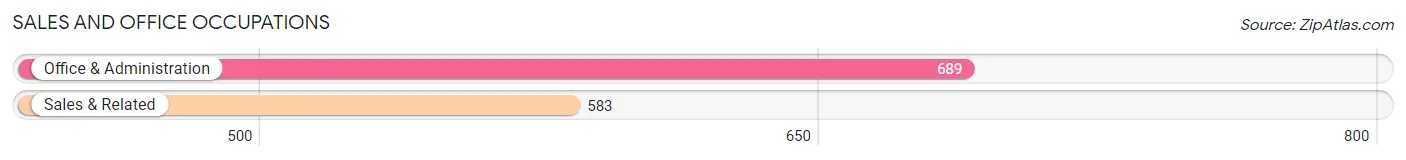
Sales and Office Occupations
The most common Sales and Office occupations in Fremont County are Office & Administration (689 | 11.9%), and Sales & Related (583 | 10.1%).
Sales and Office Occupations by Sex
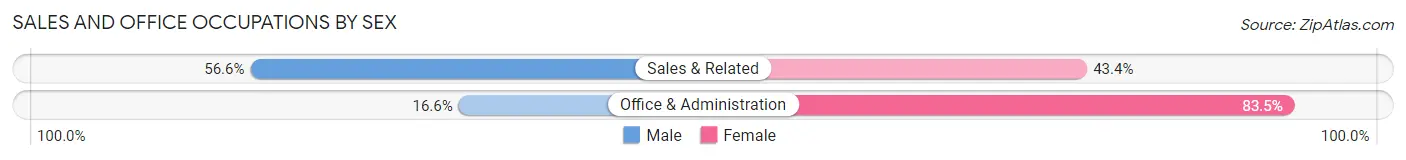
| Occupation | Male | Female |
| Sales & Related | 330 (56.6%) | 253 (43.4%) |
| Office & Administration | 114 (16.6%) | 575 (83.5%) |
| Total (Category) | 444 (34.9%) | 828 (65.1%) |
| Total (Overall) | 3,375 (58.2%) | 2,423 (41.8%) |
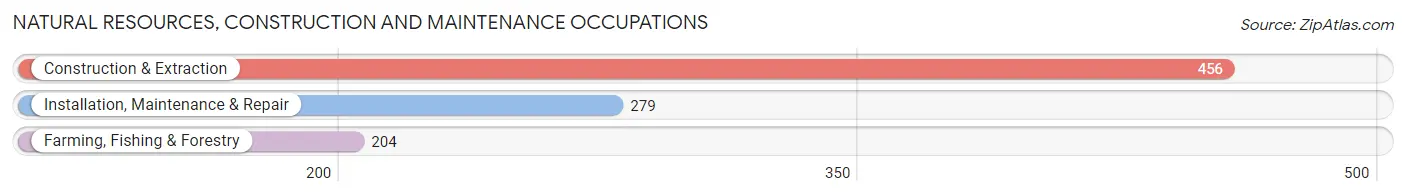
Natural Resources, Construction and Maintenance Occupations
The most common Natural Resources, Construction and Maintenance occupations in Fremont County are Construction & Extraction (456 | 7.9%), Installation, Maintenance & Repair (279 | 4.8%), and Farming, Fishing & Forestry (204 | 3.5%).
Natural Resources, Construction and Maintenance Occupations by Sex
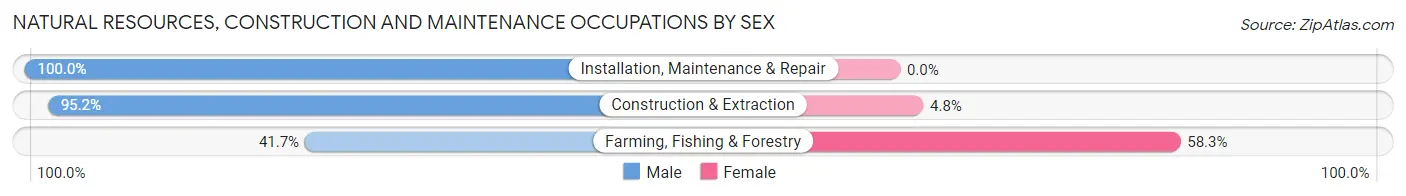
| Occupation | Male | Female |
| Farming, Fishing & Forestry | 85 (41.7%) | 119 (58.3%) |
| Construction & Extraction | 434 (95.2%) | 22 (4.8%) |
| Installation, Maintenance & Repair | 279 (100.0%) | 0 (0.0%) |
| Total (Category) | 798 (85.0%) | 141 (15.0%) |
| Total (Overall) | 3,375 (58.2%) | 2,423 (41.8%) |
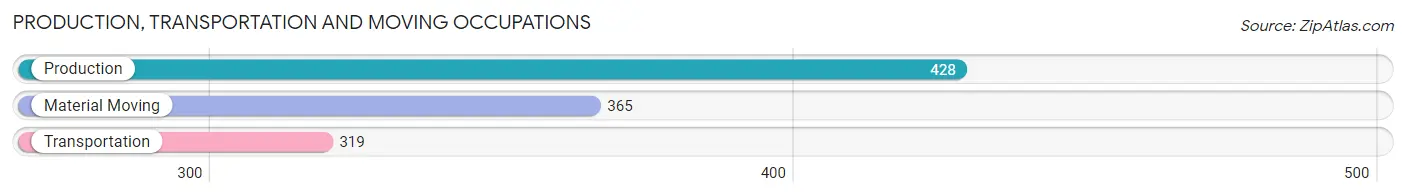
Production, Transportation and Moving Occupations
The most common Production, Transportation and Moving occupations in Fremont County are Production (428 | 7.4%), Material Moving (365 | 6.3%), and Transportation (319 | 5.5%).
Production, Transportation and Moving Occupations by Sex

| Occupation | Male | Female |
| Production | 260 (60.8%) | 168 (39.3%) |
| Transportation | 268 (84.0%) | 51 (16.0%) |
| Material Moving | 320 (87.7%) | 45 (12.3%) |
| Total (Category) | 848 (76.3%) | 264 (23.7%) |
| Total (Overall) | 3,375 (58.2%) | 2,423 (41.8%) |
Employment Industries by Sex in Fremont County
Employment Industries in Fremont County
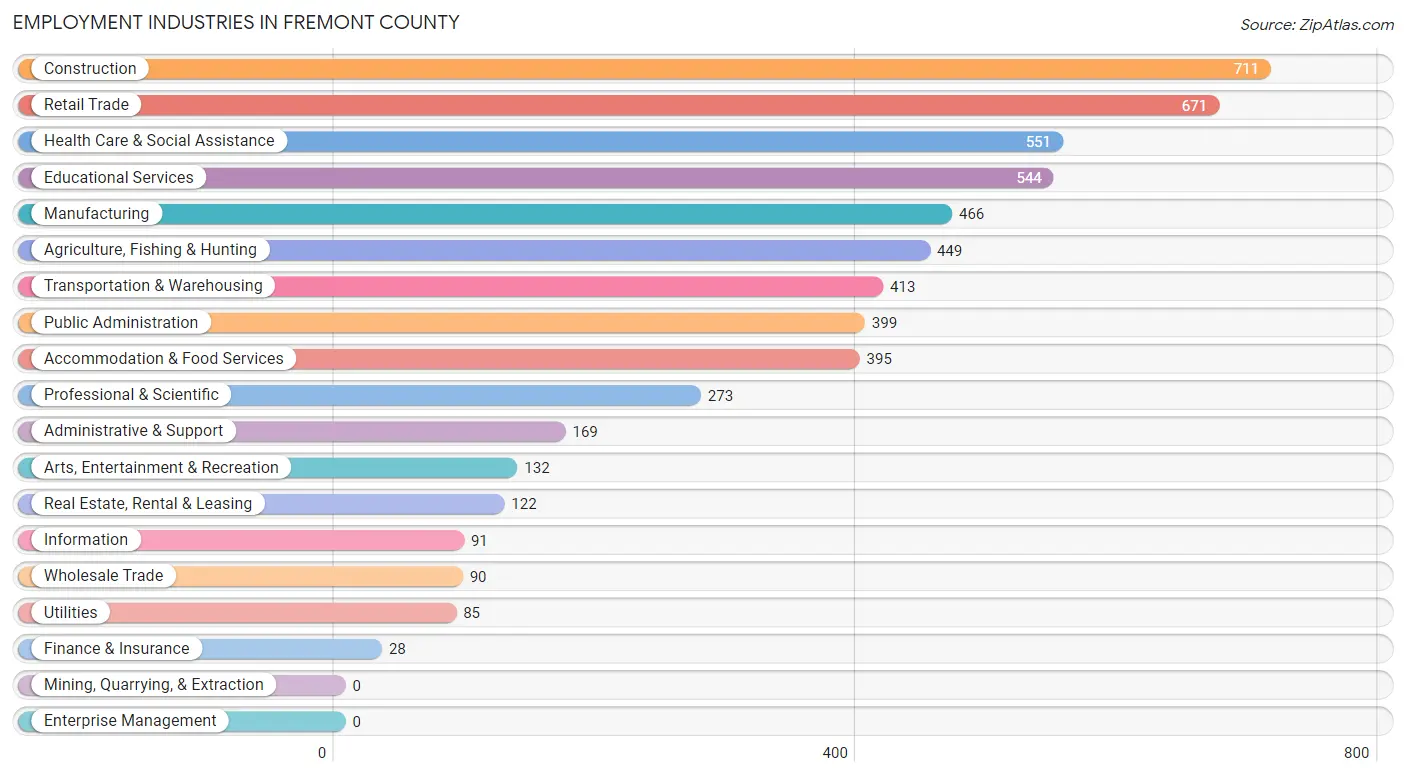
The major employment industries in Fremont County include Construction (711 | 12.3%), Retail Trade (671 | 11.6%), Health Care & Social Assistance (551 | 9.5%), Educational Services (544 | 9.4%), and Manufacturing (466 | 8.0%).
Employment Industries by Sex in Fremont County
The Fremont County industries that see more men than women are Transportation & Warehousing (90.6%), Construction (89.9%), and Wholesale Trade (85.6%), whereas the industries that tend to have a higher number of women are Information (84.6%), Educational Services (75.9%), and Health Care & Social Assistance (74.2%).
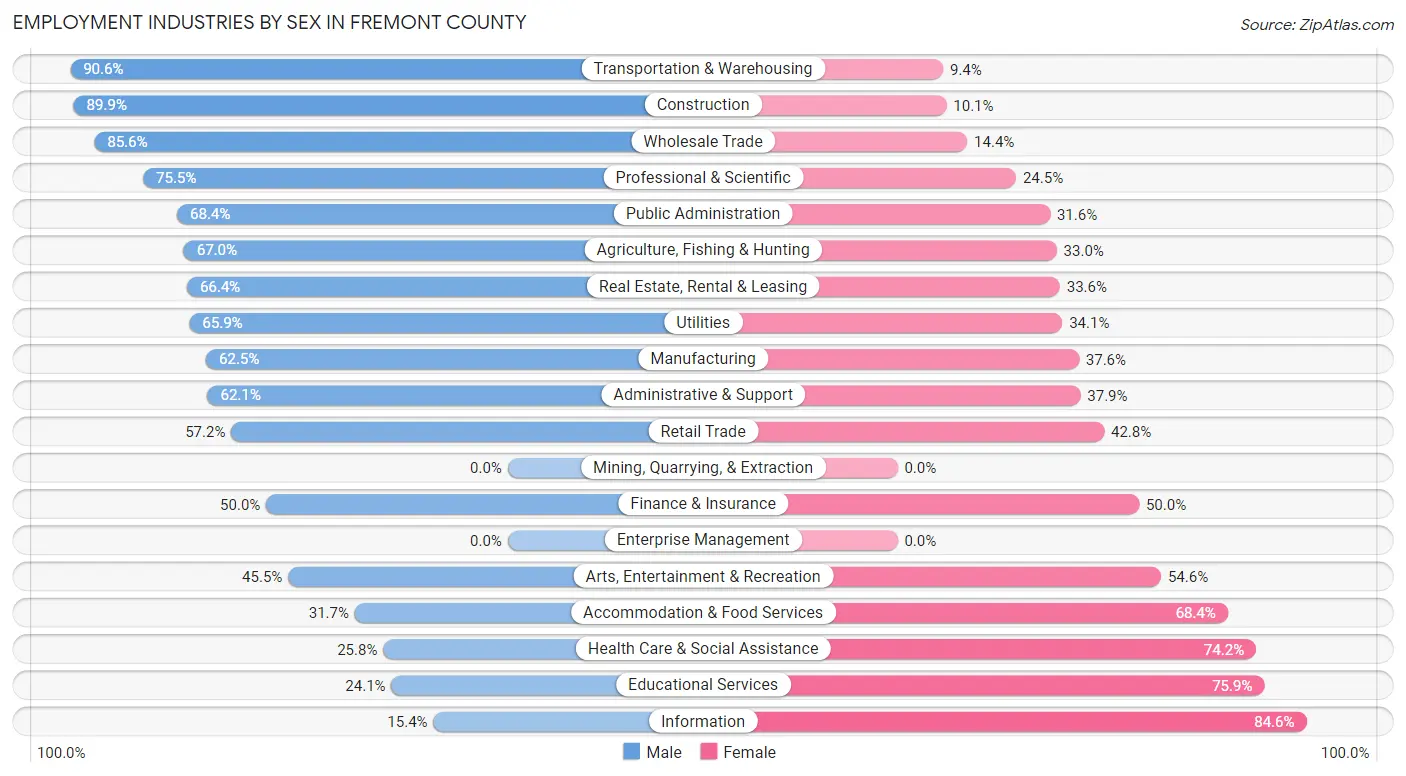
| Industry | Male | Female |
| Agriculture, Fishing & Hunting | 301 (67.0%) | 148 (33.0%) |
| Mining, Quarrying, & Extraction | 0 (0.0%) | 0 (0.0%) |
| Construction | 639 (89.9%) | 72 (10.1%) |
| Manufacturing | 291 (62.5%) | 175 (37.6%) |
| Wholesale Trade | 77 (85.6%) | 13 (14.4%) |
| Retail Trade | 384 (57.2%) | 287 (42.8%) |
| Transportation & Warehousing | 374 (90.6%) | 39 (9.4%) |
| Utilities | 56 (65.9%) | 29 (34.1%) |
| Information | 14 (15.4%) | 77 (84.6%) |
| Finance & Insurance | 14 (50.0%) | 14 (50.0%) |
| Real Estate, Rental & Leasing | 81 (66.4%) | 41 (33.6%) |
| Professional & Scientific | 206 (75.5%) | 67 (24.5%) |
| Enterprise Management | 0 (0.0%) | 0 (0.0%) |
| Administrative & Support | 105 (62.1%) | 64 (37.9%) |
| Educational Services | 131 (24.1%) | 413 (75.9%) |
| Health Care & Social Assistance | 142 (25.8%) | 409 (74.2%) |
| Arts, Entertainment & Recreation | 60 (45.5%) | 72 (54.5%) |
| Accommodation & Food Services | 125 (31.7%) | 270 (68.3%) |
| Public Administration | 273 (68.4%) | 126 (31.6%) |
| Total | 3,375 (58.2%) | 2,423 (41.8%) |
Education in Fremont County
School Enrollment in Fremont County
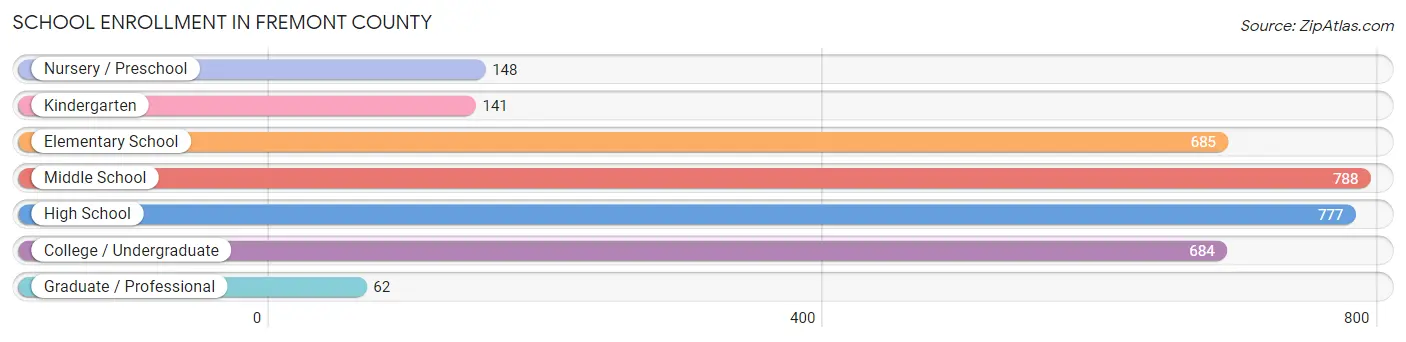
The most common levels of schooling among the 3,285 students in Fremont County are middle school (788 | 24.0%), high school (777 | 23.6%), and elementary school (685 | 20.8%).
| School Level | # Students | % Students |
| Nursery / Preschool | 148 | 4.5% |
| Kindergarten | 141 | 4.3% |
| Elementary School | 685 | 20.8% |
| Middle School | 788 | 24.0% |
| High School | 777 | 23.6% |
| College / Undergraduate | 684 | 20.8% |
| Graduate / Professional | 62 | 1.9% |
| Total | 3,285 | 100.0% |
School Enrollment by Age by Funding Source in Fremont County
Out of a total of 3,285 students who are enrolled in schools in Fremont County, 558 (17.0%) attend a private institution, while the remaining 2,727 (83.0%) are enrolled in public schools. The age group of 20 to 24 year olds has the highest likelihood of being enrolled in private schools, with 171 (61.5% in the age bracket) enrolled. Conversely, the age group of 10 to 14 year olds has the lowest likelihood of being enrolled in a private school, with 933 (98.4% in the age bracket) attending a public institution.

| Age Bracket | Public School | Private School |
| 3 to 4 Year Olds | 48 (69.6%) | 21 (30.4%) |
| 5 to 9 Year Old | 767 (92.9%) | 59 (7.1%) |
| 10 to 14 Year Olds | 933 (98.4%) | 15 (1.6%) |
| 15 to 17 Year Olds | 554 (89.1%) | 68 (10.9%) |
| 18 to 19 Year Olds | 100 (80.6%) | 24 (19.4%) |
| 20 to 24 Year Olds | 107 (38.5%) | 171 (61.5%) |
| 25 to 34 Year Olds | 150 (48.4%) | 160 (51.6%) |
| 35 Years and over | 68 (63.0%) | 40 (37.0%) |
| Total | 2,727 (83.0%) | 558 (17.0%) |
Educational Attainment by Field of Study in Fremont County
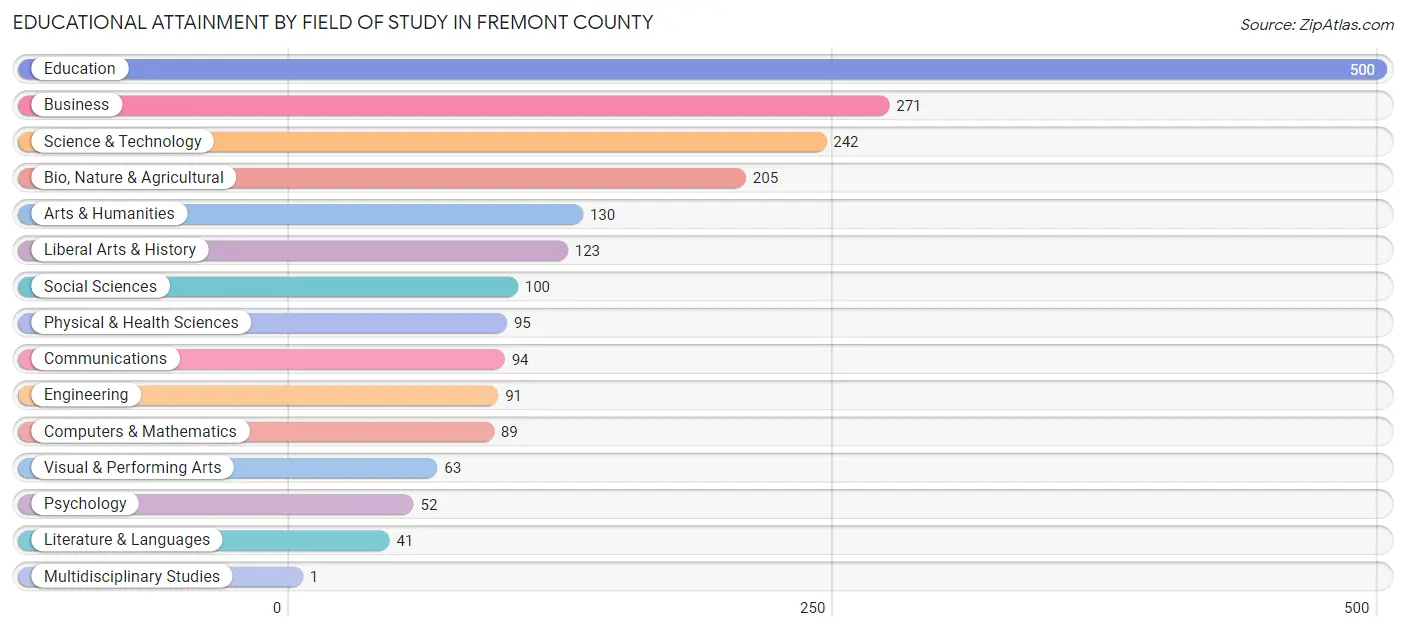
Education (500 | 23.8%), business (271 | 12.9%), science & technology (242 | 11.5%), bio, nature & agricultural (205 | 9.8%), and arts & humanities (130 | 6.2%) are the most common fields of study among 2,097 individuals in Fremont County who have obtained a bachelor's degree or higher.
| Field of Study | # Graduates | % Graduates |
| Computers & Mathematics | 89 | 4.2% |
| Bio, Nature & Agricultural | 205 | 9.8% |
| Physical & Health Sciences | 95 | 4.5% |
| Psychology | 52 | 2.5% |
| Social Sciences | 100 | 4.8% |
| Engineering | 91 | 4.3% |
| Multidisciplinary Studies | 1 | 0.1% |
| Science & Technology | 242 | 11.5% |
| Business | 271 | 12.9% |
| Education | 500 | 23.8% |
| Literature & Languages | 41 | 2.0% |
| Liberal Arts & History | 123 | 5.9% |
| Visual & Performing Arts | 63 | 3.0% |
| Communications | 94 | 4.5% |
| Arts & Humanities | 130 | 6.2% |
| Total | 2,097 | 100.0% |
Transportation & Commute in Fremont County
Vehicle Availability by Sex in Fremont County
The most prevalent vehicle ownership categories in Fremont County are males with 4 vehicles (848, accounting for 25.5%) and females with 4 vehicles (750, making up 35.6%).
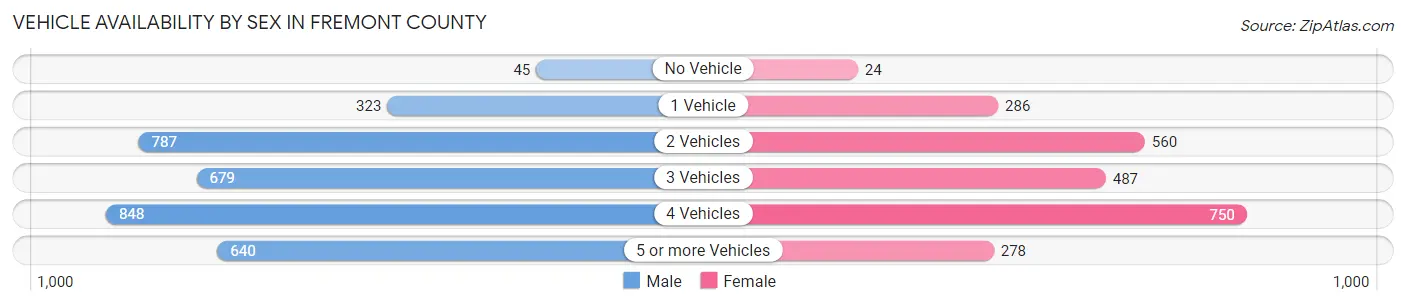
| Vehicles Available | Male | Female |
| No Vehicle | 45 (1.3%) | 24 (1.0%) |
| 1 Vehicle | 323 (9.7%) | 286 (12.0%) |
| 2 Vehicles | 787 (23.7%) | 560 (23.5%) |
| 3 Vehicles | 679 (20.4%) | 487 (20.4%) |
| 4 Vehicles | 848 (25.5%) | 750 (31.5%) |
| 5 or more Vehicles | 640 (19.3%) | 278 (11.7%) |
| Total | 3,322 (100.0%) | 2,385 (100.0%) |
Commute Time in Fremont County
The most frequently occuring commute durations in Fremont County are 15 to 19 minutes (957 commuters, 18.5%), 10 to 14 minutes (800 commuters, 15.5%), and less than 5 minutes (565 commuters, 11.0%).
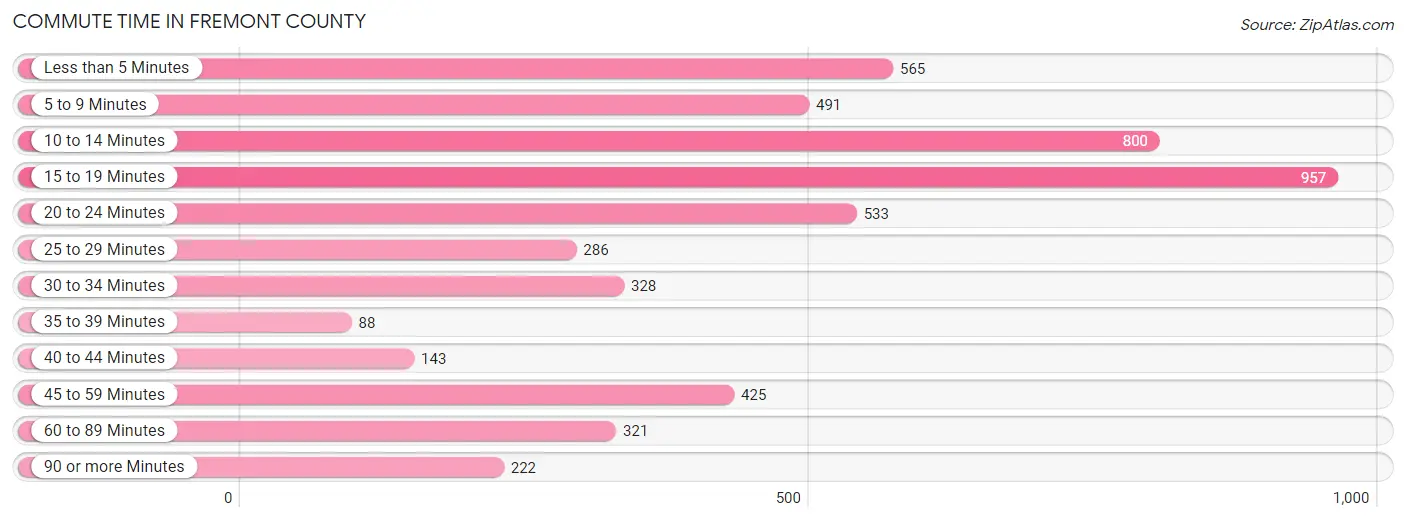
| Commute Time | # Commuters | % Commuters |
| Less than 5 Minutes | 565 | 11.0% |
| 5 to 9 Minutes | 491 | 9.5% |
| 10 to 14 Minutes | 800 | 15.5% |
| 15 to 19 Minutes | 957 | 18.5% |
| 20 to 24 Minutes | 533 | 10.3% |
| 25 to 29 Minutes | 286 | 5.5% |
| 30 to 34 Minutes | 328 | 6.4% |
| 35 to 39 Minutes | 88 | 1.7% |
| 40 to 44 Minutes | 143 | 2.8% |
| 45 to 59 Minutes | 425 | 8.2% |
| 60 to 89 Minutes | 321 | 6.2% |
| 90 or more Minutes | 222 | 4.3% |
Commute Time by Sex in Fremont County
The most common commute times in Fremont County are 15 to 19 minutes (556 commuters, 18.3%) for males and 15 to 19 minutes (401 commuters, 18.9%) for females.
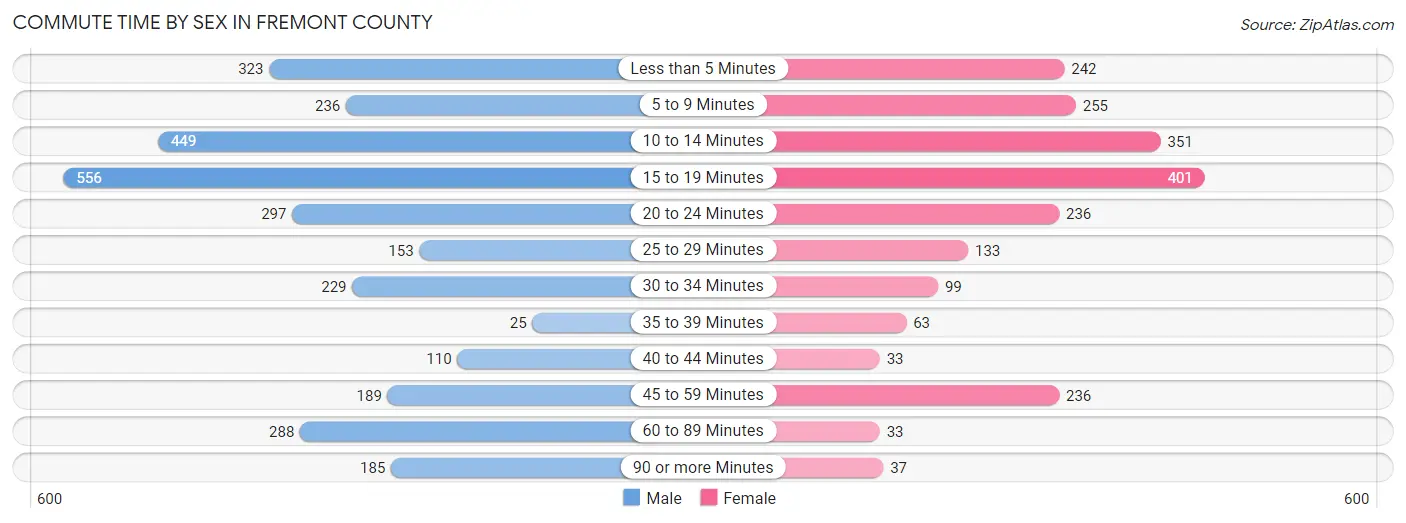
| Commute Time | Male | Female |
| Less than 5 Minutes | 323 (10.6%) | 242 (11.4%) |
| 5 to 9 Minutes | 236 (7.8%) | 255 (12.0%) |
| 10 to 14 Minutes | 449 (14.8%) | 351 (16.6%) |
| 15 to 19 Minutes | 556 (18.3%) | 401 (18.9%) |
| 20 to 24 Minutes | 297 (9.8%) | 236 (11.1%) |
| 25 to 29 Minutes | 153 (5.0%) | 133 (6.3%) |
| 30 to 34 Minutes | 229 (7.5%) | 99 (4.7%) |
| 35 to 39 Minutes | 25 (0.8%) | 63 (3.0%) |
| 40 to 44 Minutes | 110 (3.6%) | 33 (1.6%) |
| 45 to 59 Minutes | 189 (6.2%) | 236 (11.1%) |
| 60 to 89 Minutes | 288 (9.5%) | 33 (1.6%) |
| 90 or more Minutes | 185 (6.1%) | 37 (1.8%) |
Time of Departure to Work by Sex in Fremont County
The most frequent times of departure to work in Fremont County are 7:00 AM to 7:29 AM (695, 22.9%) for males and 7:30 AM to 7:59 AM (518, 24.4%) for females.
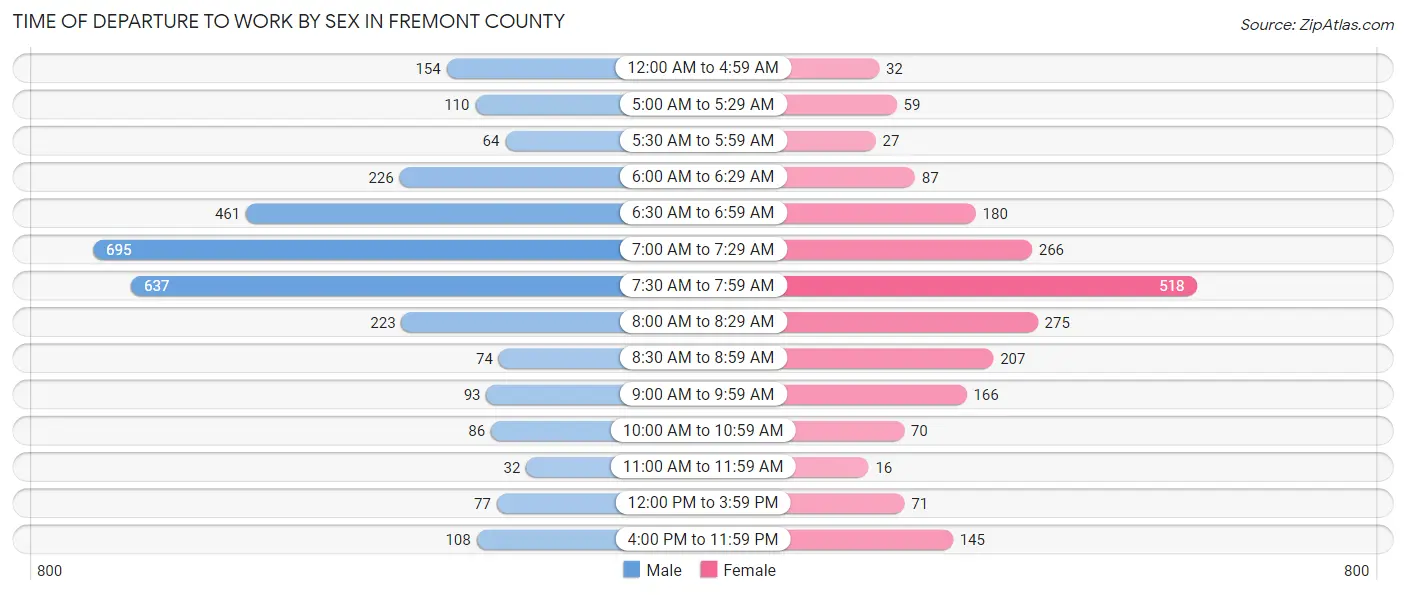
| Time of Departure | Male | Female |
| 12:00 AM to 4:59 AM | 154 (5.1%) | 32 (1.5%) |
| 5:00 AM to 5:29 AM | 110 (3.6%) | 59 (2.8%) |
| 5:30 AM to 5:59 AM | 64 (2.1%) | 27 (1.3%) |
| 6:00 AM to 6:29 AM | 226 (7.4%) | 87 (4.1%) |
| 6:30 AM to 6:59 AM | 461 (15.2%) | 180 (8.5%) |
| 7:00 AM to 7:29 AM | 695 (22.9%) | 266 (12.6%) |
| 7:30 AM to 7:59 AM | 637 (20.9%) | 518 (24.4%) |
| 8:00 AM to 8:29 AM | 223 (7.3%) | 275 (13.0%) |
| 8:30 AM to 8:59 AM | 74 (2.4%) | 207 (9.8%) |
| 9:00 AM to 9:59 AM | 93 (3.1%) | 166 (7.8%) |
| 10:00 AM to 10:59 AM | 86 (2.8%) | 70 (3.3%) |
| 11:00 AM to 11:59 AM | 32 (1.1%) | 16 (0.8%) |
| 12:00 PM to 3:59 PM | 77 (2.5%) | 71 (3.4%) |
| 4:00 PM to 11:59 PM | 108 (3.5%) | 145 (6.8%) |
| Total | 3,040 (100.0%) | 2,119 (100.0%) |
Housing Occupancy in Fremont County
Occupancy by Ownership in Fremont County
Of the total 4,320 dwellings in Fremont County, owner-occupied units account for 3,625 (83.9%), while renter-occupied units make up 695 (16.1%).
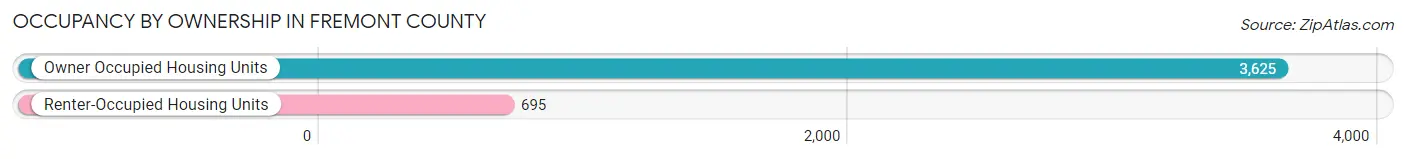
| Occupancy | # Housing Units | % Housing Units |
| Owner Occupied Housing Units | 3,625 | 83.9% |
| Renter-Occupied Housing Units | 695 | 16.1% |
| Total Occupied Housing Units | 4,320 | 100.0% |
Occupancy by Household Size in Fremont County
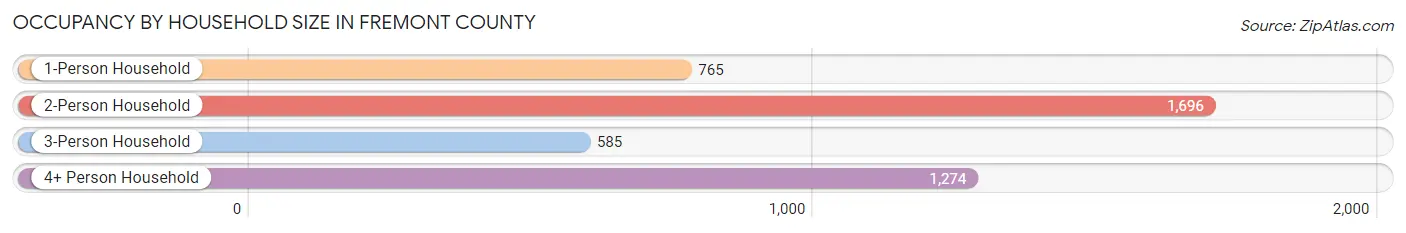
| Household Size | # Housing Units | % Housing Units |
| 1-Person Household | 765 | 17.7% |
| 2-Person Household | 1,696 | 39.3% |
| 3-Person Household | 585 | 13.5% |
| 4+ Person Household | 1,274 | 29.5% |
| Total Housing Units | 4,320 | 100.0% |
Occupancy by Ownership by Household Size in Fremont County
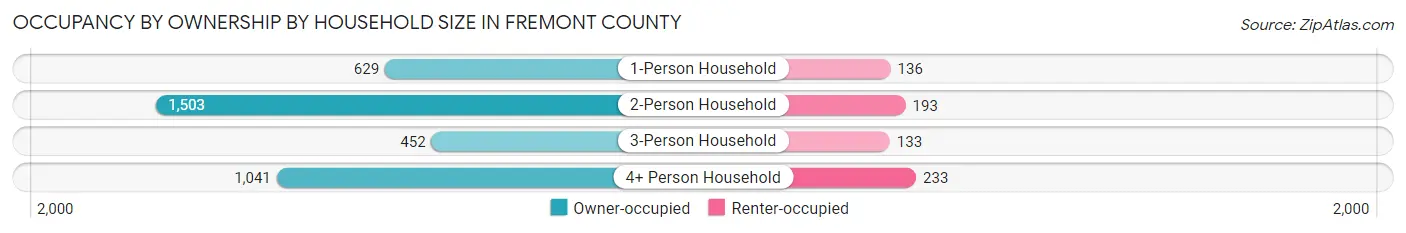
| Household Size | Owner-occupied | Renter-occupied |
| 1-Person Household | 629 (82.2%) | 136 (17.8%) |
| 2-Person Household | 1,503 (88.6%) | 193 (11.4%) |
| 3-Person Household | 452 (77.3%) | 133 (22.7%) |
| 4+ Person Household | 1,041 (81.7%) | 233 (18.3%) |
| Total Housing Units | 3,625 (83.9%) | 695 (16.1%) |
Occupancy by Educational Attainment in Fremont County
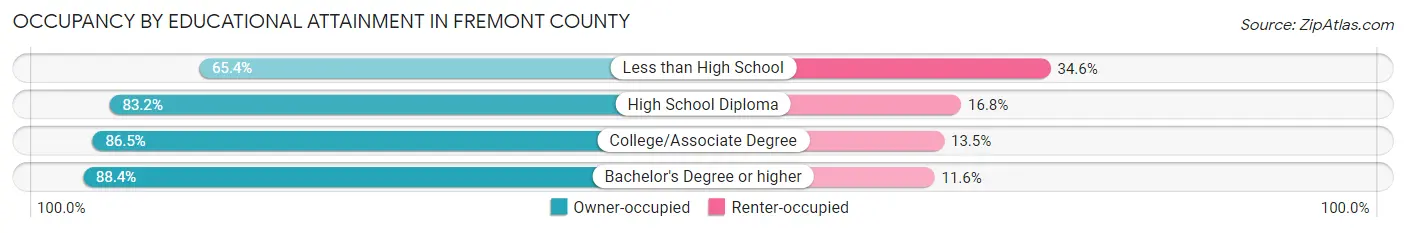
| Household Size | Owner-occupied | Renter-occupied |
| Less than High School | 282 (65.4%) | 149 (34.6%) |
| High School Diploma | 1,037 (83.2%) | 210 (16.8%) |
| College/Associate Degree | 1,389 (86.5%) | 216 (13.5%) |
| Bachelor's Degree or higher | 917 (88.4%) | 120 (11.6%) |
Occupancy by Age of Householder in Fremont County
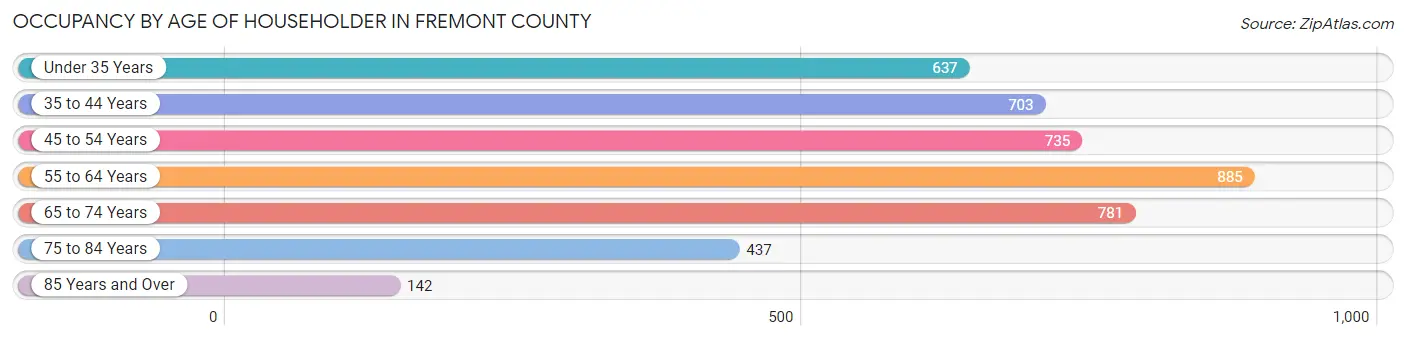
| Age Bracket | # Households | % Households |
| Under 35 Years | 637 | 14.7% |
| 35 to 44 Years | 703 | 16.3% |
| 45 to 54 Years | 735 | 17.0% |
| 55 to 64 Years | 885 | 20.5% |
| 65 to 74 Years | 781 | 18.1% |
| 75 to 84 Years | 437 | 10.1% |
| 85 Years and Over | 142 | 3.3% |
| Total | 4,320 | 100.0% |
Housing Finances in Fremont County
Median Income by Occupancy in Fremont County
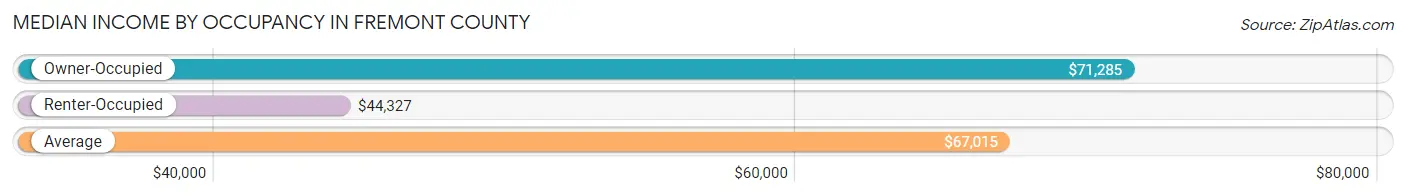
| Occupancy Type | # Households | Median Income |
| Owner-Occupied | 3,625 (83.9%) | $71,285 |
| Renter-Occupied | 695 (16.1%) | $44,327 |
| Average | 4,320 (100.0%) | $67,015 |
Occupancy by Householder Income Bracket in Fremont County

| Income Bracket | Owner-occupied | Renter-occupied |
| Less than $5,000 | 45 (1.2%) | 5 (0.7%) |
| $5,000 to $9,999 | 21 (0.6%) | 38 (5.5%) |
| $10,000 to $14,999 | 73 (2.0%) | 44 (6.3%) |
| $15,000 to $19,999 | 88 (2.4%) | 36 (5.2%) |
| $20,000 to $24,999 | 205 (5.7%) | 55 (7.9%) |
| $25,000 to $34,999 | 232 (6.4%) | 108 (15.5%) |
| $35,000 to $49,999 | 455 (12.6%) | 101 (14.5%) |
| $50,000 to $74,999 | 793 (21.9%) | 154 (22.2%) |
| $75,000 to $99,999 | 610 (16.8%) | 91 (13.1%) |
| $100,000 to $149,999 | 733 (20.2%) | 62 (8.9%) |
| $150,000 or more | 370 (10.2%) | 1 (0.1%) |
| Total | 3,625 (100.0%) | 695 (100.0%) |
Monthly Housing Cost Tiers in Fremont County

| Monthly Cost | Owner-occupied | Renter-occupied |
| Less than $300 | 392 (10.8%) | 15 (2.2%) |
| $300 to $499 | 699 (19.3%) | 47 (6.8%) |
| $500 to $799 | 712 (19.6%) | 295 (42.4%) |
| $800 to $999 | 334 (9.2%) | 79 (11.4%) |
| $1,000 to $1,499 | 754 (20.8%) | 130 (18.7%) |
| $1,500 to $1,999 | 473 (13.1%) | 2 (0.3%) |
| $2,000 to $2,499 | 105 (2.9%) | 0 (0.0%) |
| $2,500 to $2,999 | 155 (4.3%) | 8 (1.1%) |
| $3,000 or more | 1 (0.0%) | 0 (0.0%) |
| Total | 3,625 (100.0%) | 695 (100.0%) |
Physical Housing Characteristics in Fremont County
Housing Structures in Fremont County
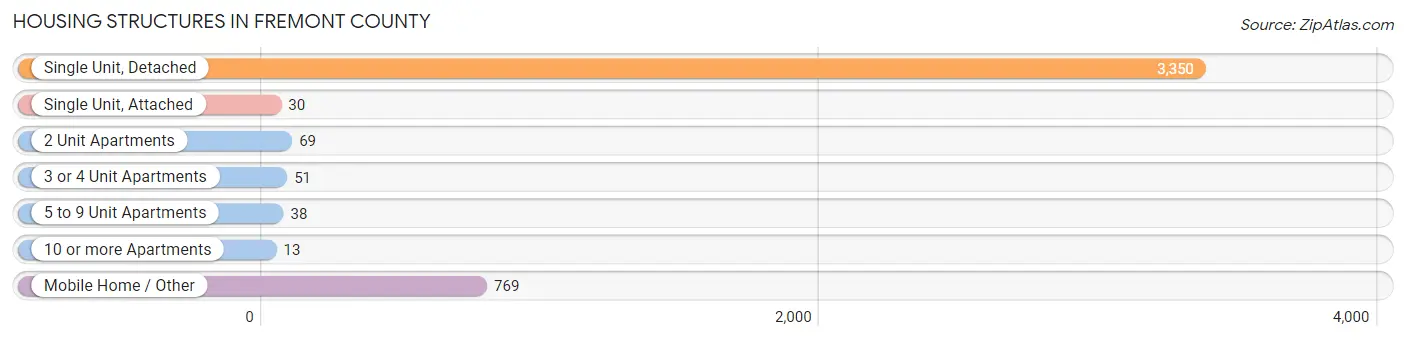
| Structure Type | # Housing Units | % Housing Units |
| Single Unit, Detached | 3,350 | 77.5% |
| Single Unit, Attached | 30 | 0.7% |
| 2 Unit Apartments | 69 | 1.6% |
| 3 or 4 Unit Apartments | 51 | 1.2% |
| 5 to 9 Unit Apartments | 38 | 0.9% |
| 10 or more Apartments | 13 | 0.3% |
| Mobile Home / Other | 769 | 17.8% |
| Total | 4,320 | 100.0% |
Housing Structures by Occupancy in Fremont County
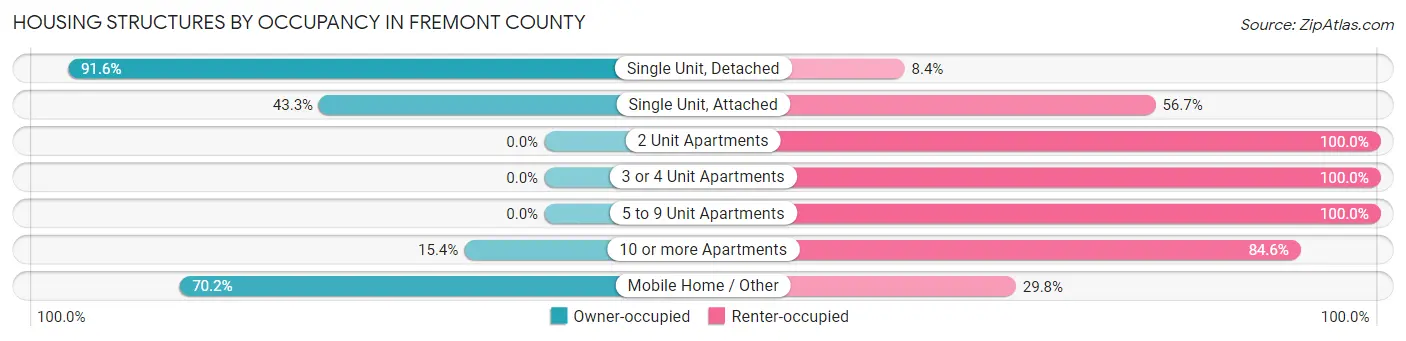
| Structure Type | Owner-occupied | Renter-occupied |
| Single Unit, Detached | 3,070 (91.6%) | 280 (8.4%) |
| Single Unit, Attached | 13 (43.3%) | 17 (56.7%) |
| 2 Unit Apartments | 0 (0.0%) | 69 (100.0%) |
| 3 or 4 Unit Apartments | 0 (0.0%) | 51 (100.0%) |
| 5 to 9 Unit Apartments | 0 (0.0%) | 38 (100.0%) |
| 10 or more Apartments | 2 (15.4%) | 11 (84.6%) |
| Mobile Home / Other | 540 (70.2%) | 229 (29.8%) |
| Total | 3,625 (83.9%) | 695 (16.1%) |
Housing Structures by Number of Rooms in Fremont County
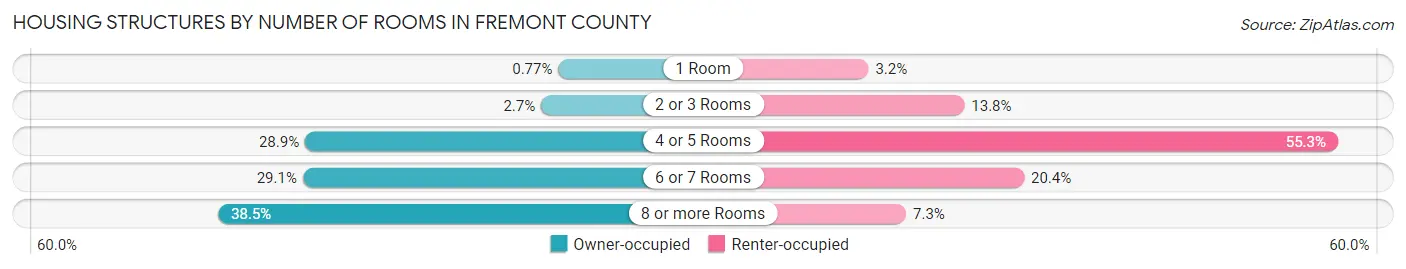
| Number of Rooms | Owner-occupied | Renter-occupied |
| 1 Room | 28 (0.8%) | 22 (3.2%) |
| 2 or 3 Rooms | 97 (2.7%) | 96 (13.8%) |
| 4 or 5 Rooms | 1,047 (28.9%) | 384 (55.2%) |
| 6 or 7 Rooms | 1,056 (29.1%) | 142 (20.4%) |
| 8 or more Rooms | 1,397 (38.5%) | 51 (7.3%) |
| Total | 3,625 (100.0%) | 695 (100.0%) |
Housing Structure by Heating Type in Fremont County
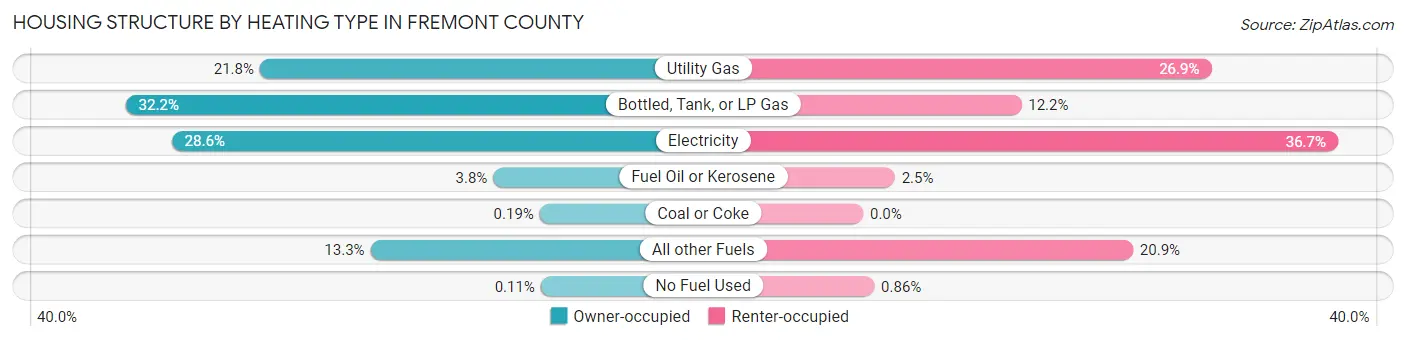
| Heating Type | Owner-occupied | Renter-occupied |
| Utility Gas | 791 (21.8%) | 187 (26.9%) |
| Bottled, Tank, or LP Gas | 1,167 (32.2%) | 85 (12.2%) |
| Electricity | 1,038 (28.6%) | 255 (36.7%) |
| Fuel Oil or Kerosene | 137 (3.8%) | 17 (2.5%) |
| Coal or Coke | 7 (0.2%) | 0 (0.0%) |
| All other Fuels | 481 (13.3%) | 145 (20.9%) |
| No Fuel Used | 4 (0.1%) | 6 (0.9%) |
| Total | 3,625 (100.0%) | 695 (100.0%) |
Household Vehicle Usage in Fremont County
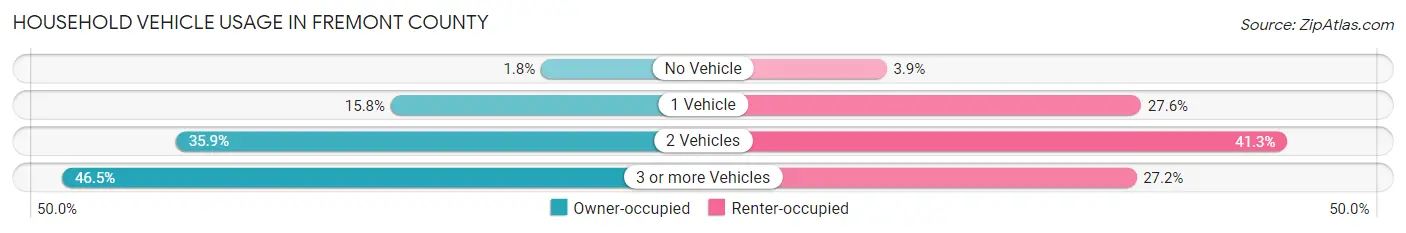
| Vehicles per Household | Owner-occupied | Renter-occupied |
| No Vehicle | 65 (1.8%) | 27 (3.9%) |
| 1 Vehicle | 573 (15.8%) | 192 (27.6%) |
| 2 Vehicles | 1,301 (35.9%) | 287 (41.3%) |
| 3 or more Vehicles | 1,686 (46.5%) | 189 (27.2%) |
| Total | 3,625 (100.0%) | 695 (100.0%) |
Real Estate & Mortgages in Fremont County
Real Estate and Mortgage Overview in Fremont County
| Characteristic | Without Mortgage | With Mortgage |
| Housing Units | 1,763 | 1,862 |
| Median Property Value | $236,000 | $252,800 |
| Median Household Income | $60,540 | $226 |
| Monthly Housing Costs | $441 | $1 |
| Real Estate Taxes | $1,220 | $35 |
Property Value by Mortgage Status in Fremont County
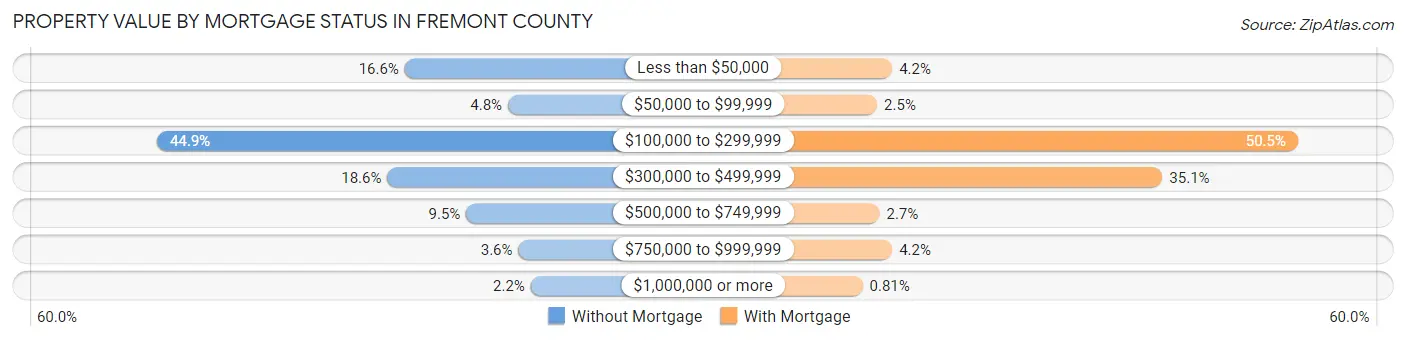
| Property Value | Without Mortgage | With Mortgage |
| Less than $50,000 | 292 (16.6%) | 78 (4.2%) |
| $50,000 to $99,999 | 84 (4.8%) | 46 (2.5%) |
| $100,000 to $299,999 | 791 (44.9%) | 941 (50.5%) |
| $300,000 to $499,999 | 327 (18.5%) | 653 (35.1%) |
| $500,000 to $749,999 | 168 (9.5%) | 51 (2.7%) |
| $750,000 to $999,999 | 63 (3.6%) | 78 (4.2%) |
| $1,000,000 or more | 38 (2.2%) | 15 (0.8%) |
| Total | 1,763 (100.0%) | 1,862 (100.0%) |
Household Income by Mortgage Status in Fremont County
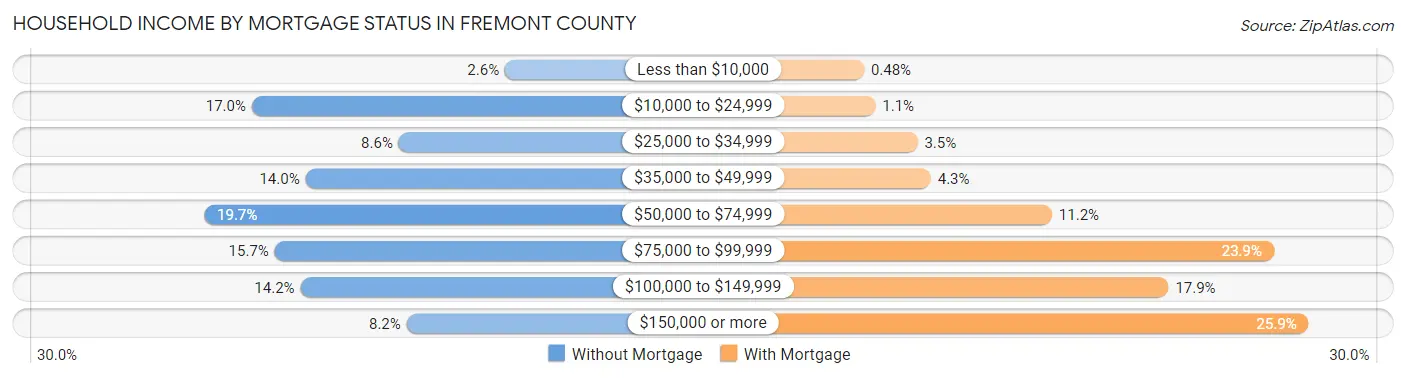
| Household Income | Without Mortgage | With Mortgage |
| Less than $10,000 | 45 (2.5%) | 9 (0.5%) |
| $10,000 to $24,999 | 300 (17.0%) | 21 (1.1%) |
| $25,000 to $34,999 | 152 (8.6%) | 66 (3.5%) |
| $35,000 to $49,999 | 246 (14.0%) | 80 (4.3%) |
| $50,000 to $74,999 | 348 (19.7%) | 209 (11.2%) |
| $75,000 to $99,999 | 277 (15.7%) | 445 (23.9%) |
| $100,000 to $149,999 | 251 (14.2%) | 333 (17.9%) |
| $150,000 or more | 144 (8.2%) | 482 (25.9%) |
| Total | 1,763 (100.0%) | 1,862 (100.0%) |
Property Value to Household Income Ratio in Fremont County
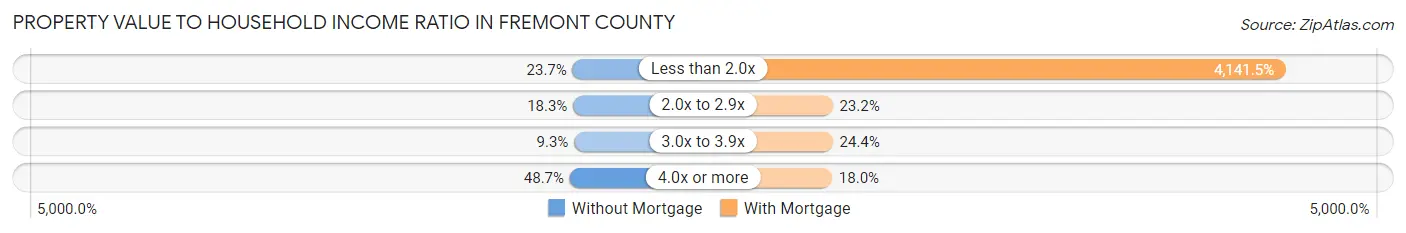
| Value-to-Income Ratio | Without Mortgage | With Mortgage |
| Less than 2.0x | 418 (23.7%) | 77,115 (4,141.5%) |
| 2.0x to 2.9x | 323 (18.3%) | 432 (23.2%) |
| 3.0x to 3.9x | 163 (9.2%) | 455 (24.4%) |
| 4.0x or more | 859 (48.7%) | 335 (18.0%) |
| Total | 1,763 (100.0%) | 1,862 (100.0%) |
Real Estate Taxes by Mortgage Status in Fremont County
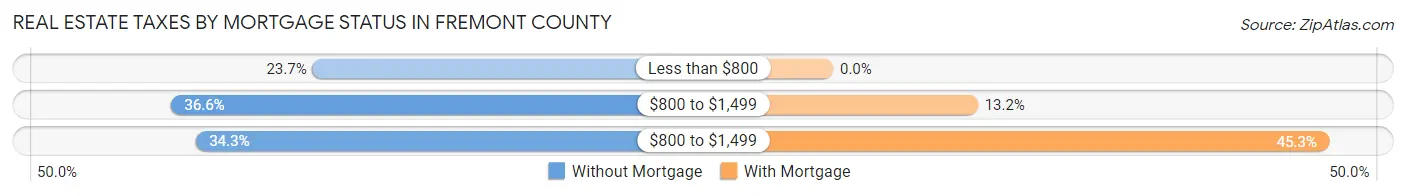
| Property Taxes | Without Mortgage | With Mortgage |
| Less than $800 | 418 (23.7%) | 0 (0.0%) |
| $800 to $1,499 | 645 (36.6%) | 246 (13.2%) |
| $800 to $1,499 | 605 (34.3%) | 843 (45.3%) |
| Total | 1,763 (100.0%) | 1,862 (100.0%) |
Health & Disability in Fremont County
Health Insurance Coverage by Age in Fremont County
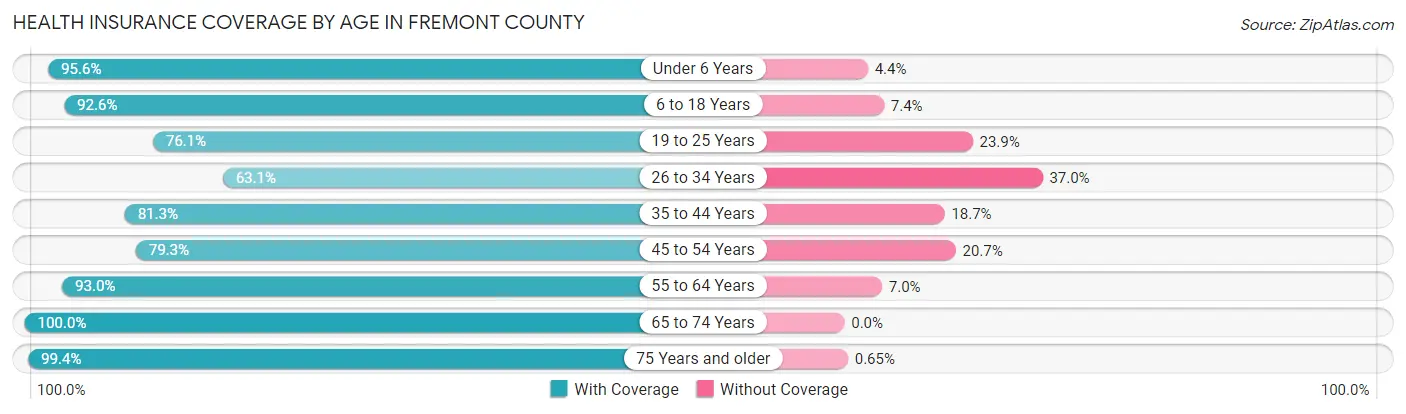
| Age Bracket | With Coverage | Without Coverage |
| Under 6 Years | 940 (95.6%) | 43 (4.4%) |
| 6 to 18 Years | 2,149 (92.6%) | 171 (7.4%) |
| 19 to 25 Years | 872 (76.1%) | 274 (23.9%) |
| 26 to 34 Years | 889 (63.0%) | 521 (36.9%) |
| 35 to 44 Years | 1,306 (81.3%) | 300 (18.7%) |
| 45 to 54 Years | 1,192 (79.3%) | 312 (20.7%) |
| 55 to 64 Years | 1,579 (93.0%) | 119 (7.0%) |
| 65 to 74 Years | 1,435 (100.0%) | 0 (0.0%) |
| 75 Years and older | 922 (99.4%) | 6 (0.6%) |
| Total | 11,284 (86.6%) | 1,746 (13.4%) |
Health Insurance Coverage by Citizenship Status in Fremont County
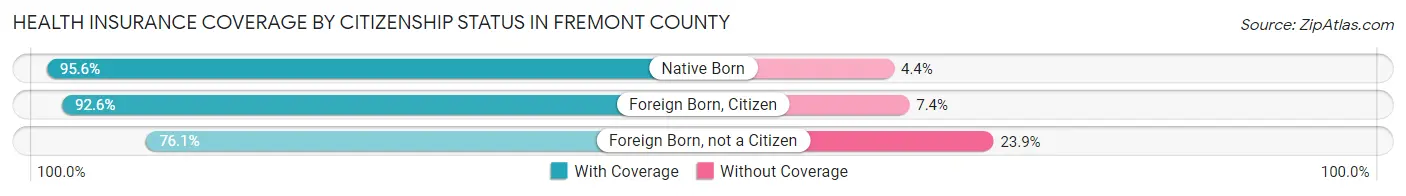
| Citizenship Status | With Coverage | Without Coverage |
| Native Born | 940 (95.6%) | 43 (4.4%) |
| Foreign Born, Citizen | 2,149 (92.6%) | 171 (7.4%) |
| Foreign Born, not a Citizen | 872 (76.1%) | 274 (23.9%) |
Health Insurance Coverage by Household Income in Fremont County
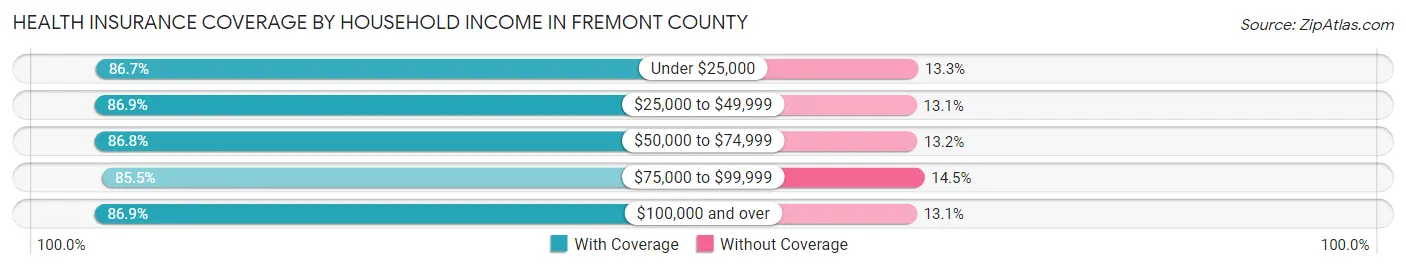
| Household Income | With Coverage | Without Coverage |
| Under $25,000 | 1,177 (86.7%) | 181 (13.3%) |
| $25,000 to $49,999 | 1,774 (86.9%) | 267 (13.1%) |
| $50,000 to $74,999 | 2,343 (86.8%) | 355 (13.2%) |
| $75,000 to $99,999 | 2,202 (85.5%) | 374 (14.5%) |
| $100,000 and over | 3,773 (86.9%) | 569 (13.1%) |
Public vs Private Health Insurance Coverage by Age in Fremont County
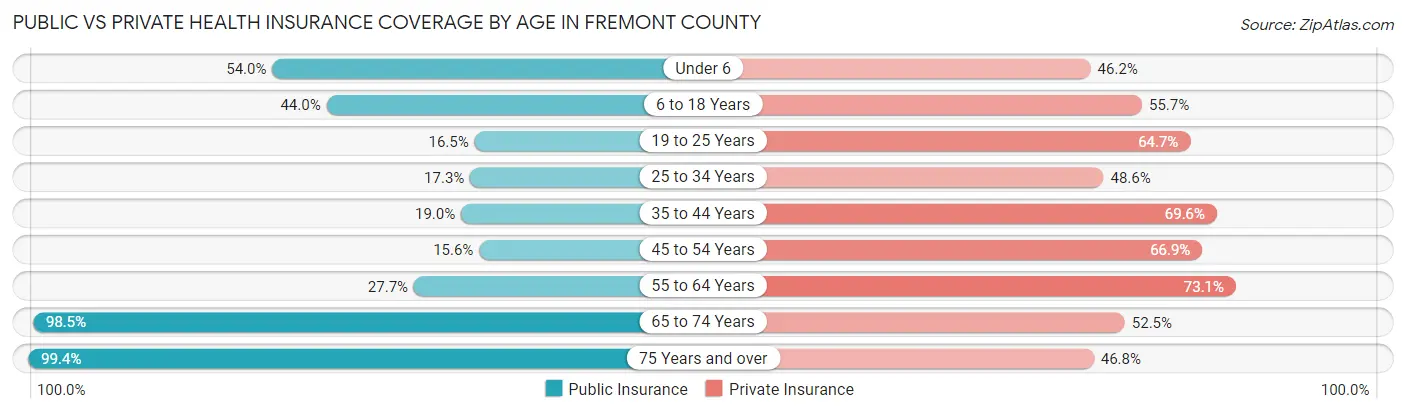
| Age Bracket | Public Insurance | Private Insurance |
| Under 6 | 531 (54.0%) | 454 (46.2%) |
| 6 to 18 Years | 1,020 (44.0%) | 1,293 (55.7%) |
| 19 to 25 Years | 189 (16.5%) | 741 (64.7%) |
| 25 to 34 Years | 244 (17.3%) | 685 (48.6%) |
| 35 to 44 Years | 305 (19.0%) | 1,118 (69.6%) |
| 45 to 54 Years | 235 (15.6%) | 1,006 (66.9%) |
| 55 to 64 Years | 471 (27.7%) | 1,242 (73.1%) |
| 65 to 74 Years | 1,413 (98.5%) | 754 (52.5%) |
| 75 Years and over | 922 (99.4%) | 434 (46.8%) |
| Total | 5,330 (40.9%) | 7,727 (59.3%) |
Disability Status by Sex by Age in Fremont County
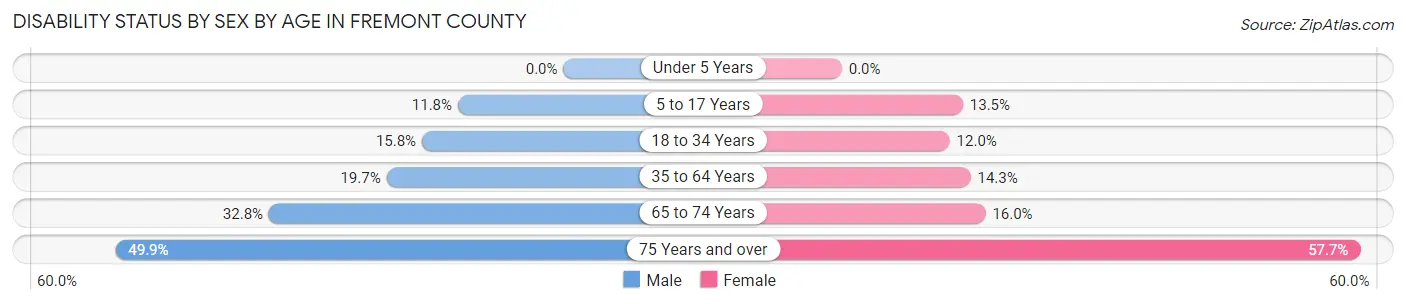
| Age Bracket | Male | Female |
| Under 5 Years | 0 (0.0%) | 0 (0.0%) |
| 5 to 17 Years | 136 (11.7%) | 162 (13.5%) |
| 18 to 34 Years | 208 (15.8%) | 164 (12.0%) |
| 35 to 64 Years | 495 (19.7%) | 329 (14.3%) |
| 65 to 74 Years | 241 (32.8%) | 112 (16.0%) |
| 75 Years and over | 221 (49.9%) | 280 (57.7%) |
Disability Class by Sex by Age in Fremont County
Disability Class: Hearing Difficulty
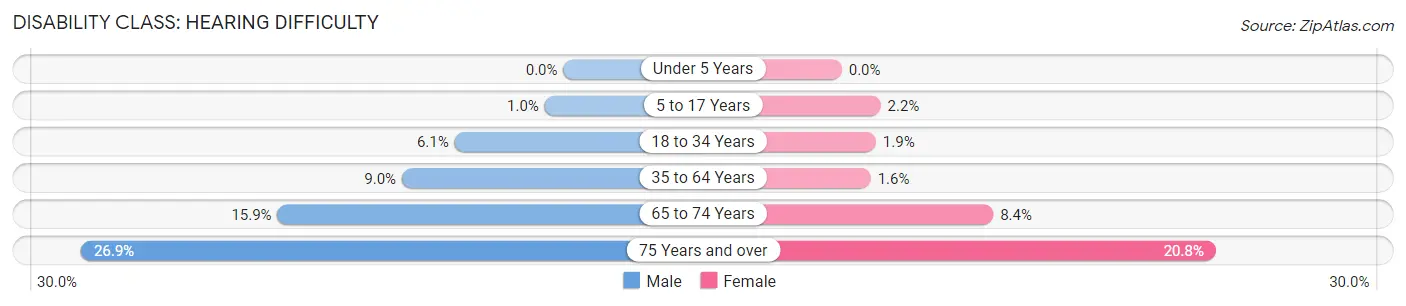
| Age Bracket | Male | Female |
| Under 5 Years | 0 (0.0%) | 0 (0.0%) |
| 5 to 17 Years | 12 (1.0%) | 26 (2.2%) |
| 18 to 34 Years | 80 (6.1%) | 26 (1.9%) |
| 35 to 64 Years | 226 (9.0%) | 37 (1.6%) |
| 65 to 74 Years | 117 (15.9%) | 59 (8.4%) |
| 75 Years and over | 119 (26.9%) | 101 (20.8%) |
Disability Class: Vision Difficulty
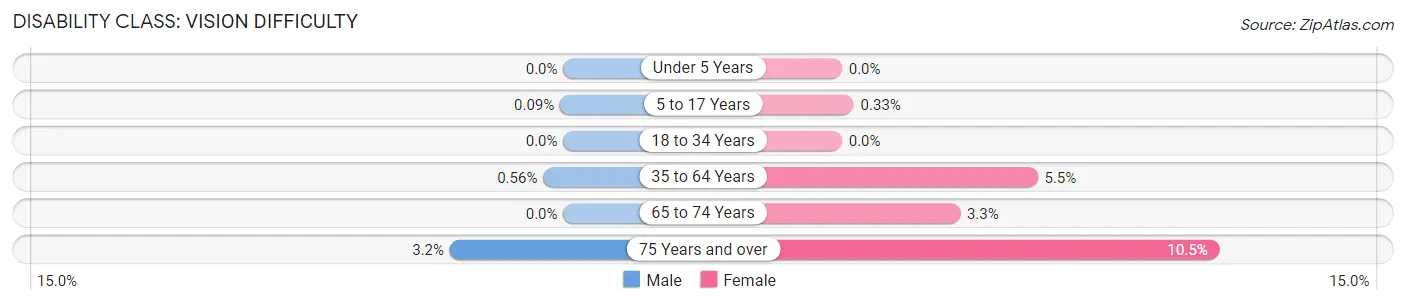
| Age Bracket | Male | Female |
| Under 5 Years | 0 (0.0%) | 0 (0.0%) |
| 5 to 17 Years | 1 (0.1%) | 4 (0.3%) |
| 18 to 34 Years | 0 (0.0%) | 0 (0.0%) |
| 35 to 64 Years | 14 (0.6%) | 125 (5.4%) |
| 65 to 74 Years | 0 (0.0%) | 23 (3.3%) |
| 75 Years and over | 14 (3.2%) | 51 (10.5%) |
Disability Class: Cognitive Difficulty
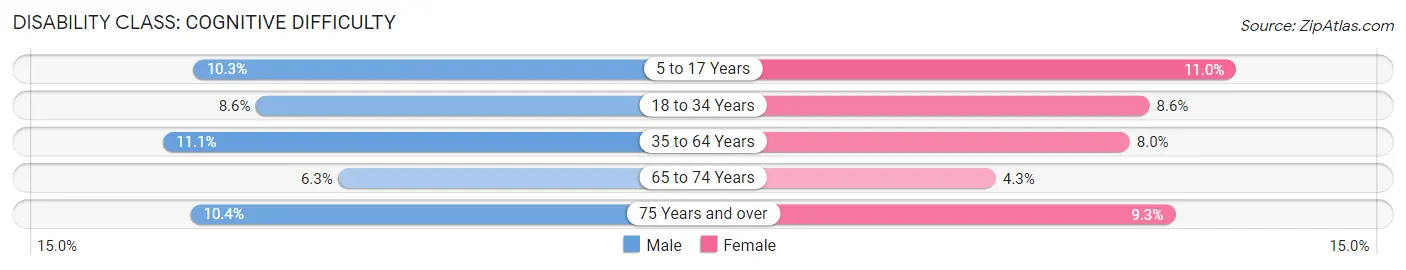
| Age Bracket | Male | Female |
| 5 to 17 Years | 119 (10.3%) | 132 (11.0%) |
| 18 to 34 Years | 113 (8.6%) | 117 (8.6%) |
| 35 to 64 Years | 280 (11.1%) | 184 (8.0%) |
| 65 to 74 Years | 46 (6.3%) | 30 (4.3%) |
| 75 Years and over | 46 (10.4%) | 45 (9.3%) |
Disability Class: Ambulatory Difficulty
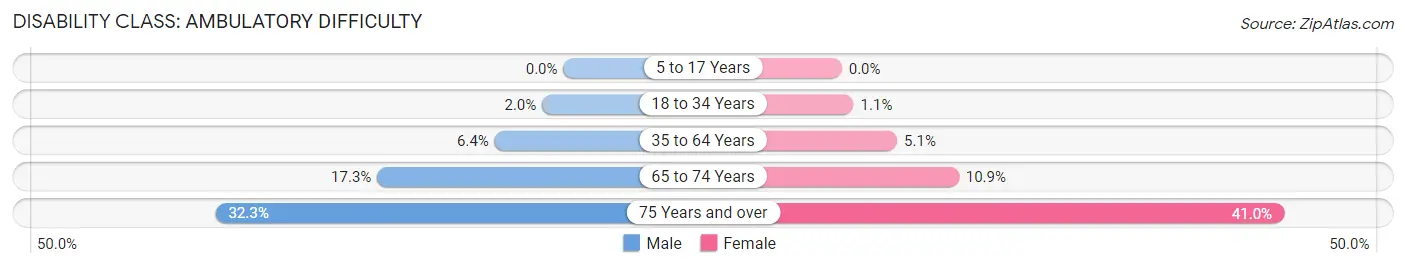
| Age Bracket | Male | Female |
| 5 to 17 Years | 0 (0.0%) | 0 (0.0%) |
| 18 to 34 Years | 26 (2.0%) | 15 (1.1%) |
| 35 to 64 Years | 160 (6.4%) | 118 (5.1%) |
| 65 to 74 Years | 127 (17.3%) | 76 (10.9%) |
| 75 Years and over | 143 (32.3%) | 199 (41.0%) |
Disability Class: Self-Care Difficulty
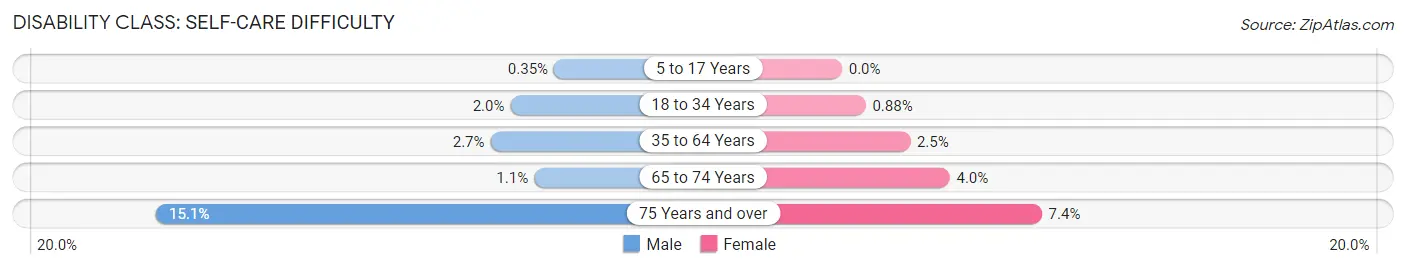
| Age Bracket | Male | Female |
| 5 to 17 Years | 4 (0.4%) | 0 (0.0%) |
| 18 to 34 Years | 26 (2.0%) | 12 (0.9%) |
| 35 to 64 Years | 68 (2.7%) | 58 (2.5%) |
| 65 to 74 Years | 8 (1.1%) | 28 (4.0%) |
| 75 Years and over | 67 (15.1%) | 36 (7.4%) |
Technology Access in Fremont County
Computing Device Access in Fremont County
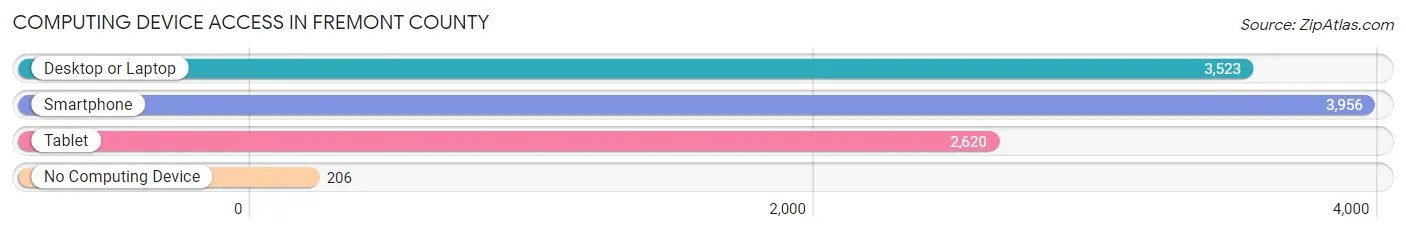
| Device Type | # Households | % Households |
| Desktop or Laptop | 3,523 | 81.6% |
| Smartphone | 3,956 | 91.6% |
| Tablet | 2,620 | 60.7% |
| No Computing Device | 206 | 4.8% |
| Total | 4,320 | 100.0% |
Internet Access in Fremont County
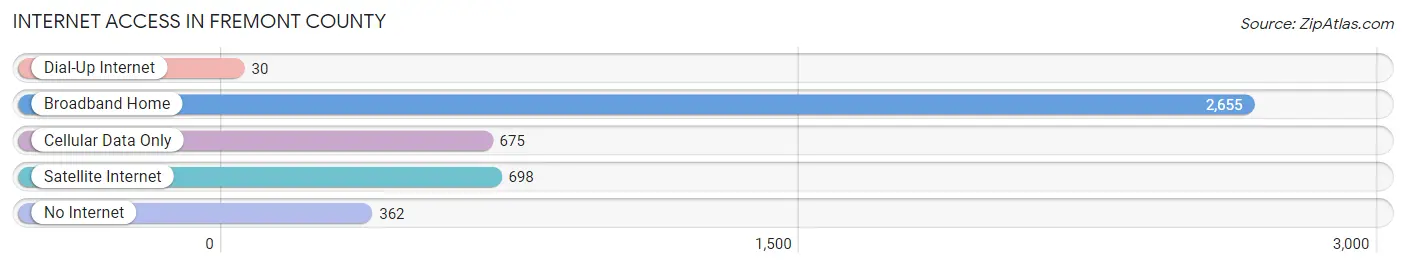
| Internet Type | # Households | % Households |
| Dial-Up Internet | 30 | 0.7% |
| Broadband Home | 2,655 | 61.5% |
| Cellular Data Only | 675 | 15.6% |
| Satellite Internet | 698 | 16.2% |
| No Internet | 362 | 8.4% |
| Total | 4,320 | 100.0% |
Fremont County Summary
Fremont County, Idaho is located in the southeastern corner of the state and is bordered by Madison County to the north, Clark County to the east, and Teton County to the south. The county seat is St. Anthony, and the largest city is Rexburg. The county was established in 1884 and named after John C. Fremont, an explorer and the first presidential candidate of the Republican Party.
Geography
Fremont County covers an area of 1,902 square miles and is the second largest county in Idaho. The county is located in the Snake River Plain, a flat, arid region of the state. The Snake River runs through the county, and the Teton River is located in the northern part of the county. The county is also home to several mountain ranges, including the Caribou, Teton, and Lemhi ranges. The highest point in the county is Mount Putnam, which has an elevation of 8,945 feet.
The climate of Fremont County is semi-arid, with hot summers and cold winters. The average annual precipitation is 11.5 inches, and the average annual temperature is 44.3 degrees Fahrenheit.
Economy
Agriculture is the main economic activity in Fremont County. The county is home to several large farms, and the main crops grown in the county are potatoes, wheat, barley, and hay. The county is also home to several large dairies, and the dairy industry is a major contributor to the local economy.
The county is also home to several manufacturing companies, including a large potato processing plant and a wood products plant. Tourism is also an important part of the local economy, and the county is home to several popular attractions, including Yellowstone National Park, Grand Teton National Park, and the Teton Range.
Demographics
As of the 2010 census, the population of Fremont County was 40,123. The population is predominantly white (94.3%), with small percentages of Native American (2.2%), Asian (1.2%), and African American (0.5%) residents. The median household income in the county is $45,945, and the median age is 28.7 years.
Conclusion
Fremont County, Idaho is a large, rural county located in the southeastern corner of the state. The county is home to several large farms and dairies, and the main crops grown in the county are potatoes, wheat, barley, and hay. The county is also home to several manufacturing companies, and tourism is an important part of the local economy. The population of the county is predominantly white, and the median household income is $45,945.
Common Questions
What is the Total Population of Fremont County?
Total Population of Fremont County is 13,519.
What is the Total Male Population of Fremont County?
Total Male Population of Fremont County is 7,028.
What is the Total Female Population of Fremont County?
Total Female Population of Fremont County is 6,491.
What is the Ratio of Males per 100 Females in Fremont County?
There are 108.27 Males per 100 Females in Fremont County.
What is the Ratio of Females per 100 Males in Fremont County?
There are 92.36 Females per 100 Males in Fremont County.
What is the Median Population Age in Fremont County?
Median Population Age in Fremont County is 39.0 Years.
What is the Average Family Size in Fremont County
Average Family Size in Fremont County is 3.4 People.
What is the Average Household Size in Fremont County
Average Household Size in Fremont County is 3.0 People.
What is Per Capita Income in Fremont County?
Per Capita income in Fremont County is $27,427.
What is the Median Family Income in Fremont County?
Median Family Income in Fremont County is $75,162.
What is the Median Household income in Fremont County?
Median Household Income in Fremont County is $67,015.
What is Income or Wage Gap in Fremont County?
Income or Wage Gap in Fremont County is 39.3%.
Women in Fremont County earn 60.7 cents for every dollar earned by a man.
What is Family Income Deficit in Fremont County?
Family Income Deficit in Fremont County is $9,897.
Families that are below poverty line in Fremont County earn $9,897 less on average than the poverty threshold level.
What is Inequality or Gini Index in Fremont County?
Inequality or Gini Index in Fremont County is 0.38.
How Large is the Labor Force in Fremont County?
There are 6,078 People in the Labor Forcein in Fremont County.
What is the Percentage of People in the Labor Force in Fremont County?
56.8% of People are in the Labor Force in Fremont County.
What is the Unemployment Rate in Fremont County?
Unemployment Rate in Fremont County is 4.5%.