Elmore County, ID
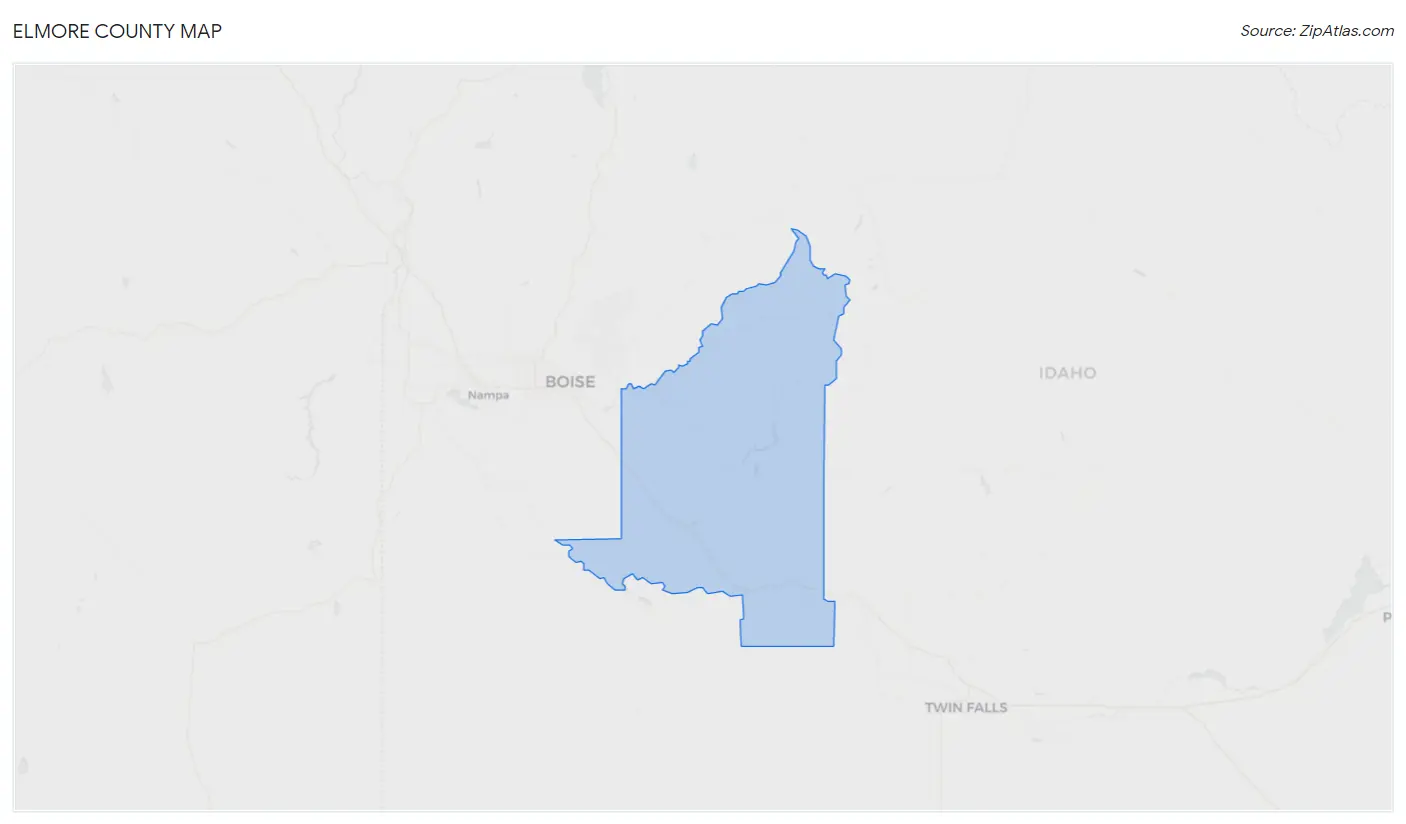
Elmore County Map
Elmore County Overview
28,752
TOTAL POPULATION
15,367
MALE POPULATION
13,385
FEMALE POPULATION
114.81
MALES / 100 FEMALES
87.10
FEMALES / 100 MALES
32.3
MEDIAN AGE
3.2
AVG FAMILY SIZE
2.6
AVG HOUSEHOLD SIZE
$28,599
PER CAPITA INCOME
$66,547
AVG FAMILY INCOME
$55,000
AVG HOUSEHOLD INCOME
29.2%
WAGE / INCOME GAP [ % ]
70.8¢/ $1
WAGE / INCOME GAP [ $ ]
$10,895
FAMILY INCOME DEFICIT
0.42
INEQUALITY / GINI INDEX
13,953
LABOR FORCE [ PEOPLE ]
62.8%
PERCENT IN LABOR FORCE
6.4%
UNEMPLOYMENT RATE
Elmore County Area Codes
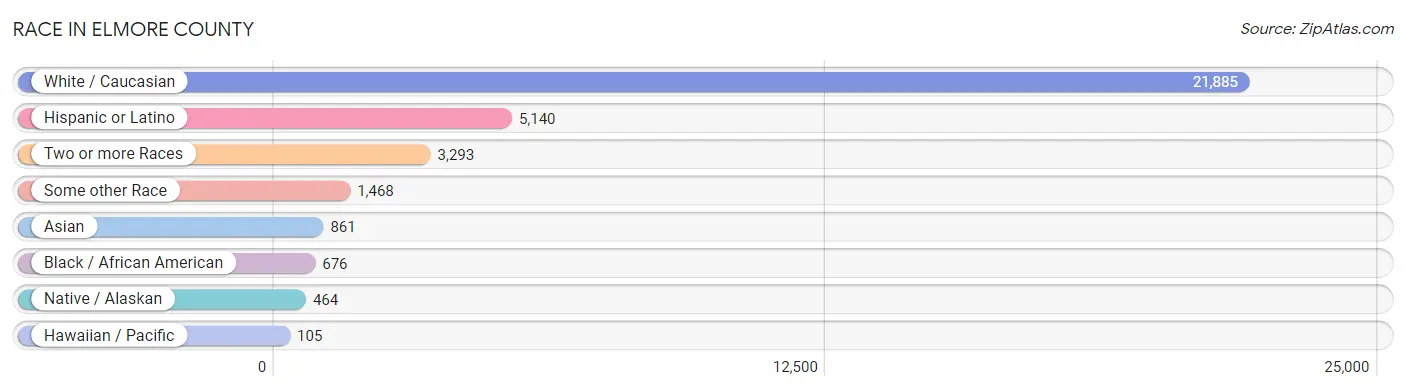
Race in Elmore County
The most populous races in Elmore County are White / Caucasian (21,885 | 76.1%), Hispanic or Latino (5,140 | 17.9%), and Two or more Races (3,293 | 11.5%).
| Race | # Population | % Population |
| Asian | 861 | 3.0% |
| Black / African American | 676 | 2.4% |
| Hawaiian / Pacific | 105 | 0.4% |
| Hispanic or Latino | 5,140 | 17.9% |
| Native / Alaskan | 464 | 1.6% |
| White / Caucasian | 21,885 | 76.1% |
| Two or more Races | 3,293 | 11.5% |
| Some other Race | 1,468 | 5.1% |
| Total | 28,752 | 100.0% |
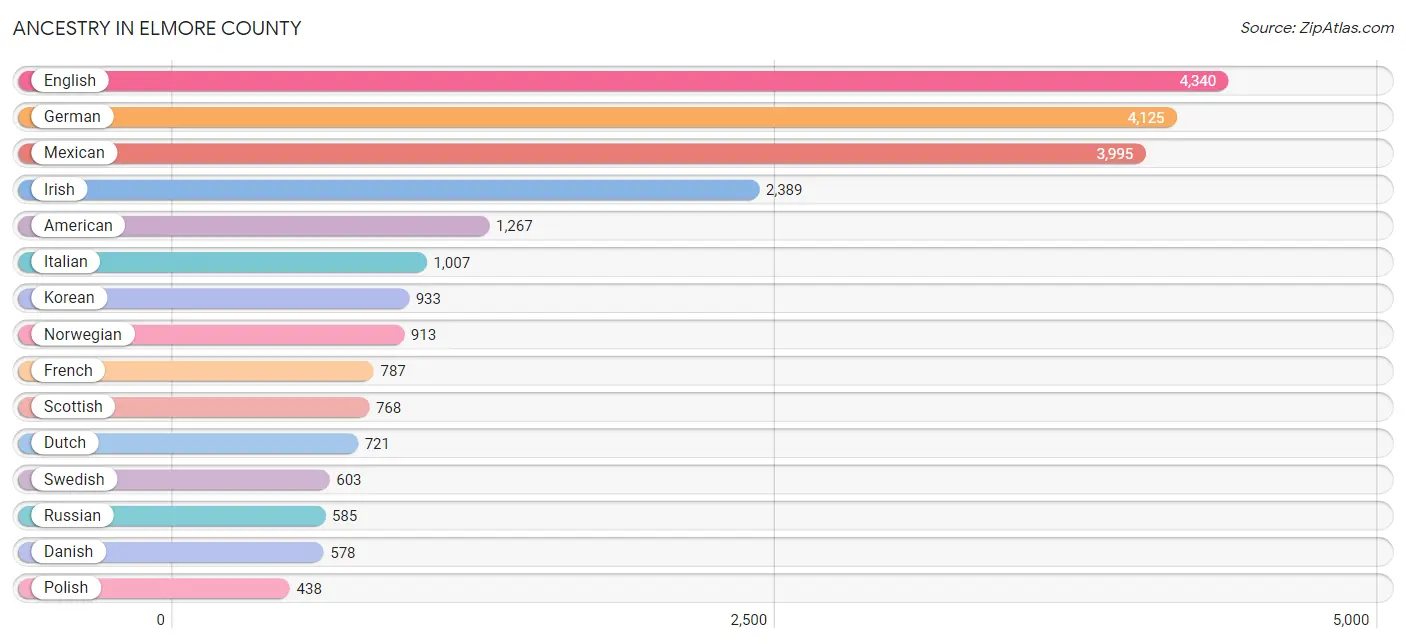
Ancestry in Elmore County
The most populous ancestries reported in Elmore County are English (4,340 | 15.1%), German (4,125 | 14.3%), Mexican (3,995 | 13.9%), Irish (2,389 | 8.3%), and American (1,267 | 4.4%), together accounting for 56.0% of all Elmore County residents.
| Ancestry | # Population | % Population |
| African | 22 | 0.1% |
| Alaska Native | 6 | 0.0% |
| Aleut | 9 | 0.0% |
| American | 1,267 | 4.4% |
| Apache | 26 | 0.1% |
| Austrian | 251 | 0.9% |
| Basque | 332 | 1.1% |
| Belgian | 14 | 0.1% |
| Bhutanese | 174 | 0.6% |
| Blackfeet | 18 | 0.1% |
| Brazilian | 1 | 0.0% |
| British | 104 | 0.4% |
| Burmese | 55 | 0.2% |
| Cajun | 15 | 0.1% |
| Canadian | 20 | 0.1% |
| Celtic | 6 | 0.0% |
| Central American | 205 | 0.7% |
| Central American Indian | 86 | 0.3% |
| Cherokee | 180 | 0.6% |
| Chippewa | 31 | 0.1% |
| Colombian | 10 | 0.0% |
| Comanche | 21 | 0.1% |
| Creek | 28 | 0.1% |
| Croatian | 10 | 0.0% |
| Cuban | 27 | 0.1% |
| Czech | 32 | 0.1% |
| Czechoslovakian | 36 | 0.1% |
| Danish | 578 | 2.0% |
| Dominican | 31 | 0.1% |
| Dutch | 721 | 2.5% |
| Eastern European | 11 | 0.0% |
| English | 4,340 | 15.1% |
| European | 364 | 1.3% |
| Finnish | 46 | 0.2% |
| French | 787 | 2.7% |
| French Canadian | 127 | 0.4% |
| German | 4,125 | 14.3% |
| Greek | 60 | 0.2% |
| Guamanian / Chamorro | 59 | 0.2% |
| Guatemalan | 126 | 0.4% |
| Hungarian | 94 | 0.3% |
| Indian (Asian) | 325 | 1.1% |
| Iranian | 16 | 0.1% |
| Irish | 2,389 | 8.3% |
| Italian | 1,007 | 3.5% |
| Jamaican | 29 | 0.1% |
| Japanese | 2 | 0.0% |
| Korean | 933 | 3.2% |
| Lithuanian | 8 | 0.0% |
| Malaysian | 16 | 0.1% |
| Maltese | 21 | 0.1% |
| Mexican | 3,995 | 13.9% |
| Mexican American Indian | 86 | 0.3% |
| Native Hawaiian | 134 | 0.5% |
| Navajo | 38 | 0.1% |
| Nigerian | 57 | 0.2% |
| Northern European | 50 | 0.2% |
| Norwegian | 913 | 3.2% |
| Okinawan | 53 | 0.2% |
| Paiute | 17 | 0.1% |
| Pakistani | 31 | 0.1% |
| Panamanian | 14 | 0.1% |
| Peruvian | 37 | 0.1% |
| Polish | 438 | 1.5% |
| Portuguese | 20 | 0.1% |
| Puerto Rican | 413 | 1.4% |
| Romanian | 12 | 0.0% |
| Russian | 585 | 2.0% |
| Salvadoran | 65 | 0.2% |
| Samoan | 20 | 0.1% |
| Scandinavian | 221 | 0.8% |
| Scotch-Irish | 263 | 0.9% |
| Scottish | 768 | 2.7% |
| Seminole | 12 | 0.0% |
| Shoshone | 30 | 0.1% |
| Sioux | 108 | 0.4% |
| South American | 47 | 0.2% |
| Spaniard | 75 | 0.3% |
| Spanish | 168 | 0.6% |
| Sri Lankan | 19 | 0.1% |
| Subsaharan African | 79 | 0.3% |
| Swedish | 603 | 2.1% |
| Swiss | 220 | 0.8% |
| Thai | 79 | 0.3% |
| Tlingit-Haida | 40 | 0.1% |
| Trinidadian and Tobagonian | 9 | 0.0% |
| Tsimshian | 4 | 0.0% |
| Turkish | 4 | 0.0% |
| Ukrainian | 8 | 0.0% |
| Welsh | 309 | 1.1% |
| Yaqui | 2 | 0.0% |
| Yugoslavian | 53 | 0.2% | View All 92 Rows |
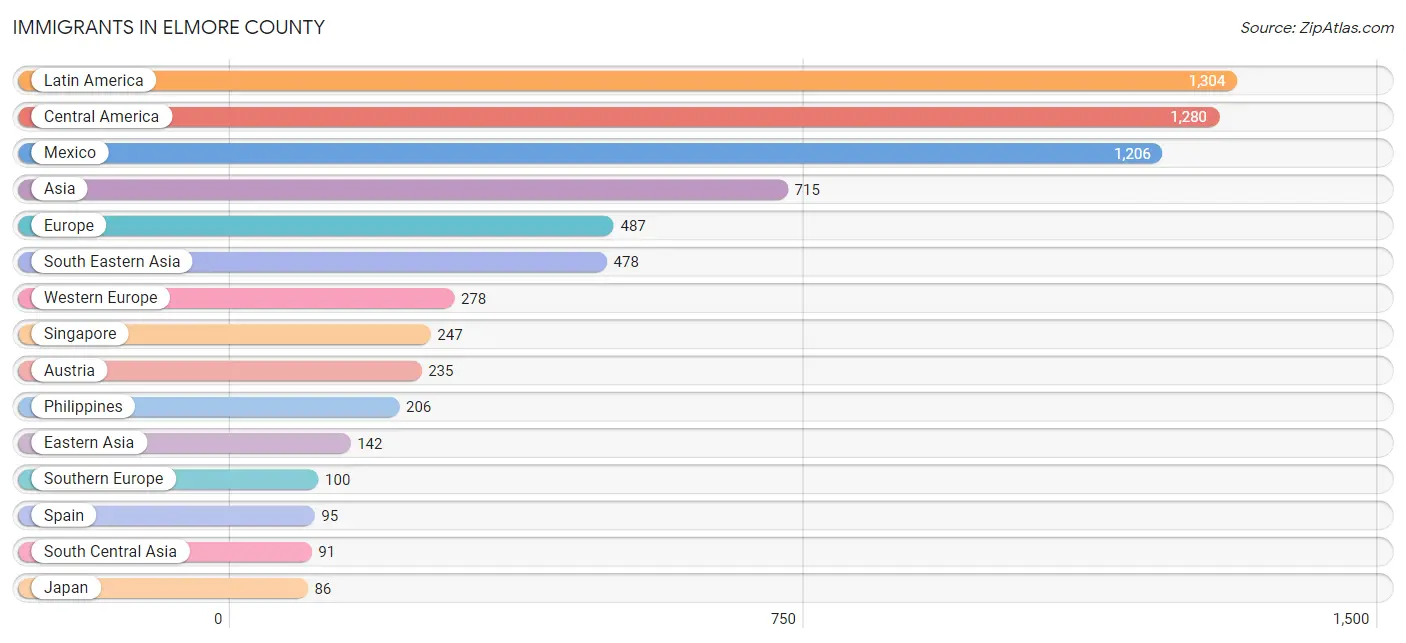
Immigrants in Elmore County
The most numerous immigrant groups reported in Elmore County came from Latin America (1,304 | 4.5%), Central America (1,280 | 4.4%), Mexico (1,206 | 4.2%), Asia (715 | 2.5%), and Europe (487 | 1.7%), together accounting for 17.4% of all Elmore County residents.
| Immigration Origin | # Population | % Population |
| Africa | 24 | 0.1% |
| Asia | 715 | 2.5% |
| Austria | 235 | 0.8% |
| Azores | 2 | 0.0% |
| Brazil | 1 | 0.0% |
| Cambodia | 2 | 0.0% |
| Canada | 40 | 0.1% |
| Caribbean | 18 | 0.1% |
| Central America | 1,280 | 4.4% |
| China | 20 | 0.1% |
| Congo | 8 | 0.0% |
| Eastern Asia | 142 | 0.5% |
| Eastern Europe | 42 | 0.2% |
| England | 40 | 0.1% |
| Europe | 487 | 1.7% |
| Germany | 43 | 0.2% |
| Guatemala | 71 | 0.3% |
| Indonesia | 3 | 0.0% |
| Iran | 16 | 0.1% |
| Italy | 3 | 0.0% |
| Jamaica | 9 | 0.0% |
| Japan | 86 | 0.3% |
| Korea | 36 | 0.1% |
| Latin America | 1,304 | 4.5% |
| Liberia | 5 | 0.0% |
| Lithuania | 8 | 0.0% |
| Mexico | 1,206 | 4.2% |
| Middle Africa | 8 | 0.0% |
| Nigeria | 11 | 0.0% |
| Northern Europe | 67 | 0.2% |
| Panama | 3 | 0.0% |
| Peru | 5 | 0.0% |
| Philippines | 206 | 0.7% |
| Portugal | 2 | 0.0% |
| Russia | 23 | 0.1% |
| Singapore | 247 | 0.9% |
| South America | 6 | 0.0% |
| South Central Asia | 91 | 0.3% |
| South Eastern Asia | 478 | 1.7% |
| Southern Europe | 100 | 0.4% |
| Spain | 95 | 0.3% |
| Thailand | 20 | 0.1% |
| Trinidad and Tobago | 9 | 0.0% |
| Turkey | 4 | 0.0% |
| Uzbekistan | 41 | 0.1% |
| Western Africa | 16 | 0.1% |
| Western Asia | 4 | 0.0% |
| Western Europe | 278 | 1.0% | View All 48 Rows |
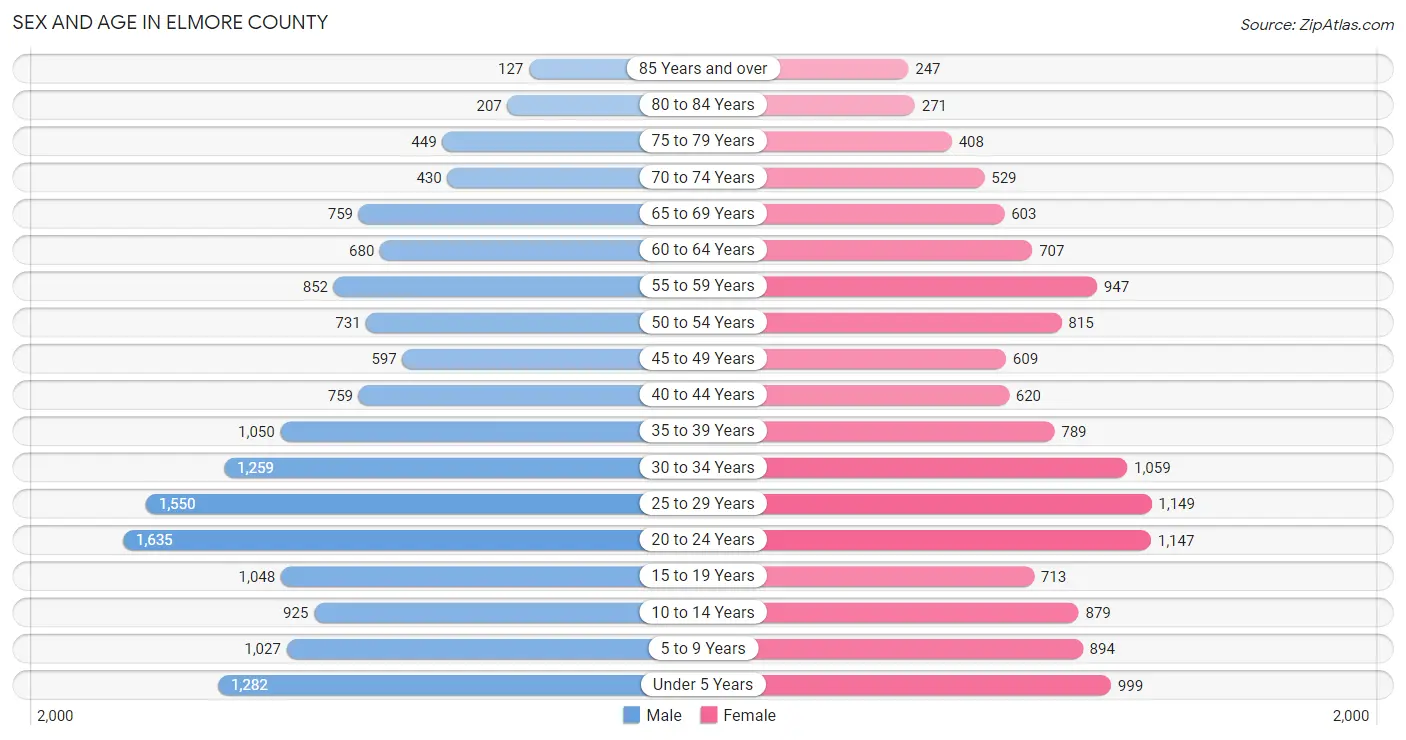
Sex and Age in Elmore County
Sex and Age in Elmore County
The most populous age groups in Elmore County are 20 to 24 Years (1,635 | 10.6%) for men and 25 to 29 Years (1,149 | 8.6%) for women.
| Age Bracket | Male | Female |
| Under 5 Years | 1,282 (8.3%) | 999 (7.5%) |
| 5 to 9 Years | 1,027 (6.7%) | 894 (6.7%) |
| 10 to 14 Years | 925 (6.0%) | 879 (6.6%) |
| 15 to 19 Years | 1,048 (6.8%) | 713 (5.3%) |
| 20 to 24 Years | 1,635 (10.6%) | 1,147 (8.6%) |
| 25 to 29 Years | 1,550 (10.1%) | 1,149 (8.6%) |
| 30 to 34 Years | 1,259 (8.2%) | 1,059 (7.9%) |
| 35 to 39 Years | 1,050 (6.8%) | 789 (5.9%) |
| 40 to 44 Years | 759 (4.9%) | 620 (4.6%) |
| 45 to 49 Years | 597 (3.9%) | 609 (4.5%) |
| 50 to 54 Years | 731 (4.8%) | 815 (6.1%) |
| 55 to 59 Years | 852 (5.5%) | 947 (7.1%) |
| 60 to 64 Years | 680 (4.4%) | 707 (5.3%) |
| 65 to 69 Years | 759 (4.9%) | 603 (4.5%) |
| 70 to 74 Years | 430 (2.8%) | 529 (4.0%) |
| 75 to 79 Years | 449 (2.9%) | 408 (3.0%) |
| 80 to 84 Years | 207 (1.3%) | 271 (2.0%) |
| 85 Years and over | 127 (0.8%) | 247 (1.8%) |
| Total | 15,367 (100.0%) | 13,385 (100.0%) |
Families and Households in Elmore County
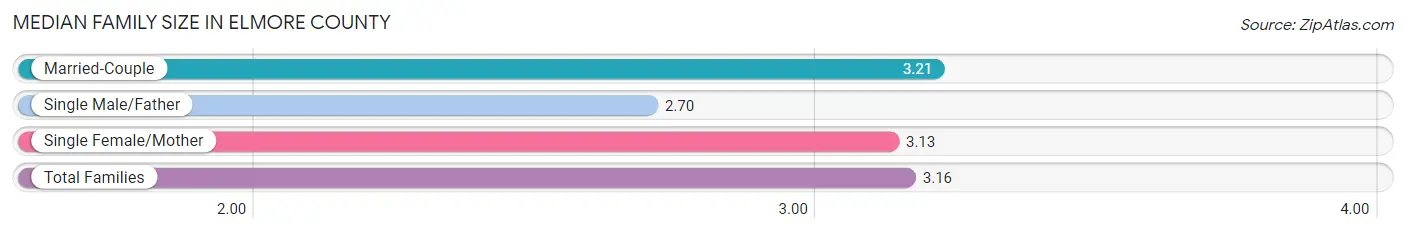
Median Family Size in Elmore County
The median family size in Elmore County is 3.16 persons per family, with married-couple families (5,056 | 74.5%) accounting for the largest median family size of 3.21 persons per family. On the other hand, single male/father families (468 | 6.9%) represent the smallest median family size with 2.70 persons per family.
| Family Type | # Families | Family Size |
| Married-Couple | 5,056 (74.5%) | 3.21 |
| Single Male/Father | 468 (6.9%) | 2.70 |
| Single Female/Mother | 1,261 (18.6%) | 3.13 |
| Total Families | 6,785 (100.0%) | 3.16 |
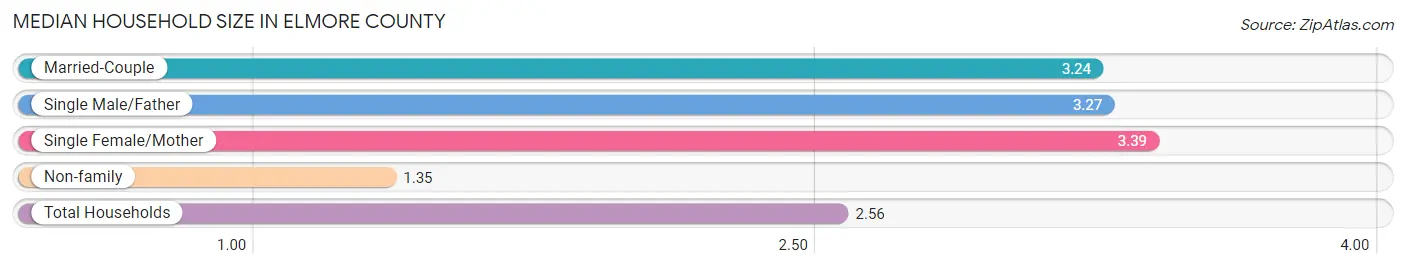
Median Household Size in Elmore County
The median household size in Elmore County is 2.56 persons per household, with single female/mother households (1,261 | 11.7%) accounting for the largest median household size of 3.39 persons per household. non-family households (3,975 | 36.9%) represent the smallest median household size with 1.35 persons per household.
| Household Type | # Households | Household Size |
| Married-Couple | 5,056 (47.0%) | 3.24 |
| Single Male/Father | 468 (4.3%) | 3.27 |
| Single Female/Mother | 1,261 (11.7%) | 3.39 |
| Non-family | 3,975 (36.9%) | 1.35 |
| Total Households | 10,760 (100.0%) | 2.56 |
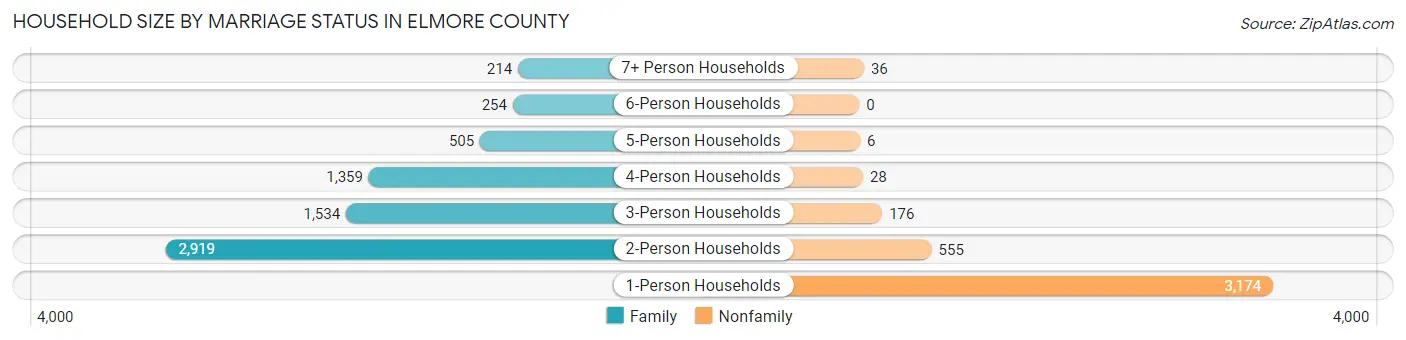
Household Size by Marriage Status in Elmore County
Out of a total of 10,760 households in Elmore County, 6,785 (63.1%) are family households, while 3,975 (36.9%) are nonfamily households. The most numerous type of family households are 2-person households, comprising 2,919, and the most common type of nonfamily households are 1-person households, comprising 3,174.
| Household Size | Family Households | Nonfamily Households |
| 1-Person Households | - | 3,174 (29.5%) |
| 2-Person Households | 2,919 (27.1%) | 555 (5.2%) |
| 3-Person Households | 1,534 (14.3%) | 176 (1.6%) |
| 4-Person Households | 1,359 (12.6%) | 28 (0.3%) |
| 5-Person Households | 505 (4.7%) | 6 (0.1%) |
| 6-Person Households | 254 (2.4%) | 0 (0.0%) |
| 7+ Person Households | 214 (2.0%) | 36 (0.3%) |
| Total | 6,785 (63.1%) | 3,975 (36.9%) |
Female Fertility in Elmore County
Fertility by Age in Elmore County
Average fertility rate in Elmore County is 65.0 births per 1,000 women. Women in the age bracket of 20 to 34 years have the highest fertility rate with 103.0 births per 1,000 women. Women in the age bracket of 20 to 34 years acount for 86.3% of all women with births.
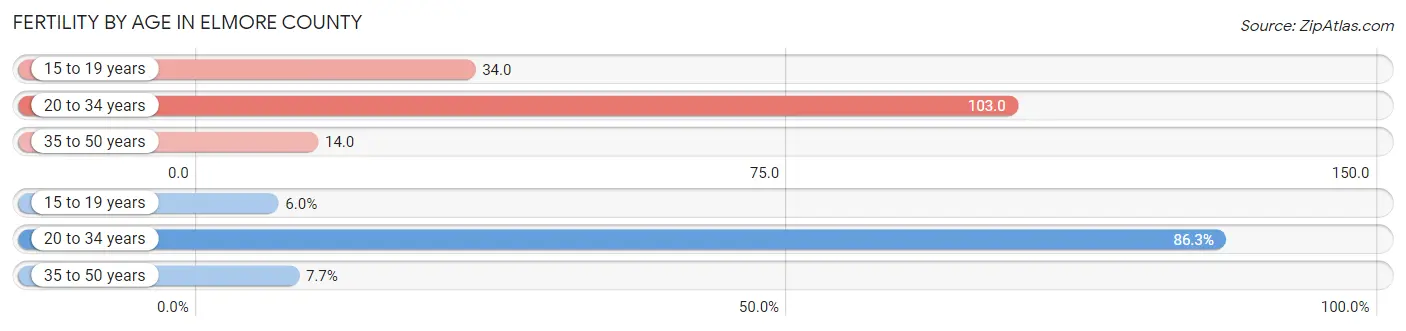
| Age Bracket | Women with Births | Births / 1,000 Women |
| 15 to 19 years | 24 (6.0%) | 34.0 |
| 20 to 34 years | 347 (86.3%) | 103.0 |
| 35 to 50 years | 31 (7.7%) | 14.0 |
| Total | 402 (100.0%) | 65.0 |
Fertility by Age by Marriage Status in Elmore County
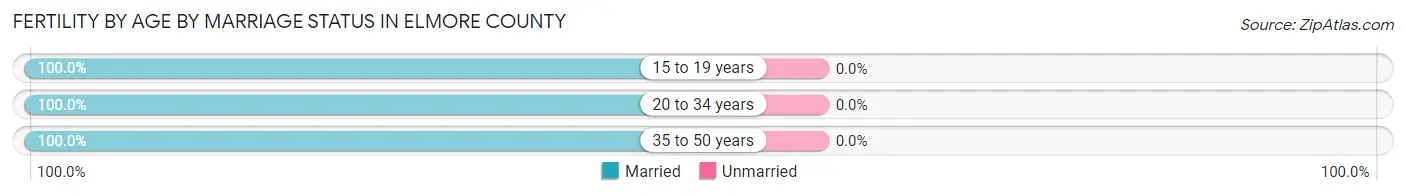
| Age Bracket | Married | Unmarried |
| 15 to 19 years | 24 (100.0%) | 0 (0.0%) |
| 20 to 34 years | 347 (100.0%) | 0 (0.0%) |
| 35 to 50 years | 31 (100.0%) | 0 (0.0%) |
| Total | 402 (100.0%) | 0 (0.0%) |
Fertility by Education in Elmore County
Average fertility rate in Elmore County is 65.0 births per 1,000 women. Women with the education attainment of high school diploma have the highest fertility rate of 98.0 births per 1,000 women, while women with the education attainment of graduate degree have the lowest fertility at 41.0 births per 1,000 women. Women with the education attainment of college or associate's degree represent 35.3% of all women with births.
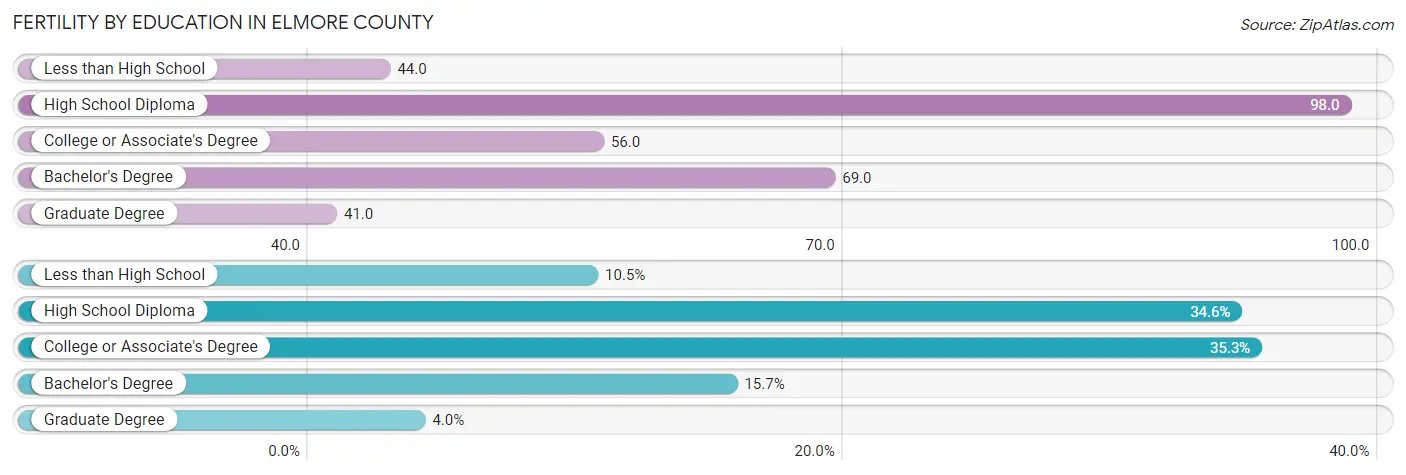
| Educational Attainment | Women with Births | Births / 1,000 Women |
| Less than High School | 42 (10.4%) | 44.0 |
| High School Diploma | 139 (34.6%) | 98.0 |
| College or Associate's Degree | 142 (35.3%) | 56.0 |
| Bachelor's Degree | 63 (15.7%) | 69.0 |
| Graduate Degree | 16 (4.0%) | 41.0 |
| Total | 402 (100.0%) | 65.0 |
Fertility by Education by Marriage Status in Elmore County
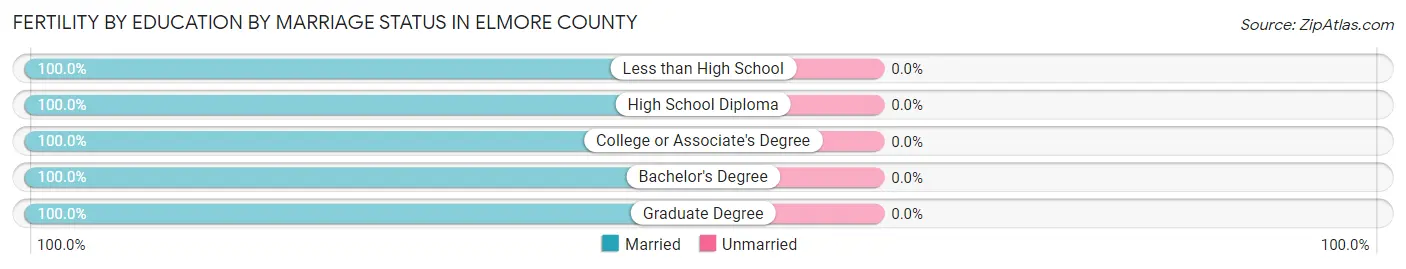
| Educational Attainment | Married | Unmarried |
| Less than High School | 42 (100.0%) | 0 (0.0%) |
| High School Diploma | 139 (100.0%) | 0 (0.0%) |
| College or Associate's Degree | 142 (100.0%) | 0 (0.0%) |
| Bachelor's Degree | 63 (100.0%) | 0 (0.0%) |
| Graduate Degree | 16 (100.0%) | 0 (0.0%) |
| Total | 402 (100.0%) | 0 (0.0%) |
Income in Elmore County
Income Overview in Elmore County
Per Capita Income in Elmore County is $28,599, while median incomes of families and households are $66,547 and $55,000 respectively.
| Characteristic | Number | Measure |
| Per Capita Income | 28,752 | $28,599 |
| Median Family Income | 6,785 | $66,547 |
| Mean Family Income | 6,785 | $82,127 |
| Median Household Income | 10,760 | $55,000 |
| Mean Household Income | 10,760 | $72,029 |
| Income Deficit | 6,785 | $10,895 |
| Wage / Income Gap (%) | 28,752 | 29.25% |
| Wage / Income Gap ($) | 28,752 | 70.75¢ per $1 |
| Gini / Inequality Index | 28,752 | 0.42 |
Earnings by Sex in Elmore County
Average Earnings in Elmore County are $34,424, $40,056 for men and $28,340 for women, a difference of 29.2%.
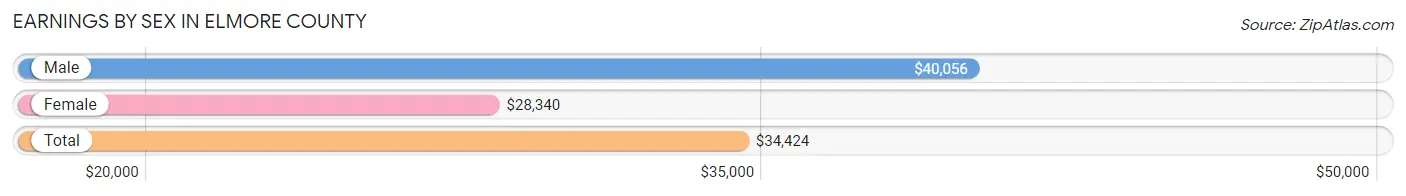
| Sex | Number | Average Earnings |
| Male | 8,770 (59.9%) | $40,056 |
| Female | 5,879 (40.1%) | $28,340 |
| Total | 14,649 (100.0%) | $34,424 |
Earnings by Sex by Income Bracket in Elmore County
The most common earnings brackets in Elmore County are $25,000 to $29,999 for men (804 | 9.2%) and $30,000 to $34,999 for women (638 | 10.8%).
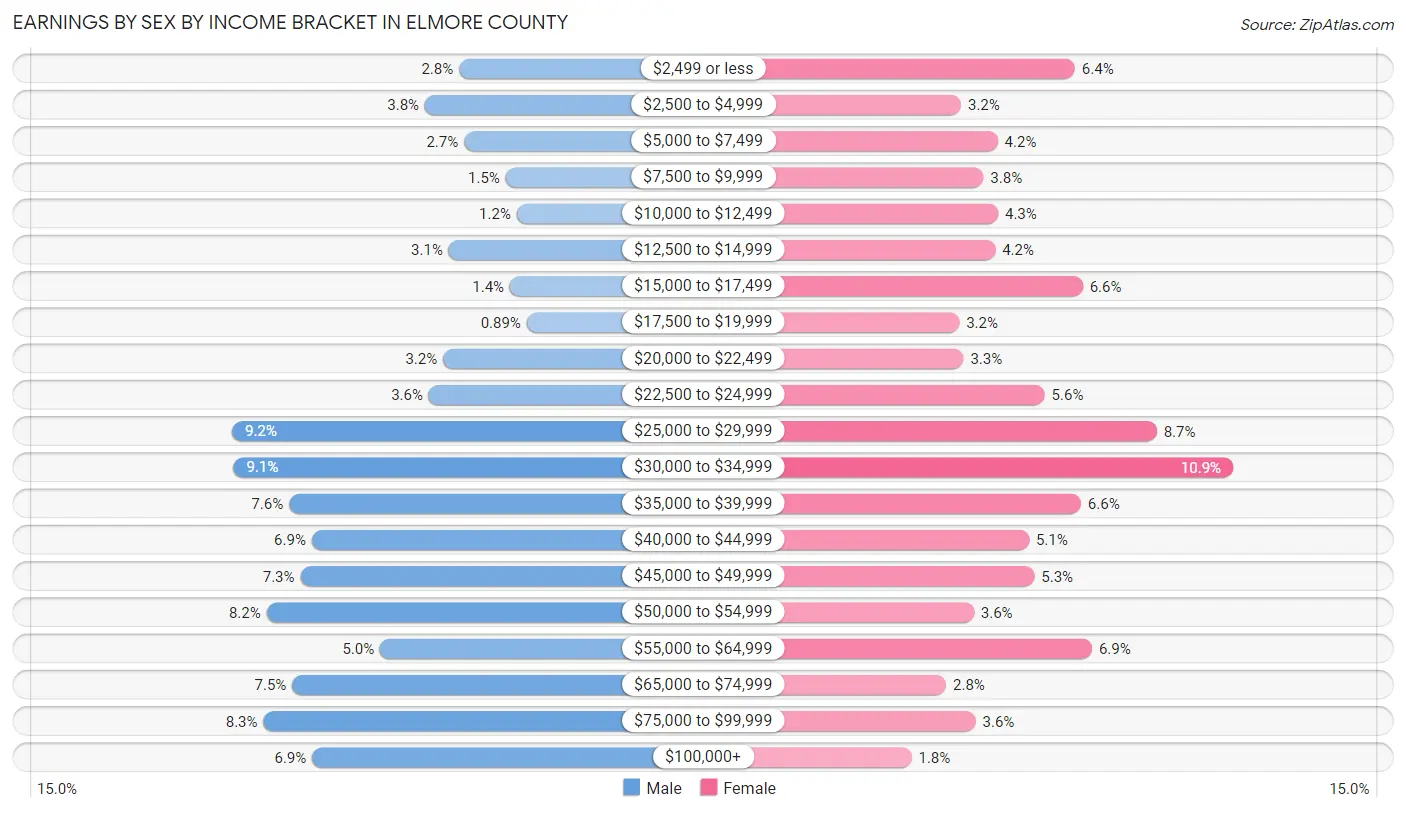
| Income | Male | Female |
| $2,499 or less | 245 (2.8%) | 377 (6.4%) |
| $2,500 to $4,999 | 329 (3.7%) | 189 (3.2%) |
| $5,000 to $7,499 | 232 (2.6%) | 249 (4.2%) |
| $7,500 to $9,999 | 130 (1.5%) | 226 (3.8%) |
| $10,000 to $12,499 | 103 (1.2%) | 250 (4.3%) |
| $12,500 to $14,999 | 270 (3.1%) | 245 (4.2%) |
| $15,000 to $17,499 | 119 (1.4%) | 390 (6.6%) |
| $17,500 to $19,999 | 78 (0.9%) | 186 (3.2%) |
| $20,000 to $22,499 | 284 (3.2%) | 193 (3.3%) |
| $22,500 to $24,999 | 319 (3.6%) | 327 (5.6%) |
| $25,000 to $29,999 | 804 (9.2%) | 512 (8.7%) |
| $30,000 to $34,999 | 801 (9.1%) | 638 (10.8%) |
| $35,000 to $39,999 | 664 (7.6%) | 387 (6.6%) |
| $40,000 to $44,999 | 608 (6.9%) | 301 (5.1%) |
| $45,000 to $49,999 | 636 (7.2%) | 310 (5.3%) |
| $50,000 to $54,999 | 719 (8.2%) | 210 (3.6%) |
| $55,000 to $64,999 | 439 (5.0%) | 405 (6.9%) |
| $65,000 to $74,999 | 656 (7.5%) | 164 (2.8%) |
| $75,000 to $99,999 | 727 (8.3%) | 213 (3.6%) |
| $100,000+ | 607 (6.9%) | 107 (1.8%) |
| Total | 8,770 (100.0%) | 5,879 (100.0%) |
Earnings by Sex by Educational Attainment in Elmore County
Average earnings in Elmore County are $46,040 for men and $29,781 for women, a difference of 35.3%. Men with an educational attainment of bachelor's degree enjoy the highest average annual earnings of $81,298, while those with high school diploma education earn the least with $35,167. Women with an educational attainment of graduate degree earn the most with the average annual earnings of $72,120, while those with less than high school education have the smallest earnings of $14,908.
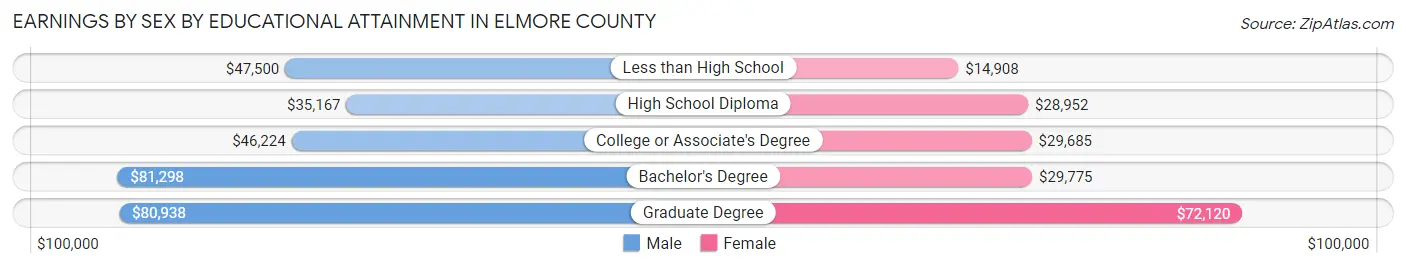
| Educational Attainment | Male Income | Female Income |
| Less than High School | $47,500 | $14,908 |
| High School Diploma | $35,167 | $28,952 |
| College or Associate's Degree | $46,224 | $29,685 |
| Bachelor's Degree | $81,298 | $29,775 |
| Graduate Degree | $80,938 | $72,120 |
| Total | $46,040 | $29,781 |
Family Income in Elmore County
Family Income Brackets in Elmore County
According to the Elmore County family income data, there are 1,316 families falling into the $50,000 to $74,999 income range, which is the most common income bracket and makes up 19.4% of all families. Conversely, the $10,000 to $14,999 income bracket is the least frequent group with only 129 families (1.9%) belonging to this category.
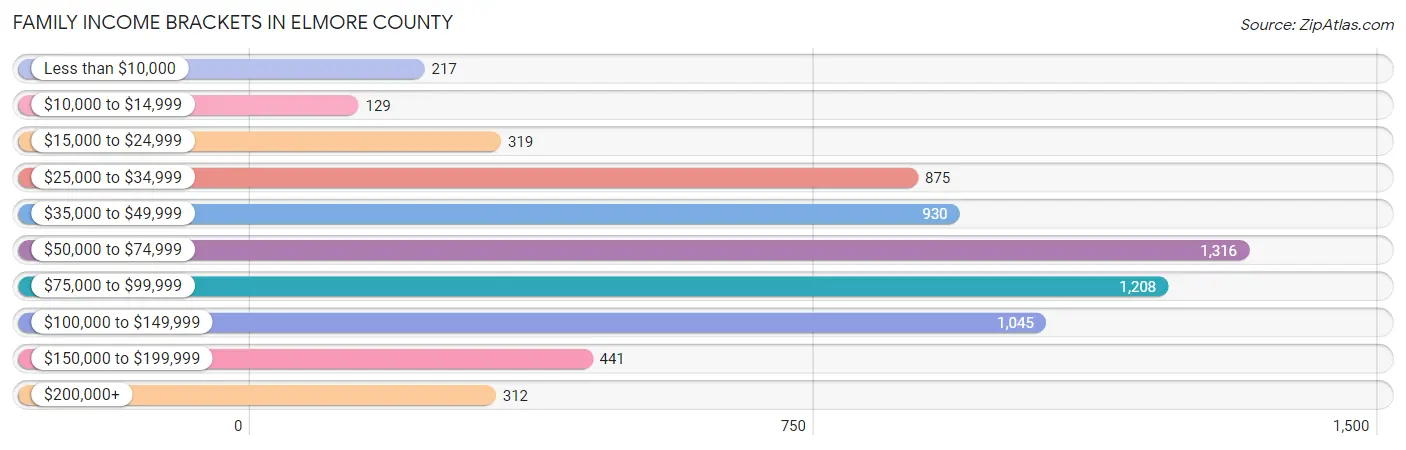
| Income Bracket | # Families | % Families |
| Less than $10,000 | 217 | 3.2% |
| $10,000 to $14,999 | 129 | 1.9% |
| $15,000 to $24,999 | 319 | 4.7% |
| $25,000 to $34,999 | 875 | 12.9% |
| $35,000 to $49,999 | 930 | 13.7% |
| $50,000 to $74,999 | 1,316 | 19.4% |
| $75,000 to $99,999 | 1,208 | 17.8% |
| $100,000 to $149,999 | 1,045 | 15.4% |
| $150,000 to $199,999 | 441 | 6.5% |
| $200,000+ | 312 | 4.6% |
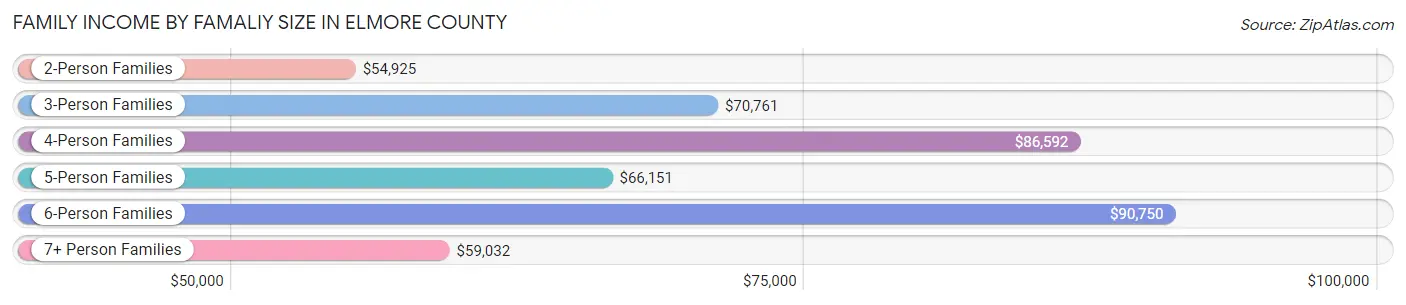
Family Income by Famaliy Size in Elmore County
6-person families (182 | 2.7%) account for the highest median family income in Elmore County with $90,750 per family, while 2-person families (3,215 | 47.4%) have the highest median income of $27,462 per family member.
| Income Bracket | # Families | Median Income |
| 2-Person Families | 3,215 (47.4%) | $54,925 |
| 3-Person Families | 1,522 (22.4%) | $70,761 |
| 4-Person Families | 1,123 (16.6%) | $86,592 |
| 5-Person Families | 533 (7.9%) | $66,151 |
| 6-Person Families | 182 (2.7%) | $90,750 |
| 7+ Person Families | 210 (3.1%) | $59,032 |
| Total | 6,785 (100.0%) | $66,547 |
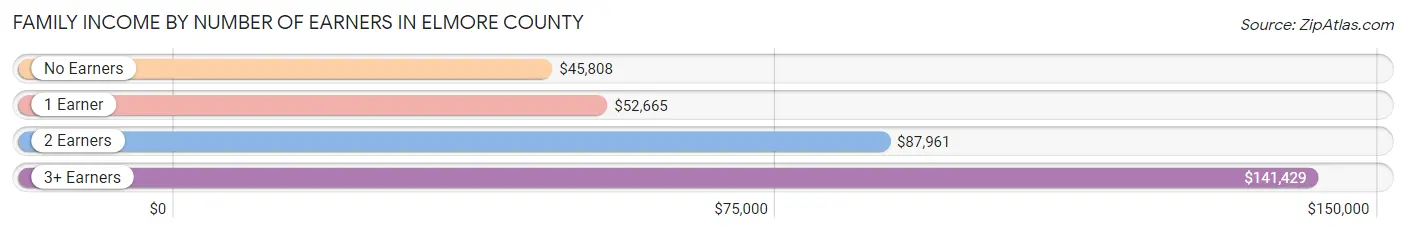
Family Income by Number of Earners in Elmore County
The median family income in Elmore County is $66,547, with families comprising 3+ earners (522) having the highest median family income of $141,429, while families with no earners (1,230) have the lowest median family income of $45,808, accounting for 7.7% and 18.1% of families, respectively.
| Number of Earners | # Families | Median Income |
| No Earners | 1,230 (18.1%) | $45,808 |
| 1 Earner | 2,433 (35.9%) | $52,665 |
| 2 Earners | 2,600 (38.3%) | $87,961 |
| 3+ Earners | 522 (7.7%) | $141,429 |
| Total | 6,785 (100.0%) | $66,547 |
Household Income in Elmore County
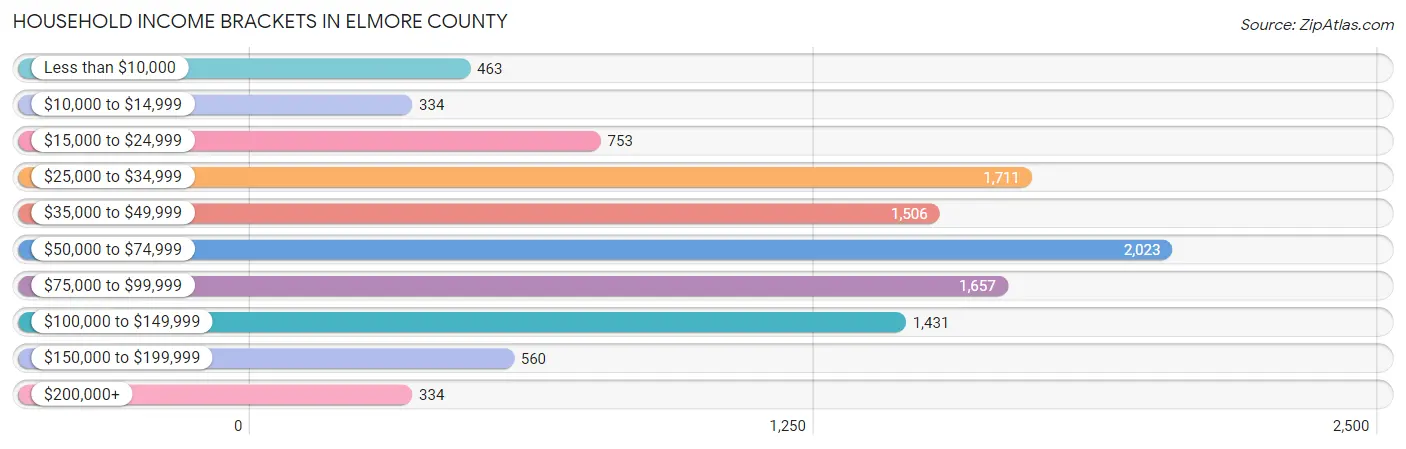
Household Income Brackets in Elmore County
With 2,023 households falling in the category, the $50,000 to $74,999 income range is the most frequent in Elmore County, accounting for 18.8% of all households. In contrast, only 334 households (3.1%) fall into the $10,000 to $14,999 income bracket, making it the least populous group.
| Income Bracket | # Households | % Households |
| Less than $10,000 | 463 | 4.3% |
| $10,000 to $14,999 | 334 | 3.1% |
| $15,000 to $24,999 | 753 | 7.0% |
| $25,000 to $34,999 | 1,711 | 15.9% |
| $35,000 to $49,999 | 1,506 | 14.0% |
| $50,000 to $74,999 | 2,023 | 18.8% |
| $75,000 to $99,999 | 1,657 | 15.4% |
| $100,000 to $149,999 | 1,431 | 13.3% |
| $150,000 to $199,999 | 560 | 5.2% |
| $200,000+ | 334 | 3.1% |
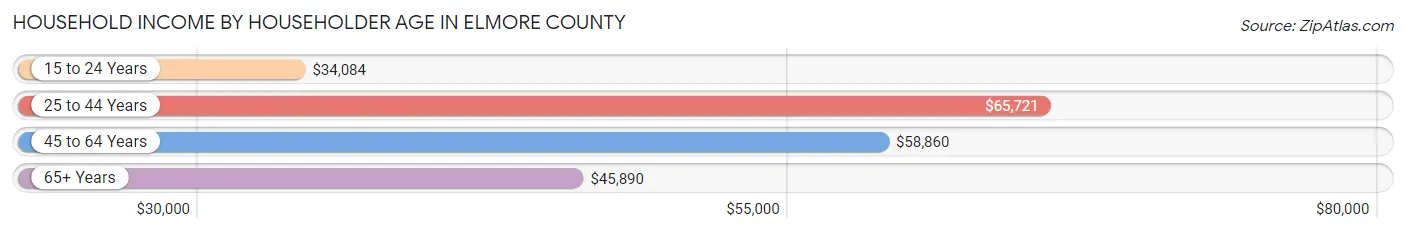
Household Income by Householder Age in Elmore County
The median household income in Elmore County is $55,000, with the highest median household income of $65,721 found in the 25 to 44 years age bracket for the primary householder. A total of 4,148 households (38.6%) fall into this category. Meanwhile, the 15 to 24 years age bracket for the primary householder has the lowest median household income of $34,084, with 888 households (8.3%) in this group.
| Income Bracket | # Households | Median Income |
| 15 to 24 Years | 888 (8.3%) | $34,084 |
| 25 to 44 Years | 4,148 (38.6%) | $65,721 |
| 45 to 64 Years | 3,192 (29.7%) | $58,860 |
| 65+ Years | 2,532 (23.5%) | $45,890 |
| Total | 10,760 (100.0%) | $55,000 |
Poverty in Elmore County
Income Below Poverty by Sex and Age in Elmore County
With 10.9% poverty level for males and 13.2% for females among the residents of Elmore County, 18 to 24 year old males and under 5 year old females are the most vulnerable to poverty, with 288 males (19.3%) and 185 females (19.0%) in their respective age groups living below the poverty level.
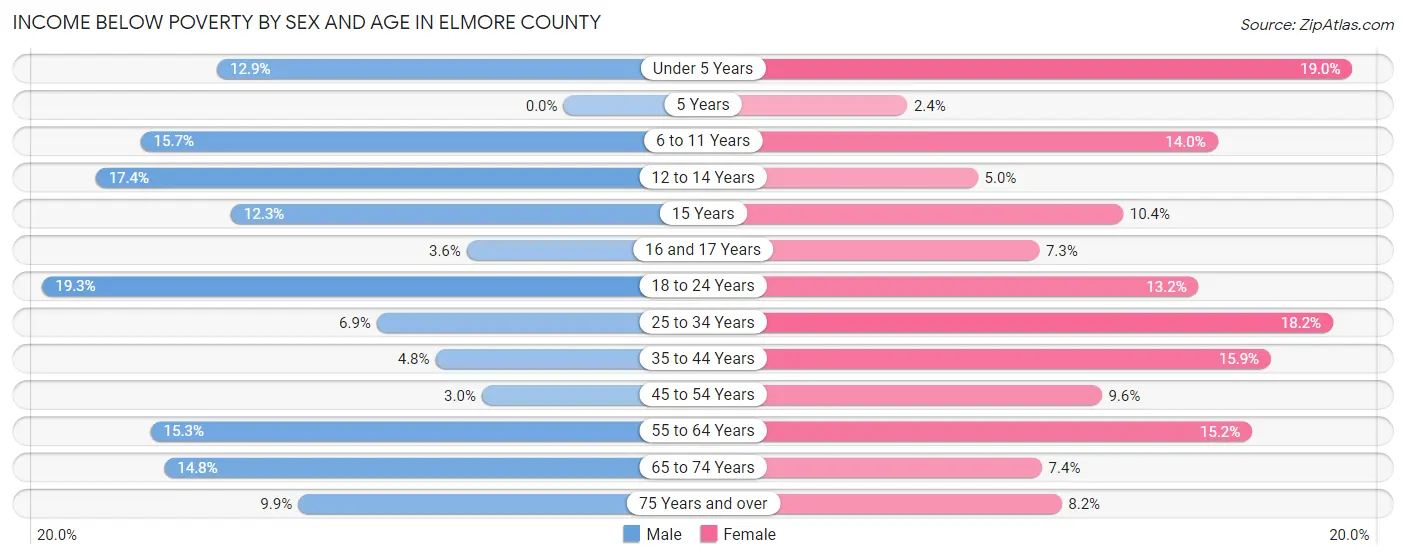
| Age Bracket | Male | Female |
| Under 5 Years | 150 (12.9%) | 185 (19.0%) |
| 5 Years | 0 (0.0%) | 3 (2.4%) |
| 6 to 11 Years | 187 (15.7%) | 129 (14.0%) |
| 12 to 14 Years | 104 (17.4%) | 33 (5.0%) |
| 15 Years | 38 (12.3%) | 22 (10.4%) |
| 16 and 17 Years | 9 (3.6%) | 15 (7.3%) |
| 18 to 24 Years | 288 (19.3%) | 174 (13.2%) |
| 25 to 34 Years | 188 (6.9%) | 397 (18.2%) |
| 35 to 44 Years | 80 (4.8%) | 222 (15.9%) |
| 45 to 54 Years | 40 (3.0%) | 137 (9.6%) |
| 55 to 64 Years | 234 (15.3%) | 251 (15.2%) |
| 65 to 74 Years | 170 (14.8%) | 84 (7.4%) |
| 75 Years and over | 73 (9.9%) | 72 (8.2%) |
| Total | 1,561 (10.9%) | 1,724 (13.2%) |
Income Above Poverty by Sex and Age in Elmore County
According to the poverty statistics in Elmore County, males aged 5 years and females aged 5 years are the age groups that are most secure financially, with 100.0% of males and 97.6% of females in these age groups living above the poverty line.
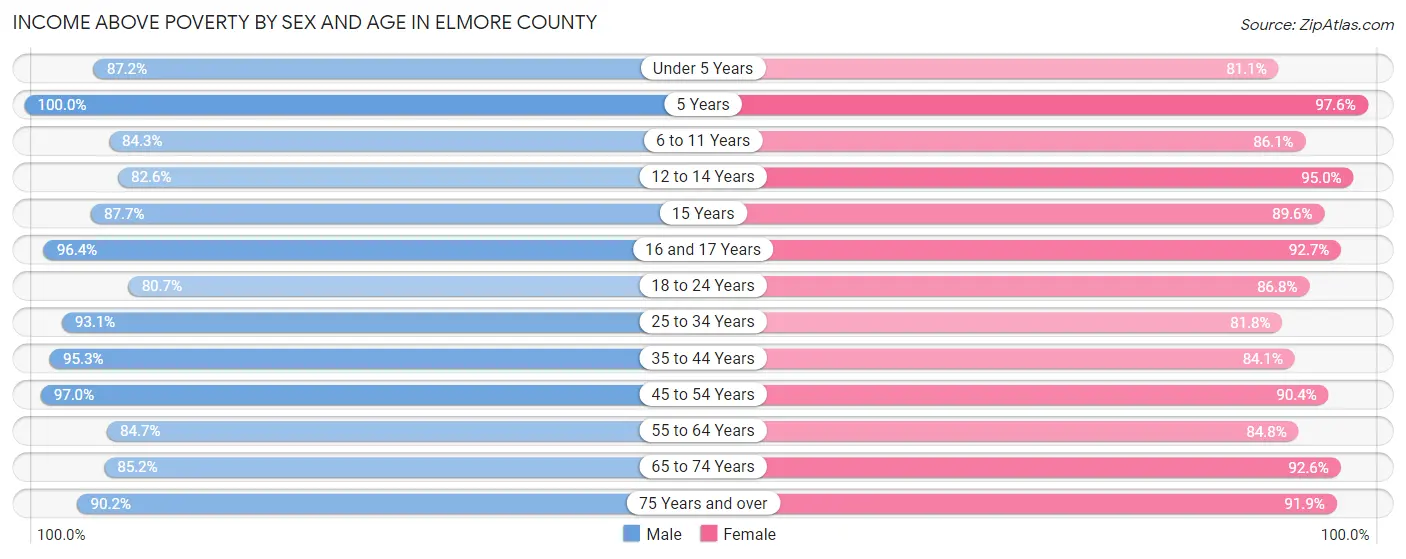
| Age Bracket | Male | Female |
| Under 5 Years | 1,017 (87.2%) | 791 (81.0%) |
| 5 Years | 135 (100.0%) | 121 (97.6%) |
| 6 to 11 Years | 1,005 (84.3%) | 796 (86.1%) |
| 12 to 14 Years | 495 (82.6%) | 622 (95.0%) |
| 15 Years | 270 (87.7%) | 189 (89.6%) |
| 16 and 17 Years | 242 (96.4%) | 190 (92.7%) |
| 18 to 24 Years | 1,201 (80.7%) | 1,140 (86.8%) |
| 25 to 34 Years | 2,523 (93.1%) | 1,781 (81.8%) |
| 35 to 44 Years | 1,604 (95.3%) | 1,172 (84.1%) |
| 45 to 54 Years | 1,279 (97.0%) | 1,284 (90.4%) |
| 55 to 64 Years | 1,293 (84.7%) | 1,397 (84.8%) |
| 65 to 74 Years | 978 (85.2%) | 1,048 (92.6%) |
| 75 Years and over | 668 (90.1%) | 811 (91.8%) |
| Total | 12,710 (89.1%) | 11,342 (86.8%) |
Income Below Poverty Among Married-Couple Families in Elmore County
The poverty statistics for married-couple families in Elmore County show that 5.7% or 289 of the total 5,056 families live below the poverty line. Families with 5 or more children have the highest poverty rate of 22.0%, comprising of 27 families. On the other hand, families with no children have the lowest poverty rate of 3.2%, which includes 84 families.
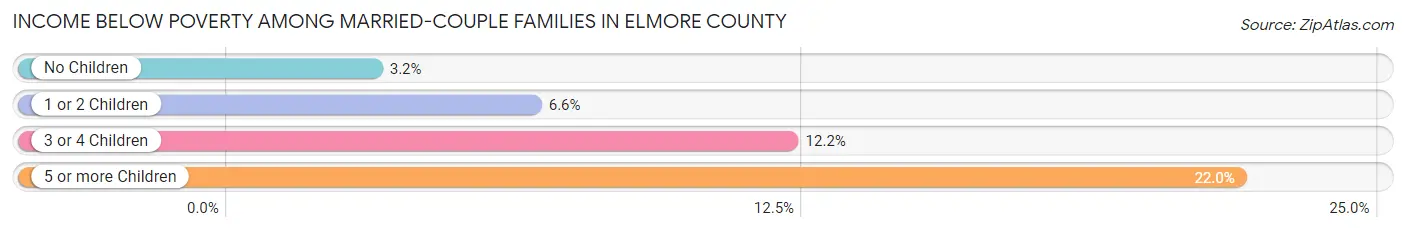
| Children | Above Poverty | Below Poverty |
| No Children | 2,579 (96.9%) | 84 (3.2%) |
| 1 or 2 Children | 1,653 (93.4%) | 117 (6.6%) |
| 3 or 4 Children | 439 (87.8%) | 61 (12.2%) |
| 5 or more Children | 96 (78.0%) | 27 (22.0%) |
| Total | 4,767 (94.3%) | 289 (5.7%) |
Income Below Poverty Among Single-Parent Households in Elmore County
According to the poverty data in Elmore County, 12.2% or 57 single-father households and 21.9% or 276 single-mother households are living below the poverty line. Among single-father households, those with 1 or 2 children have the highest poverty rate, with 30 households (13.3%) experiencing poverty. Likewise, among single-mother households, those with 1 or 2 children have the highest poverty rate, with 218 households (28.0%) falling below the poverty line.
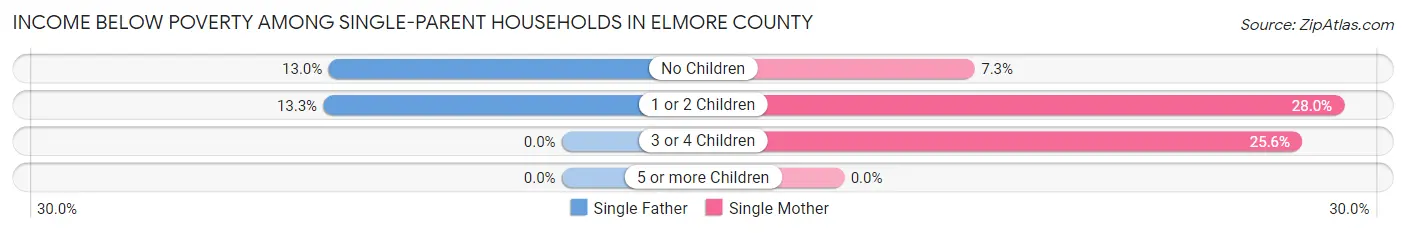
| Children | Single Father | Single Mother |
| No Children | 27 (13.0%) | 26 (7.3%) |
| 1 or 2 Children | 30 (13.3%) | 218 (28.0%) |
| 3 or 4 Children | 0 (0.0%) | 32 (25.6%) |
| 5 or more Children | 0 (0.0%) | 0 (0.0%) |
| Total | 57 (12.2%) | 276 (21.9%) |
Income Below Poverty Among Married-Couple vs Single-Parent Households in Elmore County
The poverty data for Elmore County shows that 289 of the married-couple family households (5.7%) and 333 of the single-parent households (19.3%) are living below the poverty level. Within the married-couple family households, those with 5 or more children have the highest poverty rate, with 27 households (22.0%) falling below the poverty line. Among the single-parent households, those with 1 or 2 children have the highest poverty rate, with 248 household (24.7%) living below poverty.
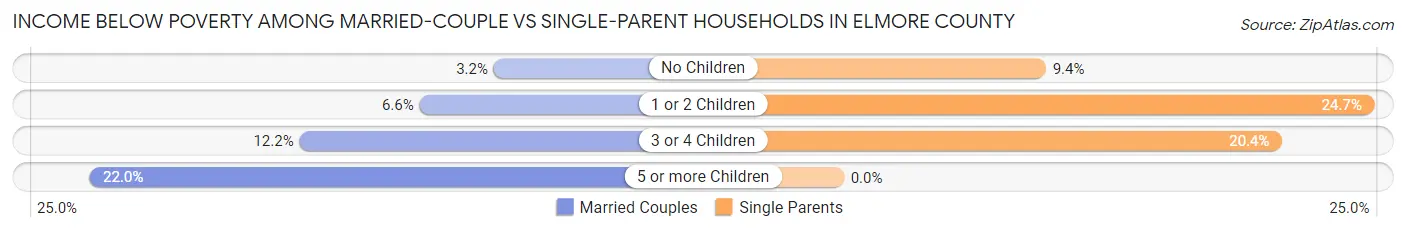
| Children | Married-Couple Families | Single-Parent Households |
| No Children | 84 (3.2%) | 53 (9.4%) |
| 1 or 2 Children | 117 (6.6%) | 248 (24.7%) |
| 3 or 4 Children | 61 (12.2%) | 32 (20.4%) |
| 5 or more Children | 27 (22.0%) | 0 (0.0%) |
| Total | 289 (5.7%) | 333 (19.3%) |
Employment Characteristics in Elmore County
Employment by Class of Employer in Elmore County
Among the 13,077 employed individuals in Elmore County, private company employees (5,957 | 45.6%), federal government employees (4,292 | 32.8%), and self-employed (not incorporated) (978 | 7.5%) make up the most common classes of employment.
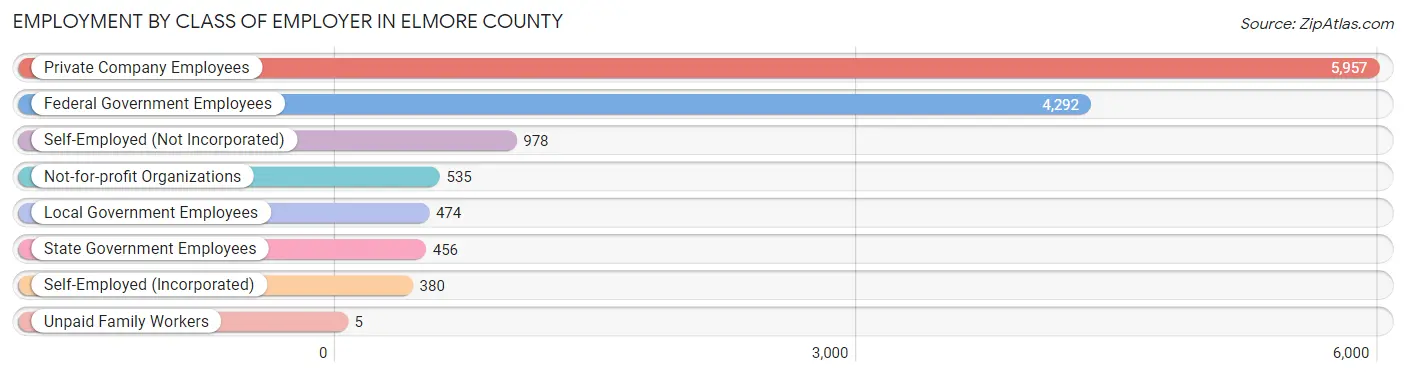
| Employer Class | # Employees | % Employees |
| Private Company Employees | 5,957 | 45.6% |
| Self-Employed (Incorporated) | 380 | 2.9% |
| Self-Employed (Not Incorporated) | 978 | 7.5% |
| Not-for-profit Organizations | 535 | 4.1% |
| Local Government Employees | 474 | 3.6% |
| State Government Employees | 456 | 3.5% |
| Federal Government Employees | 4,292 | 32.8% |
| Unpaid Family Workers | 5 | 0.0% |
| Total | 13,077 | 100.0% |
Employment Status by Age in Elmore County
According to the labor force statistics for Elmore County, out of the total population over 16 years of age (22,218), 62.8% or 13,953 individuals are in the labor force, with 6.4% or 893 of them unemployed. The age group with the highest labor force participation rate is 25 to 29 years, with 83.1% or 2,243 individuals in the labor force. Within the labor force, the 16 to 19 years age range has the highest percentage of unemployed individuals, with 34.1% or 209 of them being unemployed.
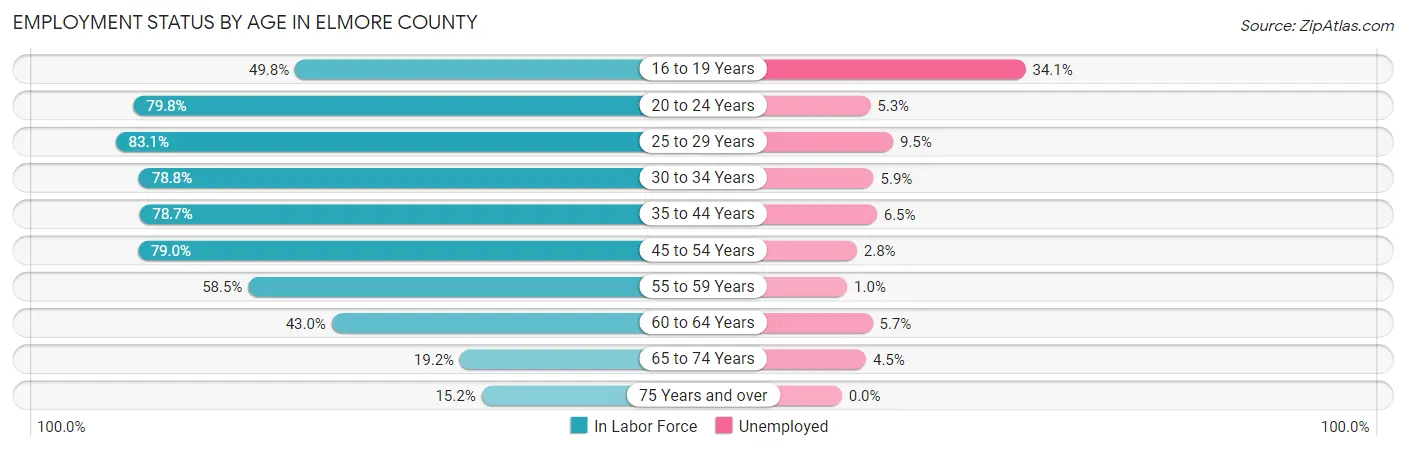
| Age Bracket | In Labor Force | Unemployed |
| 16 to 19 Years | 614 (49.8%) | 209 (34.1%) |
| 20 to 24 Years | 2,220 (79.8%) | 118 (5.3%) |
| 25 to 29 Years | 2,243 (83.1%) | 213 (9.5%) |
| 30 to 34 Years | 1,827 (78.8%) | 108 (5.9%) |
| 35 to 44 Years | 2,533 (78.7%) | 165 (6.5%) |
| 45 to 54 Years | 2,174 (79.0%) | 61 (2.8%) |
| 55 to 59 Years | 1,052 (58.5%) | 11 (1.0%) |
| 60 to 64 Years | 596 (43.0%) | 34 (5.7%) |
| 65 to 74 Years | 446 (19.2%) | 20 (4.5%) |
| 75 Years and over | 260 (15.2%) | 0 (0.0%) |
| Total | 13,953 (62.8%) | 893 (6.4%) |
Employment Status by Educational Attainment in Elmore County
According to labor force statistics for Elmore County, 73.5% of individuals (10,417) out of the total population between 25 and 64 years of age (14,173) are in the labor force, with 5.2% or 542 of them being unemployed. The group with the highest labor force participation rate are those with the educational attainment of bachelor's degree or higher, with 82.1% or 2,244 individuals in the labor force. Within the labor force, individuals with bachelor's degree or higher education have the highest percentage of unemployment, with 7.1% or 159 of them being unemployed.
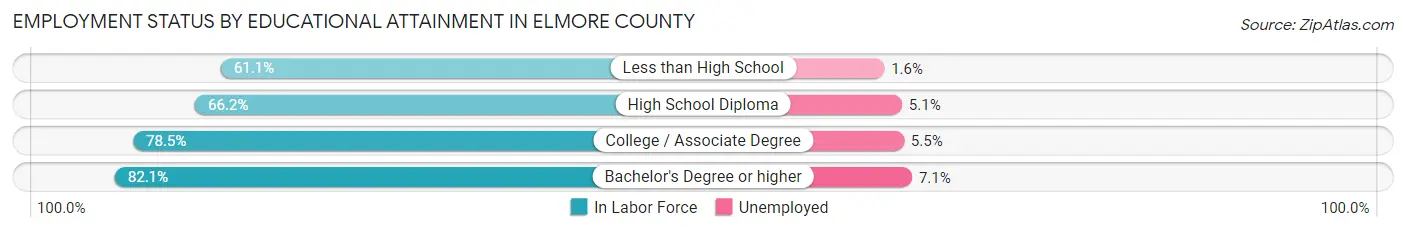
| Educational Attainment | In Labor Force | Unemployed |
| Less than High School | 1,108 (61.1%) | 29 (1.6%) |
| High School Diploma | 2,622 (66.2%) | 202 (5.1%) |
| College / Associate Degree | 4,448 (78.5%) | 312 (5.5%) |
| Bachelor's Degree or higher | 2,244 (82.1%) | 194 (7.1%) |
| Total | 10,417 (73.5%) | 737 (5.2%) |
Employment Occupations by Sex in Elmore County
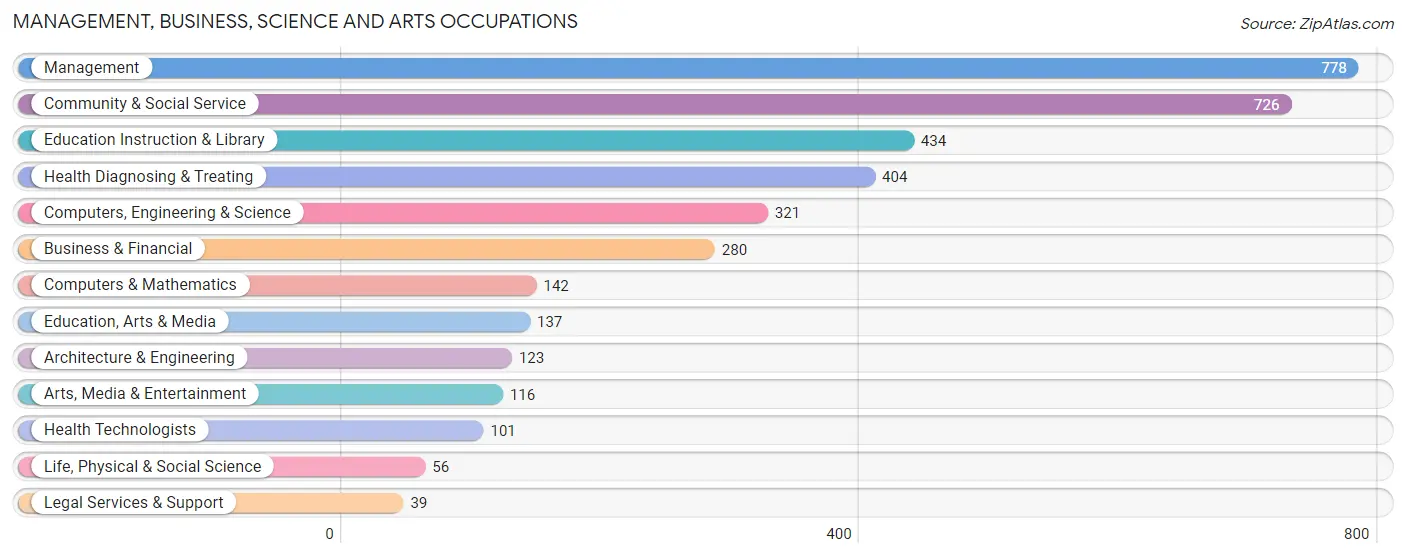
Management, Business, Science and Arts Occupations
The most common Management, Business, Science and Arts occupations in Elmore County are Management (778 | 7.8%), Community & Social Service (726 | 7.2%), Education Instruction & Library (434 | 4.3%), Health Diagnosing & Treating (404 | 4.0%), and Computers, Engineering & Science (321 | 3.2%).
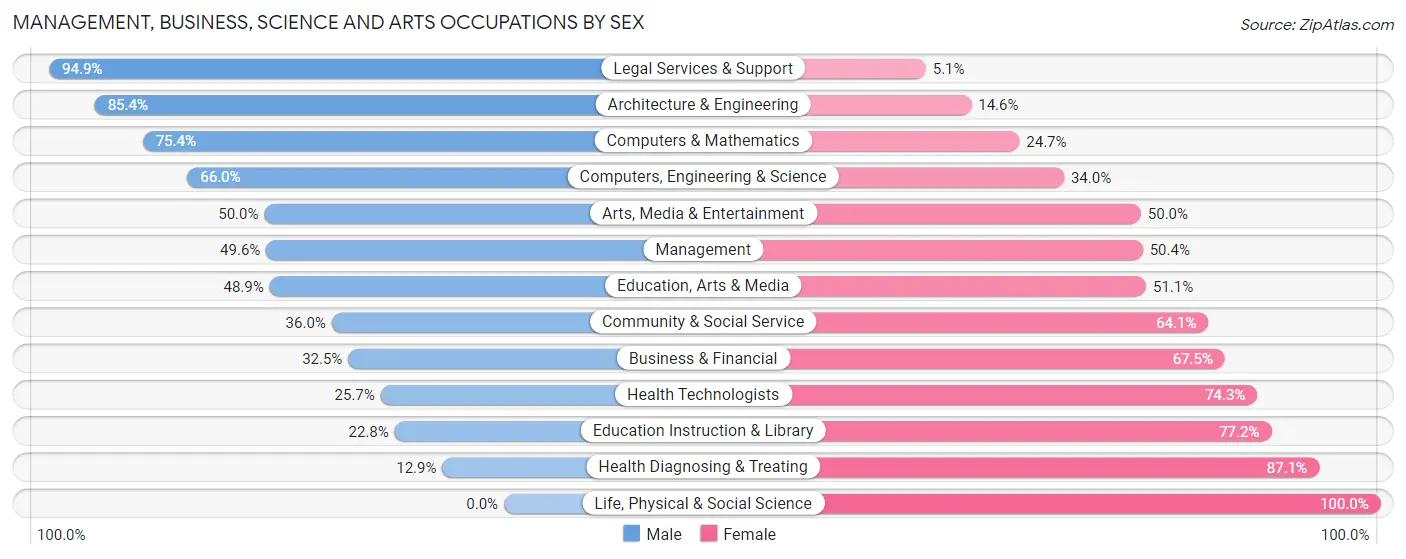
Management, Business, Science and Arts Occupations by Sex
Within the Management, Business, Science and Arts occupations in Elmore County, the most male-oriented occupations are Legal Services & Support (94.9%), Architecture & Engineering (85.4%), and Computers & Mathematics (75.3%), while the most female-oriented occupations are Life, Physical & Social Science (100.0%), Health Diagnosing & Treating (87.1%), and Education Instruction & Library (77.2%).
| Occupation | Male | Female |
| Management | 386 (49.6%) | 392 (50.4%) |
| Business & Financial | 91 (32.5%) | 189 (67.5%) |
| Computers, Engineering & Science | 212 (66.0%) | 109 (34.0%) |
| Computers & Mathematics | 107 (75.3%) | 35 (24.6%) |
| Architecture & Engineering | 105 (85.4%) | 18 (14.6%) |
| Life, Physical & Social Science | 0 (0.0%) | 56 (100.0%) |
| Community & Social Service | 261 (35.9%) | 465 (64.0%) |
| Education, Arts & Media | 67 (48.9%) | 70 (51.1%) |
| Legal Services & Support | 37 (94.9%) | 2 (5.1%) |
| Education Instruction & Library | 99 (22.8%) | 335 (77.2%) |
| Arts, Media & Entertainment | 58 (50.0%) | 58 (50.0%) |
| Health Diagnosing & Treating | 52 (12.9%) | 352 (87.1%) |
| Health Technologists | 26 (25.7%) | 75 (74.3%) |
| Total (Category) | 1,002 (39.9%) | 1,507 (60.1%) |
| Total (Overall) | 5,389 (53.8%) | 4,625 (46.2%) |
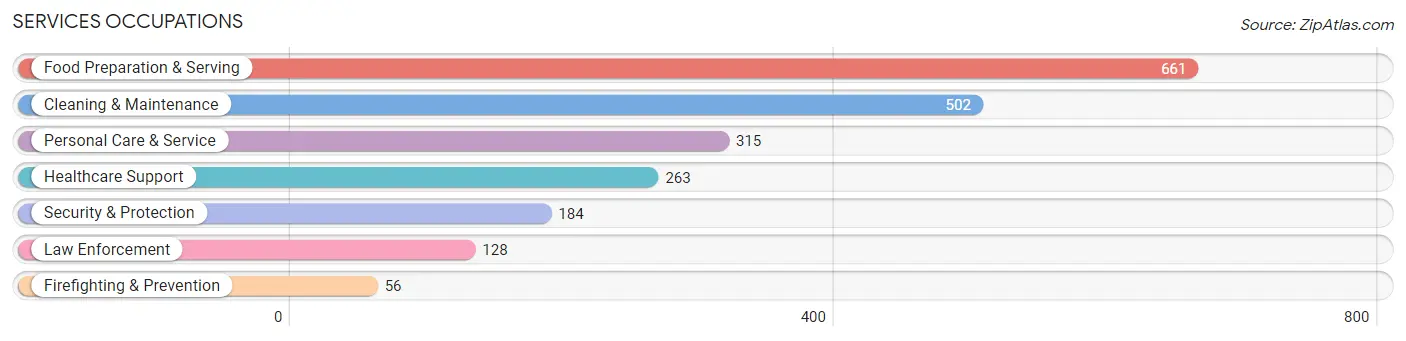
Services Occupations
The most common Services occupations in Elmore County are Food Preparation & Serving (661 | 6.6%), Cleaning & Maintenance (502 | 5.0%), Personal Care & Service (315 | 3.2%), Healthcare Support (263 | 2.6%), and Security & Protection (184 | 1.8%).
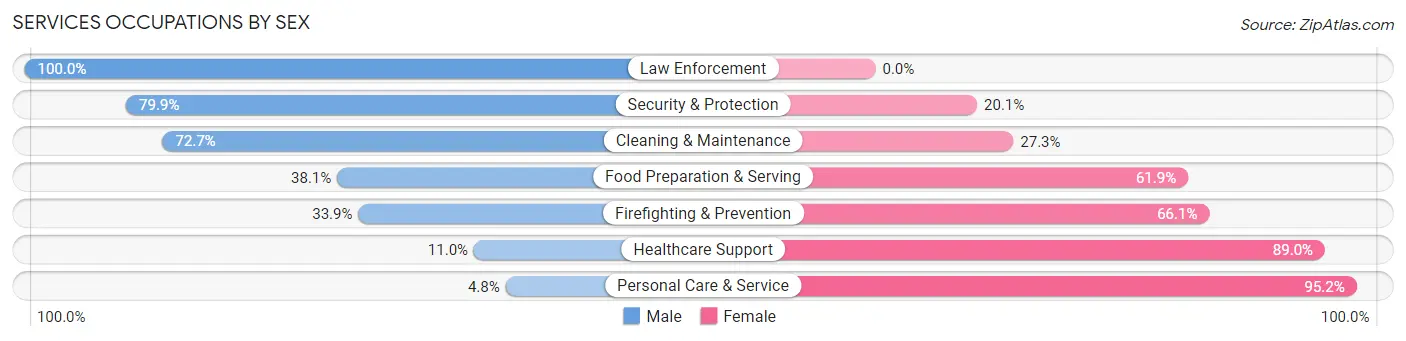
Services Occupations by Sex
Within the Services occupations in Elmore County, the most male-oriented occupations are Law Enforcement (100.0%), Security & Protection (79.9%), and Cleaning & Maintenance (72.7%), while the most female-oriented occupations are Personal Care & Service (95.2%), Healthcare Support (89.0%), and Firefighting & Prevention (66.1%).
| Occupation | Male | Female |
| Healthcare Support | 29 (11.0%) | 234 (89.0%) |
| Security & Protection | 147 (79.9%) | 37 (20.1%) |
| Firefighting & Prevention | 19 (33.9%) | 37 (66.1%) |
| Law Enforcement | 128 (100.0%) | 0 (0.0%) |
| Food Preparation & Serving | 252 (38.1%) | 409 (61.9%) |
| Cleaning & Maintenance | 365 (72.7%) | 137 (27.3%) |
| Personal Care & Service | 15 (4.8%) | 300 (95.2%) |
| Total (Category) | 808 (42.0%) | 1,117 (58.0%) |
| Total (Overall) | 5,389 (53.8%) | 4,625 (46.2%) |
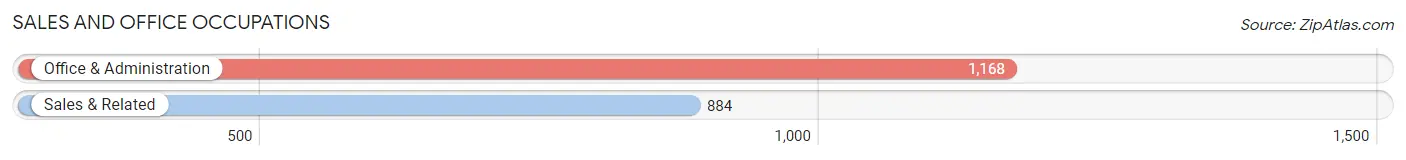
Sales and Office Occupations
The most common Sales and Office occupations in Elmore County are Office & Administration (1,168 | 11.7%), and Sales & Related (884 | 8.8%).
Sales and Office Occupations by Sex
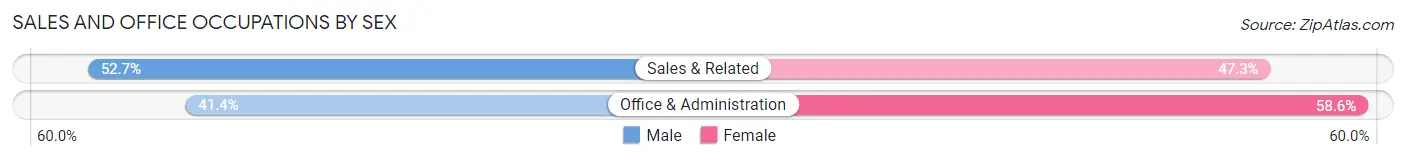
| Occupation | Male | Female |
| Sales & Related | 466 (52.7%) | 418 (47.3%) |
| Office & Administration | 484 (41.4%) | 684 (58.6%) |
| Total (Category) | 950 (46.3%) | 1,102 (53.7%) |
| Total (Overall) | 5,389 (53.8%) | 4,625 (46.2%) |
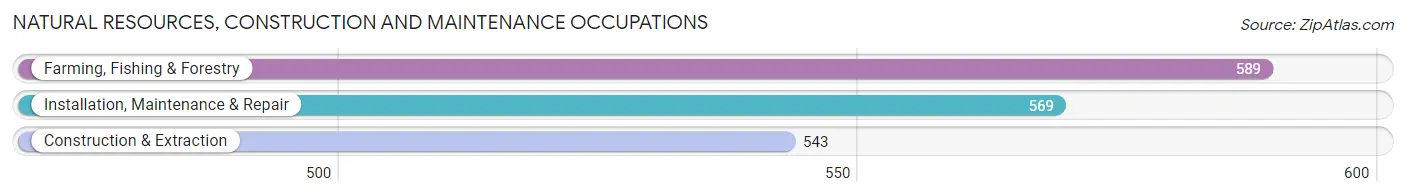
Natural Resources, Construction and Maintenance Occupations
The most common Natural Resources, Construction and Maintenance occupations in Elmore County are Farming, Fishing & Forestry (589 | 5.9%), Installation, Maintenance & Repair (569 | 5.7%), and Construction & Extraction (543 | 5.4%).
Natural Resources, Construction and Maintenance Occupations by Sex
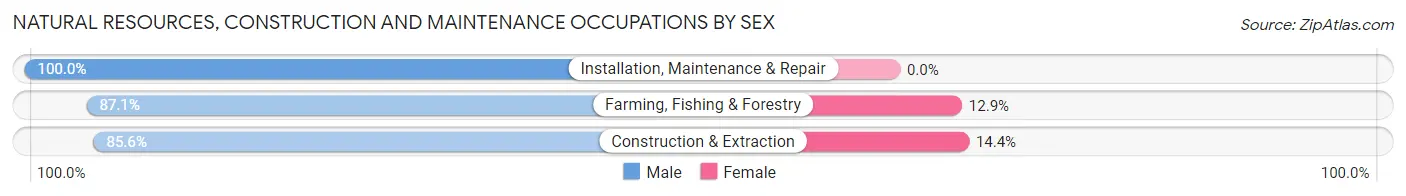
| Occupation | Male | Female |
| Farming, Fishing & Forestry | 513 (87.1%) | 76 (12.9%) |
| Construction & Extraction | 465 (85.6%) | 78 (14.4%) |
| Installation, Maintenance & Repair | 569 (100.0%) | 0 (0.0%) |
| Total (Category) | 1,547 (90.9%) | 154 (9.0%) |
| Total (Overall) | 5,389 (53.8%) | 4,625 (46.2%) |
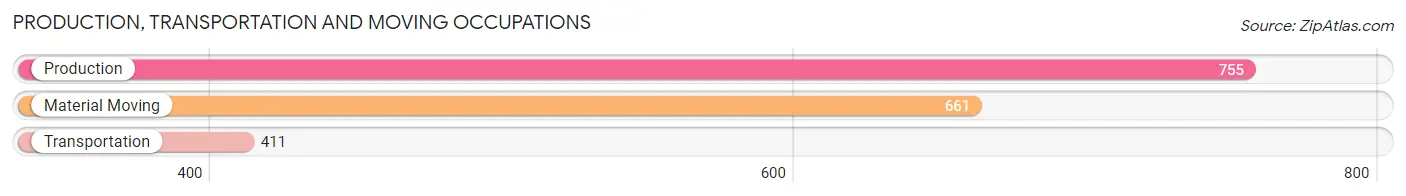
Production, Transportation and Moving Occupations
The most common Production, Transportation and Moving occupations in Elmore County are Production (755 | 7.5%), Material Moving (661 | 6.6%), and Transportation (411 | 4.1%).
Production, Transportation and Moving Occupations by Sex
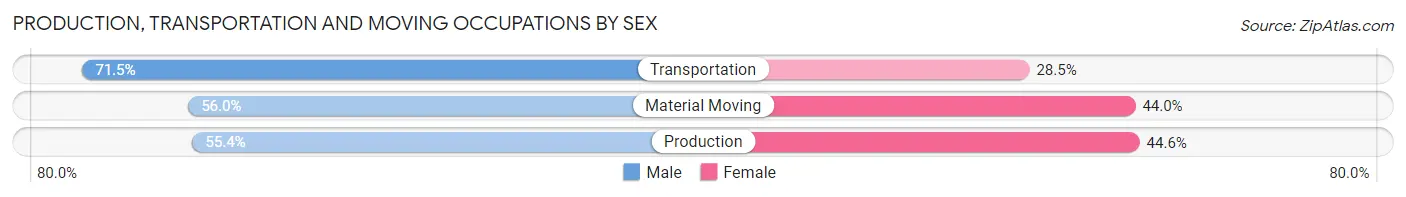
| Occupation | Male | Female |
| Production | 418 (55.4%) | 337 (44.6%) |
| Transportation | 294 (71.5%) | 117 (28.5%) |
| Material Moving | 370 (56.0%) | 291 (44.0%) |
| Total (Category) | 1,082 (59.2%) | 745 (40.8%) |
| Total (Overall) | 5,389 (53.8%) | 4,625 (46.2%) |
Employment Industries by Sex in Elmore County
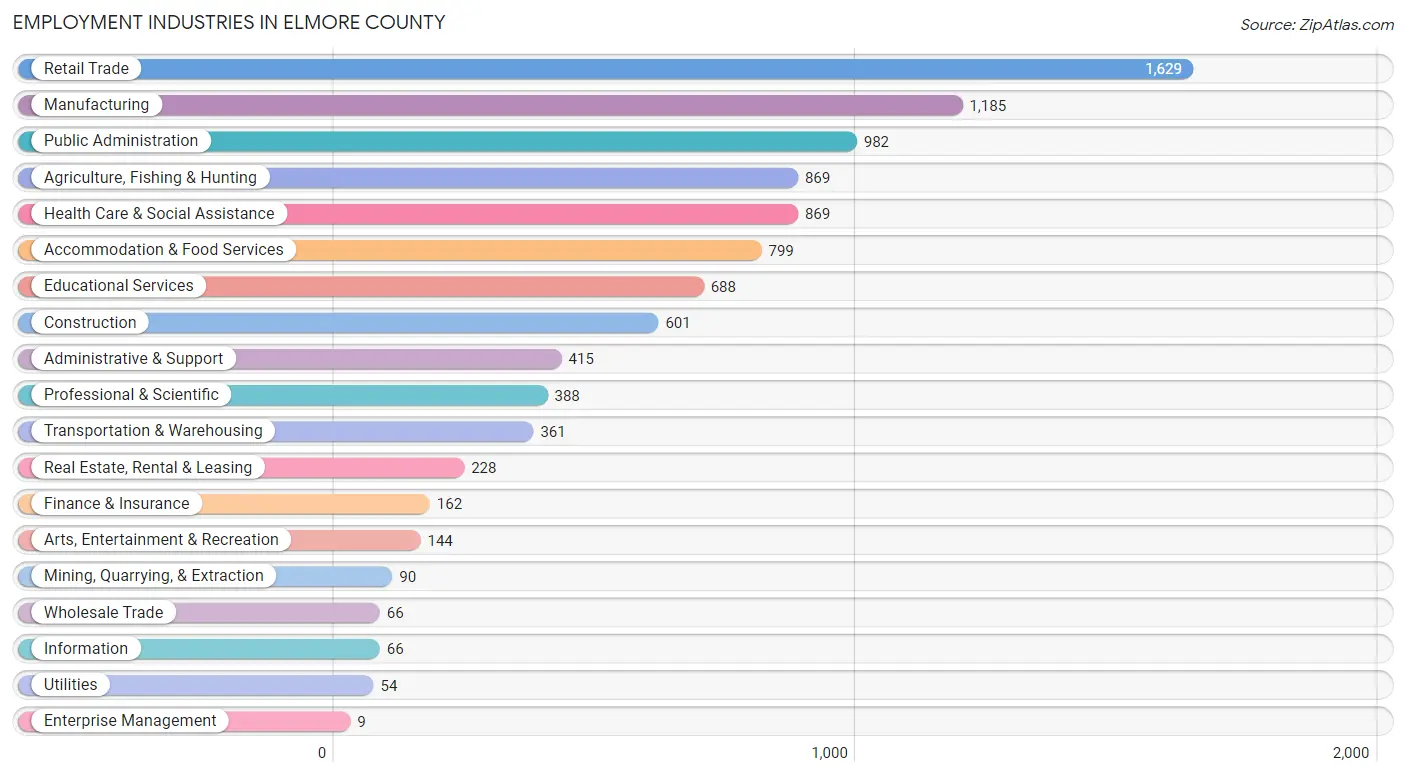
Employment Industries in Elmore County
The major employment industries in Elmore County include Retail Trade (1,629 | 16.3%), Manufacturing (1,185 | 11.8%), Public Administration (982 | 9.8%), Agriculture, Fishing & Hunting (869 | 8.7%), and Health Care & Social Assistance (869 | 8.7%).
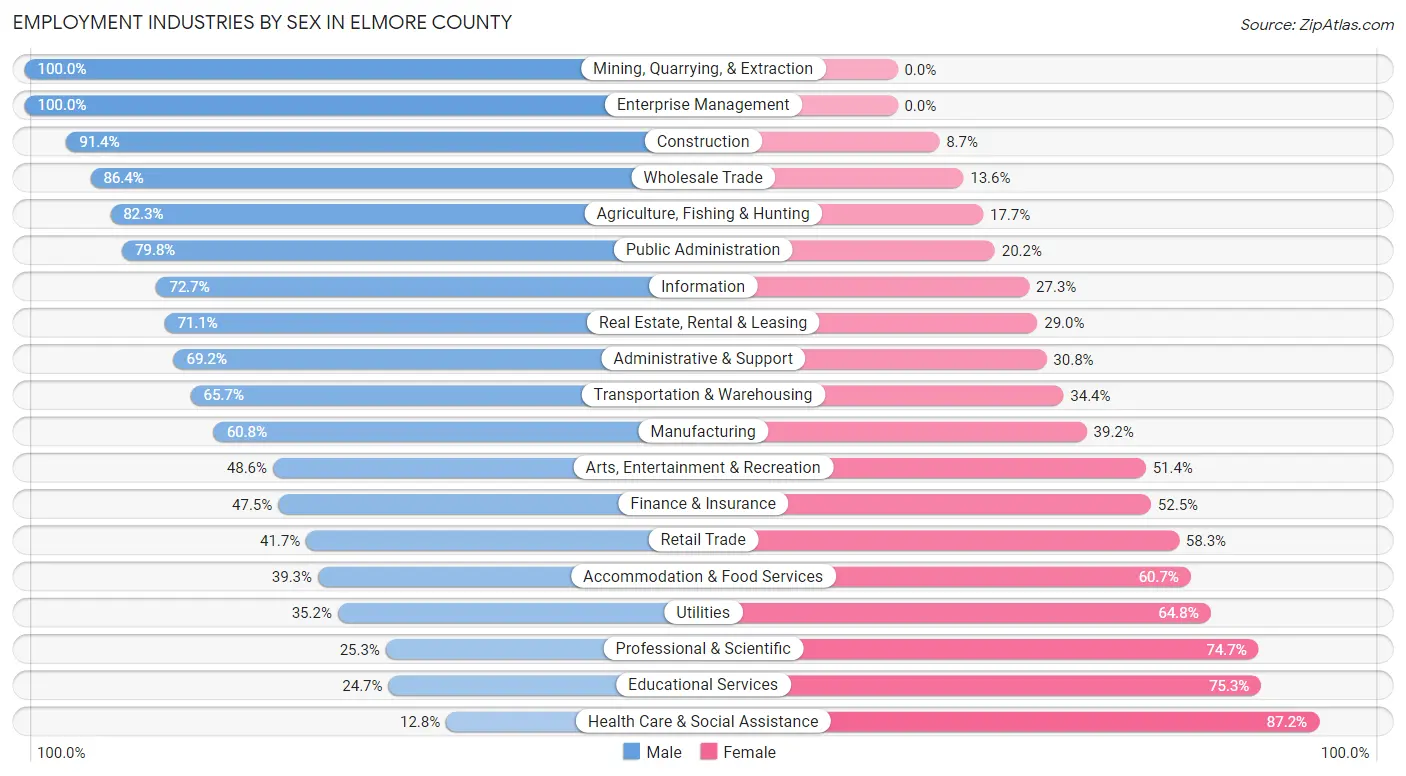
Employment Industries by Sex in Elmore County
The Elmore County industries that see more men than women are Mining, Quarrying, & Extraction (100.0%), Enterprise Management (100.0%), and Construction (91.3%), whereas the industries that tend to have a higher number of women are Health Care & Social Assistance (87.2%), Educational Services (75.3%), and Professional & Scientific (74.7%).
| Industry | Male | Female |
| Agriculture, Fishing & Hunting | 715 (82.3%) | 154 (17.7%) |
| Mining, Quarrying, & Extraction | 90 (100.0%) | 0 (0.0%) |
| Construction | 549 (91.3%) | 52 (8.6%) |
| Manufacturing | 721 (60.8%) | 464 (39.2%) |
| Wholesale Trade | 57 (86.4%) | 9 (13.6%) |
| Retail Trade | 680 (41.7%) | 949 (58.3%) |
| Transportation & Warehousing | 237 (65.6%) | 124 (34.4%) |
| Utilities | 19 (35.2%) | 35 (64.8%) |
| Information | 48 (72.7%) | 18 (27.3%) |
| Finance & Insurance | 77 (47.5%) | 85 (52.5%) |
| Real Estate, Rental & Leasing | 162 (71.1%) | 66 (28.9%) |
| Professional & Scientific | 98 (25.3%) | 290 (74.7%) |
| Enterprise Management | 9 (100.0%) | 0 (0.0%) |
| Administrative & Support | 287 (69.2%) | 128 (30.8%) |
| Educational Services | 170 (24.7%) | 518 (75.3%) |
| Health Care & Social Assistance | 111 (12.8%) | 758 (87.2%) |
| Arts, Entertainment & Recreation | 70 (48.6%) | 74 (51.4%) |
| Accommodation & Food Services | 314 (39.3%) | 485 (60.7%) |
| Public Administration | 784 (79.8%) | 198 (20.2%) |
| Total | 5,389 (53.8%) | 4,625 (46.2%) |
Education in Elmore County
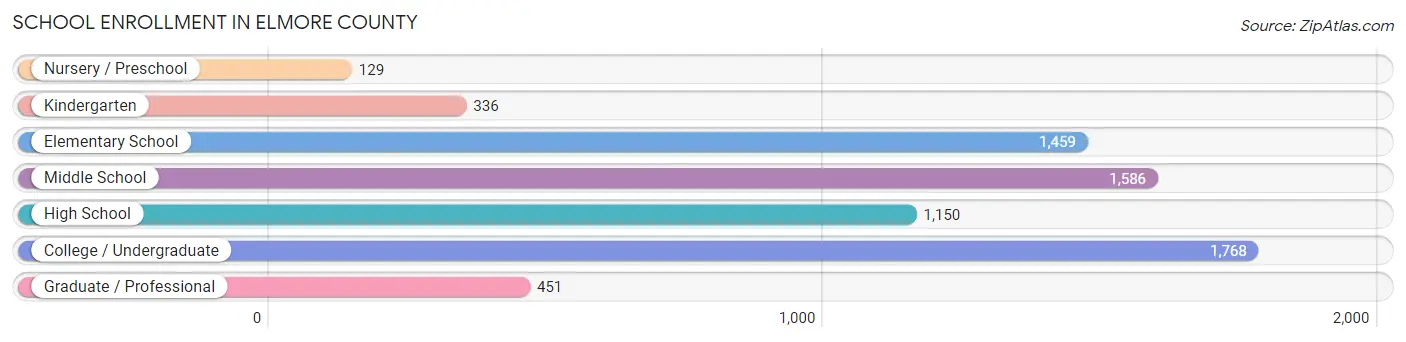
School Enrollment in Elmore County
The most common levels of schooling among the 6,879 students in Elmore County are college / undergraduate (1,768 | 25.7%), middle school (1,586 | 23.1%), and elementary school (1,459 | 21.2%).
| School Level | # Students | % Students |
| Nursery / Preschool | 129 | 1.9% |
| Kindergarten | 336 | 4.9% |
| Elementary School | 1,459 | 21.2% |
| Middle School | 1,586 | 23.1% |
| High School | 1,150 | 16.7% |
| College / Undergraduate | 1,768 | 25.7% |
| Graduate / Professional | 451 | 6.6% |
| Total | 6,879 | 100.0% |
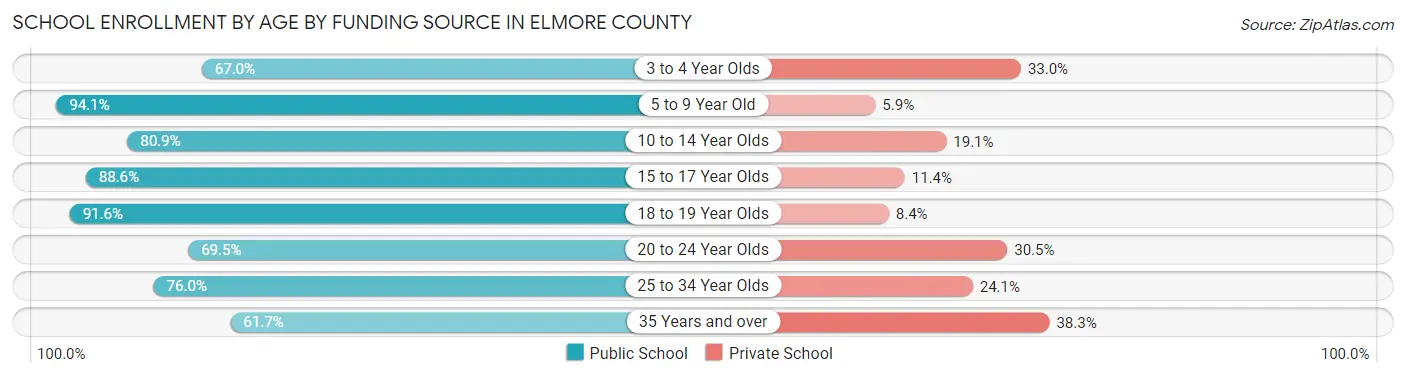
School Enrollment by Age by Funding Source in Elmore County
Out of a total of 6,879 students who are enrolled in schools in Elmore County, 1,238 (18.0%) attend a private institution, while the remaining 5,641 (82.0%) are enrolled in public schools. The age group of 35 years and over has the highest likelihood of being enrolled in private schools, with 212 (38.3% in the age bracket) enrolled. Conversely, the age group of 5 to 9 year old has the lowest likelihood of being enrolled in a private school, with 1,624 (94.1% in the age bracket) attending a public institution.
| Age Bracket | Public School | Private School |
| 3 to 4 Year Olds | 71 (67.0%) | 35 (33.0%) |
| 5 to 9 Year Old | 1,624 (94.1%) | 102 (5.9%) |
| 10 to 14 Year Olds | 1,416 (80.9%) | 335 (19.1%) |
| 15 to 17 Year Olds | 762 (88.6%) | 98 (11.4%) |
| 18 to 19 Year Olds | 283 (91.6%) | 26 (8.4%) |
| 20 to 24 Year Olds | 545 (69.5%) | 239 (30.5%) |
| 25 to 34 Year Olds | 600 (75.9%) | 190 (24.0%) |
| 35 Years and over | 341 (61.7%) | 212 (38.3%) |
| Total | 5,641 (82.0%) | 1,238 (18.0%) |
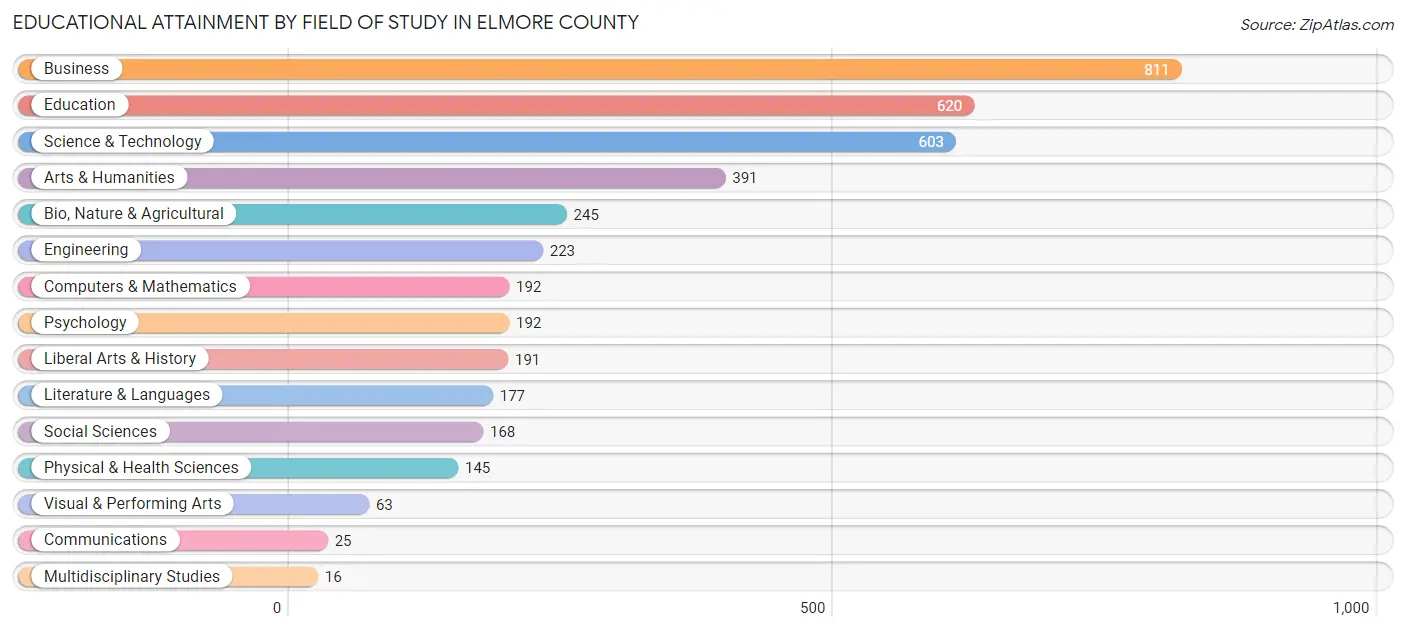
Educational Attainment by Field of Study in Elmore County
Business (811 | 20.0%), education (620 | 15.3%), science & technology (603 | 14.8%), arts & humanities (391 | 9.6%), and bio, nature & agricultural (245 | 6.0%) are the most common fields of study among 4,062 individuals in Elmore County who have obtained a bachelor's degree or higher.
| Field of Study | # Graduates | % Graduates |
| Computers & Mathematics | 192 | 4.7% |
| Bio, Nature & Agricultural | 245 | 6.0% |
| Physical & Health Sciences | 145 | 3.6% |
| Psychology | 192 | 4.7% |
| Social Sciences | 168 | 4.1% |
| Engineering | 223 | 5.5% |
| Multidisciplinary Studies | 16 | 0.4% |
| Science & Technology | 603 | 14.8% |
| Business | 811 | 20.0% |
| Education | 620 | 15.3% |
| Literature & Languages | 177 | 4.4% |
| Liberal Arts & History | 191 | 4.7% |
| Visual & Performing Arts | 63 | 1.5% |
| Communications | 25 | 0.6% |
| Arts & Humanities | 391 | 9.6% |
| Total | 4,062 | 100.0% |
Transportation & Commute in Elmore County
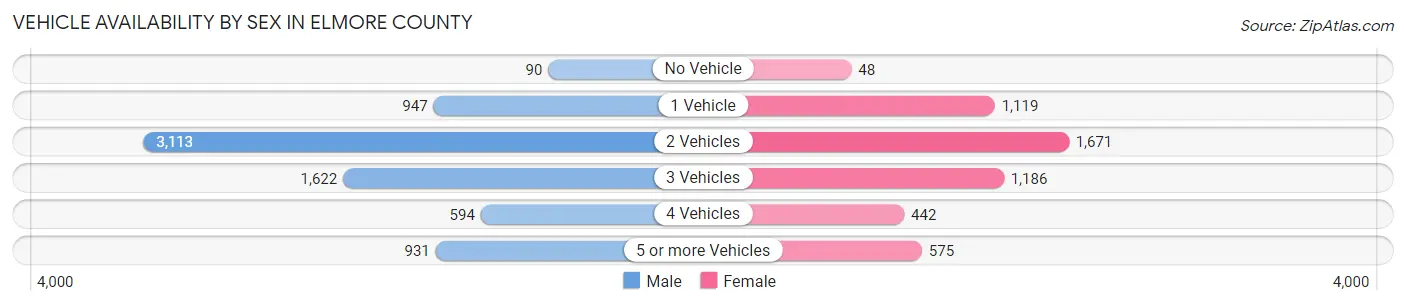
Vehicle Availability by Sex in Elmore County
The most prevalent vehicle ownership categories in Elmore County are males with 2 vehicles (3,113, accounting for 42.7%) and females with 2 vehicles (1,671, making up 61.8%).
| Vehicles Available | Male | Female |
| No Vehicle | 90 (1.2%) | 48 (0.9%) |
| 1 Vehicle | 947 (13.0%) | 1,119 (22.2%) |
| 2 Vehicles | 3,113 (42.7%) | 1,671 (33.2%) |
| 3 Vehicles | 1,622 (22.2%) | 1,186 (23.5%) |
| 4 Vehicles | 594 (8.1%) | 442 (8.8%) |
| 5 or more Vehicles | 931 (12.8%) | 575 (11.4%) |
| Total | 7,297 (100.0%) | 5,041 (100.0%) |
Commute Time in Elmore County
The most frequently occuring commute durations in Elmore County are 5 to 9 minutes (2,926 commuters, 23.1%), 10 to 14 minutes (1,925 commuters, 15.2%), and 15 to 19 minutes (1,571 commuters, 12.4%).
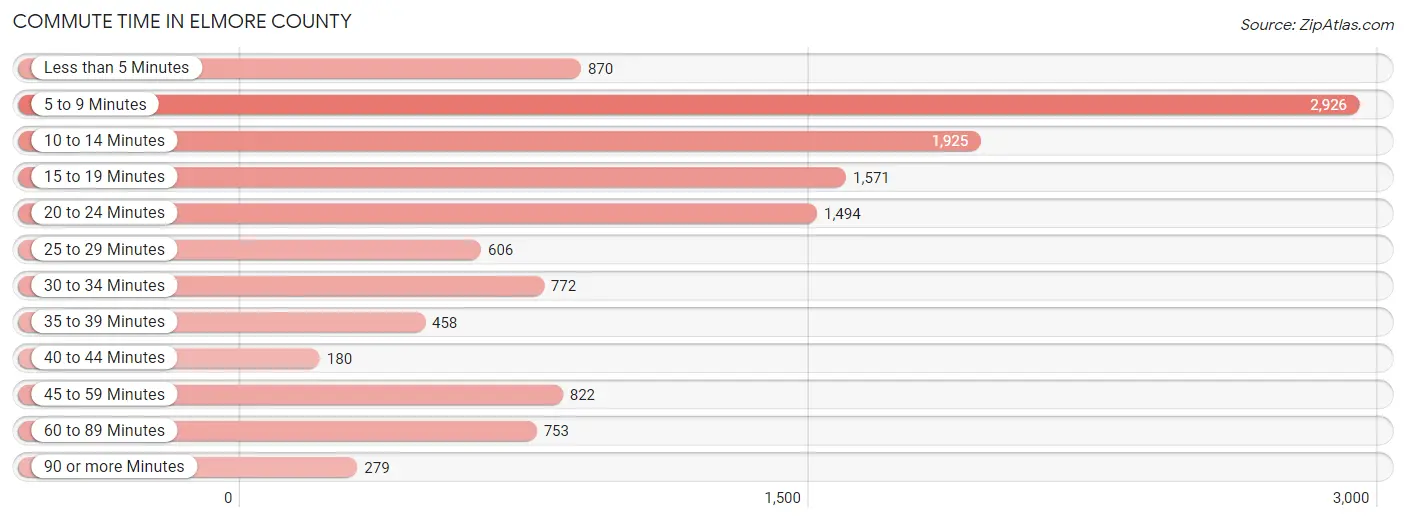
| Commute Time | # Commuters | % Commuters |
| Less than 5 Minutes | 870 | 6.9% |
| 5 to 9 Minutes | 2,926 | 23.1% |
| 10 to 14 Minutes | 1,925 | 15.2% |
| 15 to 19 Minutes | 1,571 | 12.4% |
| 20 to 24 Minutes | 1,494 | 11.8% |
| 25 to 29 Minutes | 606 | 4.8% |
| 30 to 34 Minutes | 772 | 6.1% |
| 35 to 39 Minutes | 458 | 3.6% |
| 40 to 44 Minutes | 180 | 1.4% |
| 45 to 59 Minutes | 822 | 6.5% |
| 60 to 89 Minutes | 753 | 5.9% |
| 90 or more Minutes | 279 | 2.2% |
Commute Time by Sex in Elmore County
The most common commute times in Elmore County are 5 to 9 minutes (1,840 commuters, 23.7%) for males and 5 to 9 minutes (1,086 commuters, 22.2%) for females.
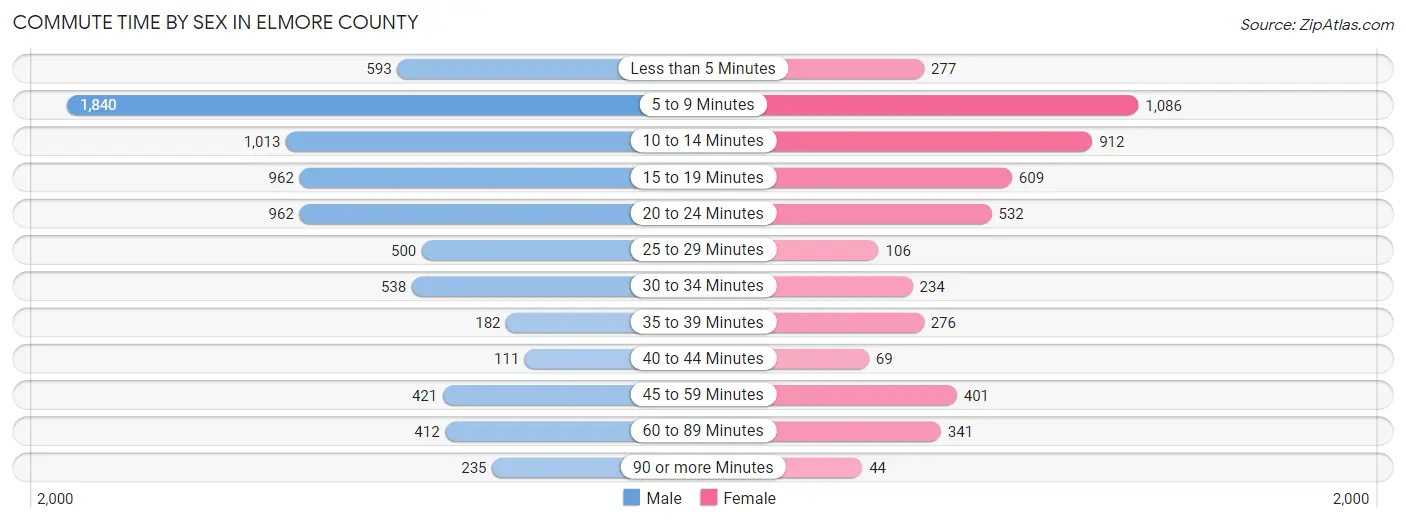
| Commute Time | Male | Female |
| Less than 5 Minutes | 593 (7.6%) | 277 (5.7%) |
| 5 to 9 Minutes | 1,840 (23.7%) | 1,086 (22.2%) |
| 10 to 14 Minutes | 1,013 (13.0%) | 912 (18.7%) |
| 15 to 19 Minutes | 962 (12.4%) | 609 (12.5%) |
| 20 to 24 Minutes | 962 (12.4%) | 532 (10.9%) |
| 25 to 29 Minutes | 500 (6.4%) | 106 (2.2%) |
| 30 to 34 Minutes | 538 (6.9%) | 234 (4.8%) |
| 35 to 39 Minutes | 182 (2.3%) | 276 (5.7%) |
| 40 to 44 Minutes | 111 (1.4%) | 69 (1.4%) |
| 45 to 59 Minutes | 421 (5.4%) | 401 (8.2%) |
| 60 to 89 Minutes | 412 (5.3%) | 341 (7.0%) |
| 90 or more Minutes | 235 (3.0%) | 44 (0.9%) |
Time of Departure to Work by Sex in Elmore County
The most frequent times of departure to work in Elmore County are 7:00 AM to 7:29 AM (1,440, 18.5%) for males and 7:00 AM to 7:29 AM (746, 15.3%) for females.
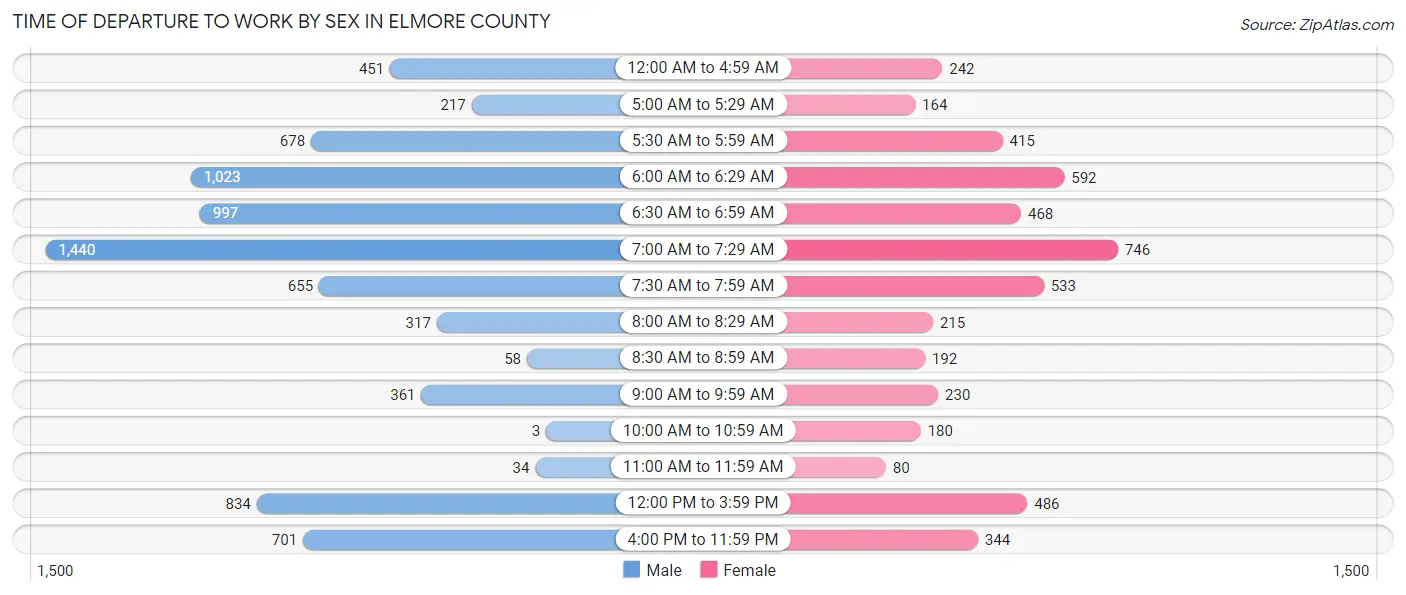
| Time of Departure | Male | Female |
| 12:00 AM to 4:59 AM | 451 (5.8%) | 242 (5.0%) |
| 5:00 AM to 5:29 AM | 217 (2.8%) | 164 (3.4%) |
| 5:30 AM to 5:59 AM | 678 (8.7%) | 415 (8.5%) |
| 6:00 AM to 6:29 AM | 1,023 (13.2%) | 592 (12.1%) |
| 6:30 AM to 6:59 AM | 997 (12.8%) | 468 (9.6%) |
| 7:00 AM to 7:29 AM | 1,440 (18.5%) | 746 (15.3%) |
| 7:30 AM to 7:59 AM | 655 (8.4%) | 533 (10.9%) |
| 8:00 AM to 8:29 AM | 317 (4.1%) | 215 (4.4%) |
| 8:30 AM to 8:59 AM | 58 (0.7%) | 192 (3.9%) |
| 9:00 AM to 9:59 AM | 361 (4.6%) | 230 (4.7%) |
| 10:00 AM to 10:59 AM | 3 (0.0%) | 180 (3.7%) |
| 11:00 AM to 11:59 AM | 34 (0.4%) | 80 (1.6%) |
| 12:00 PM to 3:59 PM | 834 (10.7%) | 486 (9.9%) |
| 4:00 PM to 11:59 PM | 701 (9.0%) | 344 (7.0%) |
| Total | 7,769 (100.0%) | 4,887 (100.0%) |
Housing Occupancy in Elmore County
Occupancy by Ownership in Elmore County
Of the total 10,760 dwellings in Elmore County, owner-occupied units account for 6,728 (62.5%), while renter-occupied units make up 4,032 (37.5%).
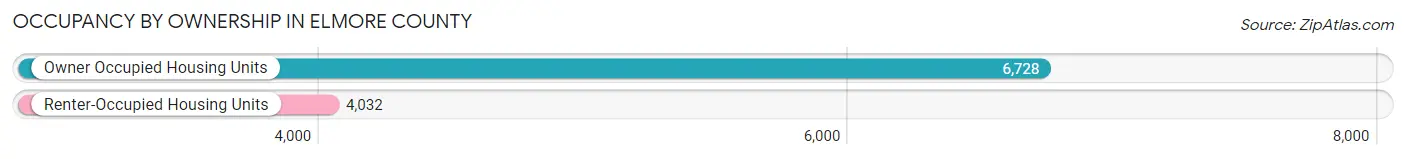
| Occupancy | # Housing Units | % Housing Units |
| Owner Occupied Housing Units | 6,728 | 62.5% |
| Renter-Occupied Housing Units | 4,032 | 37.5% |
| Total Occupied Housing Units | 10,760 | 100.0% |
Occupancy by Household Size in Elmore County
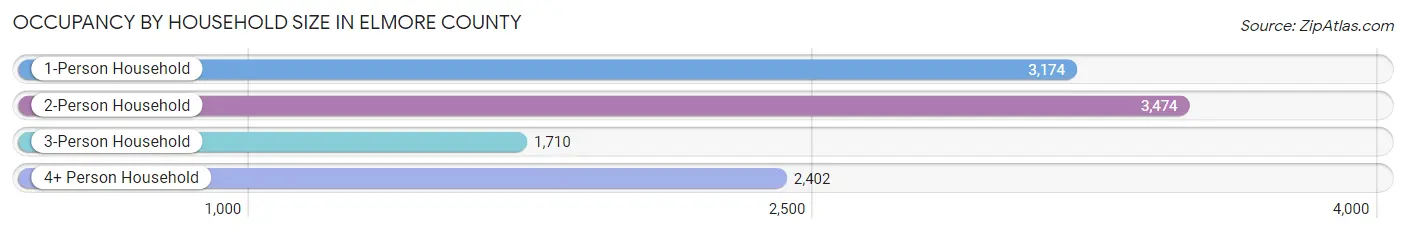
| Household Size | # Housing Units | % Housing Units |
| 1-Person Household | 3,174 | 29.5% |
| 2-Person Household | 3,474 | 32.3% |
| 3-Person Household | 1,710 | 15.9% |
| 4+ Person Household | 2,402 | 22.3% |
| Total Housing Units | 10,760 | 100.0% |
Occupancy by Ownership by Household Size in Elmore County
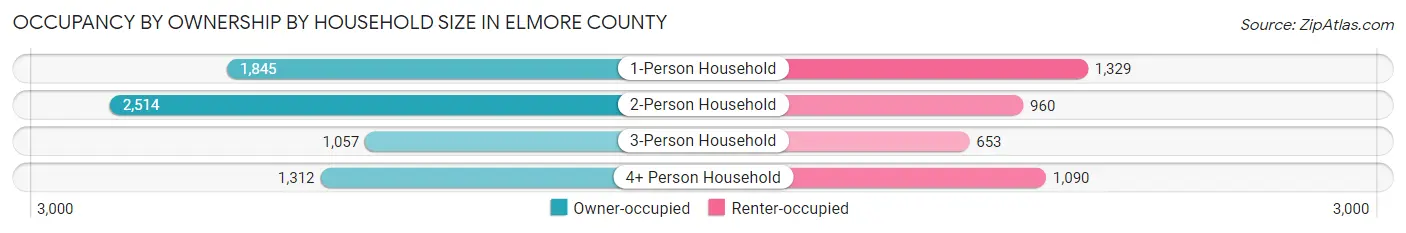
| Household Size | Owner-occupied | Renter-occupied |
| 1-Person Household | 1,845 (58.1%) | 1,329 (41.9%) |
| 2-Person Household | 2,514 (72.4%) | 960 (27.6%) |
| 3-Person Household | 1,057 (61.8%) | 653 (38.2%) |
| 4+ Person Household | 1,312 (54.6%) | 1,090 (45.4%) |
| Total Housing Units | 6,728 (62.5%) | 4,032 (37.5%) |
Occupancy by Educational Attainment in Elmore County
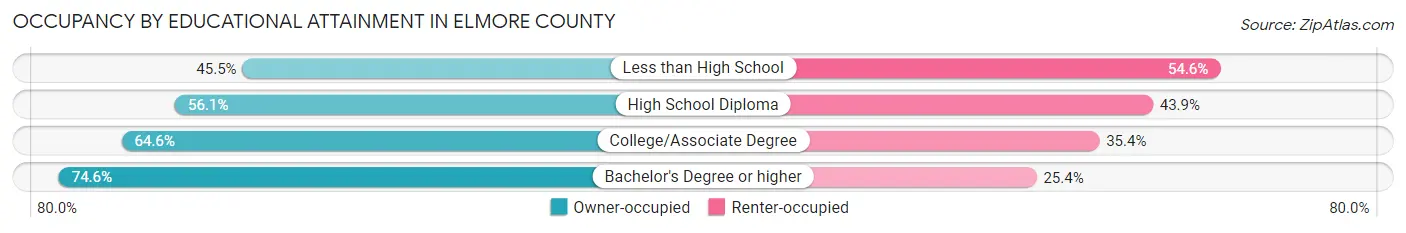
| Household Size | Owner-occupied | Renter-occupied |
| Less than High School | 435 (45.5%) | 522 (54.5%) |
| High School Diploma | 1,711 (56.1%) | 1,338 (43.9%) |
| College/Associate Degree | 2,952 (64.6%) | 1,616 (35.4%) |
| Bachelor's Degree or higher | 1,630 (74.6%) | 556 (25.4%) |
Occupancy by Age of Householder in Elmore County
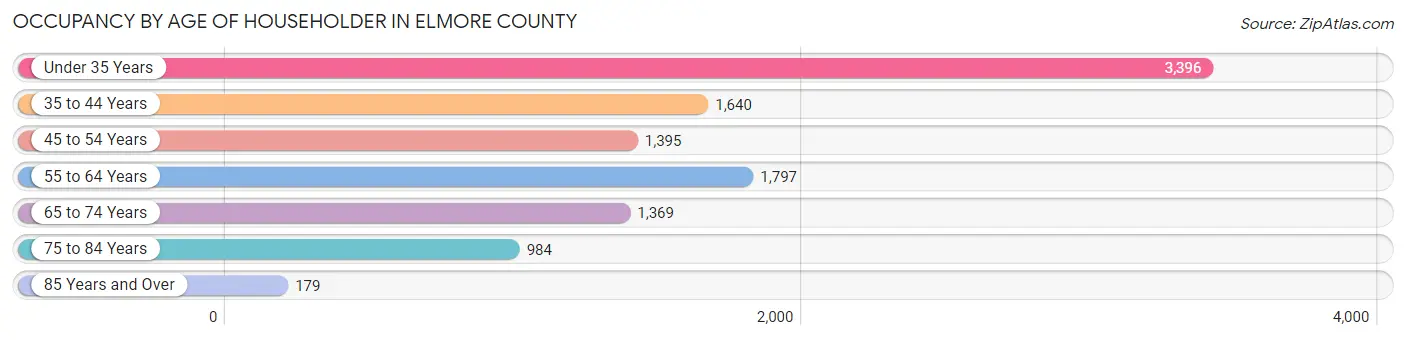
| Age Bracket | # Households | % Households |
| Under 35 Years | 3,396 | 31.6% |
| 35 to 44 Years | 1,640 | 15.2% |
| 45 to 54 Years | 1,395 | 13.0% |
| 55 to 64 Years | 1,797 | 16.7% |
| 65 to 74 Years | 1,369 | 12.7% |
| 75 to 84 Years | 984 | 9.1% |
| 85 Years and Over | 179 | 1.7% |
| Total | 10,760 | 100.0% |
Housing Finances in Elmore County
Median Income by Occupancy in Elmore County
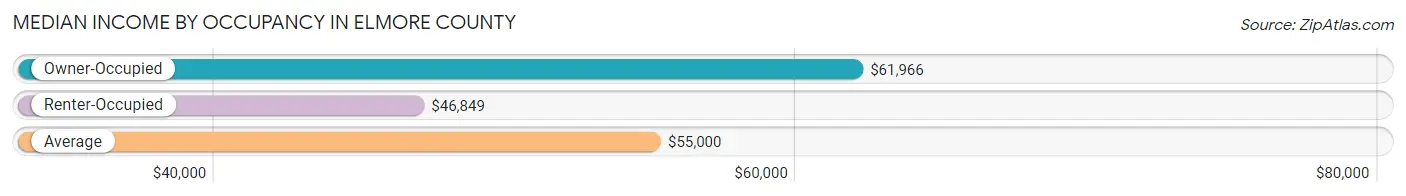
| Occupancy Type | # Households | Median Income |
| Owner-Occupied | 6,728 (62.5%) | $61,966 |
| Renter-Occupied | 4,032 (37.5%) | $46,849 |
| Average | 10,760 (100.0%) | $55,000 |
Occupancy by Householder Income Bracket in Elmore County
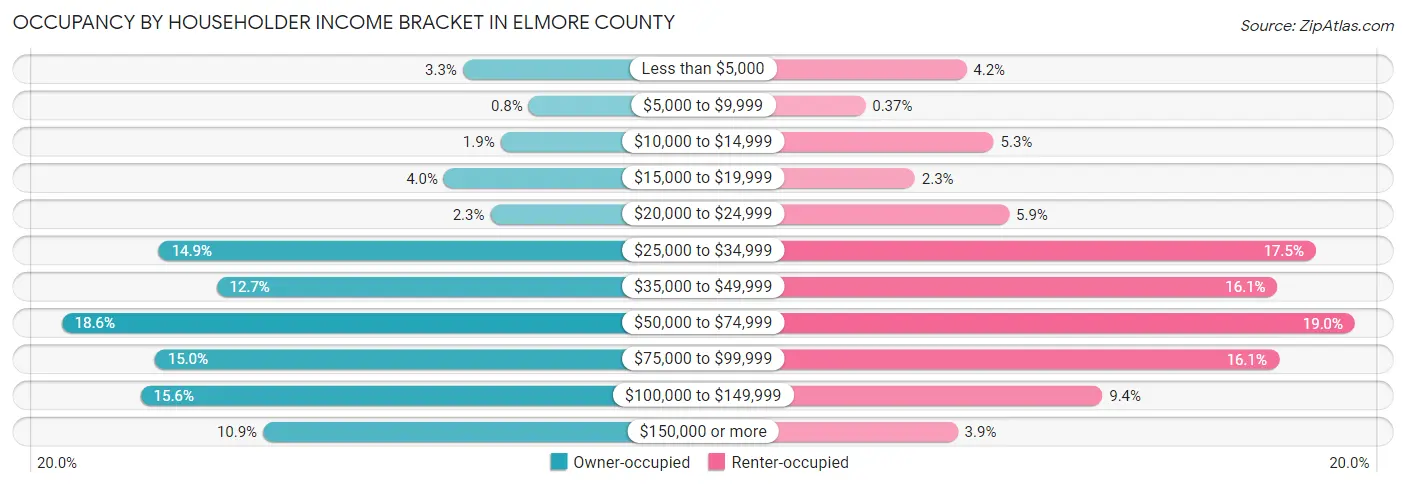
| Income Bracket | Owner-occupied | Renter-occupied |
| Less than $5,000 | 223 (3.3%) | 170 (4.2%) |
| $5,000 to $9,999 | 54 (0.8%) | 15 (0.4%) |
| $10,000 to $14,999 | 126 (1.9%) | 212 (5.3%) |
| $15,000 to $19,999 | 271 (4.0%) | 91 (2.3%) |
| $20,000 to $24,999 | 152 (2.3%) | 236 (5.9%) |
| $25,000 to $34,999 | 1,002 (14.9%) | 707 (17.5%) |
| $35,000 to $49,999 | 854 (12.7%) | 648 (16.1%) |
| $50,000 to $74,999 | 1,251 (18.6%) | 767 (19.0%) |
| $75,000 to $99,999 | 1,012 (15.0%) | 650 (16.1%) |
| $100,000 to $149,999 | 1,048 (15.6%) | 379 (9.4%) |
| $150,000 or more | 735 (10.9%) | 157 (3.9%) |
| Total | 6,728 (100.0%) | 4,032 (100.0%) |
Monthly Housing Cost Tiers in Elmore County
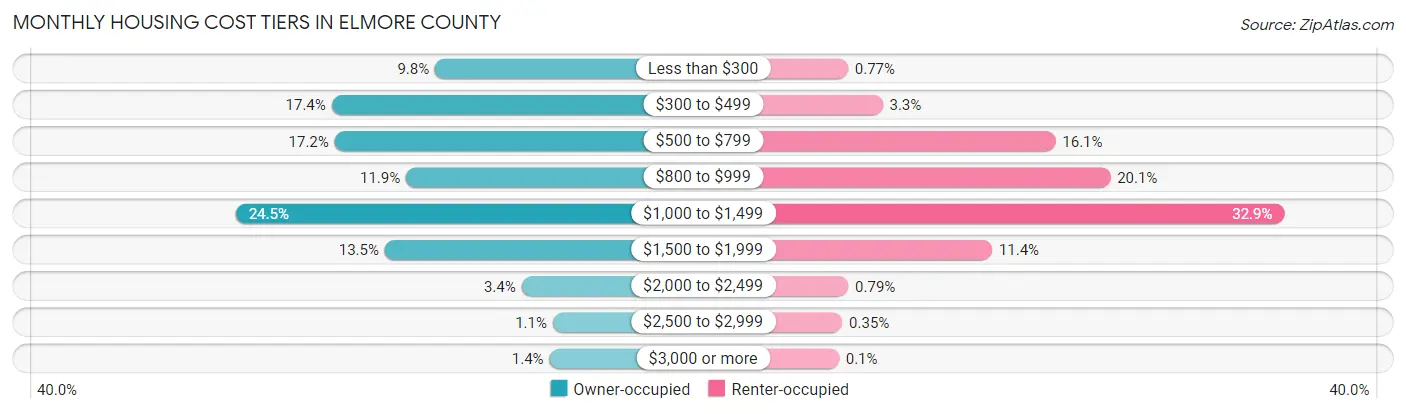
| Monthly Cost | Owner-occupied | Renter-occupied |
| Less than $300 | 657 (9.8%) | 31 (0.8%) |
| $300 to $499 | 1,170 (17.4%) | 134 (3.3%) |
| $500 to $799 | 1,155 (17.2%) | 647 (16.1%) |
| $800 to $999 | 801 (11.9%) | 810 (20.1%) |
| $1,000 to $1,499 | 1,645 (24.4%) | 1,327 (32.9%) |
| $1,500 to $1,999 | 906 (13.5%) | 459 (11.4%) |
| $2,000 to $2,499 | 229 (3.4%) | 32 (0.8%) |
| $2,500 to $2,999 | 74 (1.1%) | 14 (0.4%) |
| $3,000 or more | 91 (1.3%) | 4 (0.1%) |
| Total | 6,728 (100.0%) | 4,032 (100.0%) |
Physical Housing Characteristics in Elmore County
Housing Structures in Elmore County
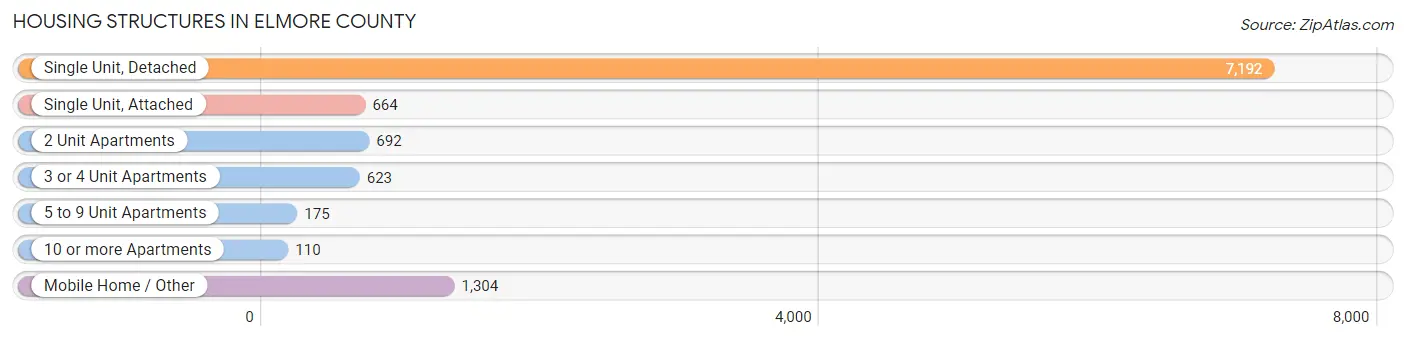
| Structure Type | # Housing Units | % Housing Units |
| Single Unit, Detached | 7,192 | 66.8% |
| Single Unit, Attached | 664 | 6.2% |
| 2 Unit Apartments | 692 | 6.4% |
| 3 or 4 Unit Apartments | 623 | 5.8% |
| 5 to 9 Unit Apartments | 175 | 1.6% |
| 10 or more Apartments | 110 | 1.0% |
| Mobile Home / Other | 1,304 | 12.1% |
| Total | 10,760 | 100.0% |
Housing Structures by Occupancy in Elmore County
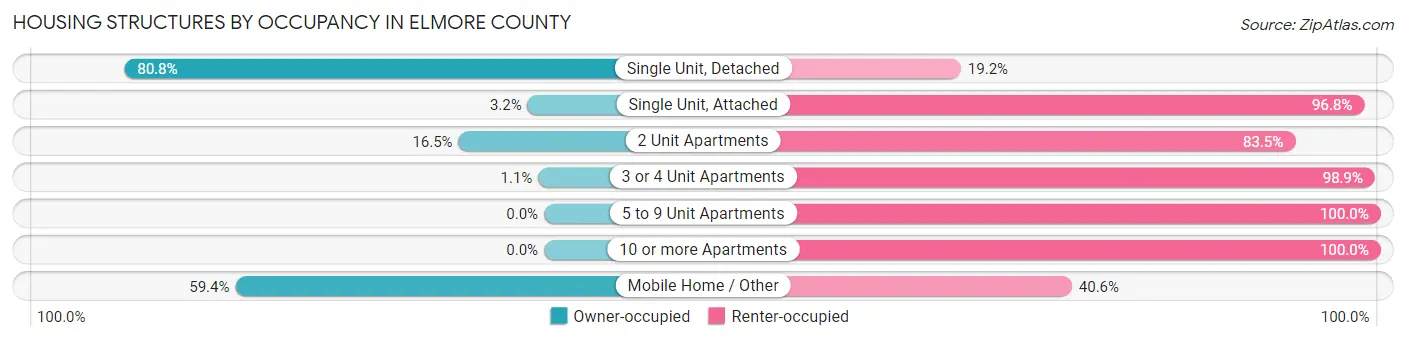
| Structure Type | Owner-occupied | Renter-occupied |
| Single Unit, Detached | 5,811 (80.8%) | 1,381 (19.2%) |
| Single Unit, Attached | 21 (3.2%) | 643 (96.8%) |
| 2 Unit Apartments | 114 (16.5%) | 578 (83.5%) |
| 3 or 4 Unit Apartments | 7 (1.1%) | 616 (98.9%) |
| 5 to 9 Unit Apartments | 0 (0.0%) | 175 (100.0%) |
| 10 or more Apartments | 0 (0.0%) | 110 (100.0%) |
| Mobile Home / Other | 775 (59.4%) | 529 (40.6%) |
| Total | 6,728 (62.5%) | 4,032 (37.5%) |
Housing Structures by Number of Rooms in Elmore County
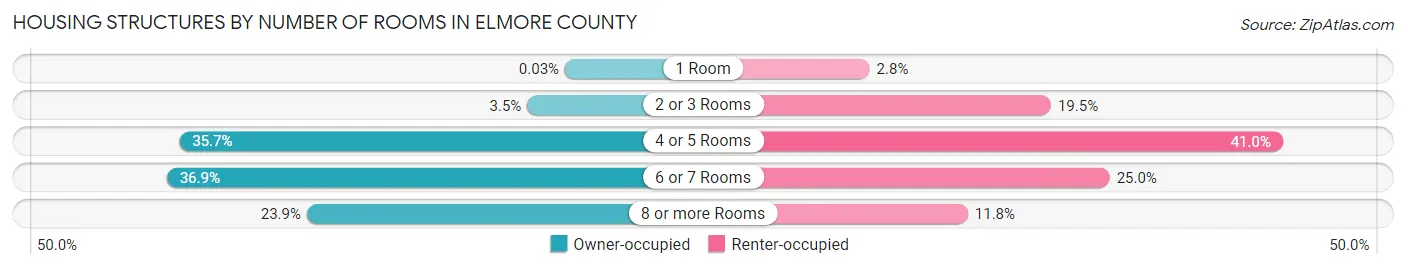
| Number of Rooms | Owner-occupied | Renter-occupied |
| 1 Room | 2 (0.0%) | 111 (2.8%) |
| 2 or 3 Rooms | 237 (3.5%) | 787 (19.5%) |
| 4 or 5 Rooms | 2,402 (35.7%) | 1,651 (40.9%) |
| 6 or 7 Rooms | 2,479 (36.8%) | 1,006 (24.9%) |
| 8 or more Rooms | 1,608 (23.9%) | 477 (11.8%) |
| Total | 6,728 (100.0%) | 4,032 (100.0%) |
Housing Structure by Heating Type in Elmore County
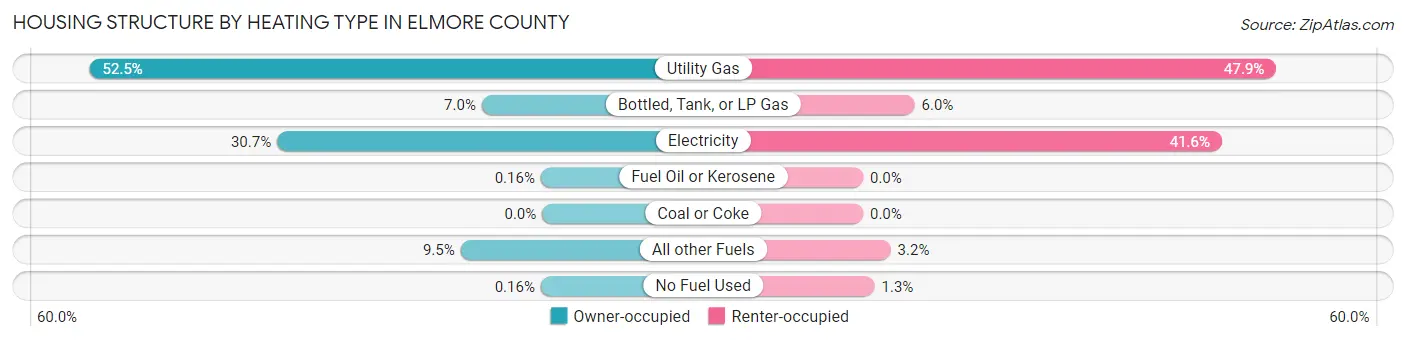
| Heating Type | Owner-occupied | Renter-occupied |
| Utility Gas | 3,531 (52.5%) | 1,931 (47.9%) |
| Bottled, Tank, or LP Gas | 471 (7.0%) | 241 (6.0%) |
| Electricity | 2,068 (30.7%) | 1,677 (41.6%) |
| Fuel Oil or Kerosene | 11 (0.2%) | 0 (0.0%) |
| Coal or Coke | 0 (0.0%) | 0 (0.0%) |
| All other Fuels | 636 (9.5%) | 129 (3.2%) |
| No Fuel Used | 11 (0.2%) | 54 (1.3%) |
| Total | 6,728 (100.0%) | 4,032 (100.0%) |
Household Vehicle Usage in Elmore County
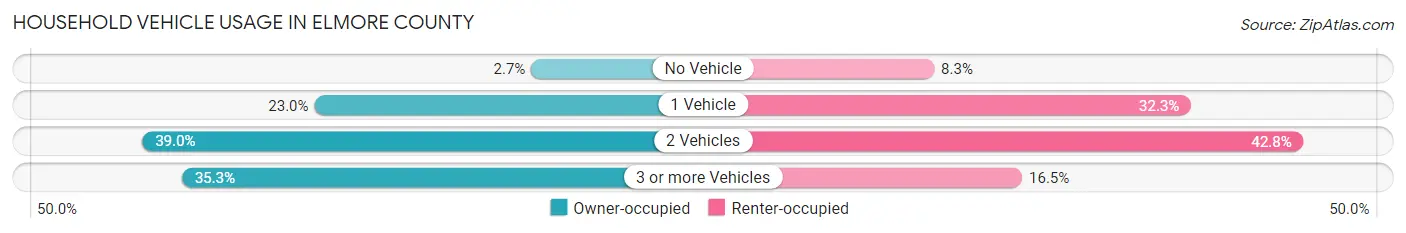
| Vehicles per Household | Owner-occupied | Renter-occupied |
| No Vehicle | 182 (2.7%) | 336 (8.3%) |
| 1 Vehicle | 1,544 (23.0%) | 1,303 (32.3%) |
| 2 Vehicles | 2,625 (39.0%) | 1,726 (42.8%) |
| 3 or more Vehicles | 2,377 (35.3%) | 667 (16.5%) |
| Total | 6,728 (100.0%) | 4,032 (100.0%) |
Real Estate & Mortgages in Elmore County
Real Estate and Mortgage Overview in Elmore County
| Characteristic | Without Mortgage | With Mortgage |
| Housing Units | 2,590 | 4,138 |
| Median Property Value | $209,900 | $248,700 |
| Median Household Income | $48,837 | $529 |
| Monthly Housing Costs | $380 | $91 |
| Real Estate Taxes | $1,406 | $130 |
Property Value by Mortgage Status in Elmore County
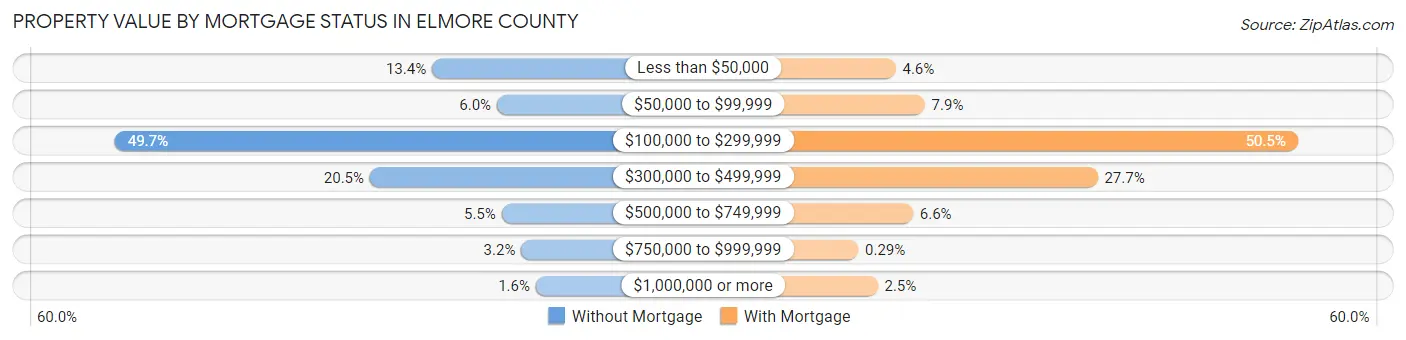
| Property Value | Without Mortgage | With Mortgage |
| Less than $50,000 | 348 (13.4%) | 189 (4.6%) |
| $50,000 to $99,999 | 156 (6.0%) | 327 (7.9%) |
| $100,000 to $299,999 | 1,287 (49.7%) | 2,091 (50.5%) |
| $300,000 to $499,999 | 532 (20.5%) | 1,144 (27.7%) |
| $500,000 to $749,999 | 142 (5.5%) | 271 (6.6%) |
| $750,000 to $999,999 | 84 (3.2%) | 12 (0.3%) |
| $1,000,000 or more | 41 (1.6%) | 104 (2.5%) |
| Total | 2,590 (100.0%) | 4,138 (100.0%) |
Household Income by Mortgage Status in Elmore County

| Household Income | Without Mortgage | With Mortgage |
| Less than $10,000 | 190 (7.3%) | 77 (1.9%) |
| $10,000 to $24,999 | 303 (11.7%) | 87 (2.1%) |
| $25,000 to $34,999 | 390 (15.1%) | 246 (5.9%) |
| $35,000 to $49,999 | 459 (17.7%) | 612 (14.8%) |
| $50,000 to $74,999 | 371 (14.3%) | 395 (9.6%) |
| $75,000 to $99,999 | 378 (14.6%) | 880 (21.3%) |
| $100,000 to $149,999 | 293 (11.3%) | 634 (15.3%) |
| $150,000 or more | 206 (8.0%) | 755 (18.2%) |
| Total | 2,590 (100.0%) | 4,138 (100.0%) |
Property Value to Household Income Ratio in Elmore County
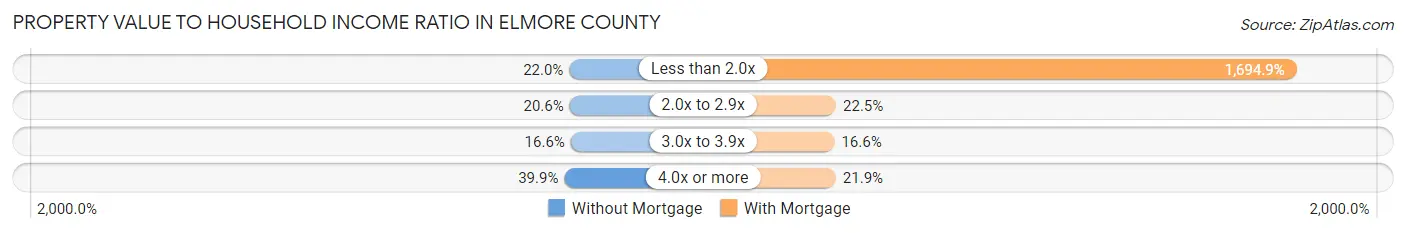
| Value-to-Income Ratio | Without Mortgage | With Mortgage |
| Less than 2.0x | 569 (22.0%) | 70,135 (1,694.9%) |
| 2.0x to 2.9x | 533 (20.6%) | 930 (22.5%) |
| 3.0x to 3.9x | 431 (16.6%) | 686 (16.6%) |
| 4.0x or more | 1,033 (39.9%) | 904 (21.8%) |
| Total | 2,590 (100.0%) | 4,138 (100.0%) |
Real Estate Taxes by Mortgage Status in Elmore County
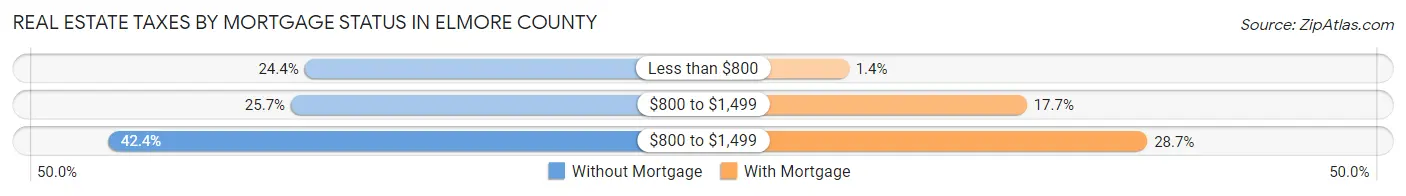
| Property Taxes | Without Mortgage | With Mortgage |
| Less than $800 | 633 (24.4%) | 59 (1.4%) |
| $800 to $1,499 | 665 (25.7%) | 732 (17.7%) |
| $800 to $1,499 | 1,098 (42.4%) | 1,187 (28.7%) |
| Total | 2,590 (100.0%) | 4,138 (100.0%) |
Health & Disability in Elmore County
Health Insurance Coverage by Age in Elmore County
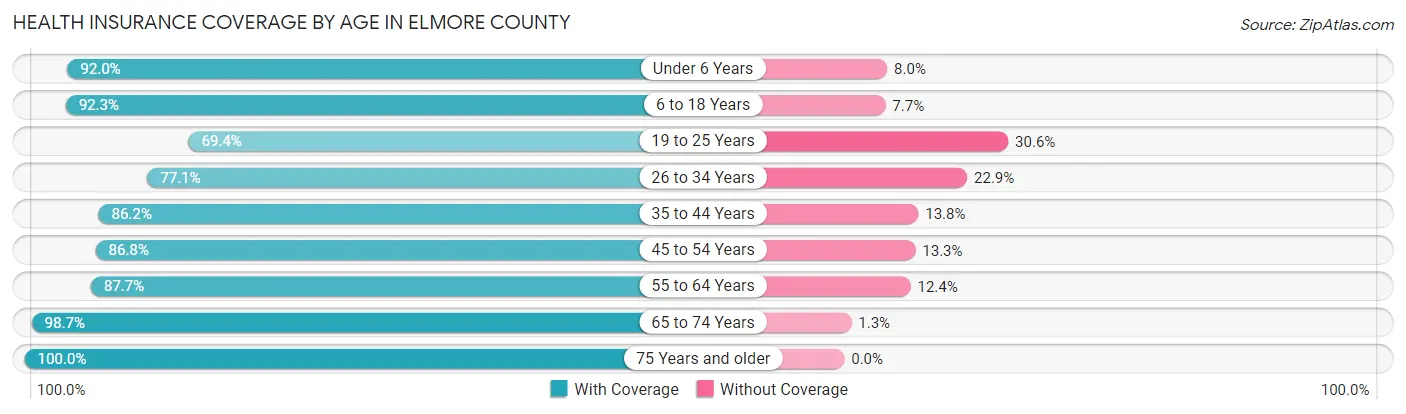
| Age Bracket | With Coverage | Without Coverage |
| Under 6 Years | 2,337 (92.0%) | 203 (8.0%) |
| 6 to 18 Years | 4,416 (92.3%) | 367 (7.7%) |
| 19 to 25 Years | 1,409 (69.4%) | 620 (30.6%) |
| 26 to 34 Years | 2,606 (77.1%) | 774 (22.9%) |
| 35 to 44 Years | 2,242 (86.2%) | 359 (13.8%) |
| 45 to 54 Years | 2,337 (86.8%) | 357 (13.3%) |
| 55 to 64 Years | 2,783 (87.6%) | 392 (12.3%) |
| 65 to 74 Years | 2,250 (98.7%) | 30 (1.3%) |
| 75 Years and older | 1,624 (100.0%) | 0 (0.0%) |
| Total | 22,004 (87.6%) | 3,102 (12.4%) |
Health Insurance Coverage by Citizenship Status in Elmore County
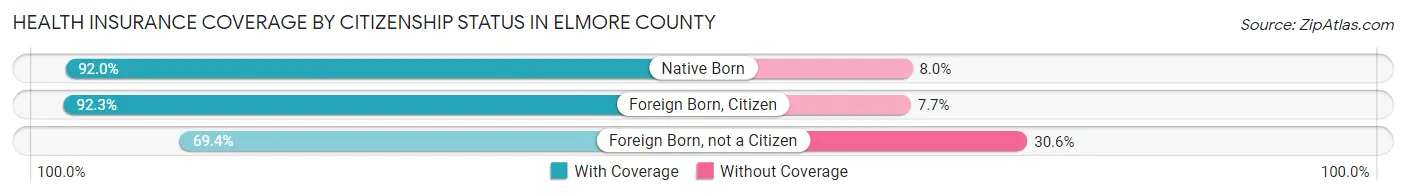
| Citizenship Status | With Coverage | Without Coverage |
| Native Born | 2,337 (92.0%) | 203 (8.0%) |
| Foreign Born, Citizen | 4,416 (92.3%) | 367 (7.7%) |
| Foreign Born, not a Citizen | 1,409 (69.4%) | 620 (30.6%) |
Health Insurance Coverage by Household Income in Elmore County
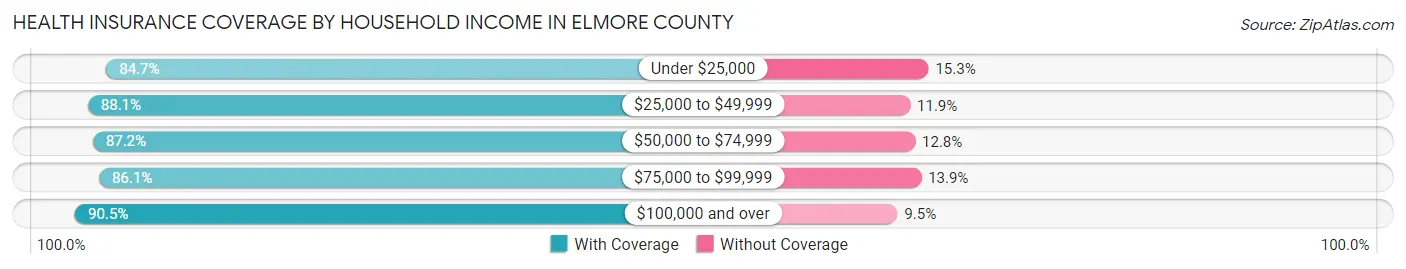
| Household Income | With Coverage | Without Coverage |
| Under $25,000 | 2,605 (84.7%) | 471 (15.3%) |
| $25,000 to $49,999 | 4,778 (88.1%) | 643 (11.9%) |
| $50,000 to $74,999 | 4,441 (87.2%) | 652 (12.8%) |
| $75,000 to $99,999 | 4,030 (86.1%) | 653 (13.9%) |
| $100,000 and over | 6,062 (90.5%) | 635 (9.5%) |
Public vs Private Health Insurance Coverage by Age in Elmore County
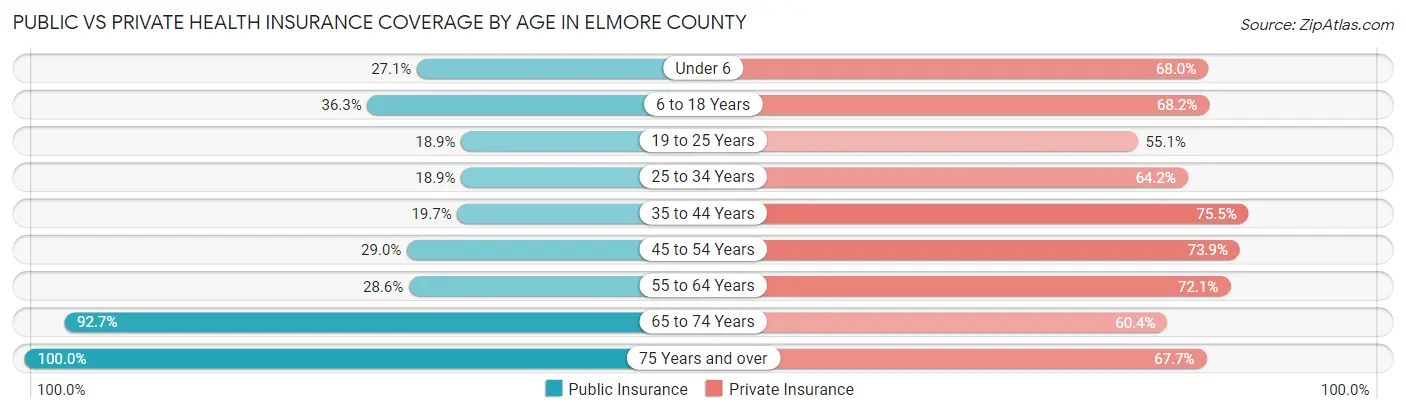
| Age Bracket | Public Insurance | Private Insurance |
| Under 6 | 689 (27.1%) | 1,727 (68.0%) |
| 6 to 18 Years | 1,738 (36.3%) | 3,261 (68.2%) |
| 19 to 25 Years | 384 (18.9%) | 1,118 (55.1%) |
| 25 to 34 Years | 640 (18.9%) | 2,170 (64.2%) |
| 35 to 44 Years | 511 (19.7%) | 1,964 (75.5%) |
| 45 to 54 Years | 781 (29.0%) | 1,990 (73.9%) |
| 55 to 64 Years | 909 (28.6%) | 2,288 (72.1%) |
| 65 to 74 Years | 2,113 (92.7%) | 1,378 (60.4%) |
| 75 Years and over | 1,624 (100.0%) | 1,099 (67.7%) |
| Total | 9,389 (37.4%) | 16,995 (67.7%) |
Disability Status by Sex by Age in Elmore County
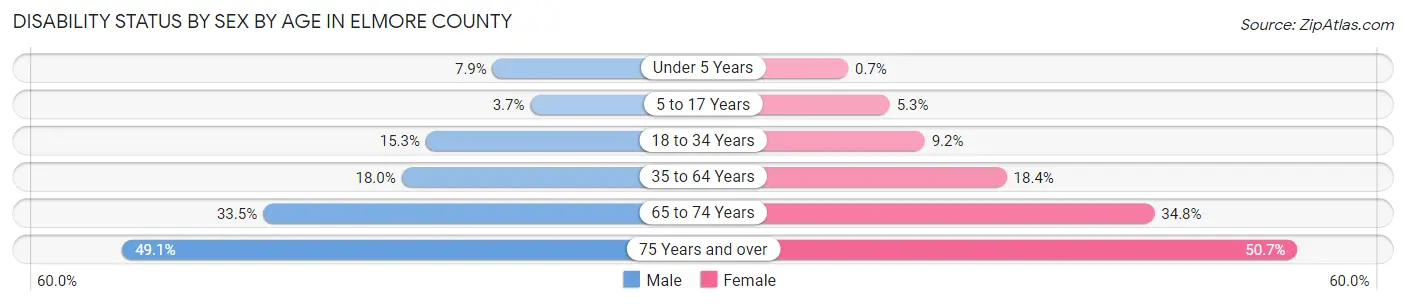
| Age Bracket | Male | Female |
| Under 5 Years | 101 (7.9%) | 7 (0.7%) |
| 5 to 17 Years | 92 (3.7%) | 117 (5.3%) |
| 18 to 34 Years | 415 (15.3%) | 282 (9.2%) |
| 35 to 64 Years | 736 (18.0%) | 805 (18.4%) |
| 65 to 74 Years | 384 (33.5%) | 394 (34.8%) |
| 75 Years and over | 364 (49.1%) | 448 (50.7%) |
Disability Class by Sex by Age in Elmore County
Disability Class: Hearing Difficulty
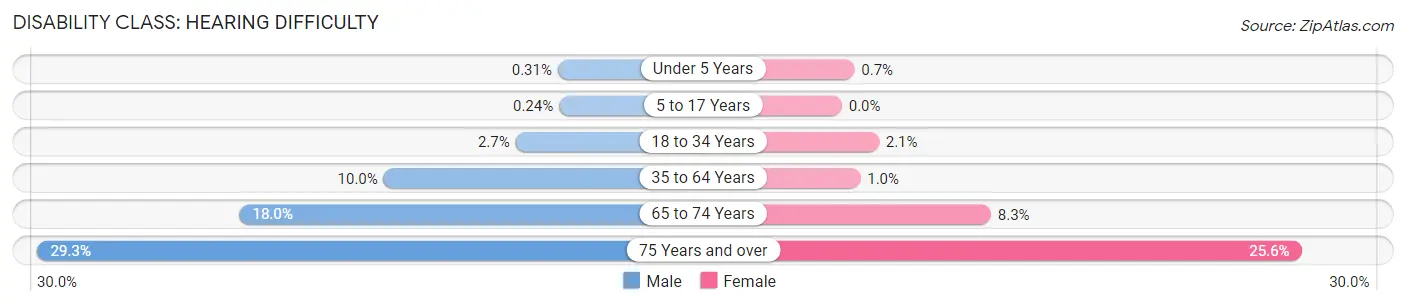
| Age Bracket | Male | Female |
| Under 5 Years | 4 (0.3%) | 7 (0.7%) |
| 5 to 17 Years | 6 (0.2%) | 0 (0.0%) |
| 18 to 34 Years | 72 (2.7%) | 63 (2.1%) |
| 35 to 64 Years | 409 (10.0%) | 45 (1.0%) |
| 65 to 74 Years | 207 (18.0%) | 94 (8.3%) |
| 75 Years and over | 217 (29.3%) | 226 (25.6%) |
Disability Class: Vision Difficulty
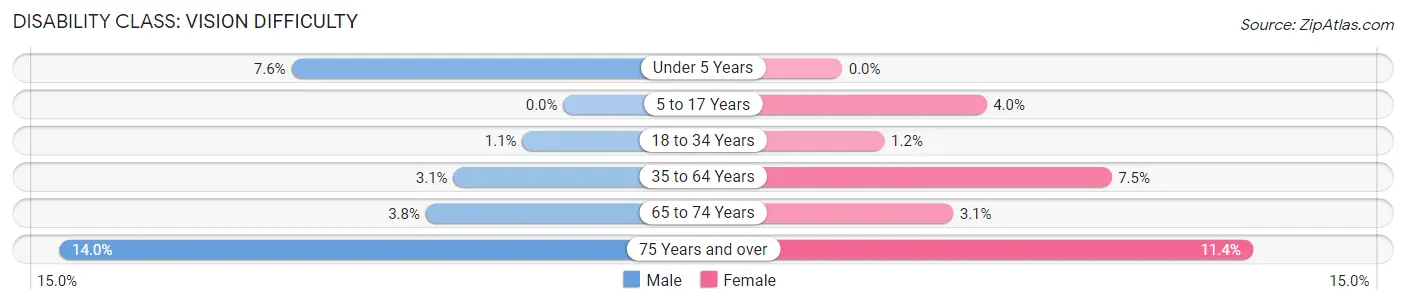
| Age Bracket | Male | Female |
| Under 5 Years | 97 (7.6%) | 0 (0.0%) |
| 5 to 17 Years | 0 (0.0%) | 88 (4.0%) |
| 18 to 34 Years | 31 (1.1%) | 36 (1.2%) |
| 35 to 64 Years | 125 (3.1%) | 329 (7.5%) |
| 65 to 74 Years | 44 (3.8%) | 35 (3.1%) |
| 75 Years and over | 104 (14.0%) | 101 (11.4%) |
Disability Class: Cognitive Difficulty
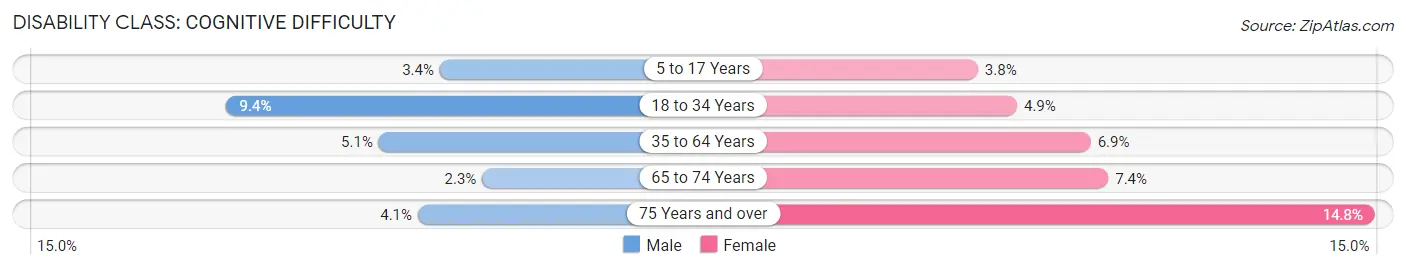
| Age Bracket | Male | Female |
| 5 to 17 Years | 86 (3.4%) | 83 (3.8%) |
| 18 to 34 Years | 254 (9.4%) | 149 (4.9%) |
| 35 to 64 Years | 210 (5.1%) | 304 (6.9%) |
| 65 to 74 Years | 26 (2.3%) | 84 (7.4%) |
| 75 Years and over | 30 (4.1%) | 131 (14.8%) |
Disability Class: Ambulatory Difficulty
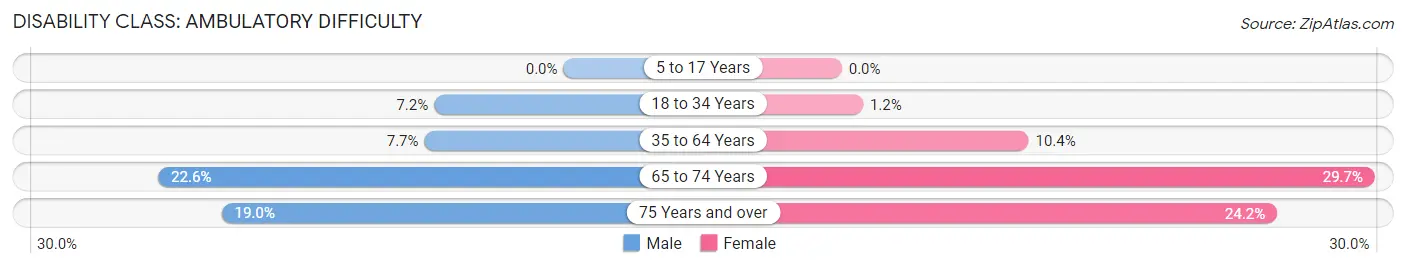
| Age Bracket | Male | Female |
| 5 to 17 Years | 0 (0.0%) | 0 (0.0%) |
| 18 to 34 Years | 195 (7.2%) | 36 (1.2%) |
| 35 to 64 Years | 316 (7.7%) | 456 (10.4%) |
| 65 to 74 Years | 259 (22.6%) | 336 (29.7%) |
| 75 Years and over | 141 (19.0%) | 214 (24.2%) |
Disability Class: Self-Care Difficulty
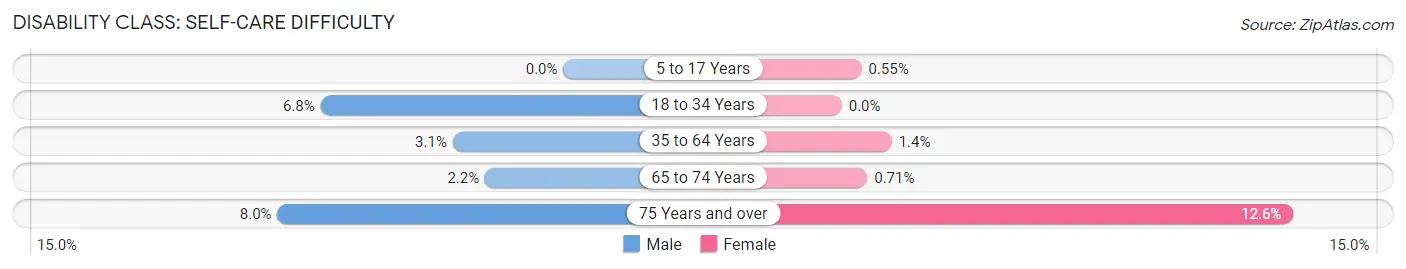
| Age Bracket | Male | Female |
| 5 to 17 Years | 0 (0.0%) | 12 (0.5%) |
| 18 to 34 Years | 183 (6.8%) | 0 (0.0%) |
| 35 to 64 Years | 126 (3.1%) | 61 (1.4%) |
| 65 to 74 Years | 25 (2.2%) | 8 (0.7%) |
| 75 Years and over | 59 (8.0%) | 111 (12.6%) |
Technology Access in Elmore County
Computing Device Access in Elmore County
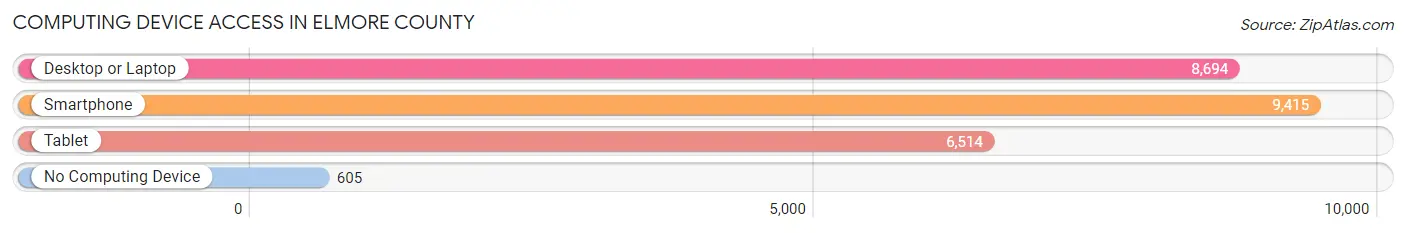
| Device Type | # Households | % Households |
| Desktop or Laptop | 8,694 | 80.8% |
| Smartphone | 9,415 | 87.5% |
| Tablet | 6,514 | 60.5% |
| No Computing Device | 605 | 5.6% |
| Total | 10,760 | 100.0% |
Internet Access in Elmore County
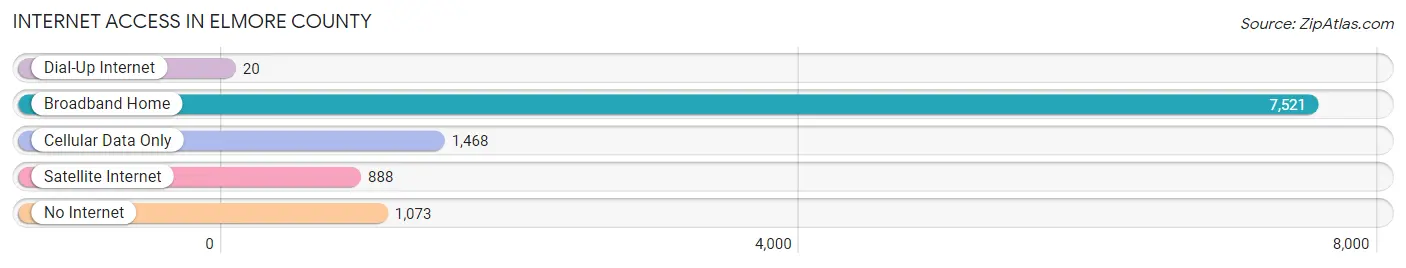
| Internet Type | # Households | % Households |
| Dial-Up Internet | 20 | 0.2% |
| Broadband Home | 7,521 | 69.9% |
| Cellular Data Only | 1,468 | 13.6% |
| Satellite Internet | 888 | 8.3% |
| No Internet | 1,073 | 10.0% |
| Total | 10,760 | 100.0% |
Elmore County Summary
Elmore County is located in the south-central region of Idaho, and is bordered by Ada County to the north, Owyhee County to the east, Twin Falls County to the south, and Boise County to the west. The county seat is Mountain Home, and the largest city is Mountain Home. Elmore County has a total area of 2,743 square miles, making it the second-largest county in Idaho. As of the 2010 census, the population was 27,150, making it the sixth-most populous county in Idaho.
History
Elmore County was established in 1889, and was named after the Elmore brothers, who were early settlers in the area. The county was originally part of Alturas County, which was created in 1864. In 1887, the Idaho Legislature split Alturas County into Elmore and Owyhee counties.
Geography
Elmore County is located in the south-central region of Idaho, and is bordered by Ada County to the north, Owyhee County to the east, Twin Falls County to the south, and Boise County to the west. The county has a total area of 2,743 square miles, making it the second-largest county in Idaho. The county is mostly mountainous, with the Sawtooth Mountains to the north and the Owyhee Mountains to the south. The Snake River runs through the county, and there are several reservoirs and lakes, including Anderson Ranch Reservoir, Arrowrock Reservoir, and Lake Lowell.
Economy
Agriculture is the main economic activity in Elmore County. The county is home to several large farms and ranches, and the main crops grown are potatoes, wheat, barley, and hay. The county is also home to several large dairy farms, and the county produces more milk than any other county in Idaho.
The county is also home to several manufacturing companies, including a large food processing plant and a large paper mill. The county is also home to several military bases, including Mountain Home Air Force Base, which is the largest employer in the county.
Demographics
As of the 2010 census, the population of Elmore County was 27,150, making it the sixth-most populous county in Idaho. The population is spread out, with the largest city being Mountain Home, which has a population of 14,206. The county is predominantly white, with 91.3% of the population identifying as white, and the remaining 8.7% identifying as other races. The median household income in the county is $45,845, and the median age is 38.3 years.
Elmore County is a rural county, and the majority of the population lives in small towns and rural areas. The county is home to several small towns, including Glenns Ferry, Grand View, Hammett, and Mountain Home. The county is also home to several Native American reservations, including the Shoshone-Bannock Tribes, the Fort Hall Indian Reservation, and the Duck Valley Indian Reservation.
Common Questions
What is the Total Population of Elmore County?
Total Population of Elmore County is 28,752.
What is the Total Male Population of Elmore County?
Total Male Population of Elmore County is 15,367.
What is the Total Female Population of Elmore County?
Total Female Population of Elmore County is 13,385.
What is the Ratio of Males per 100 Females in Elmore County?
There are 114.81 Males per 100 Females in Elmore County.
What is the Ratio of Females per 100 Males in Elmore County?
There are 87.10 Females per 100 Males in Elmore County.
What is the Median Population Age in Elmore County?
Median Population Age in Elmore County is 32.3 Years.
What is the Average Family Size in Elmore County
Average Family Size in Elmore County is 3.2 People.
What is the Average Household Size in Elmore County
Average Household Size in Elmore County is 2.6 People.
What is Per Capita Income in Elmore County?
Per Capita income in Elmore County is $28,599.
What is the Median Family Income in Elmore County?
Median Family Income in Elmore County is $66,547.
What is the Median Household income in Elmore County?
Median Household Income in Elmore County is $55,000.
What is Income or Wage Gap in Elmore County?
Income or Wage Gap in Elmore County is 29.2%.
Women in Elmore County earn 70.8 cents for every dollar earned by a man.
What is Family Income Deficit in Elmore County?
Family Income Deficit in Elmore County is $10,895.
Families that are below poverty line in Elmore County earn $10,895 less on average than the poverty threshold level.
What is Inequality or Gini Index in Elmore County?
Inequality or Gini Index in Elmore County is 0.42.
How Large is the Labor Force in Elmore County?
There are 13,953 People in the Labor Forcein in Elmore County.
What is the Percentage of People in the Labor Force in Elmore County?
62.8% of People are in the Labor Force in Elmore County.
What is the Unemployment Rate in Elmore County?
Unemployment Rate in Elmore County is 6.4%.