Custer County, ID
Custer County Map

Custer County Overview
4,344
TOTAL POPULATION
2,286
MALE POPULATION
2,058
FEMALE POPULATION
111.08
MALES / 100 FEMALES
90.03
FEMALES / 100 MALES
55.5
MEDIAN AGE
2.9
AVG FAMILY SIZE
2.3
AVG HOUSEHOLD SIZE
$28,913
PER CAPITA INCOME
$75,257
AVG FAMILY INCOME
$60,357
AVG HOUSEHOLD INCOME
17.5%
WAGE / INCOME GAP [ % ]
82.5¢/ $1
WAGE / INCOME GAP [ $ ]
0.39
INEQUALITY / GINI INDEX
1,858
LABOR FORCE [ PEOPLE ]
49.7%
PERCENT IN LABOR FORCE
1.7%
UNEMPLOYMENT RATE
Custer County Area Codes
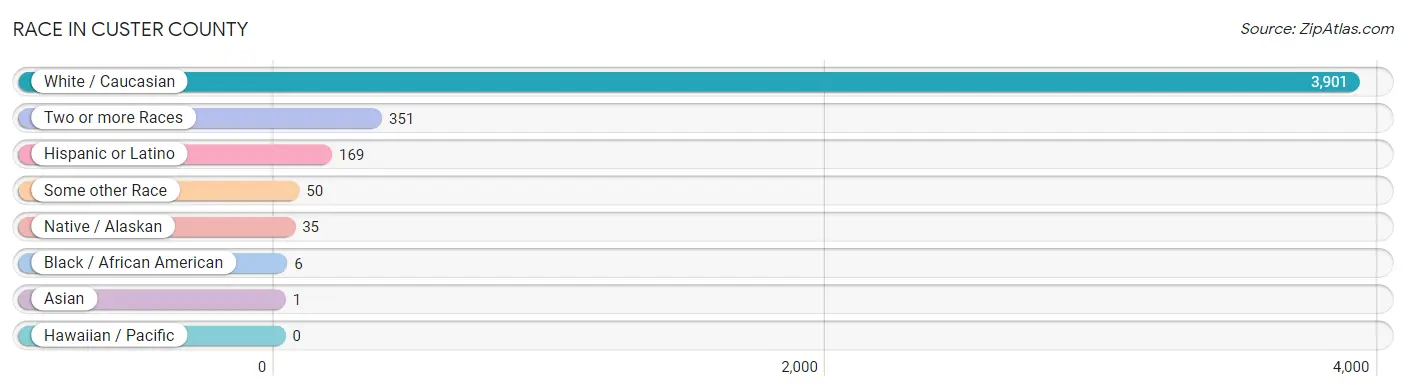
Race in Custer County
The most populous races in Custer County are White / Caucasian (3,901 | 89.8%), Two or more Races (351 | 8.1%), and Hispanic or Latino (169 | 3.9%).
| Race | # Population | % Population |
| Asian | 1 | 0.0% |
| Black / African American | 6 | 0.1% |
| Hawaiian / Pacific | 0 | 0.0% |
| Hispanic or Latino | 169 | 3.9% |
| Native / Alaskan | 35 | 0.8% |
| White / Caucasian | 3,901 | 89.8% |
| Two or more Races | 351 | 8.1% |
| Some other Race | 50 | 1.1% |
| Total | 4,344 | 100.0% |
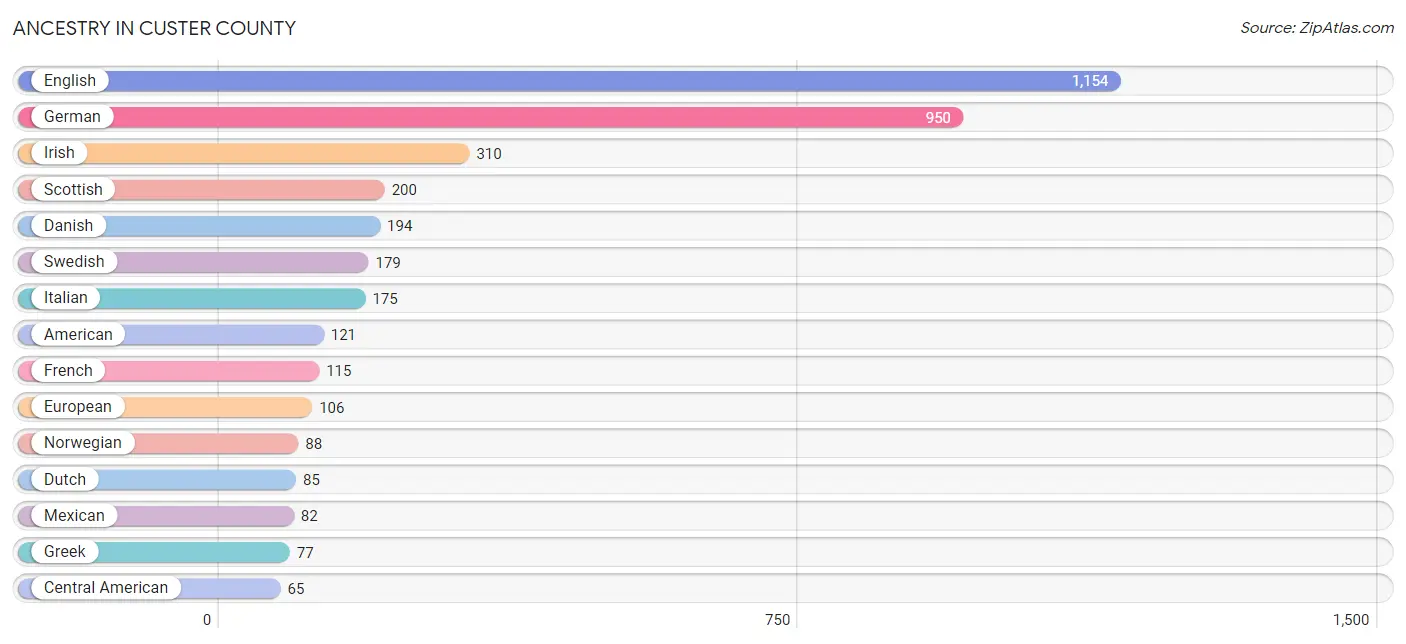
Ancestry in Custer County
The most populous ancestries reported in Custer County are English (1,154 | 26.6%), German (950 | 21.9%), Irish (310 | 7.1%), Scottish (200 | 4.6%), and Danish (194 | 4.5%), together accounting for 64.6% of all Custer County residents.
| Ancestry | # Population | % Population |
| American | 121 | 2.8% |
| Apache | 31 | 0.7% |
| Austrian | 40 | 0.9% |
| British | 61 | 1.4% |
| Burmese | 1 | 0.0% |
| Canadian | 3 | 0.1% |
| Central American | 65 | 1.5% |
| Central American Indian | 65 | 1.5% |
| Cherokee | 22 | 0.5% |
| Croatian | 20 | 0.5% |
| Czech | 4 | 0.1% |
| Danish | 194 | 4.5% |
| Delaware | 29 | 0.7% |
| Dutch | 85 | 2.0% |
| English | 1,154 | 26.6% |
| European | 106 | 2.4% |
| Finnish | 35 | 0.8% |
| French | 115 | 2.6% |
| French American Indian | 15 | 0.4% |
| French Canadian | 1 | 0.0% |
| German | 950 | 21.9% |
| Greek | 77 | 1.8% |
| Hungarian | 1 | 0.0% |
| Indian (Asian) | 15 | 0.4% |
| Irish | 310 | 7.1% |
| Italian | 175 | 4.0% |
| Korean | 2 | 0.1% |
| Mexican | 82 | 1.9% |
| Native Hawaiian | 15 | 0.4% |
| Navajo | 2 | 0.1% |
| Norwegian | 88 | 2.0% |
| Polish | 59 | 1.4% |
| Portuguese | 2 | 0.1% |
| Romanian | 23 | 0.5% |
| Russian | 10 | 0.2% |
| Salvadoran | 65 | 1.5% |
| Scandinavian | 49 | 1.1% |
| Scotch-Irish | 49 | 1.1% |
| Scottish | 200 | 4.6% |
| Sioux | 1 | 0.0% |
| Spanish | 21 | 0.5% |
| Swedish | 179 | 4.1% |
| Swiss | 55 | 1.3% |
| Thai | 29 | 0.7% |
| Welsh | 31 | 0.7% | View All 45 Rows |
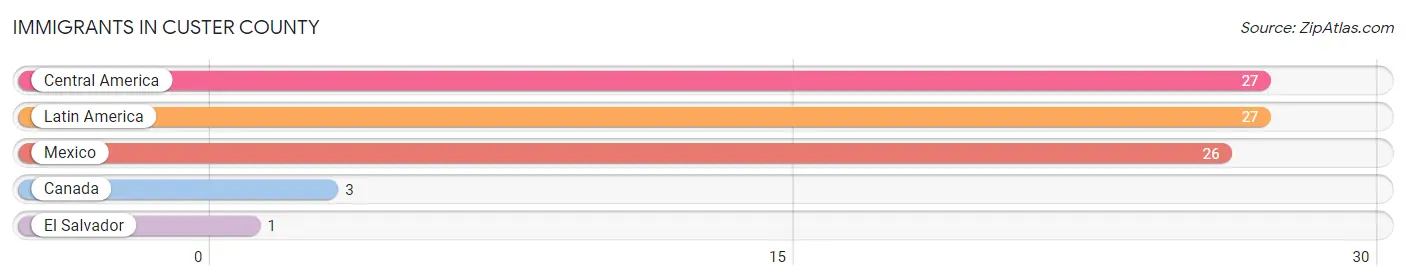
Immigrants in Custer County
The most numerous immigrant groups reported in Custer County came from Central America (27 | 0.6%), Latin America (27 | 0.6%), Mexico (26 | 0.6%), Canada (3 | 0.1%), and El Salvador (1 | 0.0%), together accounting for 1.9% of all Custer County residents.
| Immigration Origin | # Population | % Population |
| Canada | 3 | 0.1% |
| Central America | 27 | 0.6% |
| El Salvador | 1 | 0.0% |
| Latin America | 27 | 0.6% |
| Mexico | 26 | 0.6% | View All 5 Rows |
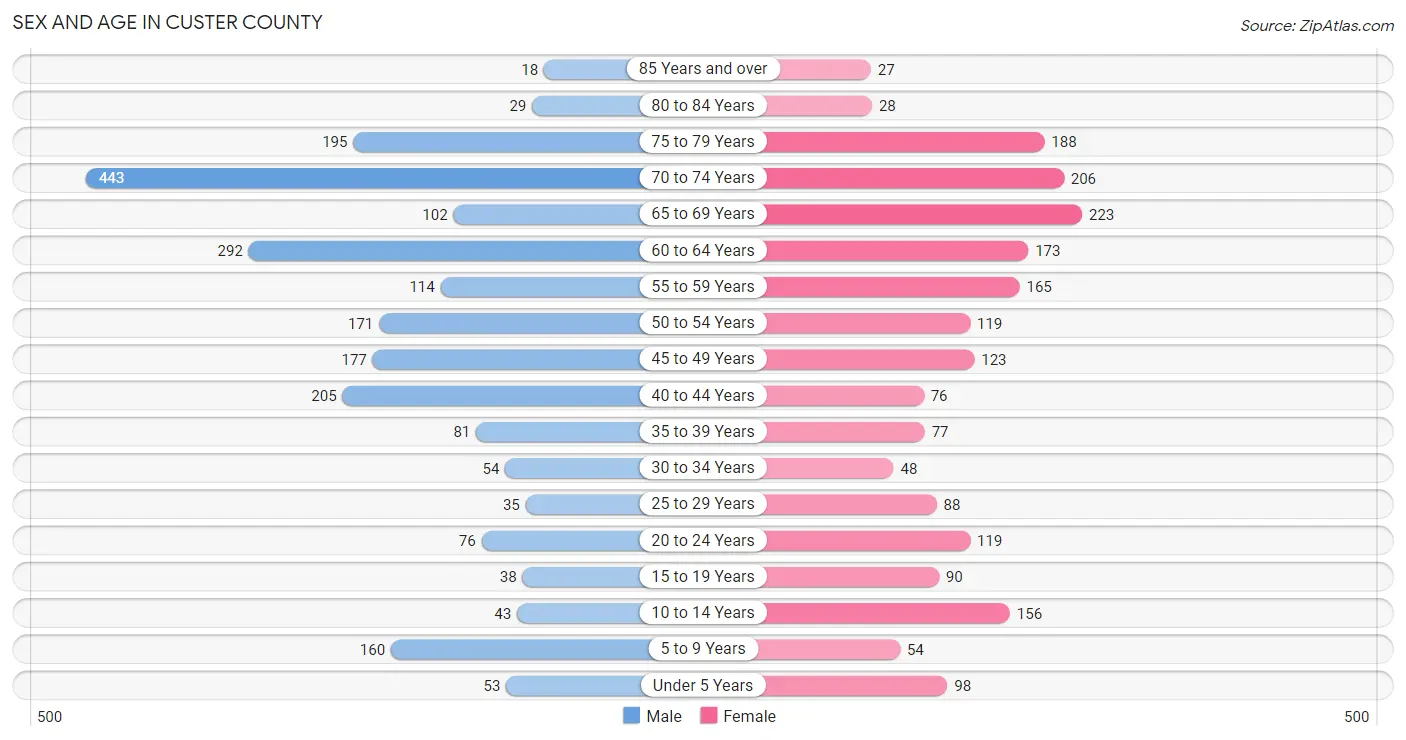
Sex and Age in Custer County
Sex and Age in Custer County
The most populous age groups in Custer County are 70 to 74 Years (443 | 19.4%) for men and 65 to 69 Years (223 | 10.8%) for women.
| Age Bracket | Male | Female |
| Under 5 Years | 53 (2.3%) | 98 (4.8%) |
| 5 to 9 Years | 160 (7.0%) | 54 (2.6%) |
| 10 to 14 Years | 43 (1.9%) | 156 (7.6%) |
| 15 to 19 Years | 38 (1.7%) | 90 (4.4%) |
| 20 to 24 Years | 76 (3.3%) | 119 (5.8%) |
| 25 to 29 Years | 35 (1.5%) | 88 (4.3%) |
| 30 to 34 Years | 54 (2.4%) | 48 (2.3%) |
| 35 to 39 Years | 81 (3.5%) | 77 (3.7%) |
| 40 to 44 Years | 205 (9.0%) | 76 (3.7%) |
| 45 to 49 Years | 177 (7.7%) | 123 (6.0%) |
| 50 to 54 Years | 171 (7.5%) | 119 (5.8%) |
| 55 to 59 Years | 114 (5.0%) | 165 (8.0%) |
| 60 to 64 Years | 292 (12.8%) | 173 (8.4%) |
| 65 to 69 Years | 102 (4.5%) | 223 (10.8%) |
| 70 to 74 Years | 443 (19.4%) | 206 (10.0%) |
| 75 to 79 Years | 195 (8.5%) | 188 (9.1%) |
| 80 to 84 Years | 29 (1.3%) | 28 (1.4%) |
| 85 Years and over | 18 (0.8%) | 27 (1.3%) |
| Total | 2,286 (100.0%) | 2,058 (100.0%) |
Families and Households in Custer County
Median Family Size in Custer County
The median family size in Custer County is 2.86 persons per family, with single female/mother families (104 | 8.6%) accounting for the largest median family size of 4.14 persons per family. On the other hand, married-couple families (1,092 | 90.5%) represent the smallest median family size with 2.74 persons per family.

| Family Type | # Families | Family Size |
| Married-Couple | 1,092 (90.5%) | 2.74 |
| Single Male/Father | 11 (0.9%) | 3.09 |
| Single Female/Mother | 104 (8.6%) | 4.14 |
| Total Families | 1,207 (100.0%) | 2.86 |
Median Household Size in Custer County
The median household size in Custer County is 2.31 persons per household, with single female/mother households (104 | 5.8%) accounting for the largest median household size of 4.81 persons per household. non-family households (601 | 33.2%) represent the smallest median household size with 1.08 persons per household.
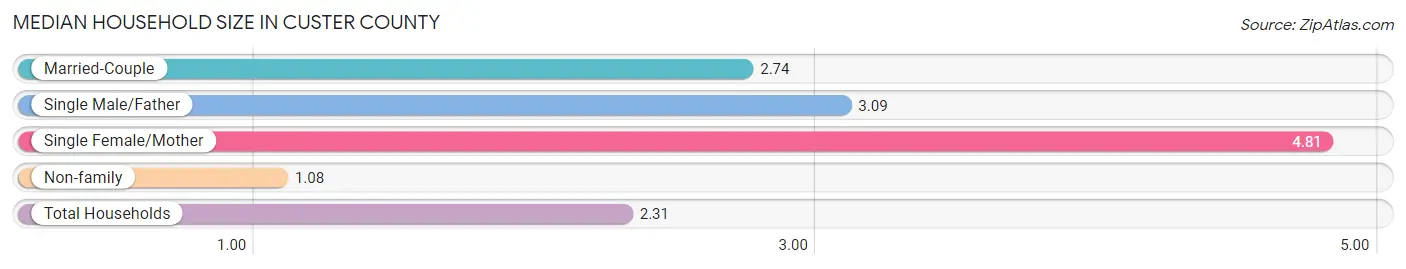
| Household Type | # Households | Household Size |
| Married-Couple | 1,092 (60.4%) | 2.74 |
| Single Male/Father | 11 (0.6%) | 3.09 |
| Single Female/Mother | 104 (5.8%) | 4.81 |
| Non-family | 601 (33.2%) | 1.08 |
| Total Households | 1,808 (100.0%) | 2.31 |
Household Size by Marriage Status in Custer County
Out of a total of 1,808 households in Custer County, 1,207 (66.8%) are family households, while 601 (33.2%) are nonfamily households. The most numerous type of family households are 2-person households, comprising 812, and the most common type of nonfamily households are 1-person households, comprising 564.

| Household Size | Family Households | Nonfamily Households |
| 1-Person Households | - | 564 (31.2%) |
| 2-Person Households | 812 (44.9%) | 37 (2.1%) |
| 3-Person Households | 201 (11.1%) | 0 (0.0%) |
| 4-Person Households | 74 (4.1%) | 0 (0.0%) |
| 5-Person Households | 102 (5.6%) | 0 (0.0%) |
| 6-Person Households | 18 (1.0%) | 0 (0.0%) |
| 7+ Person Households | 0 (0.0%) | 0 (0.0%) |
| Total | 1,207 (66.8%) | 601 (33.2%) |
Female Fertility in Custer County
Fertility by Age in Custer County
Average fertility rate in Custer County is 34.0 births per 1,000 women. Women in the age bracket of 20 to 34 years have the highest fertility rate with 55.0 births per 1,000 women. Women in the age bracket of 20 to 34 years acount for 60.9% of all women with births.
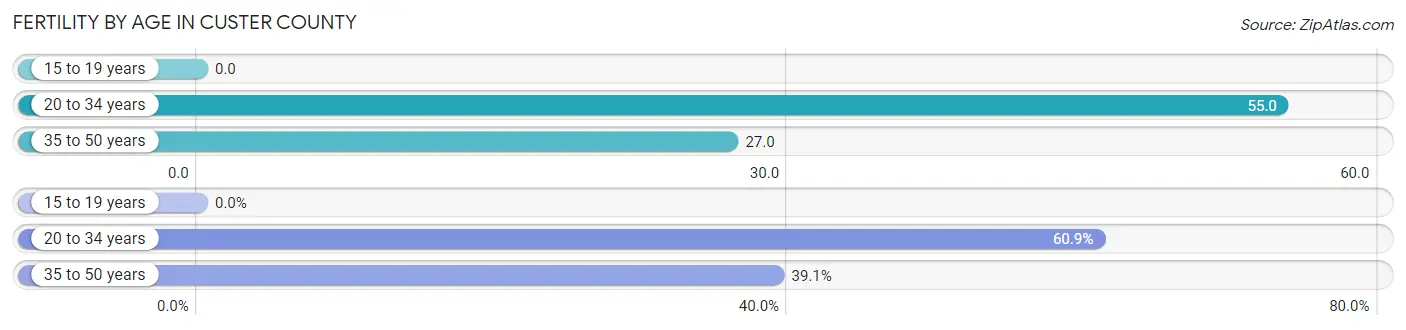
| Age Bracket | Women with Births | Births / 1,000 Women |
| 15 to 19 years | 0 (0.0%) | 0.0 |
| 20 to 34 years | 14 (60.9%) | 55.0 |
| 35 to 50 years | 9 (39.1%) | 27.0 |
| Total | 23 (100.0%) | 34.0 |
Fertility by Age by Marriage Status in Custer County
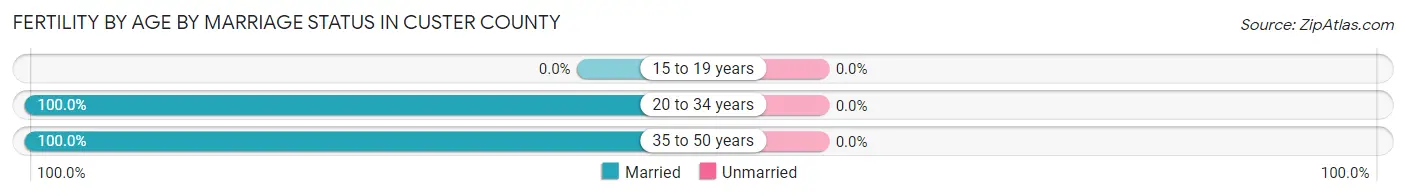
| Age Bracket | Married | Unmarried |
| 15 to 19 years | 0 (0.0%) | 0 (0.0%) |
| 20 to 34 years | 14 (100.0%) | 0 (0.0%) |
| 35 to 50 years | 9 (100.0%) | 0 (0.0%) |
| Total | 23 (100.0%) | 0 (0.0%) |
Fertility by Education in Custer County
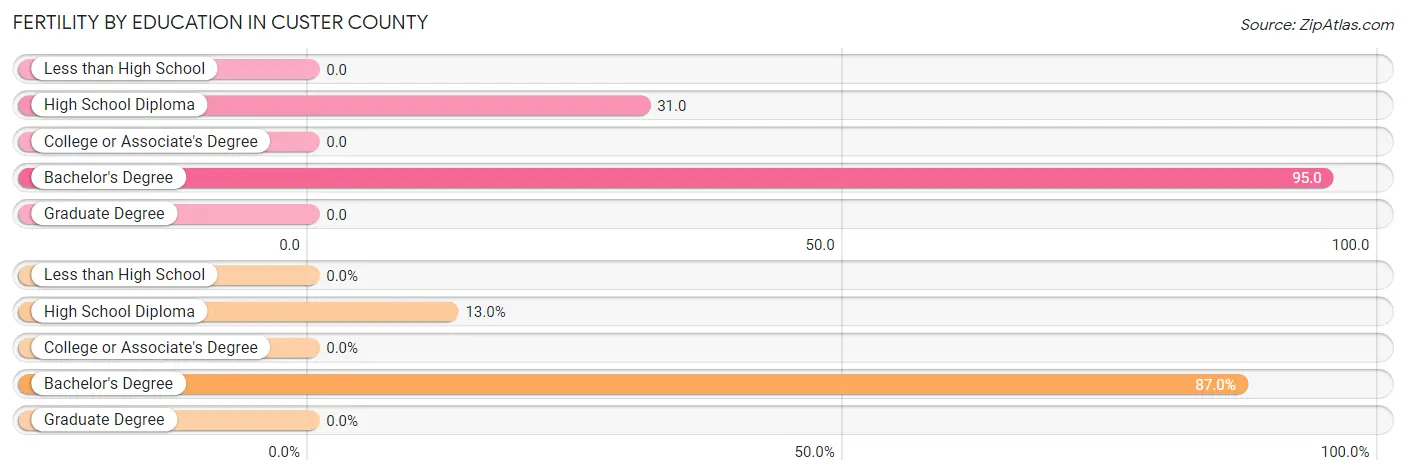
| Educational Attainment | Women with Births | Births / 1,000 Women |
| Less than High School | 0 (0.0%) | 0.0 |
| High School Diploma | 3 (13.0%) | 31.0 |
| College or Associate's Degree | 0 (0.0%) | 0.0 |
| Bachelor's Degree | 20 (87.0%) | 95.0 |
| Graduate Degree | 0 (0.0%) | 0.0 |
| Total | 23 (100.0%) | 34.0 |
Fertility by Education by Marriage Status in Custer County
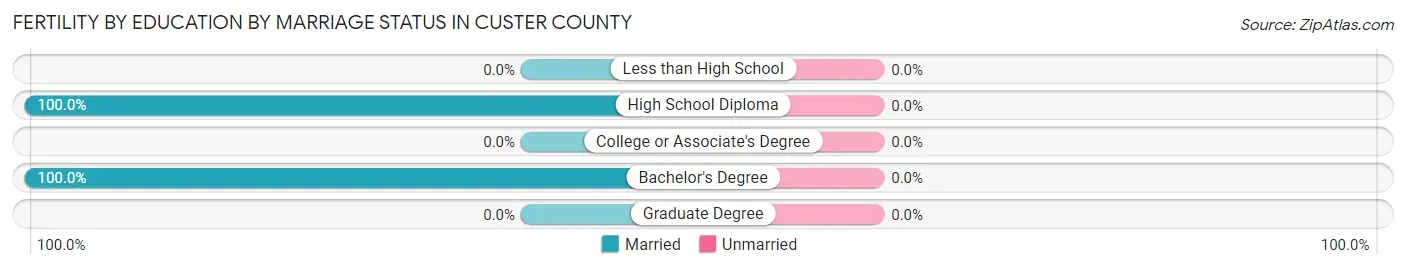
| Educational Attainment | Married | Unmarried |
| Less than High School | 0 (0.0%) | 0 (0.0%) |
| High School Diploma | 3 (100.0%) | 0 (0.0%) |
| College or Associate's Degree | 0 (0.0%) | 0 (0.0%) |
| Bachelor's Degree | 20 (100.0%) | 0 (0.0%) |
| Graduate Degree | 0 (0.0%) | 0 (0.0%) |
| Total | 23 (100.0%) | 0 (0.0%) |
Income in Custer County
Income Overview in Custer County
Per Capita Income in Custer County is $28,913, while median incomes of families and households are $75,257 and $60,357 respectively.
| Characteristic | Number | Measure |
| Per Capita Income | 4,344 | $28,913 |
| Median Family Income | 1,207 | $75,257 |
| Mean Family Income | 1,207 | $81,509 |
| Median Household Income | 1,808 | $60,357 |
| Mean Household Income | 1,808 | $68,465 |
| Income Deficit | 1,207 | $0 |
| Wage / Income Gap (%) | 4,344 | 17.54% |
| Wage / Income Gap ($) | 4,344 | 82.46¢ per $1 |
| Gini / Inequality Index | 4,344 | 0.39 |
Earnings by Sex in Custer County
Average Earnings in Custer County are $22,657, $20,194 for men and $24,490 for women, a difference of 17.5%.

| Sex | Number | Average Earnings |
| Male | 1,218 (54.6%) | $20,194 |
| Female | 1,013 (45.4%) | $24,490 |
| Total | 2,231 (100.0%) | $22,657 |
Earnings by Sex by Income Bracket in Custer County
The most common earnings brackets in Custer County are $12,500 to $14,999 for men (156 | 12.8%) and $22,500 to $24,999 for women (130 | 12.8%).

| Income | Male | Female |
| $2,499 or less | 58 (4.8%) | 37 (3.6%) |
| $2,500 to $4,999 | 26 (2.1%) | 32 (3.2%) |
| $5,000 to $7,499 | 42 (3.5%) | 47 (4.6%) |
| $7,500 to $9,999 | 45 (3.7%) | 101 (10.0%) |
| $10,000 to $12,499 | 153 (12.6%) | 29 (2.9%) |
| $12,500 to $14,999 | 156 (12.8%) | 46 (4.5%) |
| $15,000 to $17,499 | 21 (1.7%) | 28 (2.8%) |
| $17,500 to $19,999 | 100 (8.2%) | 4 (0.4%) |
| $20,000 to $22,499 | 103 (8.5%) | 79 (7.8%) |
| $22,500 to $24,999 | 5 (0.4%) | 130 (12.8%) |
| $25,000 to $29,999 | 21 (1.7%) | 70 (6.9%) |
| $30,000 to $34,999 | 66 (5.4%) | 81 (8.0%) |
| $35,000 to $39,999 | 28 (2.3%) | 79 (7.8%) |
| $40,000 to $44,999 | 61 (5.0%) | 48 (4.7%) |
| $45,000 to $49,999 | 84 (6.9%) | 31 (3.1%) |
| $50,000 to $54,999 | 17 (1.4%) | 25 (2.5%) |
| $55,000 to $64,999 | 36 (3.0%) | 57 (5.6%) |
| $65,000 to $74,999 | 19 (1.6%) | 28 (2.8%) |
| $75,000 to $99,999 | 71 (5.8%) | 21 (2.1%) |
| $100,000+ | 106 (8.7%) | 40 (4.0%) |
| Total | 1,218 (100.0%) | 1,013 (100.0%) |
Earnings by Sex by Educational Attainment in Custer County
Average earnings in Custer County are $20,583 for men and $24,265 for women, a difference of 15.2%. Men with an educational attainment of graduate degree enjoy the highest average annual earnings of $111,146, while those with college or associate's degree education earn the least with $19,531. Women with an educational attainment of graduate degree earn the most with the average annual earnings of $65,250, while those with college or associate's degree education have the smallest earnings of $20,417.
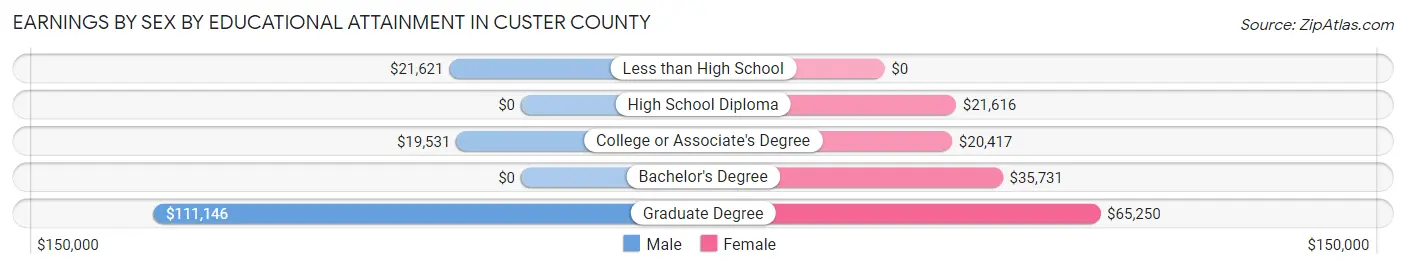
| Educational Attainment | Male Income | Female Income |
| Less than High School | $21,621 | $0 |
| High School Diploma | - | - |
| College or Associate's Degree | $19,531 | $20,417 |
| Bachelor's Degree | - | - |
| Graduate Degree | $111,146 | $65,250 |
| Total | $20,583 | $24,265 |
Family Income in Custer County
Family Income Brackets in Custer County
According to the Custer County family income data, there are 336 families falling into the $50,000 to $74,999 income range, which is the most common income bracket and makes up 27.8% of all families. Conversely, the $10,000 to $14,999 income bracket is the least frequent group with only 13 families (1.1%) belonging to this category.
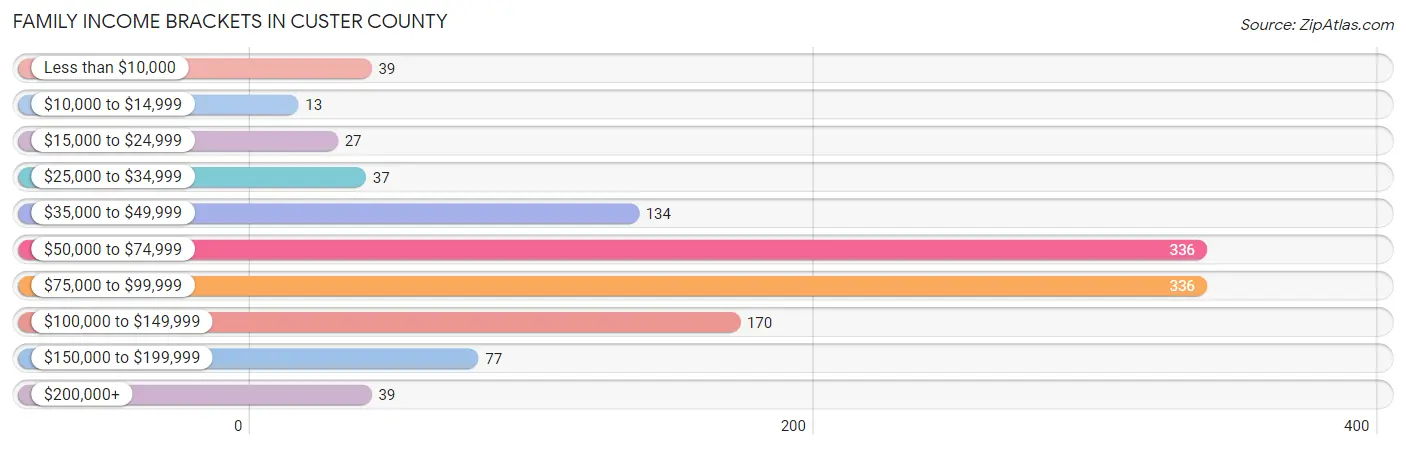
| Income Bracket | # Families | % Families |
| Less than $10,000 | 39 | 3.2% |
| $10,000 to $14,999 | 13 | 1.1% |
| $15,000 to $24,999 | 27 | 2.2% |
| $25,000 to $34,999 | 37 | 3.1% |
| $35,000 to $49,999 | 134 | 11.1% |
| $50,000 to $74,999 | 336 | 27.8% |
| $75,000 to $99,999 | 336 | 27.8% |
| $100,000 to $149,999 | 170 | 14.1% |
| $150,000 to $199,999 | 77 | 6.4% |
| $200,000+ | 39 | 3.2% |
Family Income by Famaliy Size in Custer County
3-person families (188 | 15.6%) account for the highest median family income in Custer County with $100,156 per family, while 2-person families (825 | 68.3%) have the highest median income of $33,918 per family member.
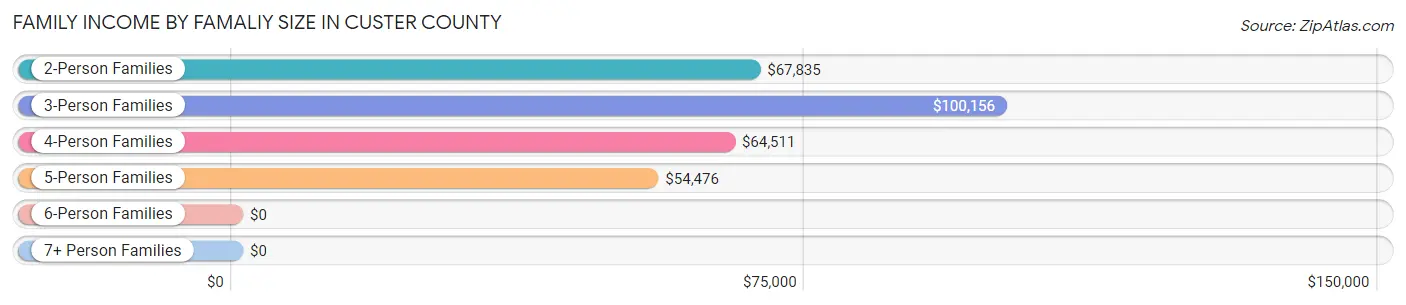
| Income Bracket | # Families | Median Income |
| 2-Person Families | 825 (68.3%) | $67,835 |
| 3-Person Families | 188 (15.6%) | $100,156 |
| 4-Person Families | 111 (9.2%) | $64,511 |
| 5-Person Families | 65 (5.4%) | $54,476 |
| 6-Person Families | 18 (1.5%) | $0 |
| 7+ Person Families | 0 (0.0%) | $0 |
| Total | 1,207 (100.0%) | $75,257 |
Family Income by Number of Earners in Custer County
The median family income in Custer County is $75,257, with families comprising 3+ earners (29) having the highest median family income of $227,986, while families with no earners (311) have the lowest median family income of $52,837, accounting for 2.4% and 25.8% of families, respectively.
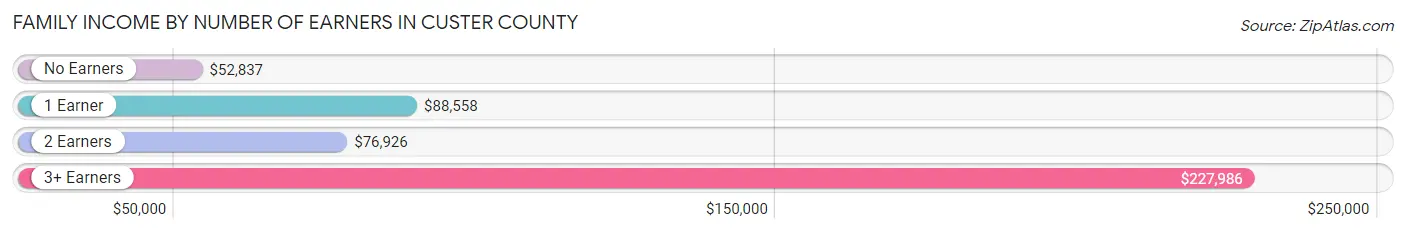
| Number of Earners | # Families | Median Income |
| No Earners | 311 (25.8%) | $52,837 |
| 1 Earner | 221 (18.3%) | $88,558 |
| 2 Earners | 646 (53.5%) | $76,926 |
| 3+ Earners | 29 (2.4%) | $227,986 |
| Total | 1,207 (100.0%) | $75,257 |
Household Income in Custer County
Household Income Brackets in Custer County
With 403 households falling in the category, the $50,000 to $74,999 income range is the most frequent in Custer County, accounting for 22.3% of all households. In contrast, only 43 households (2.4%) fall into the $200,000+ income bracket, making it the least populous group.
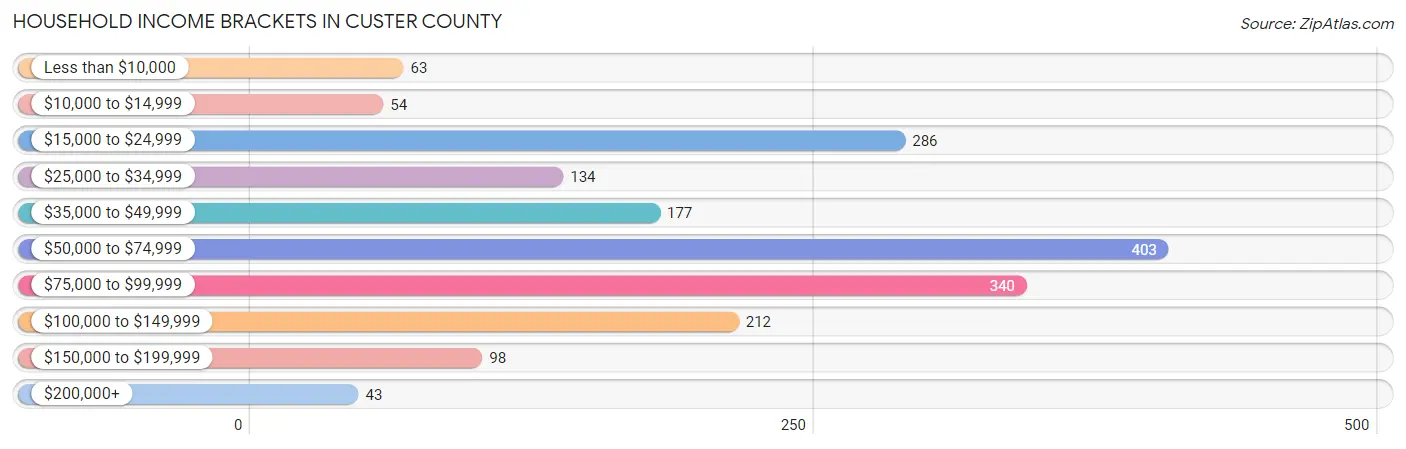
| Income Bracket | # Households | % Households |
| Less than $10,000 | 63 | 3.5% |
| $10,000 to $14,999 | 54 | 3.0% |
| $15,000 to $24,999 | 286 | 15.8% |
| $25,000 to $34,999 | 134 | 7.4% |
| $35,000 to $49,999 | 177 | 9.8% |
| $50,000 to $74,999 | 403 | 22.3% |
| $75,000 to $99,999 | 340 | 18.8% |
| $100,000 to $149,999 | 212 | 11.7% |
| $150,000 to $199,999 | 98 | 5.4% |
| $200,000+ | 43 | 2.4% |
Household Income by Householder Age in Custer County
The median household income in Custer County is $60,357, with the highest median household income of $63,750 found in the 25 to 44 years age bracket for the primary householder. A total of 279 households (15.4%) fall into this category. Meanwhile, the 15 to 24 years age bracket for the primary householder has the lowest median household income of $23,438, with 26 households (1.4%) in this group.
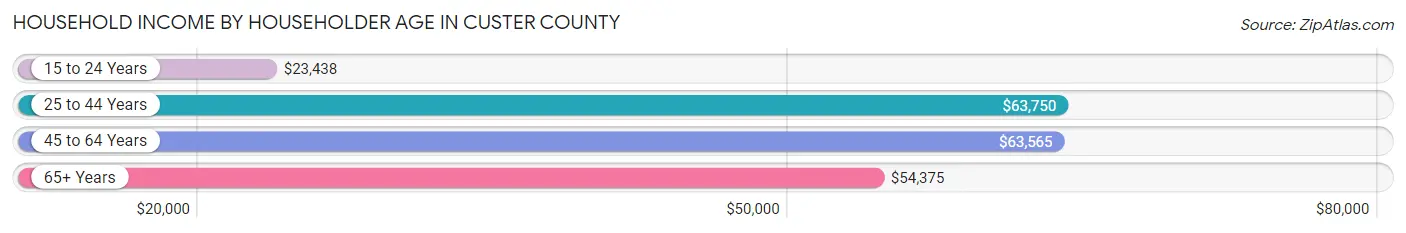
| Income Bracket | # Households | Median Income |
| 15 to 24 Years | 26 (1.4%) | $23,438 |
| 25 to 44 Years | 279 (15.4%) | $63,750 |
| 45 to 64 Years | 652 (36.1%) | $63,565 |
| 65+ Years | 851 (47.1%) | $54,375 |
| Total | 1,808 (100.0%) | $60,357 |
Poverty in Custer County
Income Below Poverty by Sex and Age in Custer County
With 13.0% poverty level for males and 10.0% for females among the residents of Custer County, under 5 year old males and 16 and 17 year old females are the most vulnerable to poverty, with 23 males (43.4%) and 18 females (75.0%) in their respective age groups living below the poverty level.
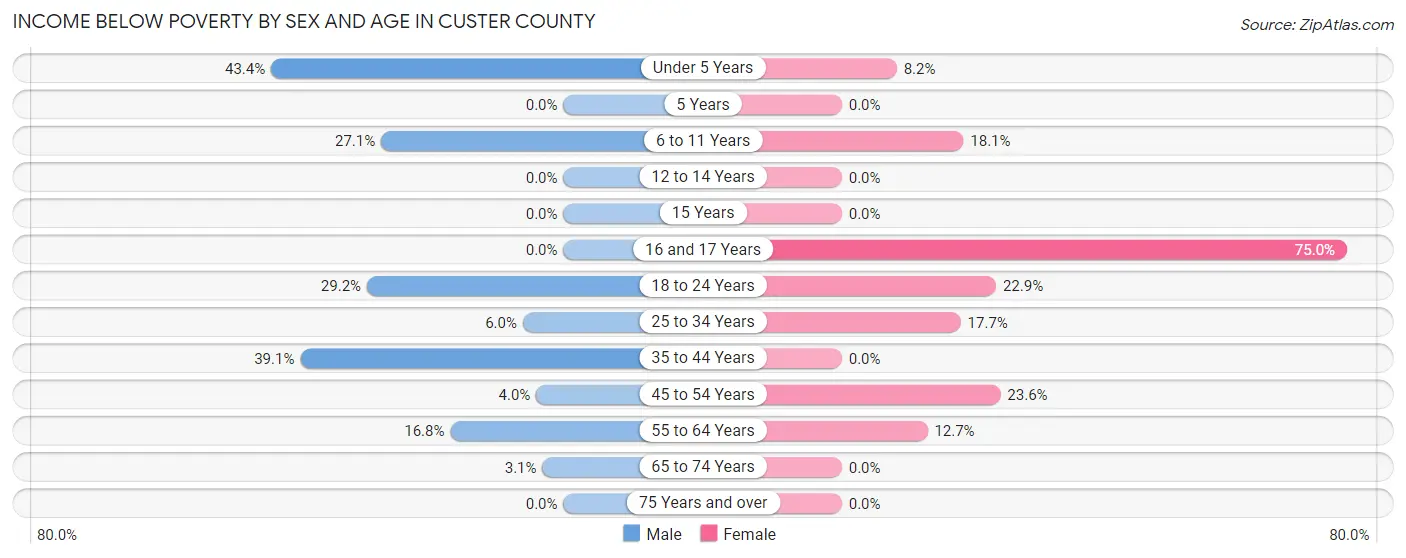
| Age Bracket | Male | Female |
| Under 5 Years | 23 (43.4%) | 8 (8.2%) |
| 5 Years | 0 (0.0%) | 0 (0.0%) |
| 6 to 11 Years | 36 (27.1%) | 24 (18.0%) |
| 12 to 14 Years | 0 (0.0%) | 0 (0.0%) |
| 15 Years | 0 (0.0%) | 0 (0.0%) |
| 16 and 17 Years | 0 (0.0%) | 18 (75.0%) |
| 18 to 24 Years | 21 (29.2%) | 30 (22.9%) |
| 25 to 34 Years | 5 (6.0%) | 24 (17.6%) |
| 35 to 44 Years | 109 (39.1%) | 0 (0.0%) |
| 45 to 54 Years | 14 (4.0%) | 57 (23.5%) |
| 55 to 64 Years | 68 (16.8%) | 43 (12.7%) |
| 65 to 74 Years | 17 (3.1%) | 0 (0.0%) |
| 75 Years and over | 0 (0.0%) | 0 (0.0%) |
| Total | 293 (13.0%) | 204 (10.0%) |
Income Above Poverty by Sex and Age in Custer County
According to the poverty statistics in Custer County, males aged 5 years and females aged 12 to 14 years are the age groups that are most secure financially, with 100.0% of males and 100.0% of females in these age groups living above the poverty line.
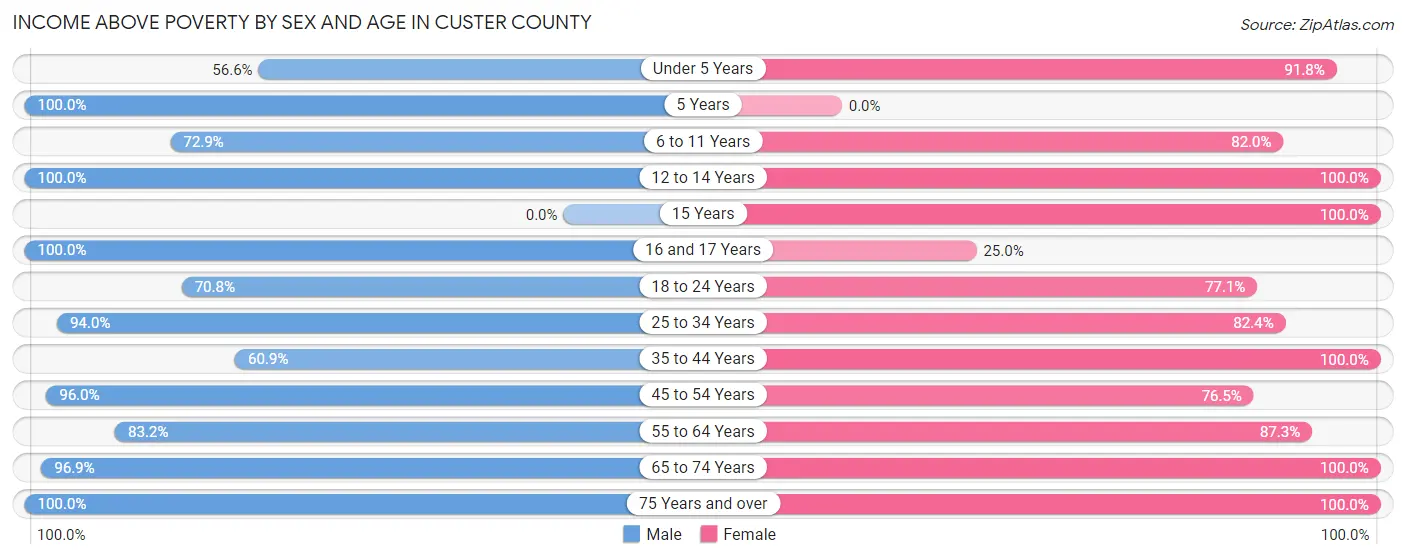
| Age Bracket | Male | Female |
| Under 5 Years | 30 (56.6%) | 90 (91.8%) |
| 5 Years | 42 (100.0%) | 0 (0.0%) |
| 6 to 11 Years | 97 (72.9%) | 109 (82.0%) |
| 12 to 14 Years | 28 (100.0%) | 77 (100.0%) |
| 15 Years | 0 (0.0%) | 41 (100.0%) |
| 16 and 17 Years | 24 (100.0%) | 6 (25.0%) |
| 18 to 24 Years | 51 (70.8%) | 101 (77.1%) |
| 25 to 34 Years | 78 (94.0%) | 112 (82.4%) |
| 35 to 44 Years | 170 (60.9%) | 153 (100.0%) |
| 45 to 54 Years | 333 (96.0%) | 185 (76.4%) |
| 55 to 64 Years | 337 (83.2%) | 295 (87.3%) |
| 65 to 74 Years | 528 (96.9%) | 429 (100.0%) |
| 75 Years and over | 242 (100.0%) | 239 (100.0%) |
| Total | 1,960 (87.0%) | 1,837 (90.0%) |
Income Below Poverty Among Married-Couple Families in Custer County
The poverty statistics for married-couple families in Custer County show that 4.5% or 49 of the total 1,092 families live below the poverty line. Families with 1 or 2 children have the highest poverty rate of 16.4%, comprising of 20 families. On the other hand, families with 3 or 4 children have the lowest poverty rate of 0.0%, which includes 0 families.
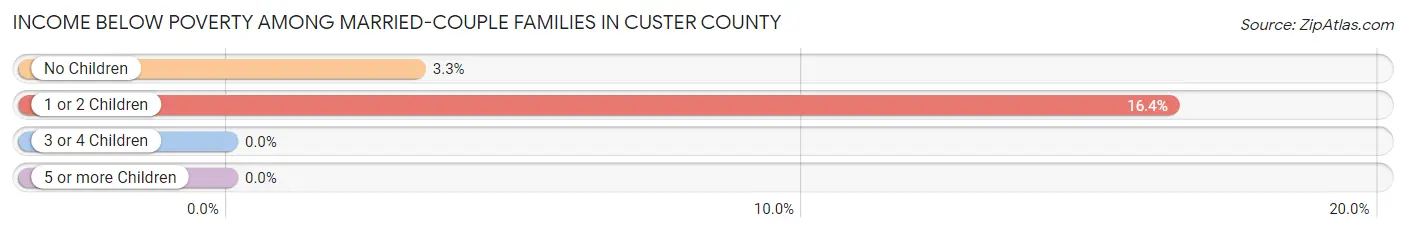
| Children | Above Poverty | Below Poverty |
| No Children | 858 (96.7%) | 29 (3.3%) |
| 1 or 2 Children | 102 (83.6%) | 20 (16.4%) |
| 3 or 4 Children | 83 (100.0%) | 0 (0.0%) |
| 5 or more Children | 0 (0.0%) | 0 (0.0%) |
| Total | 1,043 (95.5%) | 49 (4.5%) |
Income Below Poverty Among Single-Parent Households in Custer County
According to the poverty data in Custer County, 100.0% or 11 single-father households and 17.3% or 18 single-mother households are living below the poverty line. Among single-father households, those with no children have the highest poverty rate, with 11 households (100.0%) experiencing poverty. Likewise, among single-mother households, those with 3 or 4 children have the highest poverty rate, with 13 households (100.0%) falling below the poverty line.

| Children | Single Father | Single Mother |
| No Children | 11 (100.0%) | 0 (0.0%) |
| 1 or 2 Children | 0 (0.0%) | 5 (17.2%) |
| 3 or 4 Children | 0 (0.0%) | 13 (100.0%) |
| 5 or more Children | 0 (0.0%) | 0 (0.0%) |
| Total | 11 (100.0%) | 18 (17.3%) |
Income Below Poverty Among Married-Couple vs Single-Parent Households in Custer County
The poverty data for Custer County shows that 49 of the married-couple family households (4.5%) and 29 of the single-parent households (25.2%) are living below the poverty level. Within the married-couple family households, those with 1 or 2 children have the highest poverty rate, with 20 households (16.4%) falling below the poverty line. Among the single-parent households, those with 3 or 4 children have the highest poverty rate, with 13 household (100.0%) living below poverty.
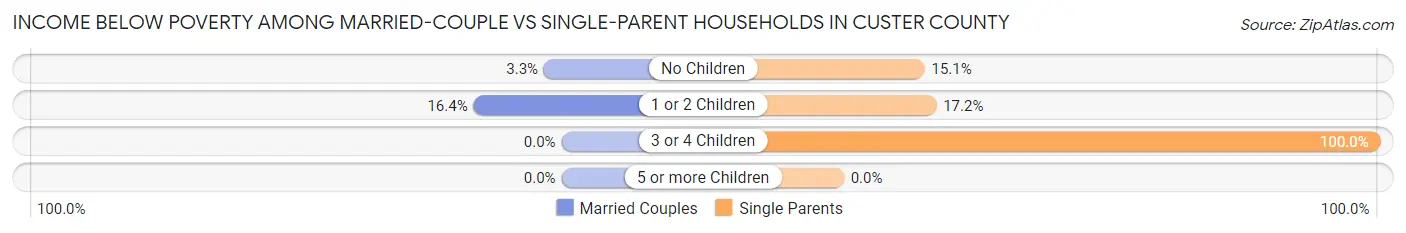
| Children | Married-Couple Families | Single-Parent Households |
| No Children | 29 (3.3%) | 11 (15.1%) |
| 1 or 2 Children | 20 (16.4%) | 5 (17.2%) |
| 3 or 4 Children | 0 (0.0%) | 13 (100.0%) |
| 5 or more Children | 0 (0.0%) | 0 (0.0%) |
| Total | 49 (4.5%) | 29 (25.2%) |
Employment Characteristics in Custer County
Employment by Class of Employer in Custer County
Among the 1,762 employed individuals in Custer County, private company employees (622 | 35.3%), self-employed (incorporated) (352 | 20.0%), and self-employed (not incorporated) (279 | 15.8%) make up the most common classes of employment.
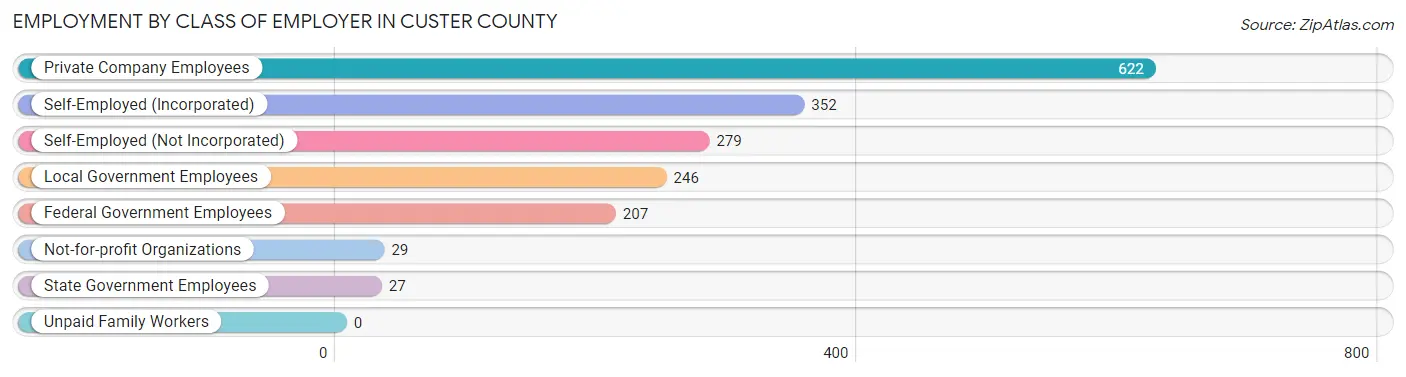
| Employer Class | # Employees | % Employees |
| Private Company Employees | 622 | 35.3% |
| Self-Employed (Incorporated) | 352 | 20.0% |
| Self-Employed (Not Incorporated) | 279 | 15.8% |
| Not-for-profit Organizations | 29 | 1.7% |
| Local Government Employees | 246 | 14.0% |
| State Government Employees | 27 | 1.5% |
| Federal Government Employees | 207 | 11.7% |
| Unpaid Family Workers | 0 | 0.0% |
| Total | 1,762 | 100.0% |
Employment Status by Age in Custer County
According to the labor force statistics for Custer County, out of the total population over 16 years of age (3,739), 49.7% or 1,858 individuals are in the labor force, with 1.7% or 32 of them unemployed. The age group with the highest labor force participation rate is 25 to 29 years, with 91.9% or 113 individuals in the labor force. Within the labor force, the 16 to 19 years age range has the highest percentage of unemployed individuals, with 13.3% or 2 of them being unemployed.

| Age Bracket | In Labor Force | Unemployed |
| 16 to 19 Years | 15 (17.2%) | 2 (13.3%) |
| 20 to 24 Years | 52 (26.7%) | 0 (0.0%) |
| 25 to 29 Years | 113 (91.9%) | 0 (0.0%) |
| 30 to 34 Years | 88 (86.3%) | 0 (0.0%) |
| 35 to 44 Years | 274 (62.4%) | 5 (1.8%) |
| 45 to 54 Years | 513 (86.9%) | 21 (4.1%) |
| 55 to 59 Years | 190 (68.1%) | 0 (0.0%) |
| 60 to 64 Years | 252 (54.2%) | 3 (1.2%) |
| 65 to 74 Years | 355 (36.4%) | 0 (0.0%) |
| 75 Years and over | 5 (1.0%) | 0 (0.0%) |
| Total | 1,858 (49.7%) | 32 (1.7%) |
Employment Status by Educational Attainment in Custer County
According to labor force statistics for Custer County, 71.6% of individuals (1,431) out of the total population between 25 and 64 years of age (1,998) are in the labor force, with 2.0% or 29 of them being unemployed. The group with the highest labor force participation rate are those with the educational attainment of bachelor's degree or higher, with 81.7% or 479 individuals in the labor force. Within the labor force, individuals with high school diploma education have the highest percentage of unemployment, with 5.6% or 21 of them being unemployed.
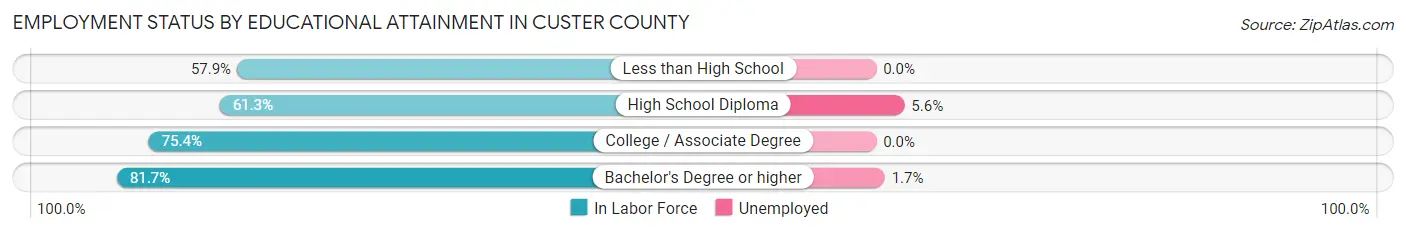
| Educational Attainment | In Labor Force | Unemployed |
| Less than High School | 88 (57.9%) | 0 (0.0%) |
| High School Diploma | 378 (61.3%) | 35 (5.6%) |
| College / Associate Degree | 485 (75.4%) | 0 (0.0%) |
| Bachelor's Degree or higher | 479 (81.7%) | 10 (1.7%) |
| Total | 1,431 (71.6%) | 40 (2.0%) |
Employment Occupations by Sex in Custer County
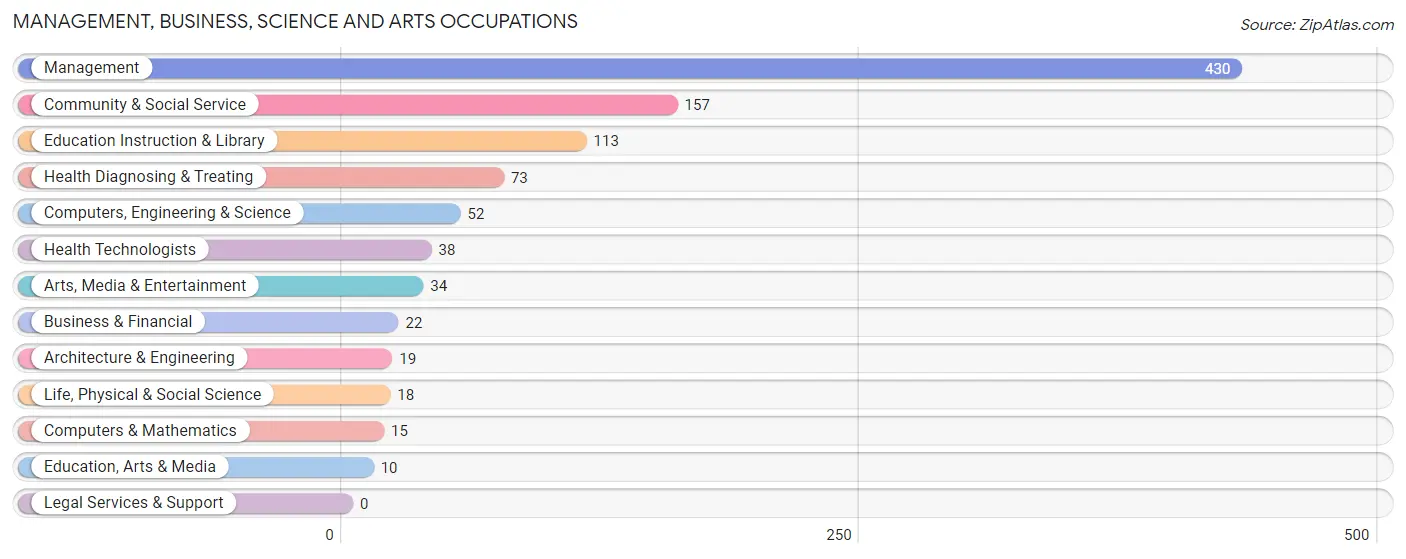
Management, Business, Science and Arts Occupations
The most common Management, Business, Science and Arts occupations in Custer County are Management (430 | 23.5%), Community & Social Service (157 | 8.6%), Education Instruction & Library (113 | 6.2%), Health Diagnosing & Treating (73 | 4.0%), and Computers, Engineering & Science (52 | 2.9%).
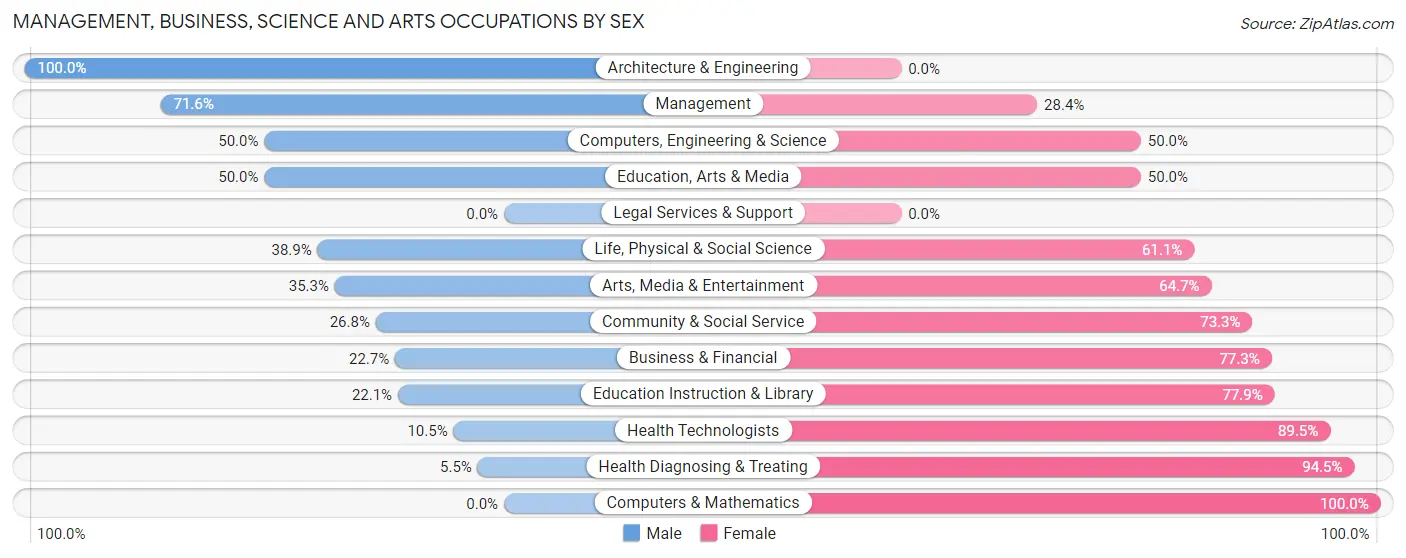
Management, Business, Science and Arts Occupations by Sex
Within the Management, Business, Science and Arts occupations in Custer County, the most male-oriented occupations are Architecture & Engineering (100.0%), Management (71.6%), and Computers, Engineering & Science (50.0%), while the most female-oriented occupations are Computers & Mathematics (100.0%), Health Diagnosing & Treating (94.5%), and Health Technologists (89.5%).
| Occupation | Male | Female |
| Management | 308 (71.6%) | 122 (28.4%) |
| Business & Financial | 5 (22.7%) | 17 (77.3%) |
| Computers, Engineering & Science | 26 (50.0%) | 26 (50.0%) |
| Computers & Mathematics | 0 (0.0%) | 15 (100.0%) |
| Architecture & Engineering | 19 (100.0%) | 0 (0.0%) |
| Life, Physical & Social Science | 7 (38.9%) | 11 (61.1%) |
| Community & Social Service | 42 (26.8%) | 115 (73.3%) |
| Education, Arts & Media | 5 (50.0%) | 5 (50.0%) |
| Legal Services & Support | 0 (0.0%) | 0 (0.0%) |
| Education Instruction & Library | 25 (22.1%) | 88 (77.9%) |
| Arts, Media & Entertainment | 12 (35.3%) | 22 (64.7%) |
| Health Diagnosing & Treating | 4 (5.5%) | 69 (94.5%) |
| Health Technologists | 4 (10.5%) | 34 (89.5%) |
| Total (Category) | 385 (52.4%) | 349 (47.5%) |
| Total (Overall) | 1,037 (56.8%) | 789 (43.2%) |
Services Occupations
The most common Services occupations in Custer County are Healthcare Support (191 | 10.5%), Security & Protection (94 | 5.1%), Firefighting & Prevention (77 | 4.2%), Personal Care & Service (73 | 4.0%), and Cleaning & Maintenance (54 | 3.0%).

Services Occupations by Sex
Within the Services occupations in Custer County, the most male-oriented occupations are Law Enforcement (100.0%), Healthcare Support (77.5%), and Security & Protection (69.2%), while the most female-oriented occupations are Personal Care & Service (100.0%), Food Preparation & Serving (67.3%), and Cleaning & Maintenance (48.1%).

| Occupation | Male | Female |
| Healthcare Support | 148 (77.5%) | 43 (22.5%) |
| Security & Protection | 65 (69.2%) | 29 (30.8%) |
| Firefighting & Prevention | 48 (62.3%) | 29 (37.7%) |
| Law Enforcement | 17 (100.0%) | 0 (0.0%) |
| Food Preparation & Serving | 16 (32.7%) | 33 (67.3%) |
| Cleaning & Maintenance | 28 (51.8%) | 26 (48.1%) |
| Personal Care & Service | 0 (0.0%) | 73 (100.0%) |
| Total (Category) | 257 (55.7%) | 204 (44.3%) |
| Total (Overall) | 1,037 (56.8%) | 789 (43.2%) |
Sales and Office Occupations
The most common Sales and Office occupations in Custer County are Office & Administration (197 | 10.8%), and Sales & Related (177 | 9.7%).

Sales and Office Occupations by Sex
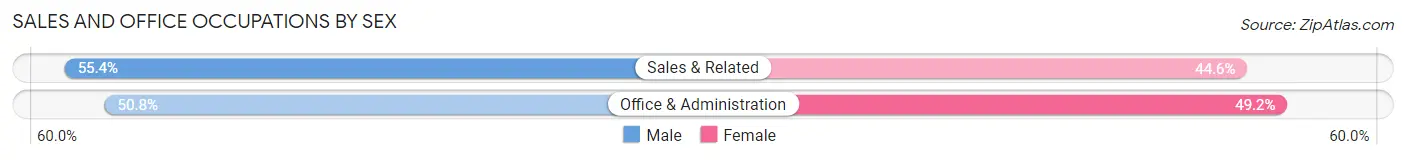
| Occupation | Male | Female |
| Sales & Related | 98 (55.4%) | 79 (44.6%) |
| Office & Administration | 100 (50.8%) | 97 (49.2%) |
| Total (Category) | 198 (52.9%) | 176 (47.1%) |
| Total (Overall) | 1,037 (56.8%) | 789 (43.2%) |
Natural Resources, Construction and Maintenance Occupations
The most common Natural Resources, Construction and Maintenance occupations in Custer County are Construction & Extraction (121 | 6.6%), Farming, Fishing & Forestry (47 | 2.6%), and Installation, Maintenance & Repair (13 | 0.7%).
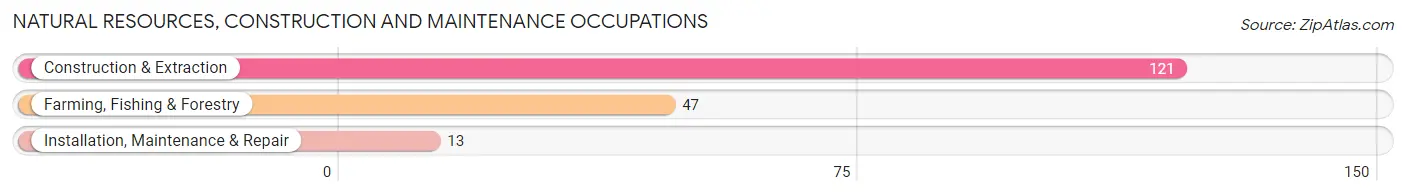
Natural Resources, Construction and Maintenance Occupations by Sex

| Occupation | Male | Female |
| Farming, Fishing & Forestry | 47 (100.0%) | 0 (0.0%) |
| Construction & Extraction | 72 (59.5%) | 49 (40.5%) |
| Installation, Maintenance & Repair | 13 (100.0%) | 0 (0.0%) |
| Total (Category) | 132 (72.9%) | 49 (27.1%) |
| Total (Overall) | 1,037 (56.8%) | 789 (43.2%) |
Production, Transportation and Moving Occupations
The most common Production, Transportation and Moving occupations in Custer County are Production (38 | 2.1%), Material Moving (27 | 1.5%), and Transportation (11 | 0.6%).
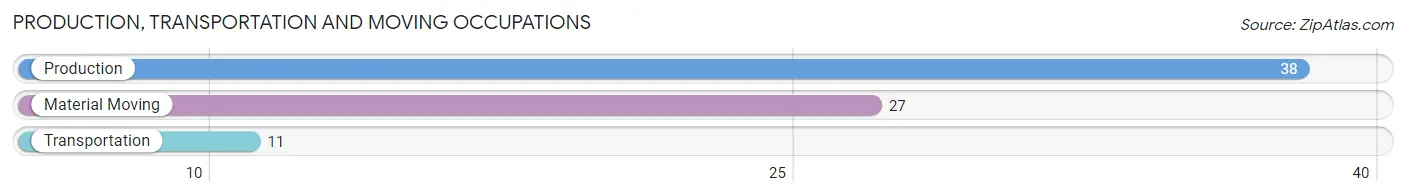
Production, Transportation and Moving Occupations by Sex
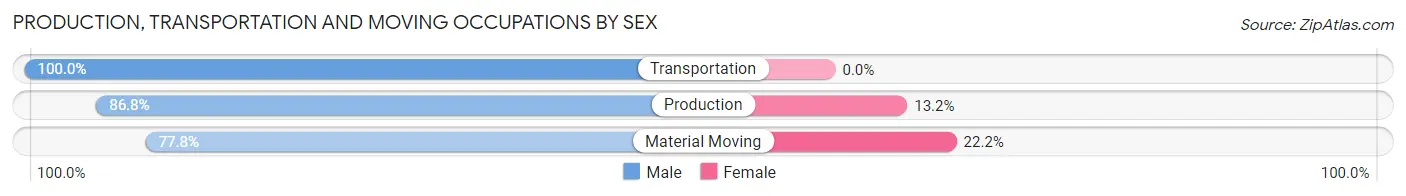
| Occupation | Male | Female |
| Production | 33 (86.8%) | 5 (13.2%) |
| Transportation | 11 (100.0%) | 0 (0.0%) |
| Material Moving | 21 (77.8%) | 6 (22.2%) |
| Total (Category) | 65 (85.5%) | 11 (14.5%) |
| Total (Overall) | 1,037 (56.8%) | 789 (43.2%) |
Employment Industries by Sex in Custer County
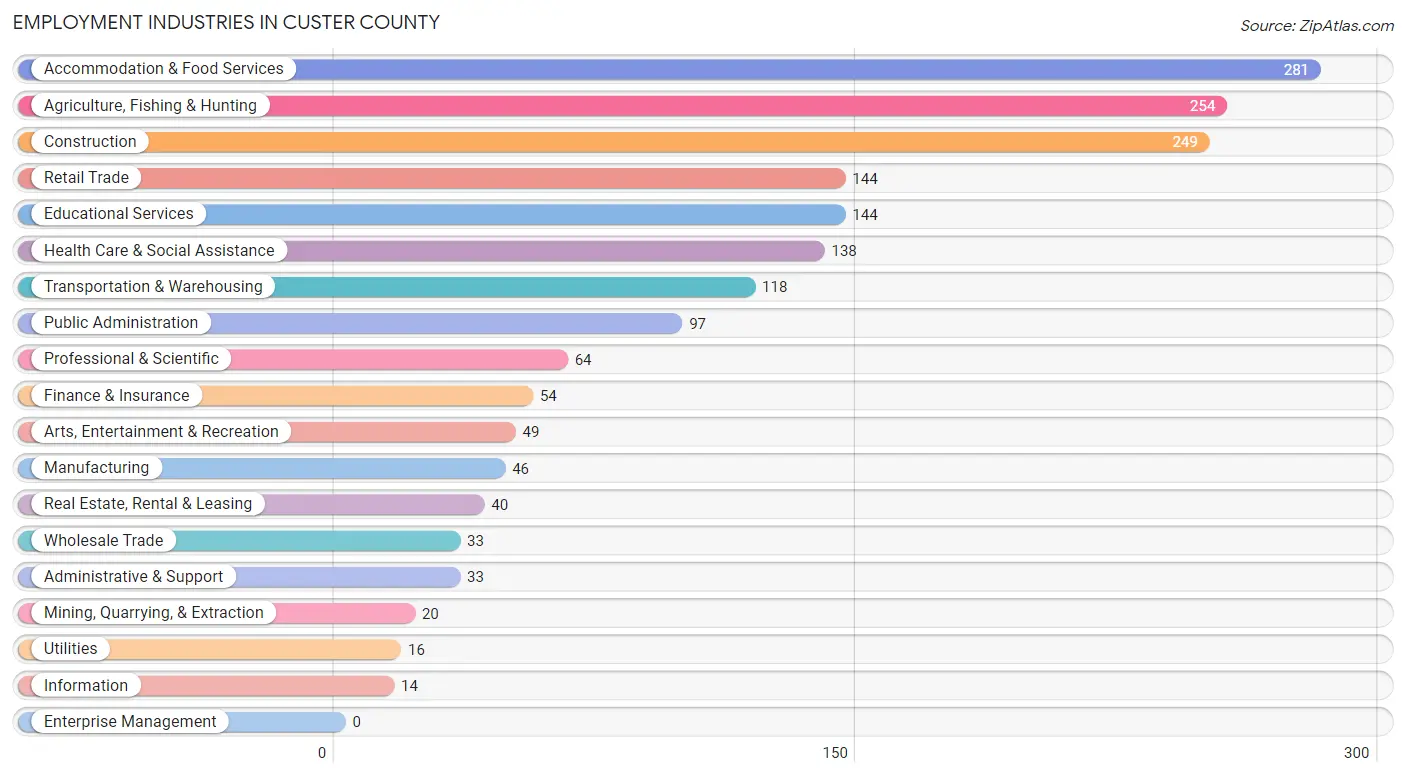
Employment Industries in Custer County
The major employment industries in Custer County include Accommodation & Food Services (281 | 15.4%), Agriculture, Fishing & Hunting (254 | 13.9%), Construction (249 | 13.6%), Retail Trade (144 | 7.9%), and Educational Services (144 | 7.9%).
Employment Industries by Sex in Custer County
The Custer County industries that see more men than women are Mining, Quarrying, & Extraction (100.0%), Utilities (100.0%), and Administrative & Support (100.0%), whereas the industries that tend to have a higher number of women are Finance & Insurance (100.0%), Health Care & Social Assistance (94.9%), and Real Estate, Rental & Leasing (90.0%).
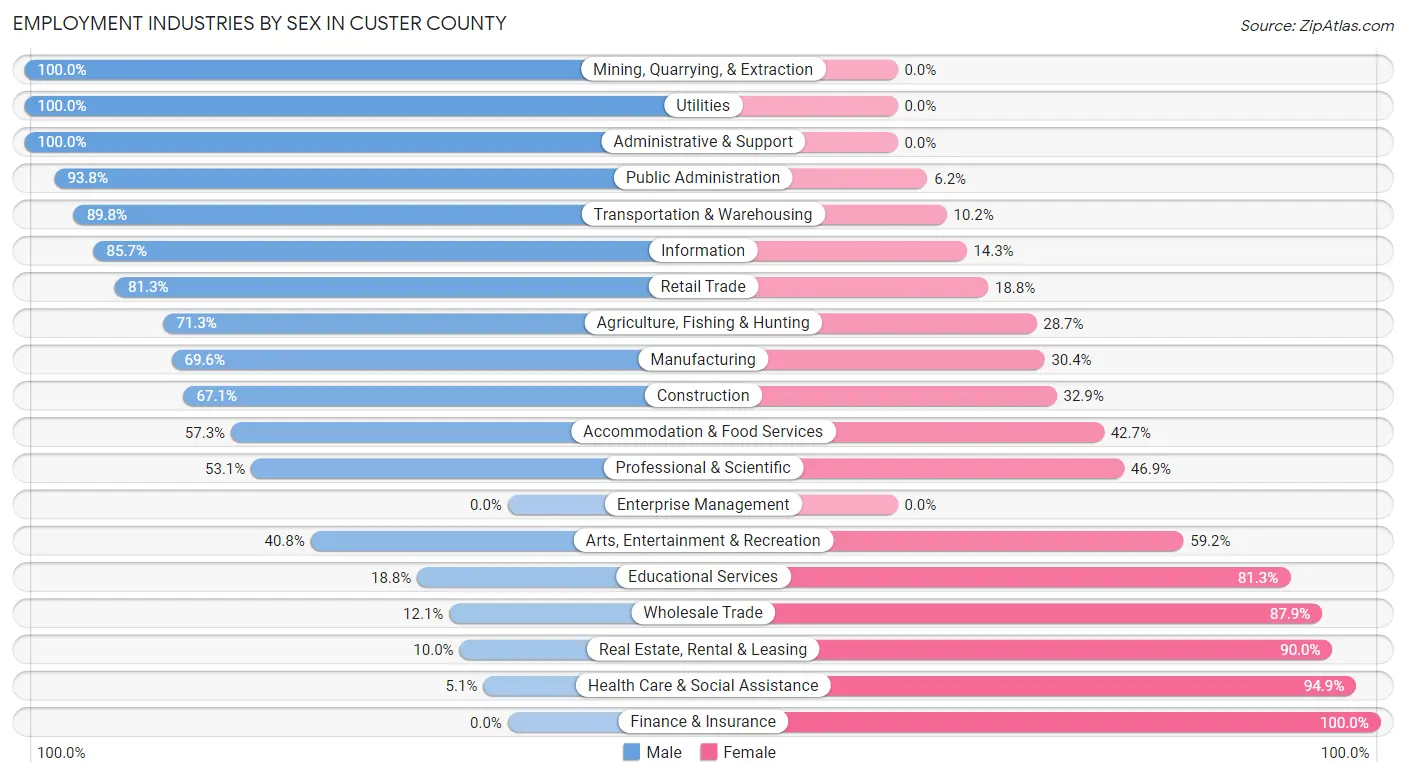
| Industry | Male | Female |
| Agriculture, Fishing & Hunting | 181 (71.3%) | 73 (28.7%) |
| Mining, Quarrying, & Extraction | 20 (100.0%) | 0 (0.0%) |
| Construction | 167 (67.1%) | 82 (32.9%) |
| Manufacturing | 32 (69.6%) | 14 (30.4%) |
| Wholesale Trade | 4 (12.1%) | 29 (87.9%) |
| Retail Trade | 117 (81.2%) | 27 (18.8%) |
| Transportation & Warehousing | 106 (89.8%) | 12 (10.2%) |
| Utilities | 16 (100.0%) | 0 (0.0%) |
| Information | 12 (85.7%) | 2 (14.3%) |
| Finance & Insurance | 0 (0.0%) | 54 (100.0%) |
| Real Estate, Rental & Leasing | 4 (10.0%) | 36 (90.0%) |
| Professional & Scientific | 34 (53.1%) | 30 (46.9%) |
| Enterprise Management | 0 (0.0%) | 0 (0.0%) |
| Administrative & Support | 33 (100.0%) | 0 (0.0%) |
| Educational Services | 27 (18.8%) | 117 (81.2%) |
| Health Care & Social Assistance | 7 (5.1%) | 131 (94.9%) |
| Arts, Entertainment & Recreation | 20 (40.8%) | 29 (59.2%) |
| Accommodation & Food Services | 161 (57.3%) | 120 (42.7%) |
| Public Administration | 91 (93.8%) | 6 (6.2%) |
| Total | 1,037 (56.8%) | 789 (43.2%) |
Education in Custer County
School Enrollment in Custer County
The most common levels of schooling among the 587 students in Custer County are elementary school (223 | 38.0%), middle school (116 | 19.8%), and high school (81 | 13.8%).

| School Level | # Students | % Students |
| Nursery / Preschool | 64 | 10.9% |
| Kindergarten | 28 | 4.8% |
| Elementary School | 223 | 38.0% |
| Middle School | 116 | 19.8% |
| High School | 81 | 13.8% |
| College / Undergraduate | 69 | 11.7% |
| Graduate / Professional | 6 | 1.0% |
| Total | 587 | 100.0% |
School Enrollment by Age by Funding Source in Custer County
Out of a total of 587 students who are enrolled in schools in Custer County, 31 (5.3%) attend a private institution, while the remaining 556 (94.7%) are enrolled in public schools. The age group of 3 to 4 year olds has the highest likelihood of being enrolled in private schools, with 14 (30.4% in the age bracket) enrolled. Conversely, the age group of 10 to 14 year olds has the lowest likelihood of being enrolled in a private school, with 194 (100.0% in the age bracket) attending a public institution.

| Age Bracket | Public School | Private School |
| 3 to 4 Year Olds | 32 (69.6%) | 14 (30.4%) |
| 5 to 9 Year Old | 192 (97.0%) | 6 (3.0%) |
| 10 to 14 Year Olds | 194 (100.0%) | 0 (0.0%) |
| 15 to 17 Year Olds | 71 (100.0%) | 0 (0.0%) |
| 18 to 19 Year Olds | 15 (100.0%) | 0 (0.0%) |
| 20 to 24 Year Olds | 27 (93.1%) | 2 (6.9%) |
| 25 to 34 Year Olds | 0 (0.0%) | 0 (0.0%) |
| 35 Years and over | 25 (73.5%) | 9 (26.5%) |
| Total | 556 (94.7%) | 31 (5.3%) |
Educational Attainment by Field of Study in Custer County
Bio, nature & agricultural (229 | 22.7%), education (164 | 16.2%), psychology (145 | 14.3%), physical & health sciences (96 | 9.5%), and computers & mathematics (93 | 9.2%) are the most common fields of study among 1,011 individuals in Custer County who have obtained a bachelor's degree or higher.
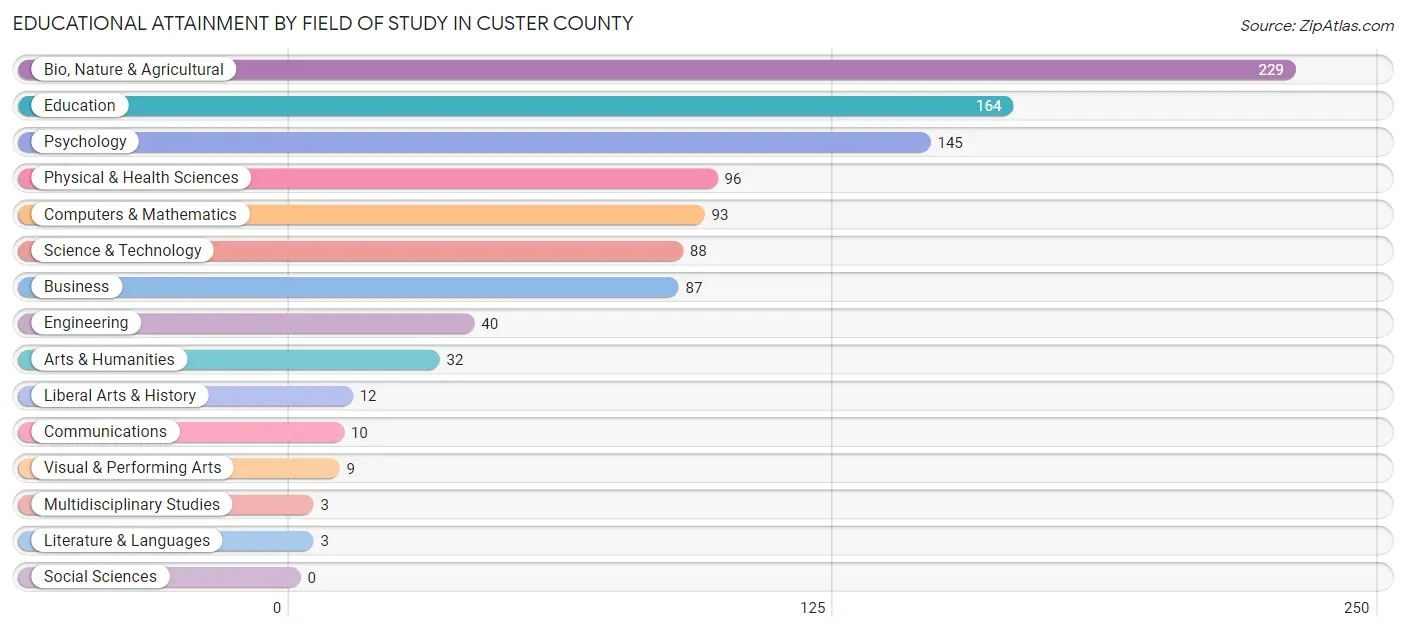
| Field of Study | # Graduates | % Graduates |
| Computers & Mathematics | 93 | 9.2% |
| Bio, Nature & Agricultural | 229 | 22.7% |
| Physical & Health Sciences | 96 | 9.5% |
| Psychology | 145 | 14.3% |
| Social Sciences | 0 | 0.0% |
| Engineering | 40 | 4.0% |
| Multidisciplinary Studies | 3 | 0.3% |
| Science & Technology | 88 | 8.7% |
| Business | 87 | 8.6% |
| Education | 164 | 16.2% |
| Literature & Languages | 3 | 0.3% |
| Liberal Arts & History | 12 | 1.2% |
| Visual & Performing Arts | 9 | 0.9% |
| Communications | 10 | 1.0% |
| Arts & Humanities | 32 | 3.2% |
| Total | 1,011 | 100.0% |
Transportation & Commute in Custer County
Vehicle Availability by Sex in Custer County
The most prevalent vehicle ownership categories in Custer County are males with 2 vehicles (349, accounting for 36.8%) and females with 2 vehicles (233, making up 45.6%).
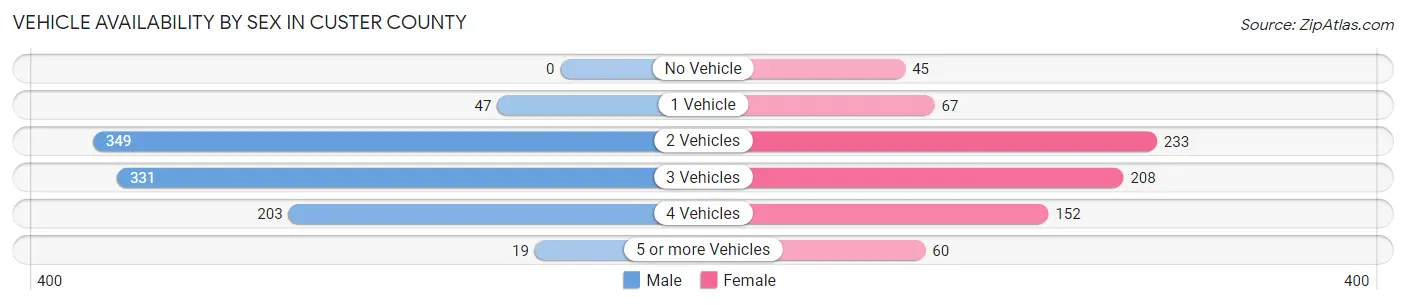
| Vehicles Available | Male | Female |
| No Vehicle | 0 (0.0%) | 45 (5.9%) |
| 1 Vehicle | 47 (5.0%) | 67 (8.8%) |
| 2 Vehicles | 349 (36.8%) | 233 (30.5%) |
| 3 Vehicles | 331 (34.9%) | 208 (27.2%) |
| 4 Vehicles | 203 (21.4%) | 152 (19.9%) |
| 5 or more Vehicles | 19 (2.0%) | 60 (7.8%) |
| Total | 949 (100.0%) | 765 (100.0%) |
Commute Time in Custer County
The most frequently occuring commute durations in Custer County are less than 5 minutes (267 commuters, 21.1%), 5 to 9 minutes (225 commuters, 17.7%), and 10 to 14 minutes (220 commuters, 17.3%).

| Commute Time | # Commuters | % Commuters |
| Less than 5 Minutes | 267 | 21.1% |
| 5 to 9 Minutes | 225 | 17.7% |
| 10 to 14 Minutes | 220 | 17.3% |
| 15 to 19 Minutes | 216 | 17.0% |
| 20 to 24 Minutes | 57 | 4.5% |
| 25 to 29 Minutes | 22 | 1.7% |
| 30 to 34 Minutes | 74 | 5.8% |
| 35 to 39 Minutes | 13 | 1.0% |
| 40 to 44 Minutes | 4 | 0.3% |
| 45 to 59 Minutes | 64 | 5.1% |
| 60 to 89 Minutes | 101 | 8.0% |
| 90 or more Minutes | 5 | 0.4% |
Commute Time by Sex in Custer County
The most common commute times in Custer County are 10 to 14 minutes (178 commuters, 24.6%) for males and less than 5 minutes (141 commuters, 25.9%) for females.
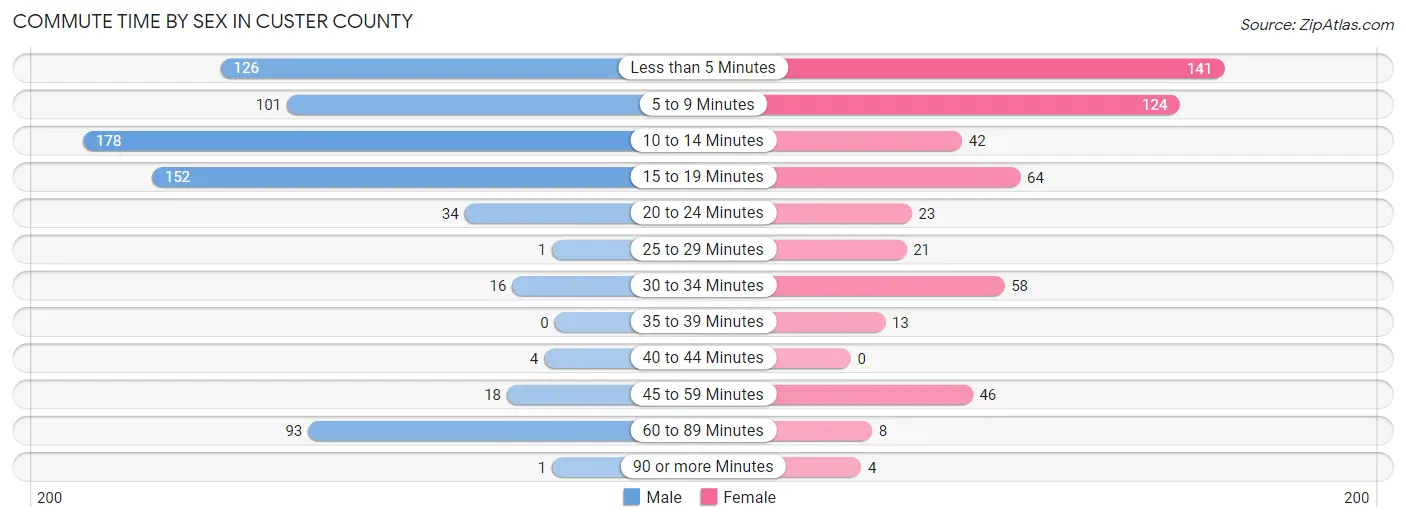
| Commute Time | Male | Female |
| Less than 5 Minutes | 126 (17.4%) | 141 (25.9%) |
| 5 to 9 Minutes | 101 (14.0%) | 124 (22.8%) |
| 10 to 14 Minutes | 178 (24.6%) | 42 (7.7%) |
| 15 to 19 Minutes | 152 (21.0%) | 64 (11.8%) |
| 20 to 24 Minutes | 34 (4.7%) | 23 (4.2%) |
| 25 to 29 Minutes | 1 (0.1%) | 21 (3.9%) |
| 30 to 34 Minutes | 16 (2.2%) | 58 (10.7%) |
| 35 to 39 Minutes | 0 (0.0%) | 13 (2.4%) |
| 40 to 44 Minutes | 4 (0.5%) | 0 (0.0%) |
| 45 to 59 Minutes | 18 (2.5%) | 46 (8.5%) |
| 60 to 89 Minutes | 93 (12.9%) | 8 (1.5%) |
| 90 or more Minutes | 1 (0.1%) | 4 (0.7%) |
Time of Departure to Work by Sex in Custer County
The most frequent times of departure to work in Custer County are 8:00 AM to 8:29 AM (163, 22.5%) for males and 7:00 AM to 7:29 AM (125, 23.0%) for females.
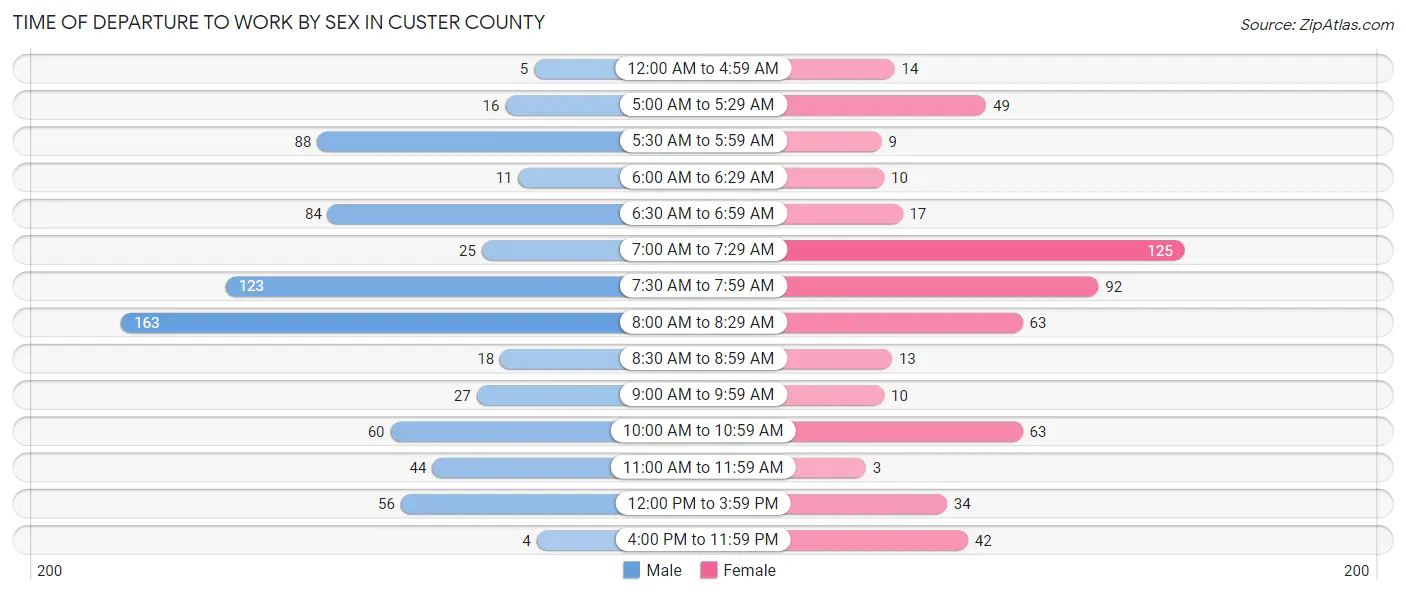
| Time of Departure | Male | Female |
| 12:00 AM to 4:59 AM | 5 (0.7%) | 14 (2.6%) |
| 5:00 AM to 5:29 AM | 16 (2.2%) | 49 (9.0%) |
| 5:30 AM to 5:59 AM | 88 (12.1%) | 9 (1.7%) |
| 6:00 AM to 6:29 AM | 11 (1.5%) | 10 (1.8%) |
| 6:30 AM to 6:59 AM | 84 (11.6%) | 17 (3.1%) |
| 7:00 AM to 7:29 AM | 25 (3.5%) | 125 (23.0%) |
| 7:30 AM to 7:59 AM | 123 (17.0%) | 92 (16.9%) |
| 8:00 AM to 8:29 AM | 163 (22.5%) | 63 (11.6%) |
| 8:30 AM to 8:59 AM | 18 (2.5%) | 13 (2.4%) |
| 9:00 AM to 9:59 AM | 27 (3.7%) | 10 (1.8%) |
| 10:00 AM to 10:59 AM | 60 (8.3%) | 63 (11.6%) |
| 11:00 AM to 11:59 AM | 44 (6.1%) | 3 (0.5%) |
| 12:00 PM to 3:59 PM | 56 (7.7%) | 34 (6.2%) |
| 4:00 PM to 11:59 PM | 4 (0.5%) | 42 (7.7%) |
| Total | 724 (100.0%) | 544 (100.0%) |
Housing Occupancy in Custer County
Occupancy by Ownership in Custer County
Of the total 1,808 dwellings in Custer County, owner-occupied units account for 1,408 (77.9%), while renter-occupied units make up 400 (22.1%).

| Occupancy | # Housing Units | % Housing Units |
| Owner Occupied Housing Units | 1,408 | 77.9% |
| Renter-Occupied Housing Units | 400 | 22.1% |
| Total Occupied Housing Units | 1,808 | 100.0% |
Occupancy by Household Size in Custer County
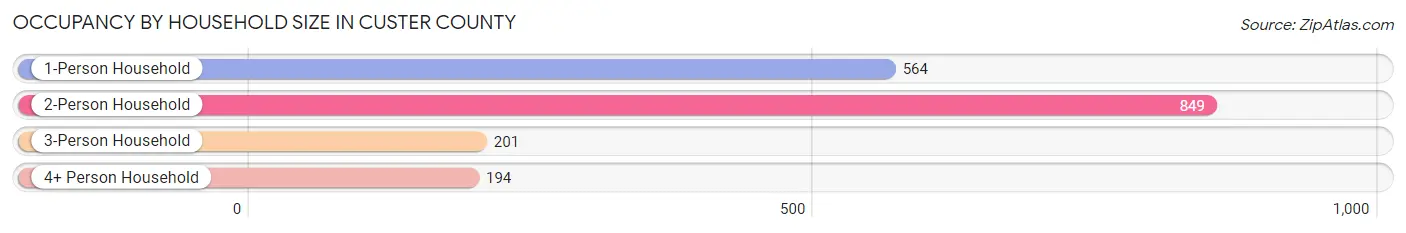
| Household Size | # Housing Units | % Housing Units |
| 1-Person Household | 564 | 31.2% |
| 2-Person Household | 849 | 47.0% |
| 3-Person Household | 201 | 11.1% |
| 4+ Person Household | 194 | 10.7% |
| Total Housing Units | 1,808 | 100.0% |
Occupancy by Ownership by Household Size in Custer County
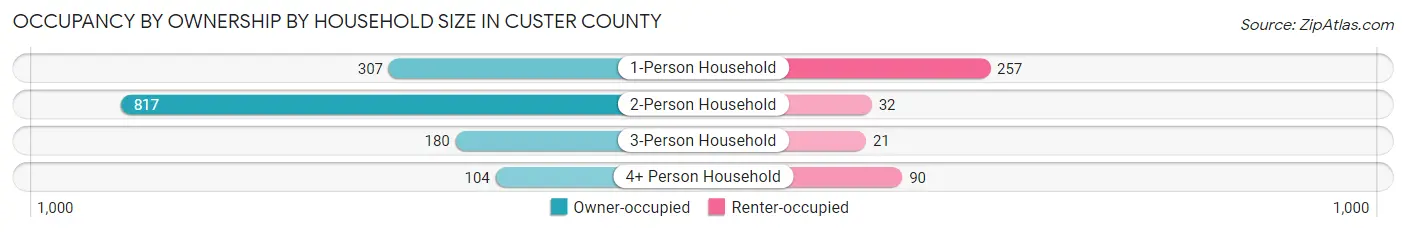
| Household Size | Owner-occupied | Renter-occupied |
| 1-Person Household | 307 (54.4%) | 257 (45.6%) |
| 2-Person Household | 817 (96.2%) | 32 (3.8%) |
| 3-Person Household | 180 (89.5%) | 21 (10.4%) |
| 4+ Person Household | 104 (53.6%) | 90 (46.4%) |
| Total Housing Units | 1,408 (77.9%) | 400 (22.1%) |
Occupancy by Educational Attainment in Custer County
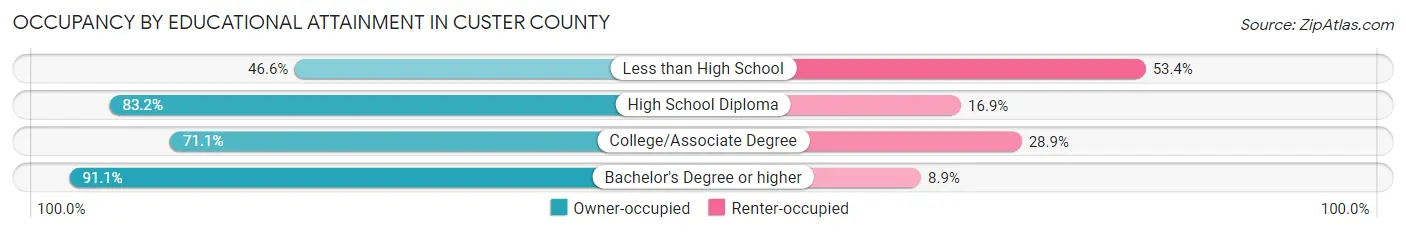
| Household Size | Owner-occupied | Renter-occupied |
| Less than High School | 88 (46.6%) | 101 (53.4%) |
| High School Diploma | 296 (83.2%) | 60 (16.9%) |
| College/Associate Degree | 451 (71.1%) | 183 (28.9%) |
| Bachelor's Degree or higher | 573 (91.1%) | 56 (8.9%) |
Occupancy by Age of Householder in Custer County

| Age Bracket | # Households | % Households |
| Under 35 Years | 133 | 7.4% |
| 35 to 44 Years | 172 | 9.5% |
| 45 to 54 Years | 212 | 11.7% |
| 55 to 64 Years | 440 | 24.3% |
| 65 to 74 Years | 504 | 27.9% |
| 75 to 84 Years | 327 | 18.1% |
| 85 Years and Over | 20 | 1.1% |
| Total | 1,808 | 100.0% |
Housing Finances in Custer County
Median Income by Occupancy in Custer County
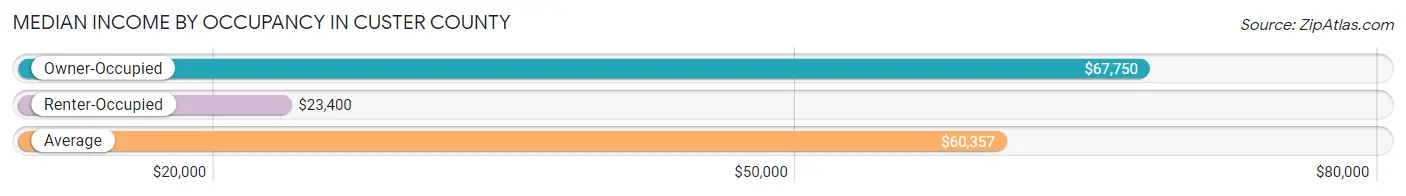
| Occupancy Type | # Households | Median Income |
| Owner-Occupied | 1,408 (77.9%) | $67,750 |
| Renter-Occupied | 400 (22.1%) | $23,400 |
| Average | 1,808 (100.0%) | $60,357 |
Occupancy by Householder Income Bracket in Custer County

| Income Bracket | Owner-occupied | Renter-occupied |
| Less than $5,000 | 14 (1.0%) | 0 (0.0%) |
| $5,000 to $9,999 | 36 (2.6%) | 13 (3.3%) |
| $10,000 to $14,999 | 9 (0.6%) | 45 (11.3%) |
| $15,000 to $19,999 | 87 (6.2%) | 114 (28.5%) |
| $20,000 to $24,999 | 40 (2.8%) | 44 (11.0%) |
| $25,000 to $34,999 | 95 (6.8%) | 39 (9.8%) |
| $35,000 to $49,999 | 144 (10.2%) | 34 (8.5%) |
| $50,000 to $74,999 | 376 (26.7%) | 27 (6.8%) |
| $75,000 to $99,999 | 291 (20.7%) | 49 (12.2%) |
| $100,000 to $149,999 | 211 (15.0%) | 0 (0.0%) |
| $150,000 or more | 105 (7.5%) | 35 (8.7%) |
| Total | 1,408 (100.0%) | 400 (100.0%) |
Monthly Housing Cost Tiers in Custer County
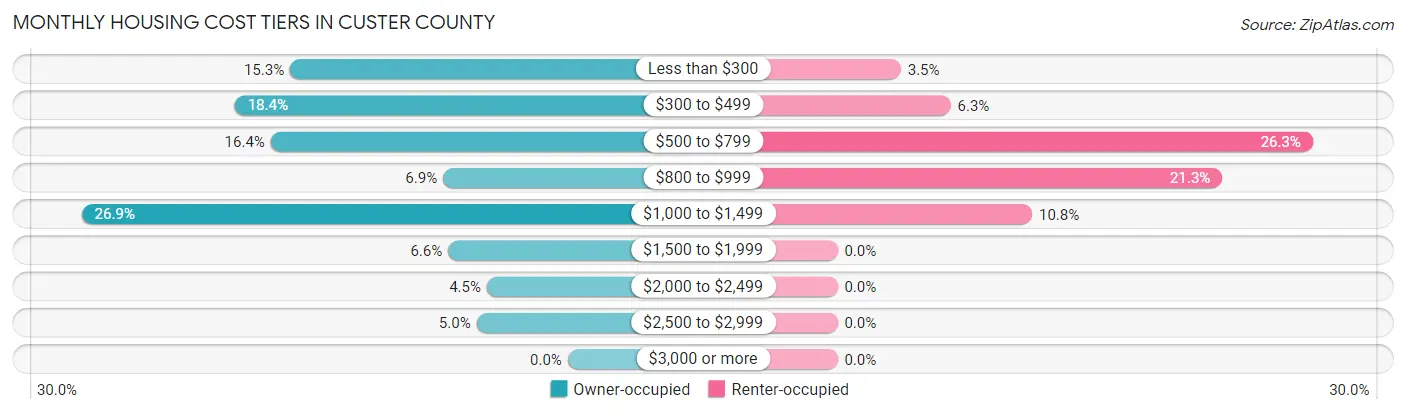
| Monthly Cost | Owner-occupied | Renter-occupied |
| Less than $300 | 216 (15.3%) | 14 (3.5%) |
| $300 to $499 | 259 (18.4%) | 25 (6.2%) |
| $500 to $799 | 231 (16.4%) | 105 (26.3%) |
| $800 to $999 | 97 (6.9%) | 85 (21.2%) |
| $1,000 to $1,499 | 378 (26.9%) | 43 (10.7%) |
| $1,500 to $1,999 | 93 (6.6%) | 0 (0.0%) |
| $2,000 to $2,499 | 63 (4.5%) | 0 (0.0%) |
| $2,500 to $2,999 | 71 (5.0%) | 0 (0.0%) |
| $3,000 or more | 0 (0.0%) | 0 (0.0%) |
| Total | 1,408 (100.0%) | 400 (100.0%) |
Physical Housing Characteristics in Custer County
Housing Structures in Custer County
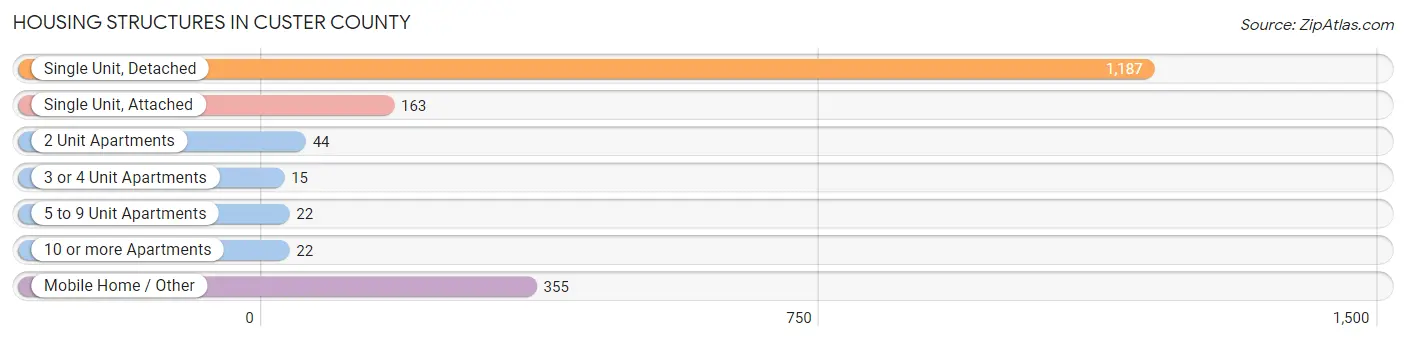
| Structure Type | # Housing Units | % Housing Units |
| Single Unit, Detached | 1,187 | 65.6% |
| Single Unit, Attached | 163 | 9.0% |
| 2 Unit Apartments | 44 | 2.4% |
| 3 or 4 Unit Apartments | 15 | 0.8% |
| 5 to 9 Unit Apartments | 22 | 1.2% |
| 10 or more Apartments | 22 | 1.2% |
| Mobile Home / Other | 355 | 19.6% |
| Total | 1,808 | 100.0% |
Housing Structures by Occupancy in Custer County
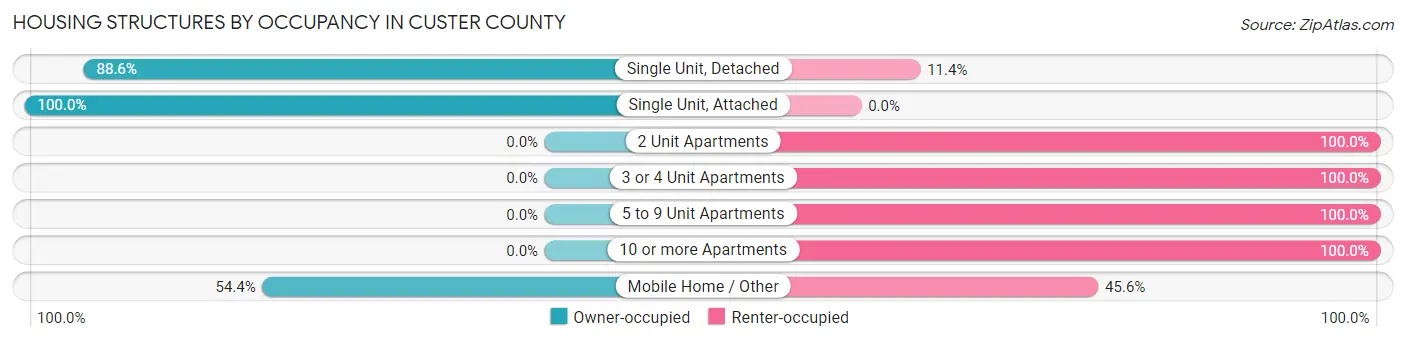
| Structure Type | Owner-occupied | Renter-occupied |
| Single Unit, Detached | 1,052 (88.6%) | 135 (11.4%) |
| Single Unit, Attached | 163 (100.0%) | 0 (0.0%) |
| 2 Unit Apartments | 0 (0.0%) | 44 (100.0%) |
| 3 or 4 Unit Apartments | 0 (0.0%) | 15 (100.0%) |
| 5 to 9 Unit Apartments | 0 (0.0%) | 22 (100.0%) |
| 10 or more Apartments | 0 (0.0%) | 22 (100.0%) |
| Mobile Home / Other | 193 (54.4%) | 162 (45.6%) |
| Total | 1,408 (77.9%) | 400 (22.1%) |
Housing Structures by Number of Rooms in Custer County

| Number of Rooms | Owner-occupied | Renter-occupied |
| 1 Room | 0 (0.0%) | 29 (7.2%) |
| 2 or 3 Rooms | 31 (2.2%) | 13 (3.3%) |
| 4 or 5 Rooms | 461 (32.7%) | 241 (60.3%) |
| 6 or 7 Rooms | 382 (27.1%) | 91 (22.8%) |
| 8 or more Rooms | 534 (37.9%) | 26 (6.5%) |
| Total | 1,408 (100.0%) | 400 (100.0%) |
Housing Structure by Heating Type in Custer County
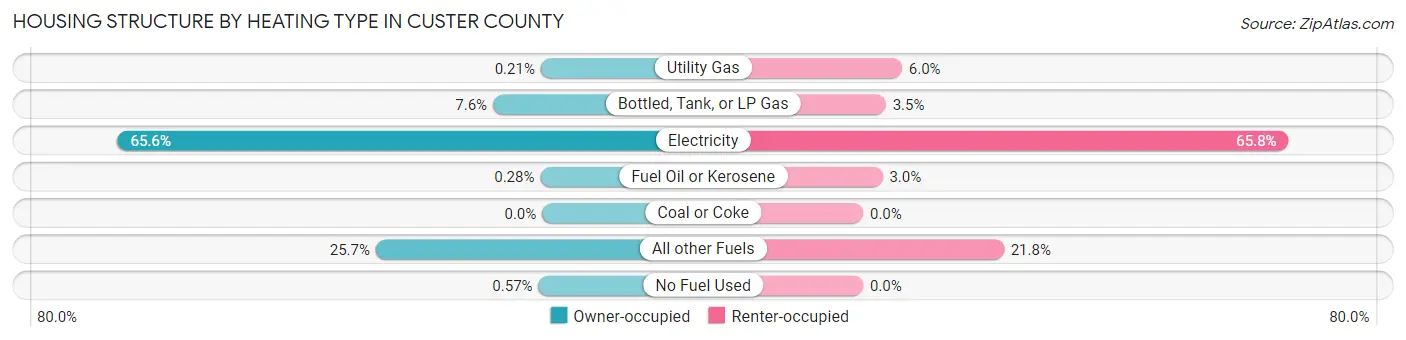
| Heating Type | Owner-occupied | Renter-occupied |
| Utility Gas | 3 (0.2%) | 24 (6.0%) |
| Bottled, Tank, or LP Gas | 107 (7.6%) | 14 (3.5%) |
| Electricity | 924 (65.6%) | 263 (65.7%) |
| Fuel Oil or Kerosene | 4 (0.3%) | 12 (3.0%) |
| Coal or Coke | 0 (0.0%) | 0 (0.0%) |
| All other Fuels | 362 (25.7%) | 87 (21.7%) |
| No Fuel Used | 8 (0.6%) | 0 (0.0%) |
| Total | 1,408 (100.0%) | 400 (100.0%) |
Household Vehicle Usage in Custer County
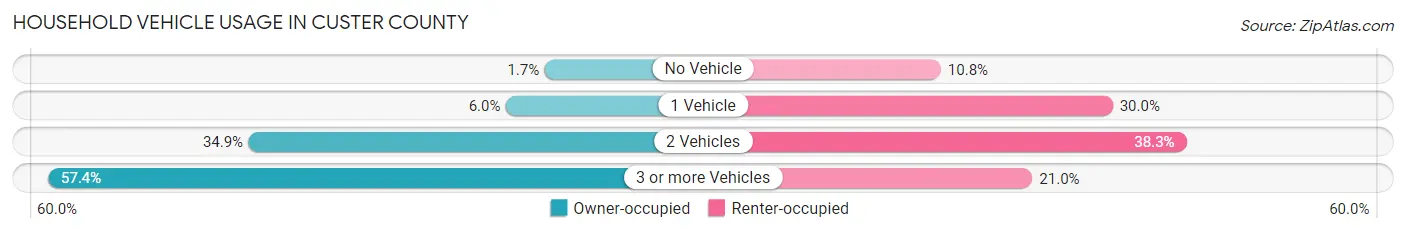
| Vehicles per Household | Owner-occupied | Renter-occupied |
| No Vehicle | 24 (1.7%) | 43 (10.7%) |
| 1 Vehicle | 85 (6.0%) | 120 (30.0%) |
| 2 Vehicles | 491 (34.9%) | 153 (38.3%) |
| 3 or more Vehicles | 808 (57.4%) | 84 (21.0%) |
| Total | 1,408 (100.0%) | 400 (100.0%) |
Real Estate & Mortgages in Custer County
Real Estate and Mortgage Overview in Custer County
| Characteristic | Without Mortgage | With Mortgage |
| Housing Units | 789 | 619 |
| Median Property Value | $290,600 | $276,200 |
| Median Household Income | $68,494 | $56 |
| Monthly Housing Costs | $404 | $0 |
| Real Estate Taxes | $900 | $0 |
Property Value by Mortgage Status in Custer County
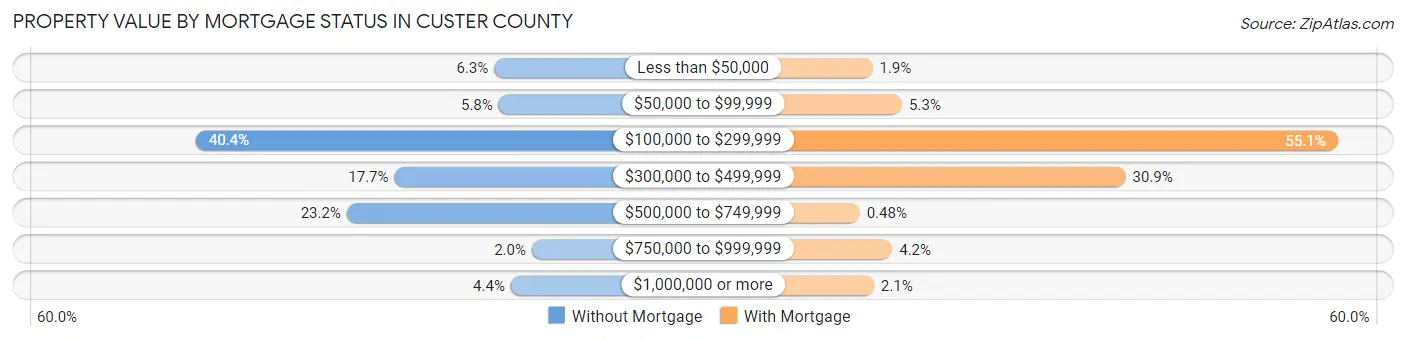
| Property Value | Without Mortgage | With Mortgage |
| Less than $50,000 | 50 (6.3%) | 12 (1.9%) |
| $50,000 to $99,999 | 46 (5.8%) | 33 (5.3%) |
| $100,000 to $299,999 | 319 (40.4%) | 341 (55.1%) |
| $300,000 to $499,999 | 140 (17.7%) | 191 (30.9%) |
| $500,000 to $749,999 | 183 (23.2%) | 3 (0.5%) |
| $750,000 to $999,999 | 16 (2.0%) | 26 (4.2%) |
| $1,000,000 or more | 35 (4.4%) | 13 (2.1%) |
| Total | 789 (100.0%) | 619 (100.0%) |
Household Income by Mortgage Status in Custer County
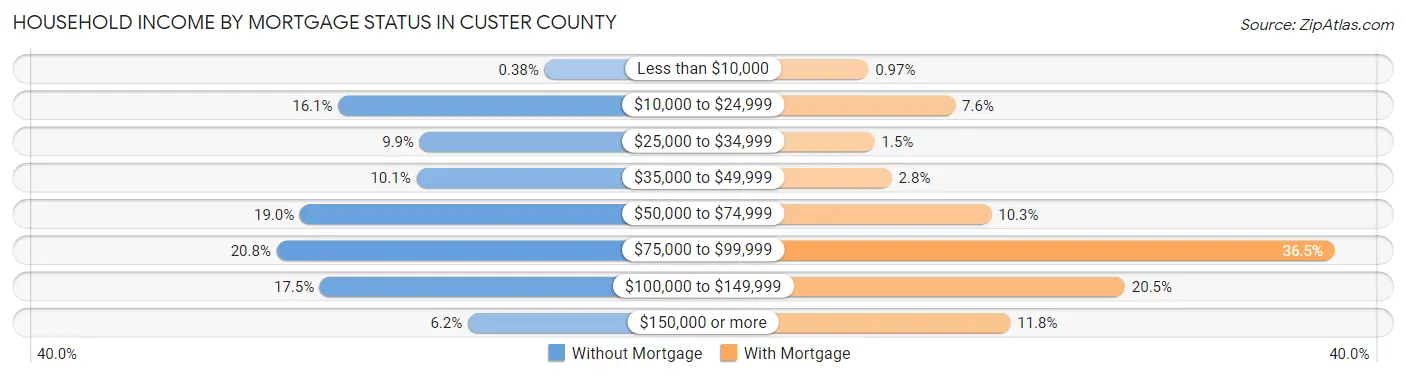
| Household Income | Without Mortgage | With Mortgage |
| Less than $10,000 | 3 (0.4%) | 6 (1.0%) |
| $10,000 to $24,999 | 127 (16.1%) | 47 (7.6%) |
| $25,000 to $34,999 | 78 (9.9%) | 9 (1.5%) |
| $35,000 to $49,999 | 80 (10.1%) | 17 (2.8%) |
| $50,000 to $74,999 | 150 (19.0%) | 64 (10.3%) |
| $75,000 to $99,999 | 164 (20.8%) | 226 (36.5%) |
| $100,000 to $149,999 | 138 (17.5%) | 127 (20.5%) |
| $150,000 or more | 49 (6.2%) | 73 (11.8%) |
| Total | 789 (100.0%) | 619 (100.0%) |
Property Value to Household Income Ratio in Custer County
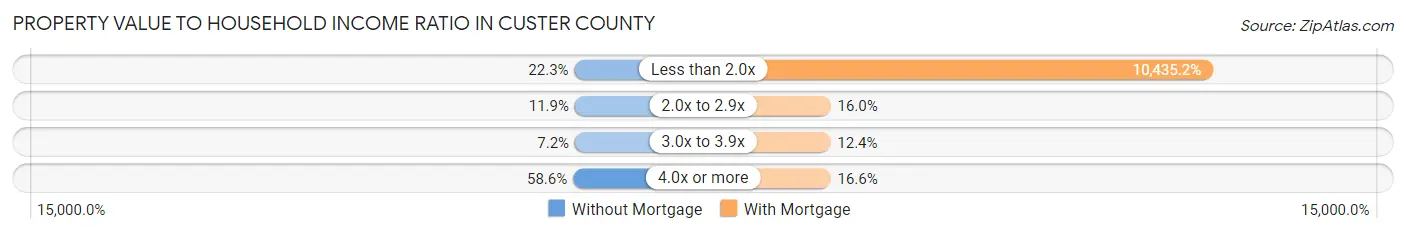
| Value-to-Income Ratio | Without Mortgage | With Mortgage |
| Less than 2.0x | 176 (22.3%) | 64,594 (10,435.2%) |
| 2.0x to 2.9x | 94 (11.9%) | 99 (16.0%) |
| 3.0x to 3.9x | 57 (7.2%) | 77 (12.4%) |
| 4.0x or more | 462 (58.6%) | 103 (16.6%) |
| Total | 789 (100.0%) | 619 (100.0%) |
Real Estate Taxes by Mortgage Status in Custer County

| Property Taxes | Without Mortgage | With Mortgage |
| Less than $800 | 341 (43.2%) | 3 (0.5%) |
| $800 to $1,499 | 283 (35.9%) | 253 (40.9%) |
| $800 to $1,499 | 97 (12.3%) | 188 (30.4%) |
| Total | 789 (100.0%) | 619 (100.0%) |
Health & Disability in Custer County
Health Insurance Coverage by Age in Custer County

| Age Bracket | With Coverage | Without Coverage |
| Under 6 Years | 193 (100.0%) | 0 (0.0%) |
| 6 to 18 Years | 465 (100.0%) | 0 (0.0%) |
| 19 to 25 Years | 210 (89.4%) | 25 (10.6%) |
| 26 to 34 Years | 187 (90.3%) | 20 (9.7%) |
| 35 to 44 Years | 302 (69.9%) | 130 (30.1%) |
| 45 to 54 Years | 310 (52.6%) | 279 (47.4%) |
| 55 to 64 Years | 596 (80.2%) | 147 (19.8%) |
| 65 to 74 Years | 974 (100.0%) | 0 (0.0%) |
| 75 Years and older | 481 (100.0%) | 0 (0.0%) |
| Total | 3,718 (86.1%) | 601 (13.9%) |
Health Insurance Coverage by Citizenship Status in Custer County
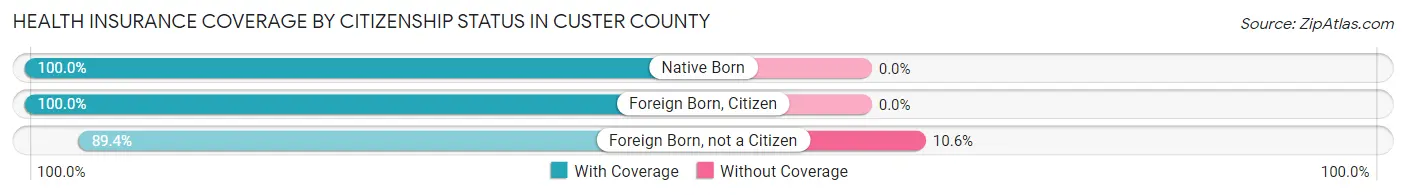
| Citizenship Status | With Coverage | Without Coverage |
| Native Born | 193 (100.0%) | 0 (0.0%) |
| Foreign Born, Citizen | 465 (100.0%) | 0 (0.0%) |
| Foreign Born, not a Citizen | 210 (89.4%) | 25 (10.6%) |
Health Insurance Coverage by Household Income in Custer County
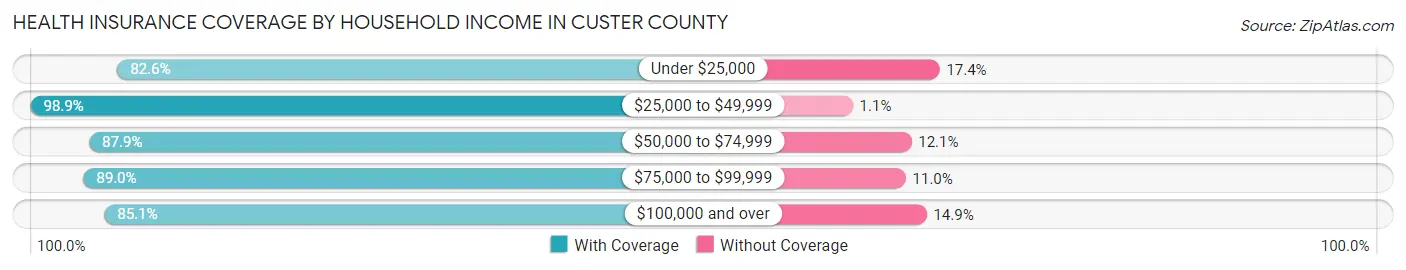
| Household Income | With Coverage | Without Coverage |
| Under $25,000 | 495 (82.6%) | 104 (17.4%) |
| $25,000 to $49,999 | 632 (98.9%) | 7 (1.1%) |
| $50,000 to $74,999 | 888 (87.9%) | 122 (12.1%) |
| $75,000 to $99,999 | 880 (89.0%) | 109 (11.0%) |
| $100,000 and over | 792 (85.1%) | 139 (14.9%) |
Public vs Private Health Insurance Coverage by Age in Custer County
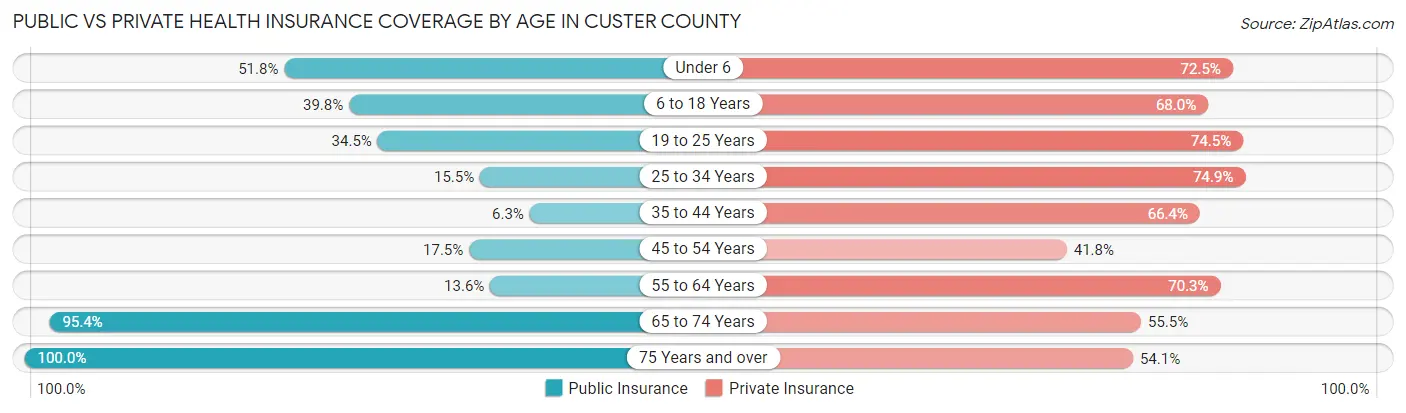
| Age Bracket | Public Insurance | Private Insurance |
| Under 6 | 100 (51.8%) | 140 (72.5%) |
| 6 to 18 Years | 185 (39.8%) | 316 (68.0%) |
| 19 to 25 Years | 81 (34.5%) | 175 (74.5%) |
| 25 to 34 Years | 32 (15.5%) | 155 (74.9%) |
| 35 to 44 Years | 27 (6.2%) | 287 (66.4%) |
| 45 to 54 Years | 103 (17.5%) | 246 (41.8%) |
| 55 to 64 Years | 101 (13.6%) | 522 (70.3%) |
| 65 to 74 Years | 929 (95.4%) | 541 (55.5%) |
| 75 Years and over | 481 (100.0%) | 260 (54.0%) |
| Total | 2,039 (47.2%) | 2,642 (61.2%) |
Disability Status by Sex by Age in Custer County
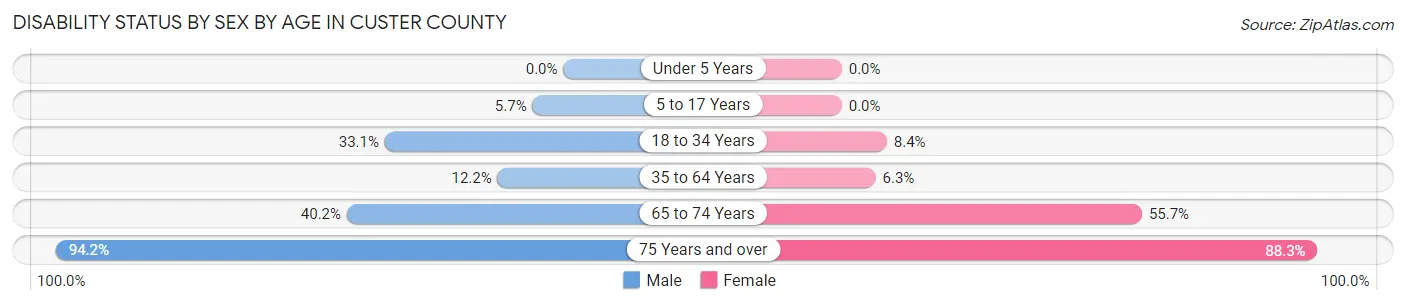
| Age Bracket | Male | Female |
| Under 5 Years | 0 (0.0%) | 0 (0.0%) |
| 5 to 17 Years | 13 (5.7%) | 0 (0.0%) |
| 18 to 34 Years | 57 (33.1%) | 23 (8.4%) |
| 35 to 64 Years | 126 (12.2%) | 46 (6.3%) |
| 65 to 74 Years | 219 (40.2%) | 239 (55.7%) |
| 75 Years and over | 228 (94.2%) | 211 (88.3%) |
Disability Class by Sex by Age in Custer County
Disability Class: Hearing Difficulty
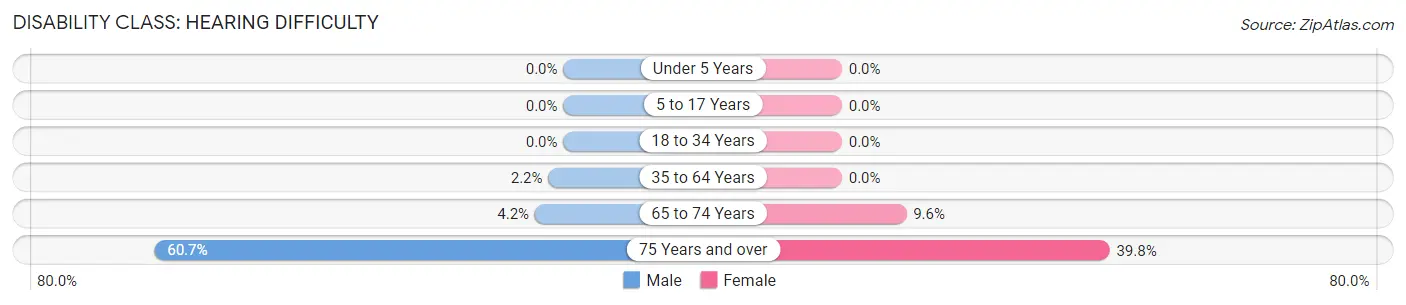
| Age Bracket | Male | Female |
| Under 5 Years | 0 (0.0%) | 0 (0.0%) |
| 5 to 17 Years | 0 (0.0%) | 0 (0.0%) |
| 18 to 34 Years | 0 (0.0%) | 0 (0.0%) |
| 35 to 64 Years | 23 (2.2%) | 0 (0.0%) |
| 65 to 74 Years | 23 (4.2%) | 41 (9.6%) |
| 75 Years and over | 147 (60.7%) | 95 (39.8%) |
Disability Class: Vision Difficulty

| Age Bracket | Male | Female |
| Under 5 Years | 0 (0.0%) | 0 (0.0%) |
| 5 to 17 Years | 0 (0.0%) | 0 (0.0%) |
| 18 to 34 Years | 0 (0.0%) | 23 (8.4%) |
| 35 to 64 Years | 64 (6.2%) | 0 (0.0%) |
| 65 to 74 Years | 23 (4.2%) | 63 (14.7%) |
| 75 Years and over | 14 (5.8%) | 104 (43.5%) |
Disability Class: Cognitive Difficulty
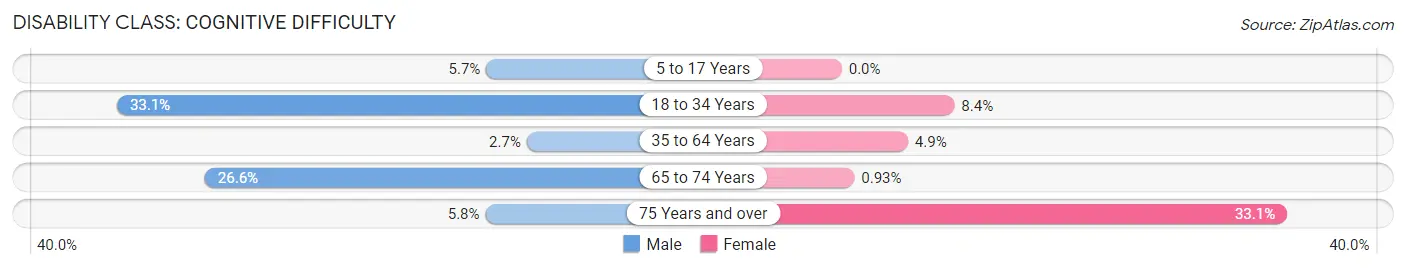
| Age Bracket | Male | Female |
| 5 to 17 Years | 13 (5.7%) | 0 (0.0%) |
| 18 to 34 Years | 57 (33.1%) | 23 (8.4%) |
| 35 to 64 Years | 28 (2.7%) | 36 (4.9%) |
| 65 to 74 Years | 145 (26.6%) | 4 (0.9%) |
| 75 Years and over | 14 (5.8%) | 79 (33.1%) |
Disability Class: Ambulatory Difficulty
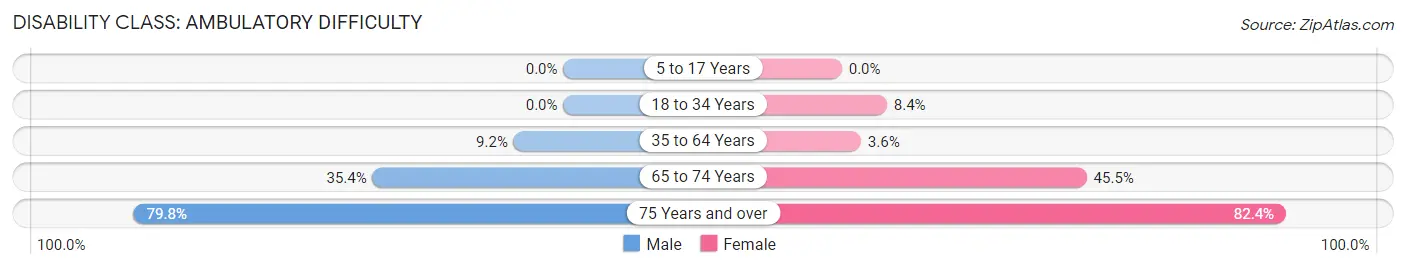
| Age Bracket | Male | Female |
| 5 to 17 Years | 0 (0.0%) | 0 (0.0%) |
| 18 to 34 Years | 0 (0.0%) | 23 (8.4%) |
| 35 to 64 Years | 95 (9.2%) | 26 (3.5%) |
| 65 to 74 Years | 193 (35.4%) | 195 (45.5%) |
| 75 Years and over | 193 (79.7%) | 197 (82.4%) |
Disability Class: Self-Care Difficulty
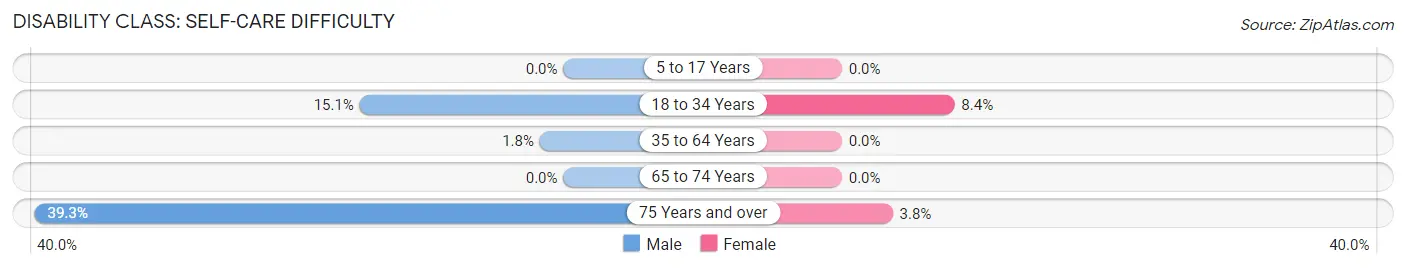
| Age Bracket | Male | Female |
| 5 to 17 Years | 0 (0.0%) | 0 (0.0%) |
| 18 to 34 Years | 26 (15.1%) | 23 (8.4%) |
| 35 to 64 Years | 18 (1.8%) | 0 (0.0%) |
| 65 to 74 Years | 0 (0.0%) | 0 (0.0%) |
| 75 Years and over | 95 (39.3%) | 9 (3.8%) |
Technology Access in Custer County
Computing Device Access in Custer County
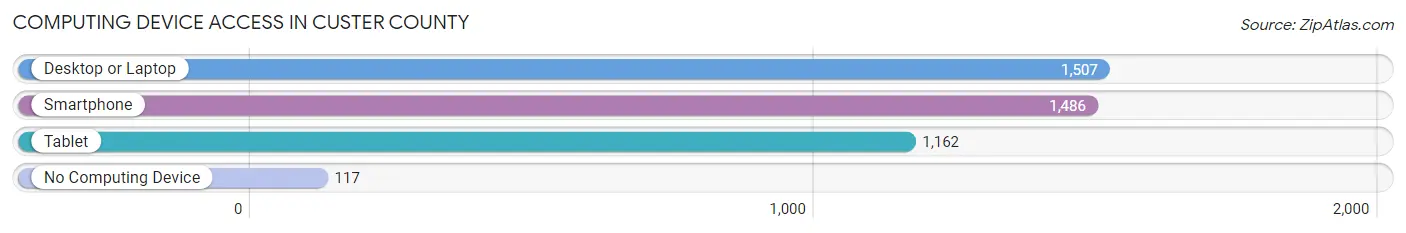
| Device Type | # Households | % Households |
| Desktop or Laptop | 1,507 | 83.4% |
| Smartphone | 1,486 | 82.2% |
| Tablet | 1,162 | 64.3% |
| No Computing Device | 117 | 6.5% |
| Total | 1,808 | 100.0% |
Internet Access in Custer County
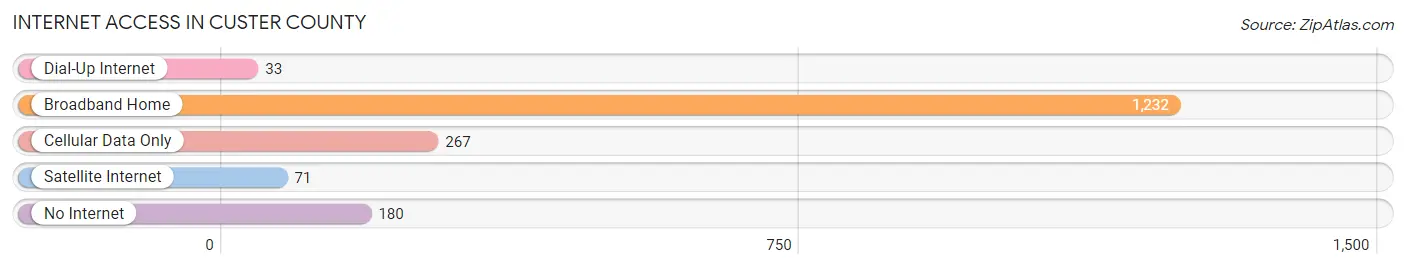
| Internet Type | # Households | % Households |
| Dial-Up Internet | 33 | 1.8% |
| Broadband Home | 1,232 | 68.1% |
| Cellular Data Only | 267 | 14.8% |
| Satellite Internet | 71 | 3.9% |
| No Internet | 180 | 10.0% |
| Total | 1,808 | 100.0% |
Custer County Summary
Custer County, Idaho is located in the central part of the state and is bordered by Lemhi County to the north, Butte County to the east, Blaine County to the south, and Boise County to the west. The county seat is Challis, and the largest city is Mackay. The county was established in 1881 and named after General George Armstrong Custer.
History
The area that is now Custer County was originally inhabited by the Shoshone and Bannock tribes. The first white settlers arrived in the area in the late 1860s, and the county was officially established in 1881. The county was named after General George Armstrong Custer, who was killed at the Battle of Little Bighorn in 1876.
The county was initially populated by miners and ranchers, and the economy was largely based on mining and ranching. The county was also home to several small towns, including Challis, Mackay, and Clayton.
In the early 1900s, the county experienced a population boom due to the discovery of gold in the area. The gold rush brought thousands of people to the area, and the population of the county grew rapidly. The population peaked in 1910, when it reached nearly 10,000 people.
The population declined after the gold rush ended, and the county’s economy shifted to ranching and farming. The county’s population has remained relatively stable since then, and it was estimated to be 7,845 in 2019.
Geography
Custer County covers an area of 2,845 square miles and is located in the central part of Idaho. The county is bordered by Lemhi County to the north, Butte County to the east, Blaine County to the south, and Boise County to the west.
The county is located in the Rocky Mountains and is home to several mountain ranges, including the Lost River Range, the White Knob Mountains, and the Lemhi Range. The highest point in the county is Mount Borah, which has an elevation of 12,662 feet.
The county is home to several rivers, including the Salmon River, the Big Lost River, and the Little Lost River. The county also contains several lakes, including Redfish Lake, Alturas Lake, and Pettit Lake.
Economy
The economy of Custer County is largely based on agriculture and tourism. The county is home to several large ranches, and the county’s agricultural products include hay, wheat, barley, and potatoes.
The county is also home to several tourist attractions, including the Salmon River, the White Knob Mountains, and the Lost River Range. The county is also home to several ski resorts, including Sun Valley and Grand Targhee.
Demographics
As of the 2010 census, the population of Custer County was 7,845. The racial makeup of the county was 95.2% White, 0.3% African American, 0.7% Native American, 0.2% Asian, 0.1% Pacific Islander, 1.2% from other races, and 2.3% from two or more races. Hispanic or Latino of any race were 3.2% of the population.
The median income for a household in the county was $37,917, and the median income for a family was $45,938. The per capita income for the county was $19,945. About 11.2% of families and 14.7% of the population were below the poverty line, including 19.2% of those under age 18 and 8.2% of those age 65 or over.
Common Questions
What is the Total Population of Custer County?
Total Population of Custer County is 4,344.
What is the Total Male Population of Custer County?
Total Male Population of Custer County is 2,286.
What is the Total Female Population of Custer County?
Total Female Population of Custer County is 2,058.
What is the Ratio of Males per 100 Females in Custer County?
There are 111.08 Males per 100 Females in Custer County.
What is the Ratio of Females per 100 Males in Custer County?
There are 90.03 Females per 100 Males in Custer County.
What is the Median Population Age in Custer County?
Median Population Age in Custer County is 55.5 Years.
What is the Average Family Size in Custer County
Average Family Size in Custer County is 2.9 People.
What is the Average Household Size in Custer County
Average Household Size in Custer County is 2.3 People.
What is Per Capita Income in Custer County?
Per Capita income in Custer County is $28,913.
What is the Median Family Income in Custer County?
Median Family Income in Custer County is $75,257.
What is the Median Household income in Custer County?
Median Household Income in Custer County is $60,357.
What is Income or Wage Gap in Custer County?
Income or Wage Gap in Custer County is 17.5%.
Women in Custer County earn 82.5 cents for every dollar earned by a man.
What is Inequality or Gini Index in Custer County?
Inequality or Gini Index in Custer County is 0.39.
How Large is the Labor Force in Custer County?
There are 1,858 People in the Labor Forcein in Custer County.
What is the Percentage of People in the Labor Force in Custer County?
49.7% of People are in the Labor Force in Custer County.
What is the Unemployment Rate in Custer County?
Unemployment Rate in Custer County is 1.7%.