Cassia County, ID
Cassia County Map
Cassia County Overview
24,859
TOTAL POPULATION
12,741
MALE POPULATION
12,118
FEMALE POPULATION
105.14
MALES / 100 FEMALES
95.11
FEMALES / 100 MALES
33.1
MEDIAN AGE
3.5
AVG FAMILY SIZE
3.0
AVG HOUSEHOLD SIZE
$28,986
PER CAPITA INCOME
$70,264
AVG FAMILY INCOME
$63,525
AVG HOUSEHOLD INCOME
41.8%
WAGE / INCOME GAP [ % ]
58.2¢/ $1
WAGE / INCOME GAP [ $ ]
$14,018
FAMILY INCOME DEFICIT
0.45
INEQUALITY / GINI INDEX
11,852
LABOR FORCE [ PEOPLE ]
65.4%
PERCENT IN LABOR FORCE
3.0%
UNEMPLOYMENT RATE
Cassia County Area Codes
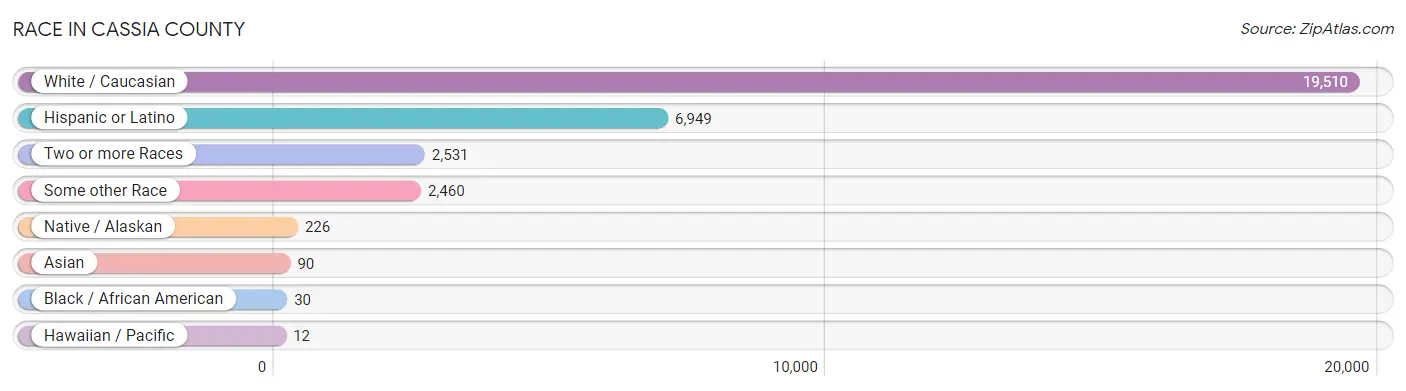
Race in Cassia County
The most populous races in Cassia County are White / Caucasian (19,510 | 78.5%), Hispanic or Latino (6,949 | 28.0%), and Two or more Races (2,531 | 10.2%).
| Race | # Population | % Population |
| Asian | 90 | 0.4% |
| Black / African American | 30 | 0.1% |
| Hawaiian / Pacific | 12 | 0.1% |
| Hispanic or Latino | 6,949 | 28.0% |
| Native / Alaskan | 226 | 0.9% |
| White / Caucasian | 19,510 | 78.5% |
| Two or more Races | 2,531 | 10.2% |
| Some other Race | 2,460 | 9.9% |
| Total | 24,859 | 100.0% |
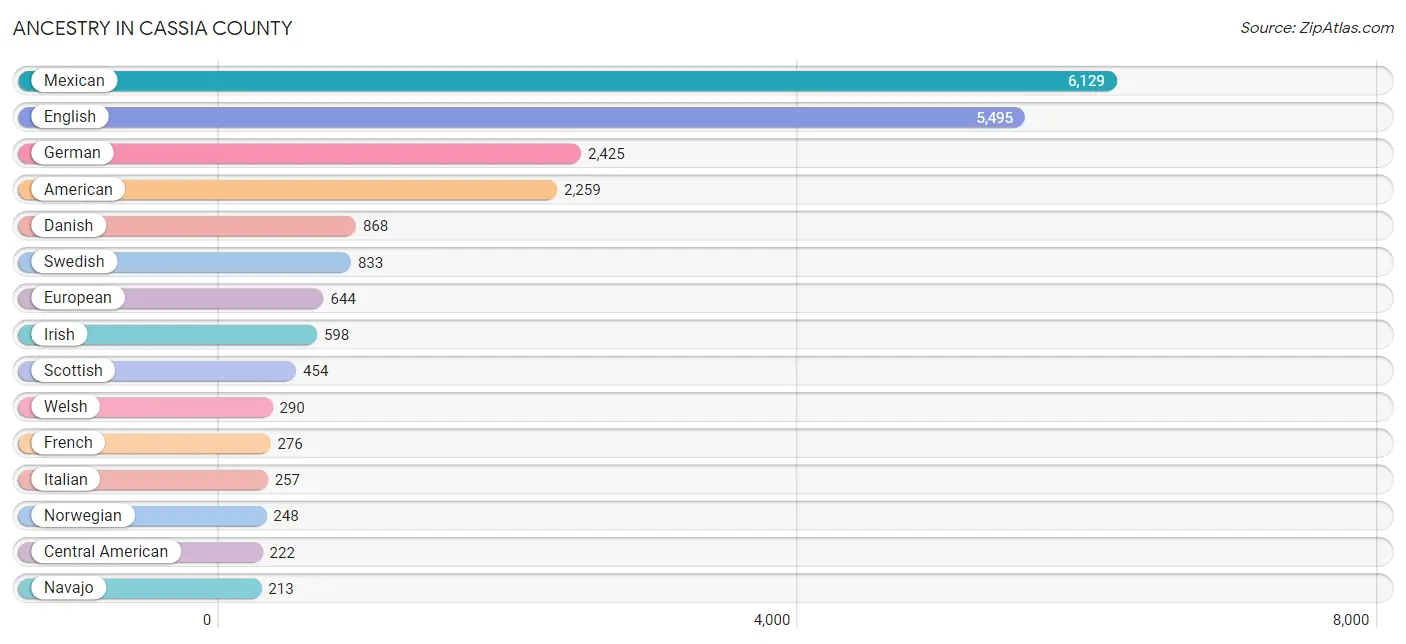
Ancestry in Cassia County
The most populous ancestries reported in Cassia County are Mexican (6,129 | 24.7%), English (5,495 | 22.1%), German (2,425 | 9.8%), American (2,259 | 9.1%), and Danish (868 | 3.5%), together accounting for 69.1% of all Cassia County residents.
| Ancestry | # Population | % Population |
| American | 2,259 | 9.1% |
| Apache | 23 | 0.1% |
| Arapaho | 1 | 0.0% |
| Basque | 52 | 0.2% |
| Bhutanese | 80 | 0.3% |
| Blackfeet | 5 | 0.0% |
| British | 132 | 0.5% |
| Burmese | 8 | 0.0% |
| Canadian | 163 | 0.7% |
| Central American | 222 | 0.9% |
| Central American Indian | 22 | 0.1% |
| Cherokee | 88 | 0.4% |
| Colombian | 13 | 0.1% |
| Cuban | 1 | 0.0% |
| Czech | 37 | 0.2% |
| Danish | 868 | 3.5% |
| Dutch | 188 | 0.8% |
| Eastern European | 19 | 0.1% |
| Ecuadorian | 8 | 0.0% |
| English | 5,495 | 22.1% |
| European | 644 | 2.6% |
| Finnish | 13 | 0.1% |
| French | 276 | 1.1% |
| French Canadian | 25 | 0.1% |
| German | 2,425 | 9.8% |
| Greek | 6 | 0.0% |
| Guatemalan | 60 | 0.2% |
| Honduran | 35 | 0.1% |
| Hopi | 11 | 0.0% |
| Icelander | 51 | 0.2% |
| Indian (Asian) | 31 | 0.1% |
| Indonesian | 73 | 0.3% |
| Irish | 598 | 2.4% |
| Italian | 257 | 1.0% |
| Korean | 24 | 0.1% |
| Laotian | 35 | 0.1% |
| Mexican | 6,129 | 24.7% |
| Mexican American Indian | 75 | 0.3% |
| Native Hawaiian | 22 | 0.1% |
| Navajo | 213 | 0.9% |
| Northern European | 15 | 0.1% |
| Norwegian | 248 | 1.0% |
| Pima | 11 | 0.0% |
| Polish | 141 | 0.6% |
| Portuguese | 19 | 0.1% |
| Potawatomi | 10 | 0.0% |
| Pueblo | 28 | 0.1% |
| Puerto Rican | 93 | 0.4% |
| Russian | 12 | 0.1% |
| Salvadoran | 127 | 0.5% |
| Scandinavian | 156 | 0.6% |
| Scotch-Irish | 137 | 0.5% |
| Scottish | 454 | 1.8% |
| Seminole | 23 | 0.1% |
| Sioux | 37 | 0.2% |
| Slovak | 13 | 0.1% |
| South American | 35 | 0.1% |
| Spaniard | 140 | 0.6% |
| Spanish | 74 | 0.3% |
| Spanish American | 93 | 0.4% |
| Spanish American Indian | 93 | 0.4% |
| Swedish | 833 | 3.4% |
| Swiss | 157 | 0.6% |
| Tongan | 1 | 0.0% |
| Uruguayan | 14 | 0.1% |
| Welsh | 290 | 1.2% |
| Yakama | 1 | 0.0% |
| Yaqui | 2 | 0.0% |
| Yugoslavian | 10 | 0.0% | View All 69 Rows |
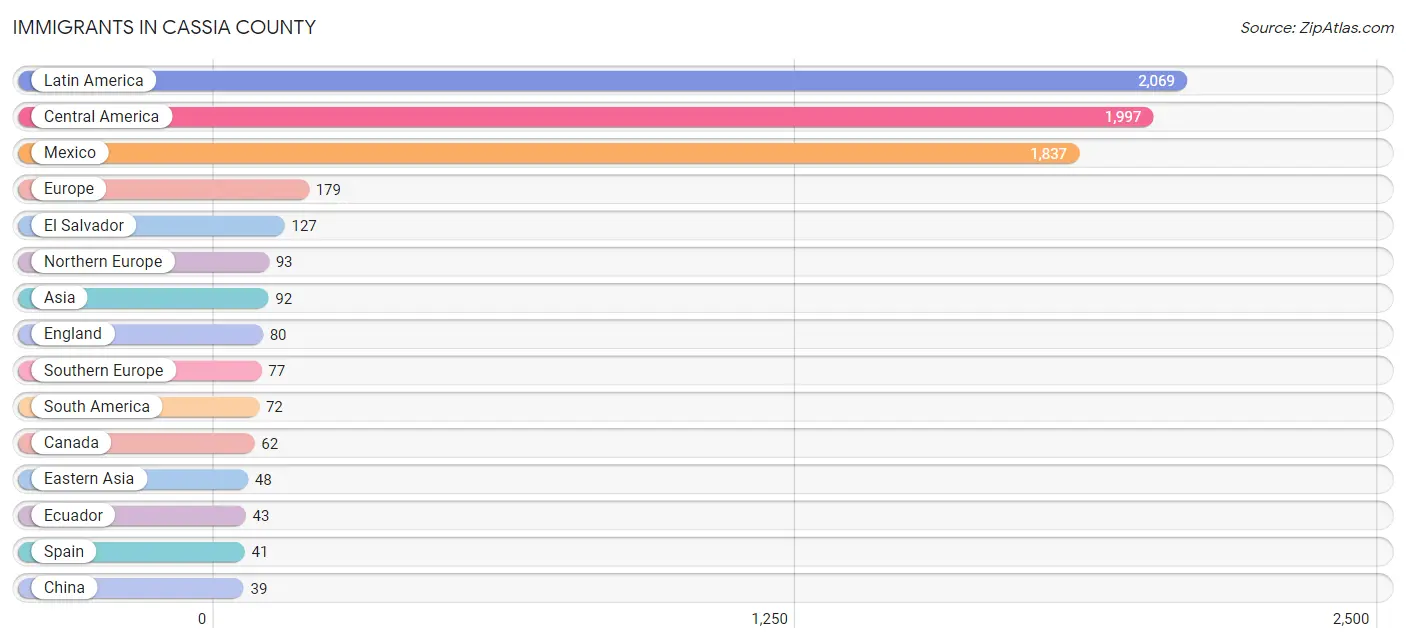
Immigrants in Cassia County
The most numerous immigrant groups reported in Cassia County came from Latin America (2,069 | 8.3%), Central America (1,997 | 8.0%), Mexico (1,837 | 7.4%), Europe (179 | 0.7%), and El Salvador (127 | 0.5%), together accounting for 25.0% of all Cassia County residents.
| Immigration Origin | # Population | % Population |
| Asia | 92 | 0.4% |
| Canada | 62 | 0.3% |
| Central America | 1,997 | 8.0% |
| China | 39 | 0.2% |
| Colombia | 13 | 0.1% |
| Eastern Asia | 48 | 0.2% |
| Ecuador | 43 | 0.2% |
| El Salvador | 127 | 0.5% |
| England | 80 | 0.3% |
| Europe | 179 | 0.7% |
| Guatemala | 31 | 0.1% |
| Honduras | 2 | 0.0% |
| Italy | 36 | 0.1% |
| Japan | 9 | 0.0% |
| Latin America | 2,069 | 8.3% |
| Mexico | 1,837 | 7.4% |
| Nepal | 14 | 0.1% |
| Netherlands | 9 | 0.0% |
| Northern Europe | 93 | 0.4% |
| Oceania | 1 | 0.0% |
| Philippines | 16 | 0.1% |
| South America | 72 | 0.3% |
| South Central Asia | 14 | 0.1% |
| South Eastern Asia | 30 | 0.1% |
| Southern Europe | 77 | 0.3% |
| Spain | 41 | 0.2% |
| Uruguay | 16 | 0.1% |
| Western Europe | 9 | 0.0% | View All 28 Rows |
Sex and Age in Cassia County
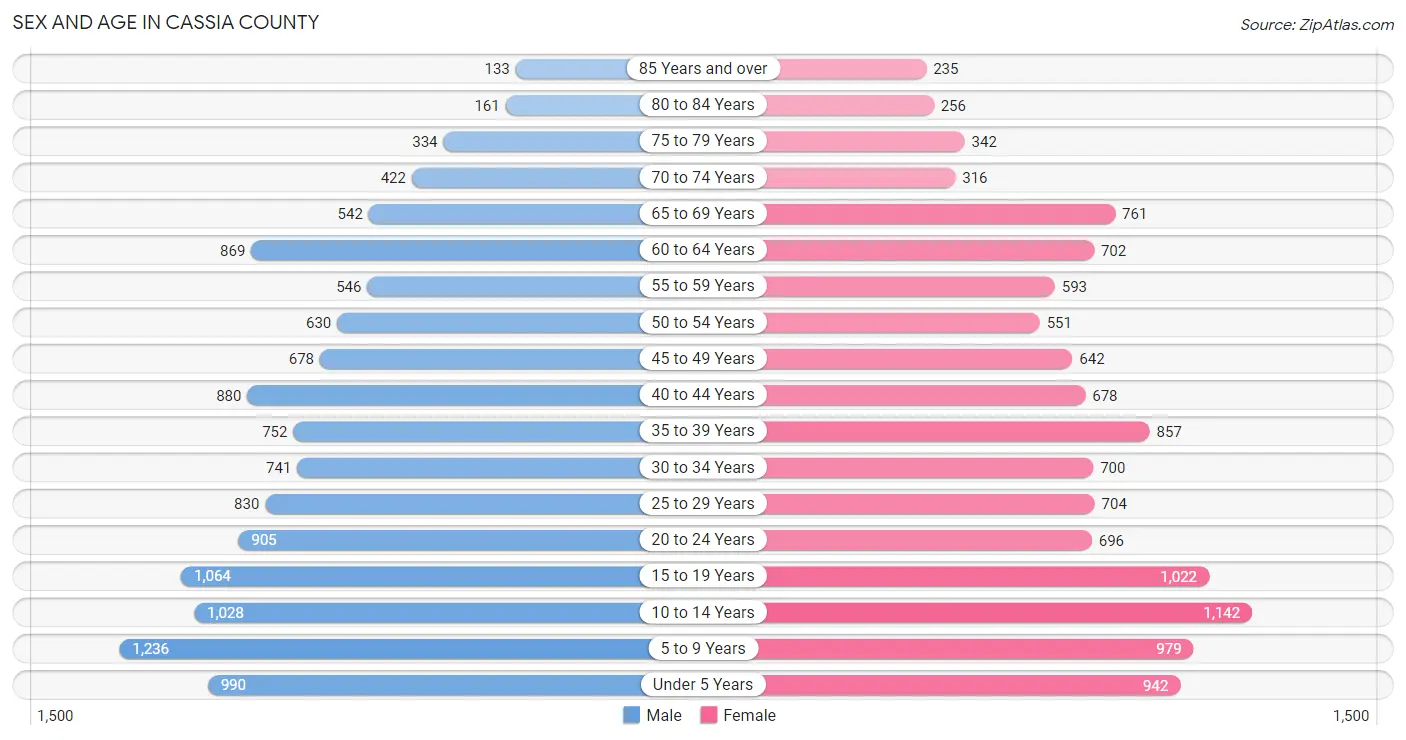
Sex and Age in Cassia County
The most populous age groups in Cassia County are 5 to 9 Years (1,236 | 9.7%) for men and 10 to 14 Years (1,142 | 9.4%) for women.
| Age Bracket | Male | Female |
| Under 5 Years | 990 (7.8%) | 942 (7.8%) |
| 5 to 9 Years | 1,236 (9.7%) | 979 (8.1%) |
| 10 to 14 Years | 1,028 (8.1%) | 1,142 (9.4%) |
| 15 to 19 Years | 1,064 (8.4%) | 1,022 (8.4%) |
| 20 to 24 Years | 905 (7.1%) | 696 (5.7%) |
| 25 to 29 Years | 830 (6.5%) | 704 (5.8%) |
| 30 to 34 Years | 741 (5.8%) | 700 (5.8%) |
| 35 to 39 Years | 752 (5.9%) | 857 (7.1%) |
| 40 to 44 Years | 880 (6.9%) | 678 (5.6%) |
| 45 to 49 Years | 678 (5.3%) | 642 (5.3%) |
| 50 to 54 Years | 630 (4.9%) | 551 (4.5%) |
| 55 to 59 Years | 546 (4.3%) | 593 (4.9%) |
| 60 to 64 Years | 869 (6.8%) | 702 (5.8%) |
| 65 to 69 Years | 542 (4.3%) | 761 (6.3%) |
| 70 to 74 Years | 422 (3.3%) | 316 (2.6%) |
| 75 to 79 Years | 334 (2.6%) | 342 (2.8%) |
| 80 to 84 Years | 161 (1.3%) | 256 (2.1%) |
| 85 Years and over | 133 (1.0%) | 235 (1.9%) |
| Total | 12,741 (100.0%) | 12,118 (100.0%) |
Families and Households in Cassia County
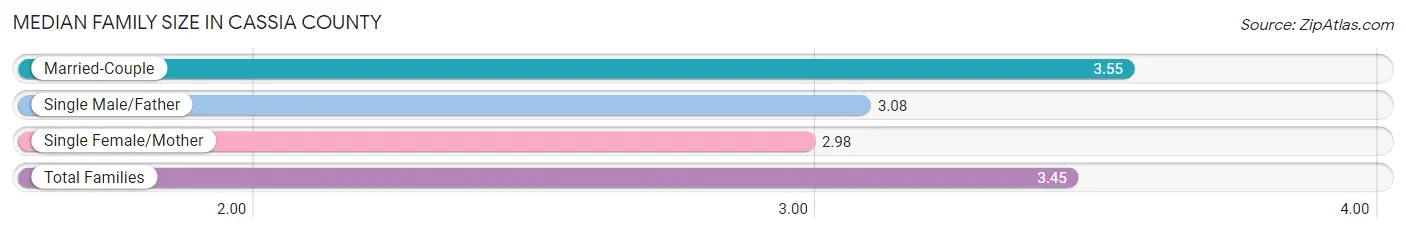
Median Family Size in Cassia County
The median family size in Cassia County is 3.45 persons per family, with married-couple families (5,004 | 80.0%) accounting for the largest median family size of 3.55 persons per family. On the other hand, single female/mother families (645 | 10.3%) represent the smallest median family size with 2.98 persons per family.
| Family Type | # Families | Family Size |
| Married-Couple | 5,004 (80.0%) | 3.55 |
| Single Male/Father | 602 (9.6%) | 3.08 |
| Single Female/Mother | 645 (10.3%) | 2.98 |
| Total Families | 6,251 (100.0%) | 3.45 |
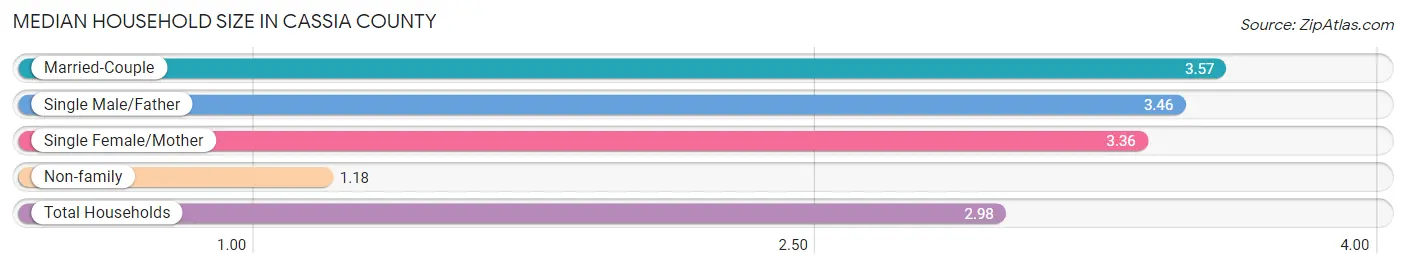
Median Household Size in Cassia County
The median household size in Cassia County is 2.98 persons per household, with married-couple households (5,004 | 61.2%) accounting for the largest median household size of 3.57 persons per household. non-family households (1,929 | 23.6%) represent the smallest median household size with 1.18 persons per household.
| Household Type | # Households | Household Size |
| Married-Couple | 5,004 (61.2%) | 3.57 |
| Single Male/Father | 602 (7.4%) | 3.46 |
| Single Female/Mother | 645 (7.9%) | 3.36 |
| Non-family | 1,929 (23.6%) | 1.18 |
| Total Households | 8,180 (100.0%) | 2.98 |
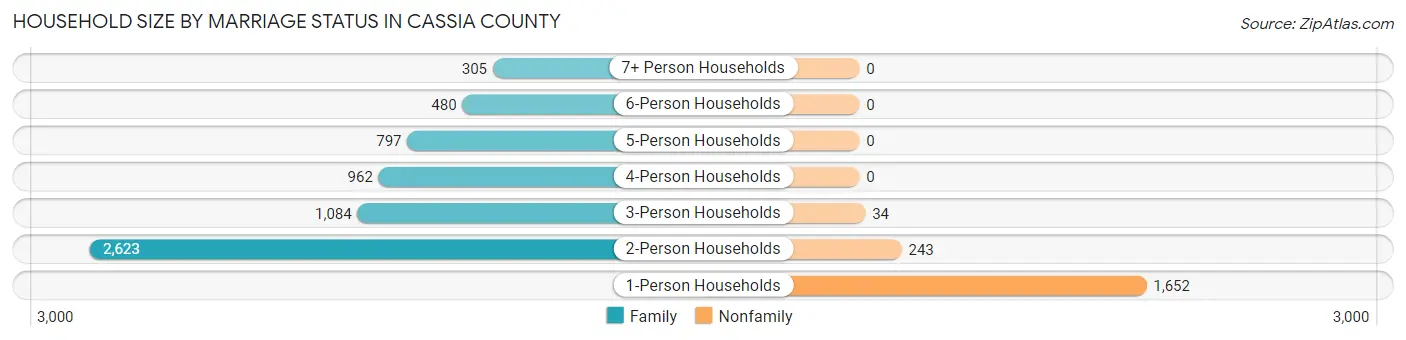
Household Size by Marriage Status in Cassia County
Out of a total of 8,180 households in Cassia County, 6,251 (76.4%) are family households, while 1,929 (23.6%) are nonfamily households. The most numerous type of family households are 2-person households, comprising 2,623, and the most common type of nonfamily households are 1-person households, comprising 1,652.
| Household Size | Family Households | Nonfamily Households |
| 1-Person Households | - | 1,652 (20.2%) |
| 2-Person Households | 2,623 (32.1%) | 243 (3.0%) |
| 3-Person Households | 1,084 (13.3%) | 34 (0.4%) |
| 4-Person Households | 962 (11.8%) | 0 (0.0%) |
| 5-Person Households | 797 (9.7%) | 0 (0.0%) |
| 6-Person Households | 480 (5.9%) | 0 (0.0%) |
| 7+ Person Households | 305 (3.7%) | 0 (0.0%) |
| Total | 6,251 (76.4%) | 1,929 (23.6%) |
Female Fertility in Cassia County
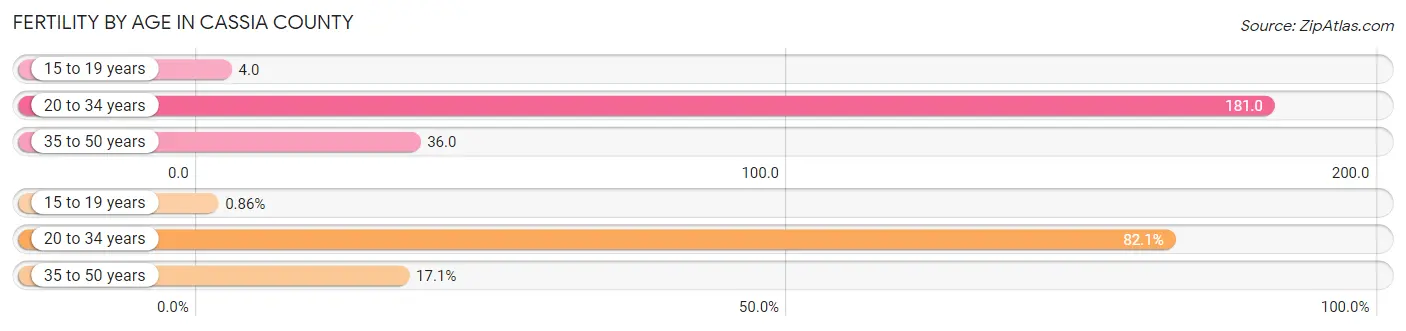
Fertility by Age in Cassia County
Average fertility rate in Cassia County is 87.0 births per 1,000 women. Women in the age bracket of 20 to 34 years have the highest fertility rate with 181.0 births per 1,000 women. Women in the age bracket of 20 to 34 years acount for 82.1% of all women with births.
| Age Bracket | Women with Births | Births / 1,000 Women |
| 15 to 19 years | 4 (0.9%) | 4.0 |
| 20 to 34 years | 380 (82.1%) | 181.0 |
| 35 to 50 years | 79 (17.1%) | 36.0 |
| Total | 463 (100.0%) | 87.0 |
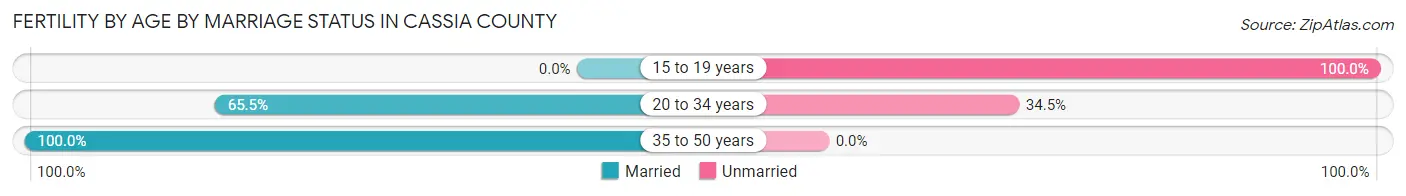
Fertility by Age by Marriage Status in Cassia County
70.8% of women with births (463) in Cassia County are married. The highest percentage of unmarried women with births falls into 15 to 19 years age bracket with 100.0% of them unmarried at the time of birth, while the lowest percentage of unmarried women with births belong to 35 to 50 years age bracket with 0.0% of them unmarried.
| Age Bracket | Married | Unmarried |
| 15 to 19 years | 0 (0.0%) | 4 (100.0%) |
| 20 to 34 years | 249 (65.5%) | 131 (34.5%) |
| 35 to 50 years | 79 (100.0%) | 0 (0.0%) |
| Total | 328 (70.8%) | 135 (29.2%) |
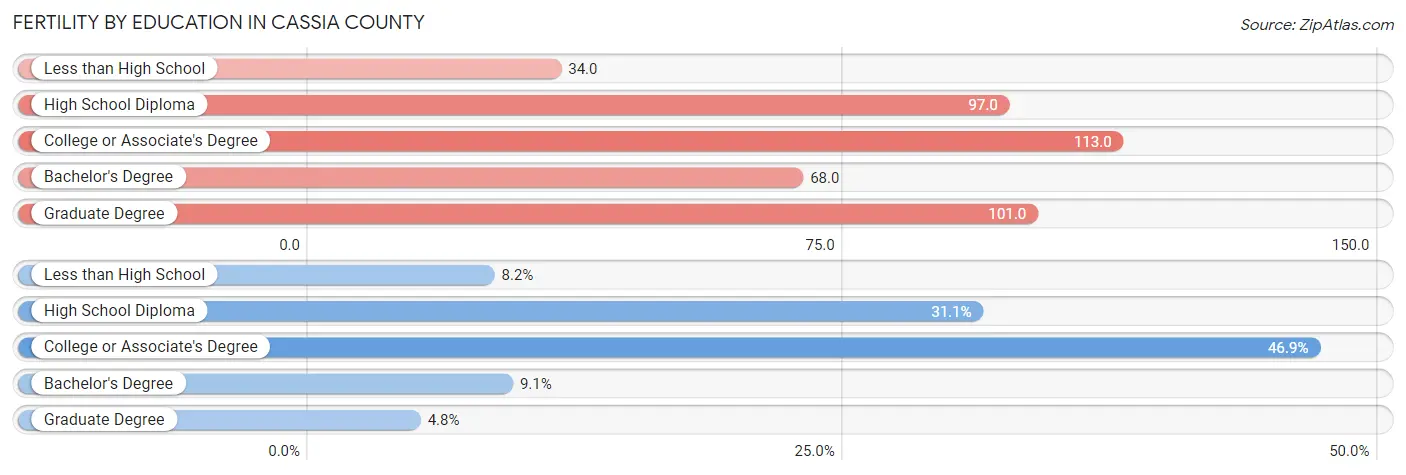
Fertility by Education in Cassia County
Average fertility rate in Cassia County is 87.0 births per 1,000 women. Women with the education attainment of college or associate's degree have the highest fertility rate of 113.0 births per 1,000 women, while women with the education attainment of less than high school have the lowest fertility at 34.0 births per 1,000 women. Women with the education attainment of college or associate's degree represent 46.9% of all women with births.
| Educational Attainment | Women with Births | Births / 1,000 Women |
| Less than High School | 38 (8.2%) | 34.0 |
| High School Diploma | 144 (31.1%) | 97.0 |
| College or Associate's Degree | 217 (46.9%) | 113.0 |
| Bachelor's Degree | 42 (9.1%) | 68.0 |
| Graduate Degree | 22 (4.8%) | 101.0 |
| Total | 463 (100.0%) | 87.0 |
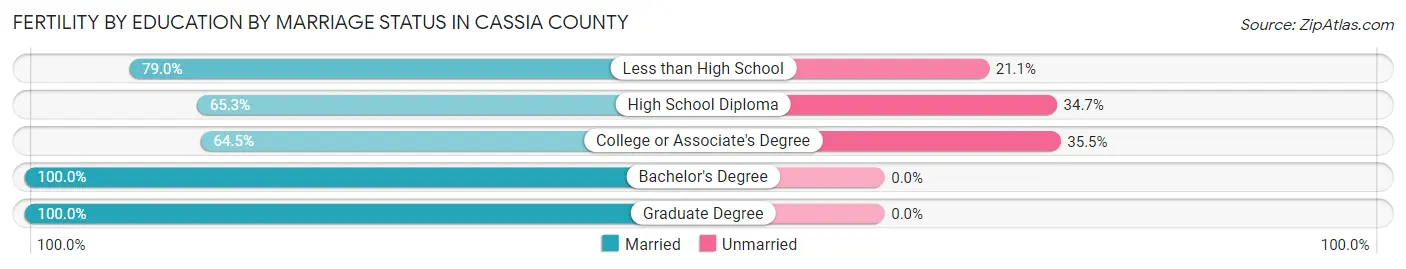
Fertility by Education by Marriage Status in Cassia County
29.2% of women with births in Cassia County are unmarried. Women with the educational attainment of bachelor's degree are most likely to be married with 100.0% of them married at childbirth, while women with the educational attainment of college or associate's degree are least likely to be married with 35.5% of them unmarried at childbirth.
| Educational Attainment | Married | Unmarried |
| Less than High School | 30 (78.9%) | 8 (21.0%) |
| High School Diploma | 94 (65.3%) | 50 (34.7%) |
| College or Associate's Degree | 140 (64.5%) | 77 (35.5%) |
| Bachelor's Degree | 42 (100.0%) | 0 (0.0%) |
| Graduate Degree | 22 (100.0%) | 0 (0.0%) |
| Total | 328 (70.8%) | 135 (29.2%) |
Income in Cassia County
Income Overview in Cassia County
Per Capita Income in Cassia County is $28,986, while median incomes of families and households are $70,264 and $63,525 respectively.
| Characteristic | Number | Measure |
| Per Capita Income | 24,859 | $28,986 |
| Median Family Income | 6,251 | $70,264 |
| Mean Family Income | 6,251 | $91,301 |
| Median Household Income | 8,180 | $63,525 |
| Mean Household Income | 8,180 | $83,982 |
| Income Deficit | 6,251 | $14,018 |
| Wage / Income Gap (%) | 24,859 | 41.84% |
| Wage / Income Gap ($) | 24,859 | 58.16¢ per $1 |
| Gini / Inequality Index | 24,859 | 0.45 |
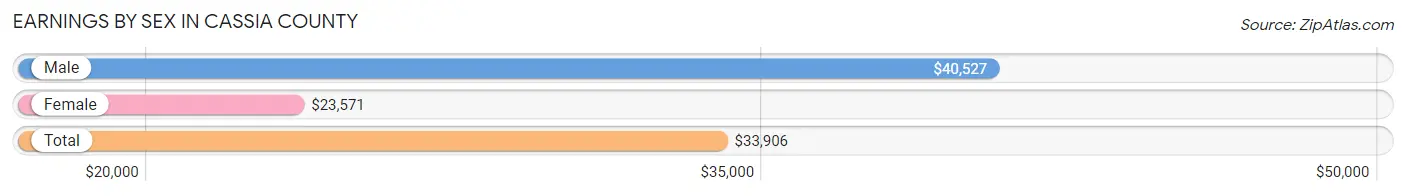
Earnings by Sex in Cassia County
Average Earnings in Cassia County are $33,906, $40,527 for men and $23,571 for women, a difference of 41.8%.
| Sex | Number | Average Earnings |
| Male | 7,161 (56.4%) | $40,527 |
| Female | 5,537 (43.6%) | $23,571 |
| Total | 12,698 (100.0%) | $33,906 |
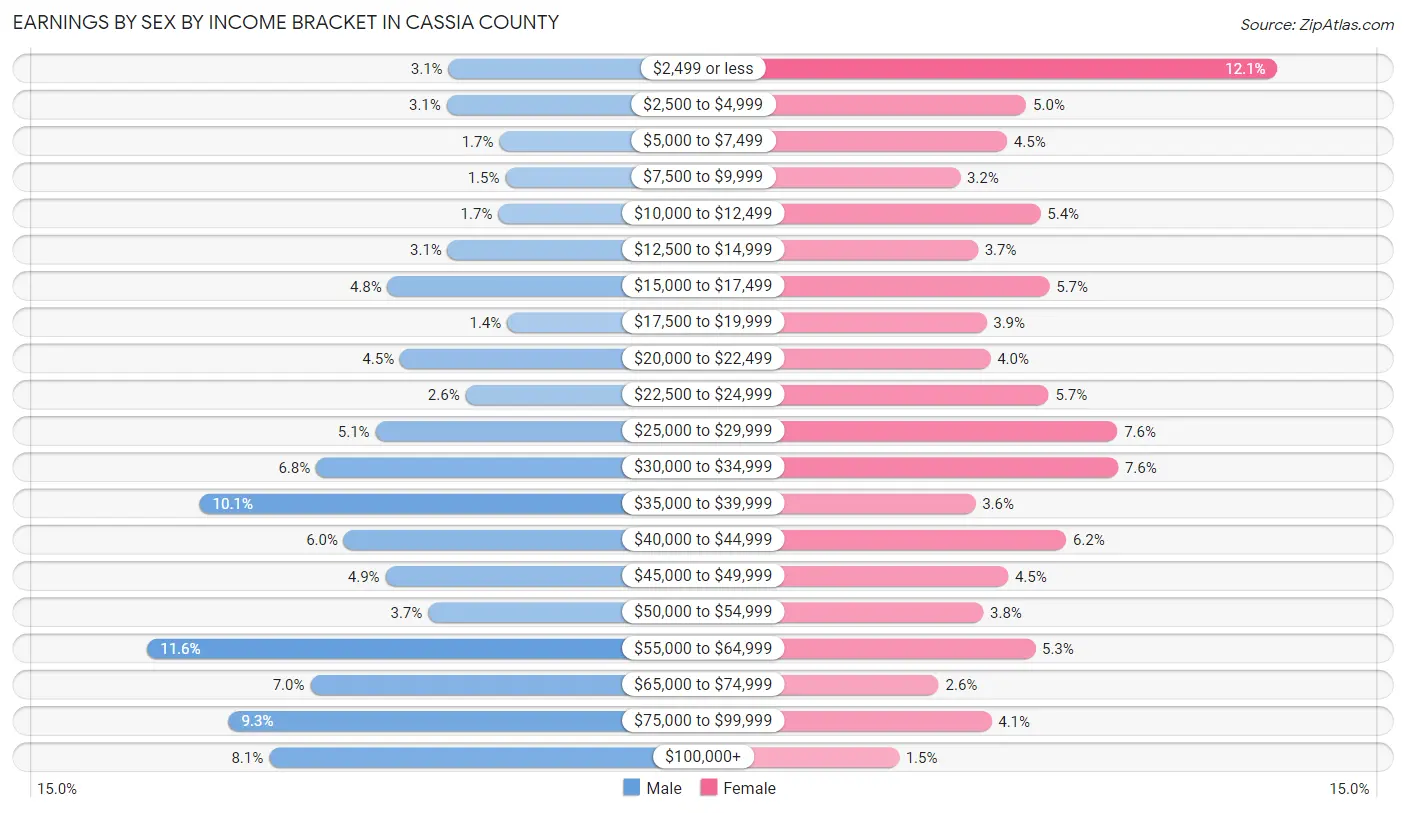
Earnings by Sex by Income Bracket in Cassia County
The most common earnings brackets in Cassia County are $55,000 to $64,999 for men (827 | 11.6%) and $2,499 or less for women (670 | 12.1%).
| Income | Male | Female |
| $2,499 or less | 221 (3.1%) | 670 (12.1%) |
| $2,500 to $4,999 | 225 (3.1%) | 279 (5.0%) |
| $5,000 to $7,499 | 119 (1.7%) | 249 (4.5%) |
| $7,500 to $9,999 | 107 (1.5%) | 176 (3.2%) |
| $10,000 to $12,499 | 121 (1.7%) | 301 (5.4%) |
| $12,500 to $14,999 | 223 (3.1%) | 204 (3.7%) |
| $15,000 to $17,499 | 344 (4.8%) | 315 (5.7%) |
| $17,500 to $19,999 | 103 (1.4%) | 217 (3.9%) |
| $20,000 to $22,499 | 319 (4.4%) | 223 (4.0%) |
| $22,500 to $24,999 | 187 (2.6%) | 314 (5.7%) |
| $25,000 to $29,999 | 368 (5.1%) | 421 (7.6%) |
| $30,000 to $34,999 | 488 (6.8%) | 422 (7.6%) |
| $35,000 to $39,999 | 722 (10.1%) | 200 (3.6%) |
| $40,000 to $44,999 | 432 (6.0%) | 341 (6.2%) |
| $45,000 to $49,999 | 348 (4.9%) | 251 (4.5%) |
| $50,000 to $54,999 | 262 (3.7%) | 212 (3.8%) |
| $55,000 to $64,999 | 827 (11.6%) | 293 (5.3%) |
| $65,000 to $74,999 | 499 (7.0%) | 143 (2.6%) |
| $75,000 to $99,999 | 664 (9.3%) | 225 (4.1%) |
| $100,000+ | 582 (8.1%) | 81 (1.5%) |
| Total | 7,161 (100.0%) | 5,537 (100.0%) |
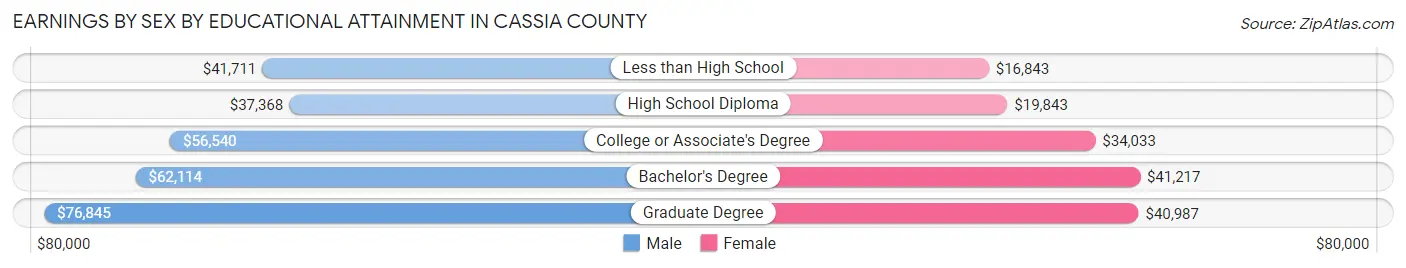
Earnings by Sex by Educational Attainment in Cassia County
Average earnings in Cassia County are $46,794 for men and $27,600 for women, a difference of 41.0%. Men with an educational attainment of graduate degree enjoy the highest average annual earnings of $76,845, while those with high school diploma education earn the least with $37,368. Women with an educational attainment of bachelor's degree earn the most with the average annual earnings of $41,217, while those with less than high school education have the smallest earnings of $16,843.
| Educational Attainment | Male Income | Female Income |
| Less than High School | $41,711 | $16,843 |
| High School Diploma | $37,368 | $19,843 |
| College or Associate's Degree | $56,540 | $34,033 |
| Bachelor's Degree | $62,114 | $41,217 |
| Graduate Degree | $76,845 | $40,987 |
| Total | $46,794 | $27,600 |
Family Income in Cassia County
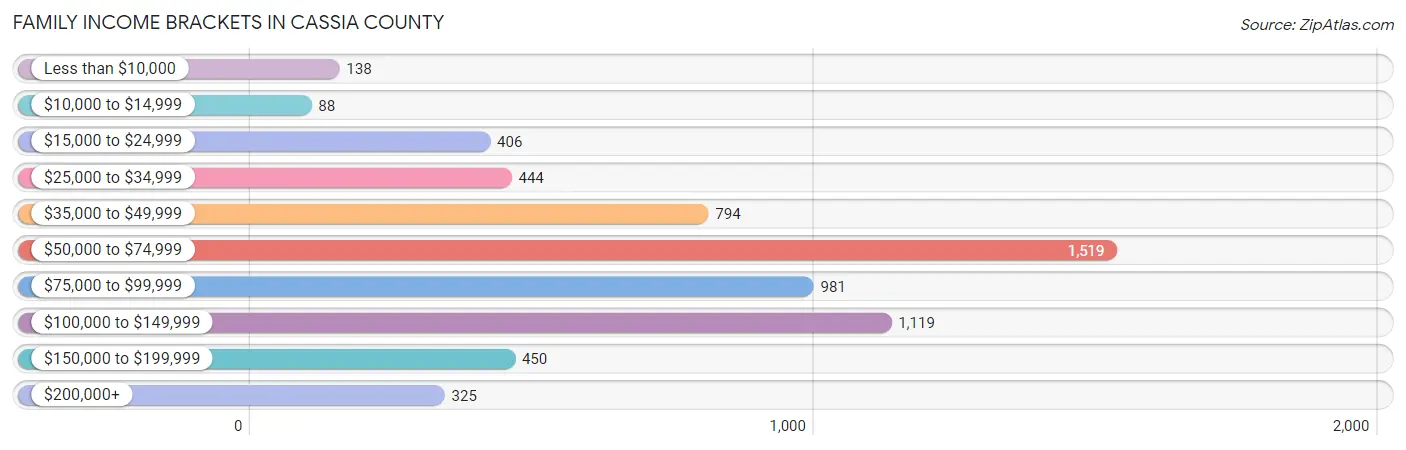
Family Income Brackets in Cassia County
According to the Cassia County family income data, there are 1,519 families falling into the $50,000 to $74,999 income range, which is the most common income bracket and makes up 24.3% of all families. Conversely, the $10,000 to $14,999 income bracket is the least frequent group with only 88 families (1.4%) belonging to this category.
| Income Bracket | # Families | % Families |
| Less than $10,000 | 138 | 2.2% |
| $10,000 to $14,999 | 88 | 1.4% |
| $15,000 to $24,999 | 406 | 6.5% |
| $25,000 to $34,999 | 444 | 7.1% |
| $35,000 to $49,999 | 794 | 12.7% |
| $50,000 to $74,999 | 1,519 | 24.3% |
| $75,000 to $99,999 | 981 | 15.7% |
| $100,000 to $149,999 | 1,119 | 17.9% |
| $150,000 to $199,999 | 450 | 7.2% |
| $200,000+ | 325 | 5.2% |
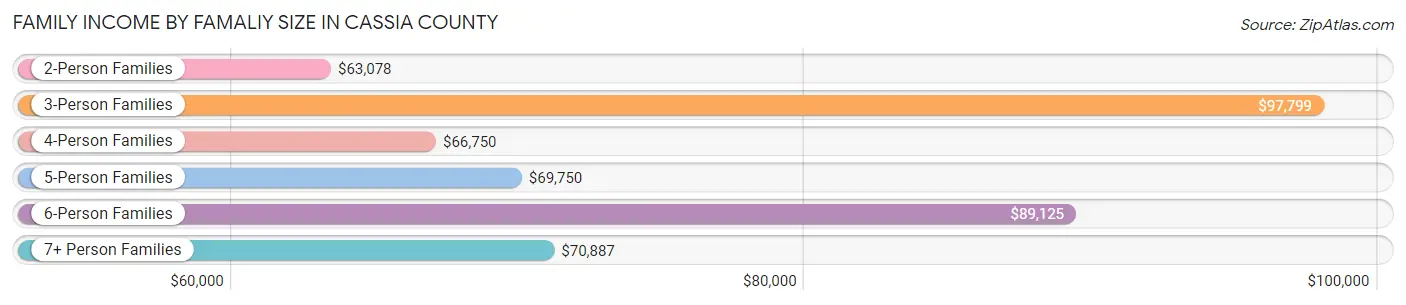
Family Income by Famaliy Size in Cassia County
3-person families (959 | 15.3%) account for the highest median family income in Cassia County with $97,799 per family, while 3-person families (959 | 15.3%) have the highest median income of $32,600 per family member.
| Income Bracket | # Families | Median Income |
| 2-Person Families | 2,916 (46.7%) | $63,078 |
| 3-Person Families | 959 (15.3%) | $97,799 |
| 4-Person Families | 922 (14.7%) | $66,750 |
| 5-Person Families | 703 (11.3%) | $69,750 |
| 6-Person Families | 459 (7.3%) | $89,125 |
| 7+ Person Families | 292 (4.7%) | $70,887 |
| Total | 6,251 (100.0%) | $70,264 |
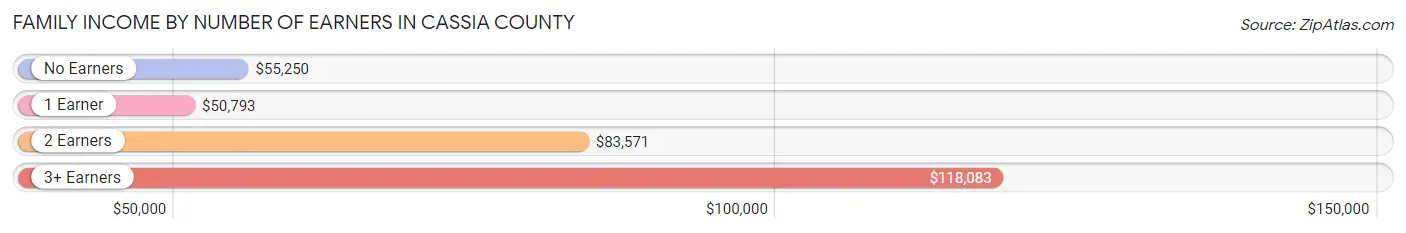
Family Income by Number of Earners in Cassia County
The median family income in Cassia County is $70,264, with families comprising 3+ earners (923) having the highest median family income of $118,083, while families with 1 earner (2,208) have the lowest median family income of $50,793, accounting for 14.8% and 35.3% of families, respectively.
| Number of Earners | # Families | Median Income |
| No Earners | 806 (12.9%) | $55,250 |
| 1 Earner | 2,208 (35.3%) | $50,793 |
| 2 Earners | 2,314 (37.0%) | $83,571 |
| 3+ Earners | 923 (14.8%) | $118,083 |
| Total | 6,251 (100.0%) | $70,264 |
Household Income in Cassia County
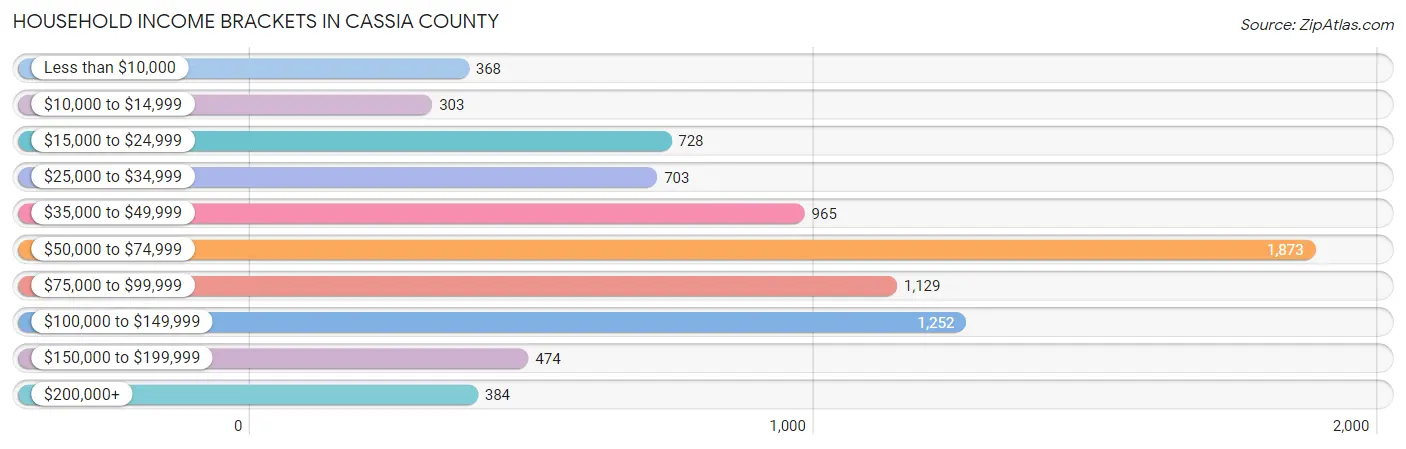
Household Income Brackets in Cassia County
With 1,873 households falling in the category, the $50,000 to $74,999 income range is the most frequent in Cassia County, accounting for 22.9% of all households. In contrast, only 303 households (3.7%) fall into the $10,000 to $14,999 income bracket, making it the least populous group.
| Income Bracket | # Households | % Households |
| Less than $10,000 | 368 | 4.5% |
| $10,000 to $14,999 | 303 | 3.7% |
| $15,000 to $24,999 | 728 | 8.9% |
| $25,000 to $34,999 | 703 | 8.6% |
| $35,000 to $49,999 | 965 | 11.8% |
| $50,000 to $74,999 | 1,873 | 22.9% |
| $75,000 to $99,999 | 1,129 | 13.8% |
| $100,000 to $149,999 | 1,252 | 15.3% |
| $150,000 to $199,999 | 474 | 5.8% |
| $200,000+ | 384 | 4.7% |
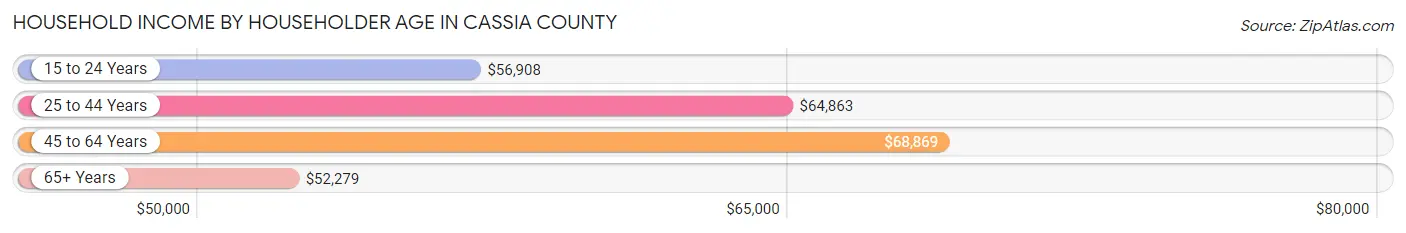
Household Income by Householder Age in Cassia County
The median household income in Cassia County is $63,525, with the highest median household income of $68,869 found in the 45 to 64 years age bracket for the primary householder. A total of 2,896 households (35.4%) fall into this category. Meanwhile, the 65+ years age bracket for the primary householder has the lowest median household income of $52,279, with 1,916 households (23.4%) in this group.
| Income Bracket | # Households | Median Income |
| 15 to 24 Years | 430 (5.3%) | $56,908 |
| 25 to 44 Years | 2,938 (35.9%) | $64,863 |
| 45 to 64 Years | 2,896 (35.4%) | $68,869 |
| 65+ Years | 1,916 (23.4%) | $52,279 |
| Total | 8,180 (100.0%) | $63,525 |
Poverty in Cassia County
Income Below Poverty by Sex and Age in Cassia County
With 10.5% poverty level for males and 10.2% for females among the residents of Cassia County, under 5 year old males and 45 to 54 year old females are the most vulnerable to poverty, with 207 males (20.9%) and 176 females (14.9%) in their respective age groups living below the poverty level.
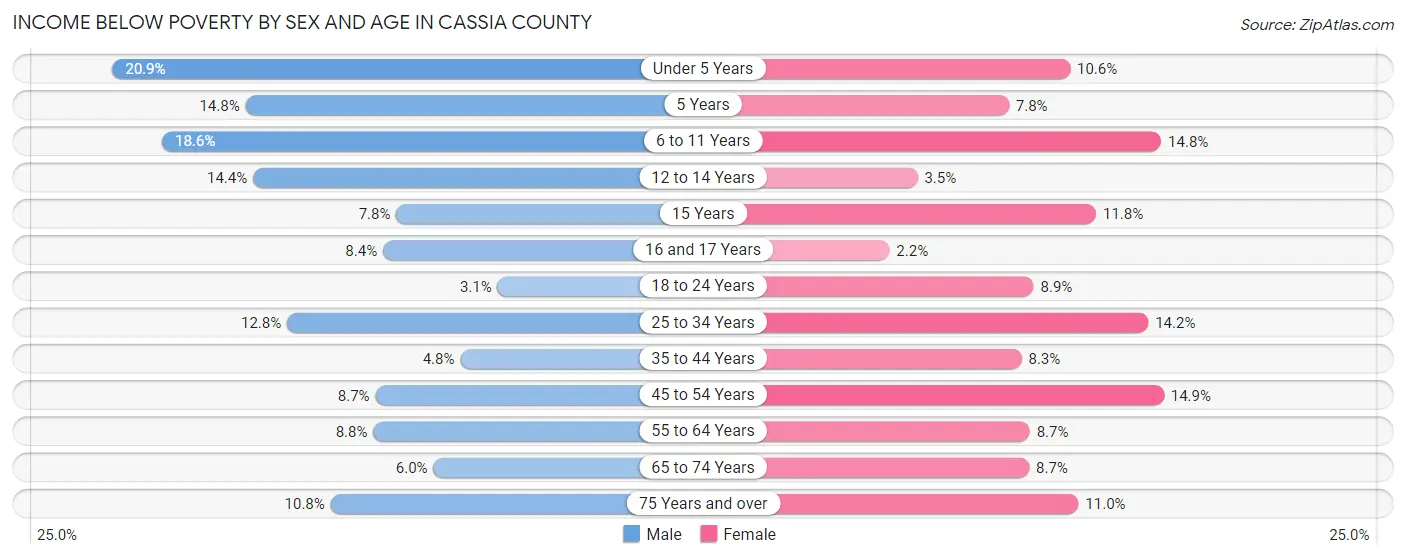
| Age Bracket | Male | Female |
| Under 5 Years | 207 (20.9%) | 99 (10.6%) |
| 5 Years | 55 (14.7%) | 10 (7.7%) |
| 6 to 11 Years | 235 (18.6%) | 177 (14.8%) |
| 12 to 14 Years | 88 (14.4%) | 28 (3.5%) |
| 15 Years | 20 (7.7%) | 19 (11.8%) |
| 16 and 17 Years | 39 (8.4%) | 11 (2.2%) |
| 18 to 24 Years | 37 (3.0%) | 94 (8.9%) |
| 25 to 34 Years | 197 (12.8%) | 199 (14.2%) |
| 35 to 44 Years | 76 (4.8%) | 128 (8.3%) |
| 45 to 54 Years | 113 (8.7%) | 176 (14.9%) |
| 55 to 64 Years | 120 (8.8%) | 112 (8.7%) |
| 65 to 74 Years | 57 (6.0%) | 91 (8.7%) |
| 75 Years and over | 65 (10.8%) | 83 (11.0%) |
| Total | 1,309 (10.5%) | 1,227 (10.2%) |
Income Above Poverty by Sex and Age in Cassia County
According to the poverty statistics in Cassia County, males aged 18 to 24 years and females aged 16 and 17 years are the age groups that are most secure financially, with 97.0% of males and 97.8% of females in these age groups living above the poverty line.
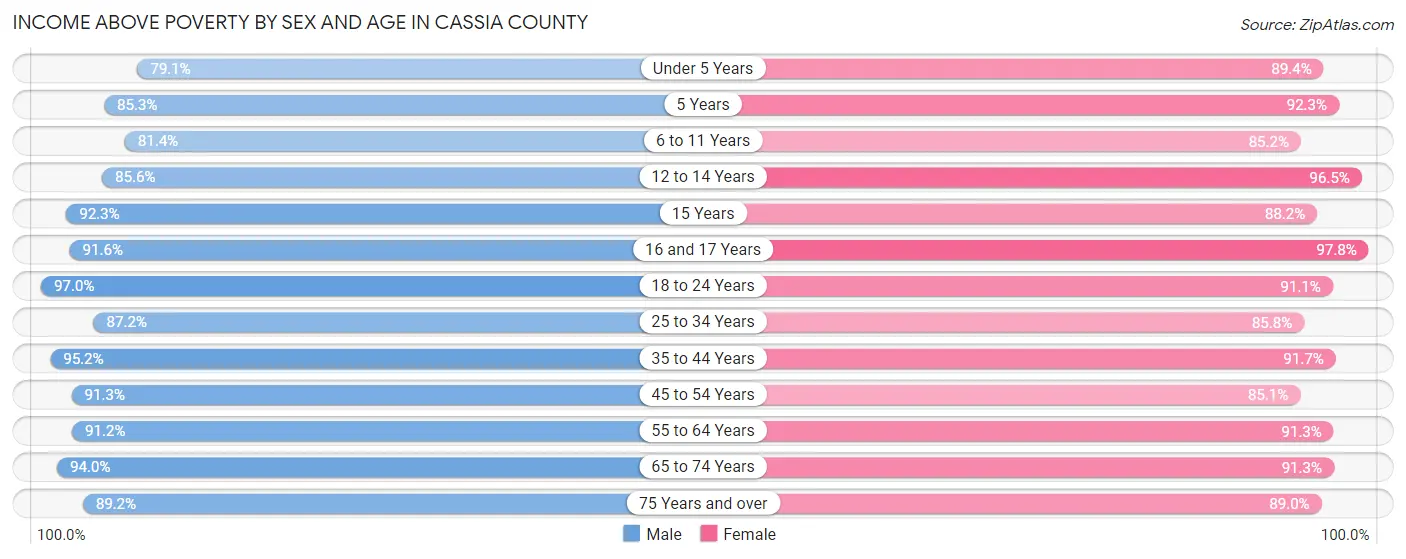
| Age Bracket | Male | Female |
| Under 5 Years | 782 (79.1%) | 836 (89.4%) |
| 5 Years | 318 (85.3%) | 119 (92.2%) |
| 6 to 11 Years | 1,027 (81.4%) | 1,017 (85.2%) |
| 12 to 14 Years | 523 (85.6%) | 769 (96.5%) |
| 15 Years | 238 (92.2%) | 142 (88.2%) |
| 16 and 17 Years | 427 (91.6%) | 486 (97.8%) |
| 18 to 24 Years | 1,177 (97.0%) | 962 (91.1%) |
| 25 to 34 Years | 1,340 (87.2%) | 1,200 (85.8%) |
| 35 to 44 Years | 1,513 (95.2%) | 1,407 (91.7%) |
| 45 to 54 Years | 1,183 (91.3%) | 1,002 (85.1%) |
| 55 to 64 Years | 1,241 (91.2%) | 1,173 (91.3%) |
| 65 to 74 Years | 889 (94.0%) | 956 (91.3%) |
| 75 Years and over | 537 (89.2%) | 673 (89.0%) |
| Total | 11,195 (89.5%) | 10,742 (89.7%) |
Income Below Poverty Among Married-Couple Families in Cassia County
The poverty statistics for married-couple families in Cassia County show that 4.6% or 231 of the total 5,004 families live below the poverty line. Families with 5 or more children have the highest poverty rate of 10.7%, comprising of 23 families. On the other hand, families with 1 or 2 children have the lowest poverty rate of 1.8%, which includes 24 families.
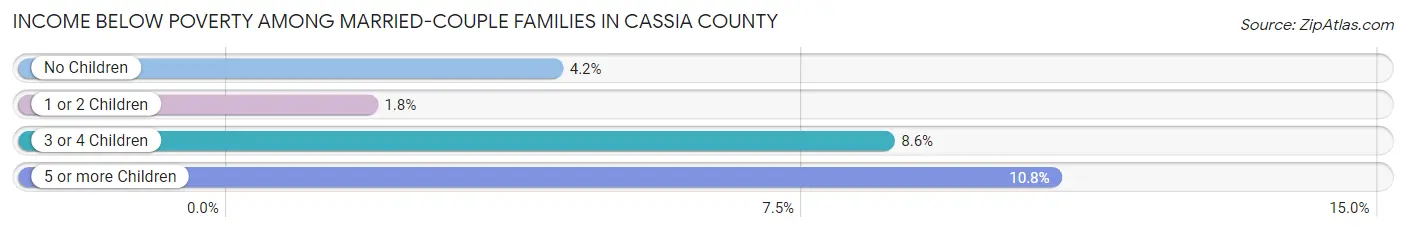
| Children | Above Poverty | Below Poverty |
| No Children | 2,506 (95.8%) | 111 (4.2%) |
| 1 or 2 Children | 1,297 (98.2%) | 24 (1.8%) |
| 3 or 4 Children | 779 (91.4%) | 73 (8.6%) |
| 5 or more Children | 191 (89.2%) | 23 (10.7%) |
| Total | 4,773 (95.4%) | 231 (4.6%) |
Income Below Poverty Among Single-Parent Households in Cassia County
According to the poverty data in Cassia County, 16.6% or 100 single-father households and 18.8% or 121 single-mother households are living below the poverty line. Among single-father households, those with 3 or 4 children have the highest poverty rate, with 90 households (73.2%) experiencing poverty. Likewise, among single-mother households, those with 3 or 4 children have the highest poverty rate, with 63 households (61.8%) falling below the poverty line.
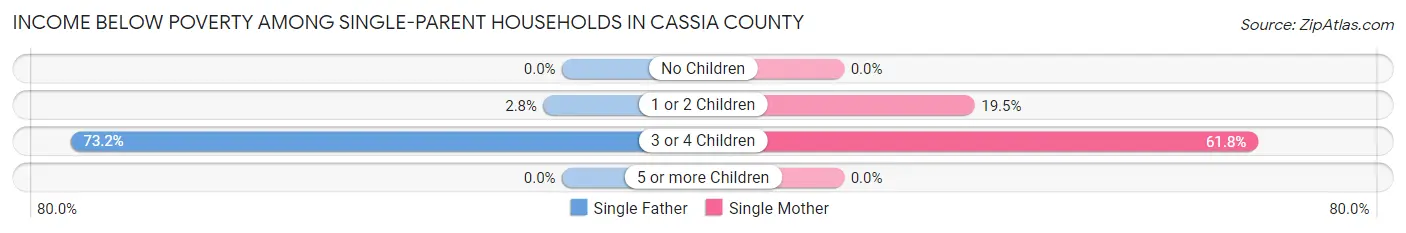
| Children | Single Father | Single Mother |
| No Children | 0 (0.0%) | 0 (0.0%) |
| 1 or 2 Children | 10 (2.8%) | 58 (19.5%) |
| 3 or 4 Children | 90 (73.2%) | 63 (61.8%) |
| 5 or more Children | 0 (0.0%) | 0 (0.0%) |
| Total | 100 (16.6%) | 121 (18.8%) |
Income Below Poverty Among Married-Couple vs Single-Parent Households in Cassia County
The poverty data for Cassia County shows that 231 of the married-couple family households (4.6%) and 221 of the single-parent households (17.7%) are living below the poverty level. Within the married-couple family households, those with 5 or more children have the highest poverty rate, with 23 households (10.7%) falling below the poverty line. Among the single-parent households, those with 3 or 4 children have the highest poverty rate, with 153 household (68.0%) living below poverty.
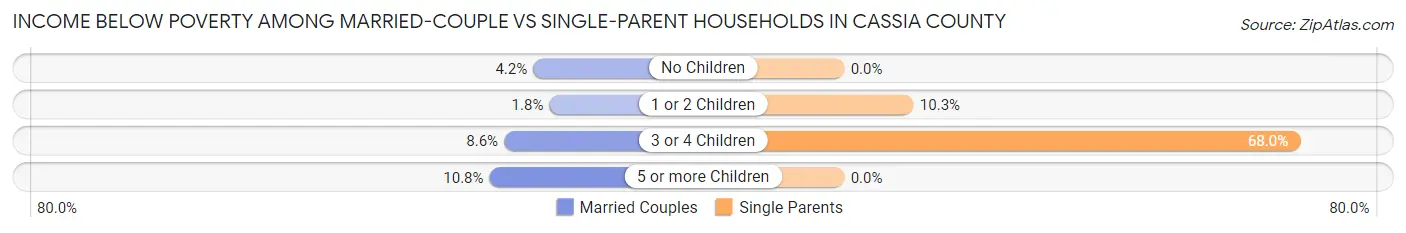
| Children | Married-Couple Families | Single-Parent Households |
| No Children | 111 (4.2%) | 0 (0.0%) |
| 1 or 2 Children | 24 (1.8%) | 68 (10.3%) |
| 3 or 4 Children | 73 (8.6%) | 153 (68.0%) |
| 5 or more Children | 23 (10.7%) | 0 (0.0%) |
| Total | 231 (4.6%) | 221 (17.7%) |
Employment Characteristics in Cassia County
Employment by Class of Employer in Cassia County
Among the 11,236 employed individuals in Cassia County, private company employees (8,044 | 71.6%), local government employees (944 | 8.4%), and self-employed (not incorporated) (828 | 7.4%) make up the most common classes of employment.

| Employer Class | # Employees | % Employees |
| Private Company Employees | 8,044 | 71.6% |
| Self-Employed (Incorporated) | 570 | 5.1% |
| Self-Employed (Not Incorporated) | 828 | 7.4% |
| Not-for-profit Organizations | 283 | 2.5% |
| Local Government Employees | 944 | 8.4% |
| State Government Employees | 437 | 3.9% |
| Federal Government Employees | 107 | 0.9% |
| Unpaid Family Workers | 23 | 0.2% |
| Total | 11,236 | 100.0% |
Employment Status by Age in Cassia County
According to the labor force statistics for Cassia County, out of the total population over 16 years of age (18,123), 65.4% or 11,852 individuals are in the labor force, with 3.0% or 356 of them unemployed. The age group with the highest labor force participation rate is 30 to 34 years, with 83.3% or 1,200 individuals in the labor force. Within the labor force, the 75 years and over age range has the highest percentage of unemployed individuals, with 33.0% or 32 of them being unemployed.
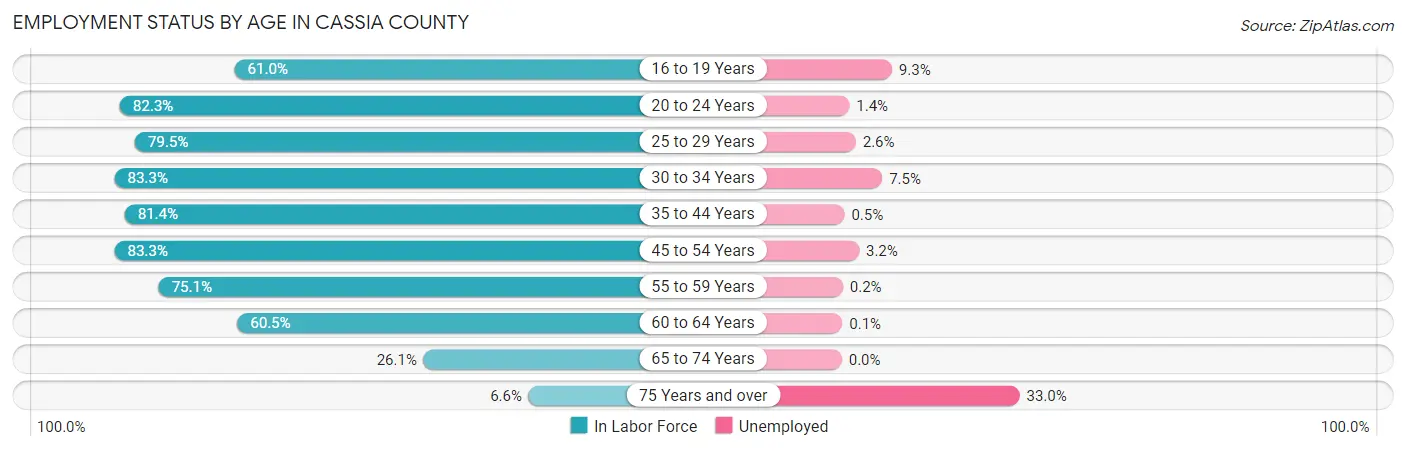
| Age Bracket | In Labor Force | Unemployed |
| 16 to 19 Years | 1,017 (61.0%) | 95 (9.3%) |
| 20 to 24 Years | 1,318 (82.3%) | 18 (1.4%) |
| 25 to 29 Years | 1,220 (79.5%) | 32 (2.6%) |
| 30 to 34 Years | 1,200 (83.3%) | 90 (7.5%) |
| 35 to 44 Years | 2,578 (81.4%) | 13 (0.5%) |
| 45 to 54 Years | 2,083 (83.3%) | 67 (3.2%) |
| 55 to 59 Years | 855 (75.1%) | 2 (0.2%) |
| 60 to 64 Years | 950 (60.5%) | 1 (0.1%) |
| 65 to 74 Years | 533 (26.1%) | 0 (0.0%) |
| 75 Years and over | 96 (6.6%) | 32 (33.0%) |
| Total | 11,852 (65.4%) | 356 (3.0%) |
Employment Status by Educational Attainment in Cassia County
According to labor force statistics for Cassia County, 78.3% of individuals (8,889) out of the total population between 25 and 64 years of age (11,353) are in the labor force, with 2.3% or 204 of them being unemployed. The group with the highest labor force participation rate are those with the educational attainment of bachelor's degree or higher, with 85.3% or 2,098 individuals in the labor force. Within the labor force, individuals with high school diploma education have the highest percentage of unemployment, with 3.6% or 91 of them being unemployed.

| Educational Attainment | In Labor Force | Unemployed |
| Less than High School | 1,210 (73.9%) | 7 (0.4%) |
| High School Diploma | 2,532 (79.2%) | 115 (3.6%) |
| College / Associate Degree | 3,048 (75.1%) | 106 (2.6%) |
| Bachelor's Degree or higher | 2,098 (85.3%) | 34 (1.4%) |
| Total | 8,889 (78.3%) | 261 (2.3%) |
Employment Occupations by Sex in Cassia County
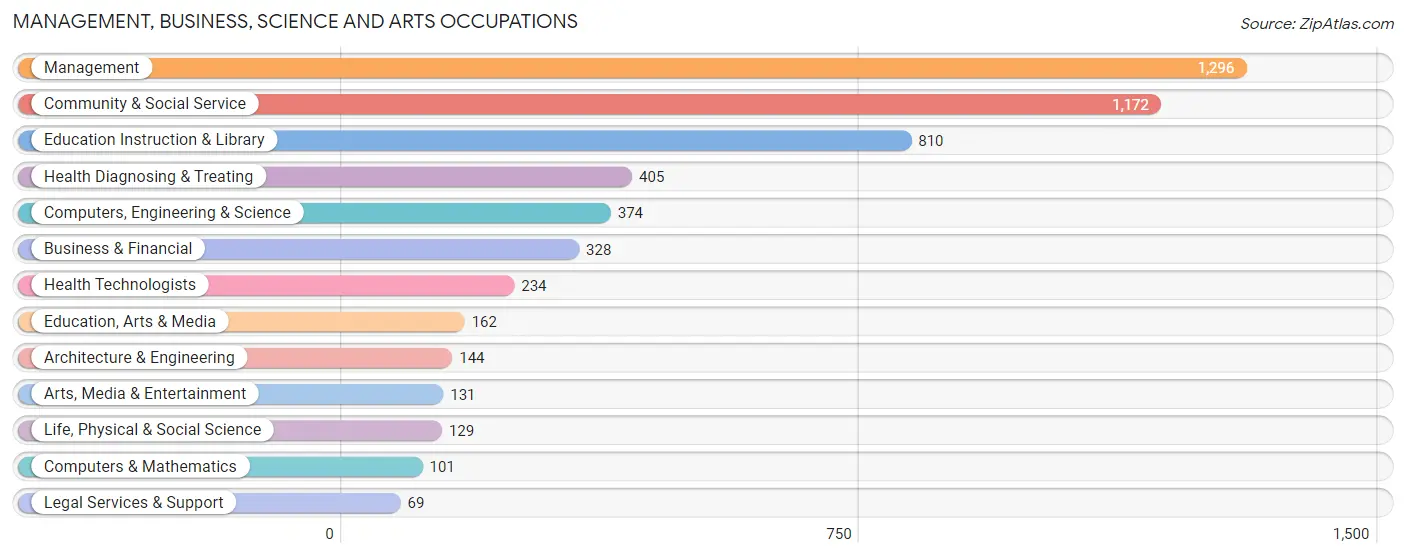
Management, Business, Science and Arts Occupations
The most common Management, Business, Science and Arts occupations in Cassia County are Management (1,296 | 11.3%), Community & Social Service (1,172 | 10.2%), Education Instruction & Library (810 | 7.0%), Health Diagnosing & Treating (405 | 3.5%), and Computers, Engineering & Science (374 | 3.3%).
Management, Business, Science and Arts Occupations by Sex
Within the Management, Business, Science and Arts occupations in Cassia County, the most male-oriented occupations are Architecture & Engineering (92.4%), Management (77.8%), and Computers & Mathematics (68.3%), while the most female-oriented occupations are Health Diagnosing & Treating (81.5%), Education Instruction & Library (81.0%), and Life, Physical & Social Science (79.1%).
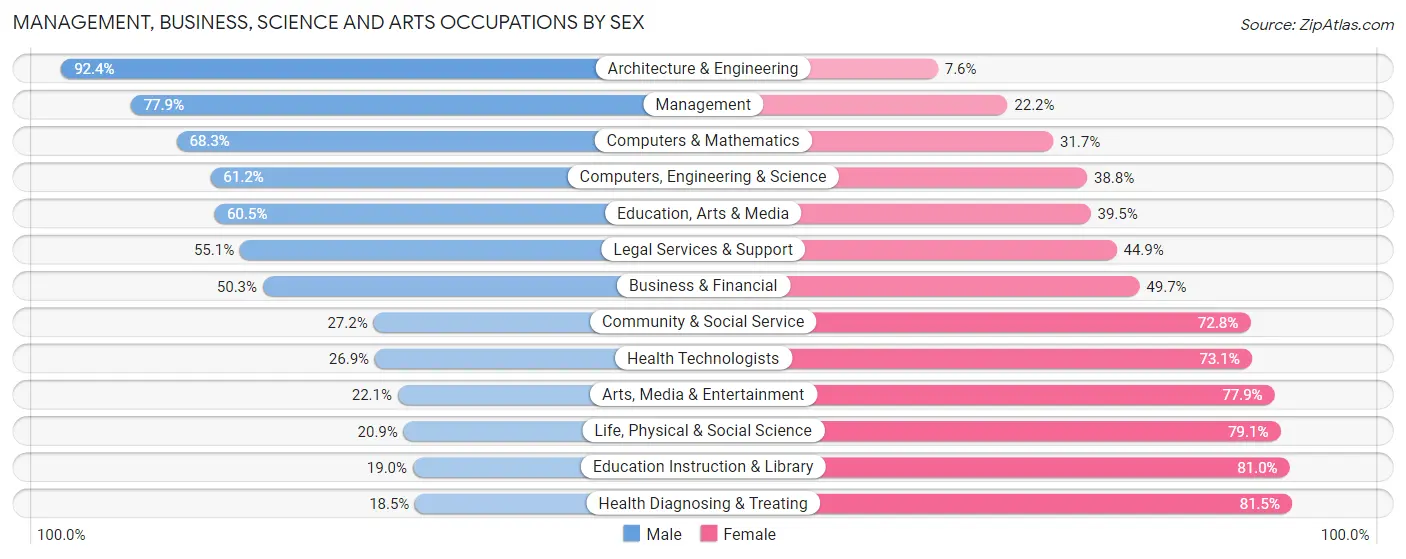
| Occupation | Male | Female |
| Management | 1,009 (77.8%) | 287 (22.2%) |
| Business & Financial | 165 (50.3%) | 163 (49.7%) |
| Computers, Engineering & Science | 229 (61.2%) | 145 (38.8%) |
| Computers & Mathematics | 69 (68.3%) | 32 (31.7%) |
| Architecture & Engineering | 133 (92.4%) | 11 (7.6%) |
| Life, Physical & Social Science | 27 (20.9%) | 102 (79.1%) |
| Community & Social Service | 319 (27.2%) | 853 (72.8%) |
| Education, Arts & Media | 98 (60.5%) | 64 (39.5%) |
| Legal Services & Support | 38 (55.1%) | 31 (44.9%) |
| Education Instruction & Library | 154 (19.0%) | 656 (81.0%) |
| Arts, Media & Entertainment | 29 (22.1%) | 102 (77.9%) |
| Health Diagnosing & Treating | 75 (18.5%) | 330 (81.5%) |
| Health Technologists | 63 (26.9%) | 171 (73.1%) |
| Total (Category) | 1,797 (50.3%) | 1,778 (49.7%) |
| Total (Overall) | 6,686 (58.1%) | 4,814 (41.9%) |
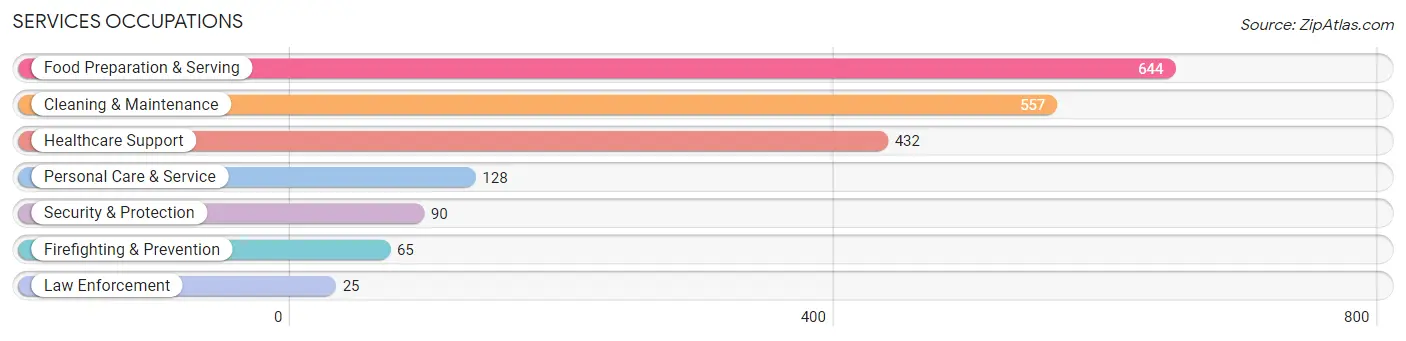
Services Occupations
The most common Services occupations in Cassia County are Food Preparation & Serving (644 | 5.6%), Cleaning & Maintenance (557 | 4.8%), Healthcare Support (432 | 3.8%), Personal Care & Service (128 | 1.1%), and Security & Protection (90 | 0.8%).
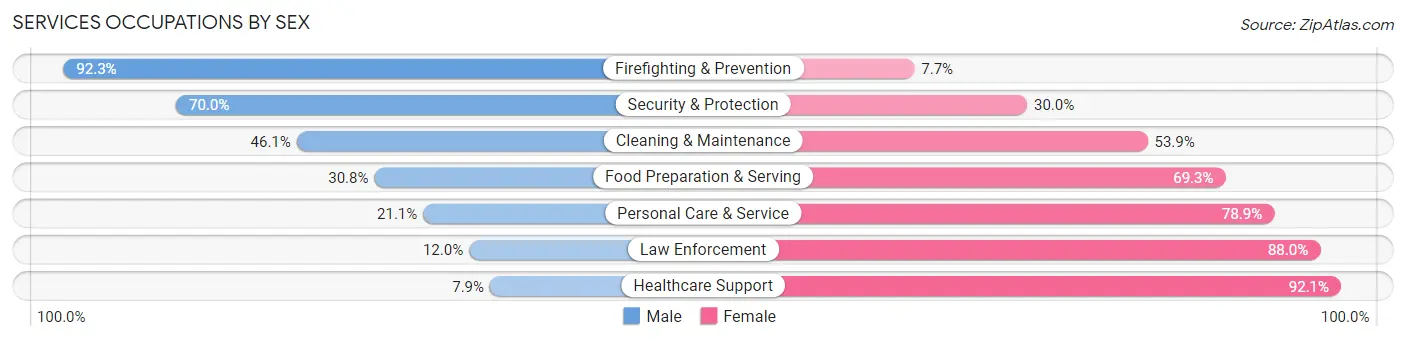
Services Occupations by Sex
Within the Services occupations in Cassia County, the most male-oriented occupations are Firefighting & Prevention (92.3%), Security & Protection (70.0%), and Cleaning & Maintenance (46.1%), while the most female-oriented occupations are Healthcare Support (92.1%), Law Enforcement (88.0%), and Personal Care & Service (78.9%).
| Occupation | Male | Female |
| Healthcare Support | 34 (7.9%) | 398 (92.1%) |
| Security & Protection | 63 (70.0%) | 27 (30.0%) |
| Firefighting & Prevention | 60 (92.3%) | 5 (7.7%) |
| Law Enforcement | 3 (12.0%) | 22 (88.0%) |
| Food Preparation & Serving | 198 (30.7%) | 446 (69.3%) |
| Cleaning & Maintenance | 257 (46.1%) | 300 (53.9%) |
| Personal Care & Service | 27 (21.1%) | 101 (78.9%) |
| Total (Category) | 579 (31.3%) | 1,272 (68.7%) |
| Total (Overall) | 6,686 (58.1%) | 4,814 (41.9%) |
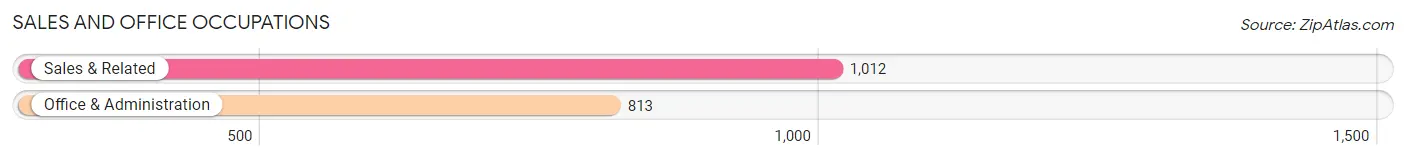
Sales and Office Occupations
The most common Sales and Office occupations in Cassia County are Sales & Related (1,012 | 8.8%), and Office & Administration (813 | 7.1%).
Sales and Office Occupations by Sex

| Occupation | Male | Female |
| Sales & Related | 466 (46.1%) | 546 (53.9%) |
| Office & Administration | 131 (16.1%) | 682 (83.9%) |
| Total (Category) | 597 (32.7%) | 1,228 (67.3%) |
| Total (Overall) | 6,686 (58.1%) | 4,814 (41.9%) |
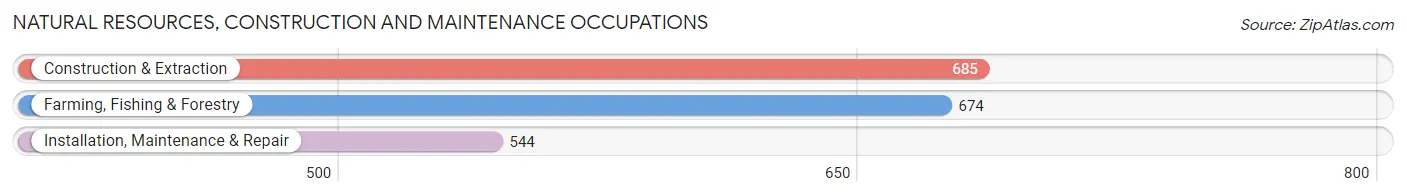
Natural Resources, Construction and Maintenance Occupations
The most common Natural Resources, Construction and Maintenance occupations in Cassia County are Construction & Extraction (685 | 6.0%), Farming, Fishing & Forestry (674 | 5.9%), and Installation, Maintenance & Repair (544 | 4.7%).
Natural Resources, Construction and Maintenance Occupations by Sex

| Occupation | Male | Female |
| Farming, Fishing & Forestry | 609 (90.4%) | 65 (9.6%) |
| Construction & Extraction | 653 (95.3%) | 32 (4.7%) |
| Installation, Maintenance & Repair | 536 (98.5%) | 8 (1.5%) |
| Total (Category) | 1,798 (94.5%) | 105 (5.5%) |
| Total (Overall) | 6,686 (58.1%) | 4,814 (41.9%) |
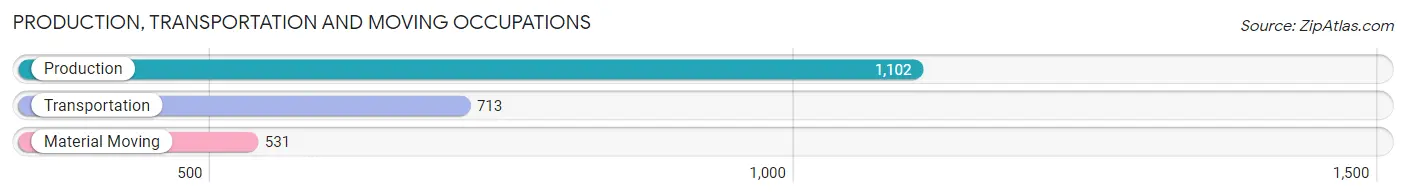
Production, Transportation and Moving Occupations
The most common Production, Transportation and Moving occupations in Cassia County are Production (1,102 | 9.6%), Transportation (713 | 6.2%), and Material Moving (531 | 4.6%).
Production, Transportation and Moving Occupations by Sex
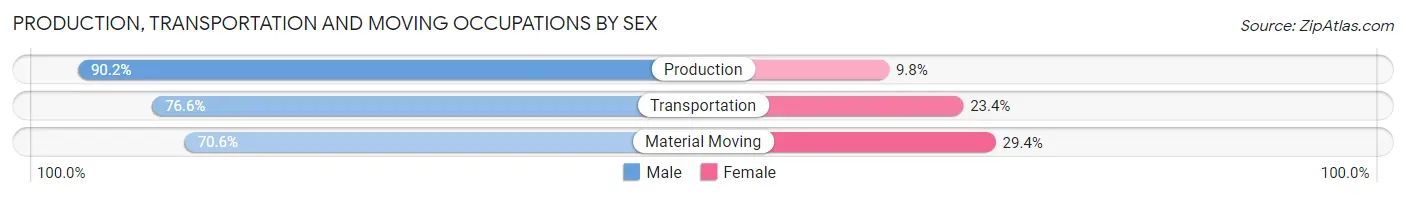
| Occupation | Male | Female |
| Production | 994 (90.2%) | 108 (9.8%) |
| Transportation | 546 (76.6%) | 167 (23.4%) |
| Material Moving | 375 (70.6%) | 156 (29.4%) |
| Total (Category) | 1,915 (81.6%) | 431 (18.4%) |
| Total (Overall) | 6,686 (58.1%) | 4,814 (41.9%) |
Employment Industries by Sex in Cassia County
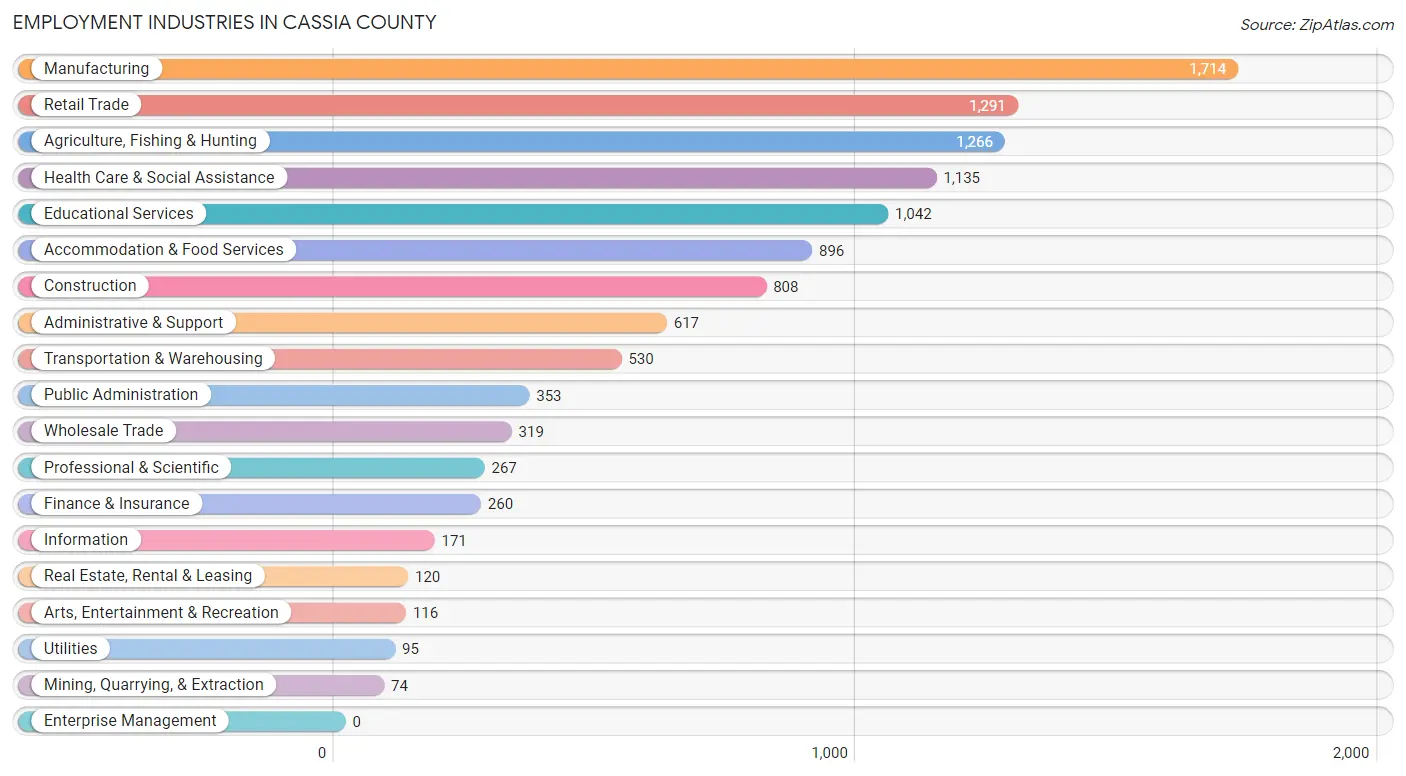
Employment Industries in Cassia County
The major employment industries in Cassia County include Manufacturing (1,714 | 14.9%), Retail Trade (1,291 | 11.2%), Agriculture, Fishing & Hunting (1,266 | 11.0%), Health Care & Social Assistance (1,135 | 9.9%), and Educational Services (1,042 | 9.1%).
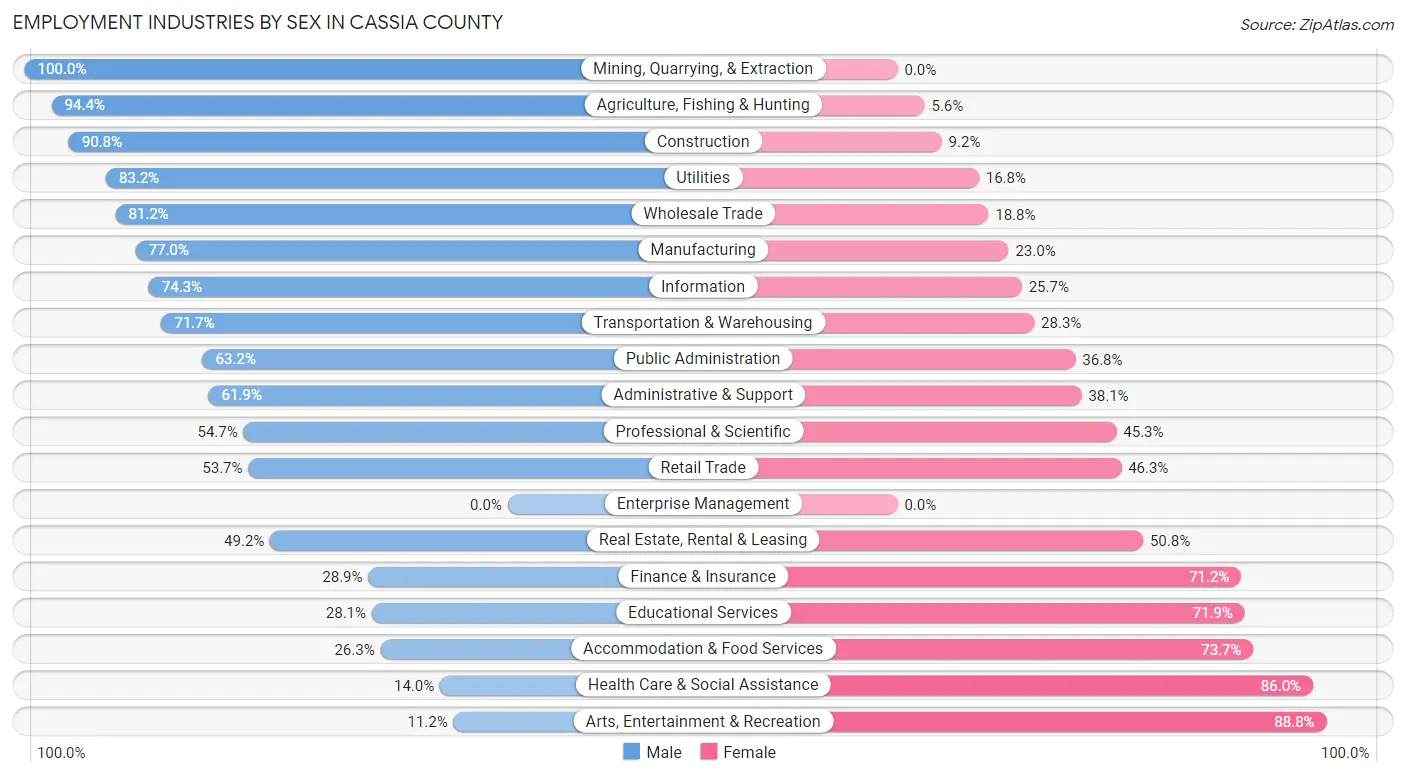
Employment Industries by Sex in Cassia County
The Cassia County industries that see more men than women are Mining, Quarrying, & Extraction (100.0%), Agriculture, Fishing & Hunting (94.4%), and Construction (90.8%), whereas the industries that tend to have a higher number of women are Arts, Entertainment & Recreation (88.8%), Health Care & Social Assistance (86.0%), and Accommodation & Food Services (73.7%).
| Industry | Male | Female |
| Agriculture, Fishing & Hunting | 1,195 (94.4%) | 71 (5.6%) |
| Mining, Quarrying, & Extraction | 74 (100.0%) | 0 (0.0%) |
| Construction | 734 (90.8%) | 74 (9.2%) |
| Manufacturing | 1,320 (77.0%) | 394 (23.0%) |
| Wholesale Trade | 259 (81.2%) | 60 (18.8%) |
| Retail Trade | 693 (53.7%) | 598 (46.3%) |
| Transportation & Warehousing | 380 (71.7%) | 150 (28.3%) |
| Utilities | 79 (83.2%) | 16 (16.8%) |
| Information | 127 (74.3%) | 44 (25.7%) |
| Finance & Insurance | 75 (28.8%) | 185 (71.2%) |
| Real Estate, Rental & Leasing | 59 (49.2%) | 61 (50.8%) |
| Professional & Scientific | 146 (54.7%) | 121 (45.3%) |
| Enterprise Management | 0 (0.0%) | 0 (0.0%) |
| Administrative & Support | 382 (61.9%) | 235 (38.1%) |
| Educational Services | 293 (28.1%) | 749 (71.9%) |
| Health Care & Social Assistance | 159 (14.0%) | 976 (86.0%) |
| Arts, Entertainment & Recreation | 13 (11.2%) | 103 (88.8%) |
| Accommodation & Food Services | 236 (26.3%) | 660 (73.7%) |
| Public Administration | 223 (63.2%) | 130 (36.8%) |
| Total | 6,686 (58.1%) | 4,814 (41.9%) |
Education in Cassia County
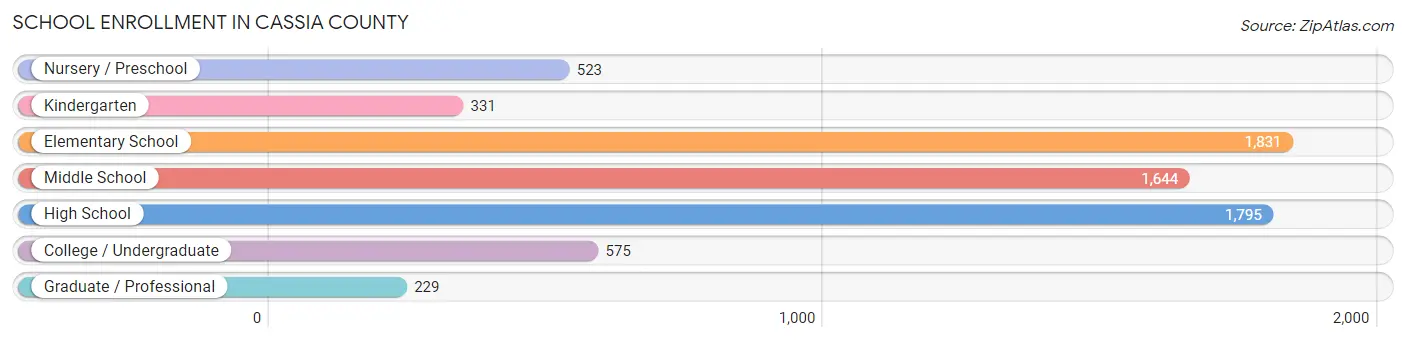
School Enrollment in Cassia County
The most common levels of schooling among the 6,928 students in Cassia County are elementary school (1,831 | 26.4%), high school (1,795 | 25.9%), and middle school (1,644 | 23.7%).
| School Level | # Students | % Students |
| Nursery / Preschool | 523 | 7.5% |
| Kindergarten | 331 | 4.8% |
| Elementary School | 1,831 | 26.4% |
| Middle School | 1,644 | 23.7% |
| High School | 1,795 | 25.9% |
| College / Undergraduate | 575 | 8.3% |
| Graduate / Professional | 229 | 3.3% |
| Total | 6,928 | 100.0% |
School Enrollment by Age by Funding Source in Cassia County
Out of a total of 6,928 students who are enrolled in schools in Cassia County, 769 (11.1%) attend a private institution, while the remaining 6,159 (88.9%) are enrolled in public schools. The age group of 3 to 4 year olds has the highest likelihood of being enrolled in private schools, with 60 (20.0% in the age bracket) enrolled. Conversely, the age group of 15 to 17 year olds has the lowest likelihood of being enrolled in a private school, with 1,268 (97.0% in the age bracket) attending a public institution.

| Age Bracket | Public School | Private School |
| 3 to 4 Year Olds | 240 (80.0%) | 60 (20.0%) |
| 5 to 9 Year Old | 1,771 (83.6%) | 348 (16.4%) |
| 10 to 14 Year Olds | 1,940 (89.9%) | 218 (10.1%) |
| 15 to 17 Year Olds | 1,268 (97.0%) | 39 (3.0%) |
| 18 to 19 Year Olds | 276 (96.8%) | 9 (3.2%) |
| 20 to 24 Year Olds | 218 (87.5%) | 31 (12.4%) |
| 25 to 34 Year Olds | 229 (94.6%) | 13 (5.4%) |
| 35 Years and over | 217 (81.0%) | 51 (19.0%) |
| Total | 6,159 (88.9%) | 769 (11.1%) |
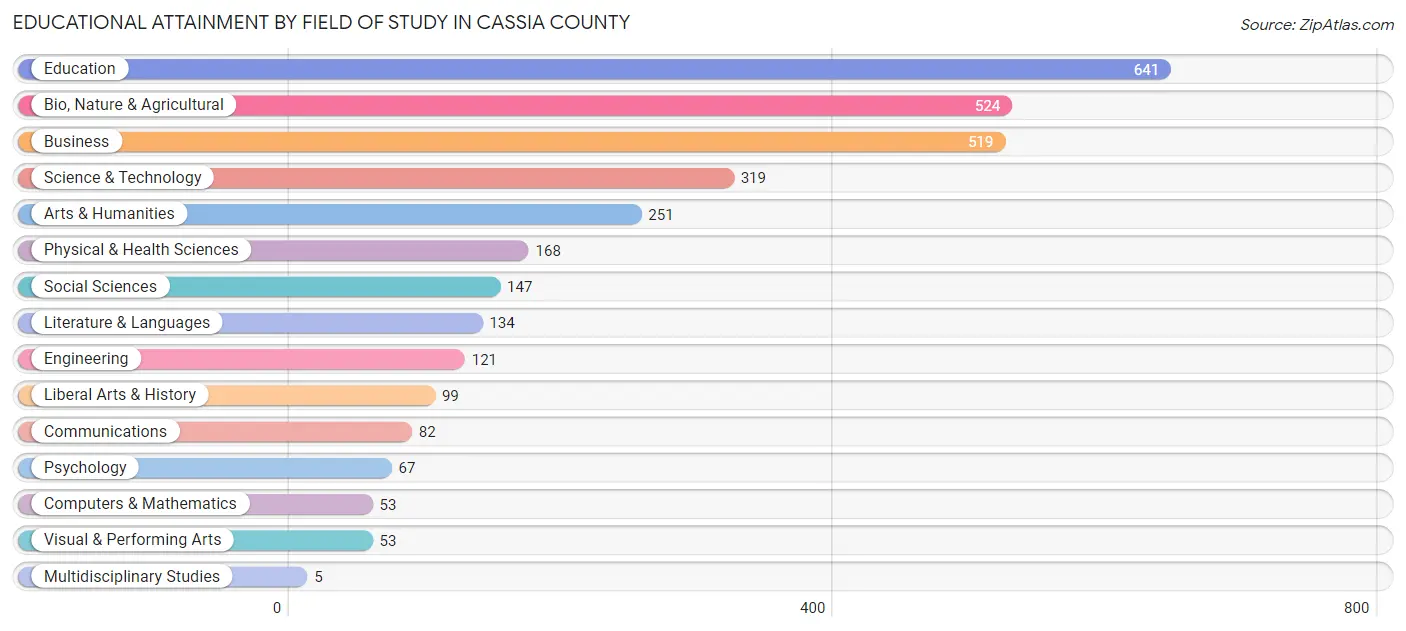
Educational Attainment by Field of Study in Cassia County
Education (641 | 20.1%), bio, nature & agricultural (524 | 16.5%), business (519 | 16.3%), science & technology (319 | 10.0%), and arts & humanities (251 | 7.9%) are the most common fields of study among 3,183 individuals in Cassia County who have obtained a bachelor's degree or higher.
| Field of Study | # Graduates | % Graduates |
| Computers & Mathematics | 53 | 1.7% |
| Bio, Nature & Agricultural | 524 | 16.5% |
| Physical & Health Sciences | 168 | 5.3% |
| Psychology | 67 | 2.1% |
| Social Sciences | 147 | 4.6% |
| Engineering | 121 | 3.8% |
| Multidisciplinary Studies | 5 | 0.2% |
| Science & Technology | 319 | 10.0% |
| Business | 519 | 16.3% |
| Education | 641 | 20.1% |
| Literature & Languages | 134 | 4.2% |
| Liberal Arts & History | 99 | 3.1% |
| Visual & Performing Arts | 53 | 1.7% |
| Communications | 82 | 2.6% |
| Arts & Humanities | 251 | 7.9% |
| Total | 3,183 | 100.0% |
Transportation & Commute in Cassia County
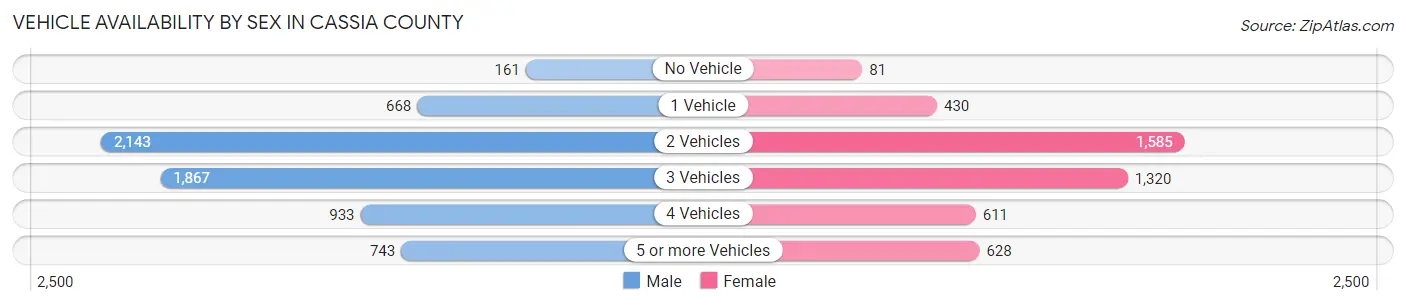
Vehicle Availability by Sex in Cassia County
The most prevalent vehicle ownership categories in Cassia County are males with 2 vehicles (2,143, accounting for 32.9%) and females with 2 vehicles (1,585, making up 46.0%).
| Vehicles Available | Male | Female |
| No Vehicle | 161 (2.5%) | 81 (1.7%) |
| 1 Vehicle | 668 (10.2%) | 430 (9.2%) |
| 2 Vehicles | 2,143 (32.9%) | 1,585 (34.1%) |
| 3 Vehicles | 1,867 (28.7%) | 1,320 (28.4%) |
| 4 Vehicles | 933 (14.3%) | 611 (13.1%) |
| 5 or more Vehicles | 743 (11.4%) | 628 (13.5%) |
| Total | 6,515 (100.0%) | 4,655 (100.0%) |
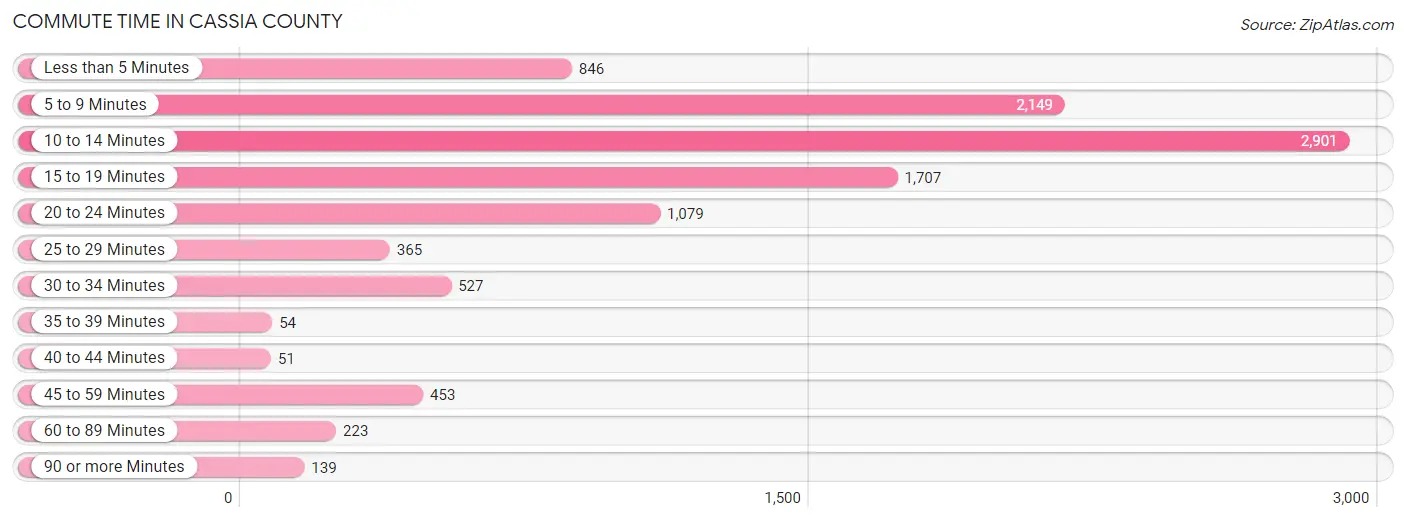
Commute Time in Cassia County
The most frequently occuring commute durations in Cassia County are 10 to 14 minutes (2,901 commuters, 27.6%), 5 to 9 minutes (2,149 commuters, 20.5%), and 15 to 19 minutes (1,707 commuters, 16.3%).
| Commute Time | # Commuters | % Commuters |
| Less than 5 Minutes | 846 | 8.1% |
| 5 to 9 Minutes | 2,149 | 20.5% |
| 10 to 14 Minutes | 2,901 | 27.6% |
| 15 to 19 Minutes | 1,707 | 16.3% |
| 20 to 24 Minutes | 1,079 | 10.3% |
| 25 to 29 Minutes | 365 | 3.5% |
| 30 to 34 Minutes | 527 | 5.0% |
| 35 to 39 Minutes | 54 | 0.5% |
| 40 to 44 Minutes | 51 | 0.5% |
| 45 to 59 Minutes | 453 | 4.3% |
| 60 to 89 Minutes | 223 | 2.1% |
| 90 or more Minutes | 139 | 1.3% |
Commute Time by Sex in Cassia County
The most common commute times in Cassia County are 10 to 14 minutes (1,706 commuters, 27.5%) for males and 10 to 14 minutes (1,195 commuters, 27.8%) for females.
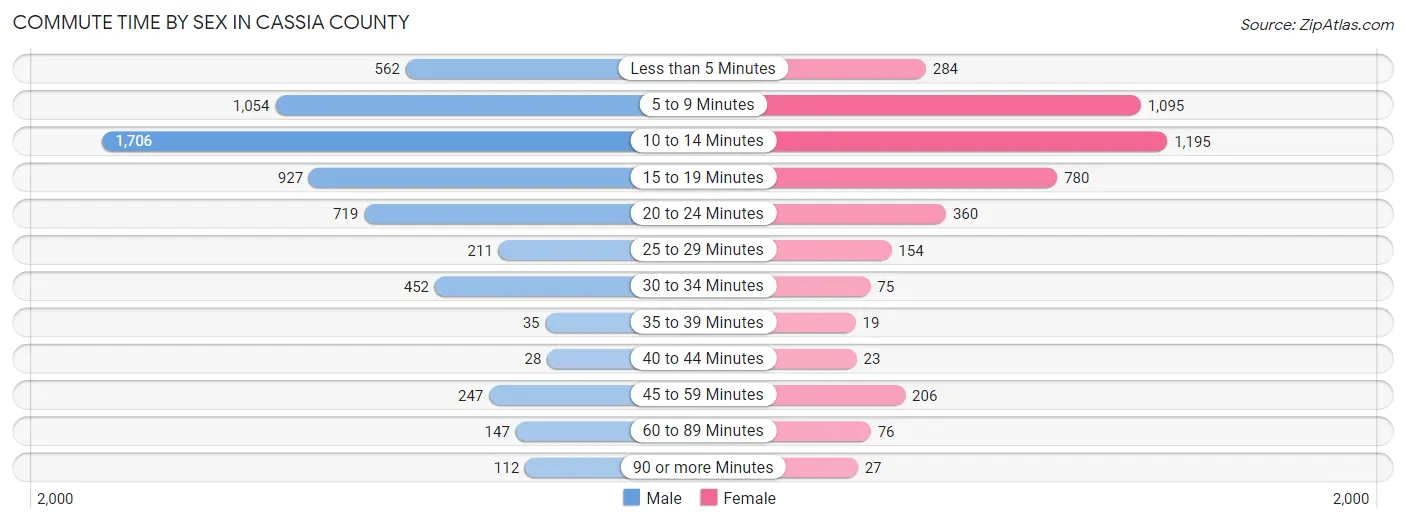
| Commute Time | Male | Female |
| Less than 5 Minutes | 562 (9.1%) | 284 (6.6%) |
| 5 to 9 Minutes | 1,054 (17.0%) | 1,095 (25.5%) |
| 10 to 14 Minutes | 1,706 (27.5%) | 1,195 (27.8%) |
| 15 to 19 Minutes | 927 (14.9%) | 780 (18.2%) |
| 20 to 24 Minutes | 719 (11.6%) | 360 (8.4%) |
| 25 to 29 Minutes | 211 (3.4%) | 154 (3.6%) |
| 30 to 34 Minutes | 452 (7.3%) | 75 (1.8%) |
| 35 to 39 Minutes | 35 (0.6%) | 19 (0.4%) |
| 40 to 44 Minutes | 28 (0.4%) | 23 (0.5%) |
| 45 to 59 Minutes | 247 (4.0%) | 206 (4.8%) |
| 60 to 89 Minutes | 147 (2.4%) | 76 (1.8%) |
| 90 or more Minutes | 112 (1.8%) | 27 (0.6%) |
Time of Departure to Work by Sex in Cassia County
The most frequent times of departure to work in Cassia County are 7:30 AM to 7:59 AM (1,153, 18.6%) for males and 7:30 AM to 7:59 AM (1,201, 28.0%) for females.

| Time of Departure | Male | Female |
| 12:00 AM to 4:59 AM | 382 (6.2%) | 87 (2.0%) |
| 5:00 AM to 5:29 AM | 276 (4.4%) | 91 (2.1%) |
| 5:30 AM to 5:59 AM | 563 (9.1%) | 289 (6.7%) |
| 6:00 AM to 6:29 AM | 615 (9.9%) | 160 (3.7%) |
| 6:30 AM to 6:59 AM | 645 (10.4%) | 279 (6.5%) |
| 7:00 AM to 7:29 AM | 1,047 (16.9%) | 276 (6.4%) |
| 7:30 AM to 7:59 AM | 1,153 (18.6%) | 1,201 (28.0%) |
| 8:00 AM to 8:29 AM | 552 (8.9%) | 379 (8.8%) |
| 8:30 AM to 8:59 AM | 196 (3.2%) | 290 (6.8%) |
| 9:00 AM to 9:59 AM | 49 (0.8%) | 275 (6.4%) |
| 10:00 AM to 10:59 AM | 16 (0.3%) | 207 (4.8%) |
| 11:00 AM to 11:59 AM | 3 (0.1%) | 80 (1.9%) |
| 12:00 PM to 3:59 PM | 258 (4.2%) | 182 (4.2%) |
| 4:00 PM to 11:59 PM | 445 (7.2%) | 498 (11.6%) |
| Total | 6,200 (100.0%) | 4,294 (100.0%) |
Housing Occupancy in Cassia County
Occupancy by Ownership in Cassia County
Of the total 8,180 dwellings in Cassia County, owner-occupied units account for 5,669 (69.3%), while renter-occupied units make up 2,511 (30.7%).
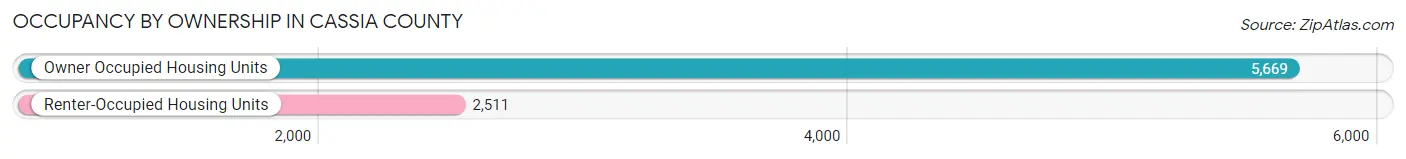
| Occupancy | # Housing Units | % Housing Units |
| Owner Occupied Housing Units | 5,669 | 69.3% |
| Renter-Occupied Housing Units | 2,511 | 30.7% |
| Total Occupied Housing Units | 8,180 | 100.0% |
Occupancy by Household Size in Cassia County
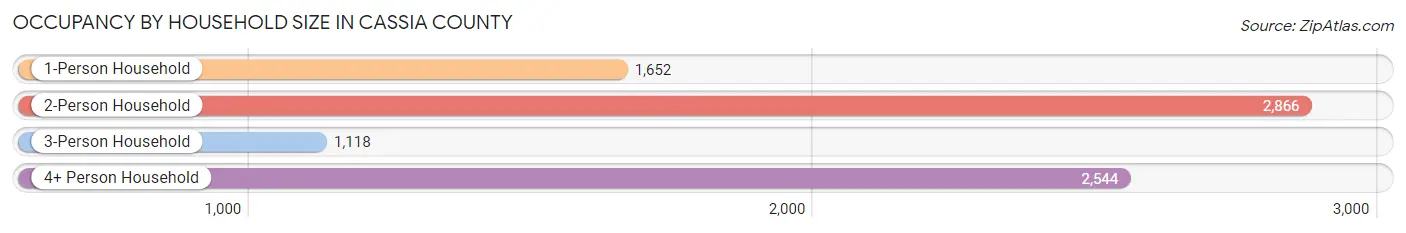
| Household Size | # Housing Units | % Housing Units |
| 1-Person Household | 1,652 | 20.2% |
| 2-Person Household | 2,866 | 35.0% |
| 3-Person Household | 1,118 | 13.7% |
| 4+ Person Household | 2,544 | 31.1% |
| Total Housing Units | 8,180 | 100.0% |
Occupancy by Ownership by Household Size in Cassia County
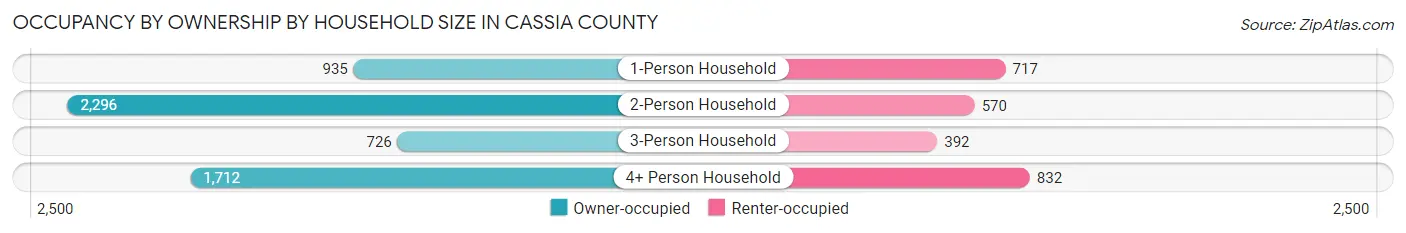
| Household Size | Owner-occupied | Renter-occupied |
| 1-Person Household | 935 (56.6%) | 717 (43.4%) |
| 2-Person Household | 2,296 (80.1%) | 570 (19.9%) |
| 3-Person Household | 726 (64.9%) | 392 (35.1%) |
| 4+ Person Household | 1,712 (67.3%) | 832 (32.7%) |
| Total Housing Units | 5,669 (69.3%) | 2,511 (30.7%) |
Occupancy by Educational Attainment in Cassia County
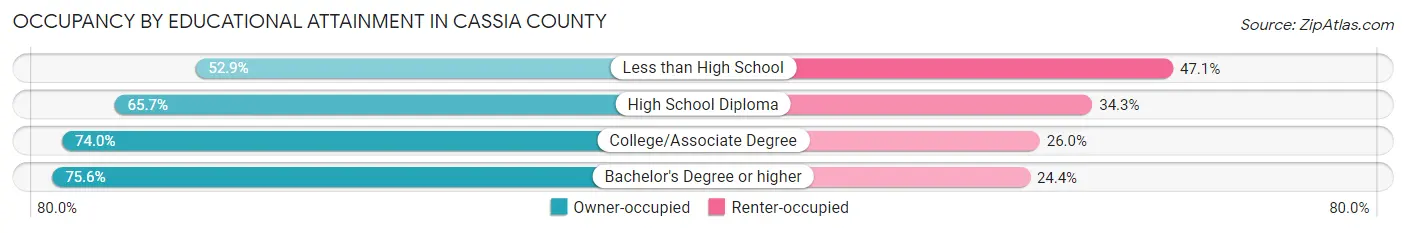
| Household Size | Owner-occupied | Renter-occupied |
| Less than High School | 555 (52.9%) | 494 (47.1%) |
| High School Diploma | 1,522 (65.7%) | 794 (34.3%) |
| College/Associate Degree | 2,287 (74.0%) | 802 (26.0%) |
| Bachelor's Degree or higher | 1,305 (75.6%) | 421 (24.4%) |
Occupancy by Age of Householder in Cassia County
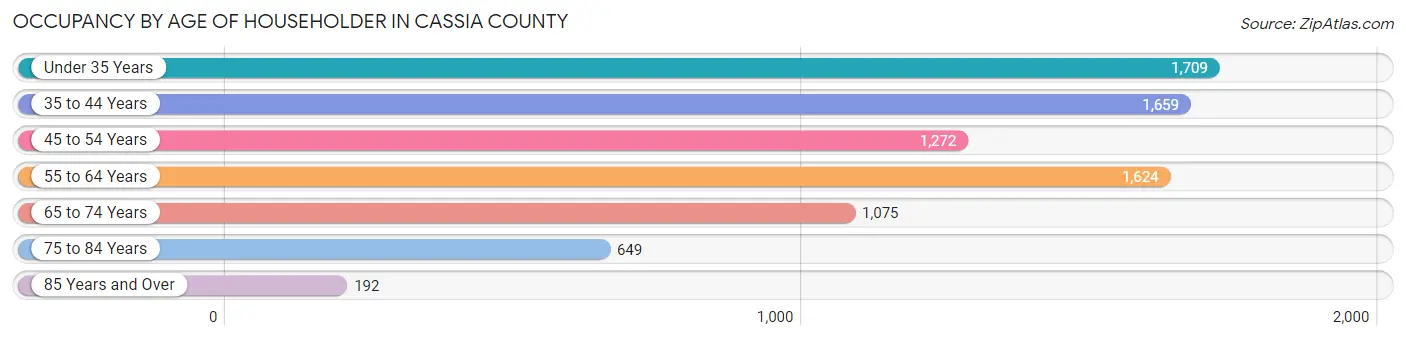
| Age Bracket | # Households | % Households |
| Under 35 Years | 1,709 | 20.9% |
| 35 to 44 Years | 1,659 | 20.3% |
| 45 to 54 Years | 1,272 | 15.5% |
| 55 to 64 Years | 1,624 | 19.9% |
| 65 to 74 Years | 1,075 | 13.1% |
| 75 to 84 Years | 649 | 7.9% |
| 85 Years and Over | 192 | 2.4% |
| Total | 8,180 | 100.0% |
Housing Finances in Cassia County
Median Income by Occupancy in Cassia County

| Occupancy Type | # Households | Median Income |
| Owner-Occupied | 5,669 (69.3%) | $72,765 |
| Renter-Occupied | 2,511 (30.7%) | $40,781 |
| Average | 8,180 (100.0%) | $63,525 |
Occupancy by Householder Income Bracket in Cassia County
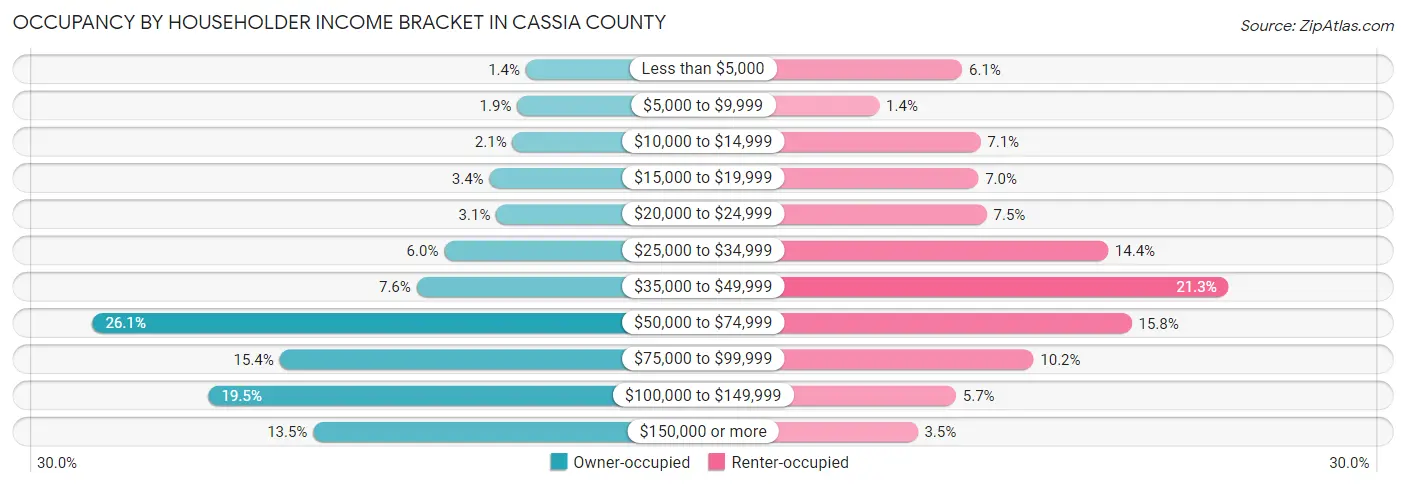
| Income Bracket | Owner-occupied | Renter-occupied |
| Less than $5,000 | 77 (1.4%) | 153 (6.1%) |
| $5,000 to $9,999 | 105 (1.8%) | 34 (1.3%) |
| $10,000 to $14,999 | 120 (2.1%) | 179 (7.1%) |
| $15,000 to $19,999 | 195 (3.4%) | 176 (7.0%) |
| $20,000 to $24,999 | 173 (3.0%) | 188 (7.5%) |
| $25,000 to $34,999 | 341 (6.0%) | 362 (14.4%) |
| $35,000 to $49,999 | 431 (7.6%) | 535 (21.3%) |
| $50,000 to $74,999 | 1,481 (26.1%) | 396 (15.8%) |
| $75,000 to $99,999 | 875 (15.4%) | 255 (10.2%) |
| $100,000 to $149,999 | 1,105 (19.5%) | 144 (5.7%) |
| $150,000 or more | 766 (13.5%) | 89 (3.5%) |
| Total | 5,669 (100.0%) | 2,511 (100.0%) |
Monthly Housing Cost Tiers in Cassia County
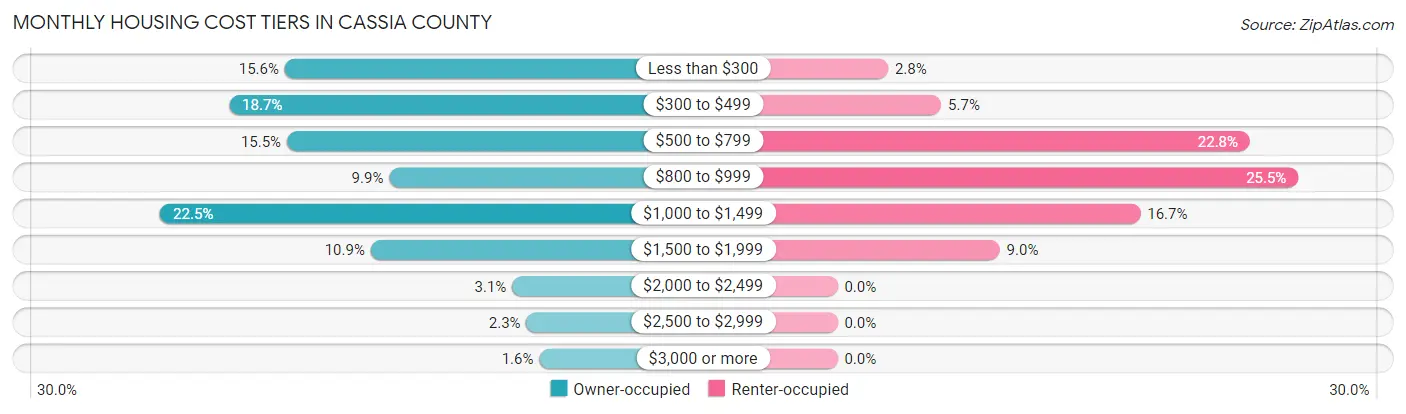
| Monthly Cost | Owner-occupied | Renter-occupied |
| Less than $300 | 886 (15.6%) | 70 (2.8%) |
| $300 to $499 | 1,060 (18.7%) | 144 (5.7%) |
| $500 to $799 | 879 (15.5%) | 572 (22.8%) |
| $800 to $999 | 559 (9.9%) | 639 (25.5%) |
| $1,000 to $1,499 | 1,276 (22.5%) | 420 (16.7%) |
| $1,500 to $1,999 | 617 (10.9%) | 225 (9.0%) |
| $2,000 to $2,499 | 174 (3.1%) | 0 (0.0%) |
| $2,500 to $2,999 | 129 (2.3%) | 0 (0.0%) |
| $3,000 or more | 89 (1.6%) | 0 (0.0%) |
| Total | 5,669 (100.0%) | 2,511 (100.0%) |
Physical Housing Characteristics in Cassia County
Housing Structures in Cassia County
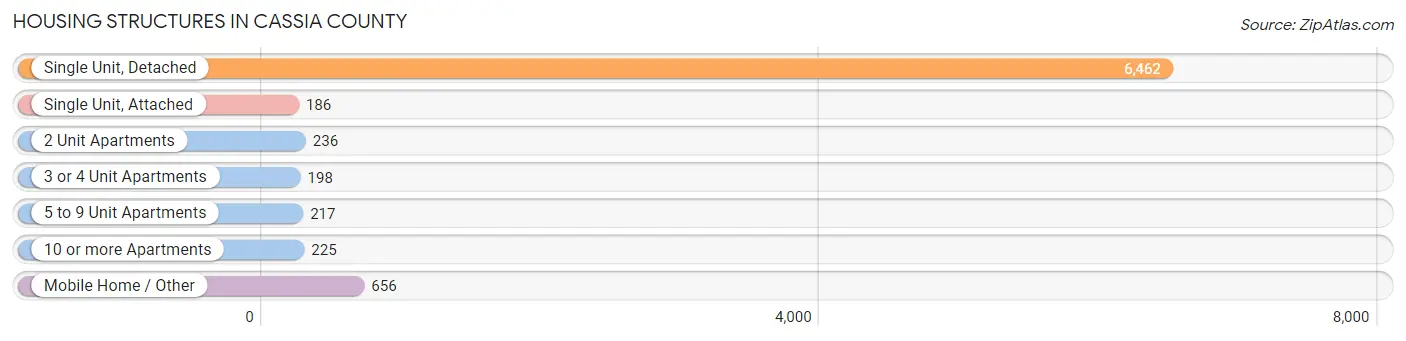
| Structure Type | # Housing Units | % Housing Units |
| Single Unit, Detached | 6,462 | 79.0% |
| Single Unit, Attached | 186 | 2.3% |
| 2 Unit Apartments | 236 | 2.9% |
| 3 or 4 Unit Apartments | 198 | 2.4% |
| 5 to 9 Unit Apartments | 217 | 2.6% |
| 10 or more Apartments | 225 | 2.8% |
| Mobile Home / Other | 656 | 8.0% |
| Total | 8,180 | 100.0% |
Housing Structures by Occupancy in Cassia County

| Structure Type | Owner-occupied | Renter-occupied |
| Single Unit, Detached | 5,135 (79.5%) | 1,327 (20.5%) |
| Single Unit, Attached | 75 (40.3%) | 111 (59.7%) |
| 2 Unit Apartments | 30 (12.7%) | 206 (87.3%) |
| 3 or 4 Unit Apartments | 0 (0.0%) | 198 (100.0%) |
| 5 to 9 Unit Apartments | 3 (1.4%) | 214 (98.6%) |
| 10 or more Apartments | 0 (0.0%) | 225 (100.0%) |
| Mobile Home / Other | 426 (64.9%) | 230 (35.1%) |
| Total | 5,669 (69.3%) | 2,511 (30.7%) |
Housing Structures by Number of Rooms in Cassia County
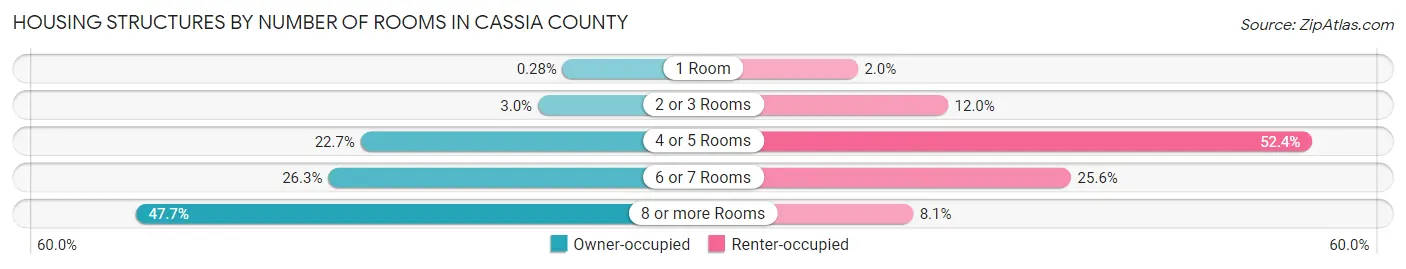
| Number of Rooms | Owner-occupied | Renter-occupied |
| 1 Room | 16 (0.3%) | 49 (1.9%) |
| 2 or 3 Rooms | 172 (3.0%) | 300 (11.9%) |
| 4 or 5 Rooms | 1,287 (22.7%) | 1,316 (52.4%) |
| 6 or 7 Rooms | 1,491 (26.3%) | 643 (25.6%) |
| 8 or more Rooms | 2,703 (47.7%) | 203 (8.1%) |
| Total | 5,669 (100.0%) | 2,511 (100.0%) |
Housing Structure by Heating Type in Cassia County
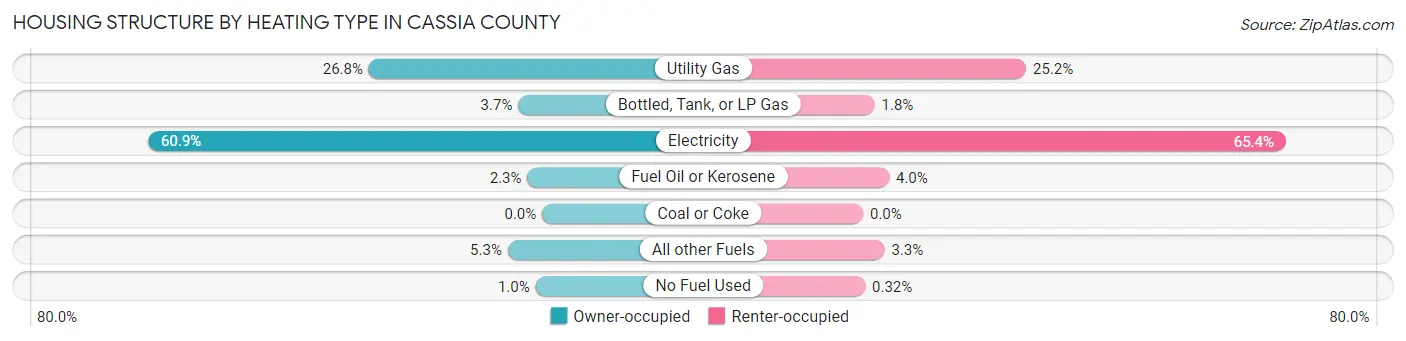
| Heating Type | Owner-occupied | Renter-occupied |
| Utility Gas | 1,519 (26.8%) | 633 (25.2%) |
| Bottled, Tank, or LP Gas | 209 (3.7%) | 45 (1.8%) |
| Electricity | 3,454 (60.9%) | 1,641 (65.3%) |
| Fuel Oil or Kerosene | 129 (2.3%) | 101 (4.0%) |
| Coal or Coke | 0 (0.0%) | 0 (0.0%) |
| All other Fuels | 301 (5.3%) | 83 (3.3%) |
| No Fuel Used | 57 (1.0%) | 8 (0.3%) |
| Total | 5,669 (100.0%) | 2,511 (100.0%) |
Household Vehicle Usage in Cassia County
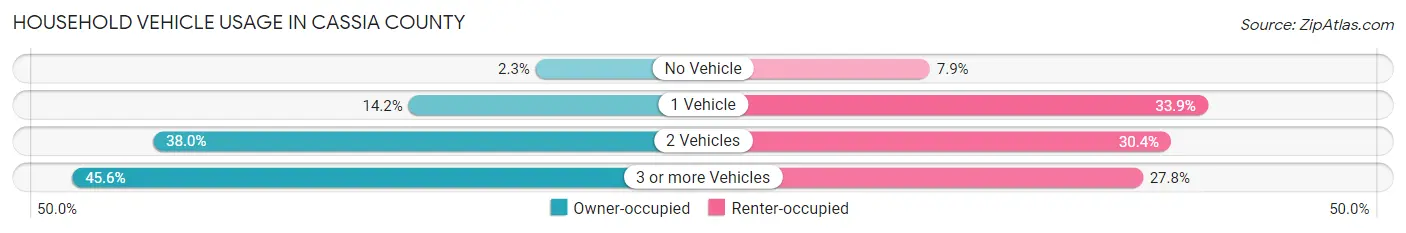
| Vehicles per Household | Owner-occupied | Renter-occupied |
| No Vehicle | 130 (2.3%) | 199 (7.9%) |
| 1 Vehicle | 803 (14.2%) | 850 (33.9%) |
| 2 Vehicles | 2,154 (38.0%) | 764 (30.4%) |
| 3 or more Vehicles | 2,582 (45.6%) | 698 (27.8%) |
| Total | 5,669 (100.0%) | 2,511 (100.0%) |
Real Estate & Mortgages in Cassia County
Real Estate and Mortgage Overview in Cassia County
| Characteristic | Without Mortgage | With Mortgage |
| Housing Units | 2,589 | 3,080 |
| Median Property Value | $193,800 | $242,100 |
| Median Household Income | $63,349 | $457 |
| Monthly Housing Costs | $369 | $89 |
| Real Estate Taxes | $959 | $166 |
Property Value by Mortgage Status in Cassia County
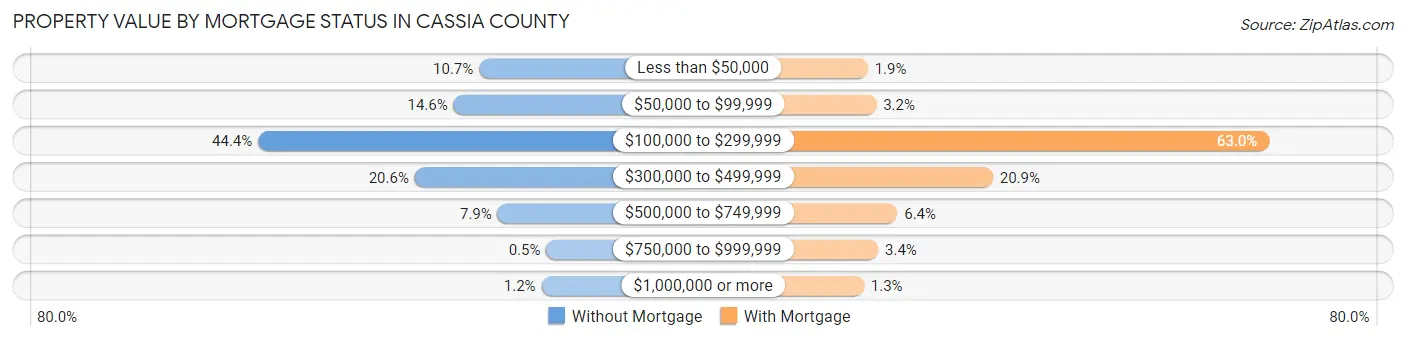
| Property Value | Without Mortgage | With Mortgage |
| Less than $50,000 | 278 (10.7%) | 57 (1.8%) |
| $50,000 to $99,999 | 379 (14.6%) | 97 (3.2%) |
| $100,000 to $299,999 | 1,150 (44.4%) | 1,941 (63.0%) |
| $300,000 to $499,999 | 532 (20.5%) | 644 (20.9%) |
| $500,000 to $749,999 | 205 (7.9%) | 196 (6.4%) |
| $750,000 to $999,999 | 13 (0.5%) | 106 (3.4%) |
| $1,000,000 or more | 32 (1.2%) | 39 (1.3%) |
| Total | 2,589 (100.0%) | 3,080 (100.0%) |
Household Income by Mortgage Status in Cassia County
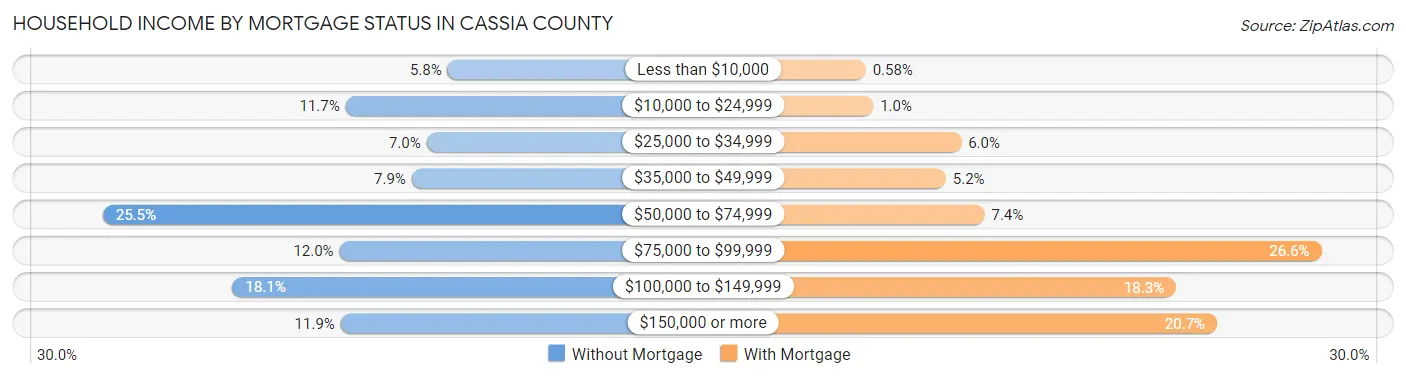
| Household Income | Without Mortgage | With Mortgage |
| Less than $10,000 | 151 (5.8%) | 18 (0.6%) |
| $10,000 to $24,999 | 302 (11.7%) | 31 (1.0%) |
| $25,000 to $34,999 | 182 (7.0%) | 186 (6.0%) |
| $35,000 to $49,999 | 204 (7.9%) | 159 (5.2%) |
| $50,000 to $74,999 | 661 (25.5%) | 227 (7.4%) |
| $75,000 to $99,999 | 311 (12.0%) | 820 (26.6%) |
| $100,000 to $149,999 | 469 (18.1%) | 564 (18.3%) |
| $150,000 or more | 309 (11.9%) | 636 (20.6%) |
| Total | 2,589 (100.0%) | 3,080 (100.0%) |
Property Value to Household Income Ratio in Cassia County
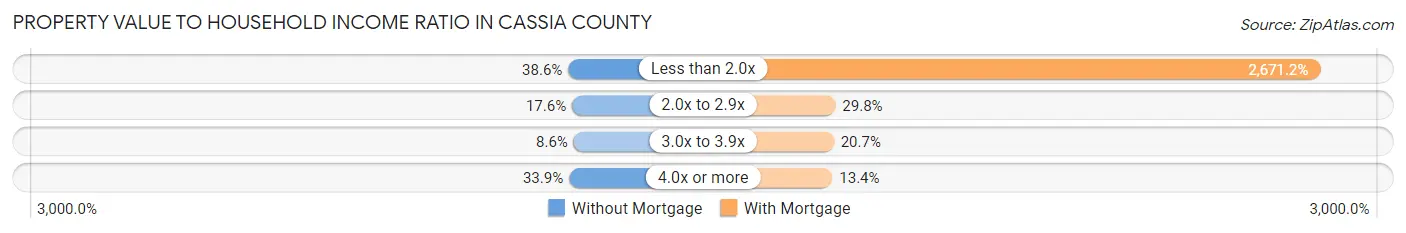
| Value-to-Income Ratio | Without Mortgage | With Mortgage |
| Less than 2.0x | 998 (38.6%) | 82,273 (2,671.2%) |
| 2.0x to 2.9x | 455 (17.6%) | 918 (29.8%) |
| 3.0x to 3.9x | 223 (8.6%) | 636 (20.6%) |
| 4.0x or more | 877 (33.9%) | 412 (13.4%) |
| Total | 2,589 (100.0%) | 3,080 (100.0%) |
Real Estate Taxes by Mortgage Status in Cassia County
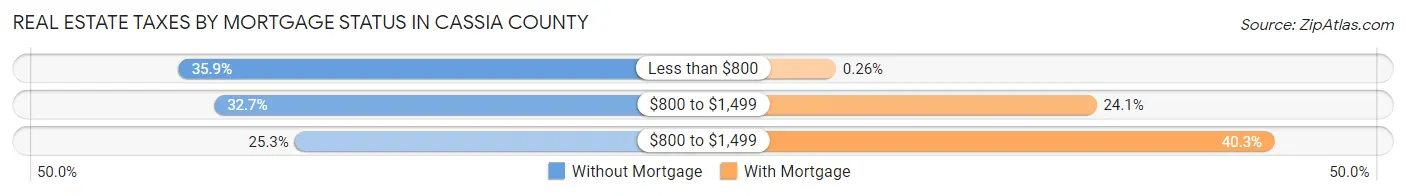
| Property Taxes | Without Mortgage | With Mortgage |
| Less than $800 | 930 (35.9%) | 8 (0.3%) |
| $800 to $1,499 | 846 (32.7%) | 741 (24.1%) |
| $800 to $1,499 | 656 (25.3%) | 1,240 (40.3%) |
| Total | 2,589 (100.0%) | 3,080 (100.0%) |
Health & Disability in Cassia County
Health Insurance Coverage by Age in Cassia County
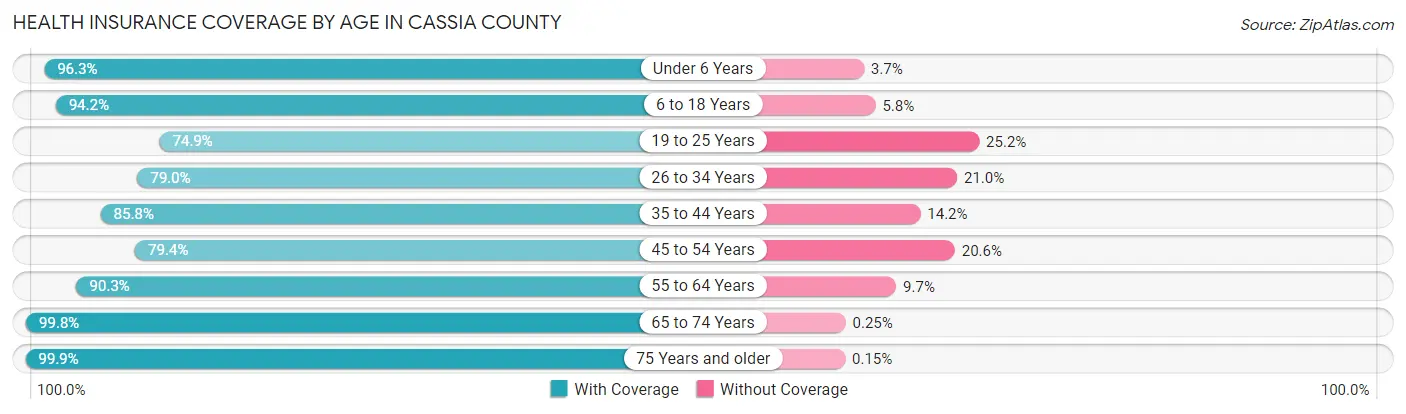
| Age Bracket | With Coverage | Without Coverage |
| Under 6 Years | 2,345 (96.3%) | 89 (3.7%) |
| 6 to 18 Years | 5,305 (94.2%) | 327 (5.8%) |
| 19 to 25 Years | 1,589 (74.9%) | 534 (25.2%) |
| 26 to 34 Years | 2,145 (79.0%) | 571 (21.0%) |
| 35 to 44 Years | 2,681 (85.8%) | 443 (14.2%) |
| 45 to 54 Years | 1,964 (79.4%) | 510 (20.6%) |
| 55 to 64 Years | 2,390 (90.3%) | 256 (9.7%) |
| 65 to 74 Years | 1,988 (99.8%) | 5 (0.3%) |
| 75 Years and older | 1,356 (99.9%) | 2 (0.2%) |
| Total | 21,763 (88.8%) | 2,737 (11.2%) |
Health Insurance Coverage by Citizenship Status in Cassia County
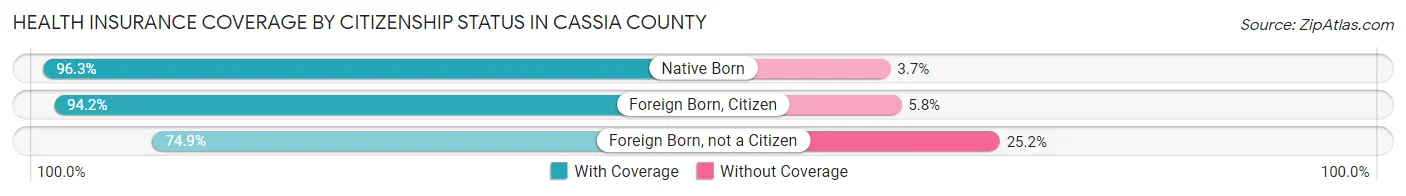
| Citizenship Status | With Coverage | Without Coverage |
| Native Born | 2,345 (96.3%) | 89 (3.7%) |
| Foreign Born, Citizen | 5,305 (94.2%) | 327 (5.8%) |
| Foreign Born, not a Citizen | 1,589 (74.9%) | 534 (25.2%) |
Health Insurance Coverage by Household Income in Cassia County
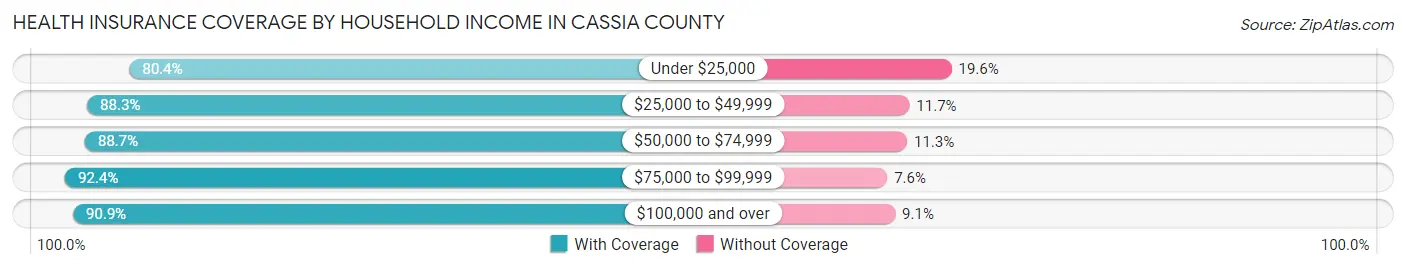
| Household Income | With Coverage | Without Coverage |
| Under $25,000 | 1,991 (80.4%) | 486 (19.6%) |
| $25,000 to $49,999 | 3,538 (88.3%) | 470 (11.7%) |
| $50,000 to $74,999 | 5,683 (88.7%) | 723 (11.3%) |
| $75,000 to $99,999 | 3,580 (92.4%) | 293 (7.6%) |
| $100,000 and over | 6,937 (90.9%) | 691 (9.1%) |
Public vs Private Health Insurance Coverage by Age in Cassia County
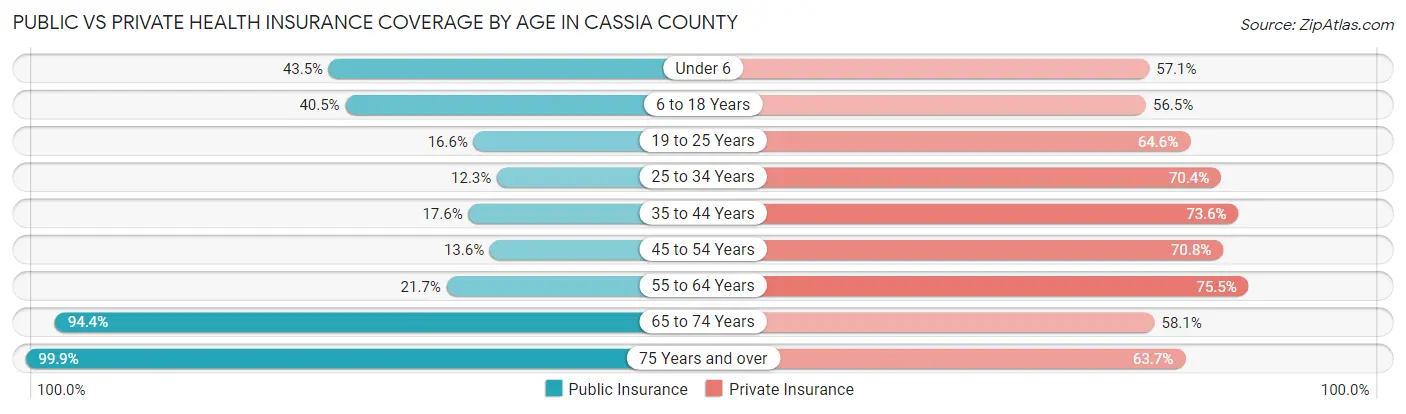
| Age Bracket | Public Insurance | Private Insurance |
| Under 6 | 1,059 (43.5%) | 1,389 (57.1%) |
| 6 to 18 Years | 2,278 (40.5%) | 3,181 (56.5%) |
| 19 to 25 Years | 353 (16.6%) | 1,372 (64.6%) |
| 25 to 34 Years | 334 (12.3%) | 1,912 (70.4%) |
| 35 to 44 Years | 550 (17.6%) | 2,300 (73.6%) |
| 45 to 54 Years | 337 (13.6%) | 1,751 (70.8%) |
| 55 to 64 Years | 573 (21.7%) | 1,998 (75.5%) |
| 65 to 74 Years | 1,881 (94.4%) | 1,157 (58.1%) |
| 75 Years and over | 1,356 (99.9%) | 865 (63.7%) |
| Total | 8,721 (35.6%) | 15,925 (65.0%) |
Disability Status by Sex by Age in Cassia County
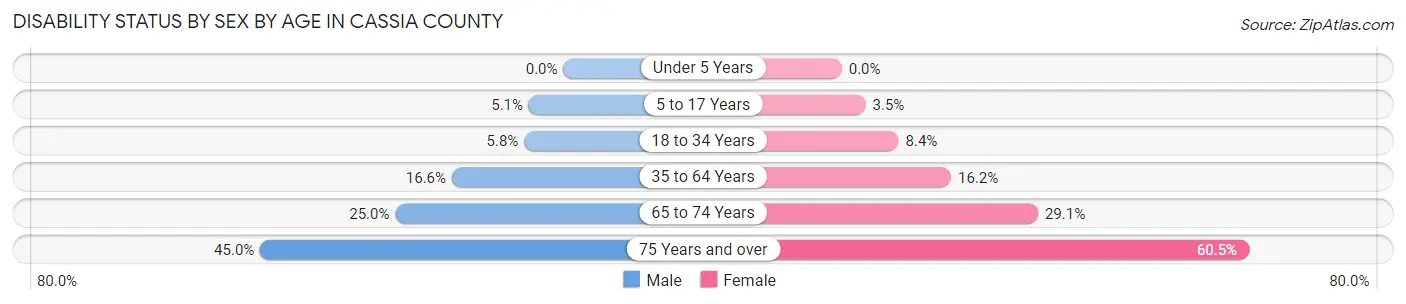
| Age Bracket | Male | Female |
| Under 5 Years | 0 (0.0%) | 0 (0.0%) |
| 5 to 17 Years | 153 (5.1%) | 98 (3.5%) |
| 18 to 34 Years | 160 (5.8%) | 207 (8.4%) |
| 35 to 64 Years | 703 (16.6%) | 649 (16.2%) |
| 65 to 74 Years | 236 (24.9%) | 305 (29.1%) |
| 75 Years and over | 271 (45.0%) | 457 (60.5%) |
Disability Class by Sex by Age in Cassia County
Disability Class: Hearing Difficulty
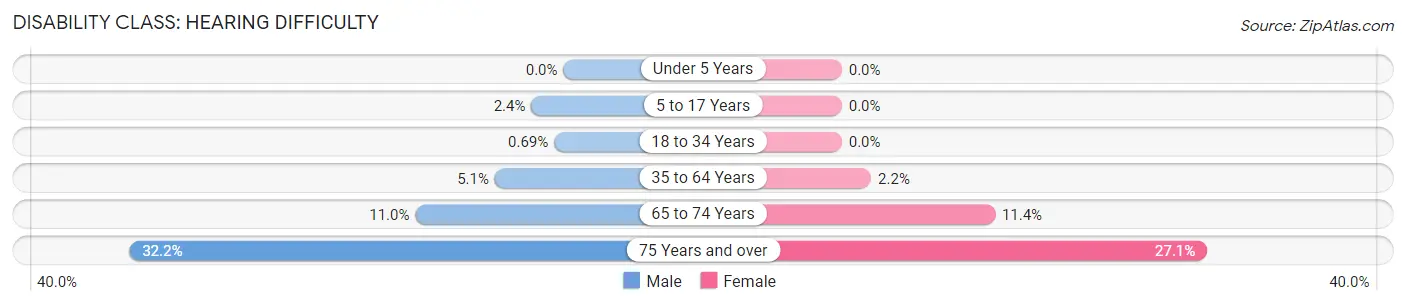
| Age Bracket | Male | Female |
| Under 5 Years | 0 (0.0%) | 0 (0.0%) |
| 5 to 17 Years | 71 (2.4%) | 0 (0.0%) |
| 18 to 34 Years | 19 (0.7%) | 0 (0.0%) |
| 35 to 64 Years | 216 (5.1%) | 87 (2.2%) |
| 65 to 74 Years | 104 (11.0%) | 119 (11.4%) |
| 75 Years and over | 194 (32.2%) | 205 (27.1%) |
Disability Class: Vision Difficulty
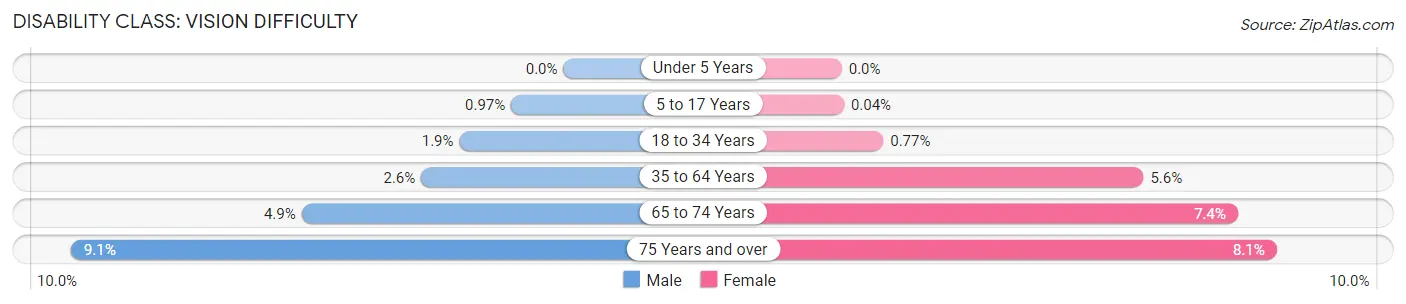
| Age Bracket | Male | Female |
| Under 5 Years | 0 (0.0%) | 0 (0.0%) |
| 5 to 17 Years | 29 (1.0%) | 1 (0.0%) |
| 18 to 34 Years | 53 (1.9%) | 19 (0.8%) |
| 35 to 64 Years | 112 (2.6%) | 224 (5.6%) |
| 65 to 74 Years | 46 (4.9%) | 77 (7.3%) |
| 75 Years and over | 55 (9.1%) | 61 (8.1%) |
Disability Class: Cognitive Difficulty
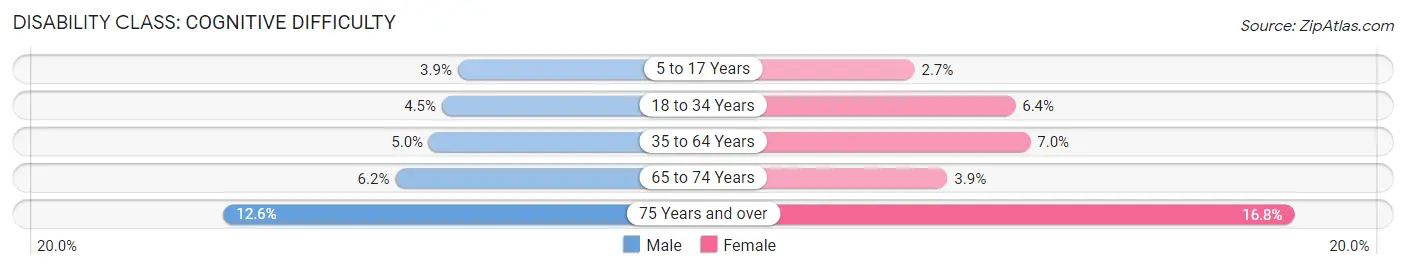
| Age Bracket | Male | Female |
| 5 to 17 Years | 117 (3.9%) | 75 (2.7%) |
| 18 to 34 Years | 124 (4.5%) | 158 (6.4%) |
| 35 to 64 Years | 212 (5.0%) | 280 (7.0%) |
| 65 to 74 Years | 59 (6.2%) | 41 (3.9%) |
| 75 Years and over | 76 (12.6%) | 127 (16.8%) |
Disability Class: Ambulatory Difficulty
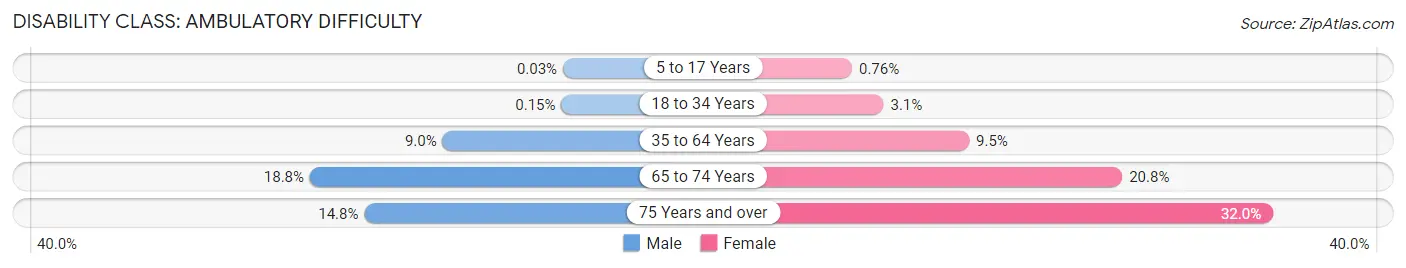
| Age Bracket | Male | Female |
| 5 to 17 Years | 1 (0.0%) | 21 (0.8%) |
| 18 to 34 Years | 4 (0.2%) | 76 (3.1%) |
| 35 to 64 Years | 381 (9.0%) | 378 (9.5%) |
| 65 to 74 Years | 178 (18.8%) | 218 (20.8%) |
| 75 Years and over | 89 (14.8%) | 242 (32.0%) |
Disability Class: Self-Care Difficulty
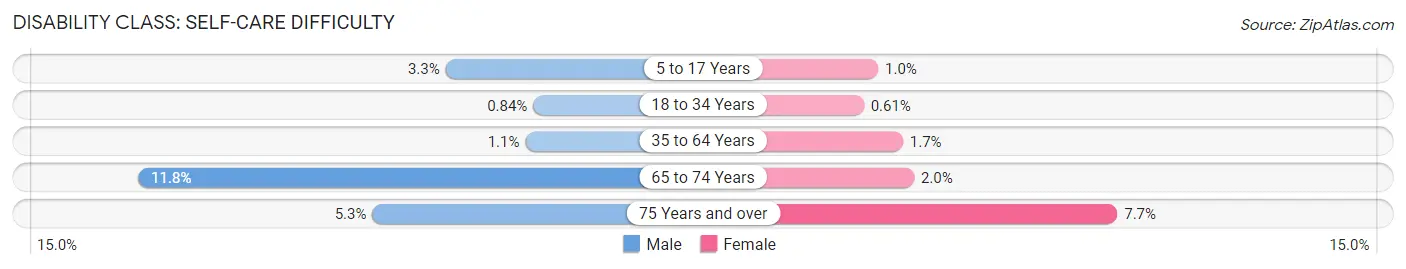
| Age Bracket | Male | Female |
| 5 to 17 Years | 98 (3.3%) | 28 (1.0%) |
| 18 to 34 Years | 23 (0.8%) | 15 (0.6%) |
| 35 to 64 Years | 45 (1.1%) | 68 (1.7%) |
| 65 to 74 Years | 112 (11.8%) | 21 (2.0%) |
| 75 Years and over | 32 (5.3%) | 58 (7.7%) |
Technology Access in Cassia County
Computing Device Access in Cassia County
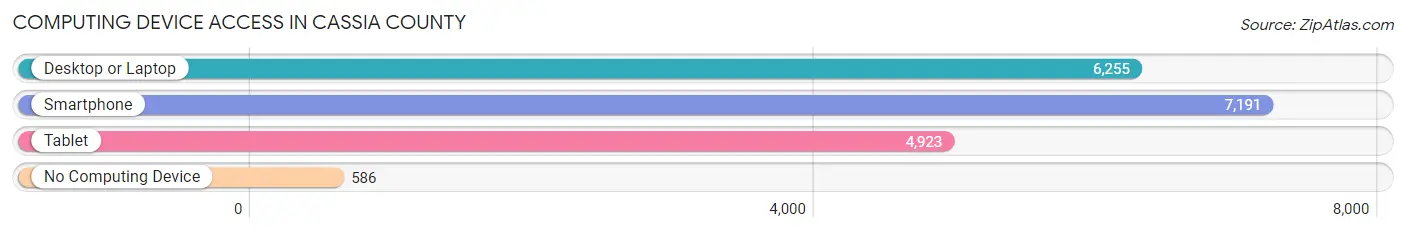
| Device Type | # Households | % Households |
| Desktop or Laptop | 6,255 | 76.5% |
| Smartphone | 7,191 | 87.9% |
| Tablet | 4,923 | 60.2% |
| No Computing Device | 586 | 7.2% |
| Total | 8,180 | 100.0% |
Internet Access in Cassia County
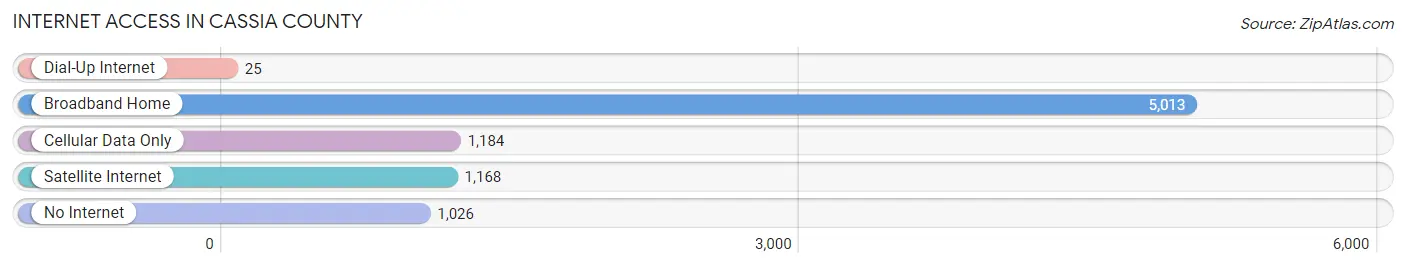
| Internet Type | # Households | % Households |
| Dial-Up Internet | 25 | 0.3% |
| Broadband Home | 5,013 | 61.3% |
| Cellular Data Only | 1,184 | 14.5% |
| Satellite Internet | 1,168 | 14.3% |
| No Internet | 1,026 | 12.5% |
| Total | 8,180 | 100.0% |
Cassia County Summary
Cassia County is located in the south-central region of the state of Idaho, in the United States. It is bordered by Twin Falls County to the north, Minidoka County to the east, Lincoln County to the south, and Owyhee County to the west. The county seat is Burley, and the largest city is Burley. The county was established in 1879 and named after Cassia Creek, which was named after the Cassia plant, a type of shrub native to the area.
Geography
Cassia County covers an area of 2,717 square miles, making it the fourth-largest county in Idaho. The county is located in the Snake River Plain, a large area of flat land that stretches across southern Idaho. The Snake River runs through the county, and the Raft River and the Bruneau River also flow through the county. The county is mostly covered in sagebrush and grasslands, with some areas of farmland and irrigated cropland. The highest point in the county is the summit of Pilot Peak, which has an elevation of 8,717 feet.
Climate
Cassia County has a semi-arid climate, with hot summers and cold winters. The average annual temperature is 50°F, and the average annual precipitation is 11.5 inches. The county receives most of its precipitation in the form of snow, with an average of 48 inches of snowfall per year.
Demographics
As of the 2010 census, Cassia County had a population of 22,952. The population was spread out, with 51.2% of the population being female and 48.8% being male. The median age was 32.7 years, and the median household income was $41,945. The largest racial group in the county was White, making up 87.3% of the population, followed by Hispanic or Latino (7.2%), and American Indian (2.2%).
Economy
Agriculture is the main economic activity in Cassia County. The county is home to many farms, and the main crops grown in the county are potatoes, sugar beets, alfalfa, and wheat. The county is also home to many dairies, and the dairy industry is a major contributor to the local economy. Other industries in the county include manufacturing, retail, and tourism.
History
Cassia County was established in 1879, and was named after Cassia Creek, which was named after the Cassia plant, a type of shrub native to the area. The county was originally inhabited by the Shoshone and Bannock Native American tribes. The first settlers in the county were Mormon pioneers, who arrived in the area in the late 1800s. The county was primarily an agricultural area, and the main crops grown in the county were potatoes, sugar beets, alfalfa, and wheat.
In the early 1900s, the county experienced a population boom due to the construction of the Oregon Short Line Railroad. The railroad brought many new settlers to the area, and the county's population grew rapidly. The county also experienced an economic boom during this time, as the railroad allowed for the transportation of goods and services to and from the county.
In the late 1900s, the county experienced a decline in population due to the decline of the railroad industry. However, the county has since experienced a resurgence in population and economic activity due to the growth of the dairy industry and the expansion of the retail and tourism industries.
Today, Cassia County is a thriving agricultural and economic center in southern Idaho. The county is home to many farms, dairies, and businesses, and is a popular tourist destination. The county is also home to many recreational activities, such as fishing, hunting, camping, and hiking.
Common Questions
What is the Total Population of Cassia County?
Total Population of Cassia County is 24,859.
What is the Total Male Population of Cassia County?
Total Male Population of Cassia County is 12,741.
What is the Total Female Population of Cassia County?
Total Female Population of Cassia County is 12,118.
What is the Ratio of Males per 100 Females in Cassia County?
There are 105.14 Males per 100 Females in Cassia County.
What is the Ratio of Females per 100 Males in Cassia County?
There are 95.11 Females per 100 Males in Cassia County.
What is the Median Population Age in Cassia County?
Median Population Age in Cassia County is 33.1 Years.
What is the Average Family Size in Cassia County
Average Family Size in Cassia County is 3.5 People.
What is the Average Household Size in Cassia County
Average Household Size in Cassia County is 3.0 People.
What is Per Capita Income in Cassia County?
Per Capita income in Cassia County is $28,986.
What is the Median Family Income in Cassia County?
Median Family Income in Cassia County is $70,264.
What is the Median Household income in Cassia County?
Median Household Income in Cassia County is $63,525.
What is Income or Wage Gap in Cassia County?
Income or Wage Gap in Cassia County is 41.8%.
Women in Cassia County earn 58.2 cents for every dollar earned by a man.
What is Family Income Deficit in Cassia County?
Family Income Deficit in Cassia County is $14,018.
Families that are below poverty line in Cassia County earn $14,018 less on average than the poverty threshold level.
What is Inequality or Gini Index in Cassia County?
Inequality or Gini Index in Cassia County is 0.45.
How Large is the Labor Force in Cassia County?
There are 11,852 People in the Labor Forcein in Cassia County.
What is the Percentage of People in the Labor Force in Cassia County?
65.4% of People are in the Labor Force in Cassia County.
What is the Unemployment Rate in Cassia County?
Unemployment Rate in Cassia County is 3.0%.