Caribou County, ID
Caribou County Map
Caribou County Overview
7,058
TOTAL POPULATION
3,704
MALE POPULATION
3,354
FEMALE POPULATION
110.44
MALES / 100 FEMALES
90.55
FEMALES / 100 MALES
37.9
MEDIAN AGE
3.5
AVG FAMILY SIZE
2.8
AVG HOUSEHOLD SIZE
$29,819
PER CAPITA INCOME
$78,750
AVG FAMILY INCOME
$65,380
AVG HOUSEHOLD INCOME
57.4%
WAGE / INCOME GAP [ % ]
42.6¢/ $1
WAGE / INCOME GAP [ $ ]
0.40
INEQUALITY / GINI INDEX
3,479
LABOR FORCE [ PEOPLE ]
63.9%
PERCENT IN LABOR FORCE
2.8%
UNEMPLOYMENT RATE
Caribou County Area Codes
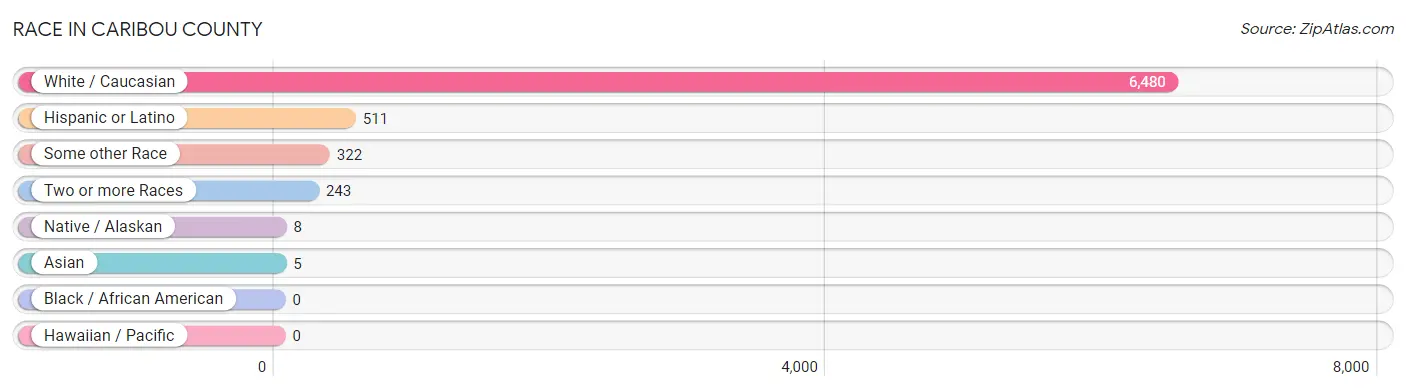
Race in Caribou County
The most populous races in Caribou County are White / Caucasian (6,480 | 91.8%), Hispanic or Latino (511 | 7.2%), and Some other Race (322 | 4.6%).
| Race | # Population | % Population |
| Asian | 5 | 0.1% |
| Black / African American | 0 | 0.0% |
| Hawaiian / Pacific | 0 | 0.0% |
| Hispanic or Latino | 511 | 7.2% |
| Native / Alaskan | 8 | 0.1% |
| White / Caucasian | 6,480 | 91.8% |
| Two or more Races | 243 | 3.4% |
| Some other Race | 322 | 4.6% |
| Total | 7,058 | 100.0% |
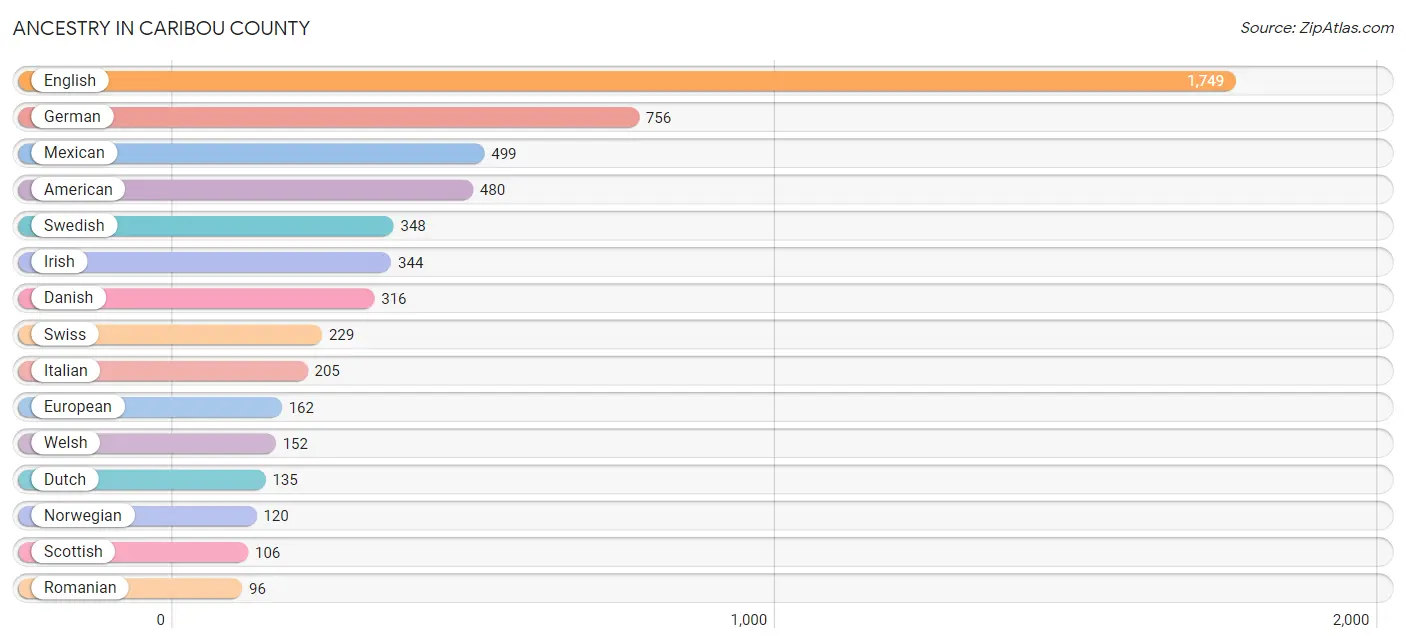
Ancestry in Caribou County
The most populous ancestries reported in Caribou County are English (1,749 | 24.8%), German (756 | 10.7%), Mexican (499 | 7.1%), American (480 | 6.8%), and Swedish (348 | 4.9%), together accounting for 54.3% of all Caribou County residents.
| Ancestry | # Population | % Population |
| American | 480 | 6.8% |
| Austrian | 3 | 0.0% |
| Basque | 18 | 0.3% |
| Bhutanese | 43 | 0.6% |
| Blackfeet | 11 | 0.2% |
| British | 63 | 0.9% |
| Canadian | 10 | 0.1% |
| Central American | 10 | 0.1% |
| Cherokee | 2 | 0.0% |
| Choctaw | 1 | 0.0% |
| Czech | 5 | 0.1% |
| Danish | 316 | 4.5% |
| Delaware | 1 | 0.0% |
| Dutch | 135 | 1.9% |
| Eastern European | 2 | 0.0% |
| English | 1,749 | 24.8% |
| European | 162 | 2.3% |
| Finnish | 56 | 0.8% |
| French | 54 | 0.8% |
| French Canadian | 11 | 0.2% |
| German | 756 | 10.7% |
| Greek | 18 | 0.3% |
| Icelander | 18 | 0.3% |
| Irish | 344 | 4.9% |
| Italian | 205 | 2.9% |
| Korean | 2 | 0.0% |
| Mexican | 499 | 7.1% |
| Native Hawaiian | 9 | 0.1% |
| Navajo | 7 | 0.1% |
| Northern European | 32 | 0.4% |
| Norwegian | 120 | 1.7% |
| Polish | 13 | 0.2% |
| Portuguese | 12 | 0.2% |
| Romanian | 96 | 1.4% |
| Russian | 5 | 0.1% |
| Salvadoran | 10 | 0.1% |
| Scandinavian | 38 | 0.5% |
| Scotch-Irish | 36 | 0.5% |
| Scottish | 106 | 1.5% |
| South African | 3 | 0.0% |
| Subsaharan African | 3 | 0.0% |
| Swedish | 348 | 4.9% |
| Swiss | 229 | 3.2% |
| Thai | 3 | 0.0% |
| Tlingit-Haida | 12 | 0.2% |
| Welsh | 152 | 2.1% | View All 46 Rows |
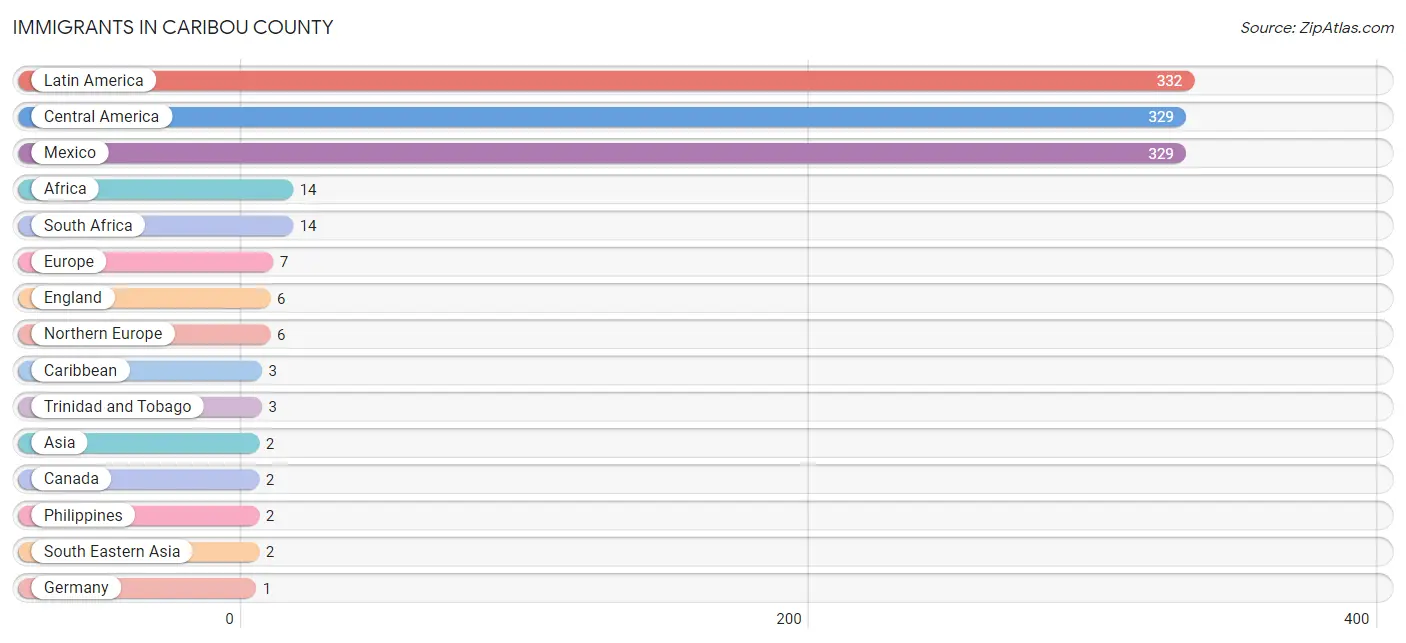
Immigrants in Caribou County
The most numerous immigrant groups reported in Caribou County came from Latin America (332 | 4.7%), Central America (329 | 4.7%), Mexico (329 | 4.7%), Africa (14 | 0.2%), and South Africa (14 | 0.2%), together accounting for 14.4% of all Caribou County residents.
| Immigration Origin | # Population | % Population |
| Africa | 14 | 0.2% |
| Asia | 2 | 0.0% |
| Canada | 2 | 0.0% |
| Caribbean | 3 | 0.0% |
| Central America | 329 | 4.7% |
| England | 6 | 0.1% |
| Europe | 7 | 0.1% |
| Germany | 1 | 0.0% |
| Latin America | 332 | 4.7% |
| Mexico | 329 | 4.7% |
| Northern Europe | 6 | 0.1% |
| Philippines | 2 | 0.0% |
| South Africa | 14 | 0.2% |
| South Eastern Asia | 2 | 0.0% |
| Trinidad and Tobago | 3 | 0.0% |
| Western Europe | 1 | 0.0% | View All 16 Rows |
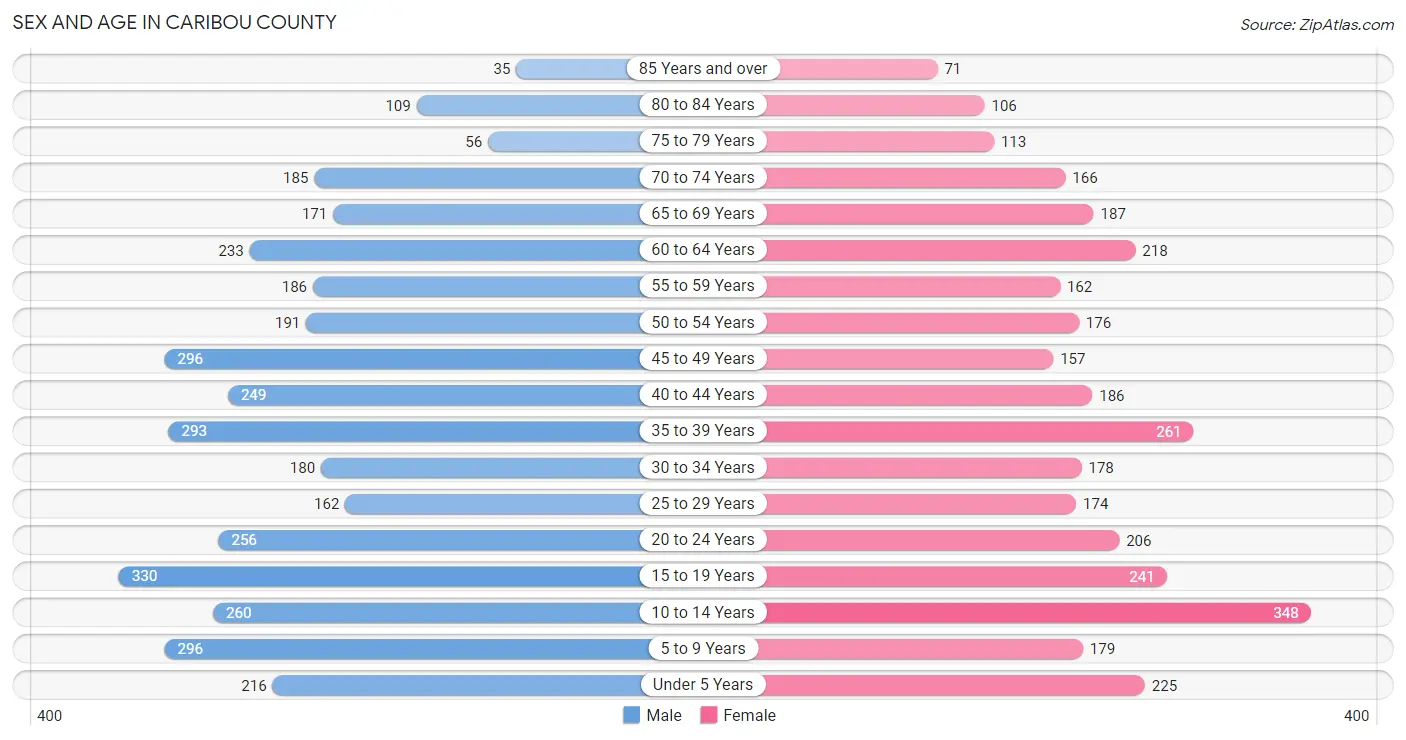
Sex and Age in Caribou County
Sex and Age in Caribou County
The most populous age groups in Caribou County are 15 to 19 Years (330 | 8.9%) for men and 10 to 14 Years (348 | 10.4%) for women.
| Age Bracket | Male | Female |
| Under 5 Years | 216 (5.8%) | 225 (6.7%) |
| 5 to 9 Years | 296 (8.0%) | 179 (5.3%) |
| 10 to 14 Years | 260 (7.0%) | 348 (10.4%) |
| 15 to 19 Years | 330 (8.9%) | 241 (7.2%) |
| 20 to 24 Years | 256 (6.9%) | 206 (6.1%) |
| 25 to 29 Years | 162 (4.4%) | 174 (5.2%) |
| 30 to 34 Years | 180 (4.9%) | 178 (5.3%) |
| 35 to 39 Years | 293 (7.9%) | 261 (7.8%) |
| 40 to 44 Years | 249 (6.7%) | 186 (5.6%) |
| 45 to 49 Years | 296 (8.0%) | 157 (4.7%) |
| 50 to 54 Years | 191 (5.2%) | 176 (5.2%) |
| 55 to 59 Years | 186 (5.0%) | 162 (4.8%) |
| 60 to 64 Years | 233 (6.3%) | 218 (6.5%) |
| 65 to 69 Years | 171 (4.6%) | 187 (5.6%) |
| 70 to 74 Years | 185 (5.0%) | 166 (5.0%) |
| 75 to 79 Years | 56 (1.5%) | 113 (3.4%) |
| 80 to 84 Years | 109 (2.9%) | 106 (3.2%) |
| 85 Years and over | 35 (0.9%) | 71 (2.1%) |
| Total | 3,704 (100.0%) | 3,354 (100.0%) |
Families and Households in Caribou County
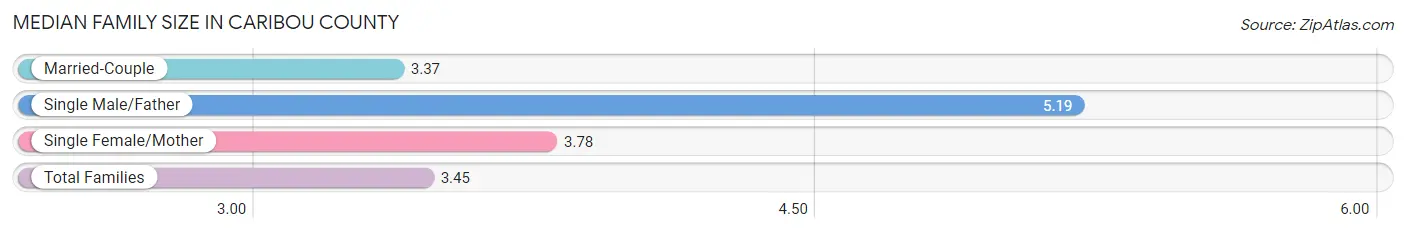
Median Family Size in Caribou County
The median family size in Caribou County is 3.45 persons per family, with single male/father families (47 | 2.7%) accounting for the largest median family size of 5.19 persons per family. On the other hand, married-couple families (1,584 | 89.7%) represent the smallest median family size with 3.37 persons per family.
| Family Type | # Families | Family Size |
| Married-Couple | 1,584 (89.7%) | 3.37 |
| Single Male/Father | 47 (2.7%) | 5.19 |
| Single Female/Mother | 134 (7.6%) | 3.78 |
| Total Families | 1,765 (100.0%) | 3.45 |
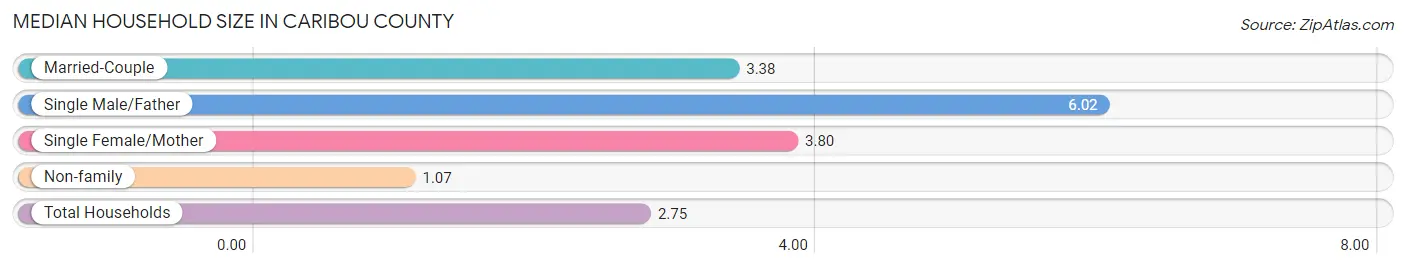
Median Household Size in Caribou County
The median household size in Caribou County is 2.75 persons per household, with single male/father households (47 | 1.9%) accounting for the largest median household size of 6.02 persons per household. non-family households (762 | 30.1%) represent the smallest median household size with 1.07 persons per household.
| Household Type | # Households | Household Size |
| Married-Couple | 1,584 (62.7%) | 3.38 |
| Single Male/Father | 47 (1.9%) | 6.02 |
| Single Female/Mother | 134 (5.3%) | 3.80 |
| Non-family | 762 (30.1%) | 1.07 |
| Total Households | 2,527 (100.0%) | 2.75 |
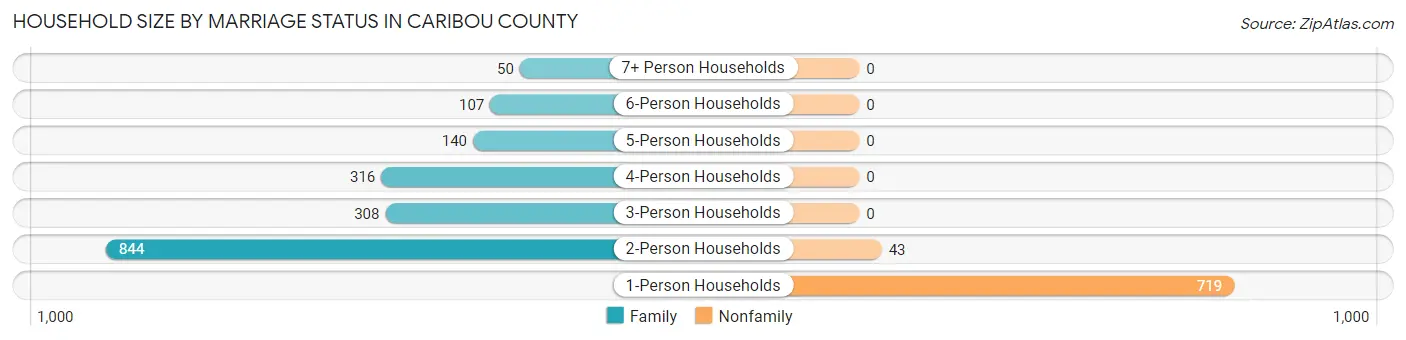
Household Size by Marriage Status in Caribou County
Out of a total of 2,527 households in Caribou County, 1,765 (69.9%) are family households, while 762 (30.1%) are nonfamily households. The most numerous type of family households are 2-person households, comprising 844, and the most common type of nonfamily households are 1-person households, comprising 719.
| Household Size | Family Households | Nonfamily Households |
| 1-Person Households | - | 719 (28.4%) |
| 2-Person Households | 844 (33.4%) | 43 (1.7%) |
| 3-Person Households | 308 (12.2%) | 0 (0.0%) |
| 4-Person Households | 316 (12.5%) | 0 (0.0%) |
| 5-Person Households | 140 (5.5%) | 0 (0.0%) |
| 6-Person Households | 107 (4.2%) | 0 (0.0%) |
| 7+ Person Households | 50 (2.0%) | 0 (0.0%) |
| Total | 1,765 (69.9%) | 762 (30.1%) |
Female Fertility in Caribou County
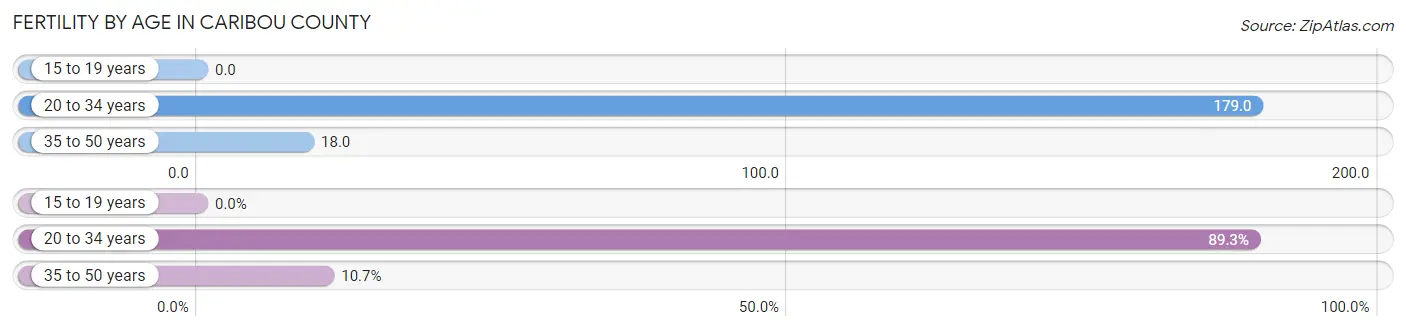
Fertility by Age in Caribou County
Average fertility rate in Caribou County is 76.0 births per 1,000 women. Women in the age bracket of 20 to 34 years have the highest fertility rate with 179.0 births per 1,000 women. Women in the age bracket of 20 to 34 years acount for 89.3% of all women with births.
| Age Bracket | Women with Births | Births / 1,000 Women |
| 15 to 19 years | 0 (0.0%) | 0.0 |
| 20 to 34 years | 100 (89.3%) | 179.0 |
| 35 to 50 years | 12 (10.7%) | 18.0 |
| Total | 112 (100.0%) | 76.0 |
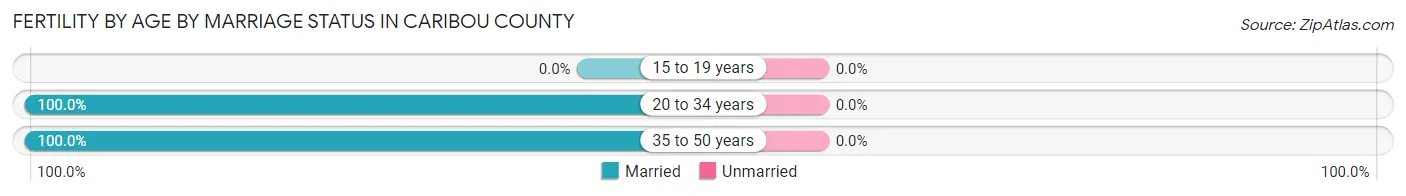
Fertility by Age by Marriage Status in Caribou County
| Age Bracket | Married | Unmarried |
| 15 to 19 years | 0 (0.0%) | 0 (0.0%) |
| 20 to 34 years | 100 (100.0%) | 0 (0.0%) |
| 35 to 50 years | 12 (100.0%) | 0 (0.0%) |
| Total | 112 (100.0%) | 0 (0.0%) |
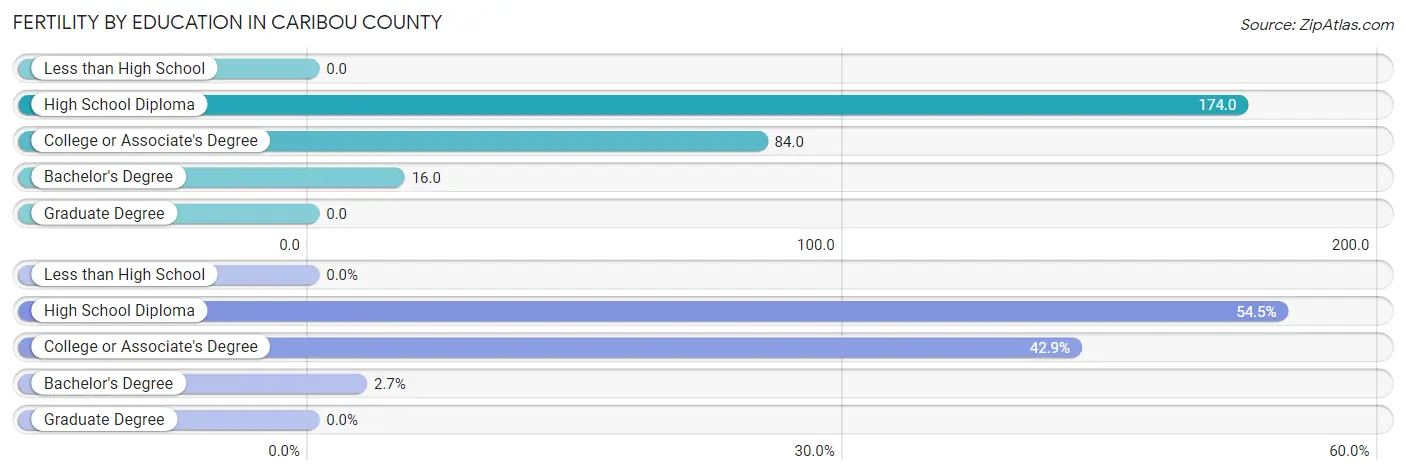
Fertility by Education in Caribou County
| Educational Attainment | Women with Births | Births / 1,000 Women |
| Less than High School | 0 (0.0%) | 0.0 |
| High School Diploma | 61 (54.5%) | 174.0 |
| College or Associate's Degree | 48 (42.9%) | 84.0 |
| Bachelor's Degree | 3 (2.7%) | 16.0 |
| Graduate Degree | 0 (0.0%) | 0.0 |
| Total | 112 (100.0%) | 76.0 |
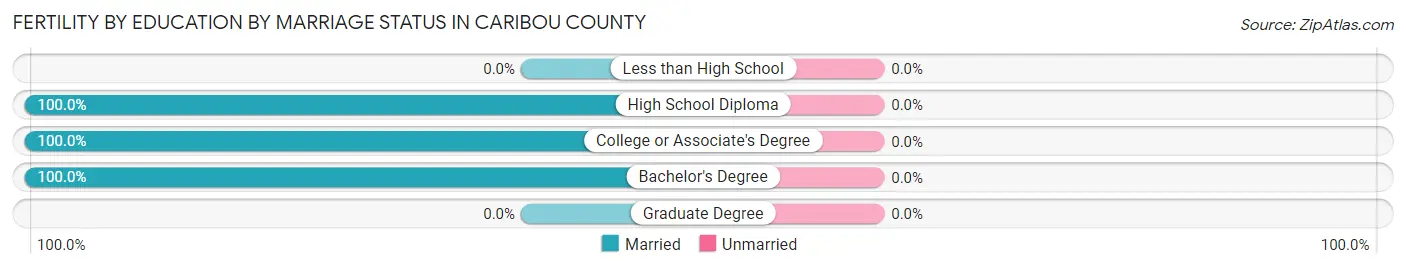
Fertility by Education by Marriage Status in Caribou County
| Educational Attainment | Married | Unmarried |
| Less than High School | 0 (0.0%) | 0 (0.0%) |
| High School Diploma | 61 (100.0%) | 0 (0.0%) |
| College or Associate's Degree | 48 (100.0%) | 0 (0.0%) |
| Bachelor's Degree | 3 (100.0%) | 0 (0.0%) |
| Graduate Degree | 0 (0.0%) | 0 (0.0%) |
| Total | 112 (100.0%) | 0 (0.0%) |
Income in Caribou County
Income Overview in Caribou County
Per Capita Income in Caribou County is $29,819, while median incomes of families and households are $78,750 and $65,380 respectively.
| Characteristic | Number | Measure |
| Per Capita Income | 7,058 | $29,819 |
| Median Family Income | 1,765 | $78,750 |
| Mean Family Income | 1,765 | $93,747 |
| Median Household Income | 2,527 | $65,380 |
| Mean Household Income | 2,527 | $77,812 |
| Income Deficit | 1,765 | $0 |
| Wage / Income Gap (%) | 7,058 | 57.45% |
| Wage / Income Gap ($) | 7,058 | 42.55¢ per $1 |
| Gini / Inequality Index | 7,058 | 0.40 |
Earnings by Sex in Caribou County
Average Earnings in Caribou County are $26,687, $40,053 for men and $17,044 for women, a difference of 57.5%.
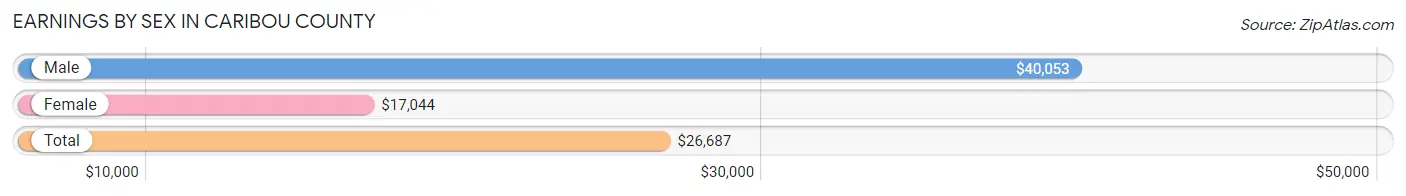
| Sex | Number | Average Earnings |
| Male | 2,324 (58.1%) | $40,053 |
| Female | 1,676 (41.9%) | $17,044 |
| Total | 4,000 (100.0%) | $26,687 |
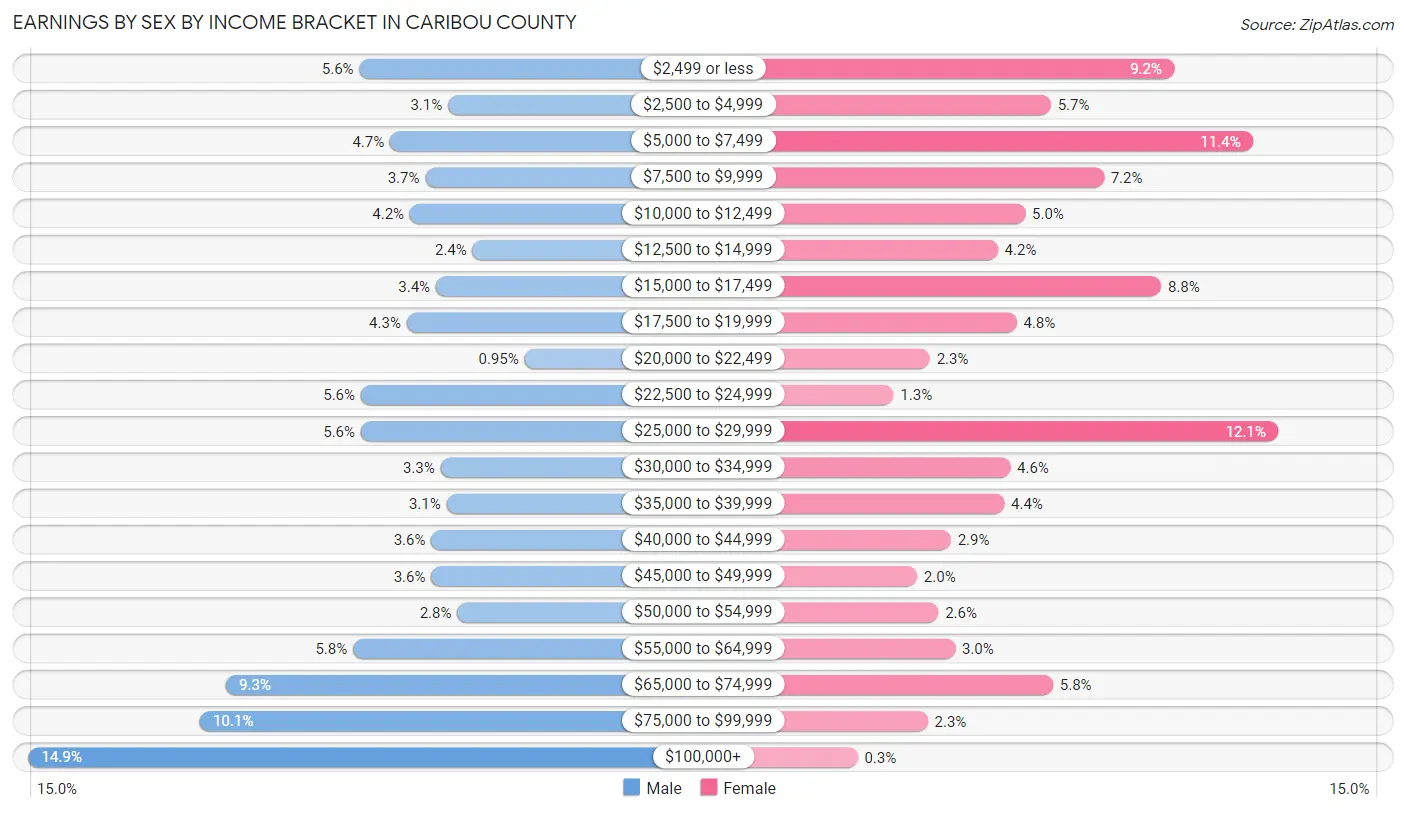
Earnings by Sex by Income Bracket in Caribou County
The most common earnings brackets in Caribou County are $100,000+ for men (346 | 14.9%) and $25,000 to $29,999 for women (203 | 12.1%).
| Income | Male | Female |
| $2,499 or less | 130 (5.6%) | 154 (9.2%) |
| $2,500 to $4,999 | 72 (3.1%) | 96 (5.7%) |
| $5,000 to $7,499 | 110 (4.7%) | 191 (11.4%) |
| $7,500 to $9,999 | 87 (3.7%) | 121 (7.2%) |
| $10,000 to $12,499 | 97 (4.2%) | 84 (5.0%) |
| $12,500 to $14,999 | 56 (2.4%) | 71 (4.2%) |
| $15,000 to $17,499 | 80 (3.4%) | 148 (8.8%) |
| $17,500 to $19,999 | 99 (4.3%) | 80 (4.8%) |
| $20,000 to $22,499 | 22 (0.9%) | 39 (2.3%) |
| $22,500 to $24,999 | 129 (5.6%) | 22 (1.3%) |
| $25,000 to $29,999 | 129 (5.6%) | 203 (12.1%) |
| $30,000 to $34,999 | 77 (3.3%) | 77 (4.6%) |
| $35,000 to $39,999 | 73 (3.1%) | 74 (4.4%) |
| $40,000 to $44,999 | 83 (3.6%) | 49 (2.9%) |
| $45,000 to $49,999 | 83 (3.6%) | 33 (2.0%) |
| $50,000 to $54,999 | 66 (2.8%) | 43 (2.6%) |
| $55,000 to $64,999 | 134 (5.8%) | 51 (3.0%) |
| $65,000 to $74,999 | 217 (9.3%) | 97 (5.8%) |
| $75,000 to $99,999 | 234 (10.1%) | 38 (2.3%) |
| $100,000+ | 346 (14.9%) | 5 (0.3%) |
| Total | 2,324 (100.0%) | 1,676 (100.0%) |
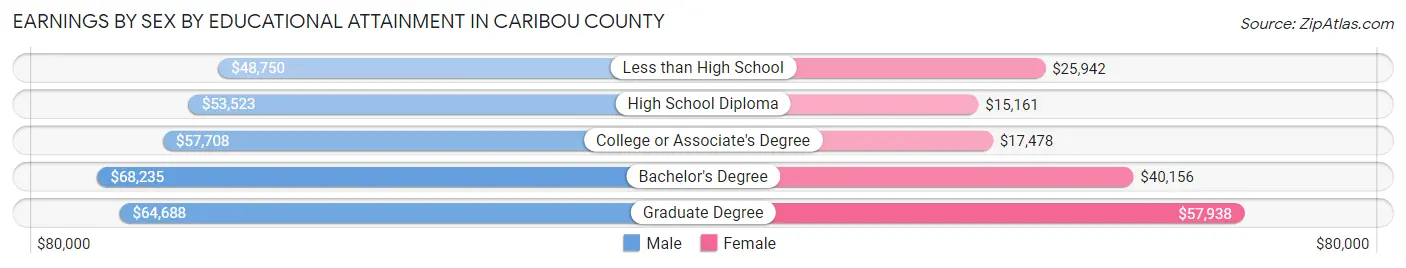
Earnings by Sex by Educational Attainment in Caribou County
Average earnings in Caribou County are $57,014 for men and $20,272 for women, a difference of 64.4%. Men with an educational attainment of bachelor's degree enjoy the highest average annual earnings of $68,235, while those with less than high school education earn the least with $48,750. Women with an educational attainment of graduate degree earn the most with the average annual earnings of $57,938, while those with high school diploma education have the smallest earnings of $15,161.
| Educational Attainment | Male Income | Female Income |
| Less than High School | $48,750 | $25,942 |
| High School Diploma | $53,523 | $15,161 |
| College or Associate's Degree | $57,708 | $17,478 |
| Bachelor's Degree | $68,235 | $40,156 |
| Graduate Degree | $64,688 | $57,938 |
| Total | $57,014 | $20,272 |
Family Income in Caribou County
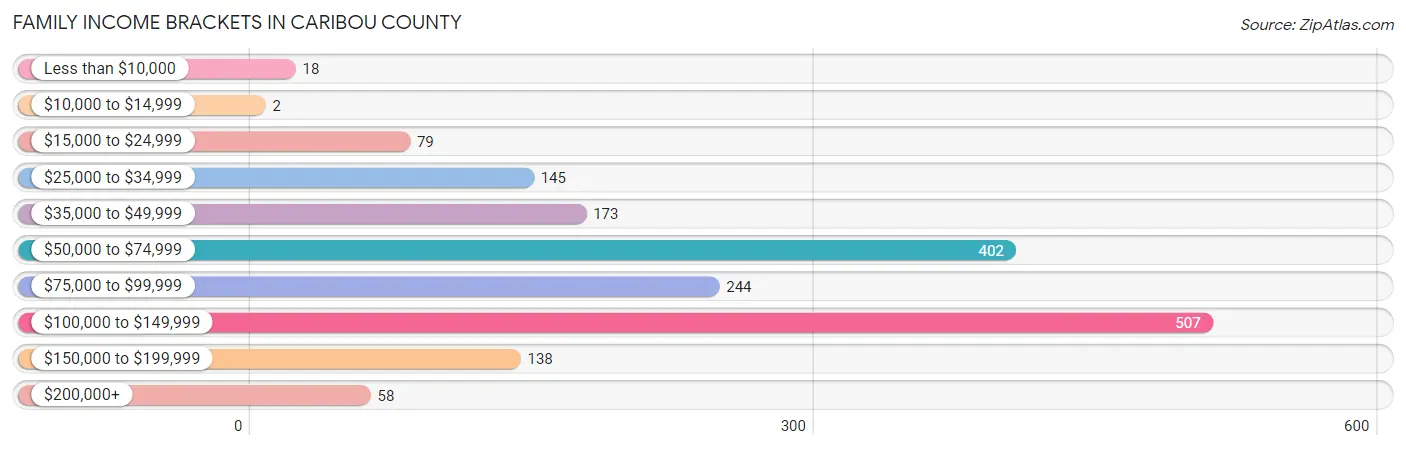
Family Income Brackets in Caribou County
According to the Caribou County family income data, there are 507 families falling into the $100,000 to $149,999 income range, which is the most common income bracket and makes up 28.7% of all families. Conversely, the $10,000 to $14,999 income bracket is the least frequent group with only 2 families (0.1%) belonging to this category.
| Income Bracket | # Families | % Families |
| Less than $10,000 | 18 | 1.0% |
| $10,000 to $14,999 | 2 | 0.1% |
| $15,000 to $24,999 | 79 | 4.5% |
| $25,000 to $34,999 | 145 | 8.2% |
| $35,000 to $49,999 | 173 | 9.8% |
| $50,000 to $74,999 | 402 | 22.8% |
| $75,000 to $99,999 | 244 | 13.8% |
| $100,000 to $149,999 | 507 | 28.7% |
| $150,000 to $199,999 | 138 | 7.8% |
| $200,000+ | 58 | 3.3% |
Family Income by Famaliy Size in Caribou County
7+ person families (45 | 2.5%) account for the highest median family income in Caribou County with $142,625 per family, while 2-person families (854 | 48.4%) have the highest median income of $35,000 per family member.
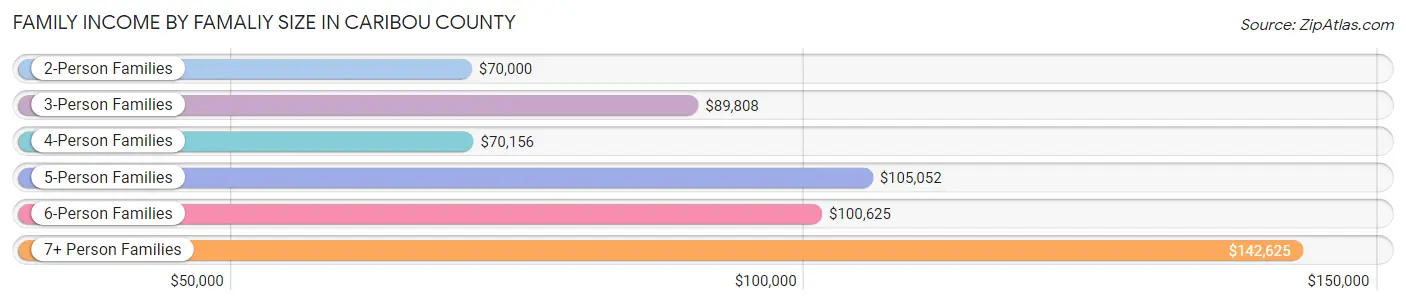
| Income Bracket | # Families | Median Income |
| 2-Person Families | 854 (48.4%) | $70,000 |
| 3-Person Families | 306 (17.3%) | $89,808 |
| 4-Person Families | 308 (17.4%) | $70,156 |
| 5-Person Families | 145 (8.2%) | $105,052 |
| 6-Person Families | 107 (6.1%) | $100,625 |
| 7+ Person Families | 45 (2.5%) | $142,625 |
| Total | 1,765 (100.0%) | $78,750 |
Family Income by Number of Earners in Caribou County
The median family income in Caribou County is $78,750, with families comprising 3+ earners (319) having the highest median family income of $122,604, while families with no earners (189) have the lowest median family income of $63,125, accounting for 18.1% and 10.7% of families, respectively.
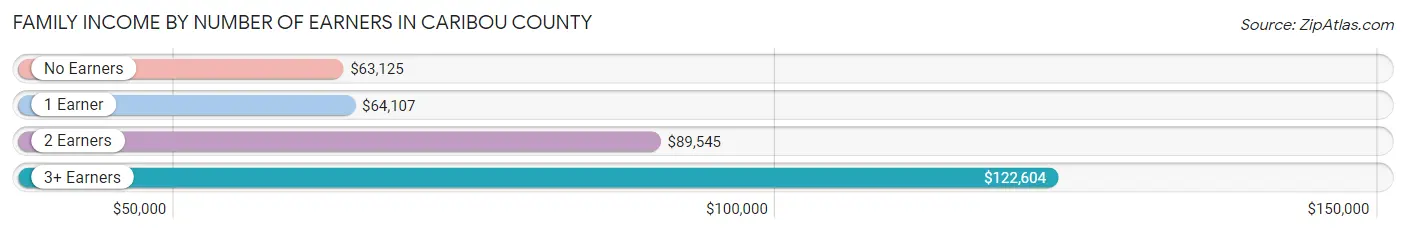
| Number of Earners | # Families | Median Income |
| No Earners | 189 (10.7%) | $63,125 |
| 1 Earner | 465 (26.4%) | $64,107 |
| 2 Earners | 792 (44.9%) | $89,545 |
| 3+ Earners | 319 (18.1%) | $122,604 |
| Total | 1,765 (100.0%) | $78,750 |
Household Income in Caribou County
Household Income Brackets in Caribou County
With 538 households falling in the category, the $100,000 to $149,999 income range is the most frequent in Caribou County, accounting for 21.3% of all households. In contrast, only 48 households (1.9%) fall into the $10,000 to $14,999 income bracket, making it the least populous group.

| Income Bracket | # Households | % Households |
| Less than $10,000 | 111 | 4.4% |
| $10,000 to $14,999 | 48 | 1.9% |
| $15,000 to $24,999 | 227 | 9.0% |
| $25,000 to $34,999 | 288 | 11.4% |
| $35,000 to $49,999 | 341 | 13.5% |
| $50,000 to $74,999 | 473 | 18.7% |
| $75,000 to $99,999 | 278 | 11.0% |
| $100,000 to $149,999 | 538 | 21.3% |
| $150,000 to $199,999 | 159 | 6.3% |
| $200,000+ | 61 | 2.4% |
Household Income by Householder Age in Caribou County
The median household income in Caribou County is $65,380, with the highest median household income of $89,167 found in the 45 to 64 years age bracket for the primary householder. A total of 906 households (35.8%) fall into this category. Meanwhile, the 15 to 24 years age bracket for the primary householder has the lowest median household income of $0, with 123 households (4.9%) in this group.
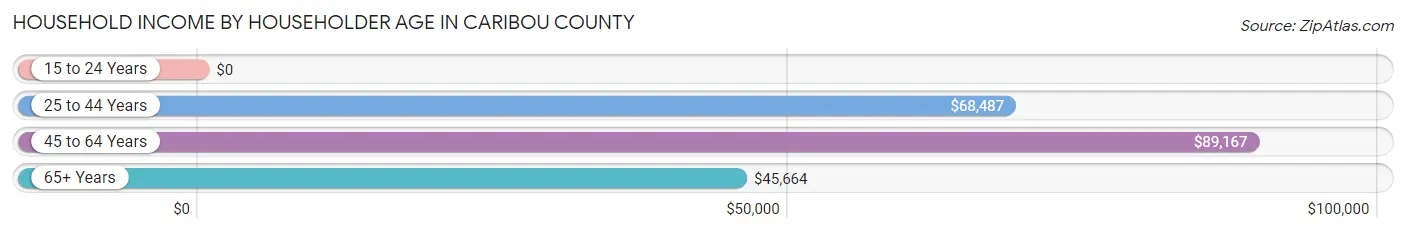
| Income Bracket | # Households | Median Income |
| 15 to 24 Years | 123 (4.9%) | $0 |
| 25 to 44 Years | 753 (29.8%) | $68,487 |
| 45 to 64 Years | 906 (35.8%) | $89,167 |
| 65+ Years | 745 (29.5%) | $45,664 |
| Total | 2,527 (100.0%) | $65,380 |
Poverty in Caribou County
Income Below Poverty by Sex and Age in Caribou County
With 7.1% poverty level for males and 6.3% for females among the residents of Caribou County, 18 to 24 year old males and 25 to 34 year old females are the most vulnerable to poverty, with 79 males (22.2%) and 75 females (21.3%) in their respective age groups living below the poverty level.
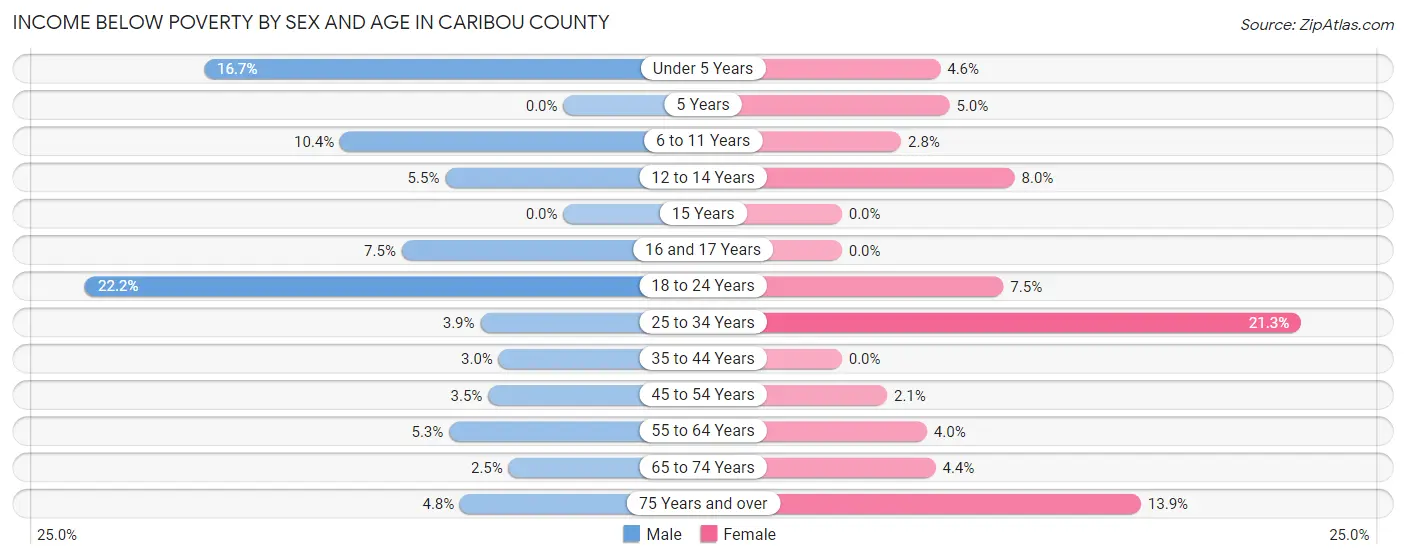
| Age Bracket | Male | Female |
| Under 5 Years | 36 (16.7%) | 10 (4.6%) |
| 5 Years | 0 (0.0%) | 2 (5.0%) |
| 6 to 11 Years | 37 (10.4%) | 6 (2.8%) |
| 12 to 14 Years | 8 (5.5%) | 21 (8.0%) |
| 15 Years | 0 (0.0%) | 0 (0.0%) |
| 16 and 17 Years | 15 (7.5%) | 0 (0.0%) |
| 18 to 24 Years | 79 (22.2%) | 18 (7.5%) |
| 25 to 34 Years | 12 (3.8%) | 75 (21.3%) |
| 35 to 44 Years | 16 (3.0%) | 0 (0.0%) |
| 45 to 54 Years | 17 (3.5%) | 7 (2.1%) |
| 55 to 64 Years | 22 (5.3%) | 15 (4.0%) |
| 65 to 74 Years | 9 (2.5%) | 15 (4.3%) |
| 75 Years and over | 9 (4.8%) | 39 (13.9%) |
| Total | 260 (7.1%) | 208 (6.3%) |
Income Above Poverty by Sex and Age in Caribou County
According to the poverty statistics in Caribou County, males aged 5 years and females aged 15 years are the age groups that are most secure financially, with 100.0% of males and 100.0% of females in these age groups living above the poverty line.
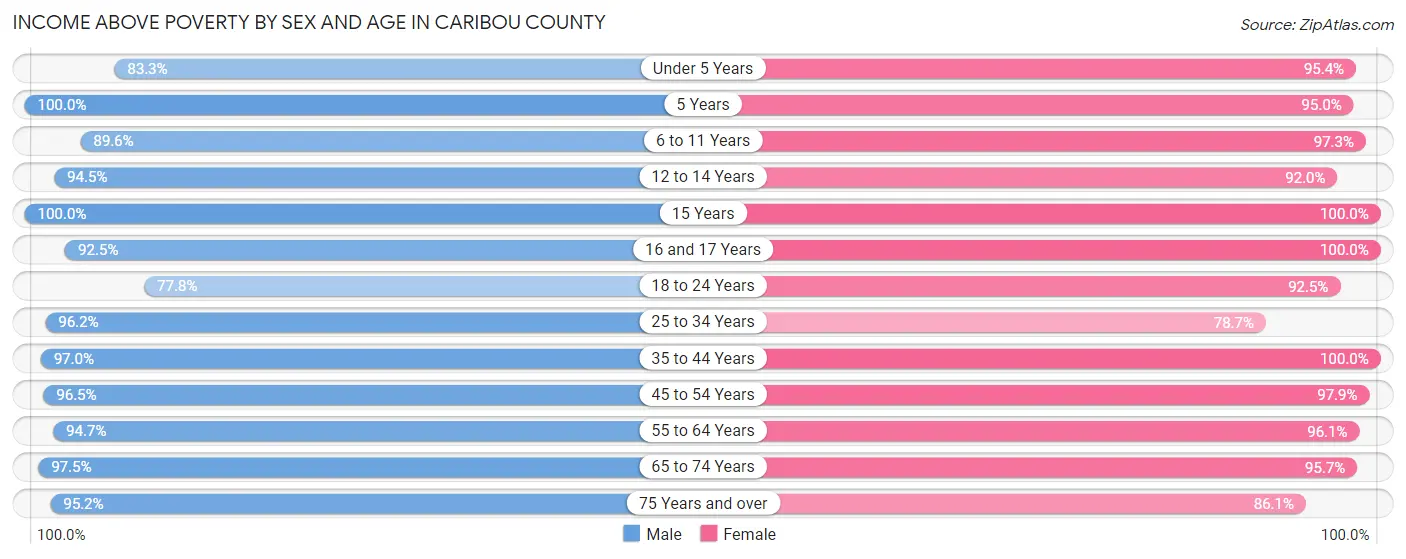
| Age Bracket | Male | Female |
| Under 5 Years | 180 (83.3%) | 209 (95.4%) |
| 5 Years | 53 (100.0%) | 38 (95.0%) |
| 6 to 11 Years | 320 (89.6%) | 212 (97.3%) |
| 12 to 14 Years | 138 (94.5%) | 241 (92.0%) |
| 15 Years | 30 (100.0%) | 60 (100.0%) |
| 16 and 17 Years | 185 (92.5%) | 147 (100.0%) |
| 18 to 24 Years | 277 (77.8%) | 222 (92.5%) |
| 25 to 34 Years | 300 (96.2%) | 277 (78.7%) |
| 35 to 44 Years | 518 (97.0%) | 443 (100.0%) |
| 45 to 54 Years | 470 (96.5%) | 326 (97.9%) |
| 55 to 64 Years | 393 (94.7%) | 365 (96.1%) |
| 65 to 74 Years | 345 (97.5%) | 330 (95.7%) |
| 75 Years and over | 179 (95.2%) | 242 (86.1%) |
| Total | 3,388 (92.9%) | 3,112 (93.7%) |
Income Below Poverty Among Married-Couple Families in Caribou County
The poverty statistics for married-couple families in Caribou County show that 3.4% or 54 of the total 1,584 families live below the poverty line. Families with 1 or 2 children have the highest poverty rate of 7.7%, comprising of 29 families. On the other hand, families with 5 or more children have the lowest poverty rate of 0.0%, which includes 0 families.
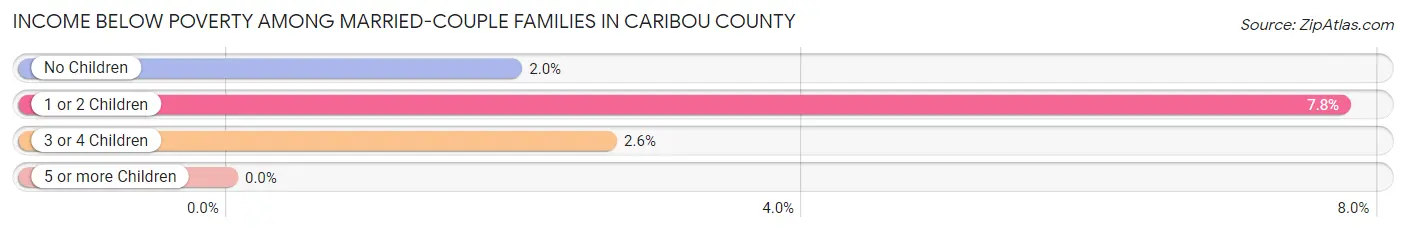
| Children | Above Poverty | Below Poverty |
| No Children | 941 (98.0%) | 19 (2.0%) |
| 1 or 2 Children | 345 (92.2%) | 29 (7.7%) |
| 3 or 4 Children | 221 (97.4%) | 6 (2.6%) |
| 5 or more Children | 23 (100.0%) | 0 (0.0%) |
| Total | 1,530 (96.6%) | 54 (3.4%) |
Income Below Poverty Among Single-Parent Households in Caribou County
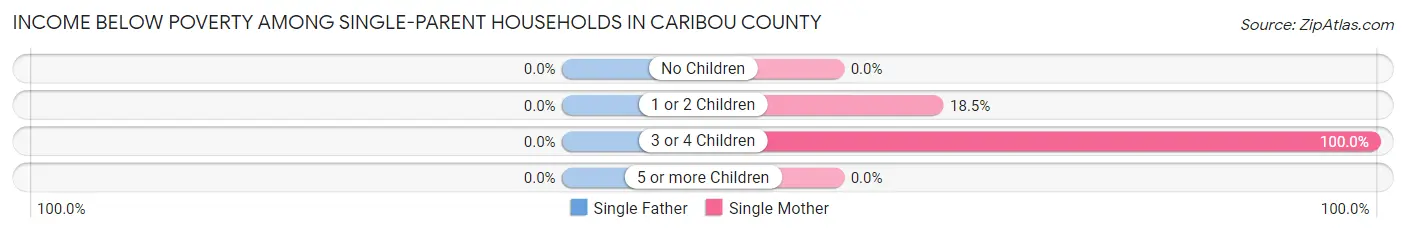
| Children | Single Father | Single Mother |
| No Children | 0 (0.0%) | 0 (0.0%) |
| 1 or 2 Children | 0 (0.0%) | 10 (18.5%) |
| 3 or 4 Children | 0 (0.0%) | 34 (100.0%) |
| 5 or more Children | 0 (0.0%) | 0 (0.0%) |
| Total | 0 (0.0%) | 44 (32.8%) |
Income Below Poverty Among Married-Couple vs Single-Parent Households in Caribou County
The poverty data for Caribou County shows that 54 of the married-couple family households (3.4%) and 44 of the single-parent households (24.3%) are living below the poverty level. Within the married-couple family households, those with 1 or 2 children have the highest poverty rate, with 29 households (7.7%) falling below the poverty line. Among the single-parent households, those with 3 or 4 children have the highest poverty rate, with 34 household (66.7%) living below poverty.
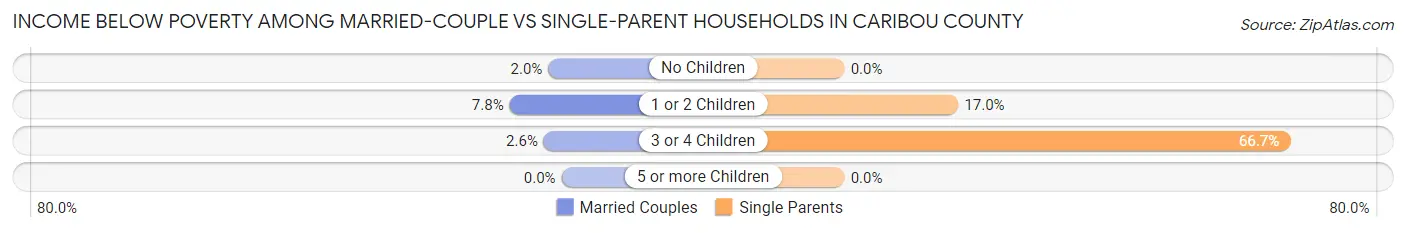
| Children | Married-Couple Families | Single-Parent Households |
| No Children | 19 (2.0%) | 0 (0.0%) |
| 1 or 2 Children | 29 (7.7%) | 10 (17.0%) |
| 3 or 4 Children | 6 (2.6%) | 34 (66.7%) |
| 5 or more Children | 0 (0.0%) | 0 (0.0%) |
| Total | 54 (3.4%) | 44 (24.3%) |
Employment Characteristics in Caribou County
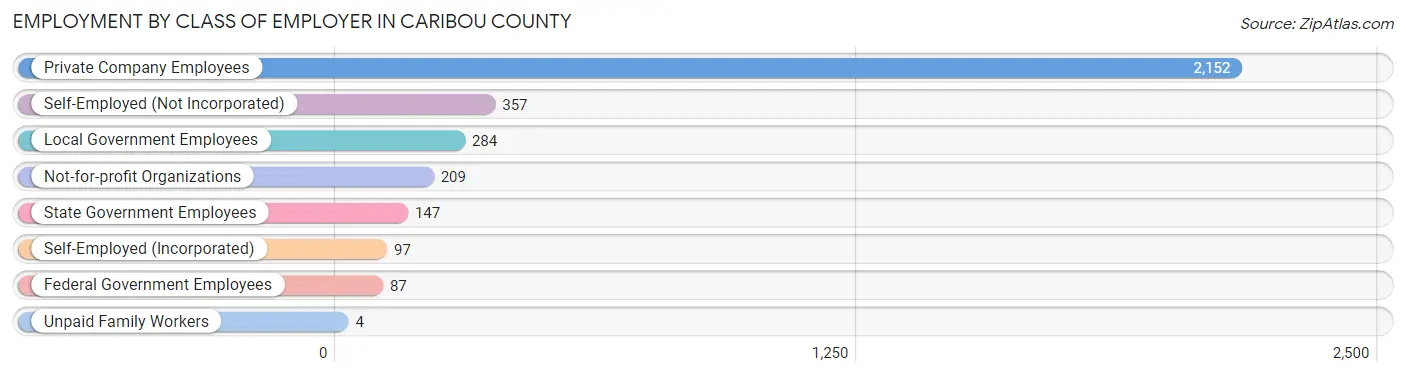
Employment by Class of Employer in Caribou County
Among the 3,337 employed individuals in Caribou County, private company employees (2,152 | 64.5%), self-employed (not incorporated) (357 | 10.7%), and local government employees (284 | 8.5%) make up the most common classes of employment.
| Employer Class | # Employees | % Employees |
| Private Company Employees | 2,152 | 64.5% |
| Self-Employed (Incorporated) | 97 | 2.9% |
| Self-Employed (Not Incorporated) | 357 | 10.7% |
| Not-for-profit Organizations | 209 | 6.3% |
| Local Government Employees | 284 | 8.5% |
| State Government Employees | 147 | 4.4% |
| Federal Government Employees | 87 | 2.6% |
| Unpaid Family Workers | 4 | 0.1% |
| Total | 3,337 | 100.0% |
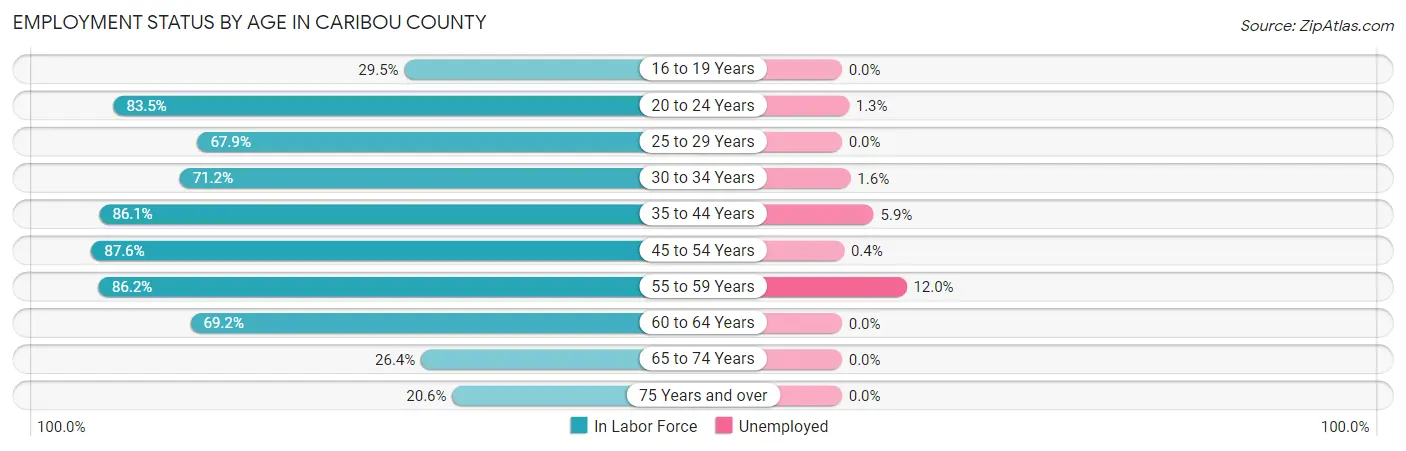
Employment Status by Age in Caribou County
According to the labor force statistics for Caribou County, out of the total population over 16 years of age (5,444), 63.9% or 3,479 individuals are in the labor force, with 2.8% or 97 of them unemployed. The age group with the highest labor force participation rate is 45 to 54 years, with 87.6% or 718 individuals in the labor force. Within the labor force, the 55 to 59 years age range has the highest percentage of unemployed individuals, with 12.0% or 36 of them being unemployed.
| Age Bracket | In Labor Force | Unemployed |
| 16 to 19 Years | 142 (29.5%) | 0 (0.0%) |
| 20 to 24 Years | 386 (83.5%) | 5 (1.3%) |
| 25 to 29 Years | 228 (67.9%) | 0 (0.0%) |
| 30 to 34 Years | 255 (71.2%) | 4 (1.6%) |
| 35 to 44 Years | 852 (86.1%) | 50 (5.9%) |
| 45 to 54 Years | 718 (87.6%) | 3 (0.4%) |
| 55 to 59 Years | 300 (86.2%) | 36 (12.0%) |
| 60 to 64 Years | 312 (69.2%) | 0 (0.0%) |
| 65 to 74 Years | 187 (26.4%) | 0 (0.0%) |
| 75 Years and over | 101 (20.6%) | 0 (0.0%) |
| Total | 3,479 (63.9%) | 97 (2.8%) |
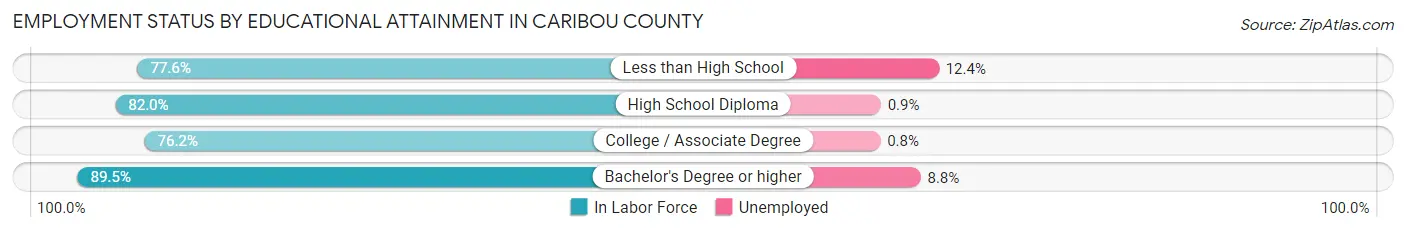
Employment Status by Educational Attainment in Caribou County
According to labor force statistics for Caribou County, 80.7% of individuals (2,665) out of the total population between 25 and 64 years of age (3,302) are in the labor force, with 3.5% or 93 of them being unemployed. The group with the highest labor force participation rate are those with the educational attainment of bachelor's degree or higher, with 89.5% or 501 individuals in the labor force. Within the labor force, individuals with less than high school education have the highest percentage of unemployment, with 12.4% or 33 of them being unemployed.
| Educational Attainment | In Labor Force | Unemployed |
| Less than High School | 267 (77.6%) | 43 (12.4%) |
| High School Diploma | 979 (82.0%) | 11 (0.9%) |
| College / Associate Degree | 917 (76.2%) | 10 (0.8%) |
| Bachelor's Degree or higher | 501 (89.5%) | 49 (8.8%) |
| Total | 2,665 (80.7%) | 116 (3.5%) |
Employment Occupations by Sex in Caribou County
Management, Business, Science and Arts Occupations
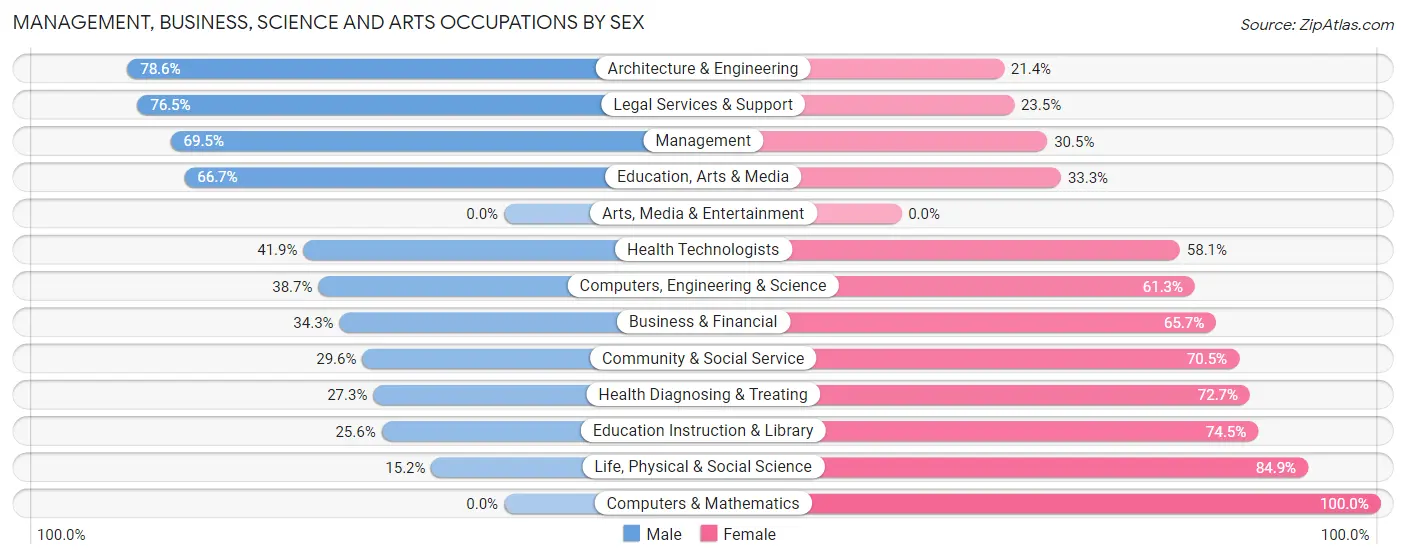
The most common Management, Business, Science and Arts occupations in Caribou County are Management (279 | 8.3%), Community & Social Service (247 | 7.3%), Education Instruction & Library (227 | 6.7%), Health Diagnosing & Treating (132 | 3.9%), and Computers, Engineering & Science (111 | 3.3%).
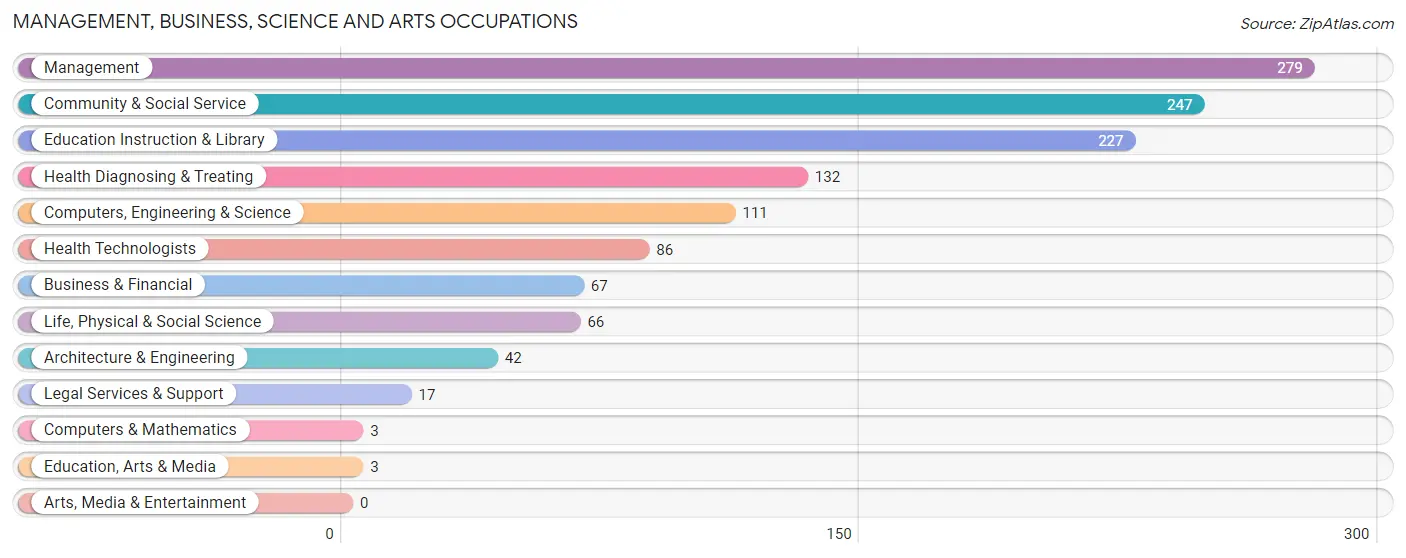
Management, Business, Science and Arts Occupations by Sex
Within the Management, Business, Science and Arts occupations in Caribou County, the most male-oriented occupations are Architecture & Engineering (78.6%), Legal Services & Support (76.5%), and Management (69.5%), while the most female-oriented occupations are Computers & Mathematics (100.0%), Life, Physical & Social Science (84.9%), and Education Instruction & Library (74.5%).
| Occupation | Male | Female |
| Management | 194 (69.5%) | 85 (30.5%) |
| Business & Financial | 23 (34.3%) | 44 (65.7%) |
| Computers, Engineering & Science | 43 (38.7%) | 68 (61.3%) |
| Computers & Mathematics | 0 (0.0%) | 3 (100.0%) |
| Architecture & Engineering | 33 (78.6%) | 9 (21.4%) |
| Life, Physical & Social Science | 10 (15.1%) | 56 (84.9%) |
| Community & Social Service | 73 (29.5%) | 174 (70.5%) |
| Education, Arts & Media | 2 (66.7%) | 1 (33.3%) |
| Legal Services & Support | 13 (76.5%) | 4 (23.5%) |
| Education Instruction & Library | 58 (25.6%) | 169 (74.5%) |
| Arts, Media & Entertainment | 0 (0.0%) | 0 (0.0%) |
| Health Diagnosing & Treating | 36 (27.3%) | 96 (72.7%) |
| Health Technologists | 36 (41.9%) | 50 (58.1%) |
| Total (Category) | 369 (44.1%) | 467 (55.9%) |
| Total (Overall) | 1,912 (56.8%) | 1,454 (43.2%) |
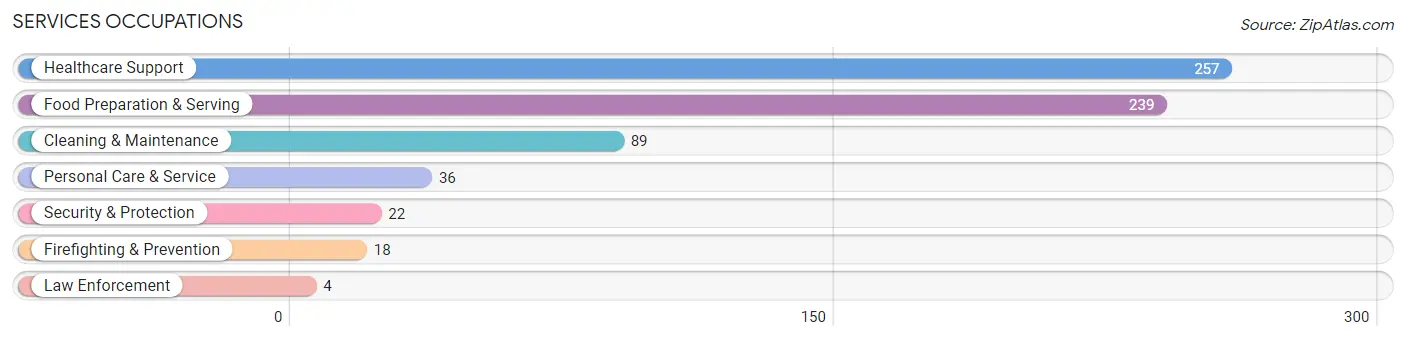
Services Occupations
The most common Services occupations in Caribou County are Healthcare Support (257 | 7.6%), Food Preparation & Serving (239 | 7.1%), Cleaning & Maintenance (89 | 2.6%), Personal Care & Service (36 | 1.1%), and Security & Protection (22 | 0.6%).
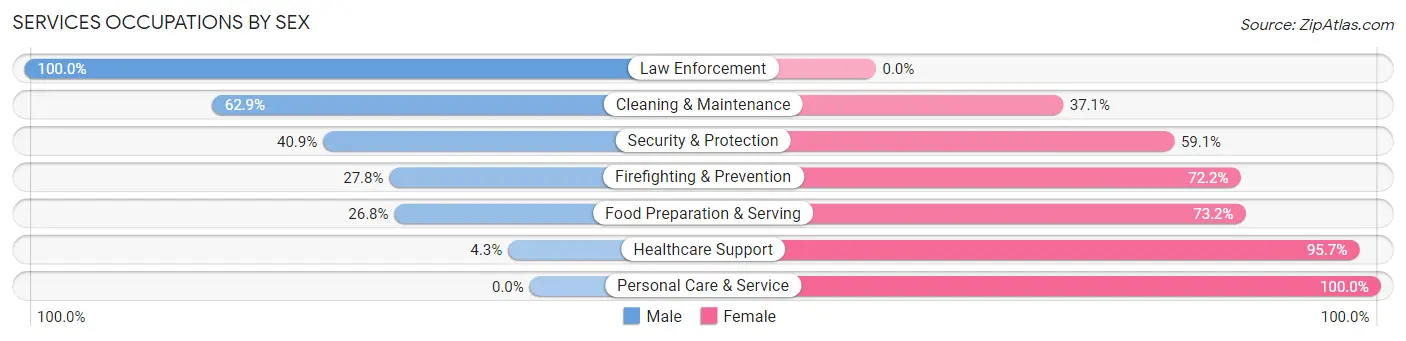
Services Occupations by Sex
Within the Services occupations in Caribou County, the most male-oriented occupations are Law Enforcement (100.0%), Cleaning & Maintenance (62.9%), and Security & Protection (40.9%), while the most female-oriented occupations are Personal Care & Service (100.0%), Healthcare Support (95.7%), and Food Preparation & Serving (73.2%).
| Occupation | Male | Female |
| Healthcare Support | 11 (4.3%) | 246 (95.7%) |
| Security & Protection | 9 (40.9%) | 13 (59.1%) |
| Firefighting & Prevention | 5 (27.8%) | 13 (72.2%) |
| Law Enforcement | 4 (100.0%) | 0 (0.0%) |
| Food Preparation & Serving | 64 (26.8%) | 175 (73.2%) |
| Cleaning & Maintenance | 56 (62.9%) | 33 (37.1%) |
| Personal Care & Service | 0 (0.0%) | 36 (100.0%) |
| Total (Category) | 140 (21.8%) | 503 (78.2%) |
| Total (Overall) | 1,912 (56.8%) | 1,454 (43.2%) |
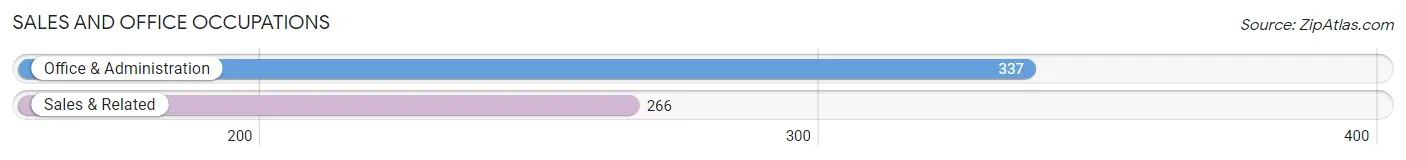
Sales and Office Occupations
The most common Sales and Office occupations in Caribou County are Office & Administration (337 | 10.0%), and Sales & Related (266 | 7.9%).
Sales and Office Occupations by Sex
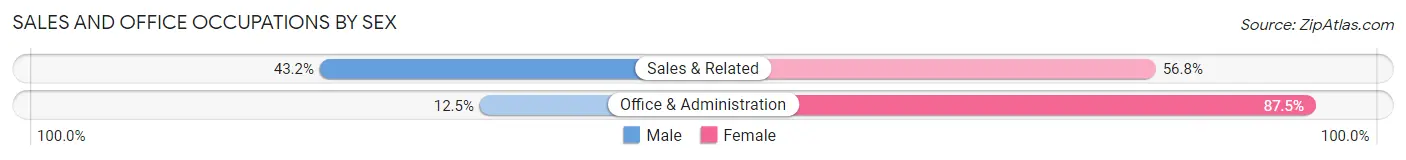
| Occupation | Male | Female |
| Sales & Related | 115 (43.2%) | 151 (56.8%) |
| Office & Administration | 42 (12.5%) | 295 (87.5%) |
| Total (Category) | 157 (26.0%) | 446 (74.0%) |
| Total (Overall) | 1,912 (56.8%) | 1,454 (43.2%) |
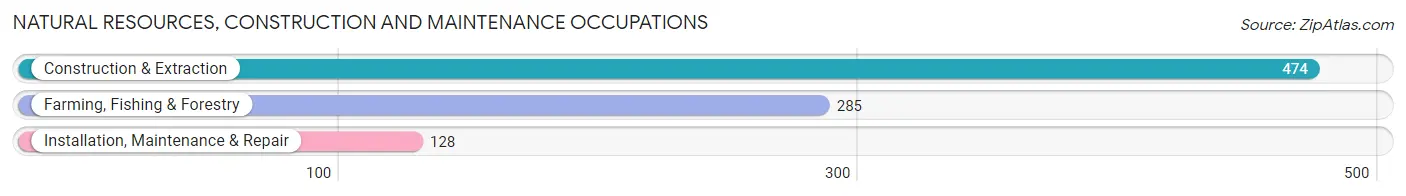
Natural Resources, Construction and Maintenance Occupations
The most common Natural Resources, Construction and Maintenance occupations in Caribou County are Construction & Extraction (474 | 14.1%), Farming, Fishing & Forestry (285 | 8.5%), and Installation, Maintenance & Repair (128 | 3.8%).
Natural Resources, Construction and Maintenance Occupations by Sex
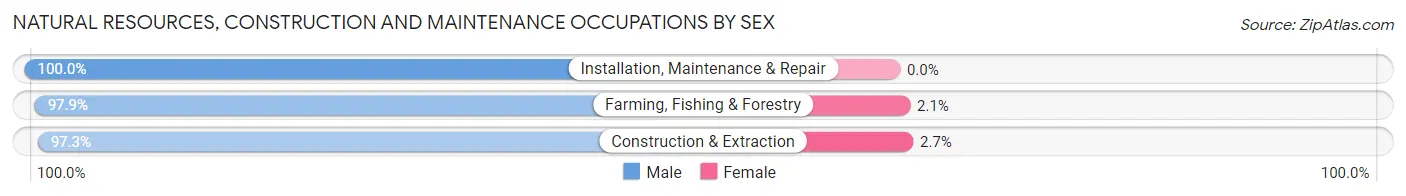
| Occupation | Male | Female |
| Farming, Fishing & Forestry | 279 (97.9%) | 6 (2.1%) |
| Construction & Extraction | 461 (97.3%) | 13 (2.7%) |
| Installation, Maintenance & Repair | 128 (100.0%) | 0 (0.0%) |
| Total (Category) | 868 (97.9%) | 19 (2.1%) |
| Total (Overall) | 1,912 (56.8%) | 1,454 (43.2%) |
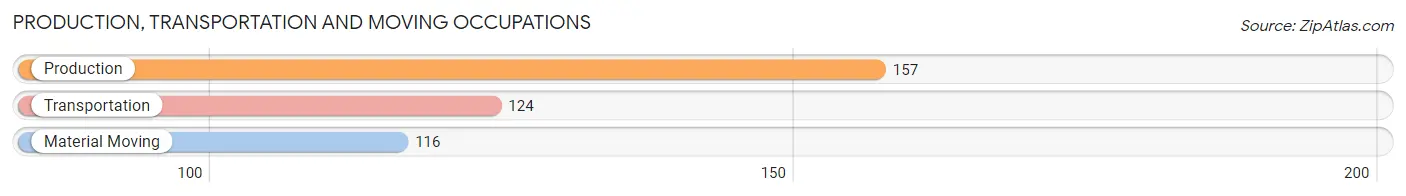
Production, Transportation and Moving Occupations
The most common Production, Transportation and Moving occupations in Caribou County are Production (157 | 4.7%), Transportation (124 | 3.7%), and Material Moving (116 | 3.5%).
Production, Transportation and Moving Occupations by Sex
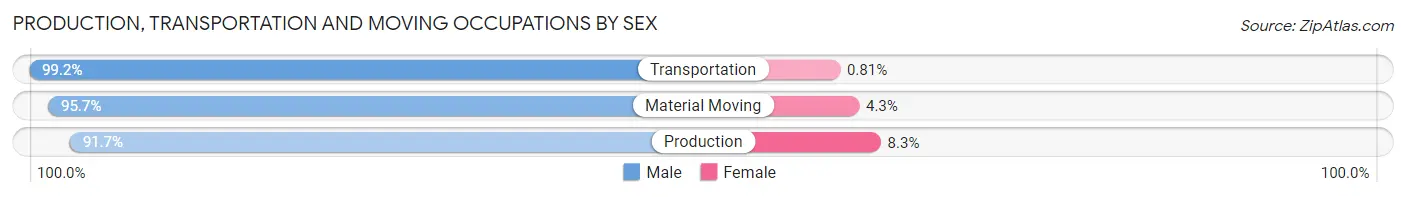
| Occupation | Male | Female |
| Production | 144 (91.7%) | 13 (8.3%) |
| Transportation | 123 (99.2%) | 1 (0.8%) |
| Material Moving | 111 (95.7%) | 5 (4.3%) |
| Total (Category) | 378 (95.2%) | 19 (4.8%) |
| Total (Overall) | 1,912 (56.8%) | 1,454 (43.2%) |
Employment Industries by Sex in Caribou County
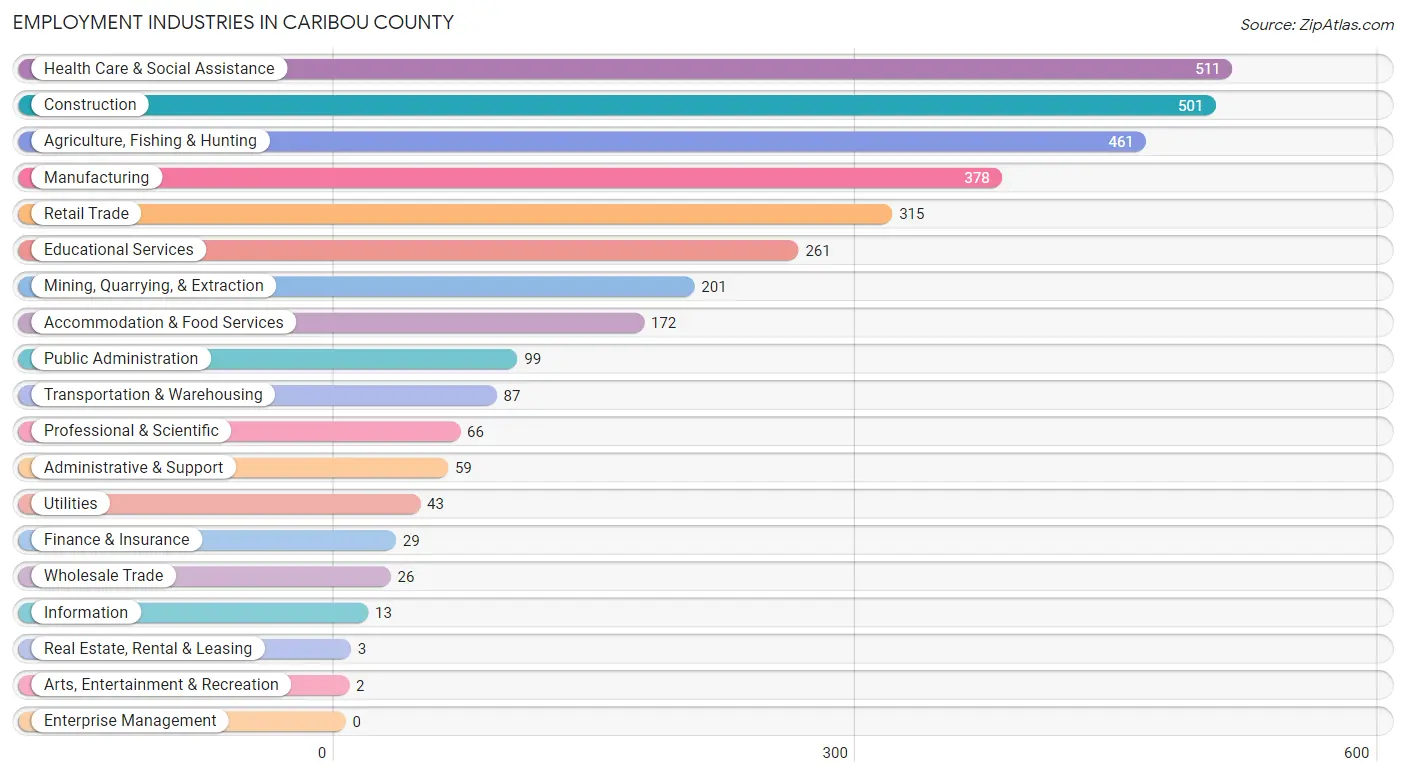
Employment Industries in Caribou County
The major employment industries in Caribou County include Health Care & Social Assistance (511 | 15.2%), Construction (501 | 14.9%), Agriculture, Fishing & Hunting (461 | 13.7%), Manufacturing (378 | 11.2%), and Retail Trade (315 | 9.4%).
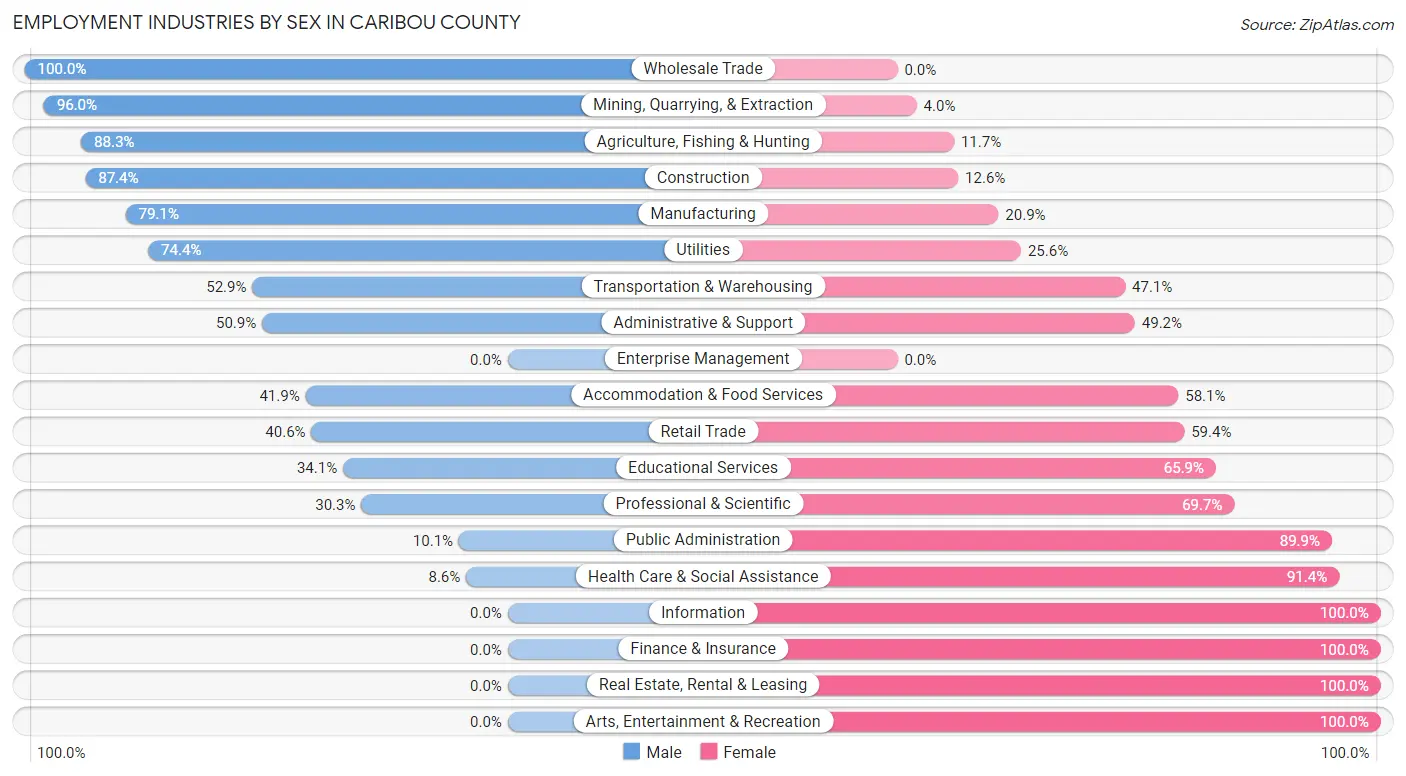
Employment Industries by Sex in Caribou County
The Caribou County industries that see more men than women are Wholesale Trade (100.0%), Mining, Quarrying, & Extraction (96.0%), and Agriculture, Fishing & Hunting (88.3%), whereas the industries that tend to have a higher number of women are Information (100.0%), Finance & Insurance (100.0%), and Real Estate, Rental & Leasing (100.0%).
| Industry | Male | Female |
| Agriculture, Fishing & Hunting | 407 (88.3%) | 54 (11.7%) |
| Mining, Quarrying, & Extraction | 193 (96.0%) | 8 (4.0%) |
| Construction | 438 (87.4%) | 63 (12.6%) |
| Manufacturing | 299 (79.1%) | 79 (20.9%) |
| Wholesale Trade | 26 (100.0%) | 0 (0.0%) |
| Retail Trade | 128 (40.6%) | 187 (59.4%) |
| Transportation & Warehousing | 46 (52.9%) | 41 (47.1%) |
| Utilities | 32 (74.4%) | 11 (25.6%) |
| Information | 0 (0.0%) | 13 (100.0%) |
| Finance & Insurance | 0 (0.0%) | 29 (100.0%) |
| Real Estate, Rental & Leasing | 0 (0.0%) | 3 (100.0%) |
| Professional & Scientific | 20 (30.3%) | 46 (69.7%) |
| Enterprise Management | 0 (0.0%) | 0 (0.0%) |
| Administrative & Support | 30 (50.8%) | 29 (49.1%) |
| Educational Services | 89 (34.1%) | 172 (65.9%) |
| Health Care & Social Assistance | 44 (8.6%) | 467 (91.4%) |
| Arts, Entertainment & Recreation | 0 (0.0%) | 2 (100.0%) |
| Accommodation & Food Services | 72 (41.9%) | 100 (58.1%) |
| Public Administration | 10 (10.1%) | 89 (89.9%) |
| Total | 1,912 (56.8%) | 1,454 (43.2%) |
Education in Caribou County
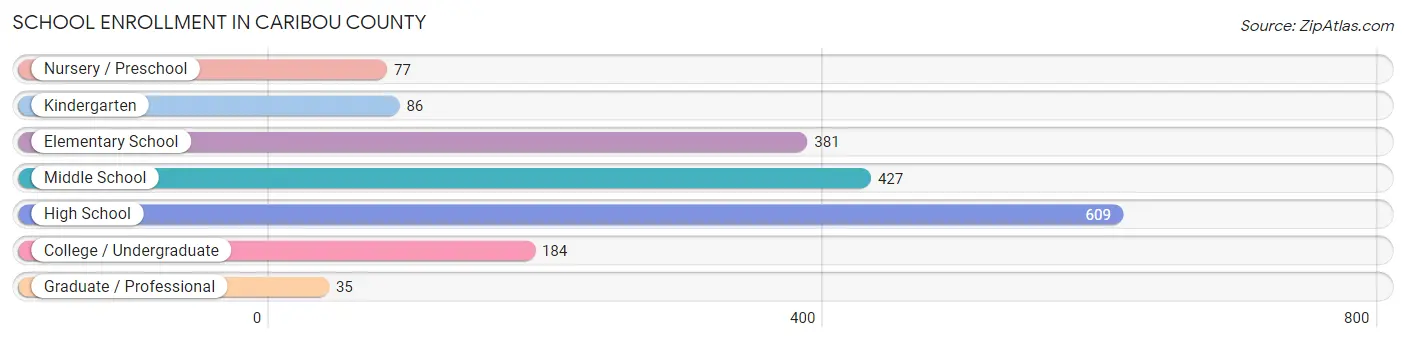
School Enrollment in Caribou County
The most common levels of schooling among the 1,799 students in Caribou County are high school (609 | 33.9%), middle school (427 | 23.7%), and elementary school (381 | 21.2%).
| School Level | # Students | % Students |
| Nursery / Preschool | 77 | 4.3% |
| Kindergarten | 86 | 4.8% |
| Elementary School | 381 | 21.2% |
| Middle School | 427 | 23.7% |
| High School | 609 | 33.9% |
| College / Undergraduate | 184 | 10.2% |
| Graduate / Professional | 35 | 1.9% |
| Total | 1,799 | 100.0% |
School Enrollment by Age by Funding Source in Caribou County
Out of a total of 1,799 students who are enrolled in schools in Caribou County, 83 (4.6%) attend a private institution, while the remaining 1,716 (95.4%) are enrolled in public schools. The age group of 3 to 4 year olds has the highest likelihood of being enrolled in private schools, with 10 (22.2% in the age bracket) enrolled. Conversely, the age group of 18 to 19 year olds has the lowest likelihood of being enrolled in a private school, with 113 (100.0% in the age bracket) attending a public institution.
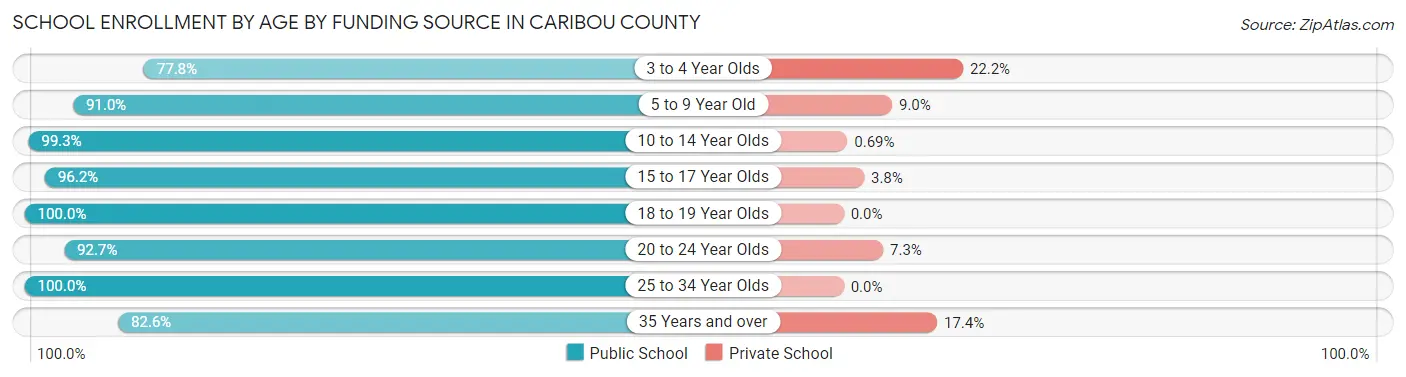
| Age Bracket | Public School | Private School |
| 3 to 4 Year Olds | 35 (77.8%) | 10 (22.2%) |
| 5 to 9 Year Old | 404 (91.0%) | 40 (9.0%) |
| 10 to 14 Year Olds | 578 (99.3%) | 4 (0.7%) |
| 15 to 17 Year Olds | 406 (96.2%) | 16 (3.8%) |
| 18 to 19 Year Olds | 113 (100.0%) | 0 (0.0%) |
| 20 to 24 Year Olds | 101 (92.7%) | 8 (7.3%) |
| 25 to 34 Year Olds | 61 (100.0%) | 0 (0.0%) |
| 35 Years and over | 19 (82.6%) | 4 (17.4%) |
| Total | 1,716 (95.4%) | 83 (4.6%) |
Educational Attainment by Field of Study in Caribou County
Education (192 | 25.6%), bio, nature & agricultural (142 | 18.9%), science & technology (99 | 13.2%), business (97 | 12.9%), and engineering (46 | 6.1%) are the most common fields of study among 750 individuals in Caribou County who have obtained a bachelor's degree or higher.
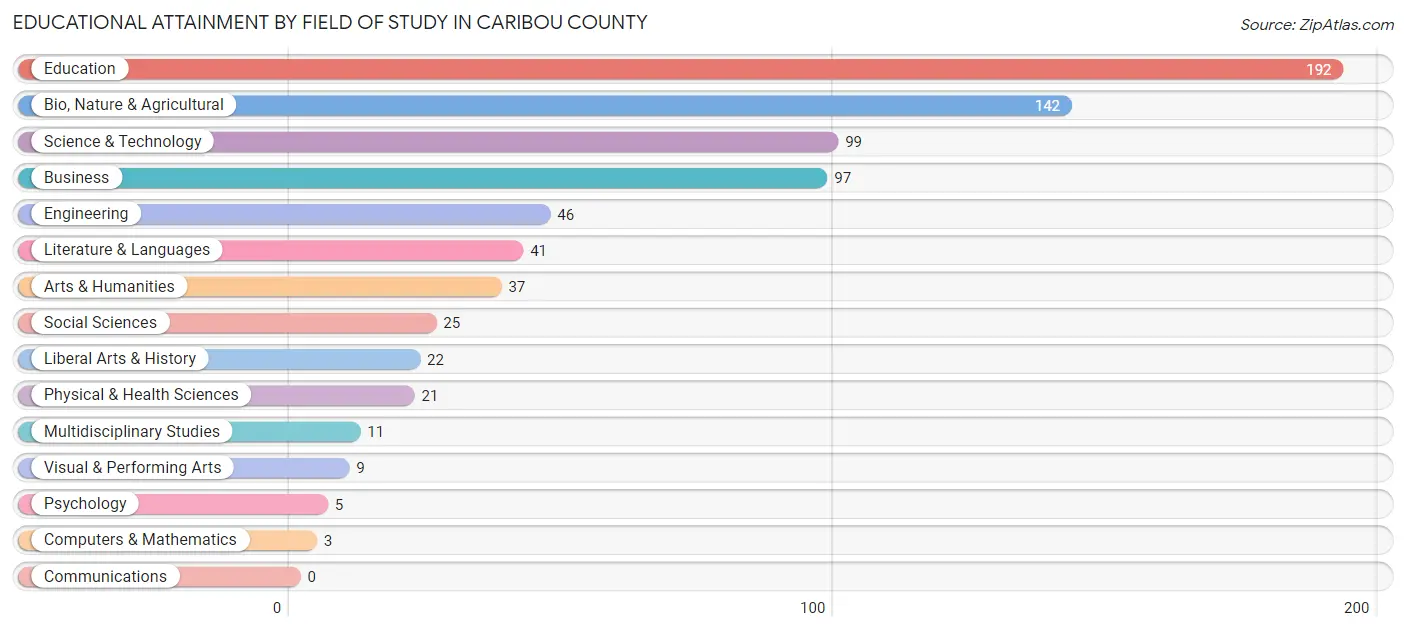
| Field of Study | # Graduates | % Graduates |
| Computers & Mathematics | 3 | 0.4% |
| Bio, Nature & Agricultural | 142 | 18.9% |
| Physical & Health Sciences | 21 | 2.8% |
| Psychology | 5 | 0.7% |
| Social Sciences | 25 | 3.3% |
| Engineering | 46 | 6.1% |
| Multidisciplinary Studies | 11 | 1.5% |
| Science & Technology | 99 | 13.2% |
| Business | 97 | 12.9% |
| Education | 192 | 25.6% |
| Literature & Languages | 41 | 5.5% |
| Liberal Arts & History | 22 | 2.9% |
| Visual & Performing Arts | 9 | 1.2% |
| Communications | 0 | 0.0% |
| Arts & Humanities | 37 | 4.9% |
| Total | 750 | 100.0% |
Transportation & Commute in Caribou County
Vehicle Availability by Sex in Caribou County
The most prevalent vehicle ownership categories in Caribou County are males with 3 vehicles (618, accounting for 33.0%) and females with 3 vehicles (475, making up 42.6%).
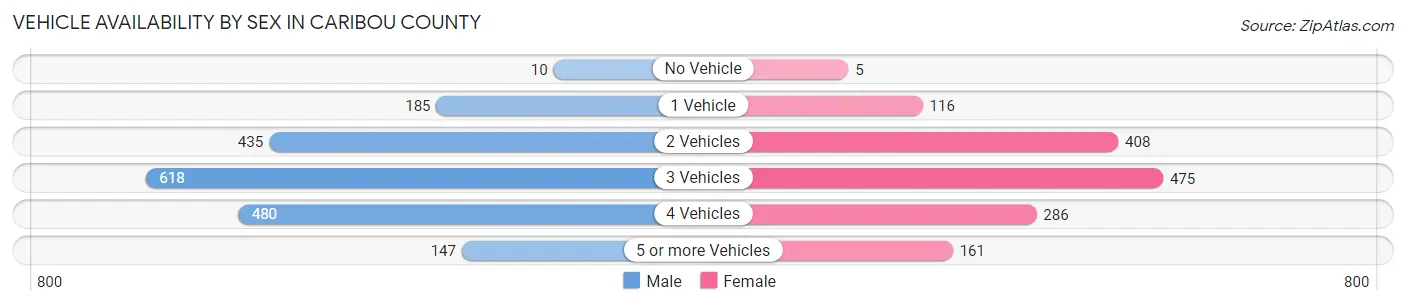
| Vehicles Available | Male | Female |
| No Vehicle | 10 (0.5%) | 5 (0.3%) |
| 1 Vehicle | 185 (9.9%) | 116 (8.0%) |
| 2 Vehicles | 435 (23.2%) | 408 (28.1%) |
| 3 Vehicles | 618 (33.0%) | 475 (32.7%) |
| 4 Vehicles | 480 (25.6%) | 286 (19.7%) |
| 5 or more Vehicles | 147 (7.8%) | 161 (11.1%) |
| Total | 1,875 (100.0%) | 1,451 (100.0%) |
Commute Time in Caribou County
The most frequently occuring commute durations in Caribou County are 5 to 9 minutes (705 commuters, 21.9%), less than 5 minutes (582 commuters, 18.1%), and 15 to 19 minutes (409 commuters, 12.7%).
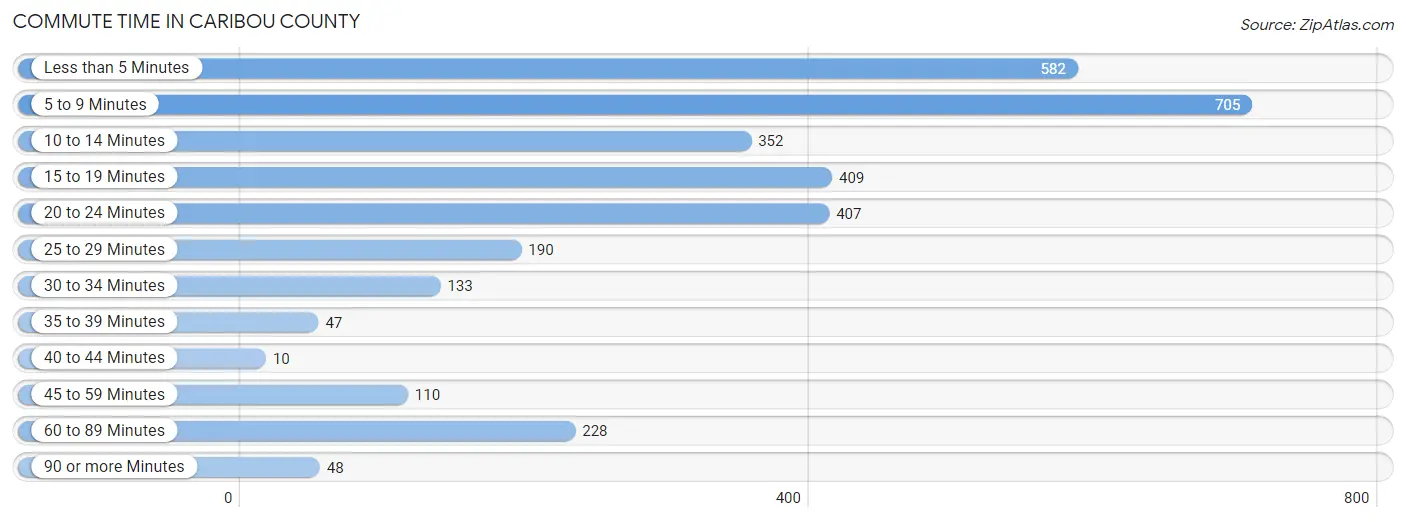
| Commute Time | # Commuters | % Commuters |
| Less than 5 Minutes | 582 | 18.1% |
| 5 to 9 Minutes | 705 | 21.9% |
| 10 to 14 Minutes | 352 | 10.9% |
| 15 to 19 Minutes | 409 | 12.7% |
| 20 to 24 Minutes | 407 | 12.6% |
| 25 to 29 Minutes | 190 | 5.9% |
| 30 to 34 Minutes | 133 | 4.1% |
| 35 to 39 Minutes | 47 | 1.5% |
| 40 to 44 Minutes | 10 | 0.3% |
| 45 to 59 Minutes | 110 | 3.4% |
| 60 to 89 Minutes | 228 | 7.1% |
| 90 or more Minutes | 48 | 1.5% |
Commute Time by Sex in Caribou County
The most common commute times in Caribou County are 5 to 9 minutes (341 commuters, 18.6%) for males and 5 to 9 minutes (364 commuters, 26.2%) for females.
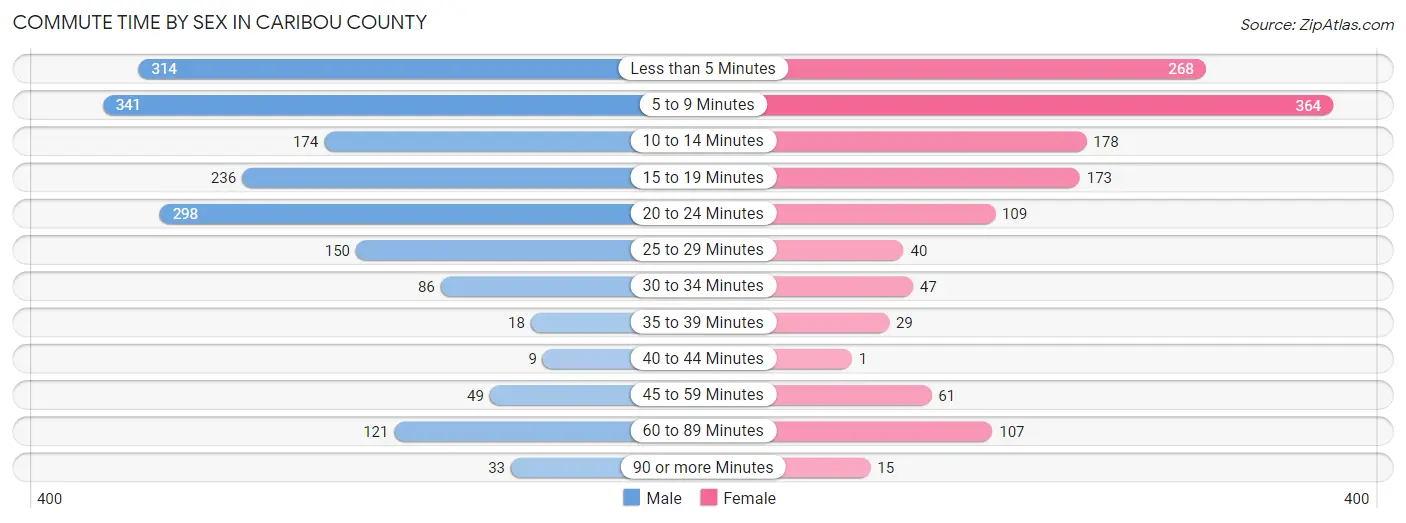
| Commute Time | Male | Female |
| Less than 5 Minutes | 314 (17.2%) | 268 (19.3%) |
| 5 to 9 Minutes | 341 (18.6%) | 364 (26.2%) |
| 10 to 14 Minutes | 174 (9.5%) | 178 (12.8%) |
| 15 to 19 Minutes | 236 (12.9%) | 173 (12.4%) |
| 20 to 24 Minutes | 298 (16.3%) | 109 (7.8%) |
| 25 to 29 Minutes | 150 (8.2%) | 40 (2.9%) |
| 30 to 34 Minutes | 86 (4.7%) | 47 (3.4%) |
| 35 to 39 Minutes | 18 (1.0%) | 29 (2.1%) |
| 40 to 44 Minutes | 9 (0.5%) | 1 (0.1%) |
| 45 to 59 Minutes | 49 (2.7%) | 61 (4.4%) |
| 60 to 89 Minutes | 121 (6.6%) | 107 (7.7%) |
| 90 or more Minutes | 33 (1.8%) | 15 (1.1%) |
Time of Departure to Work by Sex in Caribou County
The most frequent times of departure to work in Caribou County are 7:30 AM to 7:59 AM (337, 18.4%) for males and 8:00 AM to 8:29 AM (218, 15.7%) for females.
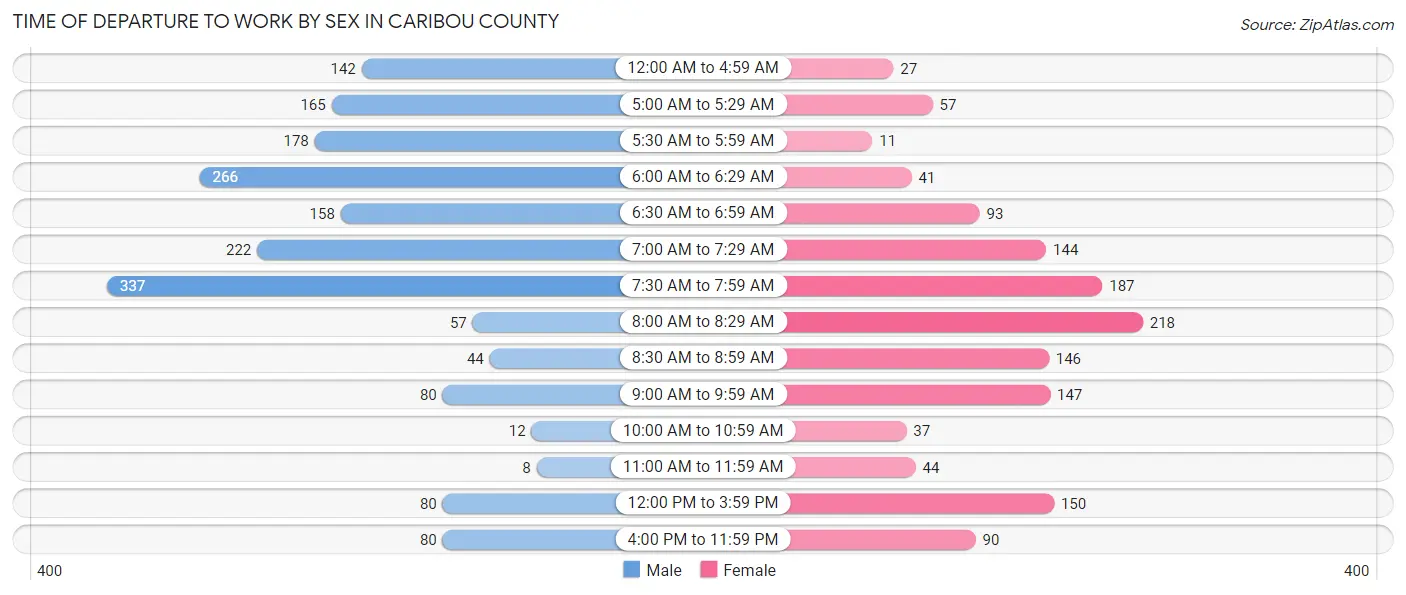
| Time of Departure | Male | Female |
| 12:00 AM to 4:59 AM | 142 (7.8%) | 27 (1.9%) |
| 5:00 AM to 5:29 AM | 165 (9.0%) | 57 (4.1%) |
| 5:30 AM to 5:59 AM | 178 (9.7%) | 11 (0.8%) |
| 6:00 AM to 6:29 AM | 266 (14.5%) | 41 (2.9%) |
| 6:30 AM to 6:59 AM | 158 (8.6%) | 93 (6.7%) |
| 7:00 AM to 7:29 AM | 222 (12.1%) | 144 (10.3%) |
| 7:30 AM to 7:59 AM | 337 (18.4%) | 187 (13.4%) |
| 8:00 AM to 8:29 AM | 57 (3.1%) | 218 (15.7%) |
| 8:30 AM to 8:59 AM | 44 (2.4%) | 146 (10.5%) |
| 9:00 AM to 9:59 AM | 80 (4.4%) | 147 (10.6%) |
| 10:00 AM to 10:59 AM | 12 (0.7%) | 37 (2.7%) |
| 11:00 AM to 11:59 AM | 8 (0.4%) | 44 (3.2%) |
| 12:00 PM to 3:59 PM | 80 (4.4%) | 150 (10.8%) |
| 4:00 PM to 11:59 PM | 80 (4.4%) | 90 (6.5%) |
| Total | 1,829 (100.0%) | 1,392 (100.0%) |
Housing Occupancy in Caribou County
Occupancy by Ownership in Caribou County
Of the total 2,527 dwellings in Caribou County, owner-occupied units account for 1,967 (77.8%), while renter-occupied units make up 560 (22.2%).
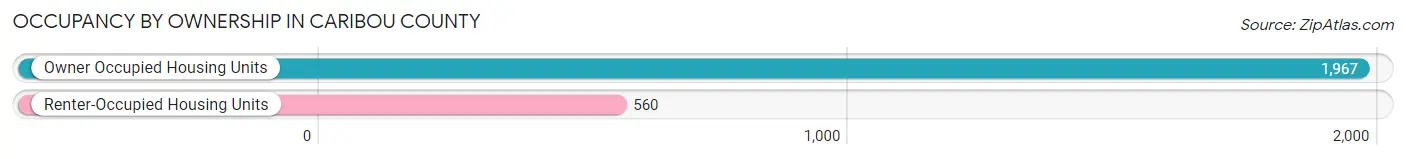
| Occupancy | # Housing Units | % Housing Units |
| Owner Occupied Housing Units | 1,967 | 77.8% |
| Renter-Occupied Housing Units | 560 | 22.2% |
| Total Occupied Housing Units | 2,527 | 100.0% |
Occupancy by Household Size in Caribou County
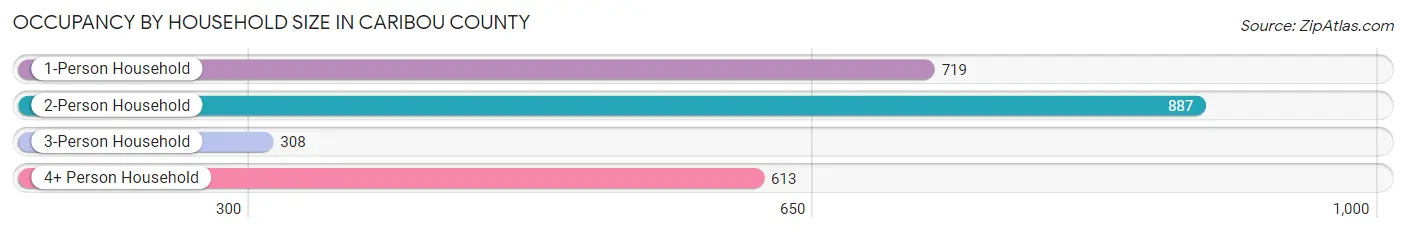
| Household Size | # Housing Units | % Housing Units |
| 1-Person Household | 719 | 28.4% |
| 2-Person Household | 887 | 35.1% |
| 3-Person Household | 308 | 12.2% |
| 4+ Person Household | 613 | 24.3% |
| Total Housing Units | 2,527 | 100.0% |
Occupancy by Ownership by Household Size in Caribou County
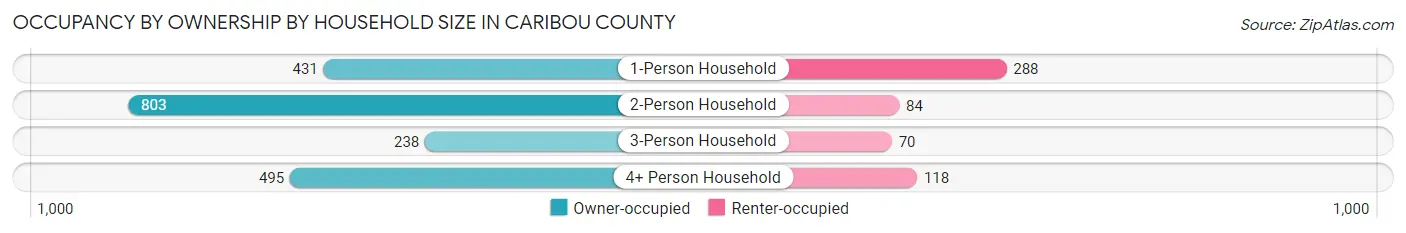
| Household Size | Owner-occupied | Renter-occupied |
| 1-Person Household | 431 (59.9%) | 288 (40.1%) |
| 2-Person Household | 803 (90.5%) | 84 (9.5%) |
| 3-Person Household | 238 (77.3%) | 70 (22.7%) |
| 4+ Person Household | 495 (80.7%) | 118 (19.3%) |
| Total Housing Units | 1,967 (77.8%) | 560 (22.2%) |
Occupancy by Educational Attainment in Caribou County
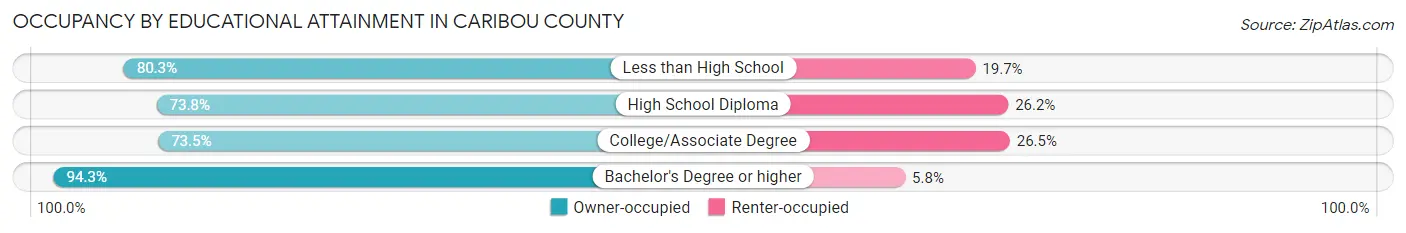
| Household Size | Owner-occupied | Renter-occupied |
| Less than High School | 200 (80.3%) | 49 (19.7%) |
| High School Diploma | 547 (73.8%) | 194 (26.2%) |
| College/Associate Degree | 810 (73.5%) | 292 (26.5%) |
| Bachelor's Degree or higher | 410 (94.3%) | 25 (5.8%) |
Occupancy by Age of Householder in Caribou County
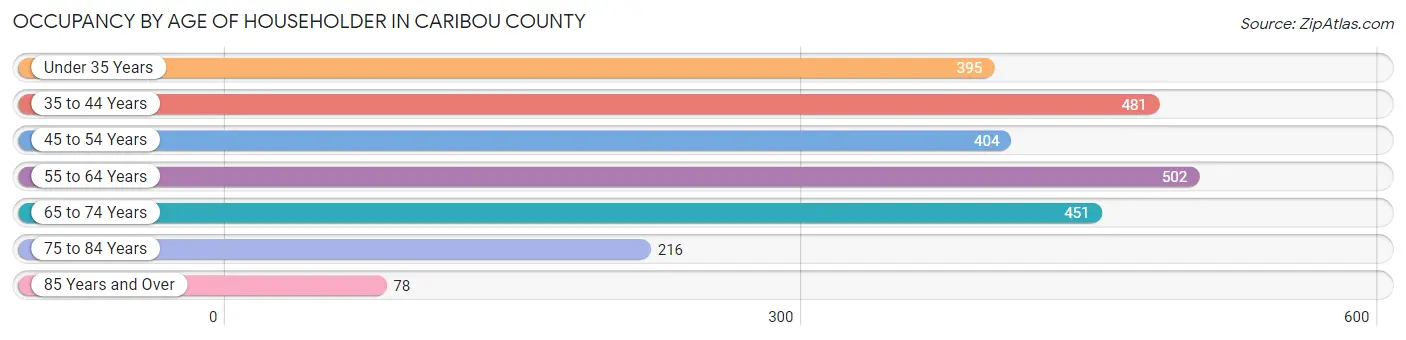
| Age Bracket | # Households | % Households |
| Under 35 Years | 395 | 15.6% |
| 35 to 44 Years | 481 | 19.0% |
| 45 to 54 Years | 404 | 16.0% |
| 55 to 64 Years | 502 | 19.9% |
| 65 to 74 Years | 451 | 17.8% |
| 75 to 84 Years | 216 | 8.6% |
| 85 Years and Over | 78 | 3.1% |
| Total | 2,527 | 100.0% |
Housing Finances in Caribou County
Median Income by Occupancy in Caribou County
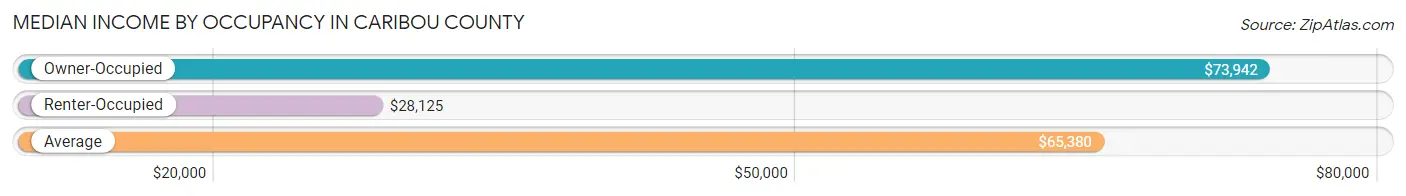
| Occupancy Type | # Households | Median Income |
| Owner-Occupied | 1,967 (77.8%) | $73,942 |
| Renter-Occupied | 560 (22.2%) | $28,125 |
| Average | 2,527 (100.0%) | $65,380 |
Occupancy by Householder Income Bracket in Caribou County
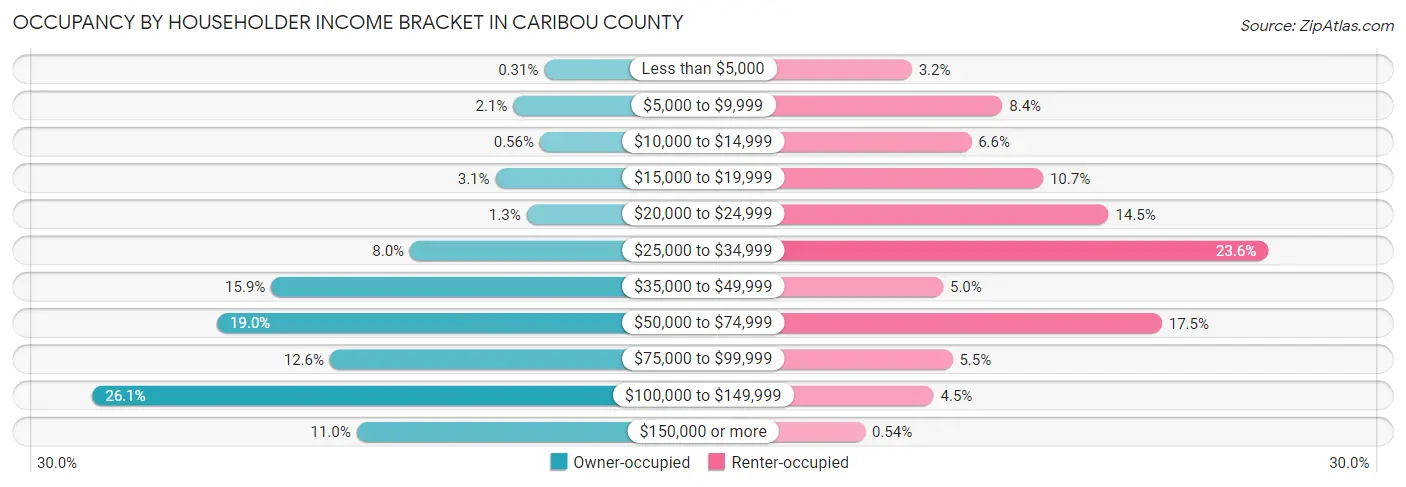
| Income Bracket | Owner-occupied | Renter-occupied |
| Less than $5,000 | 6 (0.3%) | 18 (3.2%) |
| $5,000 to $9,999 | 41 (2.1%) | 47 (8.4%) |
| $10,000 to $14,999 | 11 (0.6%) | 37 (6.6%) |
| $15,000 to $19,999 | 61 (3.1%) | 60 (10.7%) |
| $20,000 to $24,999 | 26 (1.3%) | 81 (14.5%) |
| $25,000 to $34,999 | 157 (8.0%) | 132 (23.6%) |
| $35,000 to $49,999 | 313 (15.9%) | 28 (5.0%) |
| $50,000 to $74,999 | 374 (19.0%) | 98 (17.5%) |
| $75,000 to $99,999 | 247 (12.6%) | 31 (5.5%) |
| $100,000 to $149,999 | 514 (26.1%) | 25 (4.5%) |
| $150,000 or more | 217 (11.0%) | 3 (0.5%) |
| Total | 1,967 (100.0%) | 560 (100.0%) |
Monthly Housing Cost Tiers in Caribou County
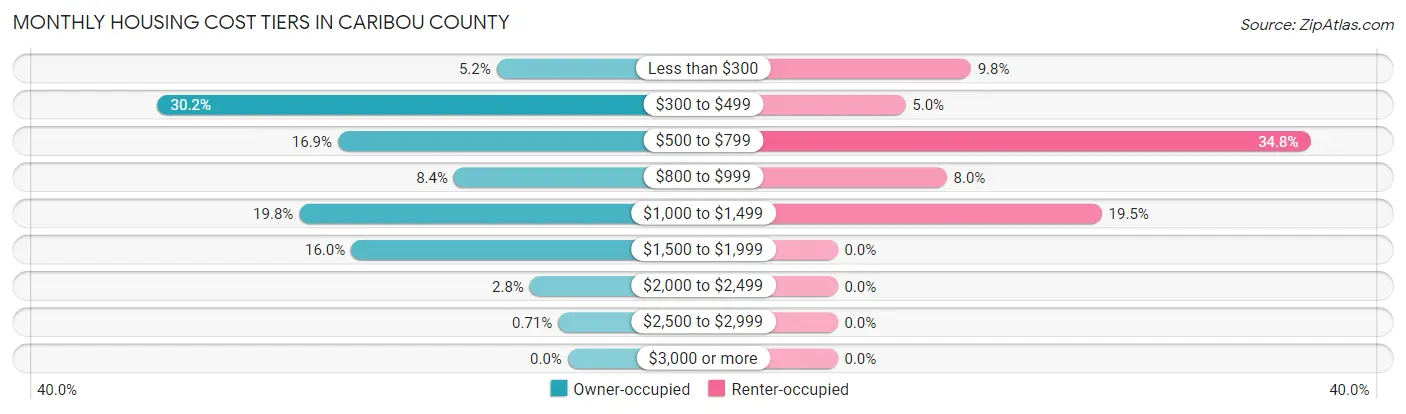
| Monthly Cost | Owner-occupied | Renter-occupied |
| Less than $300 | 103 (5.2%) | 55 (9.8%) |
| $300 to $499 | 594 (30.2%) | 28 (5.0%) |
| $500 to $799 | 333 (16.9%) | 195 (34.8%) |
| $800 to $999 | 165 (8.4%) | 45 (8.0%) |
| $1,000 to $1,499 | 389 (19.8%) | 109 (19.5%) |
| $1,500 to $1,999 | 314 (16.0%) | 0 (0.0%) |
| $2,000 to $2,499 | 55 (2.8%) | 0 (0.0%) |
| $2,500 to $2,999 | 14 (0.7%) | 0 (0.0%) |
| $3,000 or more | 0 (0.0%) | 0 (0.0%) |
| Total | 1,967 (100.0%) | 560 (100.0%) |
Physical Housing Characteristics in Caribou County
Housing Structures in Caribou County
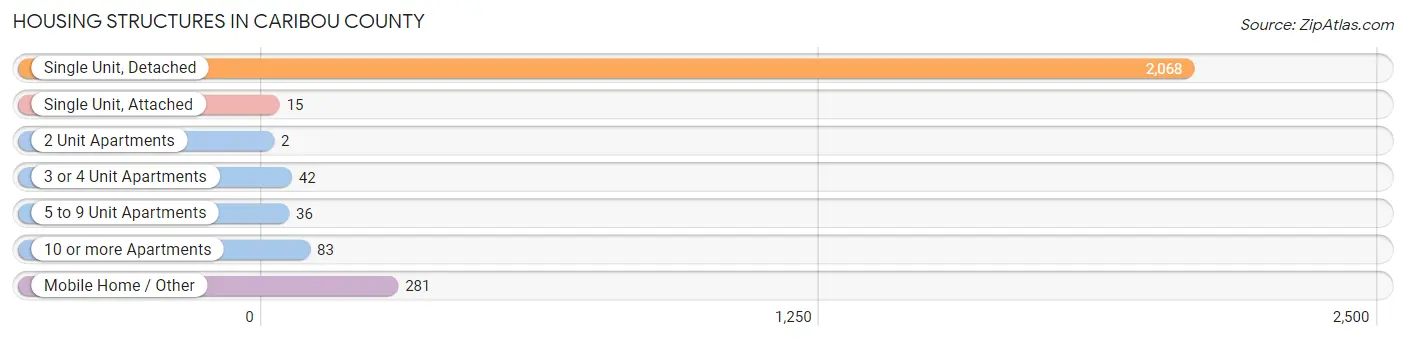
| Structure Type | # Housing Units | % Housing Units |
| Single Unit, Detached | 2,068 | 81.8% |
| Single Unit, Attached | 15 | 0.6% |
| 2 Unit Apartments | 2 | 0.1% |
| 3 or 4 Unit Apartments | 42 | 1.7% |
| 5 to 9 Unit Apartments | 36 | 1.4% |
| 10 or more Apartments | 83 | 3.3% |
| Mobile Home / Other | 281 | 11.1% |
| Total | 2,527 | 100.0% |
Housing Structures by Occupancy in Caribou County
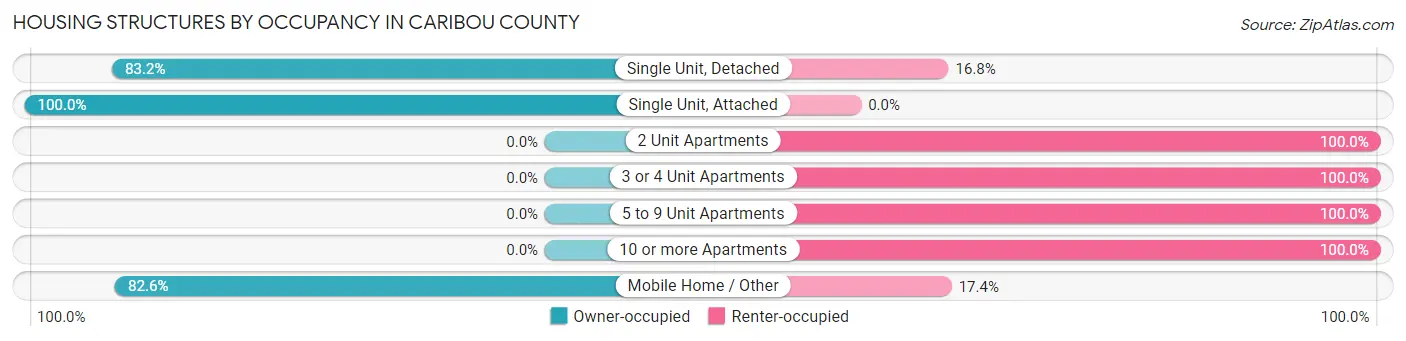
| Structure Type | Owner-occupied | Renter-occupied |
| Single Unit, Detached | 1,720 (83.2%) | 348 (16.8%) |
| Single Unit, Attached | 15 (100.0%) | 0 (0.0%) |
| 2 Unit Apartments | 0 (0.0%) | 2 (100.0%) |
| 3 or 4 Unit Apartments | 0 (0.0%) | 42 (100.0%) |
| 5 to 9 Unit Apartments | 0 (0.0%) | 36 (100.0%) |
| 10 or more Apartments | 0 (0.0%) | 83 (100.0%) |
| Mobile Home / Other | 232 (82.6%) | 49 (17.4%) |
| Total | 1,967 (77.8%) | 560 (22.2%) |
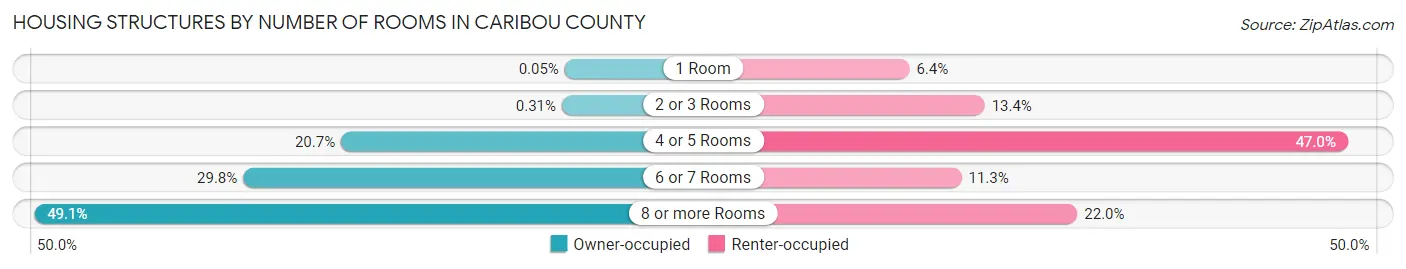
Housing Structures by Number of Rooms in Caribou County
| Number of Rooms | Owner-occupied | Renter-occupied |
| 1 Room | 1 (0.1%) | 36 (6.4%) |
| 2 or 3 Rooms | 6 (0.3%) | 75 (13.4%) |
| 4 or 5 Rooms | 408 (20.7%) | 263 (47.0%) |
| 6 or 7 Rooms | 586 (29.8%) | 63 (11.3%) |
| 8 or more Rooms | 966 (49.1%) | 123 (22.0%) |
| Total | 1,967 (100.0%) | 560 (100.0%) |
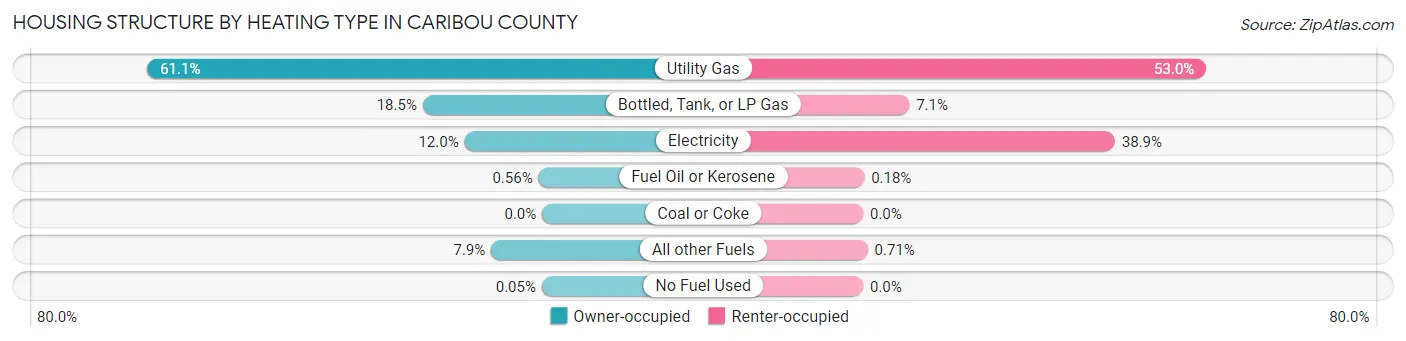
Housing Structure by Heating Type in Caribou County
| Heating Type | Owner-occupied | Renter-occupied |
| Utility Gas | 1,201 (61.1%) | 297 (53.0%) |
| Bottled, Tank, or LP Gas | 363 (18.4%) | 40 (7.1%) |
| Electricity | 236 (12.0%) | 218 (38.9%) |
| Fuel Oil or Kerosene | 11 (0.6%) | 1 (0.2%) |
| Coal or Coke | 0 (0.0%) | 0 (0.0%) |
| All other Fuels | 155 (7.9%) | 4 (0.7%) |
| No Fuel Used | 1 (0.1%) | 0 (0.0%) |
| Total | 1,967 (100.0%) | 560 (100.0%) |
Household Vehicle Usage in Caribou County
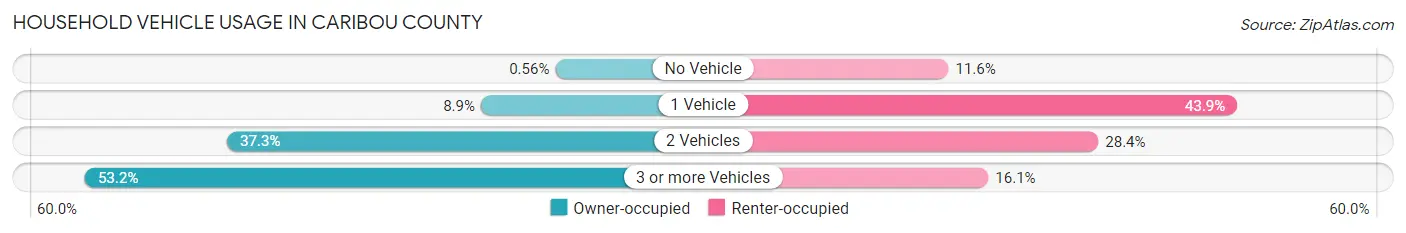
| Vehicles per Household | Owner-occupied | Renter-occupied |
| No Vehicle | 11 (0.6%) | 65 (11.6%) |
| 1 Vehicle | 175 (8.9%) | 246 (43.9%) |
| 2 Vehicles | 734 (37.3%) | 159 (28.4%) |
| 3 or more Vehicles | 1,047 (53.2%) | 90 (16.1%) |
| Total | 1,967 (100.0%) | 560 (100.0%) |
Real Estate & Mortgages in Caribou County
Real Estate and Mortgage Overview in Caribou County
| Characteristic | Without Mortgage | With Mortgage |
| Housing Units | 959 | 1,008 |
| Median Property Value | $178,800 | $217,700 |
| Median Household Income | $61,066 | $120 |
| Monthly Housing Costs | $393 | $0 |
| Real Estate Taxes | $1,378 | $12 |
Property Value by Mortgage Status in Caribou County
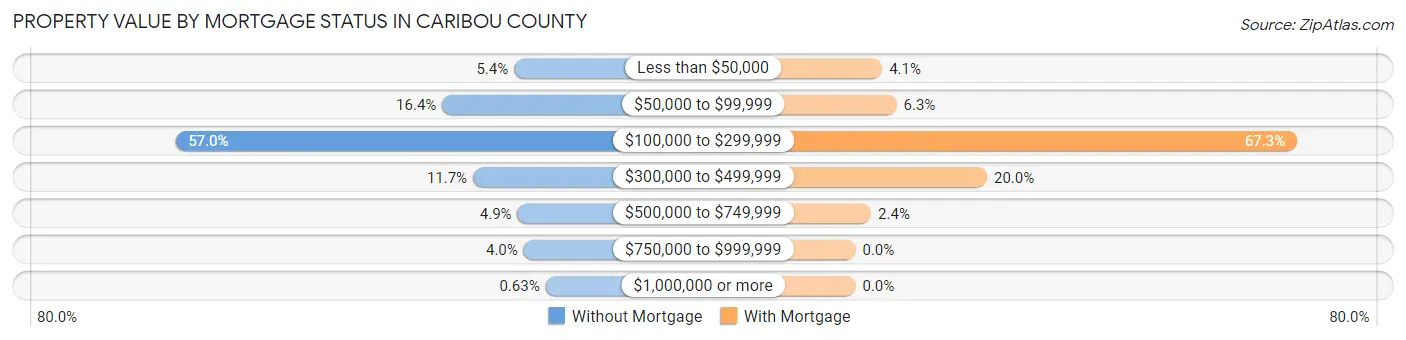
| Property Value | Without Mortgage | With Mortgage |
| Less than $50,000 | 52 (5.4%) | 41 (4.1%) |
| $50,000 to $99,999 | 157 (16.4%) | 63 (6.2%) |
| $100,000 to $299,999 | 547 (57.0%) | 678 (67.3%) |
| $300,000 to $499,999 | 112 (11.7%) | 202 (20.0%) |
| $500,000 to $749,999 | 47 (4.9%) | 24 (2.4%) |
| $750,000 to $999,999 | 38 (4.0%) | 0 (0.0%) |
| $1,000,000 or more | 6 (0.6%) | 0 (0.0%) |
| Total | 959 (100.0%) | 1,008 (100.0%) |
Household Income by Mortgage Status in Caribou County
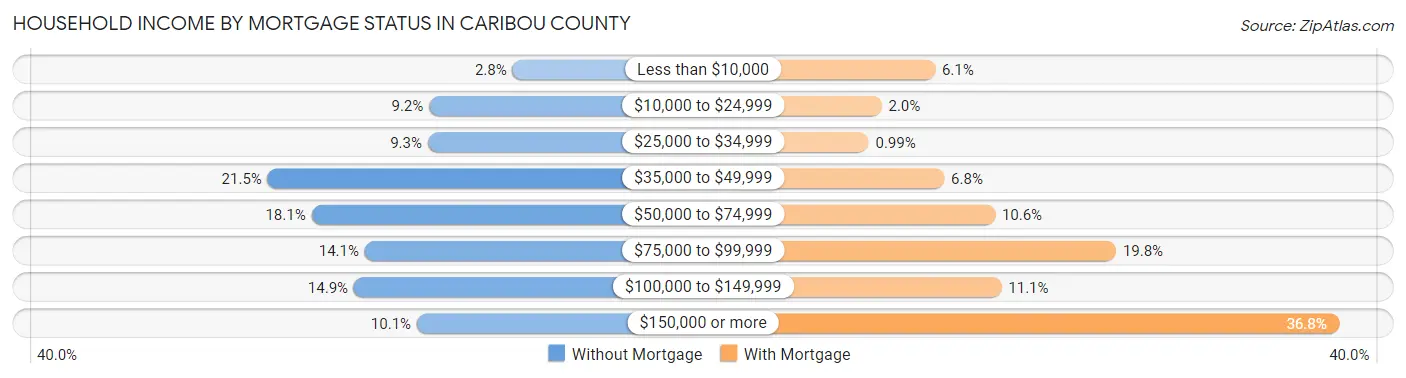
| Household Income | Without Mortgage | With Mortgage |
| Less than $10,000 | 27 (2.8%) | 61 (6.0%) |
| $10,000 to $24,999 | 88 (9.2%) | 20 (2.0%) |
| $25,000 to $34,999 | 89 (9.3%) | 10 (1.0%) |
| $35,000 to $49,999 | 206 (21.5%) | 68 (6.8%) |
| $50,000 to $74,999 | 174 (18.1%) | 107 (10.6%) |
| $75,000 to $99,999 | 135 (14.1%) | 200 (19.8%) |
| $100,000 to $149,999 | 143 (14.9%) | 112 (11.1%) |
| $150,000 or more | 97 (10.1%) | 371 (36.8%) |
| Total | 959 (100.0%) | 1,008 (100.0%) |
Property Value to Household Income Ratio in Caribou County
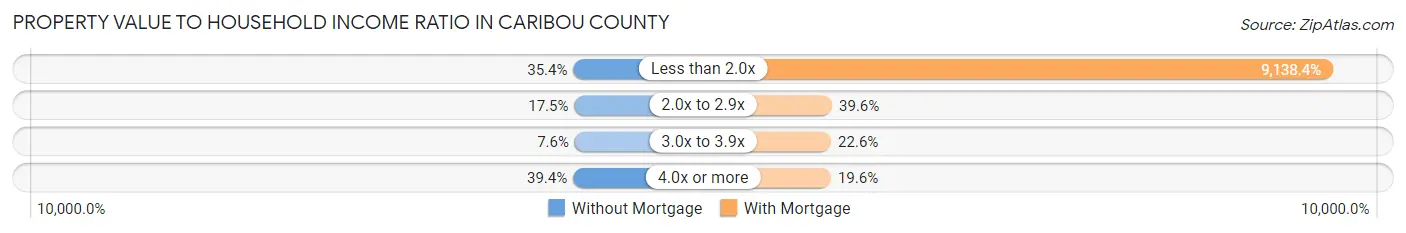
| Value-to-Income Ratio | Without Mortgage | With Mortgage |
| Less than 2.0x | 339 (35.3%) | 92,115 (9,138.4%) |
| 2.0x to 2.9x | 168 (17.5%) | 399 (39.6%) |
| 3.0x to 3.9x | 73 (7.6%) | 228 (22.6%) |
| 4.0x or more | 378 (39.4%) | 198 (19.6%) |
| Total | 959 (100.0%) | 1,008 (100.0%) |
Real Estate Taxes by Mortgage Status in Caribou County
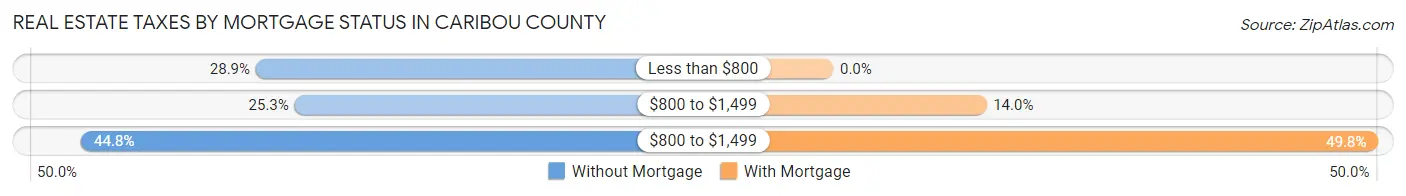
| Property Taxes | Without Mortgage | With Mortgage |
| Less than $800 | 277 (28.9%) | 0 (0.0%) |
| $800 to $1,499 | 243 (25.3%) | 141 (14.0%) |
| $800 to $1,499 | 430 (44.8%) | 502 (49.8%) |
| Total | 959 (100.0%) | 1,008 (100.0%) |
Health & Disability in Caribou County
Health Insurance Coverage by Age in Caribou County
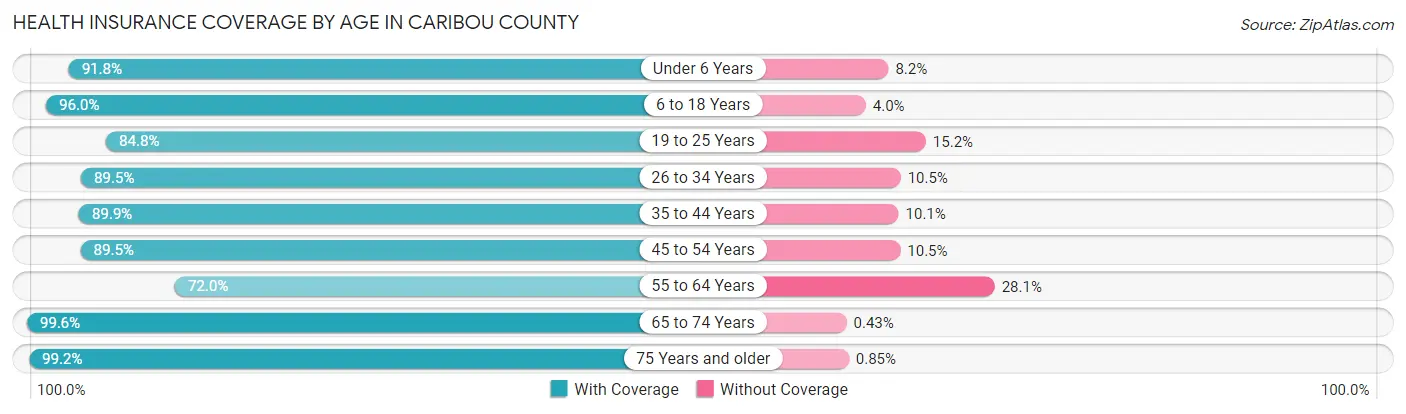
| Age Bracket | With Coverage | Without Coverage |
| Under 6 Years | 490 (91.8%) | 44 (8.2%) |
| 6 to 18 Years | 1,431 (96.0%) | 60 (4.0%) |
| 19 to 25 Years | 490 (84.8%) | 88 (15.2%) |
| 26 to 34 Years | 553 (89.5%) | 65 (10.5%) |
| 35 to 44 Years | 878 (89.9%) | 99 (10.1%) |
| 45 to 54 Years | 719 (89.5%) | 84 (10.5%) |
| 55 to 64 Years | 572 (72.0%) | 223 (28.1%) |
| 65 to 74 Years | 696 (99.6%) | 3 (0.4%) |
| 75 Years and older | 465 (99.2%) | 4 (0.9%) |
| Total | 6,294 (90.4%) | 670 (9.6%) |
Health Insurance Coverage by Citizenship Status in Caribou County
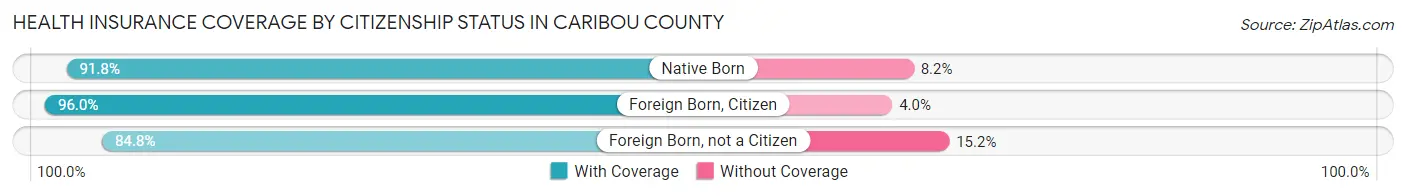
| Citizenship Status | With Coverage | Without Coverage |
| Native Born | 490 (91.8%) | 44 (8.2%) |
| Foreign Born, Citizen | 1,431 (96.0%) | 60 (4.0%) |
| Foreign Born, not a Citizen | 490 (84.8%) | 88 (15.2%) |
Health Insurance Coverage by Household Income in Caribou County
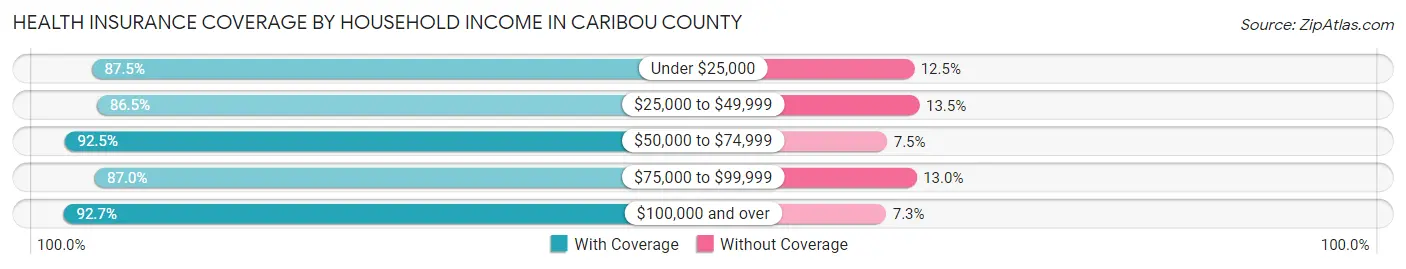
| Household Income | With Coverage | Without Coverage |
| Under $25,000 | 495 (87.5%) | 71 (12.5%) |
| $25,000 to $49,999 | 1,003 (86.5%) | 157 (13.5%) |
| $50,000 to $74,999 | 1,358 (92.5%) | 110 (7.5%) |
| $75,000 to $99,999 | 762 (87.0%) | 114 (13.0%) |
| $100,000 and over | 2,663 (92.7%) | 210 (7.3%) |
Public vs Private Health Insurance Coverage by Age in Caribou County
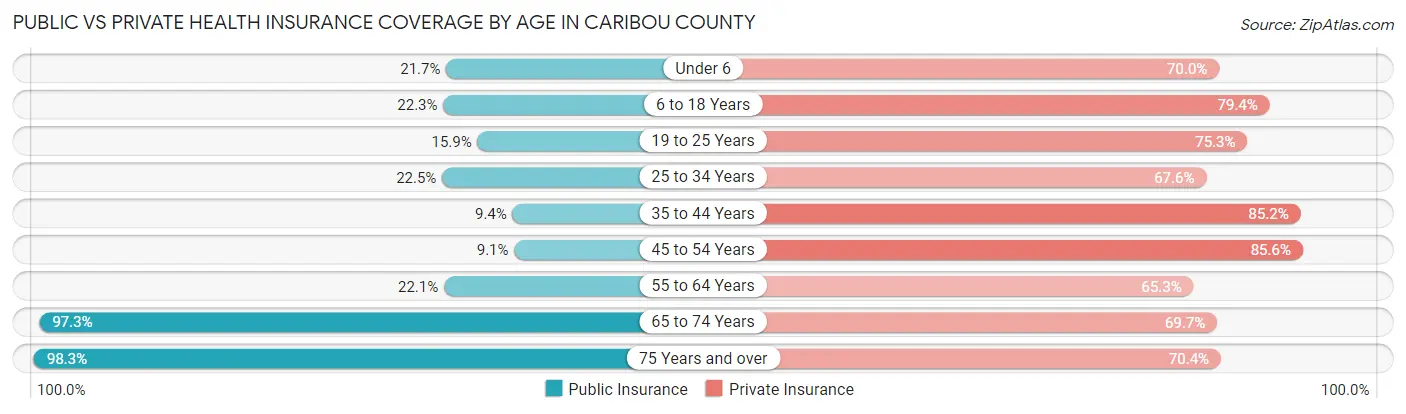
| Age Bracket | Public Insurance | Private Insurance |
| Under 6 | 116 (21.7%) | 374 (70.0%) |
| 6 to 18 Years | 332 (22.3%) | 1,184 (79.4%) |
| 19 to 25 Years | 92 (15.9%) | 435 (75.3%) |
| 25 to 34 Years | 139 (22.5%) | 418 (67.6%) |
| 35 to 44 Years | 92 (9.4%) | 832 (85.2%) |
| 45 to 54 Years | 73 (9.1%) | 687 (85.6%) |
| 55 to 64 Years | 176 (22.1%) | 519 (65.3%) |
| 65 to 74 Years | 680 (97.3%) | 487 (69.7%) |
| 75 Years and over | 461 (98.3%) | 330 (70.4%) |
| Total | 2,161 (31.0%) | 5,266 (75.6%) |
Disability Status by Sex by Age in Caribou County
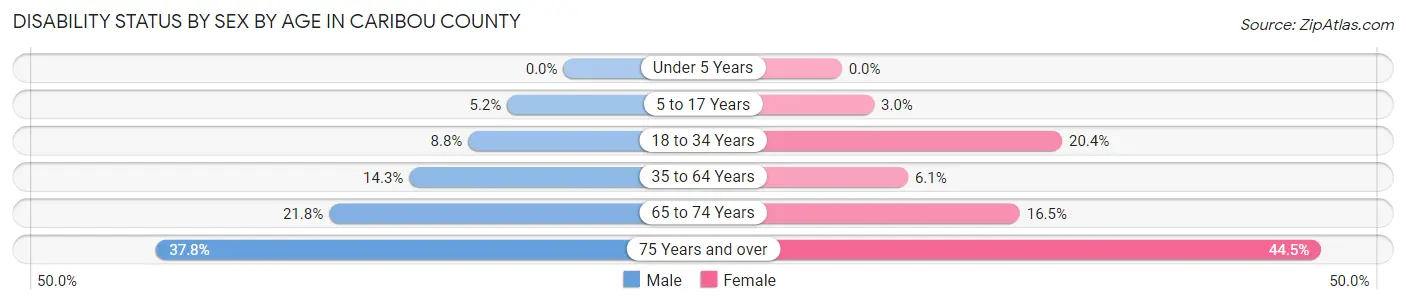
| Age Bracket | Male | Female |
| Under 5 Years | 0 (0.0%) | 0 (0.0%) |
| 5 to 17 Years | 41 (5.2%) | 22 (3.0%) |
| 18 to 34 Years | 59 (8.8%) | 121 (20.4%) |
| 35 to 64 Years | 203 (14.3%) | 71 (6.1%) |
| 65 to 74 Years | 77 (21.7%) | 57 (16.5%) |
| 75 Years and over | 71 (37.8%) | 125 (44.5%) |
Disability Class by Sex by Age in Caribou County
Disability Class: Hearing Difficulty
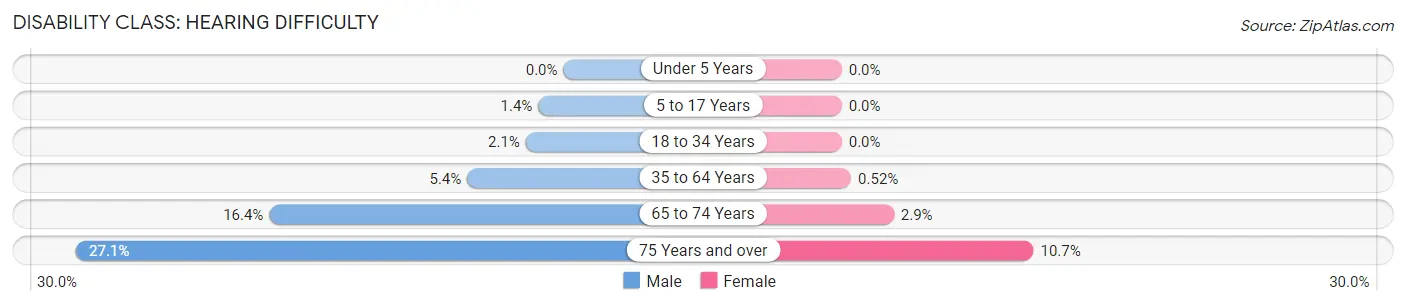
| Age Bracket | Male | Female |
| Under 5 Years | 0 (0.0%) | 0 (0.0%) |
| 5 to 17 Years | 11 (1.4%) | 0 (0.0%) |
| 18 to 34 Years | 14 (2.1%) | 0 (0.0%) |
| 35 to 64 Years | 76 (5.4%) | 6 (0.5%) |
| 65 to 74 Years | 58 (16.4%) | 10 (2.9%) |
| 75 Years and over | 51 (27.1%) | 30 (10.7%) |
Disability Class: Vision Difficulty
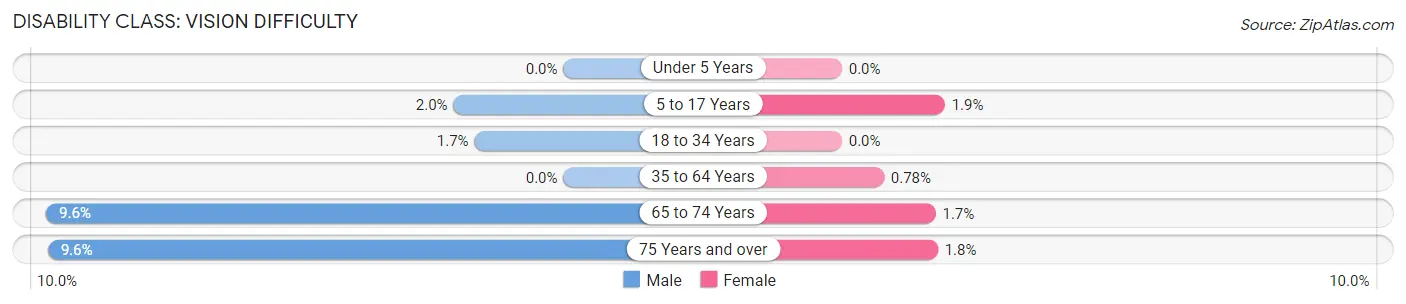
| Age Bracket | Male | Female |
| Under 5 Years | 0 (0.0%) | 0 (0.0%) |
| 5 to 17 Years | 16 (2.0%) | 14 (1.9%) |
| 18 to 34 Years | 11 (1.7%) | 0 (0.0%) |
| 35 to 64 Years | 0 (0.0%) | 9 (0.8%) |
| 65 to 74 Years | 34 (9.6%) | 6 (1.7%) |
| 75 Years and over | 18 (9.6%) | 5 (1.8%) |
Disability Class: Cognitive Difficulty
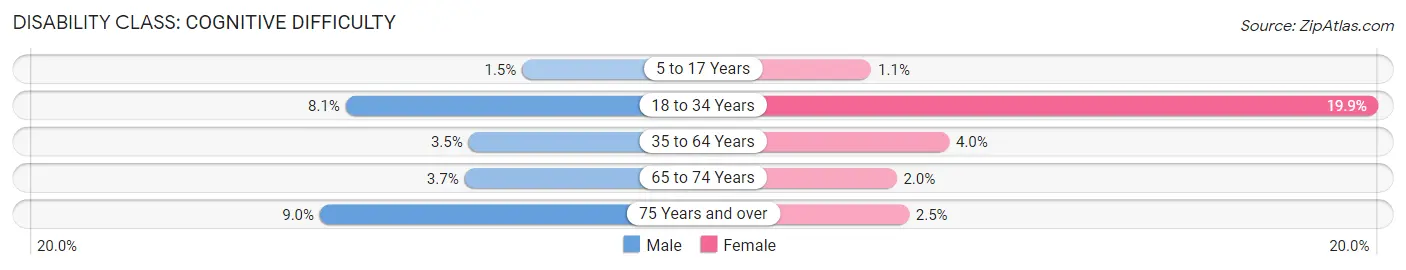
| Age Bracket | Male | Female |
| 5 to 17 Years | 12 (1.5%) | 8 (1.1%) |
| 18 to 34 Years | 54 (8.1%) | 118 (19.9%) |
| 35 to 64 Years | 50 (3.5%) | 46 (4.0%) |
| 65 to 74 Years | 13 (3.7%) | 7 (2.0%) |
| 75 Years and over | 17 (9.0%) | 7 (2.5%) |
Disability Class: Ambulatory Difficulty
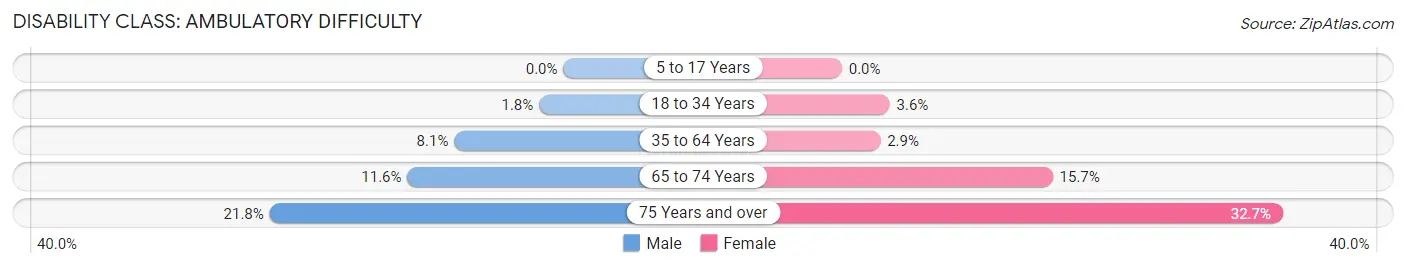
| Age Bracket | Male | Female |
| 5 to 17 Years | 0 (0.0%) | 0 (0.0%) |
| 18 to 34 Years | 12 (1.8%) | 21 (3.5%) |
| 35 to 64 Years | 115 (8.1%) | 33 (2.9%) |
| 65 to 74 Years | 41 (11.6%) | 54 (15.7%) |
| 75 Years and over | 41 (21.8%) | 92 (32.7%) |
Disability Class: Self-Care Difficulty
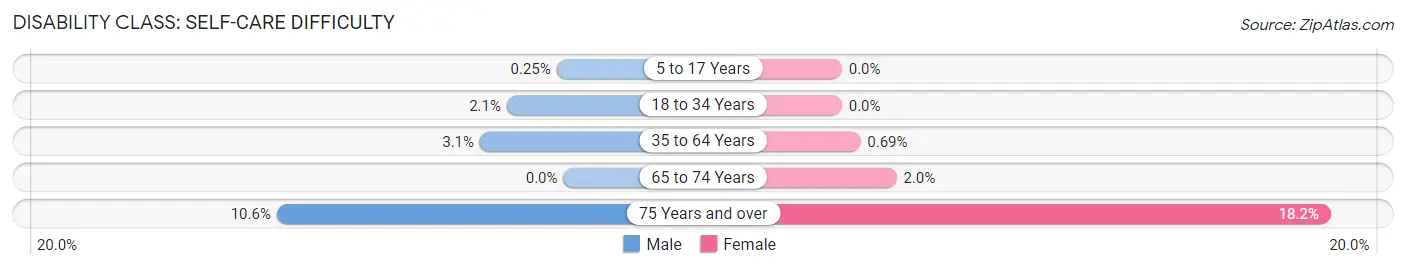
| Age Bracket | Male | Female |
| 5 to 17 Years | 2 (0.3%) | 0 (0.0%) |
| 18 to 34 Years | 14 (2.1%) | 0 (0.0%) |
| 35 to 64 Years | 44 (3.1%) | 8 (0.7%) |
| 65 to 74 Years | 0 (0.0%) | 7 (2.0%) |
| 75 Years and over | 20 (10.6%) | 51 (18.1%) |
Technology Access in Caribou County
Computing Device Access in Caribou County
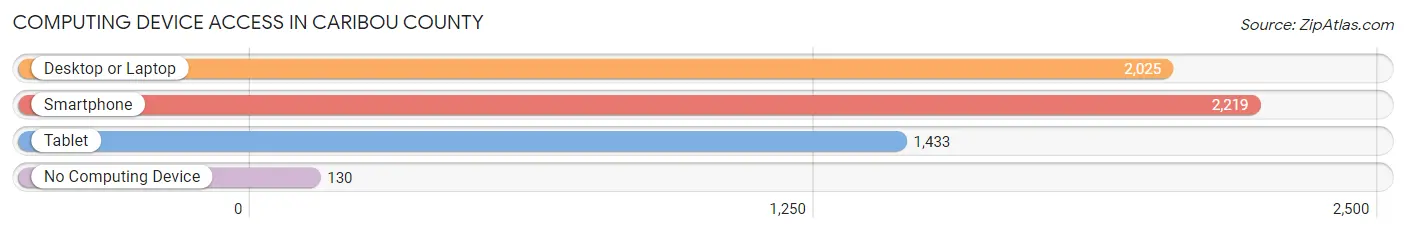
| Device Type | # Households | % Households |
| Desktop or Laptop | 2,025 | 80.1% |
| Smartphone | 2,219 | 87.8% |
| Tablet | 1,433 | 56.7% |
| No Computing Device | 130 | 5.1% |
| Total | 2,527 | 100.0% |
Internet Access in Caribou County
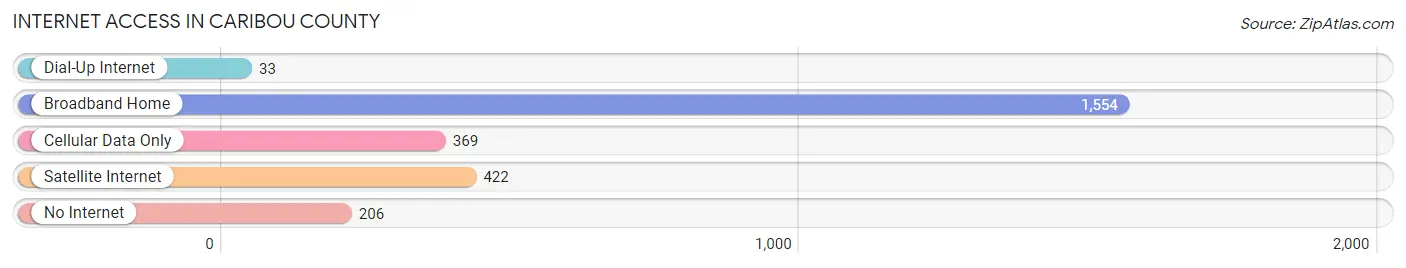
| Internet Type | # Households | % Households |
| Dial-Up Internet | 33 | 1.3% |
| Broadband Home | 1,554 | 61.5% |
| Cellular Data Only | 369 | 14.6% |
| Satellite Internet | 422 | 16.7% |
| No Internet | 206 | 8.2% |
| Total | 2,527 | 100.0% |
Caribou County Summary
Caribou County is located in the southeastern corner of Idaho, bordered by Wyoming to the east and Utah to the south. It is part of the Snake River Plain, a large area of flat land that stretches across the state. The county covers an area of 2,717 square miles and has a population of 6,945 as of the 2020 census.
History
Caribou County was established in 1919, when it was carved out of Bingham County. It was named after the Caribou Mountains, which are located in the county. The county was originally inhabited by the Shoshone and Bannock tribes, who were later displaced by settlers.
The first settlers in the area were Mormon pioneers, who arrived in the late 1800s. They established several small towns, including Soda Springs, which is now the county seat. The county was largely agricultural, with many farmers growing potatoes, wheat, and other crops.
In the early 1900s, the county began to develop its mining industry. Several gold and silver mines were established, and the county became a major producer of lead and zinc. The mining industry declined in the mid-1900s, but the county still has some active mines.
Geography
Caribou County is located in the southeastern corner of Idaho, bordered by Wyoming to the east and Utah to the south. It is part of the Snake River Plain, a large area of flat land that stretches across the state. The county covers an area of 2,717 square miles and has a population of 6,945 as of the 2020 census.
The county is mostly rural, with most of the population living in small towns and rural communities. The largest town is Soda Springs, which is the county seat. Other towns include Grace, McCammon, and Downey.
The county is home to several natural attractions, including the Caribou National Forest, which covers much of the county. The forest is home to a variety of wildlife, including elk, deer, and moose. The county also has several lakes and reservoirs, including Bear Lake, which is a popular destination for fishing and boating.
Economy
The economy of Caribou County is largely based on agriculture and mining. The county is a major producer of potatoes, wheat, and other crops. It is also home to several active mines, which produce lead and zinc.
The county also has a growing tourism industry, with many visitors coming to the area to enjoy the natural attractions. The county is home to several ski resorts, which attract visitors from all over the country.
Demographics
As of the 2020 census, the population of Caribou County was 6,945. The population is largely white (93.3%), with small percentages of Native American (2.2%), Hispanic (2.1%), and Asian (1.2%) residents. The median household income is $45,945, and the median home value is $150,000. The unemployment rate is 4.2%.
Common Questions
What is the Total Population of Caribou County?
Total Population of Caribou County is 7,058.
What is the Total Male Population of Caribou County?
Total Male Population of Caribou County is 3,704.
What is the Total Female Population of Caribou County?
Total Female Population of Caribou County is 3,354.
What is the Ratio of Males per 100 Females in Caribou County?
There are 110.44 Males per 100 Females in Caribou County.
What is the Ratio of Females per 100 Males in Caribou County?
There are 90.55 Females per 100 Males in Caribou County.
What is the Median Population Age in Caribou County?
Median Population Age in Caribou County is 37.9 Years.
What is the Average Family Size in Caribou County
Average Family Size in Caribou County is 3.5 People.
What is the Average Household Size in Caribou County
Average Household Size in Caribou County is 2.8 People.
What is Per Capita Income in Caribou County?
Per Capita income in Caribou County is $29,819.
What is the Median Family Income in Caribou County?
Median Family Income in Caribou County is $78,750.
What is the Median Household income in Caribou County?
Median Household Income in Caribou County is $65,380.
What is Income or Wage Gap in Caribou County?
Income or Wage Gap in Caribou County is 57.4%.
Women in Caribou County earn 42.6 cents for every dollar earned by a man.
What is Inequality or Gini Index in Caribou County?
Inequality or Gini Index in Caribou County is 0.40.
How Large is the Labor Force in Caribou County?
There are 3,479 People in the Labor Forcein in Caribou County.
What is the Percentage of People in the Labor Force in Caribou County?
63.9% of People are in the Labor Force in Caribou County.
What is the Unemployment Rate in Caribou County?
Unemployment Rate in Caribou County is 2.8%.