Canyon County, ID
Canyon County Overview
235,006
TOTAL POPULATION
117,340
MALE POPULATION
117,666
FEMALE POPULATION
99.72
MALES / 100 FEMALES
100.28
FEMALES / 100 MALES
34.4
MEDIAN AGE
3.3
AVG FAMILY SIZE
2.9
AVG HOUSEHOLD SIZE
$28,569
PER CAPITA INCOME
$78,620
AVG FAMILY INCOME
$68,473
AVG HOUSEHOLD INCOME
35.1%
WAGE / INCOME GAP [ % ]
64.9¢/ $1
WAGE / INCOME GAP [ $ ]
$12,020
FAMILY INCOME DEFICIT
0.39
INEQUALITY / GINI INDEX
112,690
LABOR FORCE [ PEOPLE ]
63.4%
PERCENT IN LABOR FORCE
3.5%
UNEMPLOYMENT RATE
Canyon County Area Codes
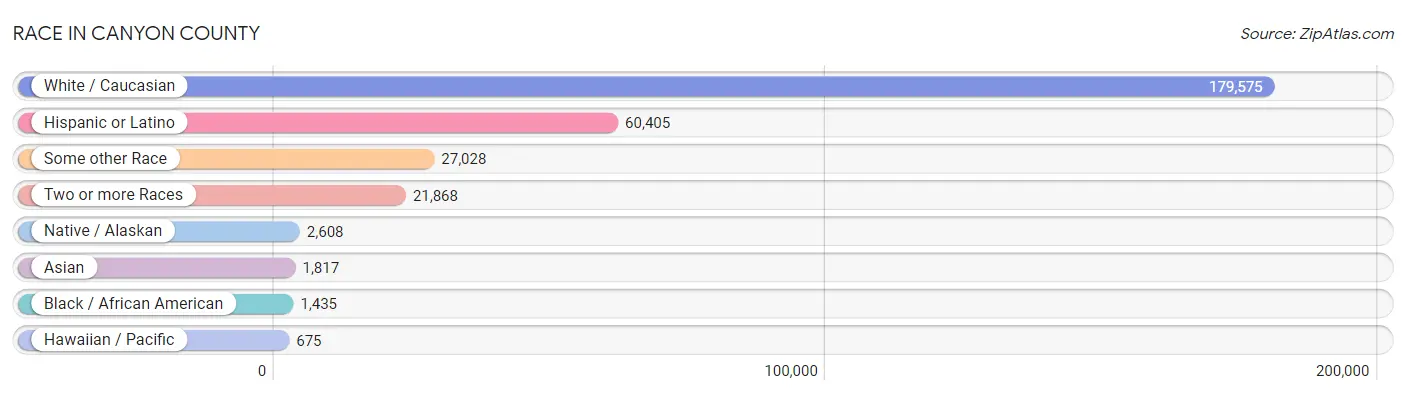
Race in Canyon County
The most populous races in Canyon County are White / Caucasian (179,575 | 76.4%), Hispanic or Latino (60,405 | 25.7%), and Some other Race (27,028 | 11.5%).
| Race | # Population | % Population |
| Asian | 1,817 | 0.8% |
| Black / African American | 1,435 | 0.6% |
| Hawaiian / Pacific | 675 | 0.3% |
| Hispanic or Latino | 60,405 | 25.7% |
| Native / Alaskan | 2,608 | 1.1% |
| White / Caucasian | 179,575 | 76.4% |
| Two or more Races | 21,868 | 9.3% |
| Some other Race | 27,028 | 11.5% |
| Total | 235,006 | 100.0% |
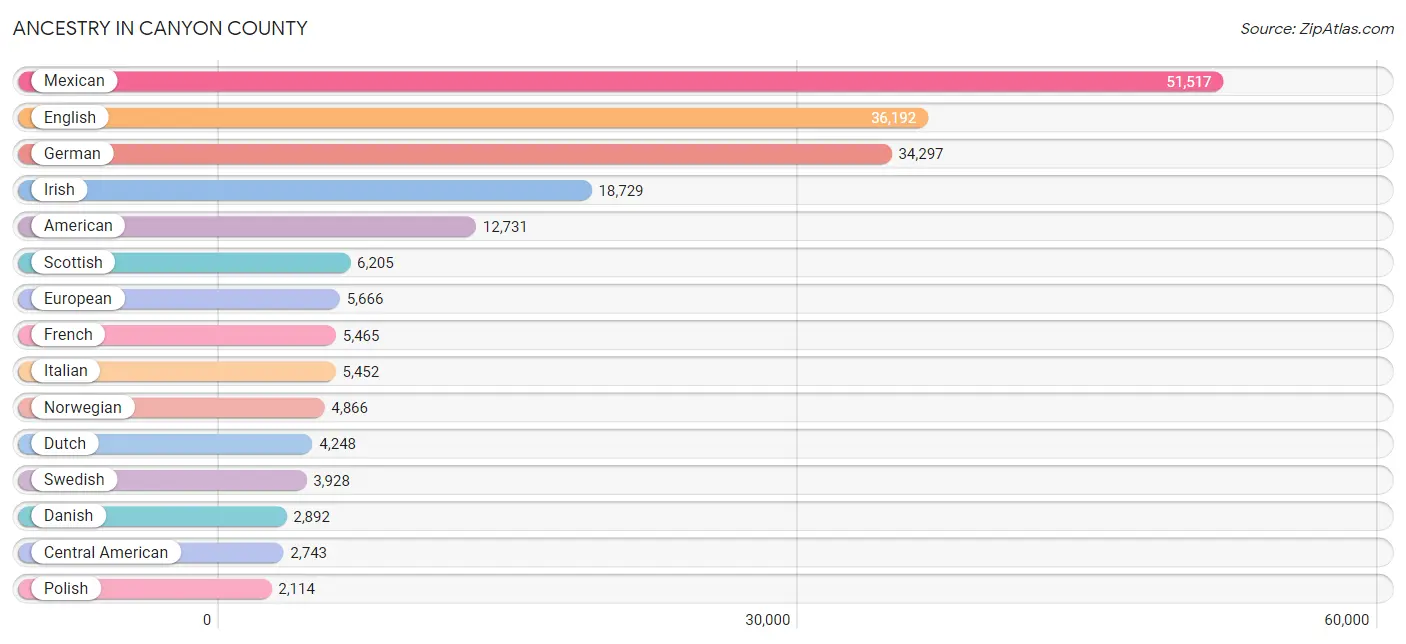
Ancestry in Canyon County
The most populous ancestries reported in Canyon County are Mexican (51,517 | 21.9%), English (36,192 | 15.4%), German (34,297 | 14.6%), Irish (18,729 | 8.0%), and American (12,731 | 5.4%), together accounting for 65.3% of all Canyon County residents.
| Ancestry | # Population | % Population |
| African | 160 | 0.1% |
| Alaska Native | 1 | 0.0% |
| Aleut | 5 | 0.0% |
| American | 12,731 | 5.4% |
| Apache | 472 | 0.2% |
| Arab | 517 | 0.2% |
| Argentinean | 12 | 0.0% |
| Armenian | 139 | 0.1% |
| Australian | 193 | 0.1% |
| Austrian | 243 | 0.1% |
| Basque | 480 | 0.2% |
| Belgian | 87 | 0.0% |
| Bhutanese | 570 | 0.2% |
| Blackfeet | 419 | 0.2% |
| Bolivian | 38 | 0.0% |
| Brazilian | 214 | 0.1% |
| British | 1,285 | 0.5% |
| Bulgarian | 287 | 0.1% |
| Burmese | 582 | 0.3% |
| Canadian | 634 | 0.3% |
| Celtic | 17 | 0.0% |
| Central American | 2,743 | 1.2% |
| Central American Indian | 189 | 0.1% |
| Cherokee | 846 | 0.4% |
| Cheyenne | 3 | 0.0% |
| Chickasaw | 52 | 0.0% |
| Chinese | 55 | 0.0% |
| Chippewa | 55 | 0.0% |
| Choctaw | 371 | 0.2% |
| Colombian | 346 | 0.2% |
| Comanche | 4 | 0.0% |
| Costa Rican | 23 | 0.0% |
| Creek | 20 | 0.0% |
| Croatian | 240 | 0.1% |
| Crow | 6 | 0.0% |
| Cuban | 76 | 0.0% |
| Czech | 661 | 0.3% |
| Czechoslovakian | 105 | 0.0% |
| Danish | 2,892 | 1.2% |
| Delaware | 7 | 0.0% |
| Dominican | 22 | 0.0% |
| Dutch | 4,248 | 1.8% |
| Eastern European | 308 | 0.1% |
| Egyptian | 6 | 0.0% |
| English | 36,192 | 15.4% |
| Ethiopian | 9 | 0.0% |
| European | 5,666 | 2.4% |
| Finnish | 381 | 0.2% |
| French | 5,465 | 2.3% |
| French American Indian | 2 | 0.0% |
| French Canadian | 843 | 0.4% |
| German | 34,297 | 14.6% |
| Greek | 706 | 0.3% |
| Guamanian / Chamorro | 36 | 0.0% |
| Guatemalan | 911 | 0.4% |
| Haitian | 31 | 0.0% |
| Hmong | 314 | 0.1% |
| Honduran | 383 | 0.2% |
| Hopi | 38 | 0.0% |
| Hungarian | 716 | 0.3% |
| Icelander | 25 | 0.0% |
| Indian (Asian) | 699 | 0.3% |
| Iranian | 18 | 0.0% |
| Iraqi | 33 | 0.0% |
| Irish | 18,729 | 8.0% |
| Iroquois | 29 | 0.0% |
| Italian | 5,452 | 2.3% |
| Jamaican | 7 | 0.0% |
| Japanese | 13 | 0.0% |
| Korean | 1,392 | 0.6% |
| Laotian | 1 | 0.0% |
| Latvian | 9 | 0.0% |
| Lebanese | 24 | 0.0% |
| Lithuanian | 171 | 0.1% |
| Luxembourger | 48 | 0.0% |
| Malaysian | 236 | 0.1% |
| Mexican | 51,517 | 21.9% |
| Mexican American Indian | 755 | 0.3% |
| Mongolian | 6 | 0.0% |
| Moroccan | 7 | 0.0% |
| Native Hawaiian | 887 | 0.4% |
| Navajo | 366 | 0.2% |
| New Zealander | 63 | 0.0% |
| Nicaraguan | 198 | 0.1% |
| Nigerian | 182 | 0.1% |
| Northern European | 712 | 0.3% |
| Norwegian | 4,866 | 2.1% |
| Osage | 37 | 0.0% |
| Ottawa | 9 | 0.0% |
| Pakistani | 345 | 0.2% |
| Palestinian | 10 | 0.0% |
| Pennsylvania German | 13 | 0.0% |
| Peruvian | 526 | 0.2% |
| Polish | 2,114 | 0.9% |
| Portuguese | 1,074 | 0.5% |
| Potawatomi | 34 | 0.0% |
| Pueblo | 103 | 0.0% |
| Puerto Rican | 1,295 | 0.5% |
| Romanian | 177 | 0.1% |
| Russian | 1,792 | 0.8% |
| Salvadoran | 1,228 | 0.5% |
| Samoan | 169 | 0.1% |
| Scandinavian | 1,621 | 0.7% |
| Scotch-Irish | 1,491 | 0.6% |
| Scottish | 6,205 | 2.6% |
| Serbian | 15 | 0.0% |
| Shoshone | 5 | 0.0% |
| Sioux | 184 | 0.1% |
| Slovak | 106 | 0.1% |
| Slovene | 102 | 0.0% |
| South African | 4 | 0.0% |
| South American | 1,156 | 0.5% |
| South American Indian | 43 | 0.0% |
| Spaniard | 1,286 | 0.5% |
| Spanish | 306 | 0.1% |
| Spanish American | 55 | 0.0% |
| Spanish American Indian | 65 | 0.0% |
| Sri Lankan | 360 | 0.2% |
| Subsaharan African | 399 | 0.2% |
| Swedish | 3,928 | 1.7% |
| Swiss | 1,460 | 0.6% |
| Syrian | 224 | 0.1% |
| Thai | 167 | 0.1% |
| Tongan | 230 | 0.1% |
| Turkish | 24 | 0.0% |
| U.S. Virgin Islander | 1 | 0.0% |
| Ugandan | 10 | 0.0% |
| Ukrainian | 1,042 | 0.4% |
| Uruguayan | 9 | 0.0% |
| Venezuelan | 225 | 0.1% |
| Welsh | 1,465 | 0.6% |
| West Indian | 18 | 0.0% |
| Yaqui | 53 | 0.0% |
| Yugoslavian | 111 | 0.1% |
| Yuman | 10 | 0.0% | View All 135 Rows |
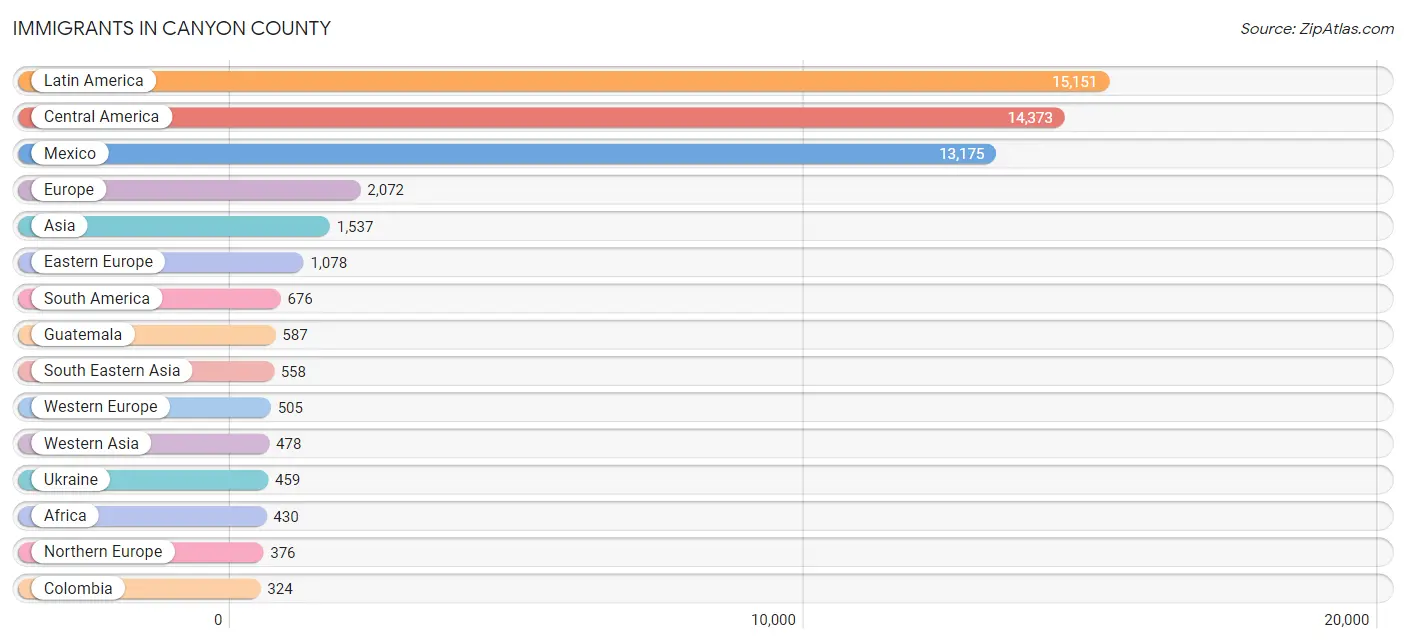
Immigrants in Canyon County
The most numerous immigrant groups reported in Canyon County came from Latin America (15,151 | 6.5%), Central America (14,373 | 6.1%), Mexico (13,175 | 5.6%), Europe (2,072 | 0.9%), and Asia (1,537 | 0.6%), together accounting for 19.7% of all Canyon County residents.
| Immigration Origin | # Population | % Population |
| Afghanistan | 90 | 0.0% |
| Africa | 430 | 0.2% |
| Armenia | 10 | 0.0% |
| Asia | 1,537 | 0.6% |
| Australia | 91 | 0.0% |
| Azores | 9 | 0.0% |
| Belarus | 15 | 0.0% |
| Bolivia | 22 | 0.0% |
| Bosnia and Herzegovina | 11 | 0.0% |
| Brazil | 85 | 0.0% |
| Bulgaria | 206 | 0.1% |
| Canada | 262 | 0.1% |
| Caribbean | 102 | 0.0% |
| Central America | 14,373 | 6.1% |
| China | 128 | 0.1% |
| Colombia | 324 | 0.1% |
| Congo | 15 | 0.0% |
| Costa Rica | 63 | 0.0% |
| Croatia | 10 | 0.0% |
| Cuba | 6 | 0.0% |
| Dominican Republic | 36 | 0.0% |
| Eastern Africa | 75 | 0.0% |
| Eastern Asia | 311 | 0.1% |
| Eastern Europe | 1,078 | 0.5% |
| El Salvador | 222 | 0.1% |
| England | 292 | 0.1% |
| Ethiopia | 75 | 0.0% |
| Europe | 2,072 | 0.9% |
| France | 79 | 0.0% |
| Germany | 300 | 0.1% |
| Guatemala | 587 | 0.3% |
| Haiti | 42 | 0.0% |
| Honduras | 248 | 0.1% |
| Hong Kong | 65 | 0.0% |
| Hungary | 53 | 0.0% |
| India | 51 | 0.0% |
| Indonesia | 17 | 0.0% |
| Iraq | 263 | 0.1% |
| Italy | 56 | 0.0% |
| Japan | 21 | 0.0% |
| Korea | 162 | 0.1% |
| Laos | 123 | 0.1% |
| Latin America | 15,151 | 6.5% |
| Latvia | 13 | 0.0% |
| Mexico | 13,175 | 5.6% |
| Middle Africa | 40 | 0.0% |
| Moldova | 29 | 0.0% |
| Morocco | 7 | 0.0% |
| Netherlands | 87 | 0.0% |
| Nicaragua | 66 | 0.0% |
| Nigeria | 102 | 0.0% |
| Northern Africa | 85 | 0.0% |
| Northern Europe | 376 | 0.2% |
| Norway | 24 | 0.0% |
| Oceania | 203 | 0.1% |
| Peru | 201 | 0.1% |
| Philippines | 135 | 0.1% |
| Poland | 14 | 0.0% |
| Portugal | 9 | 0.0% |
| Romania | 83 | 0.0% |
| Russia | 166 | 0.1% |
| Saudi Arabia | 9 | 0.0% |
| Sierra Leone | 23 | 0.0% |
| South America | 676 | 0.3% |
| South Central Asia | 190 | 0.1% |
| South Eastern Asia | 558 | 0.2% |
| Southern Europe | 113 | 0.1% |
| Spain | 48 | 0.0% |
| Sudan | 78 | 0.0% |
| Sweden | 4 | 0.0% |
| Switzerland | 39 | 0.0% |
| Syria | 100 | 0.0% |
| Taiwan | 14 | 0.0% |
| Thailand | 21 | 0.0% |
| Ukraine | 459 | 0.2% |
| Uruguay | 9 | 0.0% |
| Uzbekistan | 49 | 0.0% |
| Venezuela | 35 | 0.0% |
| Vietnam | 250 | 0.1% |
| West Indies | 18 | 0.0% |
| Western Africa | 125 | 0.1% |
| Western Asia | 478 | 0.2% |
| Western Europe | 505 | 0.2% |
| Zaire | 25 | 0.0% | View All 84 Rows |
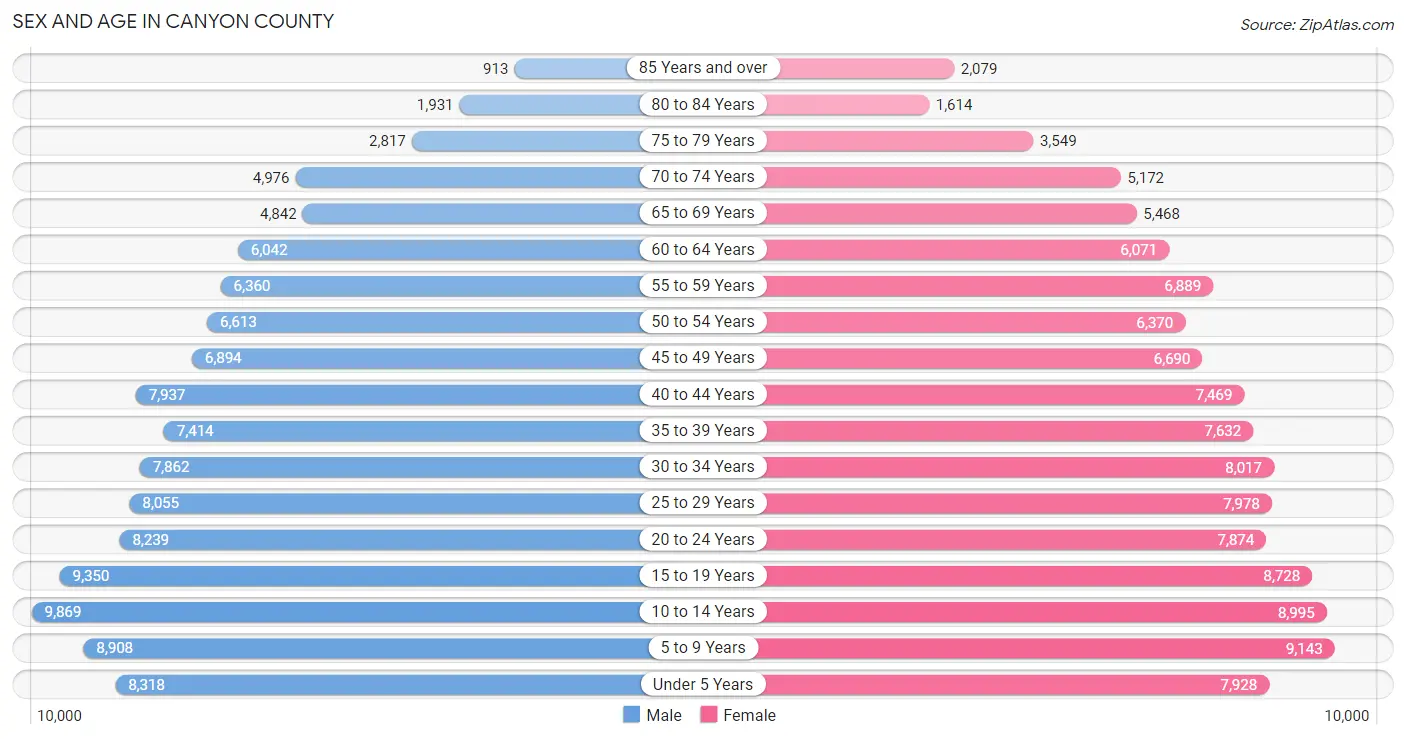
Sex and Age in Canyon County
Sex and Age in Canyon County
The most populous age groups in Canyon County are 10 to 14 Years (9,869 | 8.4%) for men and 5 to 9 Years (9,143 | 7.8%) for women.
| Age Bracket | Male | Female |
| Under 5 Years | 8,318 (7.1%) | 7,928 (6.7%) |
| 5 to 9 Years | 8,908 (7.6%) | 9,143 (7.8%) |
| 10 to 14 Years | 9,869 (8.4%) | 8,995 (7.6%) |
| 15 to 19 Years | 9,350 (8.0%) | 8,728 (7.4%) |
| 20 to 24 Years | 8,239 (7.0%) | 7,874 (6.7%) |
| 25 to 29 Years | 8,055 (6.9%) | 7,978 (6.8%) |
| 30 to 34 Years | 7,862 (6.7%) | 8,017 (6.8%) |
| 35 to 39 Years | 7,414 (6.3%) | 7,632 (6.5%) |
| 40 to 44 Years | 7,937 (6.8%) | 7,469 (6.4%) |
| 45 to 49 Years | 6,894 (5.9%) | 6,690 (5.7%) |
| 50 to 54 Years | 6,613 (5.6%) | 6,370 (5.4%) |
| 55 to 59 Years | 6,360 (5.4%) | 6,889 (5.9%) |
| 60 to 64 Years | 6,042 (5.1%) | 6,071 (5.2%) |
| 65 to 69 Years | 4,842 (4.1%) | 5,468 (4.6%) |
| 70 to 74 Years | 4,976 (4.2%) | 5,172 (4.4%) |
| 75 to 79 Years | 2,817 (2.4%) | 3,549 (3.0%) |
| 80 to 84 Years | 1,931 (1.7%) | 1,614 (1.4%) |
| 85 Years and over | 913 (0.8%) | 2,079 (1.8%) |
| Total | 117,340 (100.0%) | 117,666 (100.0%) |
Families and Households in Canyon County
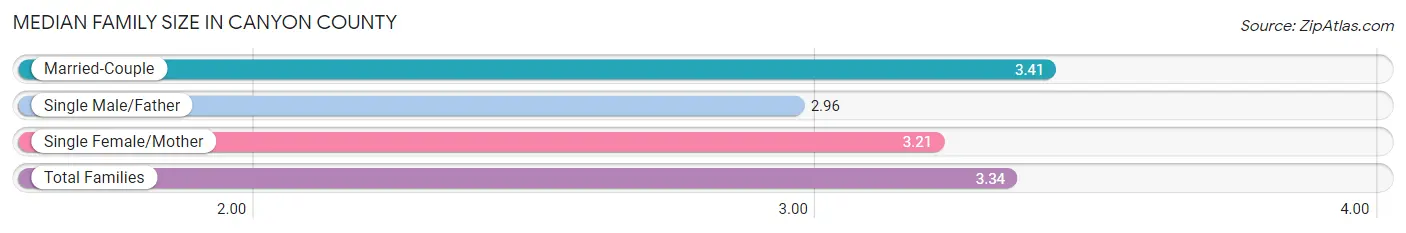
Median Family Size in Canyon County
The median family size in Canyon County is 3.34 persons per family, with married-couple families (44,796 | 76.3%) accounting for the largest median family size of 3.41 persons per family. On the other hand, single male/father families (4,984 | 8.5%) represent the smallest median family size with 2.96 persons per family.
| Family Type | # Families | Family Size |
| Married-Couple | 44,796 (76.3%) | 3.41 |
| Single Male/Father | 4,984 (8.5%) | 2.96 |
| Single Female/Mother | 8,902 (15.2%) | 3.21 |
| Total Families | 58,682 (100.0%) | 3.34 |
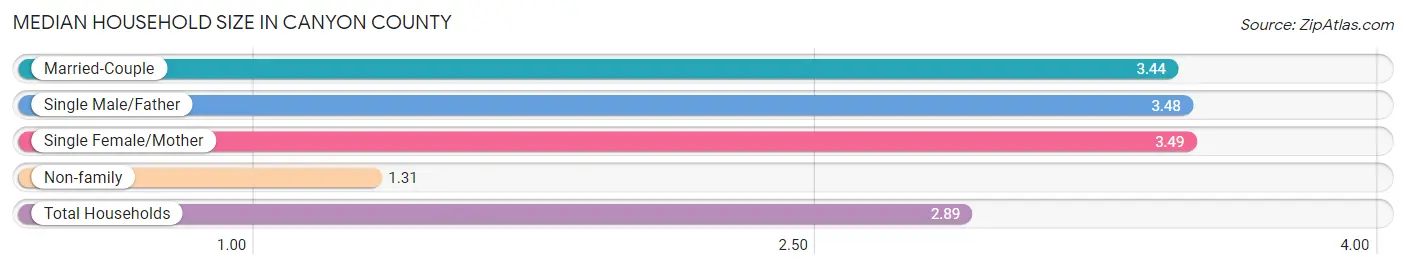
Median Household Size in Canyon County
The median household size in Canyon County is 2.89 persons per household, with single female/mother households (8,902 | 11.2%) accounting for the largest median household size of 3.49 persons per household. non-family households (21,046 | 26.4%) represent the smallest median household size with 1.31 persons per household.
| Household Type | # Households | Household Size |
| Married-Couple | 44,796 (56.2%) | 3.44 |
| Single Male/Father | 4,984 (6.2%) | 3.48 |
| Single Female/Mother | 8,902 (11.2%) | 3.49 |
| Non-family | 21,046 (26.4%) | 1.31 |
| Total Households | 79,728 (100.0%) | 2.89 |
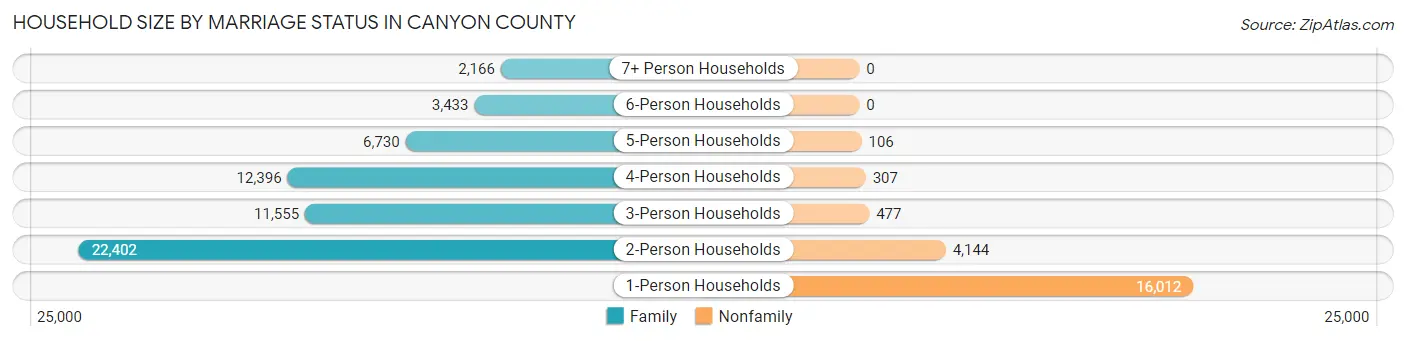
Household Size by Marriage Status in Canyon County
Out of a total of 79,728 households in Canyon County, 58,682 (73.6%) are family households, while 21,046 (26.4%) are nonfamily households. The most numerous type of family households are 2-person households, comprising 22,402, and the most common type of nonfamily households are 1-person households, comprising 16,012.
| Household Size | Family Households | Nonfamily Households |
| 1-Person Households | - | 16,012 (20.1%) |
| 2-Person Households | 22,402 (28.1%) | 4,144 (5.2%) |
| 3-Person Households | 11,555 (14.5%) | 477 (0.6%) |
| 4-Person Households | 12,396 (15.5%) | 307 (0.4%) |
| 5-Person Households | 6,730 (8.4%) | 106 (0.1%) |
| 6-Person Households | 3,433 (4.3%) | 0 (0.0%) |
| 7+ Person Households | 2,166 (2.7%) | 0 (0.0%) |
| Total | 58,682 (73.6%) | 21,046 (26.4%) |
Female Fertility in Canyon County
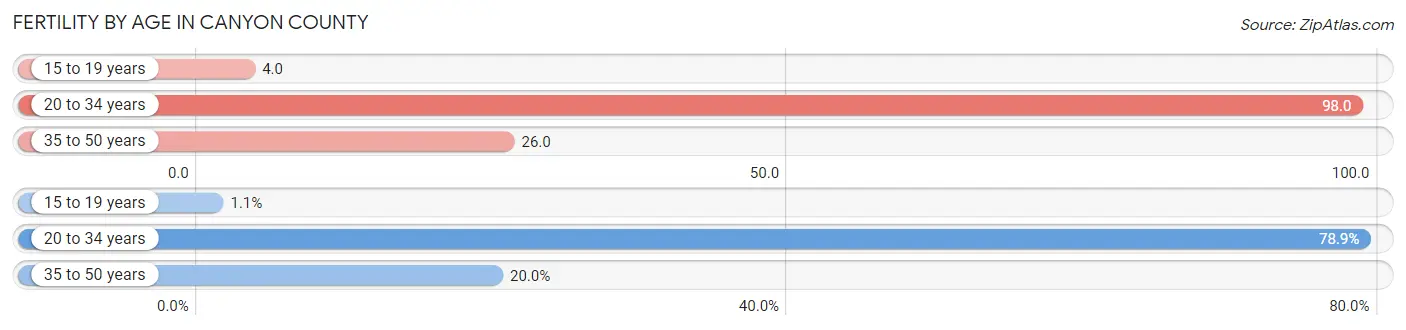
Fertility by Age in Canyon County
Average fertility rate in Canyon County is 53.0 births per 1,000 women. Women in the age bracket of 20 to 34 years have the highest fertility rate with 98.0 births per 1,000 women. Women in the age bracket of 20 to 34 years acount for 78.9% of all women with births.
| Age Bracket | Women with Births | Births / 1,000 Women |
| 15 to 19 years | 31 (1.1%) | 4.0 |
| 20 to 34 years | 2,330 (78.9%) | 98.0 |
| 35 to 50 years | 591 (20.0%) | 26.0 |
| Total | 2,952 (100.0%) | 53.0 |
Fertility by Age by Marriage Status in Canyon County
79.4% of women with births (2,952) in Canyon County are married. The highest percentage of unmarried women with births falls into 15 to 19 years age bracket with 29.0% of them unmarried at the time of birth, while the lowest percentage of unmarried women with births belong to 35 to 50 years age bracket with 5.6% of them unmarried.
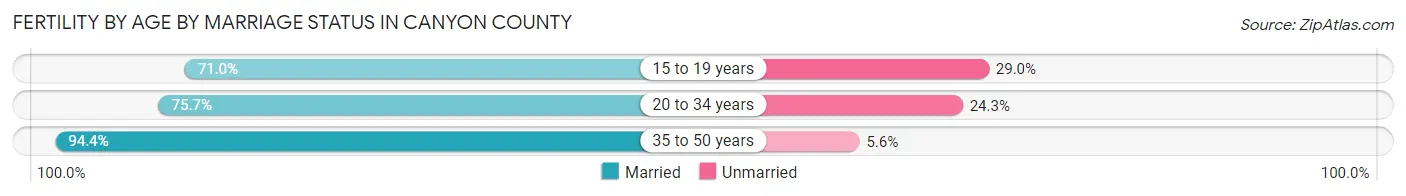
| Age Bracket | Married | Unmarried |
| 15 to 19 years | 22 (71.0%) | 9 (29.0%) |
| 20 to 34 years | 1,764 (75.7%) | 566 (24.3%) |
| 35 to 50 years | 558 (94.4%) | 33 (5.6%) |
| Total | 2,344 (79.4%) | 608 (20.6%) |
Fertility by Education in Canyon County
Average fertility rate in Canyon County is 53.0 births per 1,000 women. Women with the education attainment of bachelor's degree have the highest fertility rate of 86.0 births per 1,000 women, while women with the education attainment of less than high school have the lowest fertility at 30.0 births per 1,000 women. Women with the education attainment of college or associate's degree represent 36.9% of all women with births.
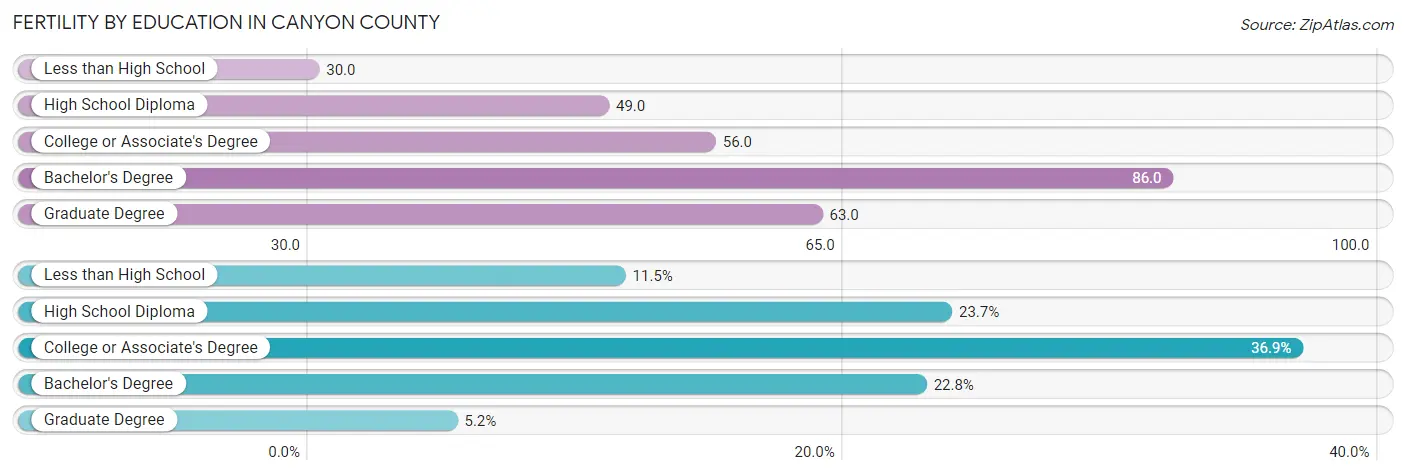
| Educational Attainment | Women with Births | Births / 1,000 Women |
| Less than High School | 339 (11.5%) | 30.0 |
| High School Diploma | 700 (23.7%) | 49.0 |
| College or Associate's Degree | 1,088 (36.9%) | 56.0 |
| Bachelor's Degree | 672 (22.8%) | 86.0 |
| Graduate Degree | 153 (5.2%) | 63.0 |
| Total | 2,952 (100.0%) | 53.0 |
Fertility by Education by Marriage Status in Canyon County
20.6% of women with births in Canyon County are unmarried. Women with the educational attainment of graduate degree are most likely to be married with 92.2% of them married at childbirth, while women with the educational attainment of high school diploma are least likely to be married with 35.0% of them unmarried at childbirth.
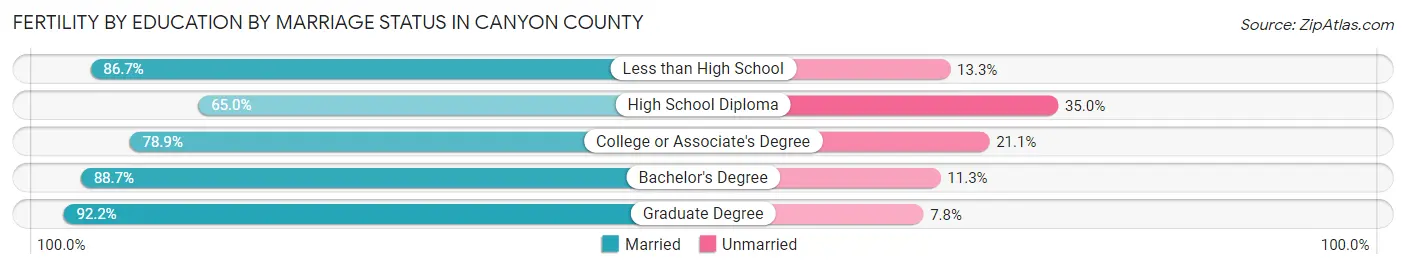
| Educational Attainment | Married | Unmarried |
| Less than High School | 294 (86.7%) | 45 (13.3%) |
| High School Diploma | 455 (65.0%) | 245 (35.0%) |
| College or Associate's Degree | 858 (78.9%) | 230 (21.1%) |
| Bachelor's Degree | 596 (88.7%) | 76 (11.3%) |
| Graduate Degree | 141 (92.2%) | 12 (7.8%) |
| Total | 2,344 (79.4%) | 608 (20.6%) |
Income in Canyon County
Income Overview in Canyon County
Per Capita Income in Canyon County is $28,569, while median incomes of families and households are $78,620 and $68,473 respectively.
| Characteristic | Number | Measure |
| Per Capita Income | 235,006 | $28,569 |
| Median Family Income | 58,682 | $78,620 |
| Mean Family Income | 58,682 | $92,157 |
| Median Household Income | 79,728 | $68,473 |
| Mean Household Income | 79,728 | $82,742 |
| Income Deficit | 58,682 | $12,020 |
| Wage / Income Gap (%) | 235,006 | 35.09% |
| Wage / Income Gap ($) | 235,006 | 64.91¢ per $1 |
| Gini / Inequality Index | 235,006 | 0.39 |
Earnings by Sex in Canyon County
Average Earnings in Canyon County are $34,988, $41,784 for men and $27,123 for women, a difference of 35.1%.
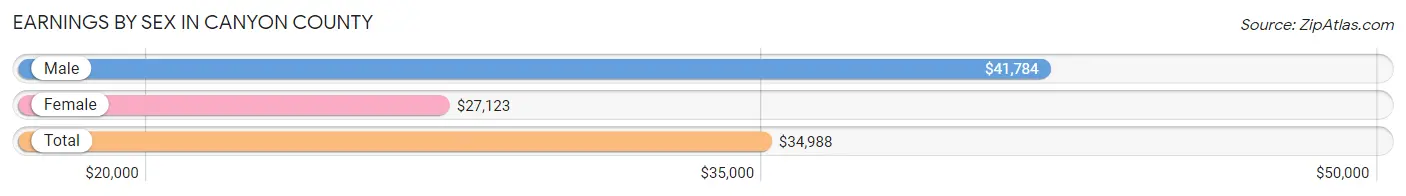
| Sex | Number | Average Earnings |
| Male | 65,833 (54.2%) | $41,784 |
| Female | 55,705 (45.8%) | $27,123 |
| Total | 121,538 (100.0%) | $34,988 |
Earnings by Sex by Income Bracket in Canyon County
The most common earnings brackets in Canyon County are $75,000 to $99,999 for men (6,915 | 10.5%) and $25,000 to $29,999 for women (4,798 | 8.6%).
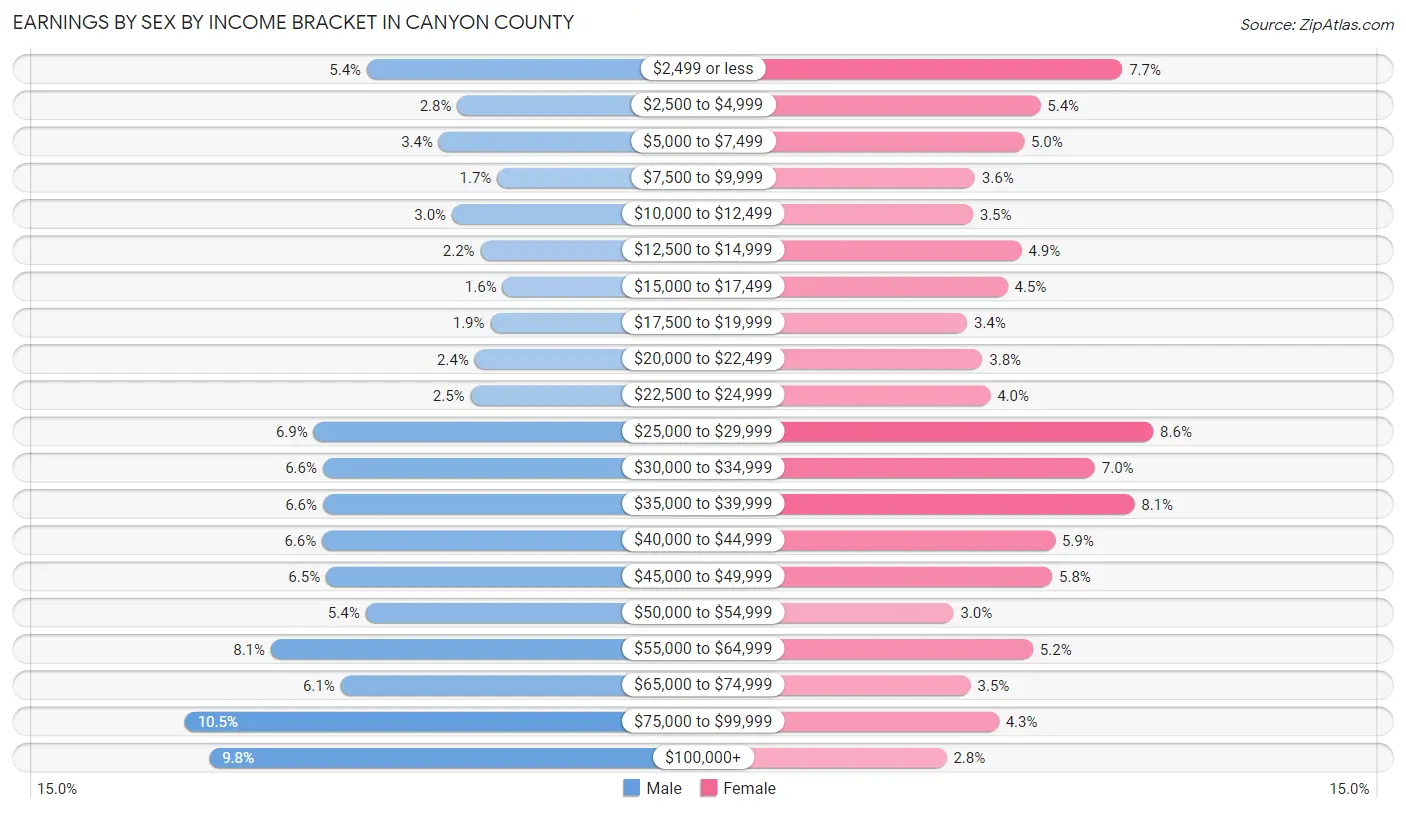
| Income | Male | Female |
| $2,499 or less | 3,544 (5.4%) | 4,309 (7.7%) |
| $2,500 to $4,999 | 1,871 (2.8%) | 3,029 (5.4%) |
| $5,000 to $7,499 | 2,214 (3.4%) | 2,775 (5.0%) |
| $7,500 to $9,999 | 1,133 (1.7%) | 2,005 (3.6%) |
| $10,000 to $12,499 | 1,968 (3.0%) | 1,972 (3.5%) |
| $12,500 to $14,999 | 1,444 (2.2%) | 2,733 (4.9%) |
| $15,000 to $17,499 | 1,034 (1.6%) | 2,516 (4.5%) |
| $17,500 to $19,999 | 1,256 (1.9%) | 1,883 (3.4%) |
| $20,000 to $22,499 | 1,545 (2.4%) | 2,121 (3.8%) |
| $22,500 to $24,999 | 1,624 (2.5%) | 2,244 (4.0%) |
| $25,000 to $29,999 | 4,528 (6.9%) | 4,798 (8.6%) |
| $30,000 to $34,999 | 4,360 (6.6%) | 3,885 (7.0%) |
| $35,000 to $39,999 | 4,357 (6.6%) | 4,499 (8.1%) |
| $40,000 to $44,999 | 4,369 (6.6%) | 3,258 (5.9%) |
| $45,000 to $49,999 | 4,296 (6.5%) | 3,216 (5.8%) |
| $50,000 to $54,999 | 3,570 (5.4%) | 1,672 (3.0%) |
| $55,000 to $64,999 | 5,317 (8.1%) | 2,914 (5.2%) |
| $65,000 to $74,999 | 4,027 (6.1%) | 1,940 (3.5%) |
| $75,000 to $99,999 | 6,915 (10.5%) | 2,377 (4.3%) |
| $100,000+ | 6,461 (9.8%) | 1,559 (2.8%) |
| Total | 65,833 (100.0%) | 55,705 (100.0%) |
Earnings by Sex by Educational Attainment in Canyon County
Average earnings in Canyon County are $47,574 for men and $32,782 for women, a difference of 31.1%. Men with an educational attainment of graduate degree enjoy the highest average annual earnings of $76,190, while those with less than high school education earn the least with $41,866. Women with an educational attainment of graduate degree earn the most with the average annual earnings of $56,773, while those with less than high school education have the smallest earnings of $22,216.
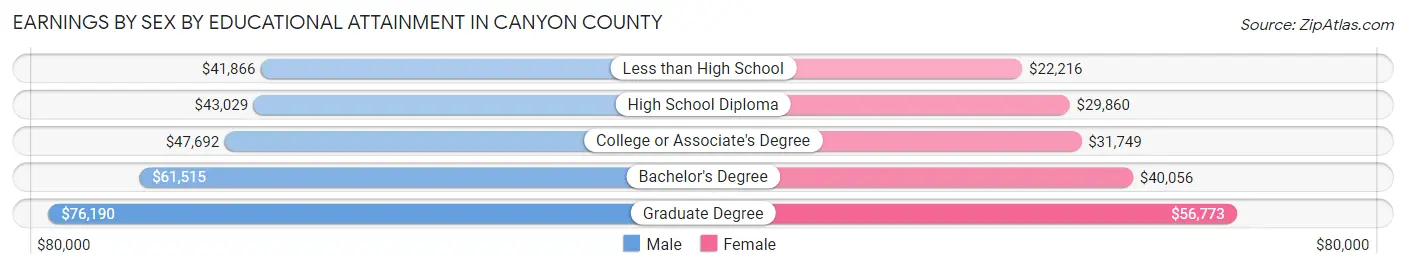
| Educational Attainment | Male Income | Female Income |
| Less than High School | $41,866 | $22,216 |
| High School Diploma | $43,029 | $29,860 |
| College or Associate's Degree | $47,692 | $31,749 |
| Bachelor's Degree | $61,515 | $40,056 |
| Graduate Degree | $76,190 | $56,773 |
| Total | $47,574 | $32,782 |
Family Income in Canyon County
Family Income Brackets in Canyon County
According to the Canyon County family income data, there are 12,910 families falling into the $100,000 to $149,999 income range, which is the most common income bracket and makes up 22.0% of all families. Conversely, the $10,000 to $14,999 income bracket is the least frequent group with only 880 families (1.5%) belonging to this category.
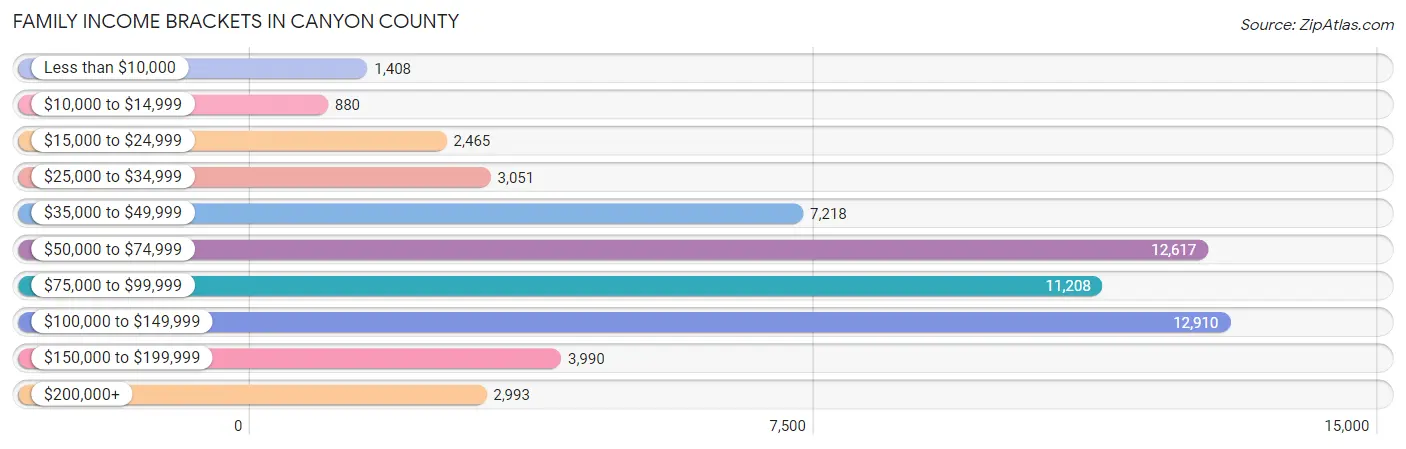
| Income Bracket | # Families | % Families |
| Less than $10,000 | 1,408 | 2.4% |
| $10,000 to $14,999 | 880 | 1.5% |
| $15,000 to $24,999 | 2,465 | 4.2% |
| $25,000 to $34,999 | 3,051 | 5.2% |
| $35,000 to $49,999 | 7,218 | 12.3% |
| $50,000 to $74,999 | 12,617 | 21.5% |
| $75,000 to $99,999 | 11,208 | 19.1% |
| $100,000 to $149,999 | 12,910 | 22.0% |
| $150,000 to $199,999 | 3,990 | 6.8% |
| $200,000+ | 2,993 | 5.1% |
Family Income by Famaliy Size in Canyon County
7+ person families (1,868 | 3.2%) account for the highest median family income in Canyon County with $100,081 per family, while 2-person families (24,297 | 41.4%) have the highest median income of $34,587 per family member.
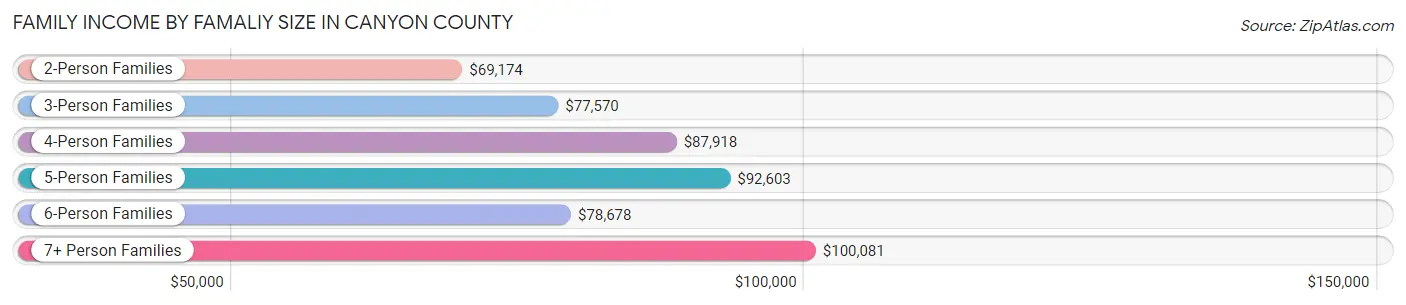
| Income Bracket | # Families | Median Income |
| 2-Person Families | 24,297 (41.4%) | $69,174 |
| 3-Person Families | 11,734 (20.0%) | $77,570 |
| 4-Person Families | 11,280 (19.2%) | $87,918 |
| 5-Person Families | 6,424 (11.0%) | $92,603 |
| 6-Person Families | 3,079 (5.2%) | $78,678 |
| 7+ Person Families | 1,868 (3.2%) | $100,081 |
| Total | 58,682 (100.0%) | $78,620 |
Family Income by Number of Earners in Canyon County
The median family income in Canyon County is $78,620, with families comprising 3+ earners (8,430) having the highest median family income of $111,234, while families with no earners (7,898) have the lowest median family income of $51,192, accounting for 14.4% and 13.5% of families, respectively.
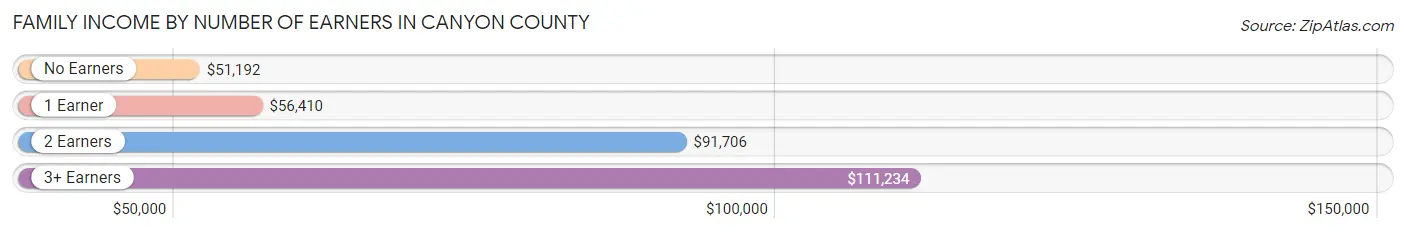
| Number of Earners | # Families | Median Income |
| No Earners | 7,898 (13.5%) | $51,192 |
| 1 Earner | 17,674 (30.1%) | $56,410 |
| 2 Earners | 24,680 (42.1%) | $91,706 |
| 3+ Earners | 8,430 (14.4%) | $111,234 |
| Total | 58,682 (100.0%) | $78,620 |
Household Income in Canyon County
Household Income Brackets in Canyon County
With 17,142 households falling in the category, the $50,000 to $74,999 income range is the most frequent in Canyon County, accounting for 21.5% of all households. In contrast, only 2,312 households (2.9%) fall into the $10,000 to $14,999 income bracket, making it the least populous group.
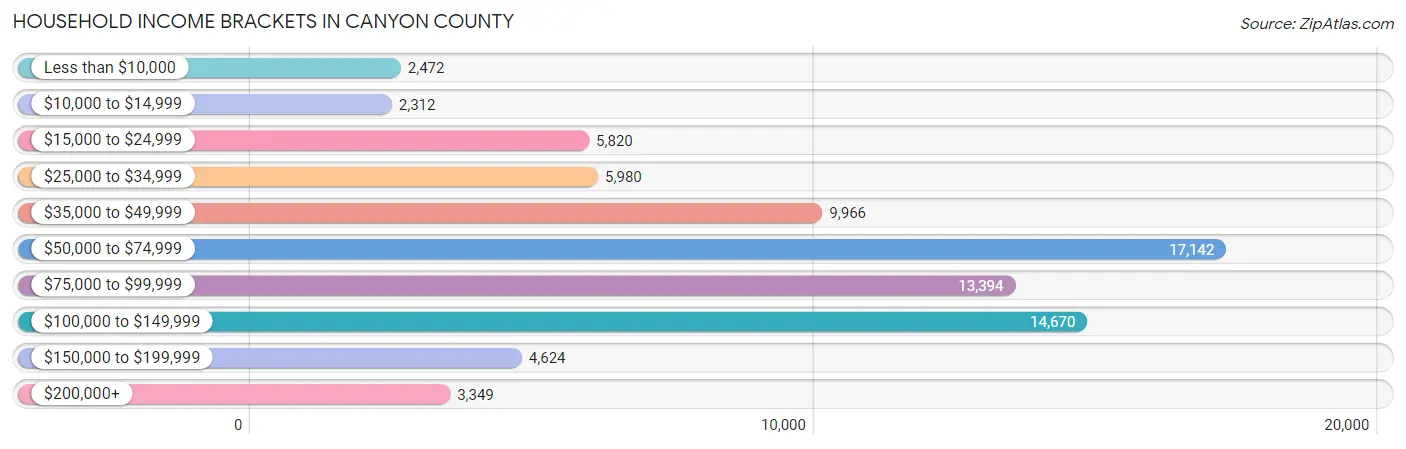
| Income Bracket | # Households | % Households |
| Less than $10,000 | 2,472 | 3.1% |
| $10,000 to $14,999 | 2,312 | 2.9% |
| $15,000 to $24,999 | 5,820 | 7.3% |
| $25,000 to $34,999 | 5,980 | 7.5% |
| $35,000 to $49,999 | 9,966 | 12.5% |
| $50,000 to $74,999 | 17,142 | 21.5% |
| $75,000 to $99,999 | 13,394 | 16.8% |
| $100,000 to $149,999 | 14,670 | 18.4% |
| $150,000 to $199,999 | 4,624 | 5.8% |
| $200,000+ | 3,349 | 4.2% |
Household Income by Householder Age in Canyon County
The median household income in Canyon County is $68,473, with the highest median household income of $79,508 found in the 45 to 64 years age bracket for the primary householder. A total of 28,092 households (35.2%) fall into this category. Meanwhile, the 65+ years age bracket for the primary householder has the lowest median household income of $52,622, with 20,004 households (25.1%) in this group.
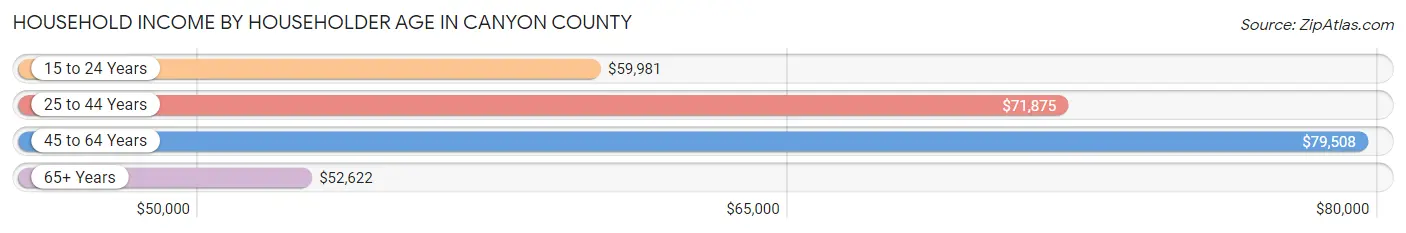
| Income Bracket | # Households | Median Income |
| 15 to 24 Years | 3,520 (4.4%) | $59,981 |
| 25 to 44 Years | 28,112 (35.3%) | $71,875 |
| 45 to 64 Years | 28,092 (35.2%) | $79,508 |
| 65+ Years | 20,004 (25.1%) | $52,622 |
| Total | 79,728 (100.0%) | $68,473 |
Poverty in Canyon County
Income Below Poverty by Sex and Age in Canyon County
With 9.1% poverty level for males and 11.3% for females among the residents of Canyon County, 15 year old males and 18 to 24 year old females are the most vulnerable to poverty, with 323 males (15.9%) and 1,664 females (16.6%) in their respective age groups living below the poverty level.
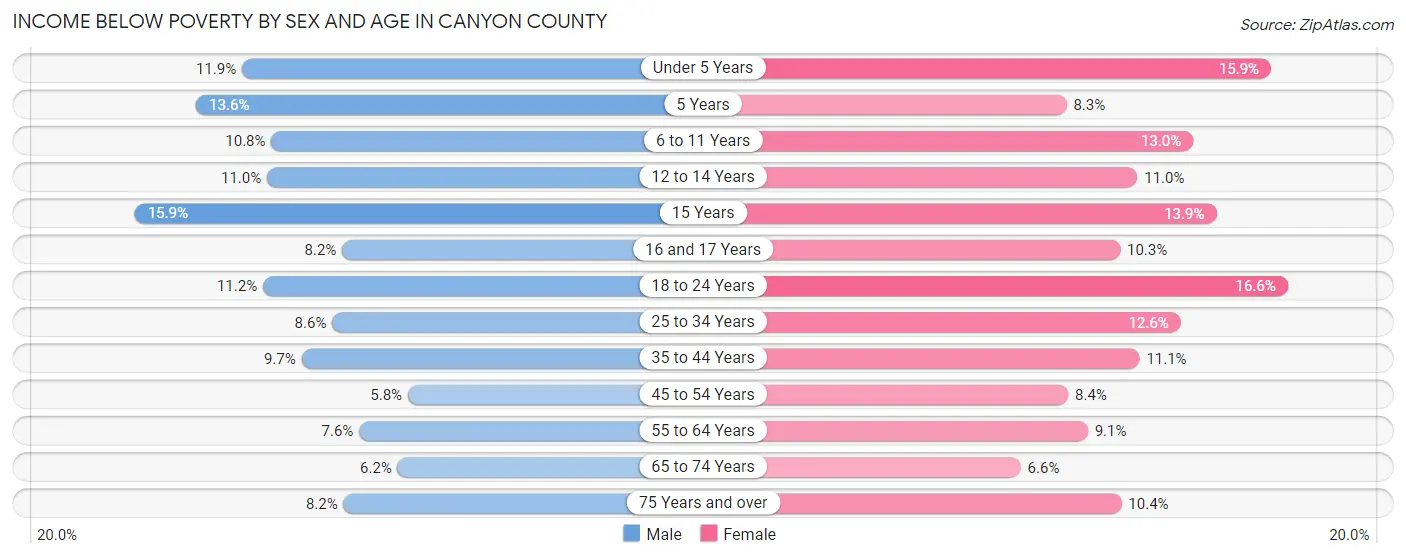
| Age Bracket | Male | Female |
| Under 5 Years | 973 (11.9%) | 1,246 (15.9%) |
| 5 Years | 239 (13.6%) | 178 (8.3%) |
| 6 to 11 Years | 1,192 (10.8%) | 1,320 (13.0%) |
| 12 to 14 Years | 639 (11.0%) | 609 (11.0%) |
| 15 Years | 323 (15.9%) | 282 (13.9%) |
| 16 and 17 Years | 306 (8.2%) | 334 (10.3%) |
| 18 to 24 Years | 1,164 (11.2%) | 1,664 (16.6%) |
| 25 to 34 Years | 1,356 (8.6%) | 2,010 (12.6%) |
| 35 to 44 Years | 1,476 (9.7%) | 1,665 (11.1%) |
| 45 to 54 Years | 777 (5.8%) | 1,095 (8.4%) |
| 55 to 64 Years | 931 (7.6%) | 1,175 (9.1%) |
| 65 to 74 Years | 598 (6.1%) | 699 (6.6%) |
| 75 Years and over | 451 (8.2%) | 710 (10.4%) |
| Total | 10,425 (9.1%) | 12,987 (11.3%) |
Income Above Poverty by Sex and Age in Canyon County
According to the poverty statistics in Canyon County, males aged 45 to 54 years and females aged 65 to 74 years are the age groups that are most secure financially, with 94.2% of males and 93.4% of females in these age groups living above the poverty line.
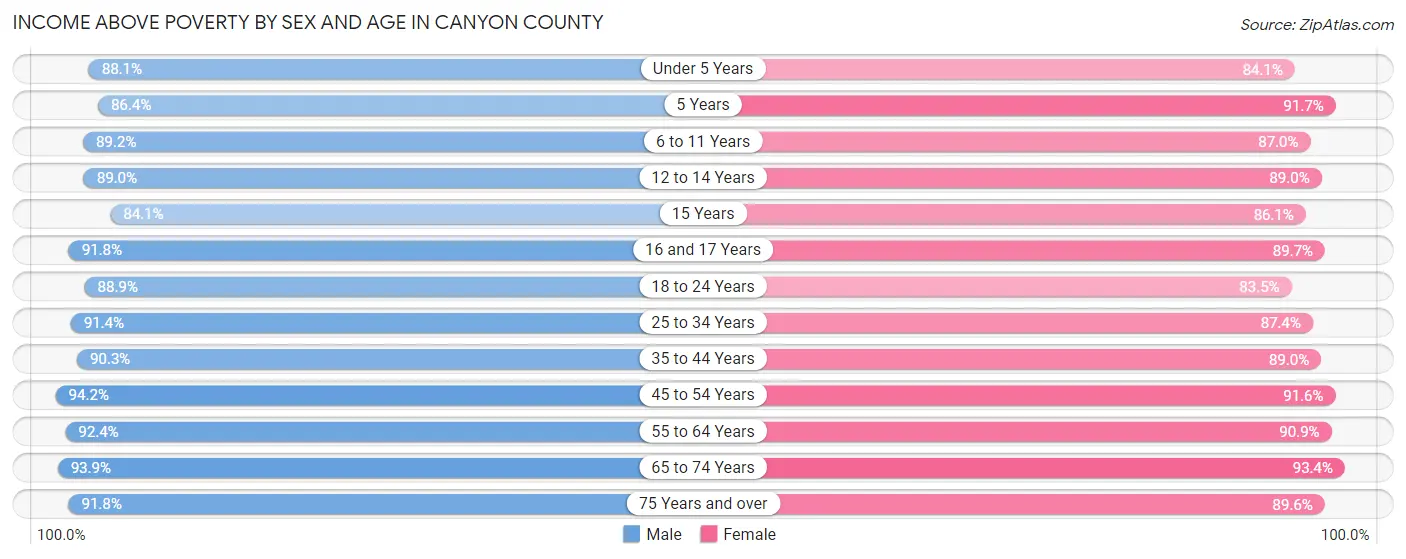
| Age Bracket | Male | Female |
| Under 5 Years | 7,184 (88.1%) | 6,576 (84.1%) |
| 5 Years | 1,514 (86.4%) | 1,957 (91.7%) |
| 6 to 11 Years | 9,802 (89.2%) | 8,801 (87.0%) |
| 12 to 14 Years | 5,171 (89.0%) | 4,942 (89.0%) |
| 15 Years | 1,707 (84.1%) | 1,747 (86.1%) |
| 16 and 17 Years | 3,421 (91.8%) | 2,900 (89.7%) |
| 18 to 24 Years | 9,276 (88.8%) | 8,393 (83.5%) |
| 25 to 34 Years | 14,445 (91.4%) | 13,965 (87.4%) |
| 35 to 44 Years | 13,703 (90.3%) | 13,403 (88.9%) |
| 45 to 54 Years | 12,681 (94.2%) | 11,942 (91.6%) |
| 55 to 64 Years | 11,359 (92.4%) | 11,690 (90.9%) |
| 65 to 74 Years | 9,118 (93.9%) | 9,831 (93.4%) |
| 75 Years and over | 5,074 (91.8%) | 6,133 (89.6%) |
| Total | 104,455 (90.9%) | 102,280 (88.7%) |
Income Below Poverty Among Married-Couple Families in Canyon County
The poverty statistics for married-couple families in Canyon County show that 4.7% or 2,107 of the total 44,796 families live below the poverty line. Families with 5 or more children have the highest poverty rate of 19.6%, comprising of 166 families. On the other hand, families with no children have the lowest poverty rate of 3.0%, which includes 699 families.
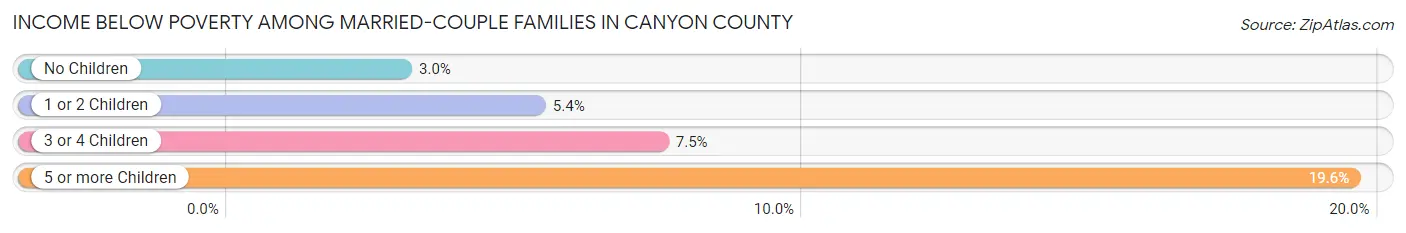
| Children | Above Poverty | Below Poverty |
| No Children | 22,385 (97.0%) | 699 (3.0%) |
| 1 or 2 Children | 14,241 (94.6%) | 806 (5.4%) |
| 3 or 4 Children | 5,380 (92.5%) | 436 (7.5%) |
| 5 or more Children | 683 (80.4%) | 166 (19.6%) |
| Total | 42,689 (95.3%) | 2,107 (4.7%) |
Income Below Poverty Among Single-Parent Households in Canyon County
According to the poverty data in Canyon County, 7.4% or 371 single-father households and 19.7% or 1,756 single-mother households are living below the poverty line. Among single-father households, those with 1 or 2 children have the highest poverty rate, with 246 households (9.4%) experiencing poverty. Likewise, among single-mother households, those with 5 or more children have the highest poverty rate, with 78 households (83.9%) falling below the poverty line.
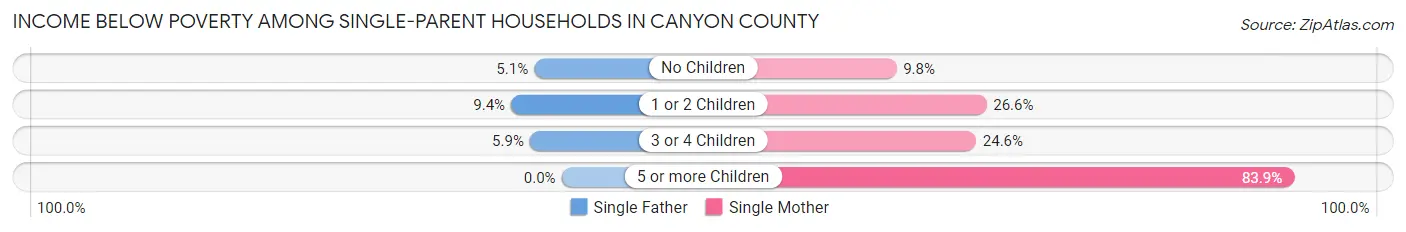
| Children | Single Father | Single Mother |
| No Children | 90 (5.1%) | 370 (9.8%) |
| 1 or 2 Children | 246 (9.4%) | 970 (26.6%) |
| 3 or 4 Children | 35 (5.9%) | 338 (24.6%) |
| 5 or more Children | 0 (0.0%) | 78 (83.9%) |
| Total | 371 (7.4%) | 1,756 (19.7%) |
Income Below Poverty Among Married-Couple vs Single-Parent Households in Canyon County
The poverty data for Canyon County shows that 2,107 of the married-couple family households (4.7%) and 2,127 of the single-parent households (15.3%) are living below the poverty level. Within the married-couple family households, those with 5 or more children have the highest poverty rate, with 166 households (19.6%) falling below the poverty line. Among the single-parent households, those with 5 or more children have the highest poverty rate, with 78 household (68.4%) living below poverty.
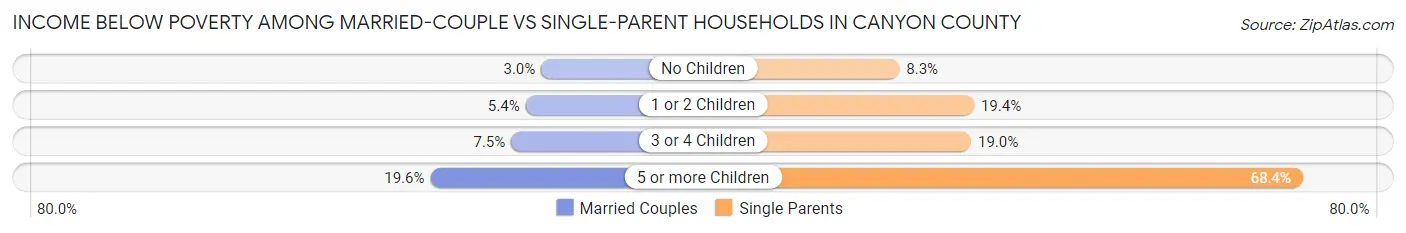
| Children | Married-Couple Families | Single-Parent Households |
| No Children | 699 (3.0%) | 460 (8.3%) |
| 1 or 2 Children | 806 (5.4%) | 1,216 (19.4%) |
| 3 or 4 Children | 436 (7.5%) | 373 (19.0%) |
| 5 or more Children | 166 (19.6%) | 78 (68.4%) |
| Total | 2,107 (4.7%) | 2,127 (15.3%) |
Employment Characteristics in Canyon County
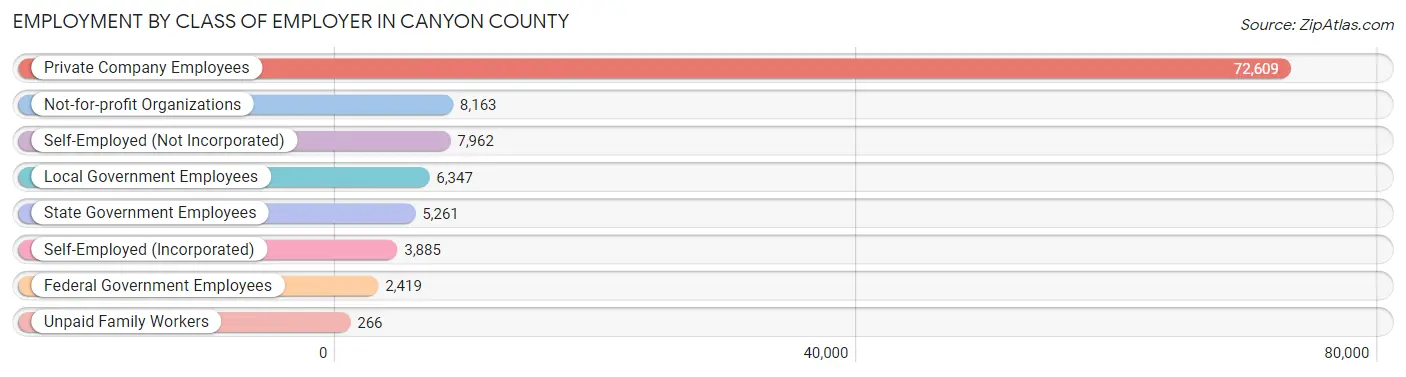
Employment by Class of Employer in Canyon County
Among the 106,912 employed individuals in Canyon County, private company employees (72,609 | 67.9%), not-for-profit organizations (8,163 | 7.6%), and self-employed (not incorporated) (7,962 | 7.4%) make up the most common classes of employment.
| Employer Class | # Employees | % Employees |
| Private Company Employees | 72,609 | 67.9% |
| Self-Employed (Incorporated) | 3,885 | 3.6% |
| Self-Employed (Not Incorporated) | 7,962 | 7.4% |
| Not-for-profit Organizations | 8,163 | 7.6% |
| Local Government Employees | 6,347 | 5.9% |
| State Government Employees | 5,261 | 4.9% |
| Federal Government Employees | 2,419 | 2.3% |
| Unpaid Family Workers | 266 | 0.3% |
| Total | 106,912 | 100.0% |
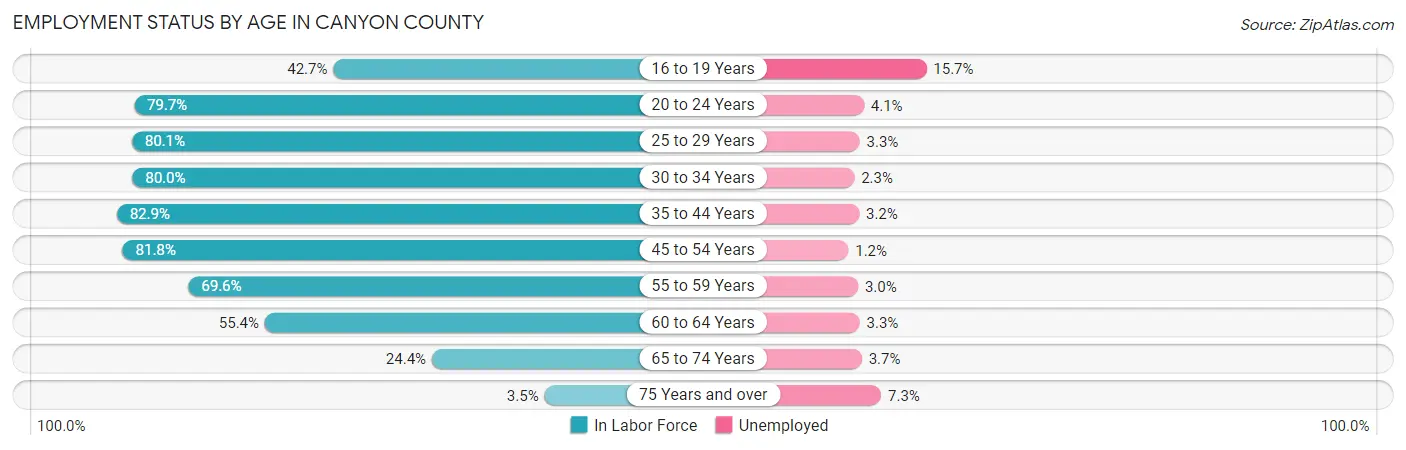
Employment Status by Age in Canyon County
According to the labor force statistics for Canyon County, out of the total population over 16 years of age (177,744), 63.4% or 112,690 individuals are in the labor force, with 3.5% or 3,944 of them unemployed. The age group with the highest labor force participation rate is 35 to 44 years, with 82.9% or 25,245 individuals in the labor force. Within the labor force, the 16 to 19 years age range has the highest percentage of unemployed individuals, with 15.7% or 937 of them being unemployed.
| Age Bracket | In Labor Force | Unemployed |
| 16 to 19 Years | 5,968 (42.7%) | 937 (15.7%) |
| 20 to 24 Years | 12,842 (79.7%) | 527 (4.1%) |
| 25 to 29 Years | 12,842 (80.1%) | 424 (3.3%) |
| 30 to 34 Years | 12,703 (80.0%) | 292 (2.3%) |
| 35 to 44 Years | 25,245 (82.9%) | 808 (3.2%) |
| 45 to 54 Years | 21,732 (81.8%) | 261 (1.2%) |
| 55 to 59 Years | 9,221 (69.6%) | 277 (3.0%) |
| 60 to 64 Years | 6,711 (55.4%) | 221 (3.3%) |
| 65 to 74 Years | 4,992 (24.4%) | 185 (3.7%) |
| 75 Years and over | 452 (3.5%) | 33 (7.3%) |
| Total | 112,690 (63.4%) | 3,944 (3.5%) |
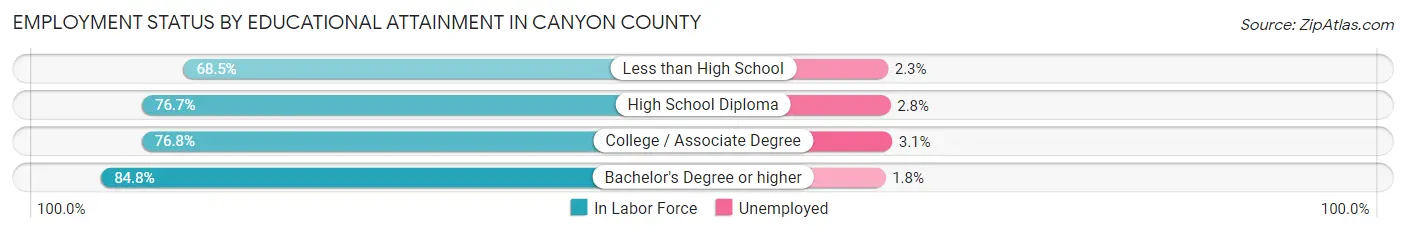
Employment Status by Educational Attainment in Canyon County
According to labor force statistics for Canyon County, 77.4% of individuals (88,463) out of the total population between 25 and 64 years of age (114,293) are in the labor force, with 2.6% or 2,300 of them being unemployed. The group with the highest labor force participation rate are those with the educational attainment of bachelor's degree or higher, with 84.8% or 21,015 individuals in the labor force. Within the labor force, individuals with college / associate degree education have the highest percentage of unemployment, with 3.1% or 987 of them being unemployed.
| Educational Attainment | In Labor Force | Unemployed |
| Less than High School | 10,448 (68.5%) | 351 (2.3%) |
| High School Diploma | 25,151 (76.7%) | 918 (2.8%) |
| College / Associate Degree | 31,846 (76.8%) | 1,285 (3.1%) |
| Bachelor's Degree or higher | 21,015 (84.8%) | 446 (1.8%) |
| Total | 88,463 (77.4%) | 2,972 (2.6%) |
Employment Occupations by Sex in Canyon County
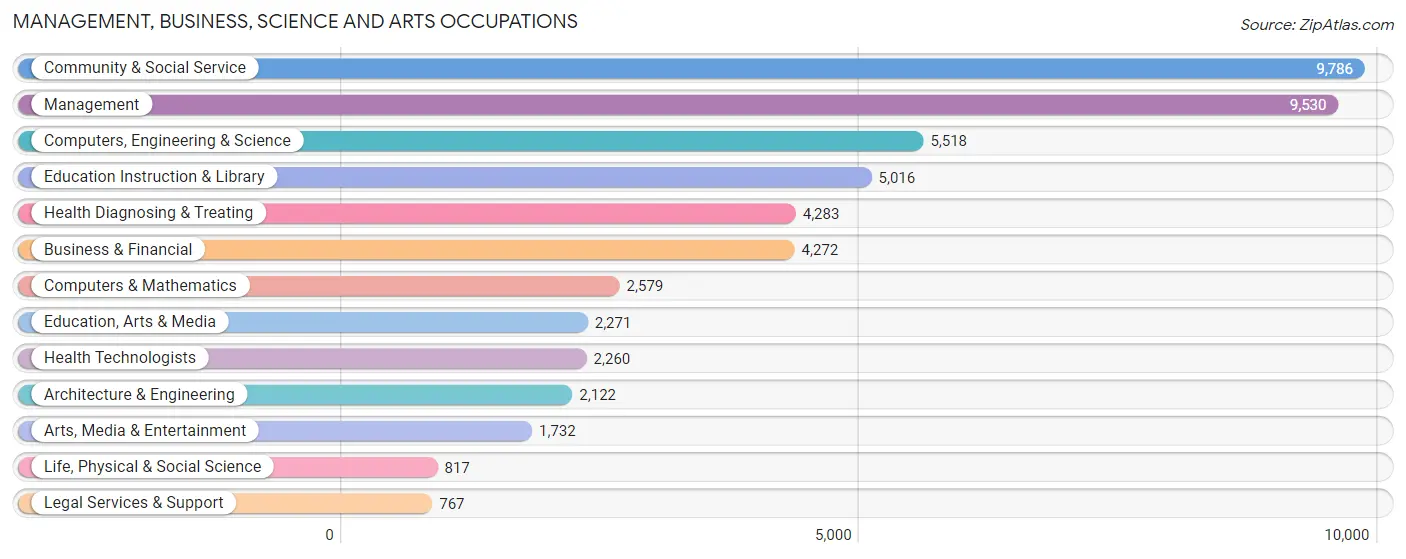
Management, Business, Science and Arts Occupations
The most common Management, Business, Science and Arts occupations in Canyon County are Community & Social Service (9,786 | 9.0%), Management (9,530 | 8.8%), Computers, Engineering & Science (5,518 | 5.1%), Education Instruction & Library (5,016 | 4.6%), and Health Diagnosing & Treating (4,283 | 4.0%).
Management, Business, Science and Arts Occupations by Sex
Within the Management, Business, Science and Arts occupations in Canyon County, the most male-oriented occupations are Architecture & Engineering (89.0%), Computers & Mathematics (77.7%), and Computers, Engineering & Science (77.0%), while the most female-oriented occupations are Health Diagnosing & Treating (80.7%), Health Technologists (73.9%), and Education Instruction & Library (73.8%).
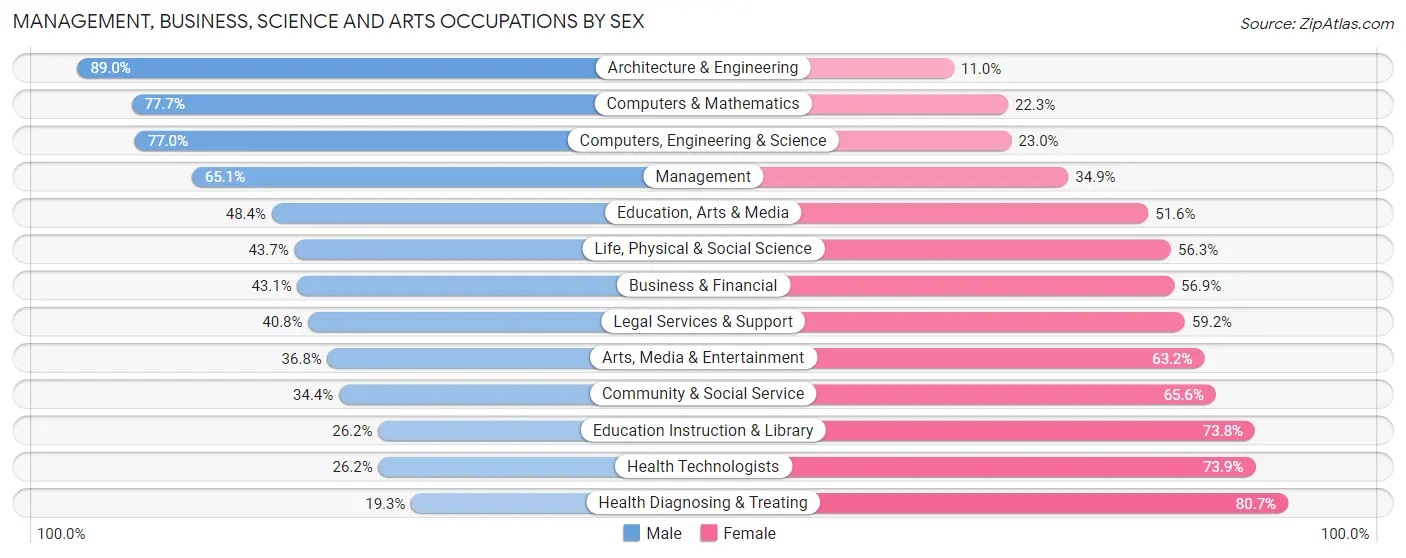
| Occupation | Male | Female |
| Management | 6,205 (65.1%) | 3,325 (34.9%) |
| Business & Financial | 1,840 (43.1%) | 2,432 (56.9%) |
| Computers, Engineering & Science | 4,249 (77.0%) | 1,269 (23.0%) |
| Computers & Mathematics | 2,004 (77.7%) | 575 (22.3%) |
| Architecture & Engineering | 1,888 (89.0%) | 234 (11.0%) |
| Life, Physical & Social Science | 357 (43.7%) | 460 (56.3%) |
| Community & Social Service | 3,365 (34.4%) | 6,421 (65.6%) |
| Education, Arts & Media | 1,100 (48.4%) | 1,171 (51.6%) |
| Legal Services & Support | 313 (40.8%) | 454 (59.2%) |
| Education Instruction & Library | 1,315 (26.2%) | 3,701 (73.8%) |
| Arts, Media & Entertainment | 637 (36.8%) | 1,095 (63.2%) |
| Health Diagnosing & Treating | 828 (19.3%) | 3,455 (80.7%) |
| Health Technologists | 591 (26.2%) | 1,669 (73.9%) |
| Total (Category) | 16,487 (49.4%) | 16,902 (50.6%) |
| Total (Overall) | 58,542 (53.9%) | 49,972 (46.1%) |
Services Occupations
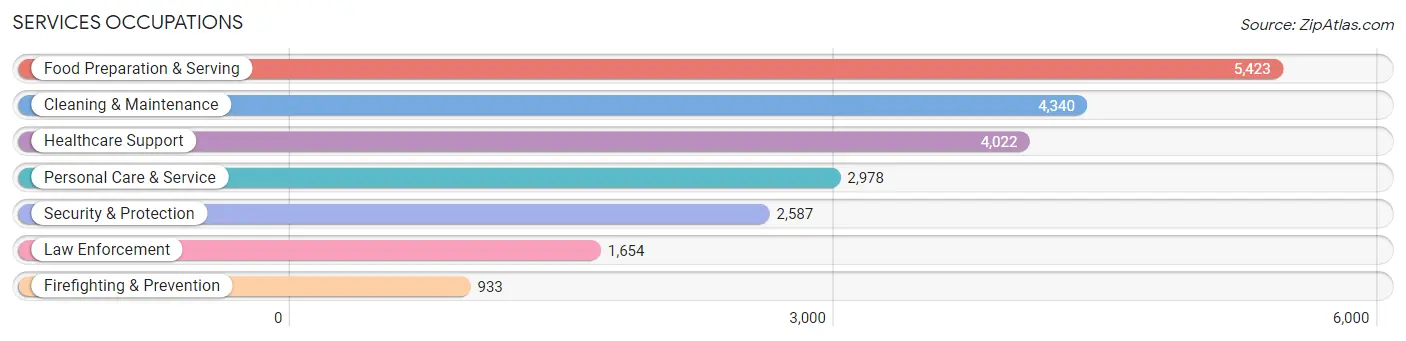
The most common Services occupations in Canyon County are Food Preparation & Serving (5,423 | 5.0%), Cleaning & Maintenance (4,340 | 4.0%), Healthcare Support (4,022 | 3.7%), Personal Care & Service (2,978 | 2.7%), and Security & Protection (2,587 | 2.4%).
Services Occupations by Sex
Within the Services occupations in Canyon County, the most male-oriented occupations are Law Enforcement (78.6%), Security & Protection (77.2%), and Firefighting & Prevention (74.8%), while the most female-oriented occupations are Personal Care & Service (90.9%), Healthcare Support (85.2%), and Food Preparation & Serving (60.1%).
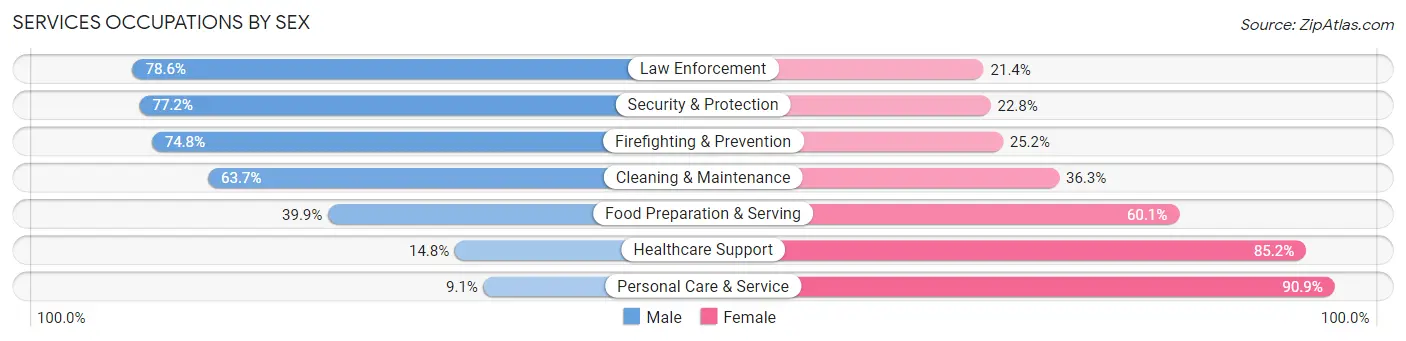
| Occupation | Male | Female |
| Healthcare Support | 594 (14.8%) | 3,428 (85.2%) |
| Security & Protection | 1,998 (77.2%) | 589 (22.8%) |
| Firefighting & Prevention | 698 (74.8%) | 235 (25.2%) |
| Law Enforcement | 1,300 (78.6%) | 354 (21.4%) |
| Food Preparation & Serving | 2,164 (39.9%) | 3,259 (60.1%) |
| Cleaning & Maintenance | 2,763 (63.7%) | 1,577 (36.3%) |
| Personal Care & Service | 271 (9.1%) | 2,707 (90.9%) |
| Total (Category) | 7,790 (40.3%) | 11,560 (59.7%) |
| Total (Overall) | 58,542 (53.9%) | 49,972 (46.1%) |
Sales and Office Occupations
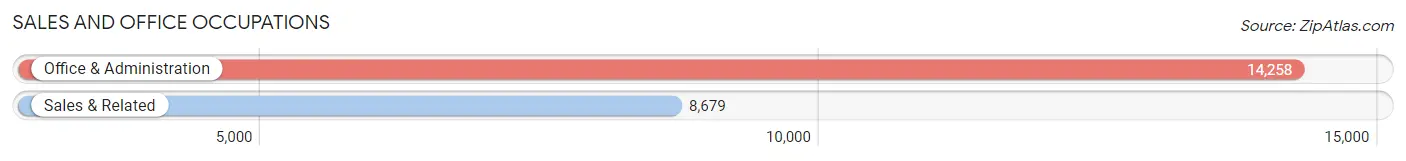
The most common Sales and Office occupations in Canyon County are Office & Administration (14,258 | 13.1%), and Sales & Related (8,679 | 8.0%).
Sales and Office Occupations by Sex
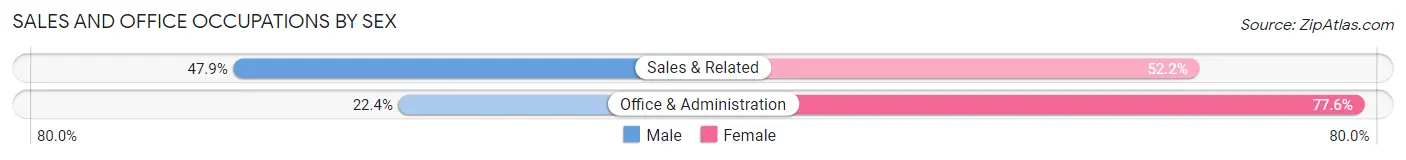
| Occupation | Male | Female |
| Sales & Related | 4,153 (47.8%) | 4,526 (52.1%) |
| Office & Administration | 3,199 (22.4%) | 11,059 (77.6%) |
| Total (Category) | 7,352 (32.1%) | 15,585 (67.9%) |
| Total (Overall) | 58,542 (53.9%) | 49,972 (46.1%) |
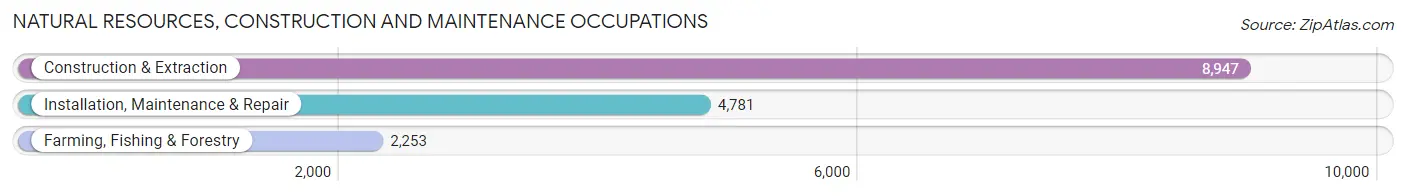
Natural Resources, Construction and Maintenance Occupations
The most common Natural Resources, Construction and Maintenance occupations in Canyon County are Construction & Extraction (8,947 | 8.3%), Installation, Maintenance & Repair (4,781 | 4.4%), and Farming, Fishing & Forestry (2,253 | 2.1%).
Natural Resources, Construction and Maintenance Occupations by Sex
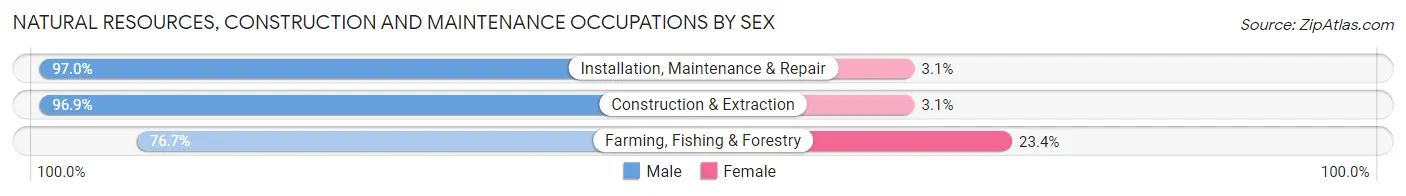
| Occupation | Male | Female |
| Farming, Fishing & Forestry | 1,727 (76.6%) | 526 (23.4%) |
| Construction & Extraction | 8,672 (96.9%) | 275 (3.1%) |
| Installation, Maintenance & Repair | 4,635 (97.0%) | 146 (3.0%) |
| Total (Category) | 15,034 (94.1%) | 947 (5.9%) |
| Total (Overall) | 58,542 (53.9%) | 49,972 (46.1%) |
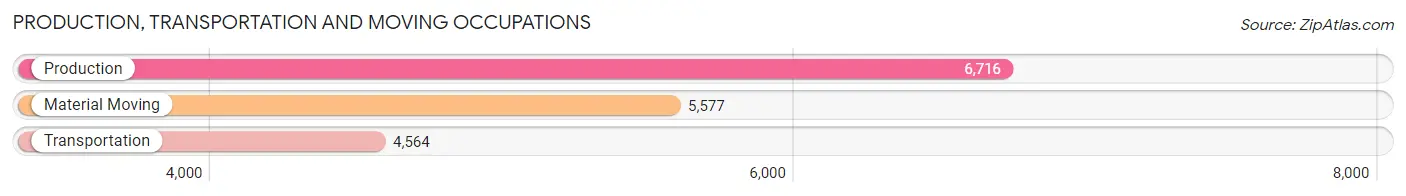
Production, Transportation and Moving Occupations
The most common Production, Transportation and Moving occupations in Canyon County are Production (6,716 | 6.2%), Material Moving (5,577 | 5.1%), and Transportation (4,564 | 4.2%).
Production, Transportation and Moving Occupations by Sex
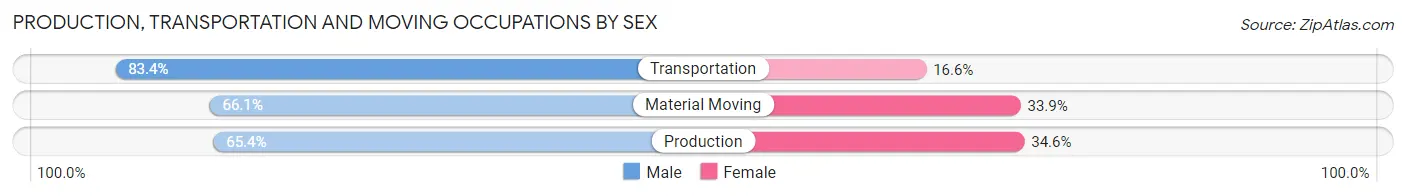
| Occupation | Male | Female |
| Production | 4,390 (65.4%) | 2,326 (34.6%) |
| Transportation | 3,805 (83.4%) | 759 (16.6%) |
| Material Moving | 3,684 (66.1%) | 1,893 (33.9%) |
| Total (Category) | 11,879 (70.5%) | 4,978 (29.5%) |
| Total (Overall) | 58,542 (53.9%) | 49,972 (46.1%) |
Employment Industries by Sex in Canyon County
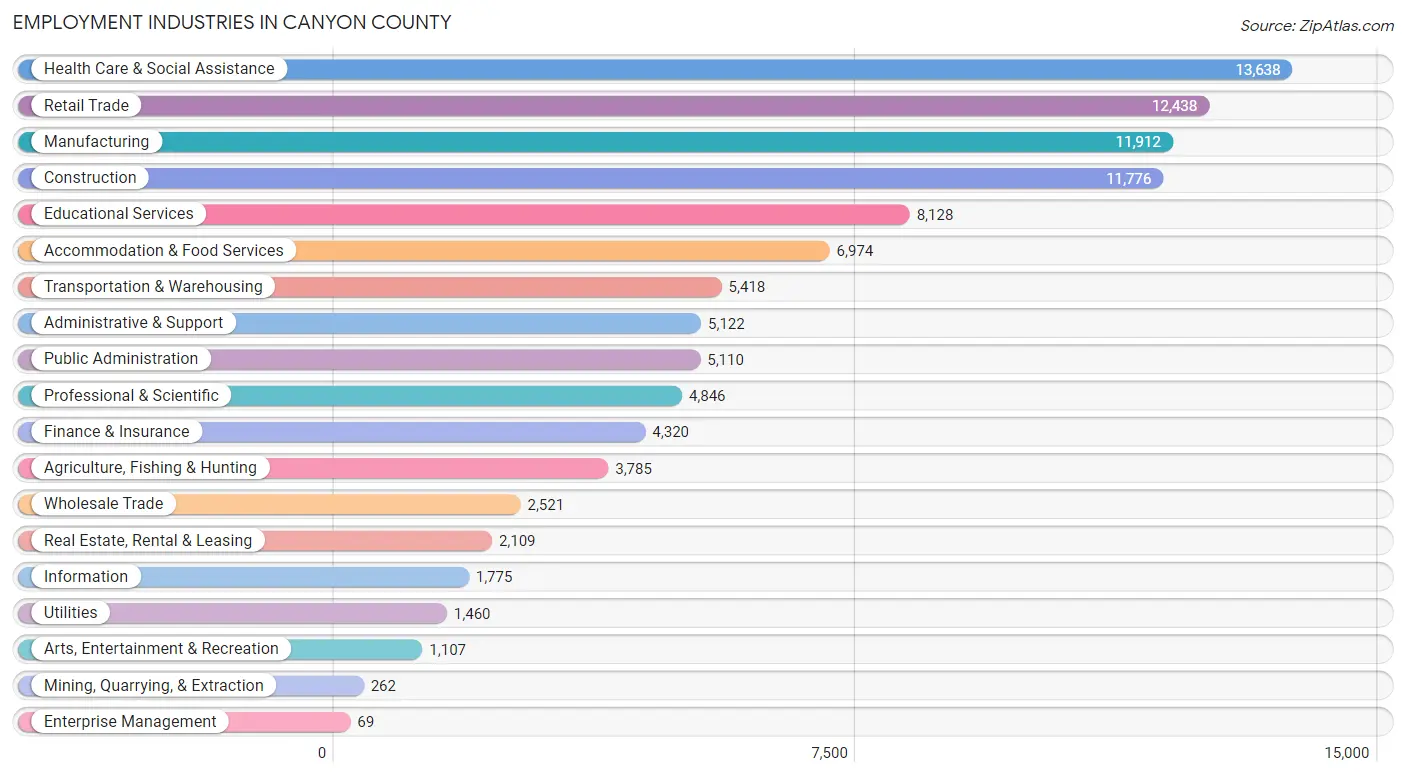
Employment Industries in Canyon County
The major employment industries in Canyon County include Health Care & Social Assistance (13,638 | 12.6%), Retail Trade (12,438 | 11.5%), Manufacturing (11,912 | 11.0%), Construction (11,776 | 10.8%), and Educational Services (8,128 | 7.5%).
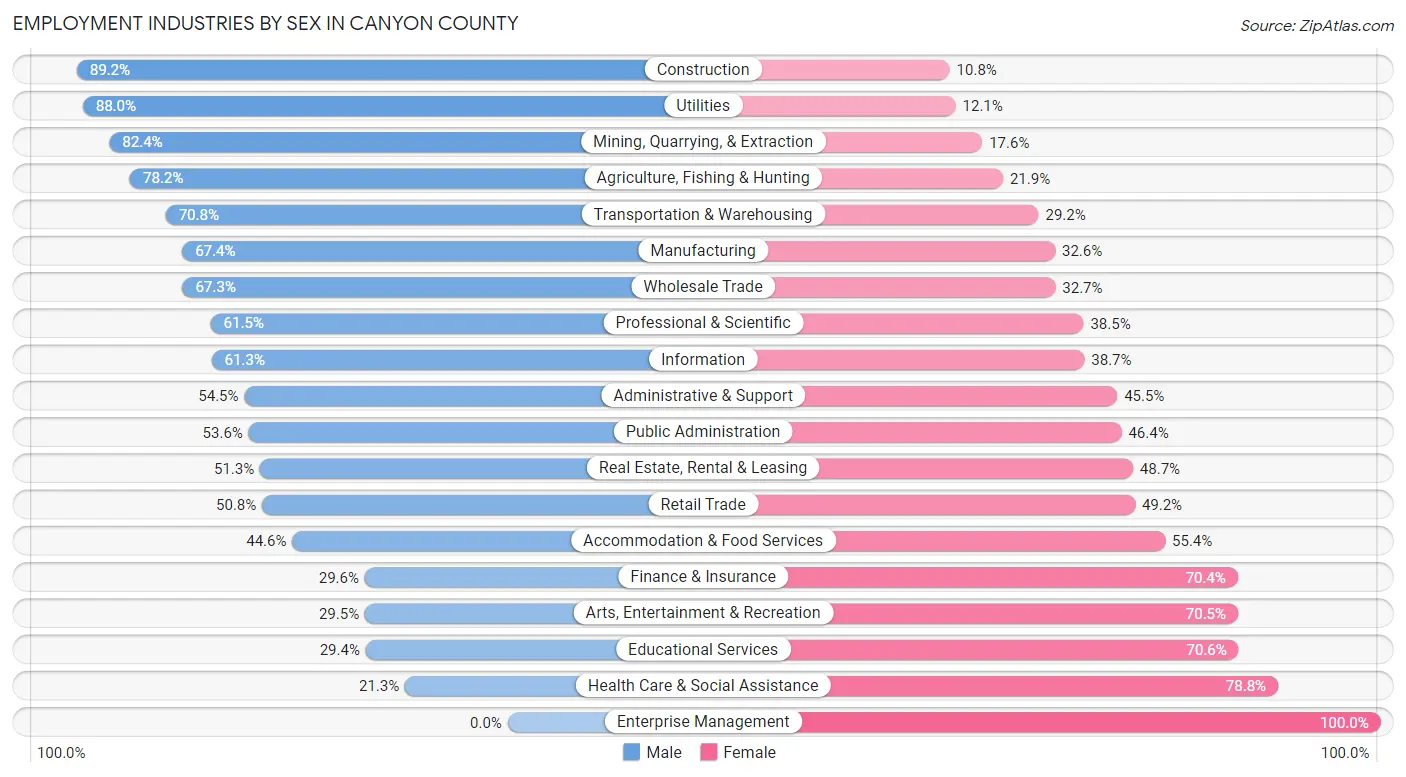
Employment Industries by Sex in Canyon County
The Canyon County industries that see more men than women are Construction (89.2%), Utilities (87.9%), and Mining, Quarrying, & Extraction (82.4%), whereas the industries that tend to have a higher number of women are Enterprise Management (100.0%), Health Care & Social Assistance (78.7%), and Educational Services (70.6%).
| Industry | Male | Female |
| Agriculture, Fishing & Hunting | 2,958 (78.1%) | 827 (21.8%) |
| Mining, Quarrying, & Extraction | 216 (82.4%) | 46 (17.6%) |
| Construction | 10,503 (89.2%) | 1,273 (10.8%) |
| Manufacturing | 8,025 (67.4%) | 3,887 (32.6%) |
| Wholesale Trade | 1,697 (67.3%) | 824 (32.7%) |
| Retail Trade | 6,323 (50.8%) | 6,115 (49.2%) |
| Transportation & Warehousing | 3,835 (70.8%) | 1,583 (29.2%) |
| Utilities | 1,284 (87.9%) | 176 (12.0%) |
| Information | 1,088 (61.3%) | 687 (38.7%) |
| Finance & Insurance | 1,278 (29.6%) | 3,042 (70.4%) |
| Real Estate, Rental & Leasing | 1,081 (51.3%) | 1,028 (48.7%) |
| Professional & Scientific | 2,980 (61.5%) | 1,866 (38.5%) |
| Enterprise Management | 0 (0.0%) | 69 (100.0%) |
| Administrative & Support | 2,792 (54.5%) | 2,330 (45.5%) |
| Educational Services | 2,389 (29.4%) | 5,739 (70.6%) |
| Health Care & Social Assistance | 2,898 (21.2%) | 10,740 (78.7%) |
| Arts, Entertainment & Recreation | 327 (29.5%) | 780 (70.5%) |
| Accommodation & Food Services | 3,110 (44.6%) | 3,864 (55.4%) |
| Public Administration | 2,740 (53.6%) | 2,370 (46.4%) |
| Total | 58,542 (53.9%) | 49,972 (46.1%) |
Education in Canyon County
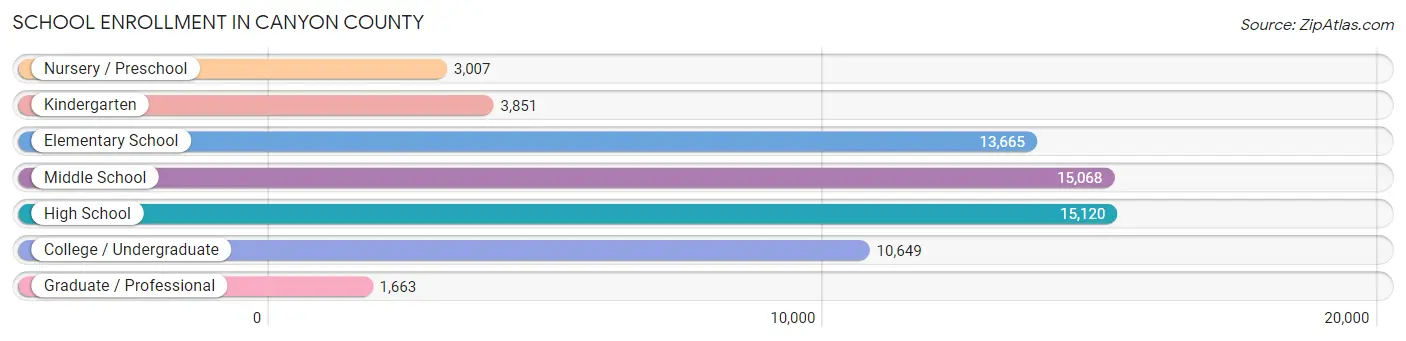
School Enrollment in Canyon County
The most common levels of schooling among the 63,023 students in Canyon County are high school (15,120 | 24.0%), middle school (15,068 | 23.9%), and elementary school (13,665 | 21.7%).
| School Level | # Students | % Students |
| Nursery / Preschool | 3,007 | 4.8% |
| Kindergarten | 3,851 | 6.1% |
| Elementary School | 13,665 | 21.7% |
| Middle School | 15,068 | 23.9% |
| High School | 15,120 | 24.0% |
| College / Undergraduate | 10,649 | 16.9% |
| Graduate / Professional | 1,663 | 2.6% |
| Total | 63,023 | 100.0% |
School Enrollment by Age by Funding Source in Canyon County
Out of a total of 63,023 students who are enrolled in schools in Canyon County, 10,336 (16.4%) attend a private institution, while the remaining 52,687 (83.6%) are enrolled in public schools. The age group of 3 to 4 year olds has the highest likelihood of being enrolled in private schools, with 1,337 (57.1% in the age bracket) enrolled. Conversely, the age group of 10 to 14 year olds has the lowest likelihood of being enrolled in a private school, with 17,219 (92.5% in the age bracket) attending a public institution.

| Age Bracket | Public School | Private School |
| 3 to 4 Year Olds | 1,006 (42.9%) | 1,337 (57.1%) |
| 5 to 9 Year Old | 14,234 (86.9%) | 2,152 (13.1%) |
| 10 to 14 Year Olds | 17,219 (92.5%) | 1,392 (7.5%) |
| 15 to 17 Year Olds | 9,841 (89.9%) | 1,099 (10.1%) |
| 18 to 19 Year Olds | 3,001 (69.9%) | 1,295 (30.1%) |
| 20 to 24 Year Olds | 2,820 (60.7%) | 1,827 (39.3%) |
| 25 to 34 Year Olds | 2,657 (84.2%) | 500 (15.8%) |
| 35 Years and over | 1,904 (72.0%) | 739 (28.0%) |
| Total | 52,687 (83.6%) | 10,336 (16.4%) |
Educational Attainment by Field of Study in Canyon County
Business (6,523 | 18.9%), education (5,086 | 14.7%), science & technology (4,384 | 12.7%), arts & humanities (2,809 | 8.1%), and bio, nature & agricultural (2,377 | 6.9%) are the most common fields of study among 34,501 individuals in Canyon County who have obtained a bachelor's degree or higher.
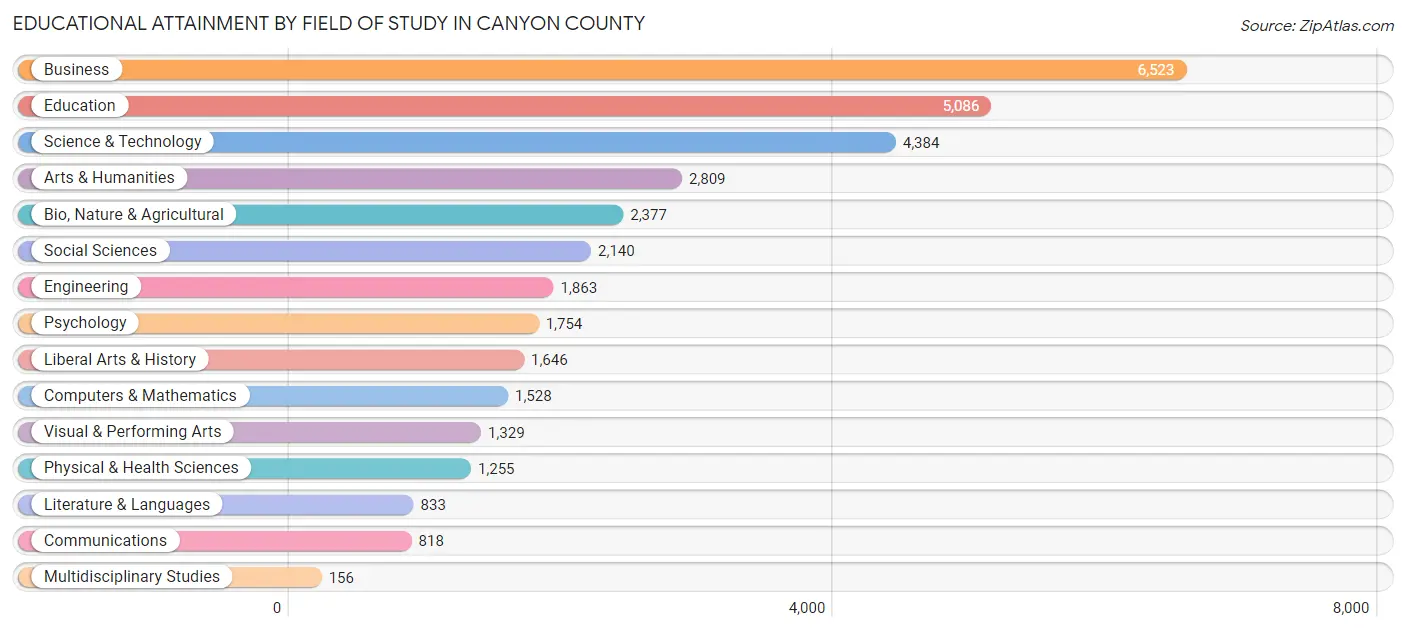
| Field of Study | # Graduates | % Graduates |
| Computers & Mathematics | 1,528 | 4.4% |
| Bio, Nature & Agricultural | 2,377 | 6.9% |
| Physical & Health Sciences | 1,255 | 3.6% |
| Psychology | 1,754 | 5.1% |
| Social Sciences | 2,140 | 6.2% |
| Engineering | 1,863 | 5.4% |
| Multidisciplinary Studies | 156 | 0.4% |
| Science & Technology | 4,384 | 12.7% |
| Business | 6,523 | 18.9% |
| Education | 5,086 | 14.7% |
| Literature & Languages | 833 | 2.4% |
| Liberal Arts & History | 1,646 | 4.8% |
| Visual & Performing Arts | 1,329 | 3.8% |
| Communications | 818 | 2.4% |
| Arts & Humanities | 2,809 | 8.1% |
| Total | 34,501 | 100.0% |
Transportation & Commute in Canyon County
Vehicle Availability by Sex in Canyon County
The most prevalent vehicle ownership categories in Canyon County are males with 2 vehicles (21,858, accounting for 38.1%) and females with 2 vehicles (18,669, making up 45.1%).
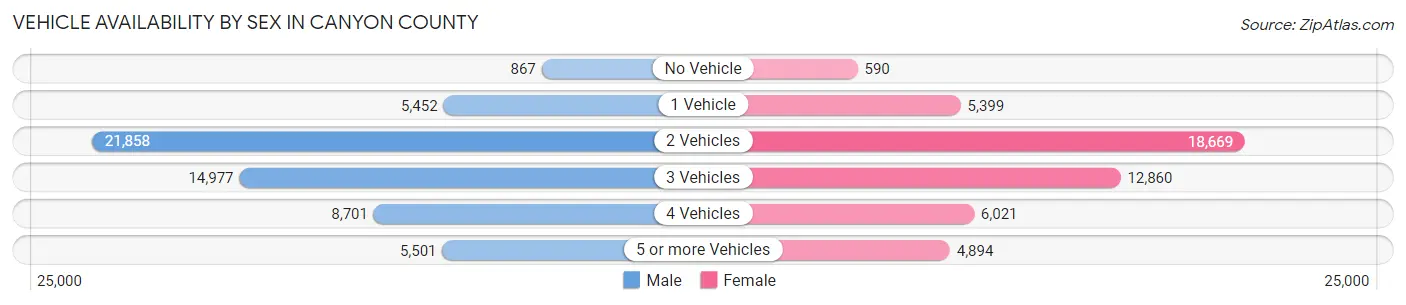
| Vehicles Available | Male | Female |
| No Vehicle | 867 (1.5%) | 590 (1.2%) |
| 1 Vehicle | 5,452 (9.5%) | 5,399 (11.2%) |
| 2 Vehicles | 21,858 (38.1%) | 18,669 (38.6%) |
| 3 Vehicles | 14,977 (26.1%) | 12,860 (26.6%) |
| 4 Vehicles | 8,701 (15.2%) | 6,021 (12.4%) |
| 5 or more Vehicles | 5,501 (9.6%) | 4,894 (10.1%) |
| Total | 57,356 (100.0%) | 48,433 (100.0%) |
Commute Time in Canyon County
The most frequently occuring commute durations in Canyon County are 30 to 34 minutes (14,905 commuters, 15.5%), 15 to 19 minutes (12,892 commuters, 13.4%), and 20 to 24 minutes (12,867 commuters, 13.4%).
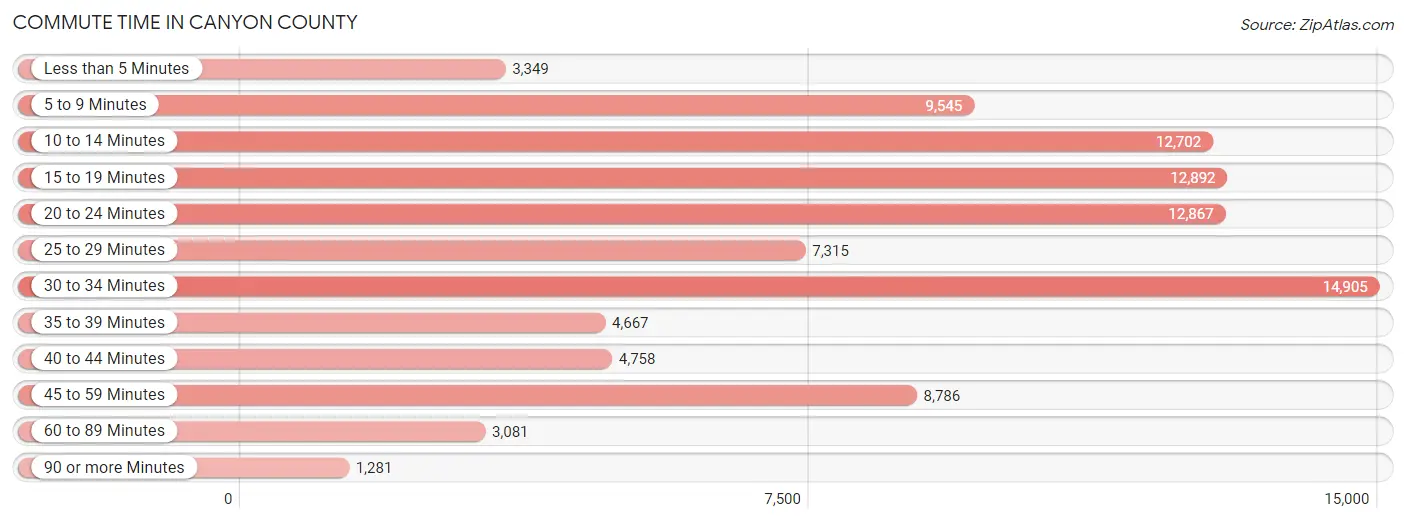
| Commute Time | # Commuters | % Commuters |
| Less than 5 Minutes | 3,349 | 3.5% |
| 5 to 9 Minutes | 9,545 | 9.9% |
| 10 to 14 Minutes | 12,702 | 13.2% |
| 15 to 19 Minutes | 12,892 | 13.4% |
| 20 to 24 Minutes | 12,867 | 13.4% |
| 25 to 29 Minutes | 7,315 | 7.6% |
| 30 to 34 Minutes | 14,905 | 15.5% |
| 35 to 39 Minutes | 4,667 | 4.9% |
| 40 to 44 Minutes | 4,758 | 5.0% |
| 45 to 59 Minutes | 8,786 | 9.1% |
| 60 to 89 Minutes | 3,081 | 3.2% |
| 90 or more Minutes | 1,281 | 1.3% |
Commute Time by Sex in Canyon County
The most common commute times in Canyon County are 30 to 34 minutes (8,844 commuters, 16.6%) for males and 10 to 14 minutes (6,272 commuters, 14.6%) for females.
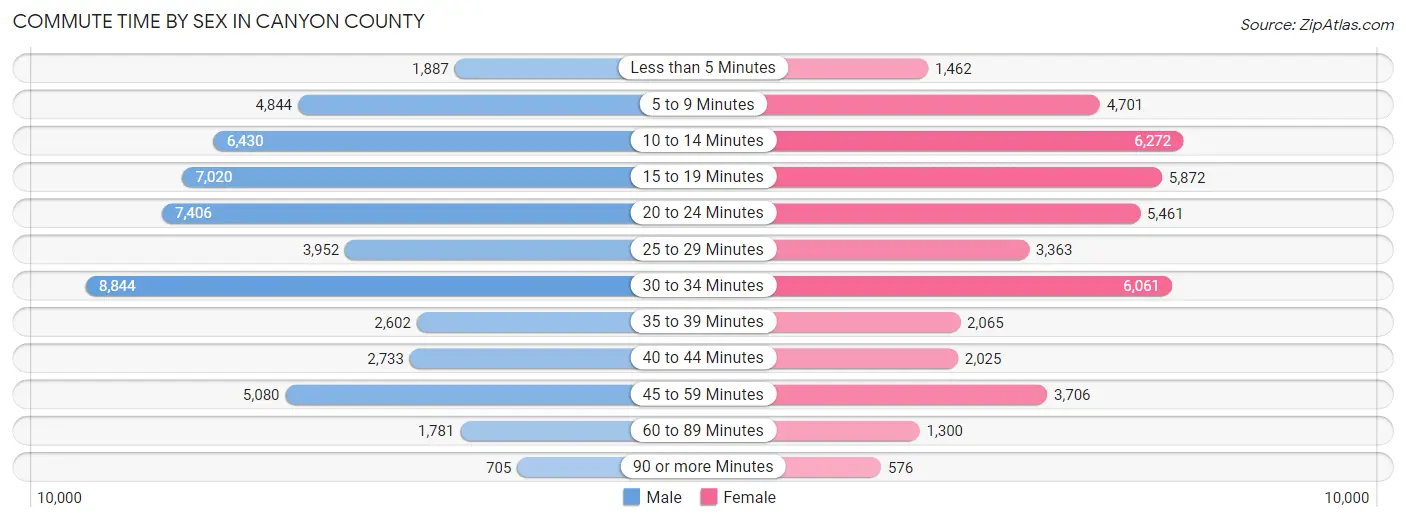
| Commute Time | Male | Female |
| Less than 5 Minutes | 1,887 (3.5%) | 1,462 (3.4%) |
| 5 to 9 Minutes | 4,844 (9.1%) | 4,701 (11.0%) |
| 10 to 14 Minutes | 6,430 (12.1%) | 6,272 (14.6%) |
| 15 to 19 Minutes | 7,020 (13.2%) | 5,872 (13.7%) |
| 20 to 24 Minutes | 7,406 (13.9%) | 5,461 (12.7%) |
| 25 to 29 Minutes | 3,952 (7.4%) | 3,363 (7.9%) |
| 30 to 34 Minutes | 8,844 (16.6%) | 6,061 (14.1%) |
| 35 to 39 Minutes | 2,602 (4.9%) | 2,065 (4.8%) |
| 40 to 44 Minutes | 2,733 (5.1%) | 2,025 (4.7%) |
| 45 to 59 Minutes | 5,080 (9.5%) | 3,706 (8.6%) |
| 60 to 89 Minutes | 1,781 (3.3%) | 1,300 (3.0%) |
| 90 or more Minutes | 705 (1.3%) | 576 (1.3%) |
Time of Departure to Work by Sex in Canyon County
The most frequent times of departure to work in Canyon County are 7:00 AM to 7:29 AM (8,845, 16.6%) for males and 7:00 AM to 7:29 AM (7,600, 17.7%) for females.
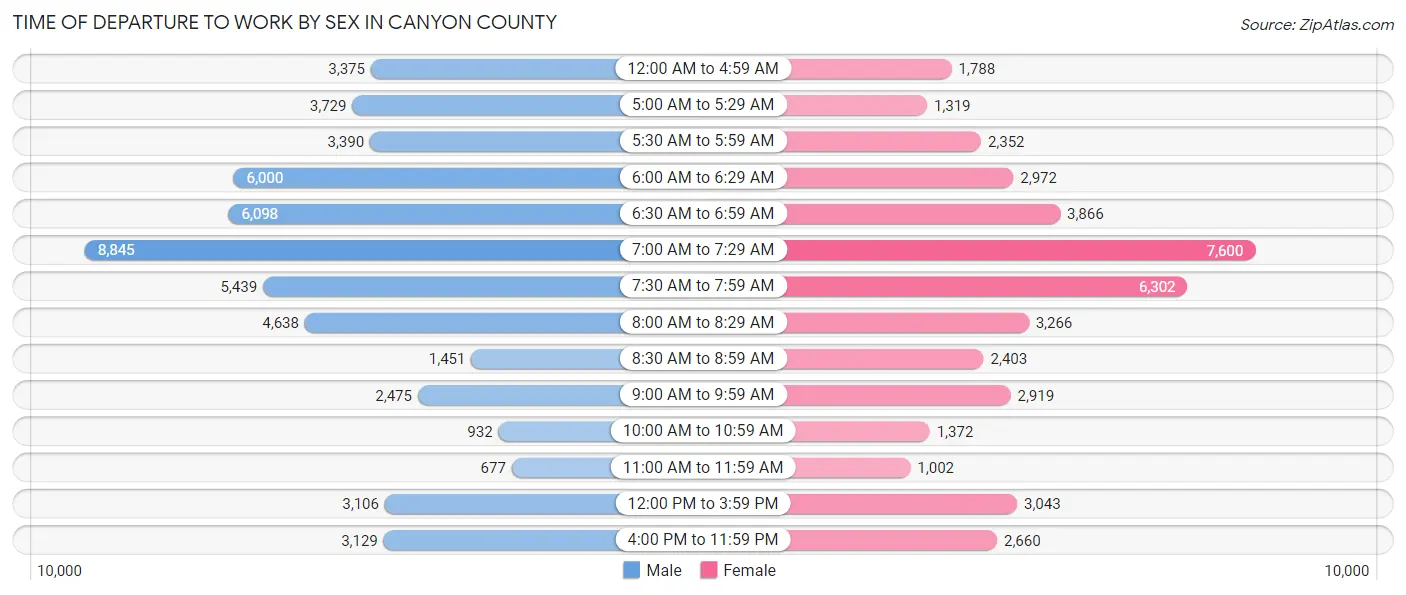
| Time of Departure | Male | Female |
| 12:00 AM to 4:59 AM | 3,375 (6.3%) | 1,788 (4.2%) |
| 5:00 AM to 5:29 AM | 3,729 (7.0%) | 1,319 (3.1%) |
| 5:30 AM to 5:59 AM | 3,390 (6.4%) | 2,352 (5.5%) |
| 6:00 AM to 6:29 AM | 6,000 (11.3%) | 2,972 (6.9%) |
| 6:30 AM to 6:59 AM | 6,098 (11.4%) | 3,866 (9.0%) |
| 7:00 AM to 7:29 AM | 8,845 (16.6%) | 7,600 (17.7%) |
| 7:30 AM to 7:59 AM | 5,439 (10.2%) | 6,302 (14.7%) |
| 8:00 AM to 8:29 AM | 4,638 (8.7%) | 3,266 (7.6%) |
| 8:30 AM to 8:59 AM | 1,451 (2.7%) | 2,403 (5.6%) |
| 9:00 AM to 9:59 AM | 2,475 (4.6%) | 2,919 (6.8%) |
| 10:00 AM to 10:59 AM | 932 (1.8%) | 1,372 (3.2%) |
| 11:00 AM to 11:59 AM | 677 (1.3%) | 1,002 (2.3%) |
| 12:00 PM to 3:59 PM | 3,106 (5.8%) | 3,043 (7.1%) |
| 4:00 PM to 11:59 PM | 3,129 (5.9%) | 2,660 (6.2%) |
| Total | 53,284 (100.0%) | 42,864 (100.0%) |
Housing Occupancy in Canyon County
Occupancy by Ownership in Canyon County
Of the total 79,728 dwellings in Canyon County, owner-occupied units account for 59,609 (74.8%), while renter-occupied units make up 20,119 (25.2%).
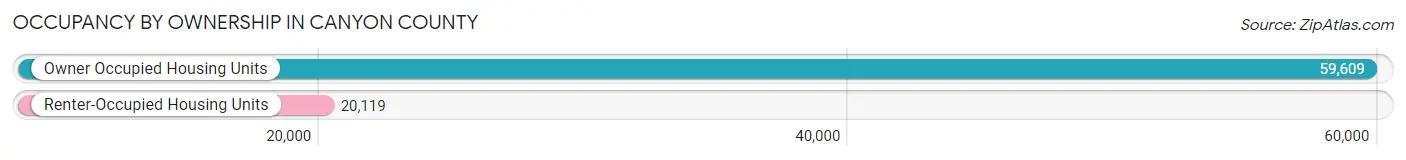
| Occupancy | # Housing Units | % Housing Units |
| Owner Occupied Housing Units | 59,609 | 74.8% |
| Renter-Occupied Housing Units | 20,119 | 25.2% |
| Total Occupied Housing Units | 79,728 | 100.0% |
Occupancy by Household Size in Canyon County
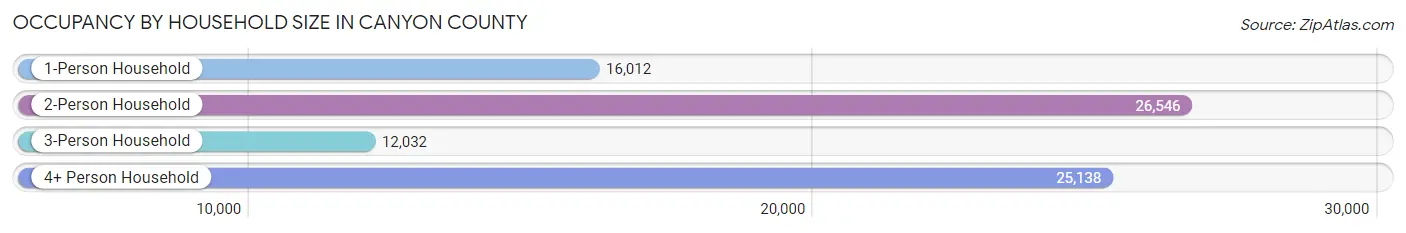
| Household Size | # Housing Units | % Housing Units |
| 1-Person Household | 16,012 | 20.1% |
| 2-Person Household | 26,546 | 33.3% |
| 3-Person Household | 12,032 | 15.1% |
| 4+ Person Household | 25,138 | 31.5% |
| Total Housing Units | 79,728 | 100.0% |
Occupancy by Ownership by Household Size in Canyon County
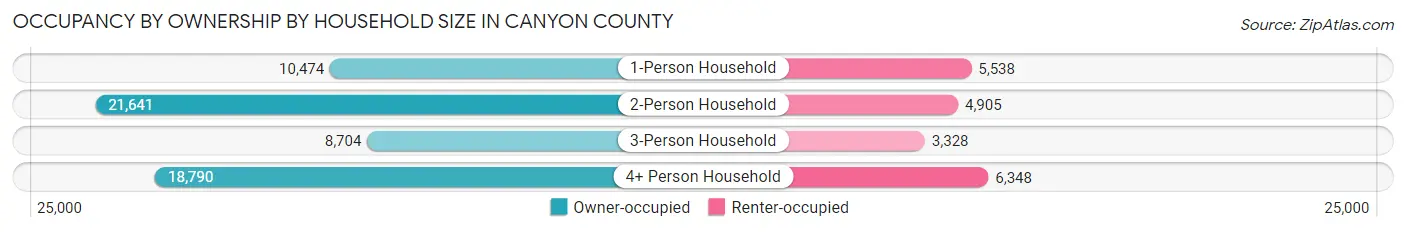
| Household Size | Owner-occupied | Renter-occupied |
| 1-Person Household | 10,474 (65.4%) | 5,538 (34.6%) |
| 2-Person Household | 21,641 (81.5%) | 4,905 (18.5%) |
| 3-Person Household | 8,704 (72.3%) | 3,328 (27.7%) |
| 4+ Person Household | 18,790 (74.8%) | 6,348 (25.3%) |
| Total Housing Units | 59,609 (74.8%) | 20,119 (25.2%) |
Occupancy by Educational Attainment in Canyon County
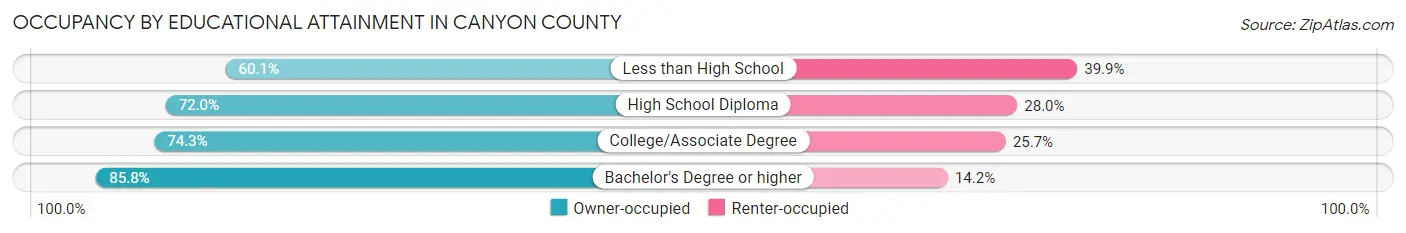
| Household Size | Owner-occupied | Renter-occupied |
| Less than High School | 5,656 (60.1%) | 3,750 (39.9%) |
| High School Diploma | 15,494 (72.0%) | 6,021 (28.0%) |
| College/Associate Degree | 21,952 (74.3%) | 7,607 (25.7%) |
| Bachelor's Degree or higher | 16,507 (85.8%) | 2,741 (14.2%) |
Occupancy by Age of Householder in Canyon County
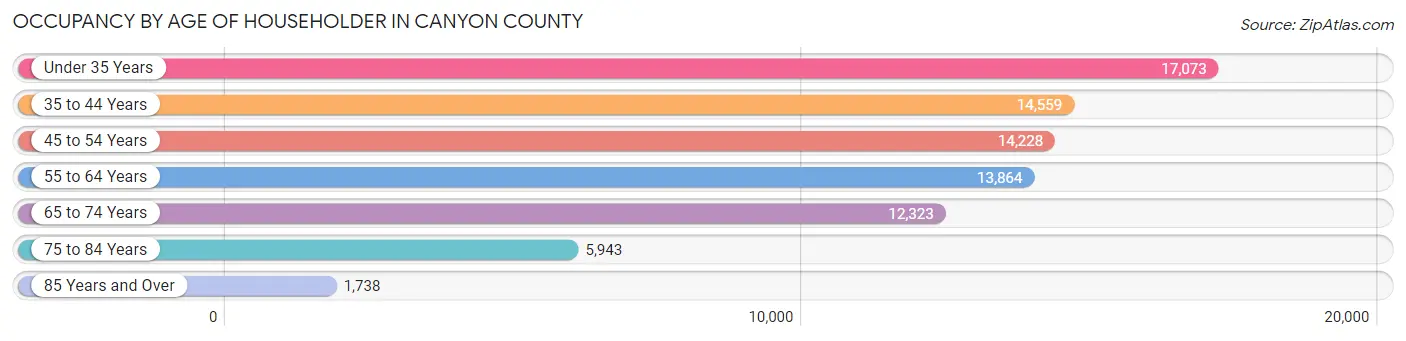
| Age Bracket | # Households | % Households |
| Under 35 Years | 17,073 | 21.4% |
| 35 to 44 Years | 14,559 | 18.3% |
| 45 to 54 Years | 14,228 | 17.8% |
| 55 to 64 Years | 13,864 | 17.4% |
| 65 to 74 Years | 12,323 | 15.5% |
| 75 to 84 Years | 5,943 | 7.4% |
| 85 Years and Over | 1,738 | 2.2% |
| Total | 79,728 | 100.0% |
Housing Finances in Canyon County
Median Income by Occupancy in Canyon County
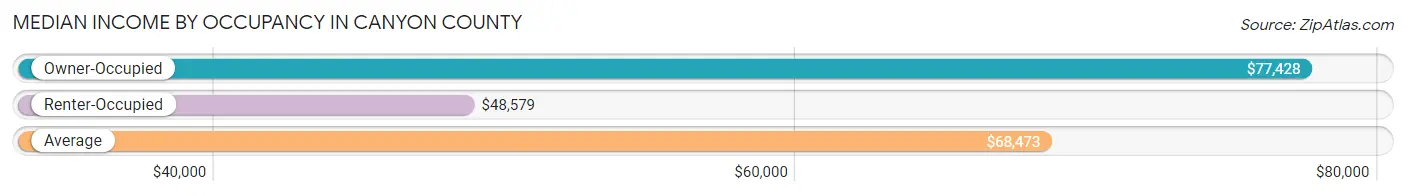
| Occupancy Type | # Households | Median Income |
| Owner-Occupied | 59,609 (74.8%) | $77,428 |
| Renter-Occupied | 20,119 (25.2%) | $48,579 |
| Average | 79,728 (100.0%) | $68,473 |
Occupancy by Householder Income Bracket in Canyon County
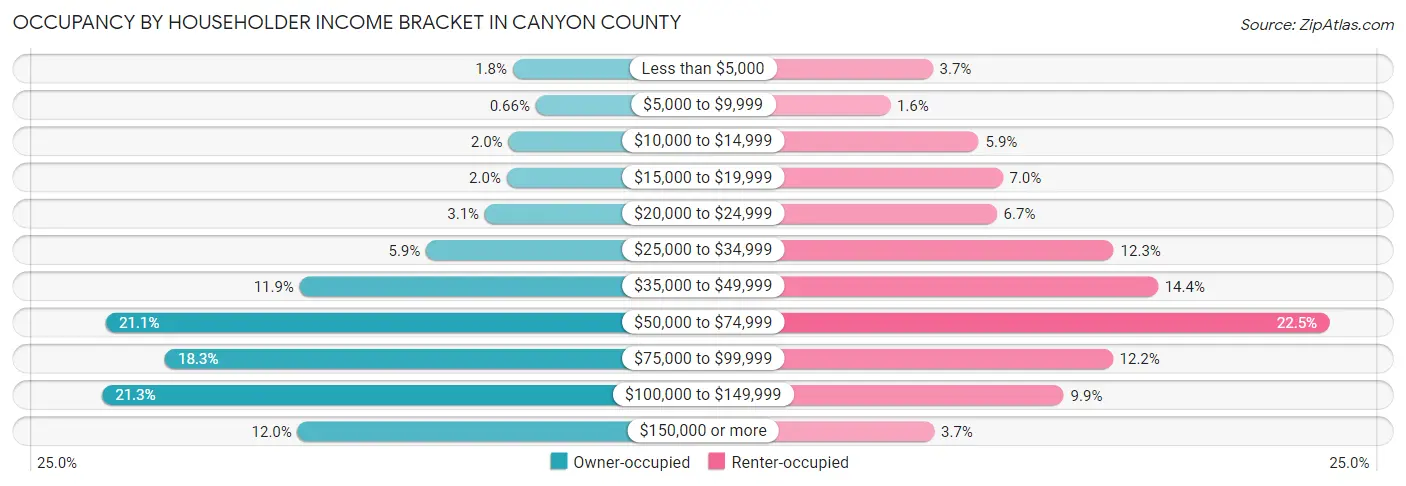
| Income Bracket | Owner-occupied | Renter-occupied |
| Less than $5,000 | 1,043 (1.8%) | 738 (3.7%) |
| $5,000 to $9,999 | 396 (0.7%) | 330 (1.6%) |
| $10,000 to $14,999 | 1,166 (2.0%) | 1,178 (5.9%) |
| $15,000 to $19,999 | 1,215 (2.0%) | 1,409 (7.0%) |
| $20,000 to $24,999 | 1,836 (3.1%) | 1,353 (6.7%) |
| $25,000 to $34,999 | 3,507 (5.9%) | 2,472 (12.3%) |
| $35,000 to $49,999 | 7,093 (11.9%) | 2,896 (14.4%) |
| $50,000 to $74,999 | 12,589 (21.1%) | 4,534 (22.5%) |
| $75,000 to $99,999 | 10,913 (18.3%) | 2,463 (12.2%) |
| $100,000 to $149,999 | 12,699 (21.3%) | 1,993 (9.9%) |
| $150,000 or more | 7,152 (12.0%) | 753 (3.7%) |
| Total | 59,609 (100.0%) | 20,119 (100.0%) |
Monthly Housing Cost Tiers in Canyon County
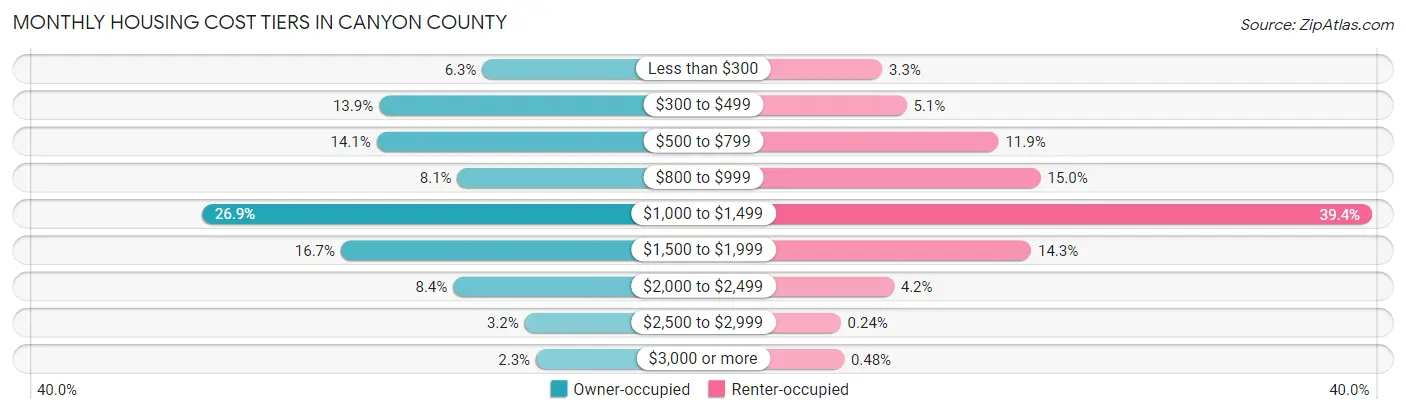
| Monthly Cost | Owner-occupied | Renter-occupied |
| Less than $300 | 3,752 (6.3%) | 662 (3.3%) |
| $300 to $499 | 8,283 (13.9%) | 1,024 (5.1%) |
| $500 to $799 | 8,393 (14.1%) | 2,387 (11.9%) |
| $800 to $999 | 4,841 (8.1%) | 3,009 (15.0%) |
| $1,000 to $1,499 | 16,058 (26.9%) | 7,919 (39.4%) |
| $1,500 to $1,999 | 9,960 (16.7%) | 2,869 (14.3%) |
| $2,000 to $2,499 | 5,033 (8.4%) | 835 (4.2%) |
| $2,500 to $2,999 | 1,897 (3.2%) | 48 (0.2%) |
| $3,000 or more | 1,392 (2.3%) | 97 (0.5%) |
| Total | 59,609 (100.0%) | 20,119 (100.0%) |
Physical Housing Characteristics in Canyon County
Housing Structures in Canyon County
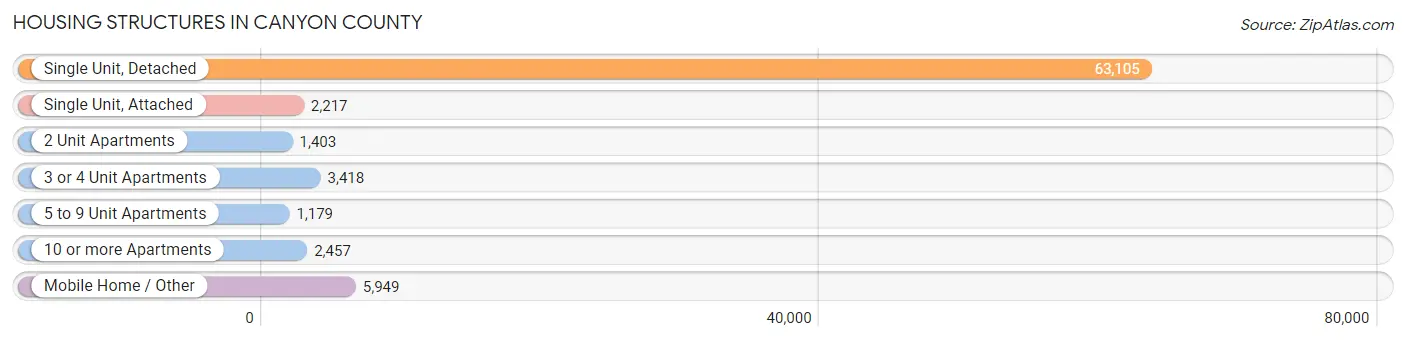
| Structure Type | # Housing Units | % Housing Units |
| Single Unit, Detached | 63,105 | 79.1% |
| Single Unit, Attached | 2,217 | 2.8% |
| 2 Unit Apartments | 1,403 | 1.8% |
| 3 or 4 Unit Apartments | 3,418 | 4.3% |
| 5 to 9 Unit Apartments | 1,179 | 1.5% |
| 10 or more Apartments | 2,457 | 3.1% |
| Mobile Home / Other | 5,949 | 7.5% |
| Total | 79,728 | 100.0% |
Housing Structures by Occupancy in Canyon County
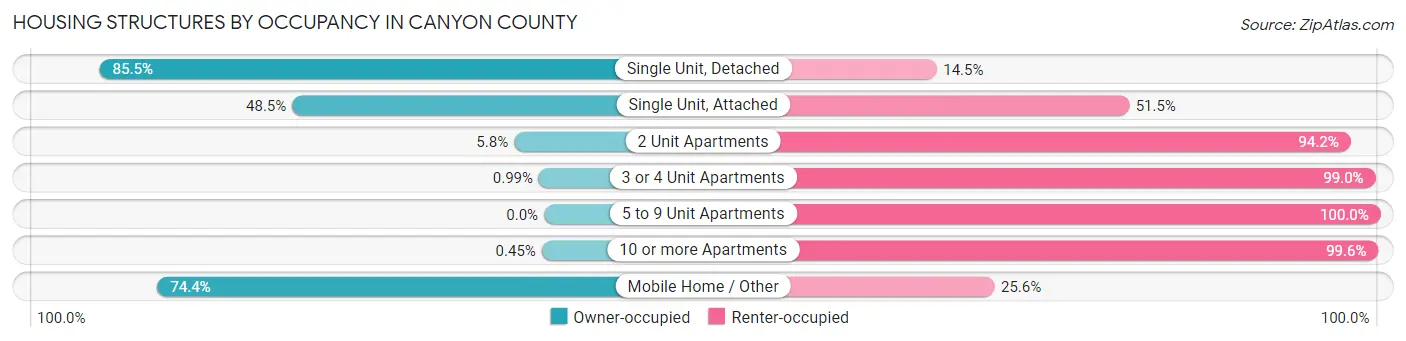
| Structure Type | Owner-occupied | Renter-occupied |
| Single Unit, Detached | 53,981 (85.5%) | 9,124 (14.5%) |
| Single Unit, Attached | 1,075 (48.5%) | 1,142 (51.5%) |
| 2 Unit Apartments | 81 (5.8%) | 1,322 (94.2%) |
| 3 or 4 Unit Apartments | 34 (1.0%) | 3,384 (99.0%) |
| 5 to 9 Unit Apartments | 0 (0.0%) | 1,179 (100.0%) |
| 10 or more Apartments | 11 (0.4%) | 2,446 (99.6%) |
| Mobile Home / Other | 4,427 (74.4%) | 1,522 (25.6%) |
| Total | 59,609 (74.8%) | 20,119 (25.2%) |
Housing Structures by Number of Rooms in Canyon County
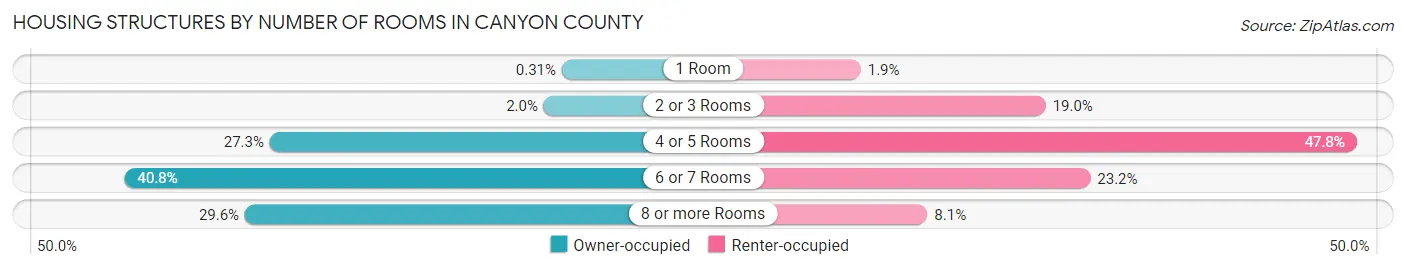
| Number of Rooms | Owner-occupied | Renter-occupied |
| 1 Room | 184 (0.3%) | 389 (1.9%) |
| 2 or 3 Rooms | 1,180 (2.0%) | 3,828 (19.0%) |
| 4 or 5 Rooms | 16,284 (27.3%) | 9,615 (47.8%) |
| 6 or 7 Rooms | 24,302 (40.8%) | 4,659 (23.2%) |
| 8 or more Rooms | 17,659 (29.6%) | 1,628 (8.1%) |
| Total | 59,609 (100.0%) | 20,119 (100.0%) |
Housing Structure by Heating Type in Canyon County
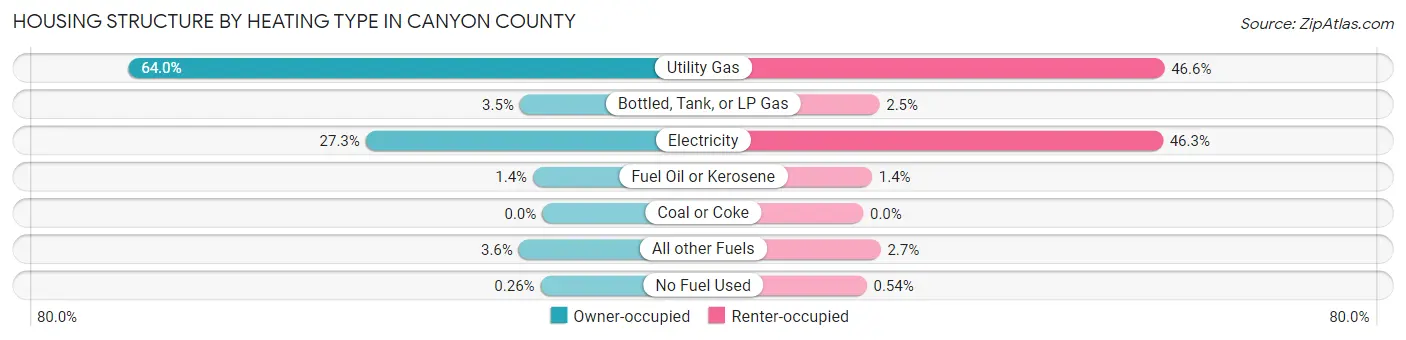
| Heating Type | Owner-occupied | Renter-occupied |
| Utility Gas | 38,126 (64.0%) | 9,368 (46.6%) |
| Bottled, Tank, or LP Gas | 2,062 (3.5%) | 505 (2.5%) |
| Electricity | 16,262 (27.3%) | 9,322 (46.3%) |
| Fuel Oil or Kerosene | 844 (1.4%) | 273 (1.4%) |
| Coal or Coke | 0 (0.0%) | 0 (0.0%) |
| All other Fuels | 2,161 (3.6%) | 542 (2.7%) |
| No Fuel Used | 154 (0.3%) | 109 (0.5%) |
| Total | 59,609 (100.0%) | 20,119 (100.0%) |
Household Vehicle Usage in Canyon County
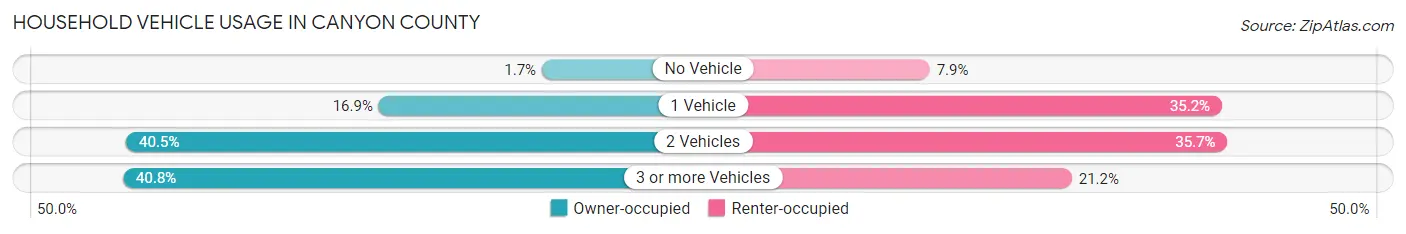
| Vehicles per Household | Owner-occupied | Renter-occupied |
| No Vehicle | 1,021 (1.7%) | 1,594 (7.9%) |
| 1 Vehicle | 10,099 (16.9%) | 7,080 (35.2%) |
| 2 Vehicles | 24,157 (40.5%) | 7,183 (35.7%) |
| 3 or more Vehicles | 24,332 (40.8%) | 4,262 (21.2%) |
| Total | 59,609 (100.0%) | 20,119 (100.0%) |
Real Estate & Mortgages in Canyon County
Real Estate and Mortgage Overview in Canyon County
| Characteristic | Without Mortgage | With Mortgage |
| Housing Units | 18,089 | 41,520 |
| Median Property Value | $282,400 | $316,000 |
| Median Household Income | $58,613 | $5,480 |
| Monthly Housing Costs | $442 | $1,363 |
| Real Estate Taxes | $1,841 | $1,574 |
Property Value by Mortgage Status in Canyon County
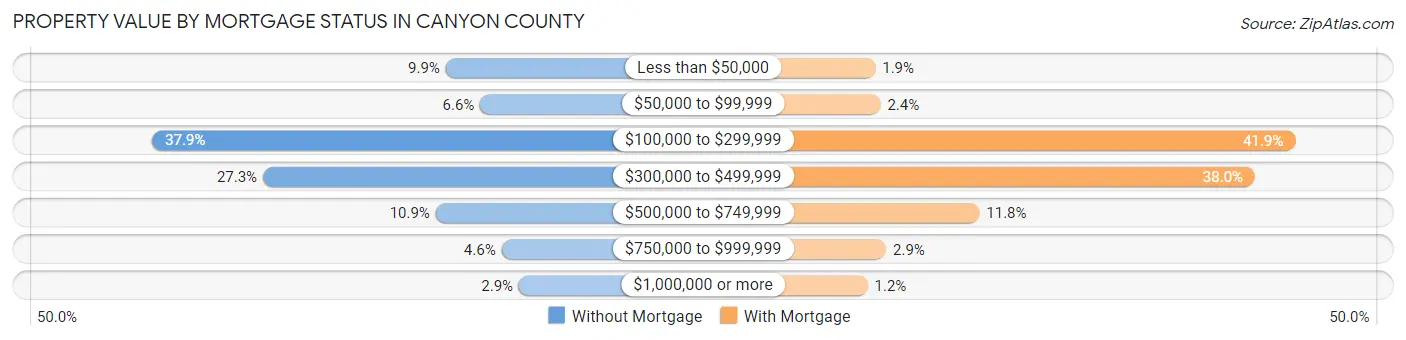
| Property Value | Without Mortgage | With Mortgage |
| Less than $50,000 | 1,791 (9.9%) | 781 (1.9%) |
| $50,000 to $99,999 | 1,195 (6.6%) | 986 (2.4%) |
| $100,000 to $299,999 | 6,846 (37.9%) | 17,385 (41.9%) |
| $300,000 to $499,999 | 4,938 (27.3%) | 15,789 (38.0%) |
| $500,000 to $749,999 | 1,963 (10.8%) | 4,895 (11.8%) |
| $750,000 to $999,999 | 828 (4.6%) | 1,207 (2.9%) |
| $1,000,000 or more | 528 (2.9%) | 477 (1.1%) |
| Total | 18,089 (100.0%) | 41,520 (100.0%) |
Household Income by Mortgage Status in Canyon County
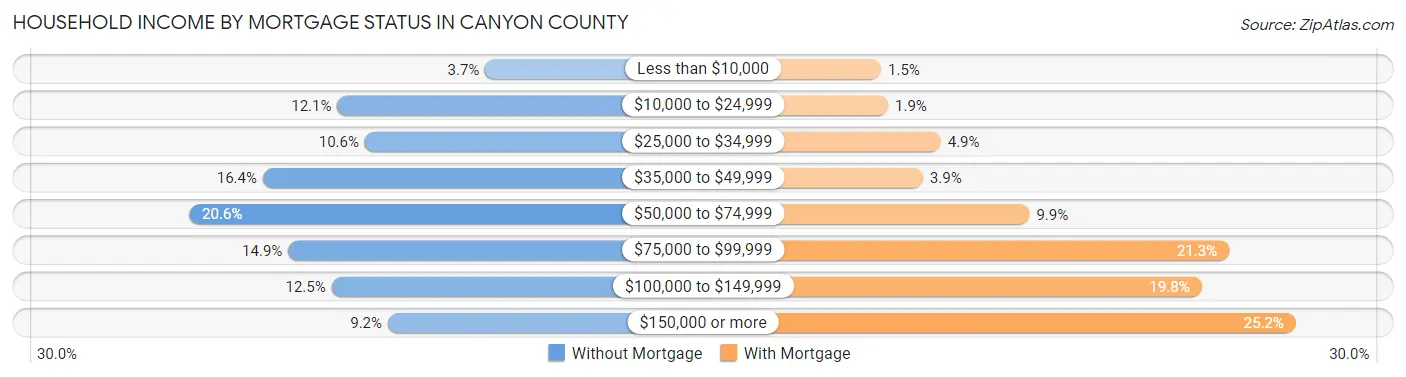
| Household Income | Without Mortgage | With Mortgage |
| Less than $10,000 | 665 (3.7%) | 606 (1.5%) |
| $10,000 to $24,999 | 2,195 (12.1%) | 774 (1.9%) |
| $25,000 to $34,999 | 1,910 (10.6%) | 2,022 (4.9%) |
| $35,000 to $49,999 | 2,964 (16.4%) | 1,597 (3.8%) |
| $50,000 to $74,999 | 3,727 (20.6%) | 4,129 (9.9%) |
| $75,000 to $99,999 | 2,703 (14.9%) | 8,862 (21.3%) |
| $100,000 to $149,999 | 2,253 (12.5%) | 8,210 (19.8%) |
| $150,000 or more | 1,672 (9.2%) | 10,446 (25.2%) |
| Total | 18,089 (100.0%) | 41,520 (100.0%) |
Property Value to Household Income Ratio in Canyon County
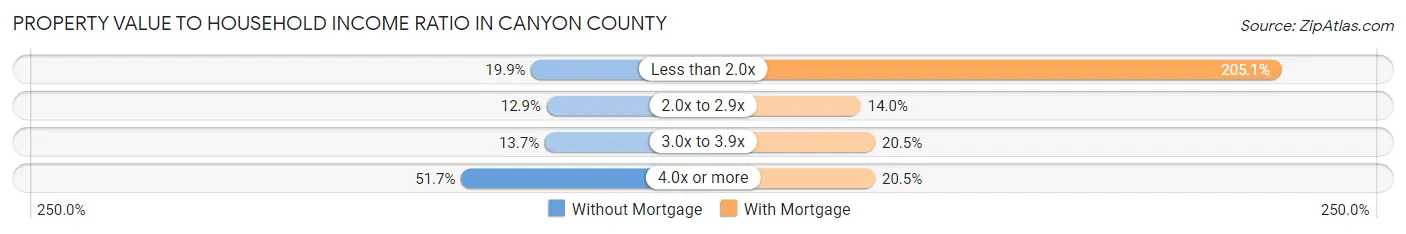
| Value-to-Income Ratio | Without Mortgage | With Mortgage |
| Less than 2.0x | 3,600 (19.9%) | 85,171 (205.1%) |
| 2.0x to 2.9x | 2,334 (12.9%) | 5,822 (14.0%) |
| 3.0x to 3.9x | 2,482 (13.7%) | 8,509 (20.5%) |
| 4.0x or more | 9,360 (51.7%) | 8,509 (20.5%) |
| Total | 18,089 (100.0%) | 41,520 (100.0%) |
Real Estate Taxes by Mortgage Status in Canyon County
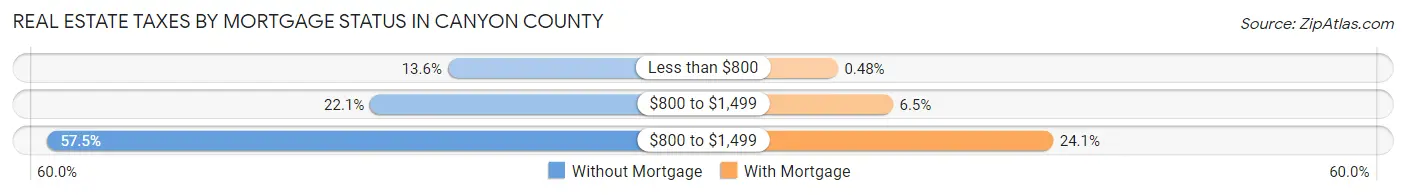
| Property Taxes | Without Mortgage | With Mortgage |
| Less than $800 | 2,465 (13.6%) | 201 (0.5%) |
| $800 to $1,499 | 4,004 (22.1%) | 2,707 (6.5%) |
| $800 to $1,499 | 10,399 (57.5%) | 9,997 (24.1%) |
| Total | 18,089 (100.0%) | 41,520 (100.0%) |
Health & Disability in Canyon County
Health Insurance Coverage by Age in Canyon County
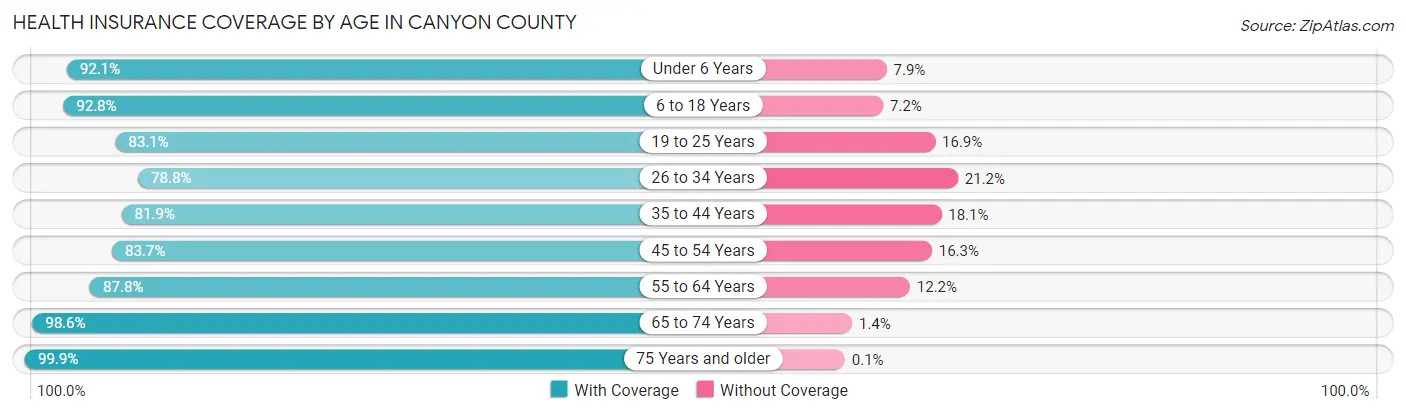
| Age Bracket | With Coverage | Without Coverage |
| Under 6 Years | 18,670 (92.1%) | 1,600 (7.9%) |
| 6 to 18 Years | 44,376 (92.8%) | 3,463 (7.2%) |
| 19 to 25 Years | 18,557 (83.1%) | 3,783 (16.9%) |
| 26 to 34 Years | 22,361 (78.8%) | 6,010 (21.2%) |
| 35 to 44 Years | 24,730 (81.9%) | 5,463 (18.1%) |
| 45 to 54 Years | 22,145 (83.7%) | 4,316 (16.3%) |
| 55 to 64 Years | 22,078 (87.8%) | 3,077 (12.2%) |
| 65 to 74 Years | 19,954 (98.6%) | 292 (1.4%) |
| 75 Years and older | 12,356 (99.9%) | 12 (0.1%) |
| Total | 205,227 (88.0%) | 28,016 (12.0%) |
Health Insurance Coverage by Citizenship Status in Canyon County
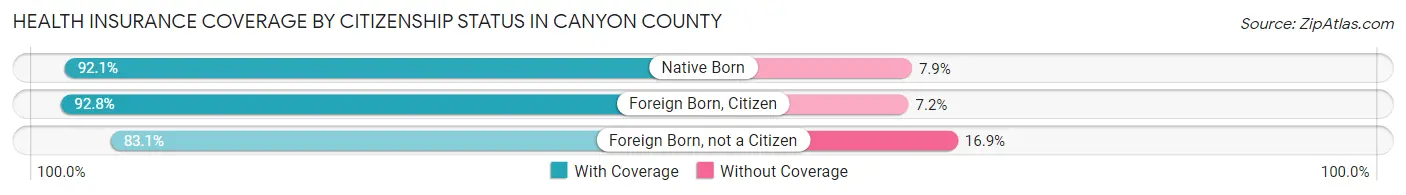
| Citizenship Status | With Coverage | Without Coverage |
| Native Born | 18,670 (92.1%) | 1,600 (7.9%) |
| Foreign Born, Citizen | 44,376 (92.8%) | 3,463 (7.2%) |
| Foreign Born, not a Citizen | 18,557 (83.1%) | 3,783 (16.9%) |
Health Insurance Coverage by Household Income in Canyon County
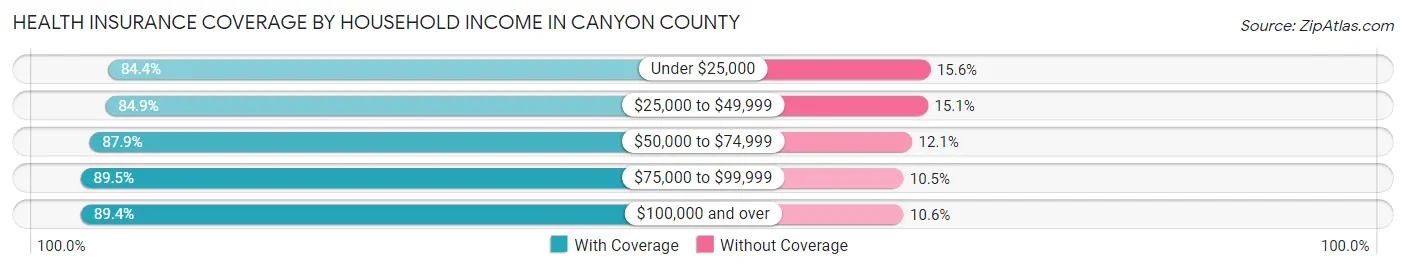
| Household Income | With Coverage | Without Coverage |
| Under $25,000 | 16,874 (84.4%) | 3,113 (15.6%) |
| $25,000 to $49,999 | 31,552 (84.9%) | 5,627 (15.1%) |
| $50,000 to $74,999 | 43,336 (87.9%) | 5,990 (12.1%) |
| $75,000 to $99,999 | 38,470 (89.5%) | 4,514 (10.5%) |
| $100,000 and over | 71,974 (89.4%) | 8,499 (10.6%) |
Public vs Private Health Insurance Coverage by Age in Canyon County
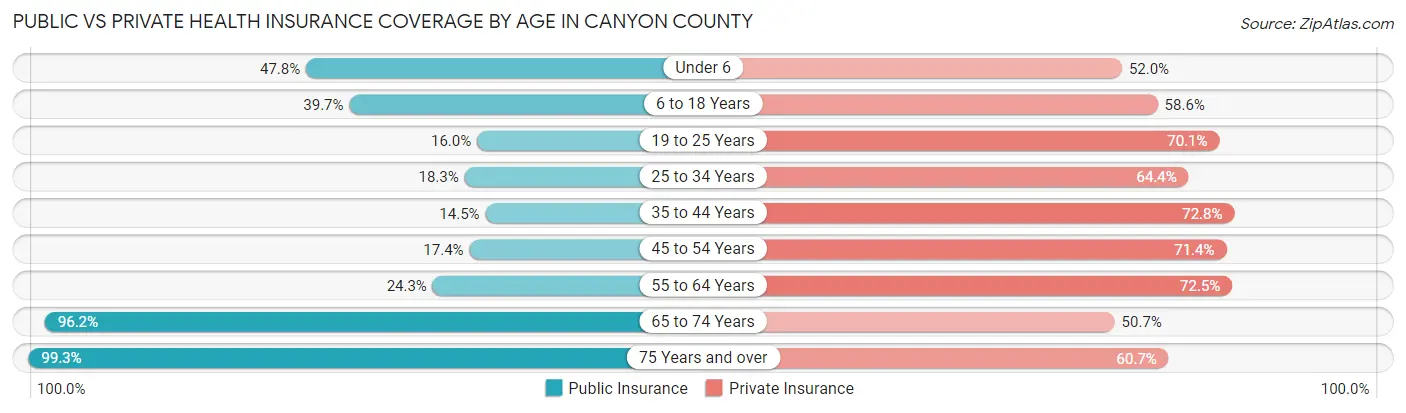
| Age Bracket | Public Insurance | Private Insurance |
| Under 6 | 9,681 (47.8%) | 10,540 (52.0%) |
| 6 to 18 Years | 19,002 (39.7%) | 28,050 (58.6%) |
| 19 to 25 Years | 3,578 (16.0%) | 15,653 (70.1%) |
| 25 to 34 Years | 5,204 (18.3%) | 18,261 (64.4%) |
| 35 to 44 Years | 4,368 (14.5%) | 21,993 (72.8%) |
| 45 to 54 Years | 4,615 (17.4%) | 18,882 (71.4%) |
| 55 to 64 Years | 6,099 (24.2%) | 18,225 (72.5%) |
| 65 to 74 Years | 19,483 (96.2%) | 10,255 (50.6%) |
| 75 Years and over | 12,282 (99.3%) | 7,503 (60.7%) |
| Total | 84,312 (36.1%) | 149,362 (64.0%) |
Disability Status by Sex by Age in Canyon County
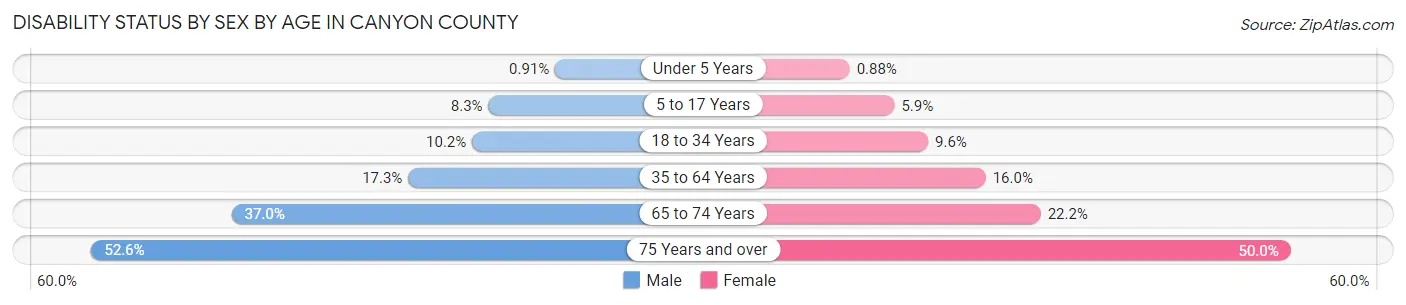
| Age Bracket | Male | Female |
| Under 5 Years | 76 (0.9%) | 70 (0.9%) |
| 5 to 17 Years | 2,045 (8.3%) | 1,376 (5.9%) |
| 18 to 34 Years | 2,785 (10.2%) | 2,615 (9.6%) |
| 35 to 64 Years | 7,059 (17.3%) | 6,566 (16.0%) |
| 65 to 74 Years | 3,590 (36.9%) | 2,332 (22.2%) |
| 75 Years and over | 2,904 (52.6%) | 3,420 (50.0%) |
Disability Class by Sex by Age in Canyon County
Disability Class: Hearing Difficulty
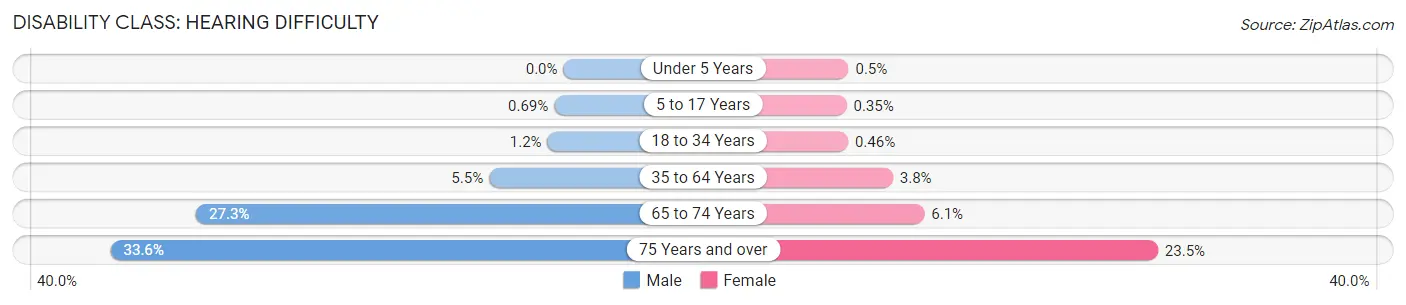
| Age Bracket | Male | Female |
| Under 5 Years | 0 (0.0%) | 40 (0.5%) |
| 5 to 17 Years | 168 (0.7%) | 82 (0.4%) |
| 18 to 34 Years | 322 (1.2%) | 126 (0.5%) |
| 35 to 64 Years | 2,256 (5.5%) | 1,554 (3.8%) |
| 65 to 74 Years | 2,649 (27.3%) | 645 (6.1%) |
| 75 Years and over | 1,857 (33.6%) | 1,606 (23.5%) |
Disability Class: Vision Difficulty
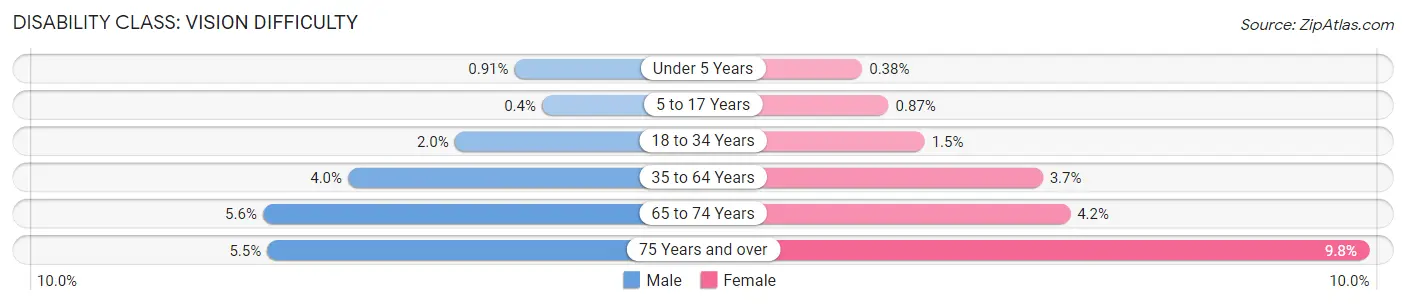
| Age Bracket | Male | Female |
| Under 5 Years | 76 (0.9%) | 30 (0.4%) |
| 5 to 17 Years | 97 (0.4%) | 203 (0.9%) |
| 18 to 34 Years | 554 (2.0%) | 419 (1.5%) |
| 35 to 64 Years | 1,632 (4.0%) | 1,527 (3.7%) |
| 65 to 74 Years | 542 (5.6%) | 446 (4.2%) |
| 75 Years and over | 304 (5.5%) | 669 (9.8%) |
Disability Class: Cognitive Difficulty
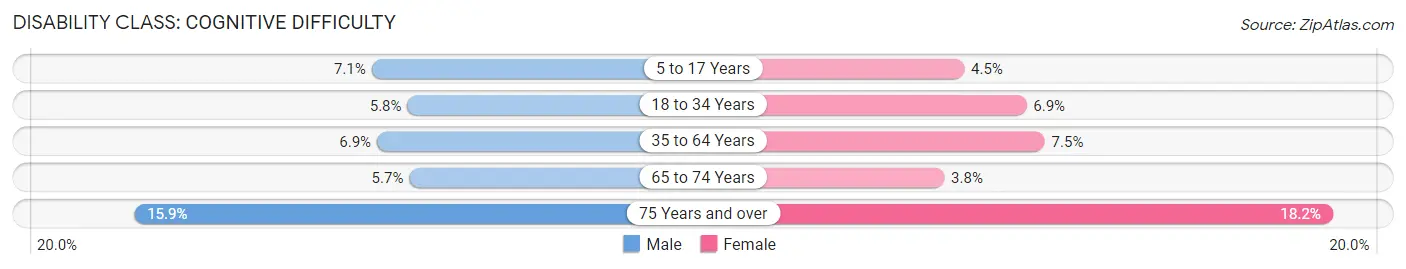
| Age Bracket | Male | Female |
| 5 to 17 Years | 1,746 (7.1%) | 1,063 (4.5%) |
| 18 to 34 Years | 1,588 (5.8%) | 1,865 (6.9%) |
| 35 to 64 Years | 2,828 (6.9%) | 3,083 (7.5%) |
| 65 to 74 Years | 556 (5.7%) | 400 (3.8%) |
| 75 Years and over | 880 (15.9%) | 1,247 (18.2%) |
Disability Class: Ambulatory Difficulty
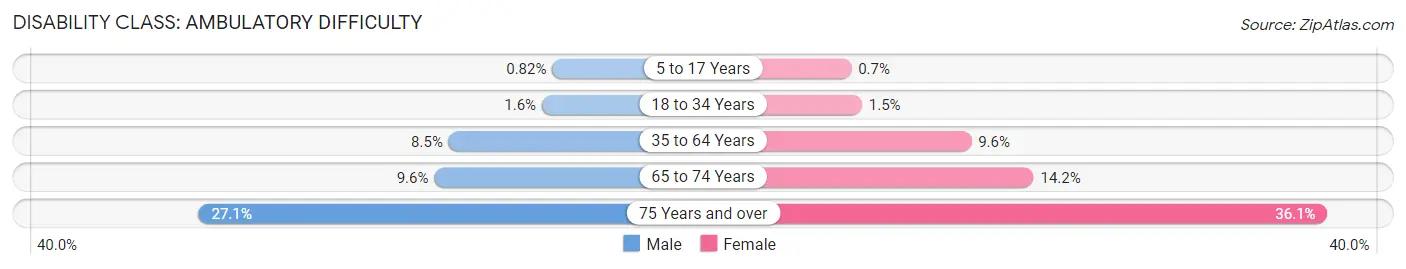
| Age Bracket | Male | Female |
| 5 to 17 Years | 201 (0.8%) | 164 (0.7%) |
| 18 to 34 Years | 435 (1.6%) | 406 (1.5%) |
| 35 to 64 Years | 3,476 (8.5%) | 3,939 (9.6%) |
| 65 to 74 Years | 931 (9.6%) | 1,499 (14.2%) |
| 75 Years and over | 1,496 (27.1%) | 2,467 (36.0%) |
Disability Class: Self-Care Difficulty
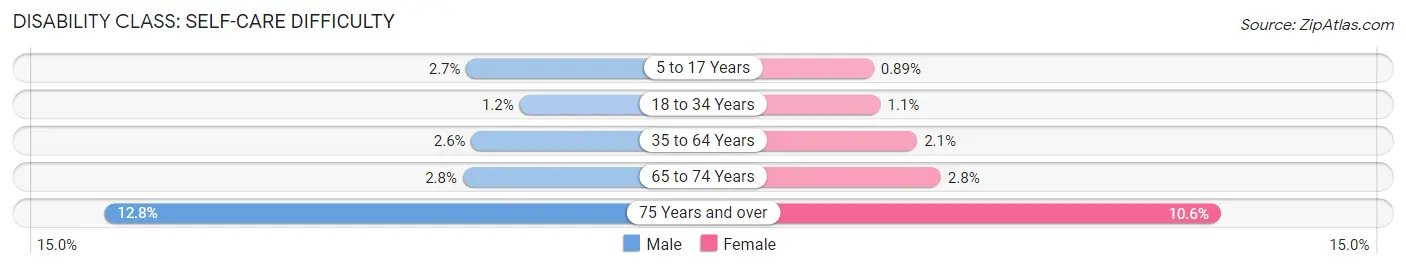
| Age Bracket | Male | Female |
| 5 to 17 Years | 661 (2.7%) | 209 (0.9%) |
| 18 to 34 Years | 335 (1.2%) | 293 (1.1%) |
| 35 to 64 Years | 1,044 (2.6%) | 860 (2.1%) |
| 65 to 74 Years | 272 (2.8%) | 291 (2.8%) |
| 75 Years and over | 706 (12.8%) | 722 (10.5%) |
Technology Access in Canyon County
Computing Device Access in Canyon County
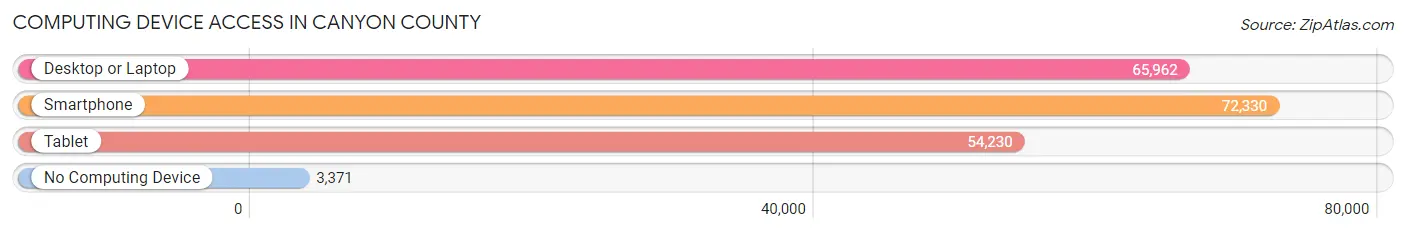
| Device Type | # Households | % Households |
| Desktop or Laptop | 65,962 | 82.7% |
| Smartphone | 72,330 | 90.7% |
| Tablet | 54,230 | 68.0% |
| No Computing Device | 3,371 | 4.2% |
| Total | 79,728 | 100.0% |
Internet Access in Canyon County
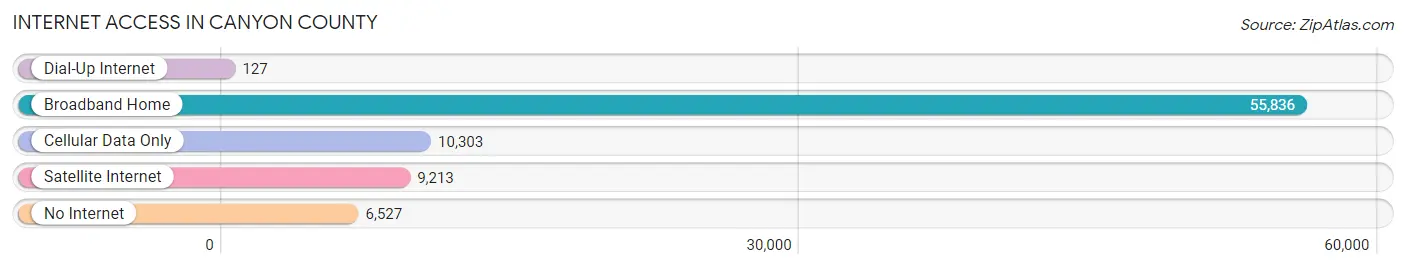
| Internet Type | # Households | % Households |
| Dial-Up Internet | 127 | 0.2% |
| Broadband Home | 55,836 | 70.0% |
| Cellular Data Only | 10,303 | 12.9% |
| Satellite Internet | 9,213 | 11.6% |
| No Internet | 6,527 | 8.2% |
| Total | 79,728 | 100.0% |
Canyon County Summary
Canyon County, Idaho is located in the southwestern part of the state and is part of the Boise Metropolitan Statistical Area. It is bordered by Ada County to the north, Owyhee County to the east, Malheur County, Oregon to the south, and Payette County to the west. The county seat is Caldwell, and the largest city is Nampa. The county was established in 1891 and named for the canyon of the Boise River, which forms its southern boundary.
Geography
Canyon County covers an area of 1,039 square miles and is located in the Snake River Plain region of Idaho. The county is mostly flat, with the exception of the Owyhee Mountains in the east and the Boise Mountains in the west. The Snake River forms the county’s southern boundary, and the Boise River forms its western boundary. The county is home to several lakes, including Lake Lowell, Lake Cascade, and Lake Walcott.
The climate of Canyon County is semi-arid, with hot summers and cold winters. The average annual precipitation is 11.5 inches, and the average annual temperature is 50.3 degrees Fahrenheit.
Economy
Agriculture is the primary industry in Canyon County. The county is home to a variety of crops, including potatoes, onions, corn, wheat, and alfalfa. Livestock production is also important, with cattle, sheep, and horses being raised in the county.
Manufacturing is also an important part of the county’s economy. The county is home to several food processing plants, as well as a variety of other manufacturing businesses.
The county is also home to several technology companies, including Hewlett-Packard and Micron Technology.
Demographics
As of the 2010 census, the population of Canyon County was 188,923. The population is predominantly white (87.3%), with smaller percentages of Hispanic (7.7%), Asian (2.2%), and African American (1.2%) residents.
The median household income in the county is $45,945, and the median family income is $54,945. The per capita income is $22,845.
The largest employers in the county are St. Luke’s Health System, Hewlett-Packard, and Micron Technology.
Conclusion
Canyon County, Idaho is located in the southwestern part of the state and is part of the Boise Metropolitan Statistical Area. It is bordered by Ada County to the north, Owyhee County to the east, Malheur County, Oregon to the south, and Payette County to the west. The county is mostly flat, with the exception of the Owyhee Mountains in the east and the Boise Mountains in the west. Agriculture is the primary industry in the county, and manufacturing and technology are also important parts of the economy. The population of the county is predominantly white, with smaller percentages of Hispanic, Asian, and African American residents. The median household income in the county is $45,945, and the largest employers are St. Luke’s Health System, Hewlett-Packard, and Micron Technology.
Common Questions
What is the Total Population of Canyon County?
Total Population of Canyon County is 235,006.
What is the Total Male Population of Canyon County?
Total Male Population of Canyon County is 117,340.
What is the Total Female Population of Canyon County?
Total Female Population of Canyon County is 117,666.
What is the Ratio of Males per 100 Females in Canyon County?
There are 99.72 Males per 100 Females in Canyon County.
What is the Ratio of Females per 100 Males in Canyon County?
There are 100.28 Females per 100 Males in Canyon County.
What is the Median Population Age in Canyon County?
Median Population Age in Canyon County is 34.4 Years.
What is the Average Family Size in Canyon County
Average Family Size in Canyon County is 3.3 People.
What is the Average Household Size in Canyon County
Average Household Size in Canyon County is 2.9 People.
What is Per Capita Income in Canyon County?
Per Capita income in Canyon County is $28,569.
What is the Median Family Income in Canyon County?
Median Family Income in Canyon County is $78,620.
What is the Median Household income in Canyon County?
Median Household Income in Canyon County is $68,473.
What is Income or Wage Gap in Canyon County?
Income or Wage Gap in Canyon County is 35.1%.
Women in Canyon County earn 64.9 cents for every dollar earned by a man.
What is Family Income Deficit in Canyon County?
Family Income Deficit in Canyon County is $12,020.
Families that are below poverty line in Canyon County earn $12,020 less on average than the poverty threshold level.
What is Inequality or Gini Index in Canyon County?
Inequality or Gini Index in Canyon County is 0.39.
How Large is the Labor Force in Canyon County?
There are 112,690 People in the Labor Forcein in Canyon County.
What is the Percentage of People in the Labor Force in Canyon County?
63.4% of People are in the Labor Force in Canyon County.
What is the Unemployment Rate in Canyon County?
Unemployment Rate in Canyon County is 3.5%.