Boundary County, ID
Boundary County Map
Boundary County Overview
12,335
TOTAL POPULATION
6,230
MALE POPULATION
6,105
FEMALE POPULATION
102.05
MALES / 100 FEMALES
97.99
FEMALES / 100 MALES
43.6
MEDIAN AGE
3.0
AVG FAMILY SIZE
2.6
AVG HOUSEHOLD SIZE
$27,287
PER CAPITA INCOME
$65,122
AVG FAMILY INCOME
$58,810
AVG HOUSEHOLD INCOME
38.2%
WAGE / INCOME GAP [ % ]
61.8¢/ $1
WAGE / INCOME GAP [ $ ]
0.41
INEQUALITY / GINI INDEX
5,002
LABOR FORCE [ PEOPLE ]
51.1%
PERCENT IN LABOR FORCE
3.8%
UNEMPLOYMENT RATE
Boundary County Area Codes
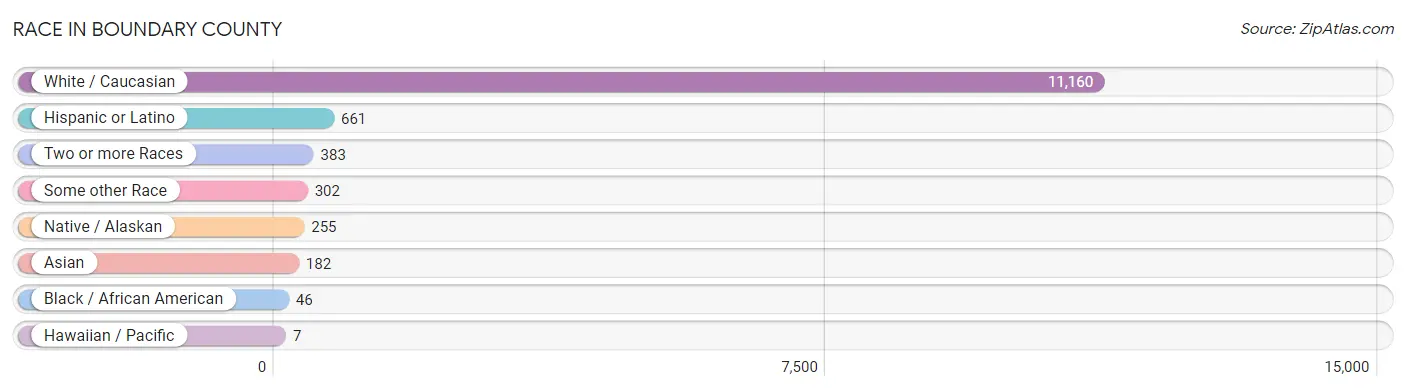
Race in Boundary County
The most populous races in Boundary County are White / Caucasian (11,160 | 90.5%), Hispanic or Latino (661 | 5.4%), and Two or more Races (383 | 3.1%).
| Race | # Population | % Population |
| Asian | 182 | 1.5% |
| Black / African American | 46 | 0.4% |
| Hawaiian / Pacific | 7 | 0.1% |
| Hispanic or Latino | 661 | 5.4% |
| Native / Alaskan | 255 | 2.1% |
| White / Caucasian | 11,160 | 90.5% |
| Two or more Races | 383 | 3.1% |
| Some other Race | 302 | 2.5% |
| Total | 12,335 | 100.0% |
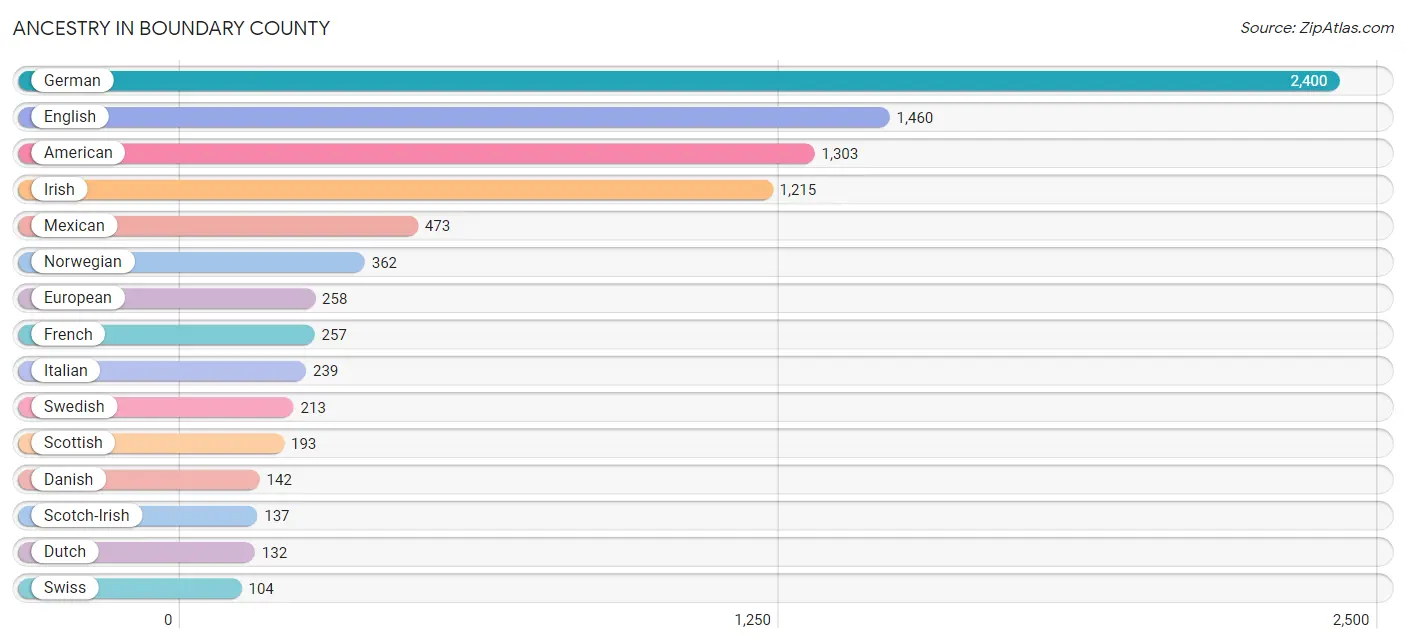
Ancestry in Boundary County
The most populous ancestries reported in Boundary County are German (2,400 | 19.5%), English (1,460 | 11.8%), American (1,303 | 10.6%), Irish (1,215 | 9.9%), and Mexican (473 | 3.8%), together accounting for 55.5% of all Boundary County residents.
| Ancestry | # Population | % Population |
| African | 4 | 0.0% |
| American | 1,303 | 10.6% |
| Arab | 9 | 0.1% |
| Austrian | 73 | 0.6% |
| Bhutanese | 12 | 0.1% |
| Blackfeet | 13 | 0.1% |
| Bolivian | 3 | 0.0% |
| Brazilian | 3 | 0.0% |
| British | 103 | 0.8% |
| Burmese | 35 | 0.3% |
| Canadian | 90 | 0.7% |
| Central American | 99 | 0.8% |
| Cherokee | 102 | 0.8% |
| Chippewa | 1 | 0.0% |
| Croatian | 21 | 0.2% |
| Cuban | 23 | 0.2% |
| Czech | 3 | 0.0% |
| Danish | 142 | 1.1% |
| Dominican | 9 | 0.1% |
| Dutch | 132 | 1.1% |
| Eastern European | 76 | 0.6% |
| English | 1,460 | 11.8% |
| European | 258 | 2.1% |
| Finnish | 85 | 0.7% |
| French | 257 | 2.1% |
| French Canadian | 98 | 0.8% |
| German | 2,400 | 19.5% |
| Greek | 14 | 0.1% |
| Honduran | 64 | 0.5% |
| Indian (Asian) | 79 | 0.6% |
| Irish | 1,215 | 9.9% |
| Italian | 239 | 1.9% |
| Korean | 29 | 0.2% |
| Lebanese | 9 | 0.1% |
| Mexican | 473 | 3.8% |
| Navajo | 2 | 0.0% |
| Northern European | 72 | 0.6% |
| Norwegian | 362 | 2.9% |
| Ottawa | 31 | 0.3% |
| Pakistani | 16 | 0.1% |
| Panamanian | 22 | 0.2% |
| Polish | 95 | 0.8% |
| Puerto Rican | 24 | 0.2% |
| Salvadoran | 13 | 0.1% |
| Scandinavian | 72 | 0.6% |
| Scotch-Irish | 137 | 1.1% |
| Scottish | 193 | 1.6% |
| Shoshone | 3 | 0.0% |
| Sioux | 4 | 0.0% |
| Slavic | 13 | 0.1% |
| South American | 3 | 0.0% |
| Spaniard | 21 | 0.2% |
| Spanish | 8 | 0.1% |
| Subsaharan African | 4 | 0.0% |
| Swedish | 213 | 1.7% |
| Swiss | 104 | 0.8% |
| Thai | 59 | 0.5% |
| Ukrainian | 32 | 0.3% |
| Ute | 3 | 0.0% |
| Welsh | 26 | 0.2% |
| Yakama | 6 | 0.1% | View All 61 Rows |
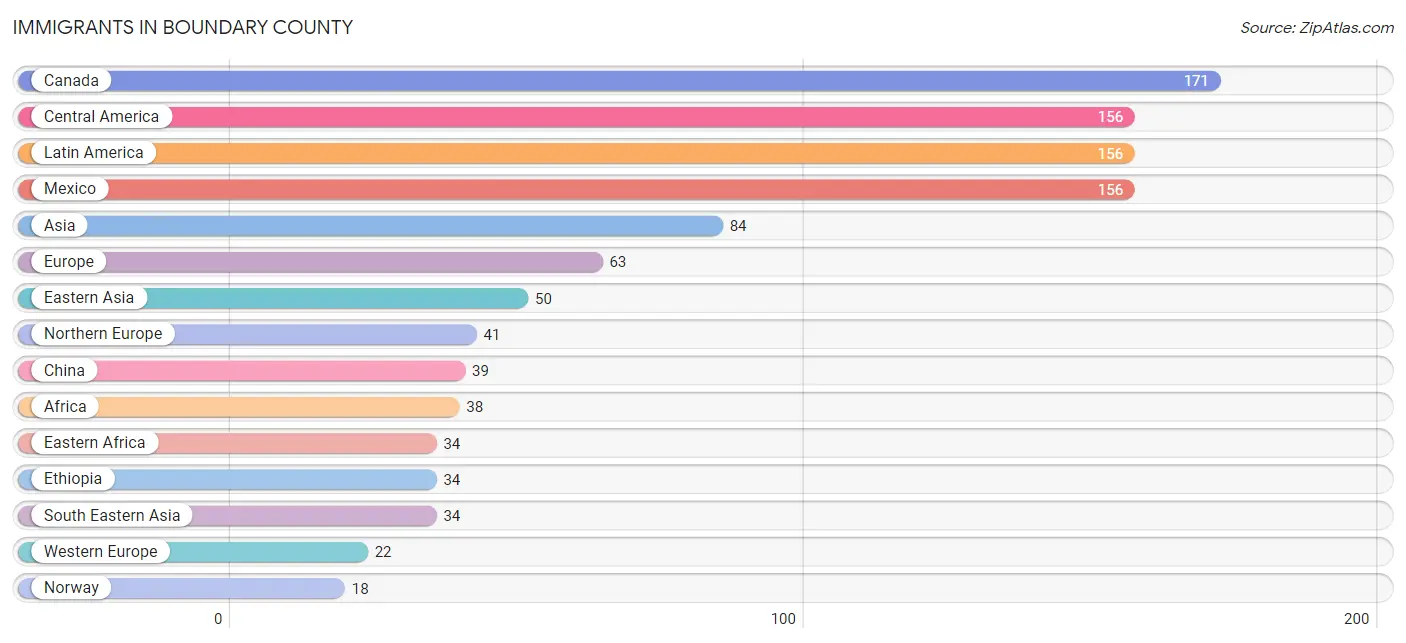
Immigrants in Boundary County
The most numerous immigrant groups reported in Boundary County came from Canada (171 | 1.4%), Central America (156 | 1.3%), Latin America (156 | 1.3%), Mexico (156 | 1.3%), and Asia (84 | 0.7%), together accounting for 5.8% of all Boundary County residents.
| Immigration Origin | # Population | % Population |
| Africa | 38 | 0.3% |
| Asia | 84 | 0.7% |
| Cameroon | 4 | 0.0% |
| Canada | 171 | 1.4% |
| Central America | 156 | 1.3% |
| China | 39 | 0.3% |
| Eastern Africa | 34 | 0.3% |
| Eastern Asia | 50 | 0.4% |
| Ethiopia | 34 | 0.3% |
| Europe | 63 | 0.5% |
| Germany | 15 | 0.1% |
| Korea | 11 | 0.1% |
| Latin America | 156 | 1.3% |
| Malaysia | 3 | 0.0% |
| Mexico | 156 | 1.3% |
| Middle Africa | 4 | 0.0% |
| Netherlands | 2 | 0.0% |
| Northern Europe | 41 | 0.3% |
| Norway | 18 | 0.2% |
| Philippines | 15 | 0.1% |
| South Eastern Asia | 34 | 0.3% |
| Switzerland | 5 | 0.0% |
| Thailand | 16 | 0.1% |
| Western Europe | 22 | 0.2% | View All 24 Rows |
Sex and Age in Boundary County
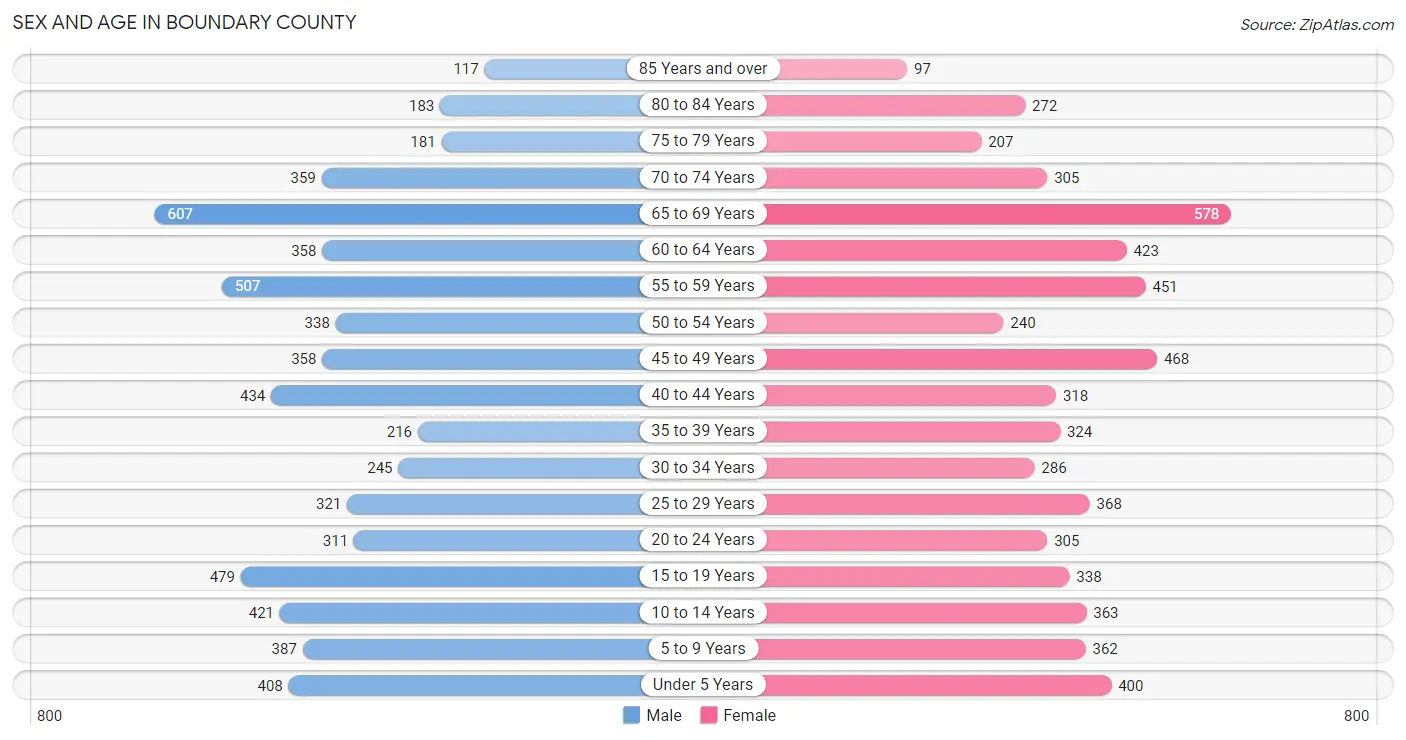
Sex and Age in Boundary County
The most populous age groups in Boundary County are 65 to 69 Years (607 | 9.7%) for men and 65 to 69 Years (578 | 9.5%) for women.
| Age Bracket | Male | Female |
| Under 5 Years | 408 (6.6%) | 400 (6.6%) |
| 5 to 9 Years | 387 (6.2%) | 362 (5.9%) |
| 10 to 14 Years | 421 (6.8%) | 363 (5.9%) |
| 15 to 19 Years | 479 (7.7%) | 338 (5.5%) |
| 20 to 24 Years | 311 (5.0%) | 305 (5.0%) |
| 25 to 29 Years | 321 (5.1%) | 368 (6.0%) |
| 30 to 34 Years | 245 (3.9%) | 286 (4.7%) |
| 35 to 39 Years | 216 (3.5%) | 324 (5.3%) |
| 40 to 44 Years | 434 (7.0%) | 318 (5.2%) |
| 45 to 49 Years | 358 (5.8%) | 468 (7.7%) |
| 50 to 54 Years | 338 (5.4%) | 240 (3.9%) |
| 55 to 59 Years | 507 (8.1%) | 451 (7.4%) |
| 60 to 64 Years | 358 (5.8%) | 423 (6.9%) |
| 65 to 69 Years | 607 (9.7%) | 578 (9.5%) |
| 70 to 74 Years | 359 (5.8%) | 305 (5.0%) |
| 75 to 79 Years | 181 (2.9%) | 207 (3.4%) |
| 80 to 84 Years | 183 (2.9%) | 272 (4.5%) |
| 85 Years and over | 117 (1.9%) | 97 (1.6%) |
| Total | 6,230 (100.0%) | 6,105 (100.0%) |
Families and Households in Boundary County
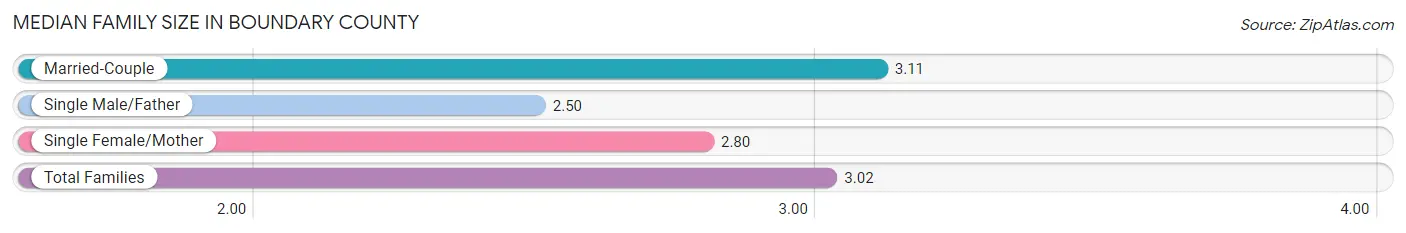
Median Family Size in Boundary County
The median family size in Boundary County is 3.02 persons per family, with married-couple families (2,650 | 81.1%) accounting for the largest median family size of 3.11 persons per family. On the other hand, single male/father families (324 | 9.9%) represent the smallest median family size with 2.50 persons per family.
| Family Type | # Families | Family Size |
| Married-Couple | 2,650 (81.1%) | 3.11 |
| Single Male/Father | 324 (9.9%) | 2.50 |
| Single Female/Mother | 292 (8.9%) | 2.80 |
| Total Families | 3,266 (100.0%) | 3.02 |
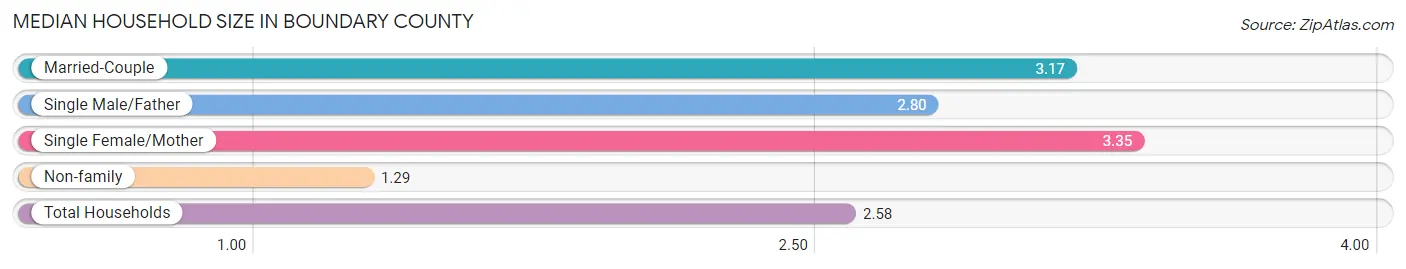
Median Household Size in Boundary County
The median household size in Boundary County is 2.58 persons per household, with single female/mother households (292 | 6.2%) accounting for the largest median household size of 3.35 persons per household. non-family households (1,444 | 30.7%) represent the smallest median household size with 1.29 persons per household.
| Household Type | # Households | Household Size |
| Married-Couple | 2,650 (56.3%) | 3.17 |
| Single Male/Father | 324 (6.9%) | 2.80 |
| Single Female/Mother | 292 (6.2%) | 3.35 |
| Non-family | 1,444 (30.7%) | 1.29 |
| Total Households | 4,710 (100.0%) | 2.58 |
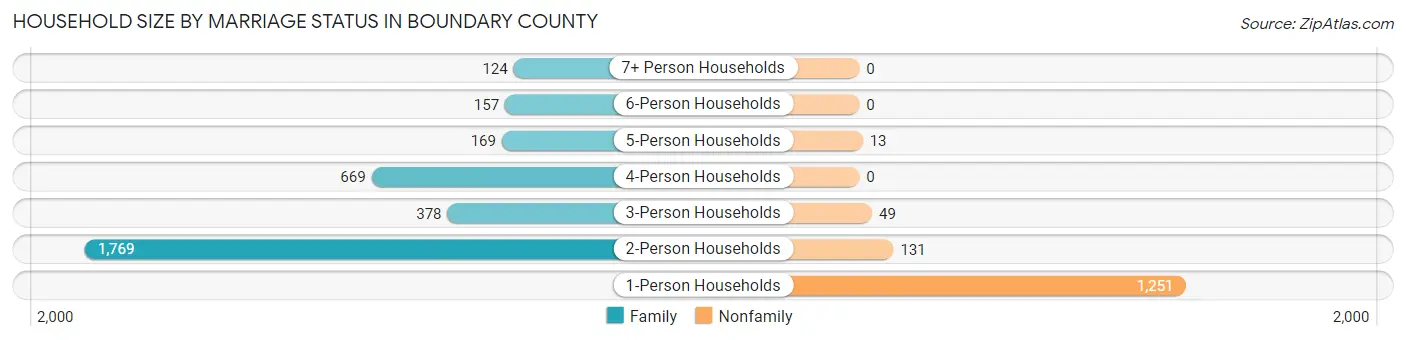
Household Size by Marriage Status in Boundary County
Out of a total of 4,710 households in Boundary County, 3,266 (69.3%) are family households, while 1,444 (30.7%) are nonfamily households. The most numerous type of family households are 2-person households, comprising 1,769, and the most common type of nonfamily households are 1-person households, comprising 1,251.
| Household Size | Family Households | Nonfamily Households |
| 1-Person Households | - | 1,251 (26.6%) |
| 2-Person Households | 1,769 (37.6%) | 131 (2.8%) |
| 3-Person Households | 378 (8.0%) | 49 (1.0%) |
| 4-Person Households | 669 (14.2%) | 0 (0.0%) |
| 5-Person Households | 169 (3.6%) | 13 (0.3%) |
| 6-Person Households | 157 (3.3%) | 0 (0.0%) |
| 7+ Person Households | 124 (2.6%) | 0 (0.0%) |
| Total | 3,266 (69.3%) | 1,444 (30.7%) |
Female Fertility in Boundary County
Fertility by Age in Boundary County
Average fertility rate in Boundary County is 66.0 births per 1,000 women. Women in the age bracket of 20 to 34 years have the highest fertility rate with 154.0 births per 1,000 women. Women in the age bracket of 20 to 34 years acount for 93.1% of all women with births.
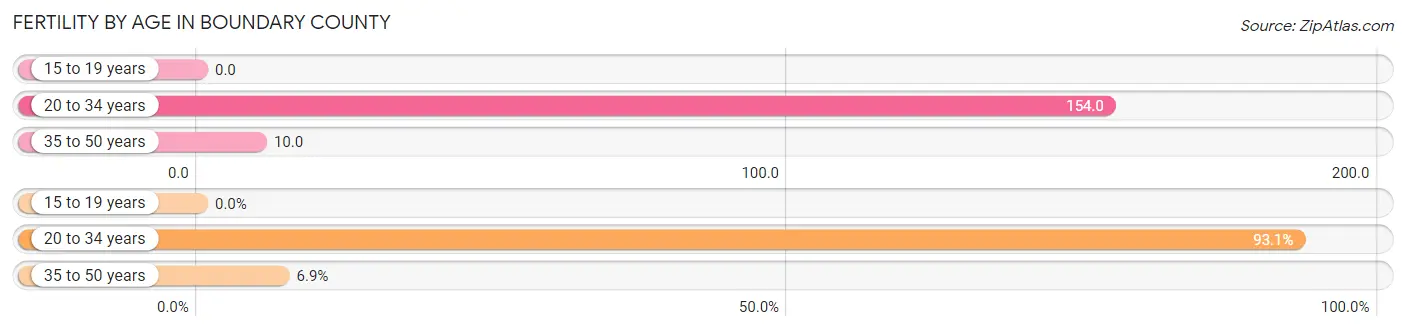
| Age Bracket | Women with Births | Births / 1,000 Women |
| 15 to 19 years | 0 (0.0%) | 0.0 |
| 20 to 34 years | 148 (93.1%) | 154.0 |
| 35 to 50 years | 11 (6.9%) | 10.0 |
| Total | 159 (100.0%) | 66.0 |
Fertility by Age by Marriage Status in Boundary County
40.3% of women with births (159) in Boundary County are married. The highest percentage of unmarried women with births falls into 35 to 50 years age bracket with 63.6% of them unmarried at the time of birth, while the lowest percentage of unmarried women with births belong to 20 to 34 years age bracket with 59.5% of them unmarried.
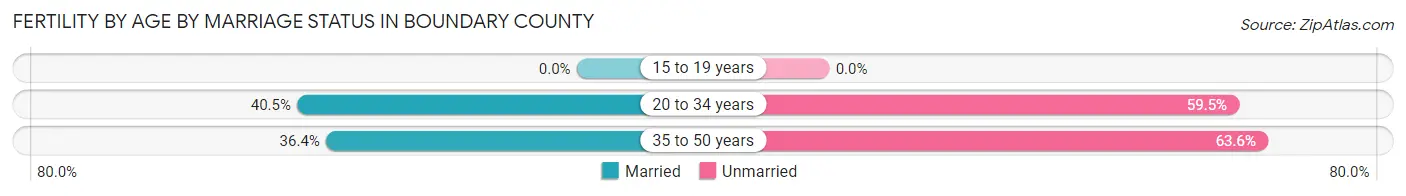
| Age Bracket | Married | Unmarried |
| 15 to 19 years | 0 (0.0%) | 0 (0.0%) |
| 20 to 34 years | 60 (40.5%) | 88 (59.5%) |
| 35 to 50 years | 4 (36.4%) | 7 (63.6%) |
| Total | 64 (40.3%) | 95 (59.8%) |
Fertility by Education in Boundary County
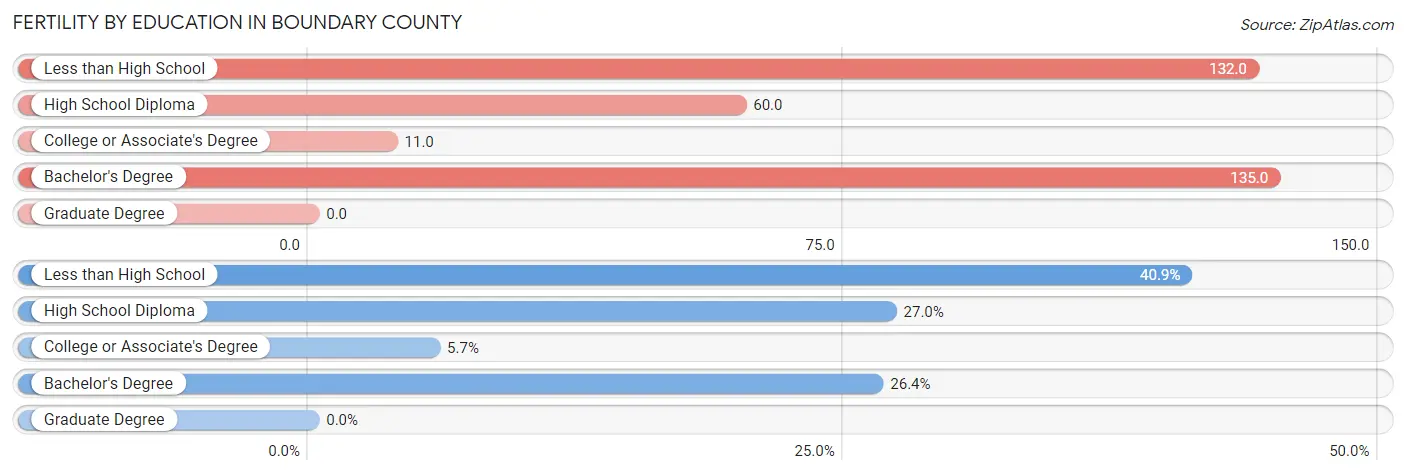
| Educational Attainment | Women with Births | Births / 1,000 Women |
| Less than High School | 65 (40.9%) | 132.0 |
| High School Diploma | 43 (27.0%) | 60.0 |
| College or Associate's Degree | 9 (5.7%) | 11.0 |
| Bachelor's Degree | 42 (26.4%) | 135.0 |
| Graduate Degree | 0 (0.0%) | 0.0 |
| Total | 159 (100.0%) | 66.0 |
Fertility by Education by Marriage Status in Boundary County
59.8% of women with births in Boundary County are unmarried. Women with the educational attainment of bachelor's degree are most likely to be married with 100.0% of them married at childbirth, while women with the educational attainment of less than high school are least likely to be married with 83.1% of them unmarried at childbirth.
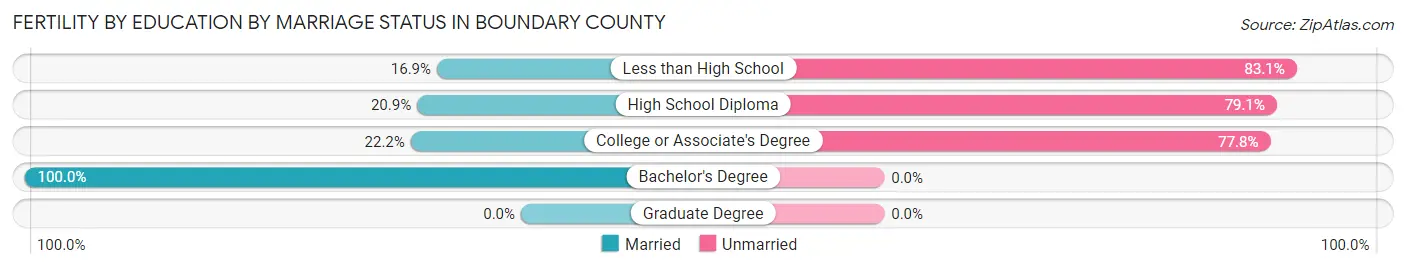
| Educational Attainment | Married | Unmarried |
| Less than High School | 11 (16.9%) | 54 (83.1%) |
| High School Diploma | 9 (20.9%) | 34 (79.1%) |
| College or Associate's Degree | 2 (22.2%) | 7 (77.8%) |
| Bachelor's Degree | 42 (100.0%) | 0 (0.0%) |
| Graduate Degree | 0 (0.0%) | 0 (0.0%) |
| Total | 64 (40.3%) | 95 (59.8%) |
Income in Boundary County
Income Overview in Boundary County
Per Capita Income in Boundary County is $27,287, while median incomes of families and households are $65,122 and $58,810 respectively.
| Characteristic | Number | Measure |
| Per Capita Income | 12,335 | $27,287 |
| Median Family Income | 3,266 | $65,122 |
| Mean Family Income | 3,266 | $77,331 |
| Median Household Income | 4,710 | $58,810 |
| Mean Household Income | 4,710 | $69,579 |
| Income Deficit | 3,266 | $0 |
| Wage / Income Gap (%) | 12,335 | 38.21% |
| Wage / Income Gap ($) | 12,335 | 61.79¢ per $1 |
| Gini / Inequality Index | 12,335 | 0.41 |
Earnings by Sex in Boundary County
Average Earnings in Boundary County are $33,468, $42,731 for men and $26,402 for women, a difference of 38.2%.
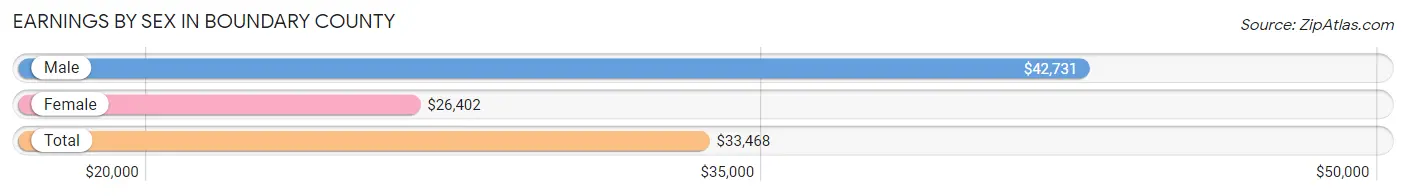
| Sex | Number | Average Earnings |
| Male | 3,316 (57.4%) | $42,731 |
| Female | 2,463 (42.6%) | $26,402 |
| Total | 5,779 (100.0%) | $33,468 |
Earnings by Sex by Income Bracket in Boundary County
The most common earnings brackets in Boundary County are $50,000 to $54,999 for men (416 | 12.6%) and $35,000 to $39,999 for women (292 | 11.9%).
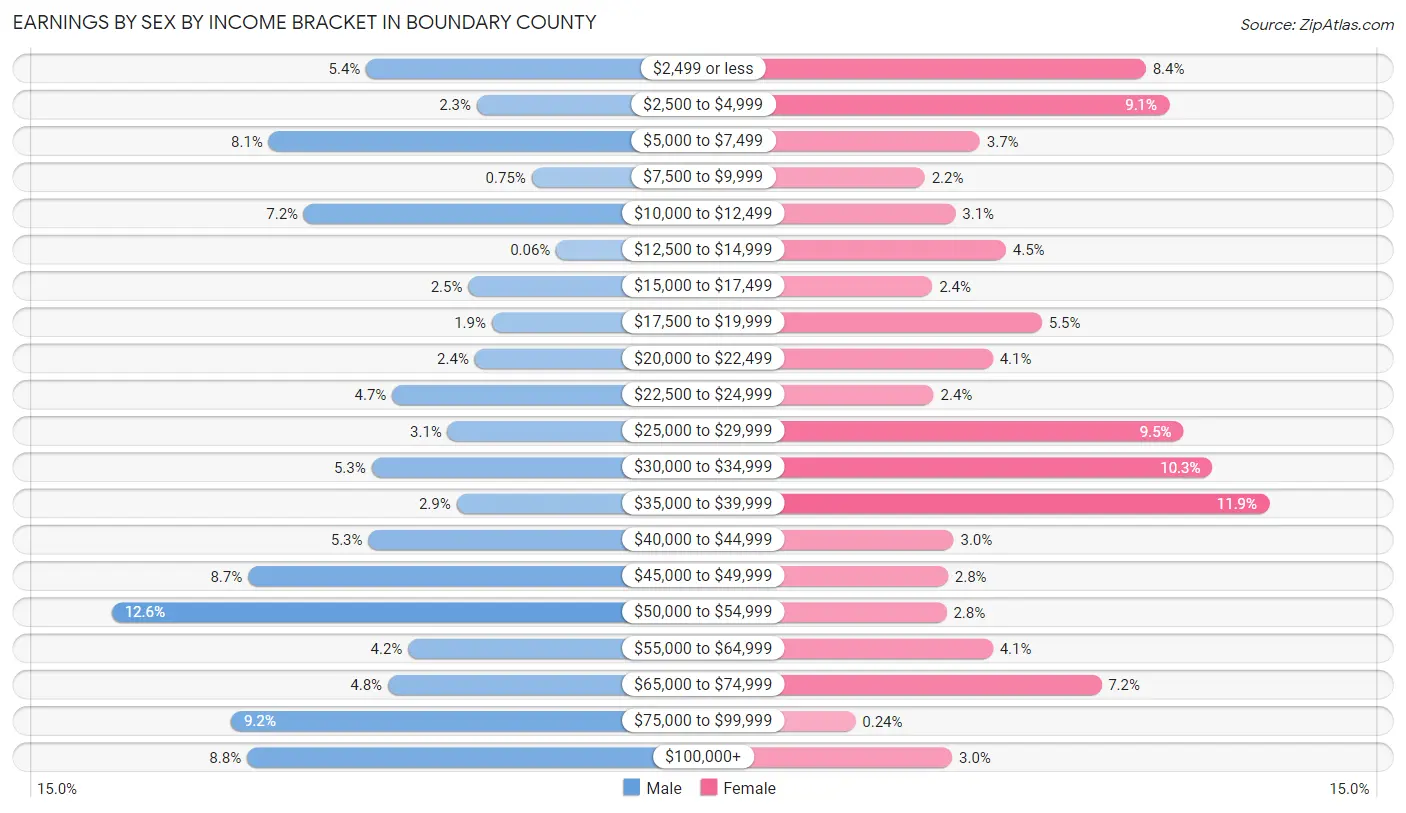
| Income | Male | Female |
| $2,499 or less | 179 (5.4%) | 207 (8.4%) |
| $2,500 to $4,999 | 76 (2.3%) | 223 (9.0%) |
| $5,000 to $7,499 | 270 (8.1%) | 92 (3.7%) |
| $7,500 to $9,999 | 25 (0.7%) | 54 (2.2%) |
| $10,000 to $12,499 | 237 (7.1%) | 75 (3.0%) |
| $12,500 to $14,999 | 2 (0.1%) | 110 (4.5%) |
| $15,000 to $17,499 | 84 (2.5%) | 59 (2.4%) |
| $17,500 to $19,999 | 62 (1.9%) | 135 (5.5%) |
| $20,000 to $22,499 | 78 (2.4%) | 101 (4.1%) |
| $22,500 to $24,999 | 155 (4.7%) | 60 (2.4%) |
| $25,000 to $29,999 | 103 (3.1%) | 233 (9.5%) |
| $30,000 to $34,999 | 174 (5.2%) | 253 (10.3%) |
| $35,000 to $39,999 | 95 (2.9%) | 292 (11.9%) |
| $40,000 to $44,999 | 177 (5.3%) | 74 (3.0%) |
| $45,000 to $49,999 | 289 (8.7%) | 70 (2.8%) |
| $50,000 to $54,999 | 416 (12.6%) | 69 (2.8%) |
| $55,000 to $64,999 | 140 (4.2%) | 101 (4.1%) |
| $65,000 to $74,999 | 159 (4.8%) | 176 (7.1%) |
| $75,000 to $99,999 | 305 (9.2%) | 6 (0.2%) |
| $100,000+ | 290 (8.7%) | 73 (3.0%) |
| Total | 3,316 (100.0%) | 2,463 (100.0%) |
Earnings by Sex by Educational Attainment in Boundary County
Average earnings in Boundary County are $48,738 for men and $30,160 for women, a difference of 38.1%. Men with an educational attainment of graduate degree enjoy the highest average annual earnings of $83,438, while those with college or associate's degree education earn the least with $46,103. Women with an educational attainment of graduate degree earn the most with the average annual earnings of $46,250, while those with less than high school education have the smallest earnings of $19,120.
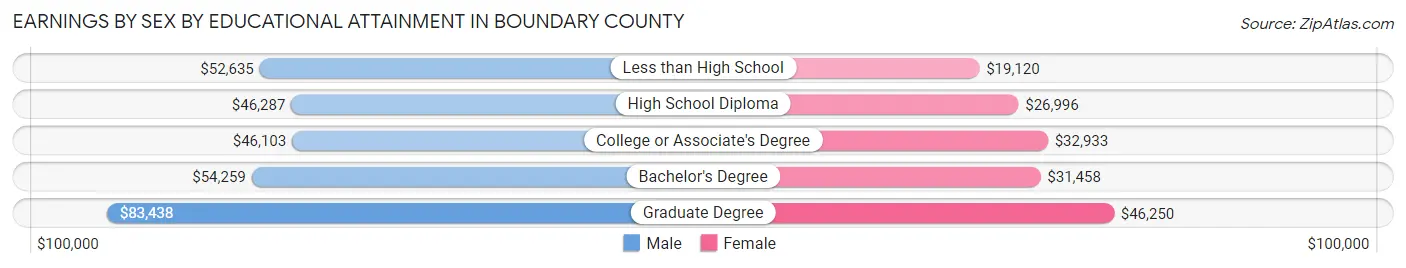
| Educational Attainment | Male Income | Female Income |
| Less than High School | $52,635 | $19,120 |
| High School Diploma | $46,287 | $26,996 |
| College or Associate's Degree | $46,103 | $32,933 |
| Bachelor's Degree | $54,259 | $31,458 |
| Graduate Degree | $83,438 | $46,250 |
| Total | $48,738 | $30,160 |
Family Income in Boundary County
Family Income Brackets in Boundary County
According to the Boundary County family income data, there are 768 families falling into the $50,000 to $74,999 income range, which is the most common income bracket and makes up 23.5% of all families. Conversely, the $25,000 to $34,999 income bracket is the least frequent group with only 140 families (4.3%) belonging to this category.
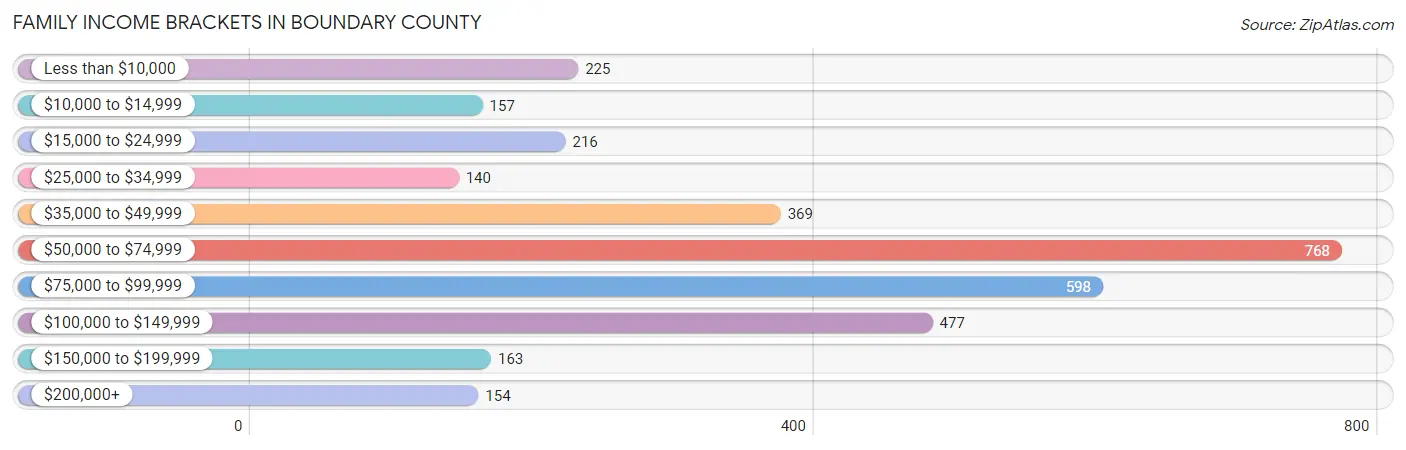
| Income Bracket | # Families | % Families |
| Less than $10,000 | 225 | 6.9% |
| $10,000 to $14,999 | 157 | 4.8% |
| $15,000 to $24,999 | 216 | 6.6% |
| $25,000 to $34,999 | 140 | 4.3% |
| $35,000 to $49,999 | 369 | 11.3% |
| $50,000 to $74,999 | 768 | 23.5% |
| $75,000 to $99,999 | 598 | 18.3% |
| $100,000 to $149,999 | 477 | 14.6% |
| $150,000 to $199,999 | 163 | 5.0% |
| $200,000+ | 154 | 4.7% |
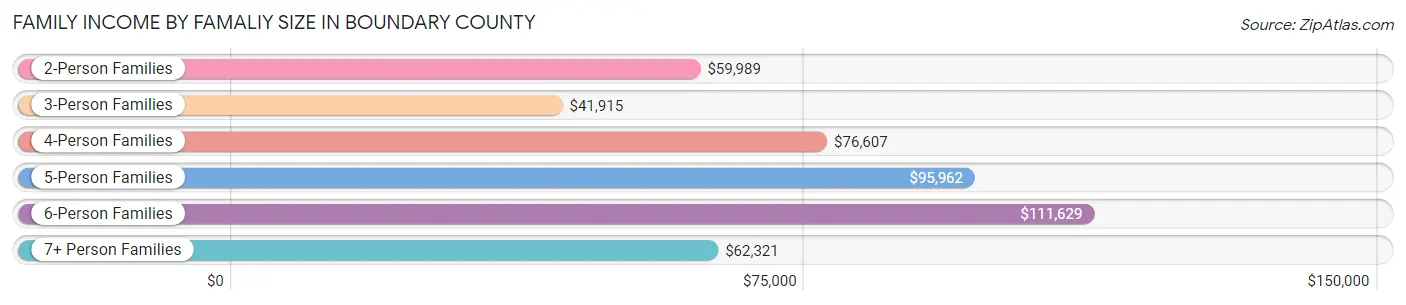
Family Income by Famaliy Size in Boundary County
6-person families (157 | 4.8%) account for the highest median family income in Boundary County with $111,629 per family, while 2-person families (1,815 | 55.6%) have the highest median income of $29,994 per family member.
| Income Bracket | # Families | Median Income |
| 2-Person Families | 1,815 (55.6%) | $59,989 |
| 3-Person Families | 528 (16.2%) | $41,915 |
| 4-Person Families | 512 (15.7%) | $76,607 |
| 5-Person Families | 158 (4.8%) | $95,962 |
| 6-Person Families | 157 (4.8%) | $111,629 |
| 7+ Person Families | 96 (2.9%) | $62,321 |
| Total | 3,266 (100.0%) | $65,122 |
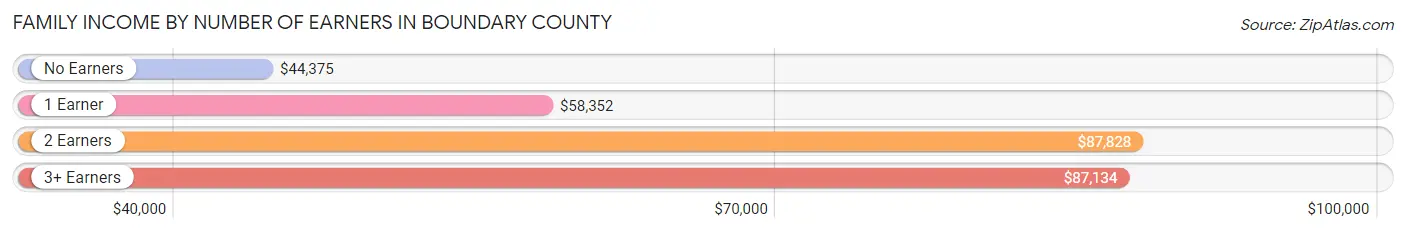
Family Income by Number of Earners in Boundary County
The median family income in Boundary County is $65,122, with families comprising 2 earners (1,171) having the highest median family income of $87,828, while families with no earners (676) have the lowest median family income of $44,375, accounting for 35.8% and 20.7% of families, respectively.
| Number of Earners | # Families | Median Income |
| No Earners | 676 (20.7%) | $44,375 |
| 1 Earner | 1,152 (35.3%) | $58,352 |
| 2 Earners | 1,171 (35.8%) | $87,828 |
| 3+ Earners | 267 (8.2%) | $87,134 |
| Total | 3,266 (100.0%) | $65,122 |
Household Income in Boundary County
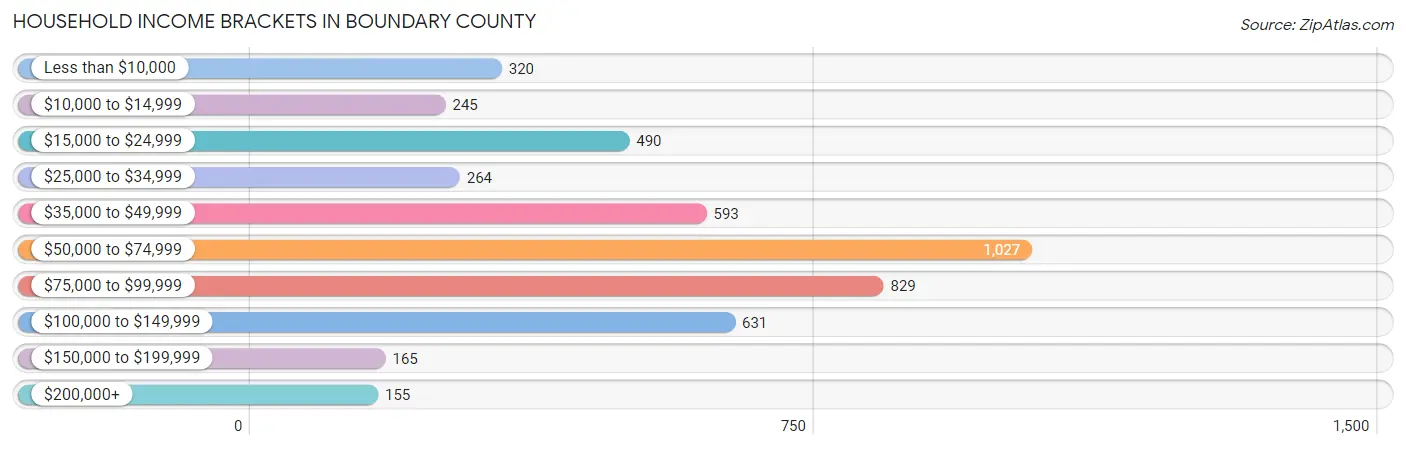
Household Income Brackets in Boundary County
With 1,027 households falling in the category, the $50,000 to $74,999 income range is the most frequent in Boundary County, accounting for 21.8% of all households. In contrast, only 155 households (3.3%) fall into the $200,000+ income bracket, making it the least populous group.
| Income Bracket | # Households | % Households |
| Less than $10,000 | 320 | 6.8% |
| $10,000 to $14,999 | 245 | 5.2% |
| $15,000 to $24,999 | 490 | 10.4% |
| $25,000 to $34,999 | 264 | 5.6% |
| $35,000 to $49,999 | 593 | 12.6% |
| $50,000 to $74,999 | 1,027 | 21.8% |
| $75,000 to $99,999 | 829 | 17.6% |
| $100,000 to $149,999 | 631 | 13.4% |
| $150,000 to $199,999 | 165 | 3.5% |
| $200,000+ | 155 | 3.3% |
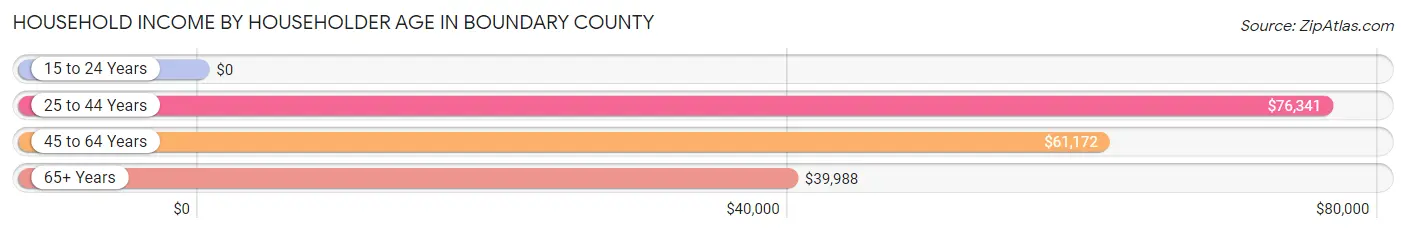
Household Income by Householder Age in Boundary County
The median household income in Boundary County is $58,810, with the highest median household income of $76,341 found in the 25 to 44 years age bracket for the primary householder. A total of 1,164 households (24.7%) fall into this category. Meanwhile, the 15 to 24 years age bracket for the primary householder has the lowest median household income of $0, with 130 households (2.8%) in this group.
| Income Bracket | # Households | Median Income |
| 15 to 24 Years | 130 (2.8%) | $0 |
| 25 to 44 Years | 1,164 (24.7%) | $76,341 |
| 45 to 64 Years | 1,611 (34.2%) | $61,172 |
| 65+ Years | 1,805 (38.3%) | $39,988 |
| Total | 4,710 (100.0%) | $58,810 |
Poverty in Boundary County
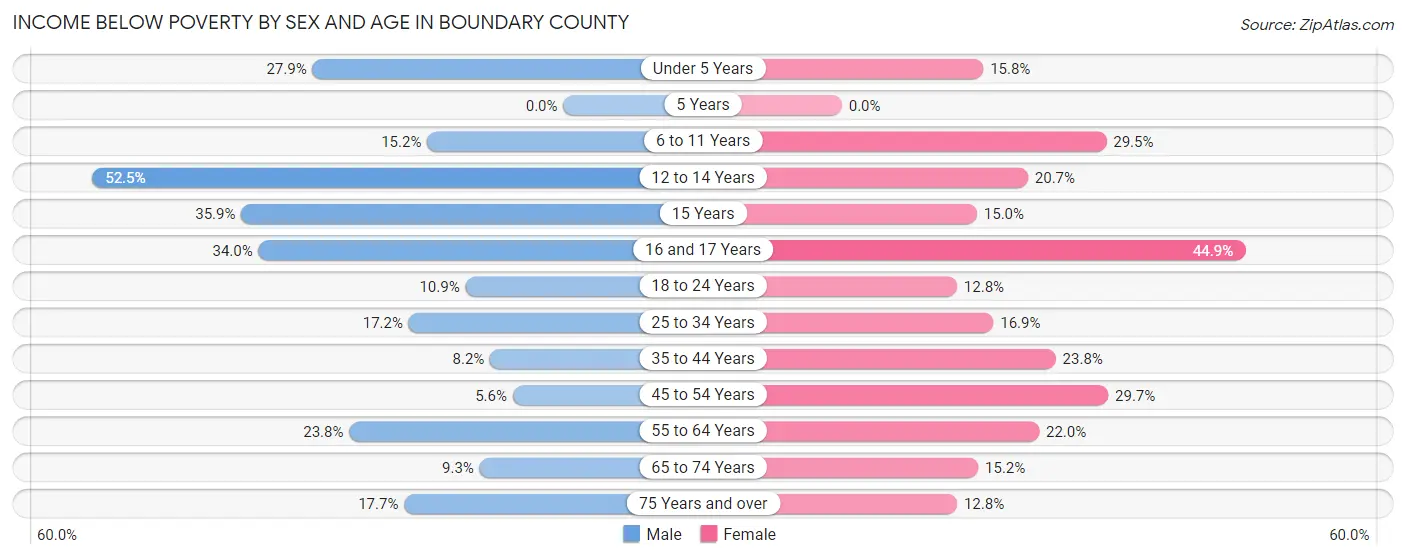
Income Below Poverty by Sex and Age in Boundary County
With 16.3% poverty level for males and 20.7% for females among the residents of Boundary County, 12 to 14 year old males and 16 and 17 year old females are the most vulnerable to poverty, with 96 males (52.5%) and 66 females (44.9%) in their respective age groups living below the poverty level.
| Age Bracket | Male | Female |
| Under 5 Years | 114 (27.9%) | 63 (15.8%) |
| 5 Years | 0 (0.0%) | 0 (0.0%) |
| 6 to 11 Years | 79 (15.2%) | 170 (29.5%) |
| 12 to 14 Years | 96 (52.5%) | 23 (20.7%) |
| 15 Years | 33 (35.9%) | 17 (15.0%) |
| 16 and 17 Years | 55 (34.0%) | 66 (44.9%) |
| 18 to 24 Years | 58 (10.9%) | 45 (12.8%) |
| 25 to 34 Years | 95 (17.2%) | 109 (16.9%) |
| 35 to 44 Years | 53 (8.2%) | 151 (23.8%) |
| 45 to 54 Years | 38 (5.6%) | 210 (29.7%) |
| 55 to 64 Years | 206 (23.8%) | 192 (22.0%) |
| 65 to 74 Years | 87 (9.3%) | 134 (15.2%) |
| 75 Years and over | 81 (17.7%) | 72 (12.8%) |
| Total | 995 (16.3%) | 1,252 (20.7%) |
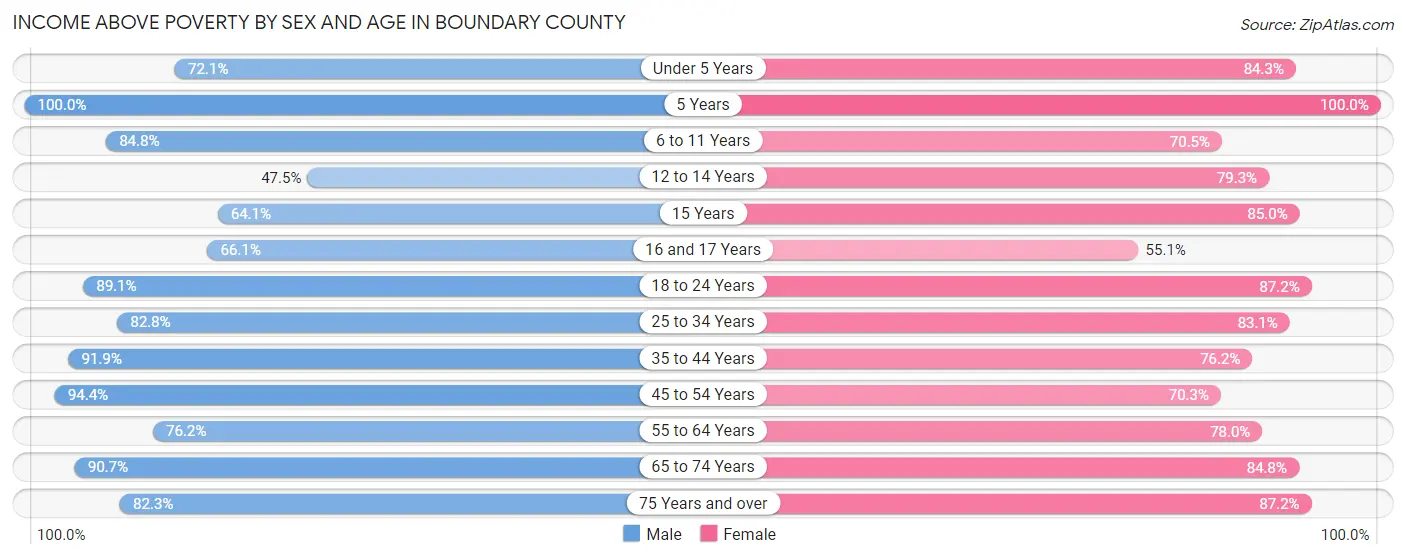
Income Above Poverty by Sex and Age in Boundary County
According to the poverty statistics in Boundary County, males aged 5 years and females aged 5 years are the age groups that are most secure financially, with 100.0% of males and 100.0% of females in these age groups living above the poverty line.
| Age Bracket | Male | Female |
| Under 5 Years | 294 (72.1%) | 337 (84.3%) |
| 5 Years | 79 (100.0%) | 37 (100.0%) |
| 6 to 11 Years | 442 (84.8%) | 407 (70.5%) |
| 12 to 14 Years | 87 (47.5%) | 88 (79.3%) |
| 15 Years | 59 (64.1%) | 96 (85.0%) |
| 16 and 17 Years | 107 (66.0%) | 81 (55.1%) |
| 18 to 24 Years | 474 (89.1%) | 306 (87.2%) |
| 25 to 34 Years | 457 (82.8%) | 537 (83.1%) |
| 35 to 44 Years | 597 (91.8%) | 483 (76.2%) |
| 45 to 54 Years | 637 (94.4%) | 498 (70.3%) |
| 55 to 64 Years | 658 (76.2%) | 682 (78.0%) |
| 65 to 74 Years | 846 (90.7%) | 749 (84.8%) |
| 75 Years and over | 376 (82.3%) | 489 (87.2%) |
| Total | 5,113 (83.7%) | 4,790 (79.3%) |
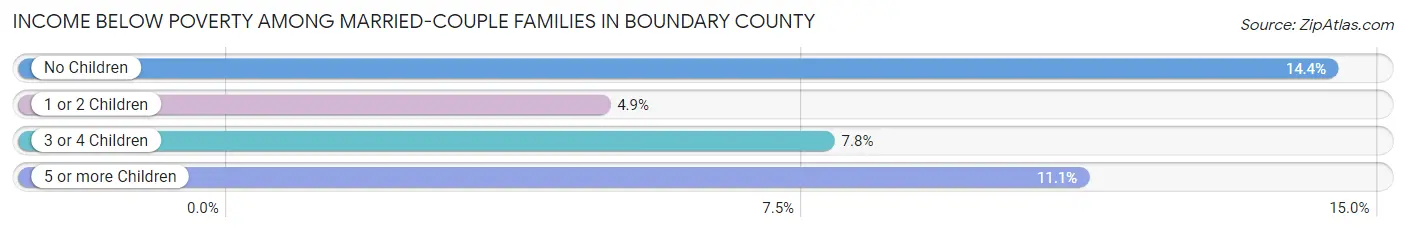
Income Below Poverty Among Married-Couple Families in Boundary County
The poverty statistics for married-couple families in Boundary County show that 11.7% or 309 of the total 2,650 families live below the poverty line. Families with no children have the highest poverty rate of 14.4%, comprising of 254 families. On the other hand, families with 1 or 2 children have the lowest poverty rate of 4.9%, which includes 27 families.
| Children | Above Poverty | Below Poverty |
| No Children | 1,515 (85.6%) | 254 (14.4%) |
| 1 or 2 Children | 529 (95.1%) | 27 (4.9%) |
| 3 or 4 Children | 225 (92.2%) | 19 (7.8%) |
| 5 or more Children | 72 (88.9%) | 9 (11.1%) |
| Total | 2,341 (88.3%) | 309 (11.7%) |
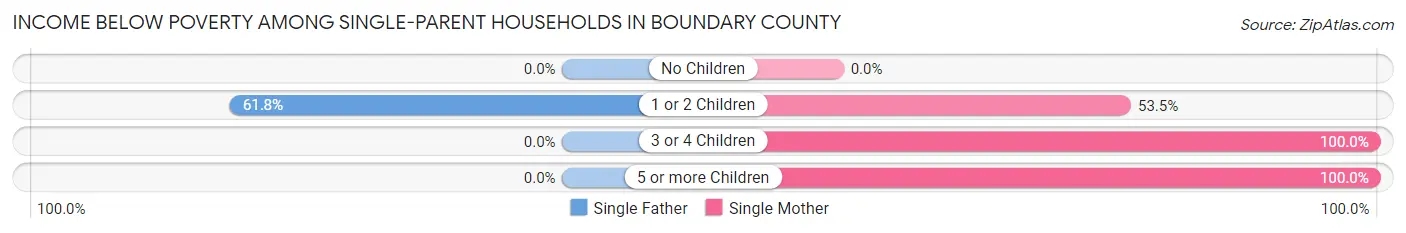
Income Below Poverty Among Single-Parent Households in Boundary County
According to the poverty data in Boundary County, 25.9% or 84 single-father households and 53.8% or 157 single-mother households are living below the poverty line. Among single-father households, those with 1 or 2 children have the highest poverty rate, with 84 households (61.8%) experiencing poverty. Likewise, among single-mother households, those with 3 or 4 children have the highest poverty rate, with 64 households (100.0%) falling below the poverty line.
| Children | Single Father | Single Mother |
| No Children | 0 (0.0%) | 0 (0.0%) |
| 1 or 2 Children | 84 (61.8%) | 91 (53.5%) |
| 3 or 4 Children | 0 (0.0%) | 64 (100.0%) |
| 5 or more Children | 0 (0.0%) | 2 (100.0%) |
| Total | 84 (25.9%) | 157 (53.8%) |
Income Below Poverty Among Married-Couple vs Single-Parent Households in Boundary County
The poverty data for Boundary County shows that 309 of the married-couple family households (11.7%) and 241 of the single-parent households (39.1%) are living below the poverty level. Within the married-couple family households, those with no children have the highest poverty rate, with 254 households (14.4%) falling below the poverty line. Among the single-parent households, those with 3 or 4 children have the highest poverty rate, with 64 household (100.0%) living below poverty.
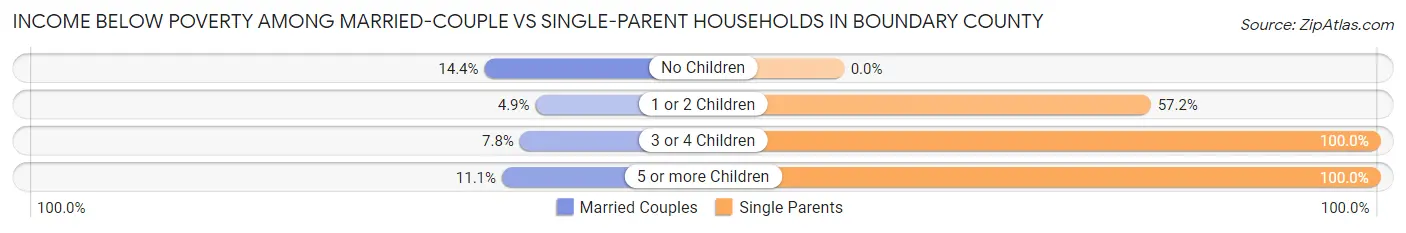
| Children | Married-Couple Families | Single-Parent Households |
| No Children | 254 (14.4%) | 0 (0.0%) |
| 1 or 2 Children | 27 (4.9%) | 175 (57.2%) |
| 3 or 4 Children | 19 (7.8%) | 64 (100.0%) |
| 5 or more Children | 9 (11.1%) | 2 (100.0%) |
| Total | 309 (11.7%) | 241 (39.1%) |
Employment Characteristics in Boundary County
Employment by Class of Employer in Boundary County
Among the 4,743 employed individuals in Boundary County, private company employees (2,969 | 62.6%), self-employed (not incorporated) (604 | 12.7%), and local government employees (349 | 7.4%) make up the most common classes of employment.
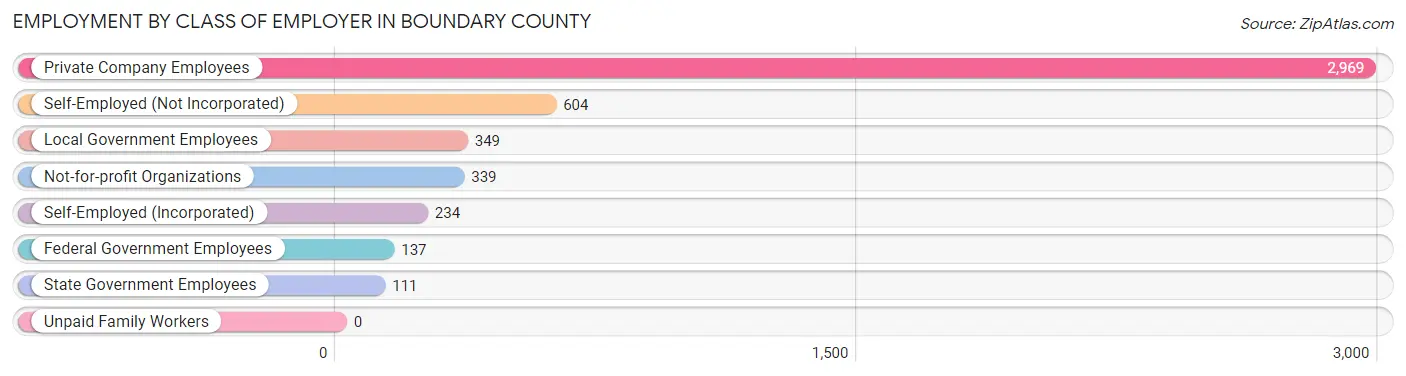
| Employer Class | # Employees | % Employees |
| Private Company Employees | 2,969 | 62.6% |
| Self-Employed (Incorporated) | 234 | 4.9% |
| Self-Employed (Not Incorporated) | 604 | 12.7% |
| Not-for-profit Organizations | 339 | 7.1% |
| Local Government Employees | 349 | 7.4% |
| State Government Employees | 111 | 2.3% |
| Federal Government Employees | 137 | 2.9% |
| Unpaid Family Workers | 0 | 0.0% |
| Total | 4,743 | 100.0% |
Employment Status by Age in Boundary County
According to the labor force statistics for Boundary County, out of the total population over 16 years of age (9,789), 51.1% or 5,002 individuals are in the labor force, with 3.8% or 190 of them unemployed. The age group with the highest labor force participation rate is 45 to 54 years, with 75.6% or 1,061 individuals in the labor force. Within the labor force, the 20 to 24 years age range has the highest percentage of unemployed individuals, with 27.3% or 111 of them being unemployed.
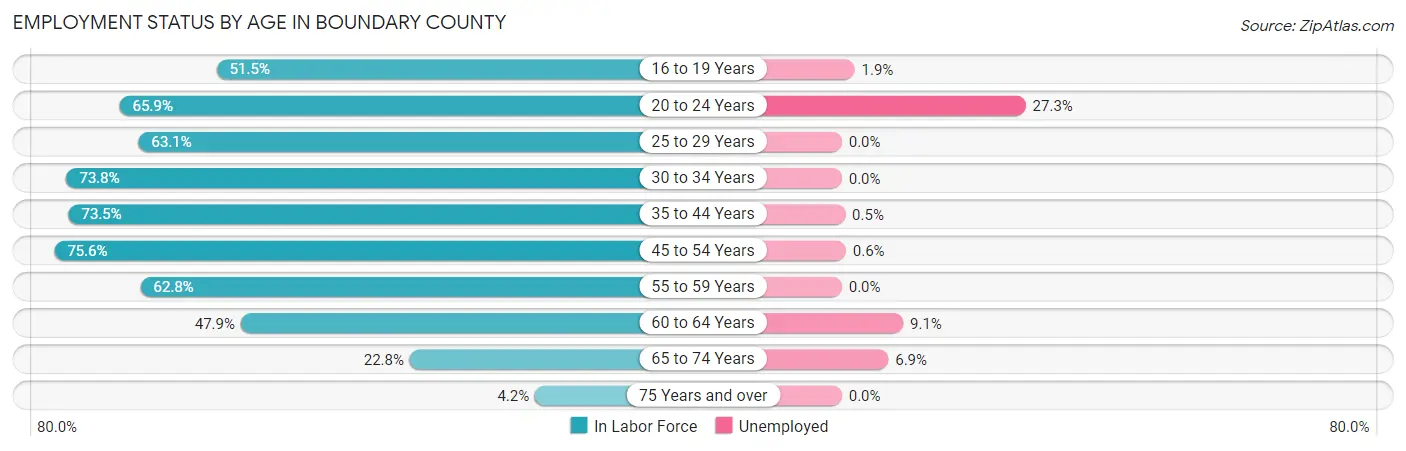
| Age Bracket | In Labor Force | Unemployed |
| 16 to 19 Years | 315 (51.5%) | 6 (1.9%) |
| 20 to 24 Years | 406 (65.9%) | 111 (27.3%) |
| 25 to 29 Years | 435 (63.1%) | 0 (0.0%) |
| 30 to 34 Years | 392 (73.8%) | 0 (0.0%) |
| 35 to 44 Years | 950 (73.5%) | 5 (0.5%) |
| 45 to 54 Years | 1,061 (75.6%) | 6 (0.6%) |
| 55 to 59 Years | 602 (62.8%) | 0 (0.0%) |
| 60 to 64 Years | 374 (47.9%) | 34 (9.1%) |
| 65 to 74 Years | 422 (22.8%) | 29 (6.9%) |
| 75 Years and over | 44 (4.2%) | 0 (0.0%) |
| Total | 5,002 (51.1%) | 190 (3.8%) |
Employment Status by Educational Attainment in Boundary County
According to labor force statistics for Boundary County, 67.4% of individuals (3,811) out of the total population between 25 and 64 years of age (5,655) are in the labor force, with 1.2% or 46 of them being unemployed. The group with the highest labor force participation rate are those with the educational attainment of bachelor's degree or higher, with 73.5% or 654 individuals in the labor force. Within the labor force, individuals with college / associate degree education have the highest percentage of unemployment, with 2.9% or 34 of them being unemployed.
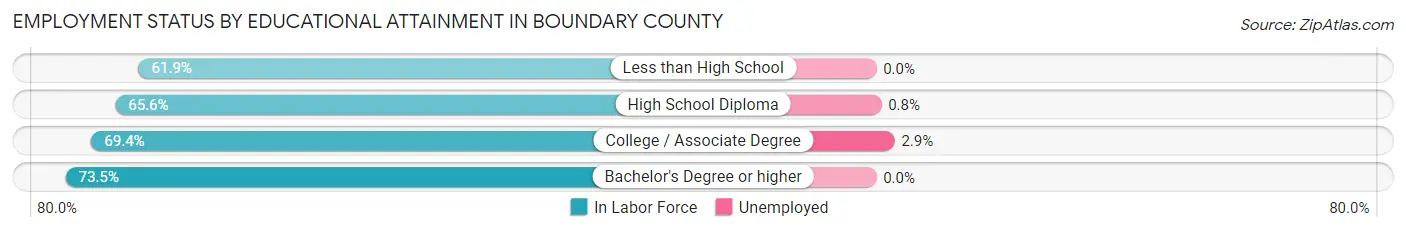
| Educational Attainment | In Labor Force | Unemployed |
| Less than High School | 511 (61.9%) | 0 (0.0%) |
| High School Diploma | 1,466 (65.6%) | 18 (0.8%) |
| College / Associate Degree | 1,184 (69.4%) | 49 (2.9%) |
| Bachelor's Degree or higher | 654 (73.5%) | 0 (0.0%) |
| Total | 3,811 (67.4%) | 68 (1.2%) |
Employment Occupations by Sex in Boundary County
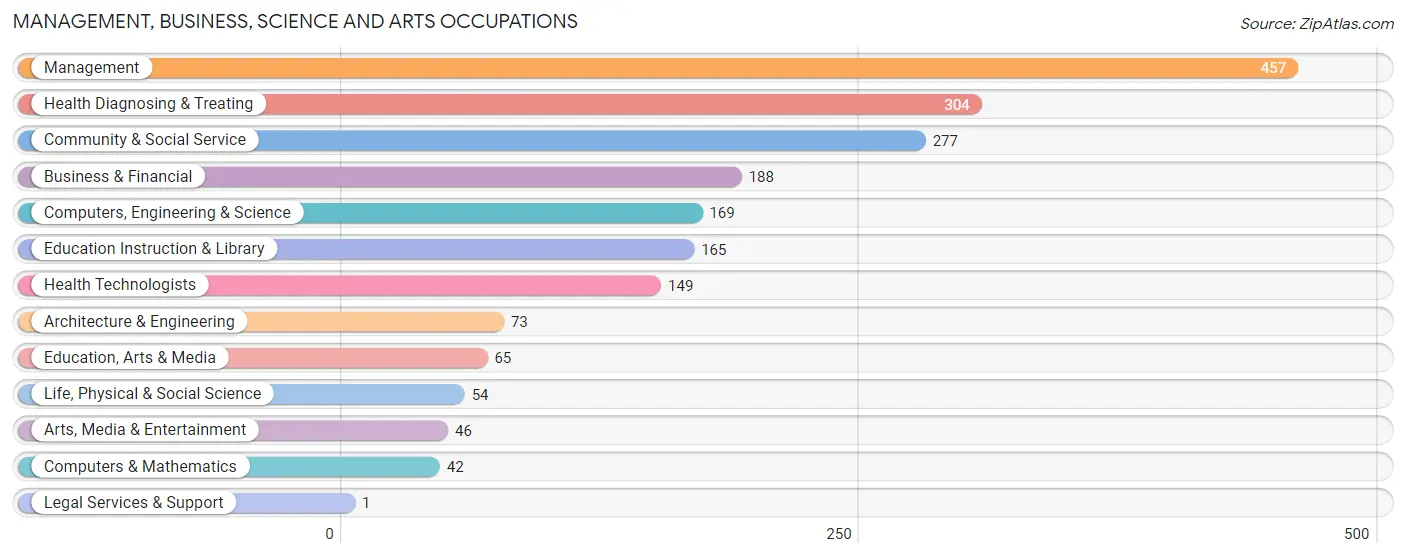
Management, Business, Science and Arts Occupations
The most common Management, Business, Science and Arts occupations in Boundary County are Management (457 | 9.5%), Health Diagnosing & Treating (304 | 6.3%), Community & Social Service (277 | 5.8%), Business & Financial (188 | 3.9%), and Computers, Engineering & Science (169 | 3.5%).
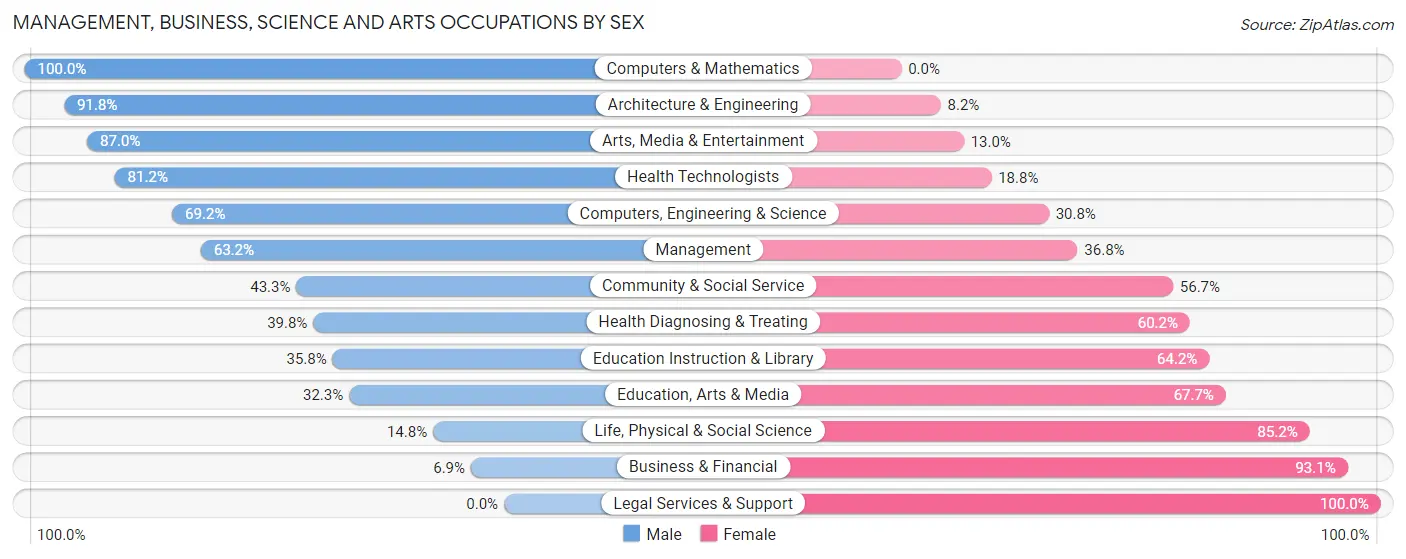
Management, Business, Science and Arts Occupations by Sex
Within the Management, Business, Science and Arts occupations in Boundary County, the most male-oriented occupations are Computers & Mathematics (100.0%), Architecture & Engineering (91.8%), and Arts, Media & Entertainment (87.0%), while the most female-oriented occupations are Legal Services & Support (100.0%), Business & Financial (93.1%), and Life, Physical & Social Science (85.2%).
| Occupation | Male | Female |
| Management | 289 (63.2%) | 168 (36.8%) |
| Business & Financial | 13 (6.9%) | 175 (93.1%) |
| Computers, Engineering & Science | 117 (69.2%) | 52 (30.8%) |
| Computers & Mathematics | 42 (100.0%) | 0 (0.0%) |
| Architecture & Engineering | 67 (91.8%) | 6 (8.2%) |
| Life, Physical & Social Science | 8 (14.8%) | 46 (85.2%) |
| Community & Social Service | 120 (43.3%) | 157 (56.7%) |
| Education, Arts & Media | 21 (32.3%) | 44 (67.7%) |
| Legal Services & Support | 0 (0.0%) | 1 (100.0%) |
| Education Instruction & Library | 59 (35.8%) | 106 (64.2%) |
| Arts, Media & Entertainment | 40 (87.0%) | 6 (13.0%) |
| Health Diagnosing & Treating | 121 (39.8%) | 183 (60.2%) |
| Health Technologists | 121 (81.2%) | 28 (18.8%) |
| Total (Category) | 660 (47.3%) | 735 (52.7%) |
| Total (Overall) | 2,837 (59.0%) | 1,973 (41.0%) |
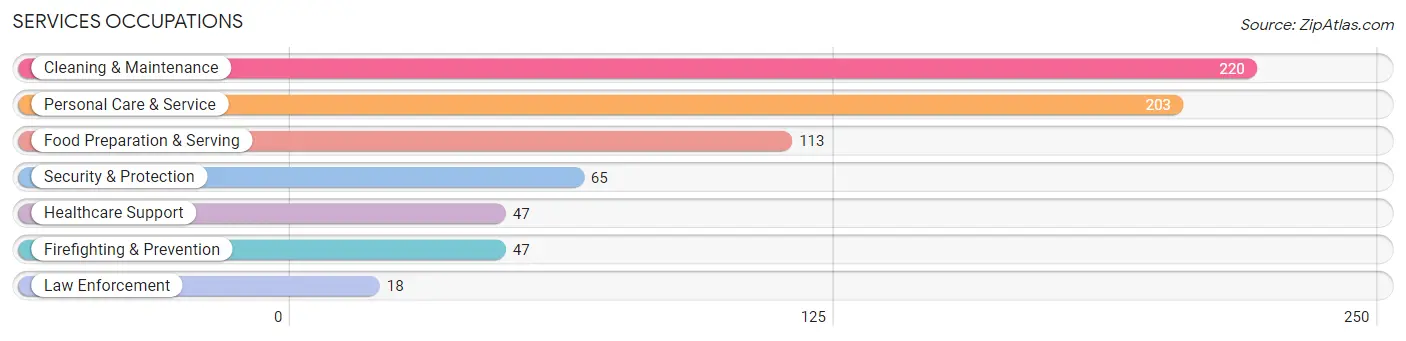
Services Occupations
The most common Services occupations in Boundary County are Cleaning & Maintenance (220 | 4.6%), Personal Care & Service (203 | 4.2%), Food Preparation & Serving (113 | 2.4%), Security & Protection (65 | 1.3%), and Healthcare Support (47 | 1.0%).
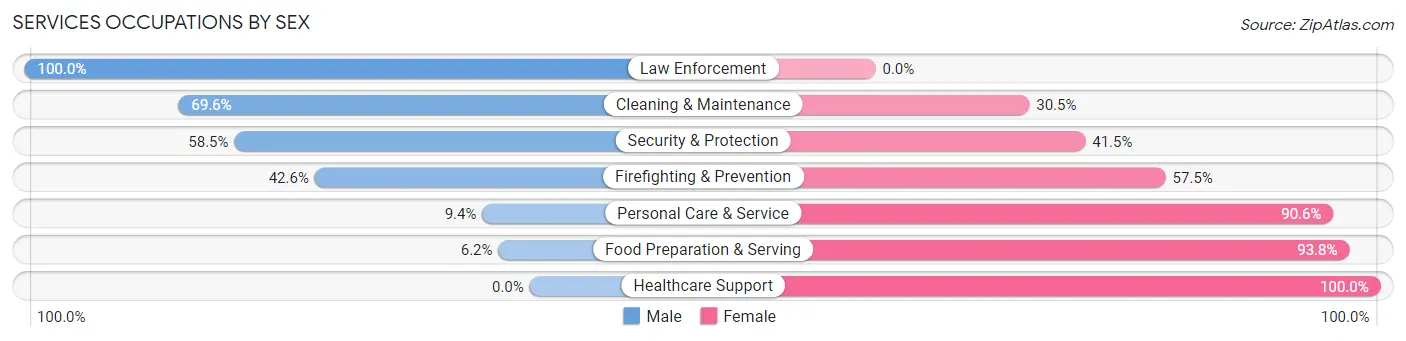
Services Occupations by Sex
Within the Services occupations in Boundary County, the most male-oriented occupations are Law Enforcement (100.0%), Cleaning & Maintenance (69.6%), and Security & Protection (58.5%), while the most female-oriented occupations are Healthcare Support (100.0%), Food Preparation & Serving (93.8%), and Personal Care & Service (90.6%).
| Occupation | Male | Female |
| Healthcare Support | 0 (0.0%) | 47 (100.0%) |
| Security & Protection | 38 (58.5%) | 27 (41.5%) |
| Firefighting & Prevention | 20 (42.5%) | 27 (57.5%) |
| Law Enforcement | 18 (100.0%) | 0 (0.0%) |
| Food Preparation & Serving | 7 (6.2%) | 106 (93.8%) |
| Cleaning & Maintenance | 153 (69.6%) | 67 (30.4%) |
| Personal Care & Service | 19 (9.4%) | 184 (90.6%) |
| Total (Category) | 217 (33.5%) | 431 (66.5%) |
| Total (Overall) | 2,837 (59.0%) | 1,973 (41.0%) |
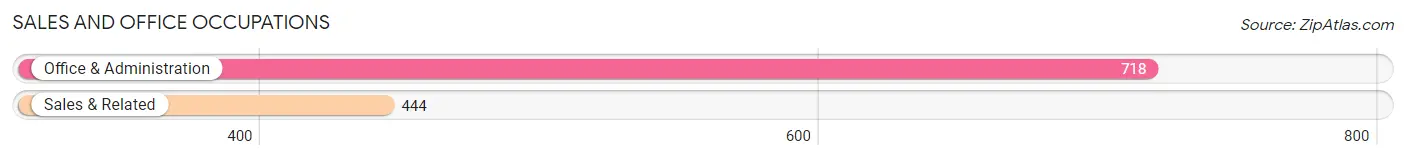
Sales and Office Occupations
The most common Sales and Office occupations in Boundary County are Office & Administration (718 | 14.9%), and Sales & Related (444 | 9.2%).
Sales and Office Occupations by Sex
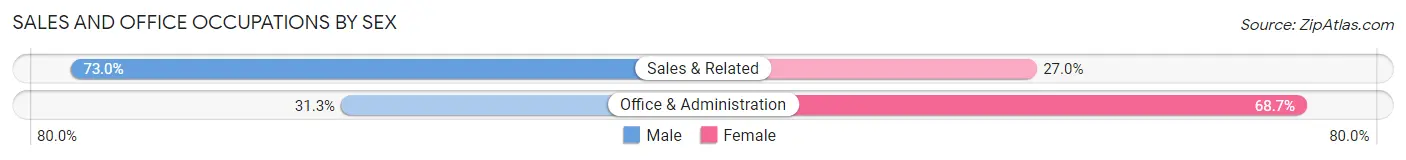
| Occupation | Male | Female |
| Sales & Related | 324 (73.0%) | 120 (27.0%) |
| Office & Administration | 225 (31.3%) | 493 (68.7%) |
| Total (Category) | 549 (47.2%) | 613 (52.7%) |
| Total (Overall) | 2,837 (59.0%) | 1,973 (41.0%) |
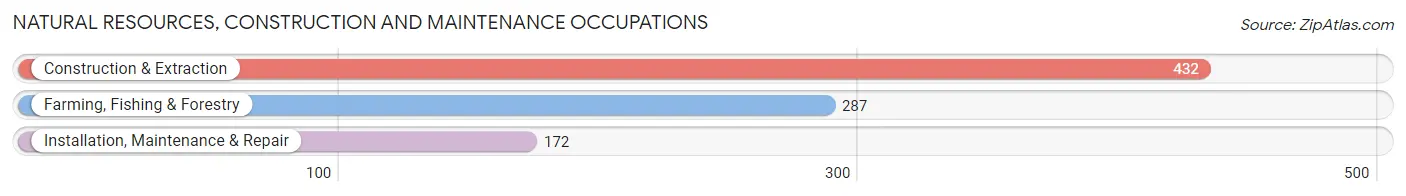
Natural Resources, Construction and Maintenance Occupations
The most common Natural Resources, Construction and Maintenance occupations in Boundary County are Construction & Extraction (432 | 9.0%), Farming, Fishing & Forestry (287 | 6.0%), and Installation, Maintenance & Repair (172 | 3.6%).
Natural Resources, Construction and Maintenance Occupations by Sex
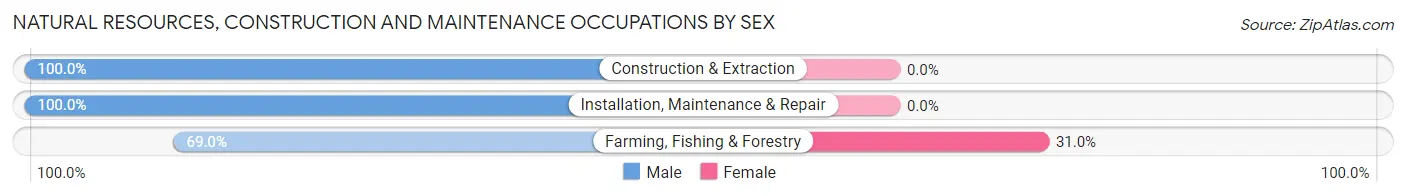
| Occupation | Male | Female |
| Farming, Fishing & Forestry | 198 (69.0%) | 89 (31.0%) |
| Construction & Extraction | 432 (100.0%) | 0 (0.0%) |
| Installation, Maintenance & Repair | 172 (100.0%) | 0 (0.0%) |
| Total (Category) | 802 (90.0%) | 89 (10.0%) |
| Total (Overall) | 2,837 (59.0%) | 1,973 (41.0%) |
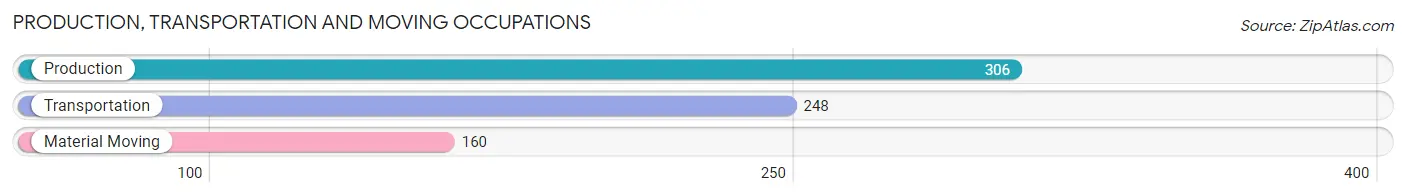
Production, Transportation and Moving Occupations
The most common Production, Transportation and Moving occupations in Boundary County are Production (306 | 6.4%), Transportation (248 | 5.2%), and Material Moving (160 | 3.3%).
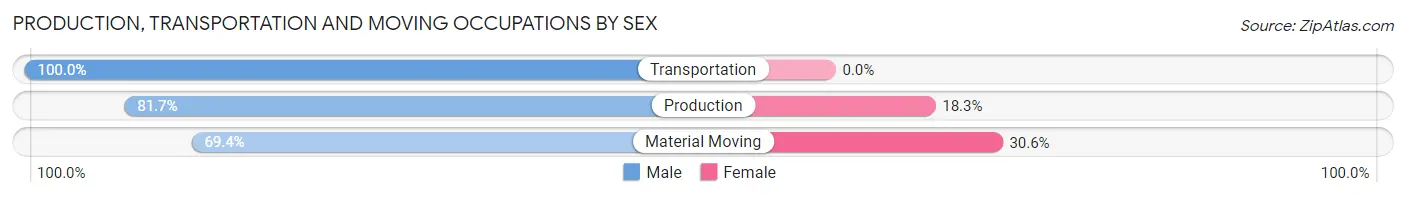
Production, Transportation and Moving Occupations by Sex
| Occupation | Male | Female |
| Production | 250 (81.7%) | 56 (18.3%) |
| Transportation | 248 (100.0%) | 0 (0.0%) |
| Material Moving | 111 (69.4%) | 49 (30.6%) |
| Total (Category) | 609 (85.3%) | 105 (14.7%) |
| Total (Overall) | 2,837 (59.0%) | 1,973 (41.0%) |
Employment Industries by Sex in Boundary County
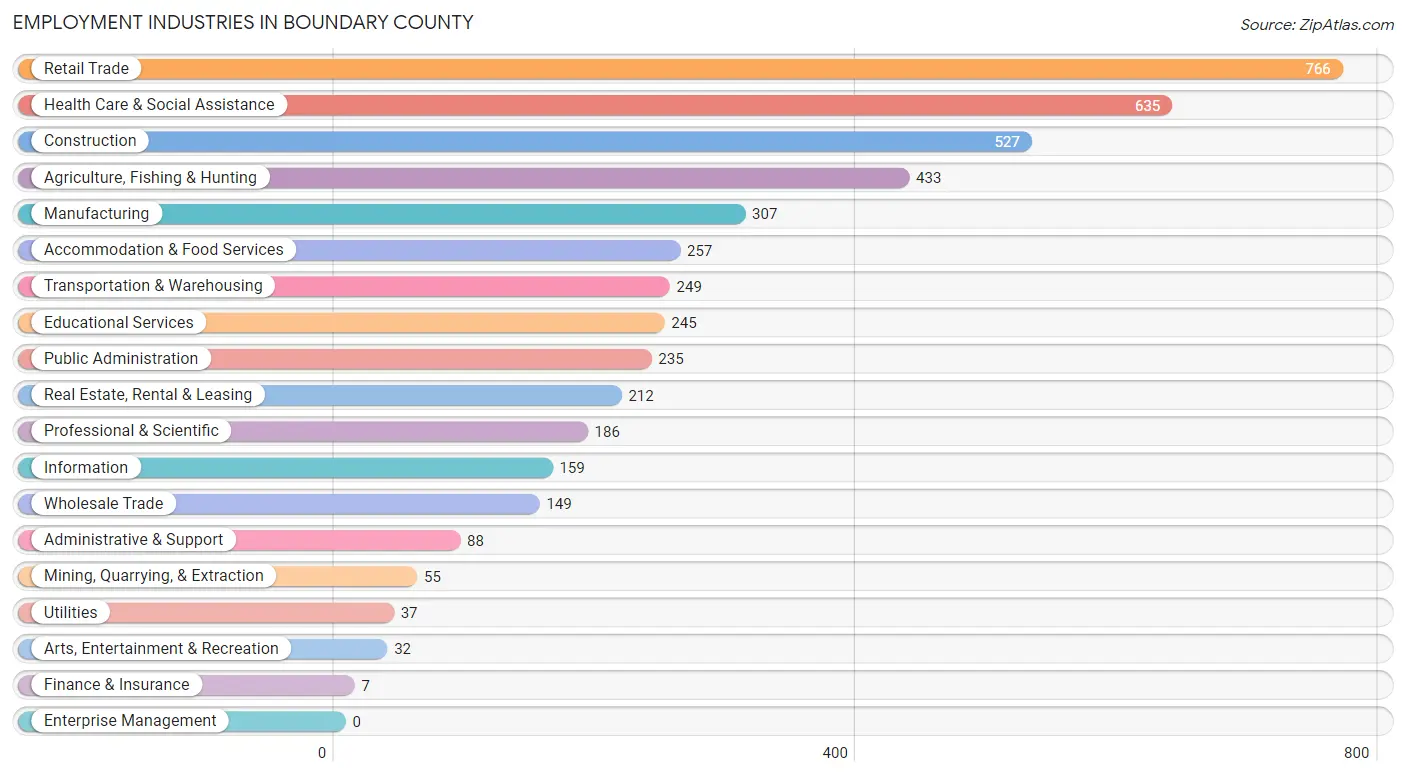
Employment Industries in Boundary County
The major employment industries in Boundary County include Retail Trade (766 | 15.9%), Health Care & Social Assistance (635 | 13.2%), Construction (527 | 11.0%), Agriculture, Fishing & Hunting (433 | 9.0%), and Manufacturing (307 | 6.4%).
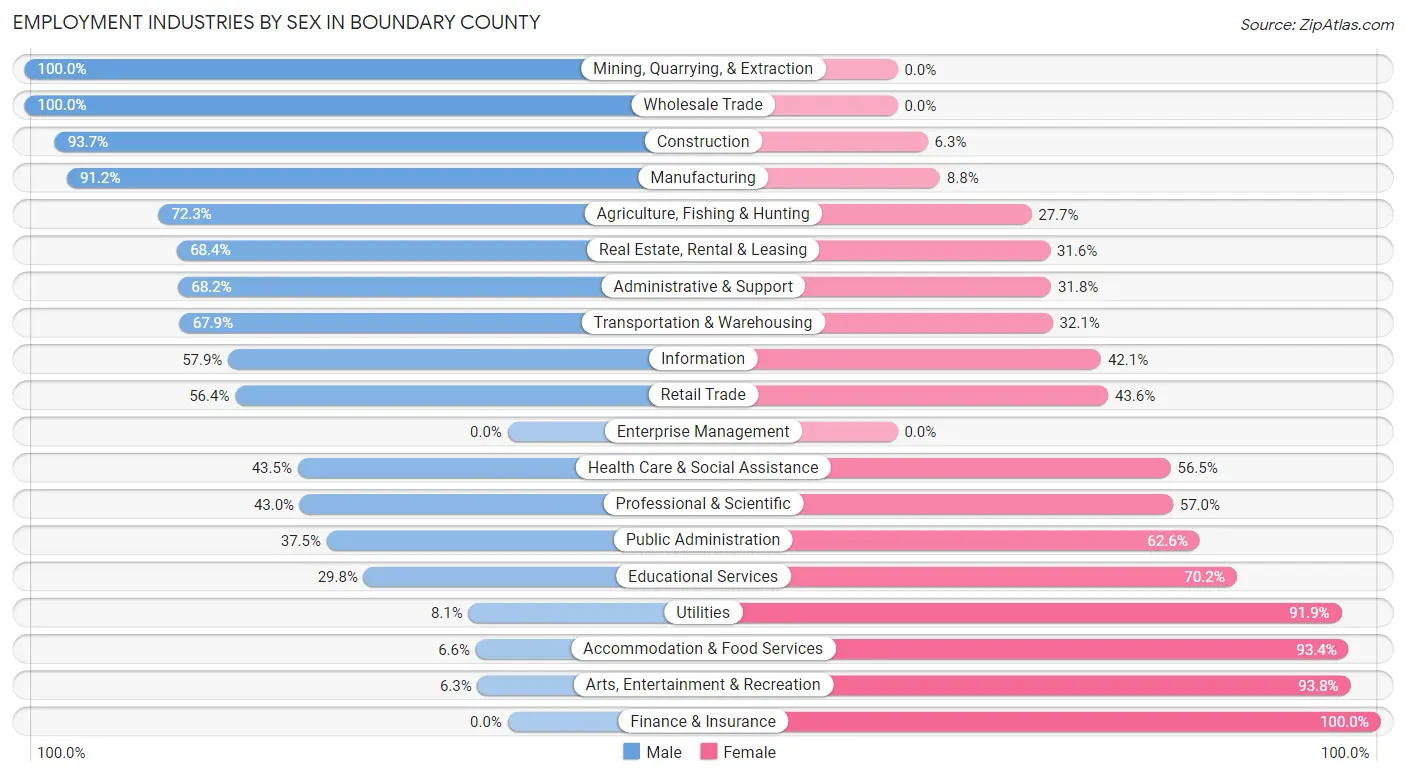
Employment Industries by Sex in Boundary County
The Boundary County industries that see more men than women are Mining, Quarrying, & Extraction (100.0%), Wholesale Trade (100.0%), and Construction (93.7%), whereas the industries that tend to have a higher number of women are Finance & Insurance (100.0%), Arts, Entertainment & Recreation (93.8%), and Accommodation & Food Services (93.4%).
| Industry | Male | Female |
| Agriculture, Fishing & Hunting | 313 (72.3%) | 120 (27.7%) |
| Mining, Quarrying, & Extraction | 55 (100.0%) | 0 (0.0%) |
| Construction | 494 (93.7%) | 33 (6.3%) |
| Manufacturing | 280 (91.2%) | 27 (8.8%) |
| Wholesale Trade | 149 (100.0%) | 0 (0.0%) |
| Retail Trade | 432 (56.4%) | 334 (43.6%) |
| Transportation & Warehousing | 169 (67.9%) | 80 (32.1%) |
| Utilities | 3 (8.1%) | 34 (91.9%) |
| Information | 92 (57.9%) | 67 (42.1%) |
| Finance & Insurance | 0 (0.0%) | 7 (100.0%) |
| Real Estate, Rental & Leasing | 145 (68.4%) | 67 (31.6%) |
| Professional & Scientific | 80 (43.0%) | 106 (57.0%) |
| Enterprise Management | 0 (0.0%) | 0 (0.0%) |
| Administrative & Support | 60 (68.2%) | 28 (31.8%) |
| Educational Services | 73 (29.8%) | 172 (70.2%) |
| Health Care & Social Assistance | 276 (43.5%) | 359 (56.5%) |
| Arts, Entertainment & Recreation | 2 (6.2%) | 30 (93.8%) |
| Accommodation & Food Services | 17 (6.6%) | 240 (93.4%) |
| Public Administration | 88 (37.4%) | 147 (62.5%) |
| Total | 2,837 (59.0%) | 1,973 (41.0%) |
Education in Boundary County
School Enrollment in Boundary County
The most common levels of schooling among the 2,421 students in Boundary County are elementary school (656 | 27.1%), high school (616 | 25.4%), and middle school (598 | 24.7%).
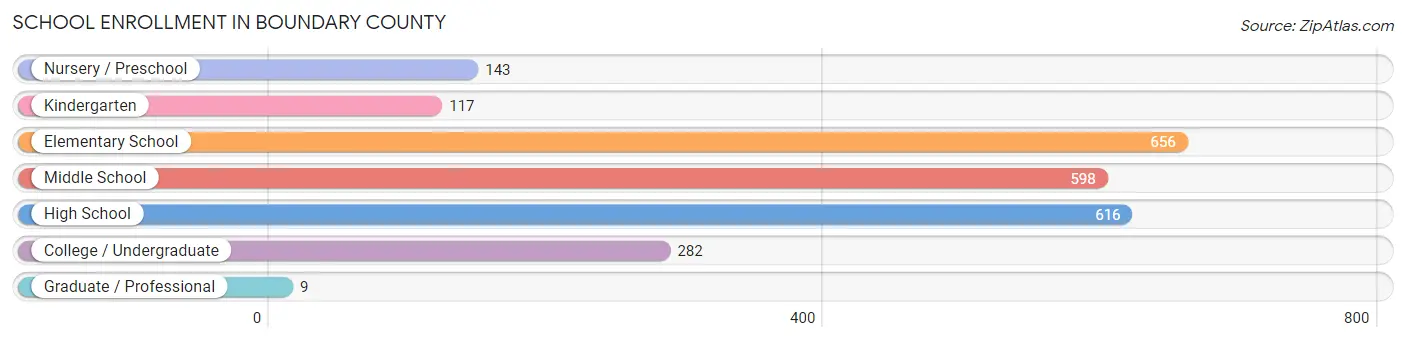
| School Level | # Students | % Students |
| Nursery / Preschool | 143 | 5.9% |
| Kindergarten | 117 | 4.8% |
| Elementary School | 656 | 27.1% |
| Middle School | 598 | 24.7% |
| High School | 616 | 25.4% |
| College / Undergraduate | 282 | 11.7% |
| Graduate / Professional | 9 | 0.4% |
| Total | 2,421 | 100.0% |
School Enrollment by Age by Funding Source in Boundary County
Out of a total of 2,421 students who are enrolled in schools in Boundary County, 683 (28.2%) attend a private institution, while the remaining 1,738 (71.8%) are enrolled in public schools. The age group of 20 to 24 year olds has the highest likelihood of being enrolled in private schools, with 161 (88.0% in the age bracket) enrolled. Conversely, the age group of 25 to 34 year olds has the lowest likelihood of being enrolled in a private school, with 41 (89.1% in the age bracket) attending a public institution.
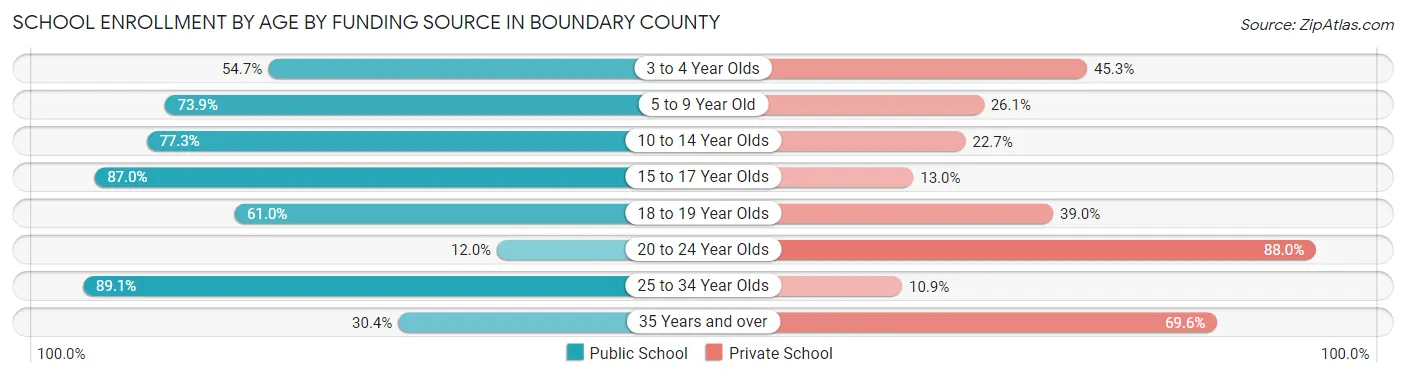
| Age Bracket | Public School | Private School |
| 3 to 4 Year Olds | 41 (54.7%) | 34 (45.3%) |
| 5 to 9 Year Old | 524 (73.9%) | 185 (26.1%) |
| 10 to 14 Year Olds | 606 (77.3%) | 178 (22.7%) |
| 15 to 17 Year Olds | 436 (87.0%) | 65 (13.0%) |
| 18 to 19 Year Olds | 61 (61.0%) | 39 (39.0%) |
| 20 to 24 Year Olds | 22 (12.0%) | 161 (88.0%) |
| 25 to 34 Year Olds | 41 (89.1%) | 5 (10.9%) |
| 35 Years and over | 7 (30.4%) | 16 (69.6%) |
| Total | 1,738 (71.8%) | 683 (28.2%) |
Educational Attainment by Field of Study in Boundary County
Education (315 | 19.3%), bio, nature & agricultural (250 | 15.3%), business (121 | 7.4%), social sciences (112 | 6.9%), and engineering (110 | 6.8%) are the most common fields of study among 1,630 individuals in Boundary County who have obtained a bachelor's degree or higher.
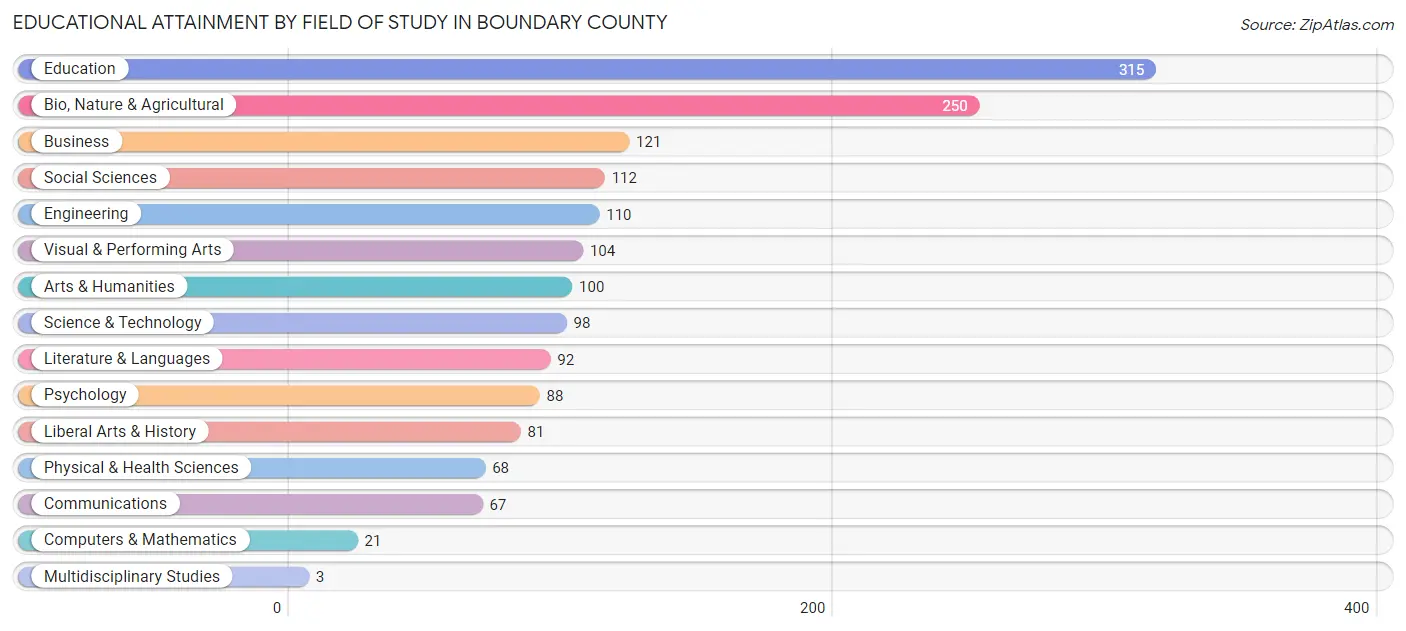
| Field of Study | # Graduates | % Graduates |
| Computers & Mathematics | 21 | 1.3% |
| Bio, Nature & Agricultural | 250 | 15.3% |
| Physical & Health Sciences | 68 | 4.2% |
| Psychology | 88 | 5.4% |
| Social Sciences | 112 | 6.9% |
| Engineering | 110 | 6.8% |
| Multidisciplinary Studies | 3 | 0.2% |
| Science & Technology | 98 | 6.0% |
| Business | 121 | 7.4% |
| Education | 315 | 19.3% |
| Literature & Languages | 92 | 5.6% |
| Liberal Arts & History | 81 | 5.0% |
| Visual & Performing Arts | 104 | 6.4% |
| Communications | 67 | 4.1% |
| Arts & Humanities | 100 | 6.1% |
| Total | 1,630 | 100.0% |
Transportation & Commute in Boundary County
Vehicle Availability by Sex in Boundary County
The most prevalent vehicle ownership categories in Boundary County are males with 2 vehicles (847, accounting for 30.4%) and females with 2 vehicles (619, making up 43.7%).
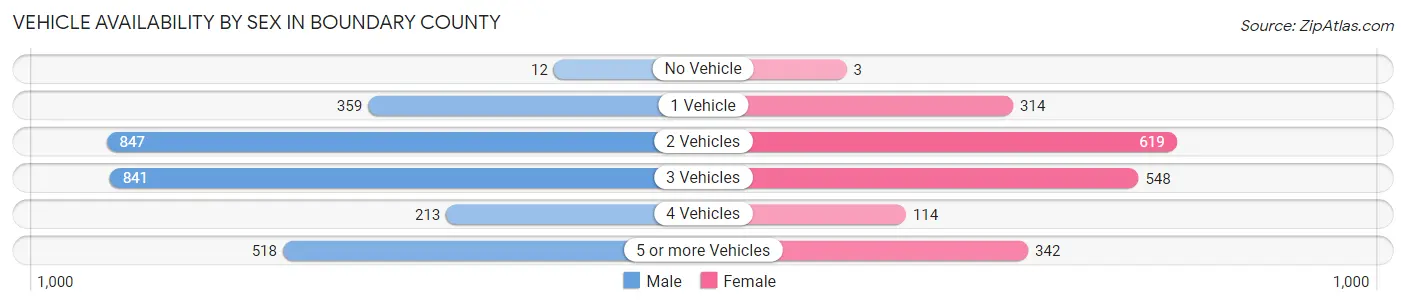
| Vehicles Available | Male | Female |
| No Vehicle | 12 (0.4%) | 3 (0.2%) |
| 1 Vehicle | 359 (12.9%) | 314 (16.2%) |
| 2 Vehicles | 847 (30.4%) | 619 (31.9%) |
| 3 Vehicles | 841 (30.1%) | 548 (28.2%) |
| 4 Vehicles | 213 (7.6%) | 114 (5.9%) |
| 5 or more Vehicles | 518 (18.6%) | 342 (17.6%) |
| Total | 2,790 (100.0%) | 1,940 (100.0%) |
Commute Time in Boundary County
The most frequently occuring commute durations in Boundary County are 15 to 19 minutes (862 commuters, 19.2%), 30 to 34 minutes (640 commuters, 14.2%), and 10 to 14 minutes (636 commuters, 14.1%).
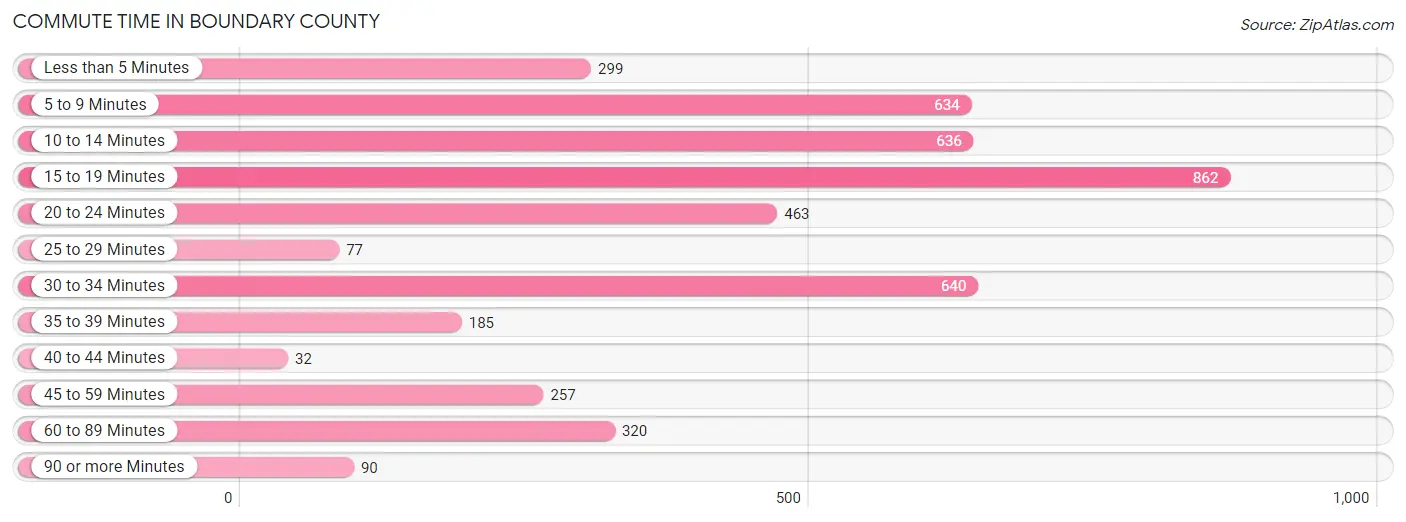
| Commute Time | # Commuters | % Commuters |
| Less than 5 Minutes | 299 | 6.7% |
| 5 to 9 Minutes | 634 | 14.1% |
| 10 to 14 Minutes | 636 | 14.1% |
| 15 to 19 Minutes | 862 | 19.2% |
| 20 to 24 Minutes | 463 | 10.3% |
| 25 to 29 Minutes | 77 | 1.7% |
| 30 to 34 Minutes | 640 | 14.2% |
| 35 to 39 Minutes | 185 | 4.1% |
| 40 to 44 Minutes | 32 | 0.7% |
| 45 to 59 Minutes | 257 | 5.7% |
| 60 to 89 Minutes | 320 | 7.1% |
| 90 or more Minutes | 90 | 2.0% |
Commute Time by Sex in Boundary County
The most common commute times in Boundary County are 15 to 19 minutes (495 commuters, 18.5%) for males and 15 to 19 minutes (367 commuters, 20.2%) for females.
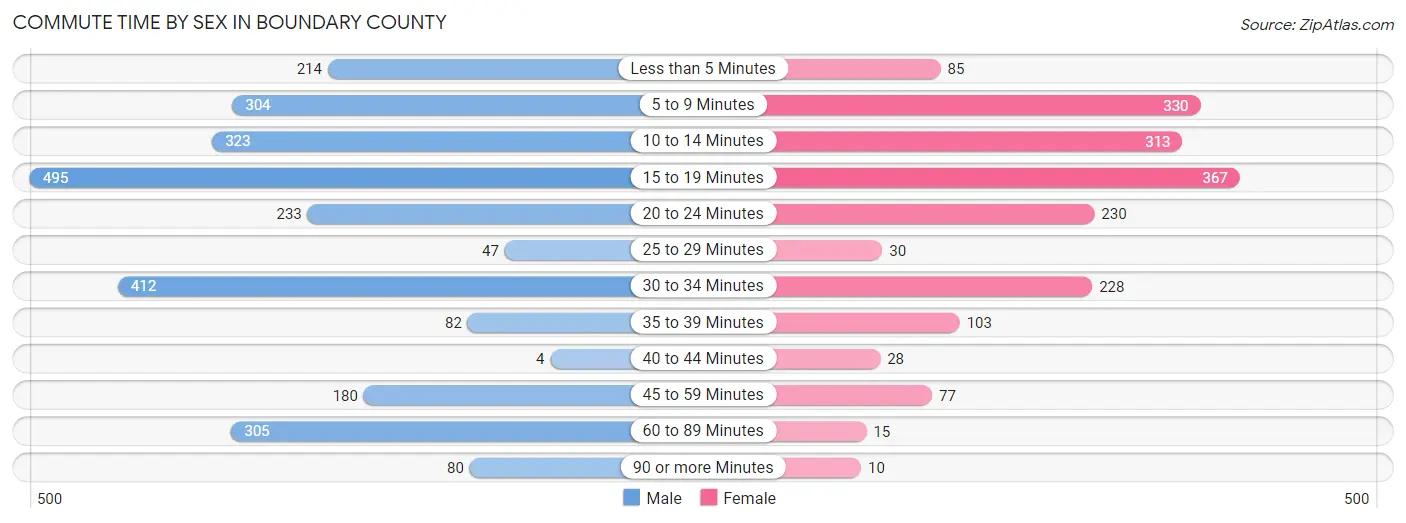
| Commute Time | Male | Female |
| Less than 5 Minutes | 214 (8.0%) | 85 (4.7%) |
| 5 to 9 Minutes | 304 (11.4%) | 330 (18.2%) |
| 10 to 14 Minutes | 323 (12.1%) | 313 (17.2%) |
| 15 to 19 Minutes | 495 (18.5%) | 367 (20.2%) |
| 20 to 24 Minutes | 233 (8.7%) | 230 (12.7%) |
| 25 to 29 Minutes | 47 (1.8%) | 30 (1.7%) |
| 30 to 34 Minutes | 412 (15.4%) | 228 (12.6%) |
| 35 to 39 Minutes | 82 (3.1%) | 103 (5.7%) |
| 40 to 44 Minutes | 4 (0.2%) | 28 (1.5%) |
| 45 to 59 Minutes | 180 (6.7%) | 77 (4.2%) |
| 60 to 89 Minutes | 305 (11.4%) | 15 (0.8%) |
| 90 or more Minutes | 80 (3.0%) | 10 (0.5%) |
Time of Departure to Work by Sex in Boundary County
The most frequent times of departure to work in Boundary County are 5:00 AM to 5:29 AM (418, 15.6%) for males and 6:30 AM to 6:59 AM (319, 17.6%) for females.
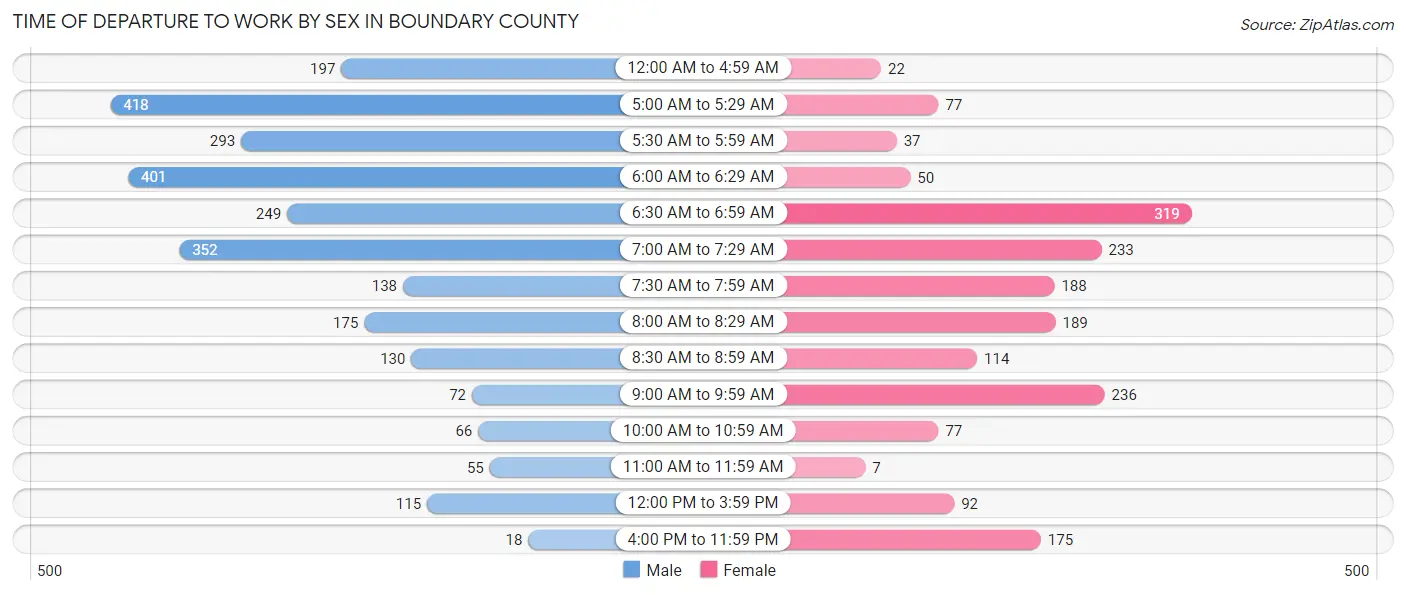
| Time of Departure | Male | Female |
| 12:00 AM to 4:59 AM | 197 (7.3%) | 22 (1.2%) |
| 5:00 AM to 5:29 AM | 418 (15.6%) | 77 (4.2%) |
| 5:30 AM to 5:59 AM | 293 (10.9%) | 37 (2.0%) |
| 6:00 AM to 6:29 AM | 401 (15.0%) | 50 (2.8%) |
| 6:30 AM to 6:59 AM | 249 (9.3%) | 319 (17.6%) |
| 7:00 AM to 7:29 AM | 352 (13.1%) | 233 (12.8%) |
| 7:30 AM to 7:59 AM | 138 (5.1%) | 188 (10.3%) |
| 8:00 AM to 8:29 AM | 175 (6.5%) | 189 (10.4%) |
| 8:30 AM to 8:59 AM | 130 (4.9%) | 114 (6.3%) |
| 9:00 AM to 9:59 AM | 72 (2.7%) | 236 (13.0%) |
| 10:00 AM to 10:59 AM | 66 (2.5%) | 77 (4.2%) |
| 11:00 AM to 11:59 AM | 55 (2.1%) | 7 (0.4%) |
| 12:00 PM to 3:59 PM | 115 (4.3%) | 92 (5.1%) |
| 4:00 PM to 11:59 PM | 18 (0.7%) | 175 (9.6%) |
| Total | 2,679 (100.0%) | 1,816 (100.0%) |
Housing Occupancy in Boundary County
Occupancy by Ownership in Boundary County
Of the total 4,710 dwellings in Boundary County, owner-occupied units account for 3,651 (77.5%), while renter-occupied units make up 1,059 (22.5%).
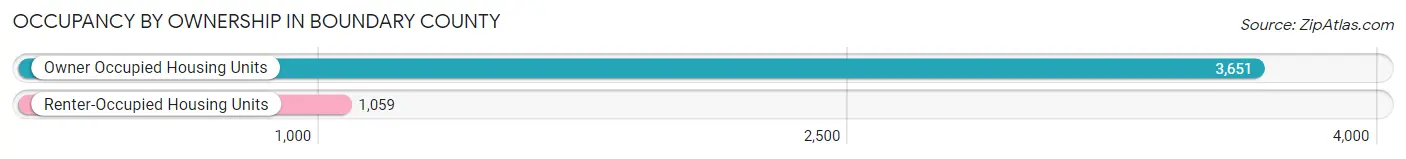
| Occupancy | # Housing Units | % Housing Units |
| Owner Occupied Housing Units | 3,651 | 77.5% |
| Renter-Occupied Housing Units | 1,059 | 22.5% |
| Total Occupied Housing Units | 4,710 | 100.0% |
Occupancy by Household Size in Boundary County
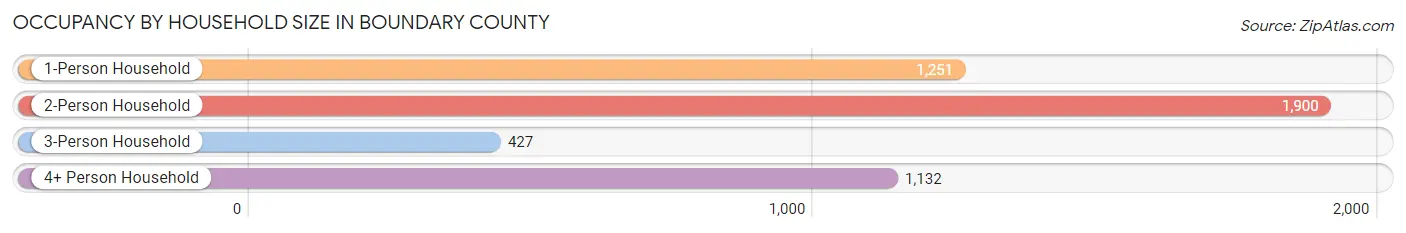
| Household Size | # Housing Units | % Housing Units |
| 1-Person Household | 1,251 | 26.6% |
| 2-Person Household | 1,900 | 40.3% |
| 3-Person Household | 427 | 9.1% |
| 4+ Person Household | 1,132 | 24.0% |
| Total Housing Units | 4,710 | 100.0% |
Occupancy by Ownership by Household Size in Boundary County
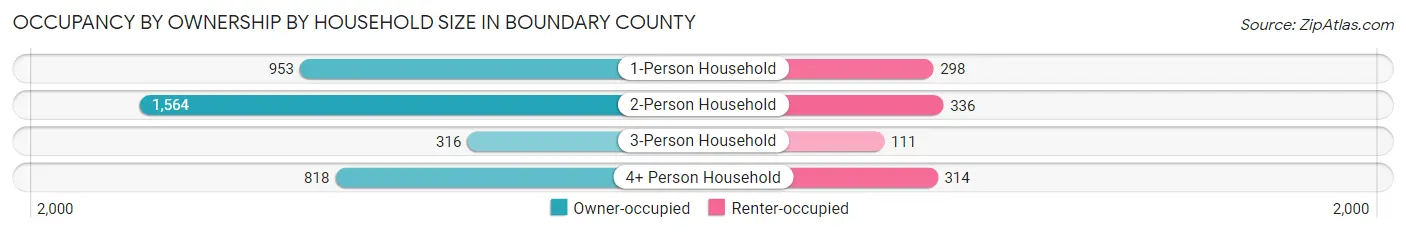
| Household Size | Owner-occupied | Renter-occupied |
| 1-Person Household | 953 (76.2%) | 298 (23.8%) |
| 2-Person Household | 1,564 (82.3%) | 336 (17.7%) |
| 3-Person Household | 316 (74.0%) | 111 (26.0%) |
| 4+ Person Household | 818 (72.3%) | 314 (27.7%) |
| Total Housing Units | 3,651 (77.5%) | 1,059 (22.5%) |
Occupancy by Educational Attainment in Boundary County
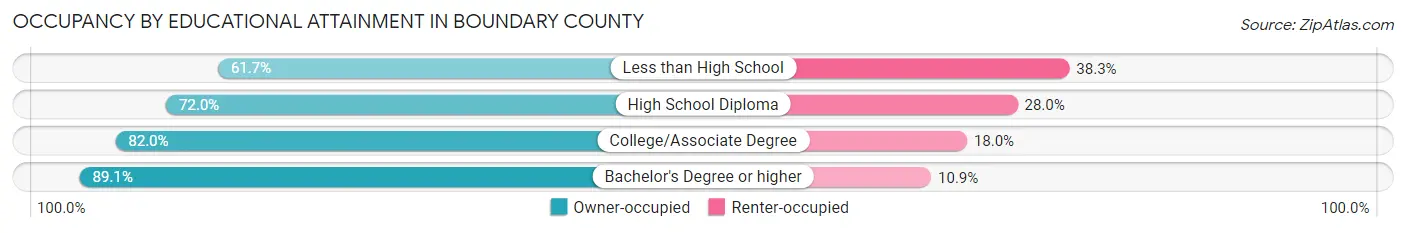
| Household Size | Owner-occupied | Renter-occupied |
| Less than High School | 388 (61.7%) | 241 (38.3%) |
| High School Diploma | 1,086 (72.0%) | 423 (28.0%) |
| College/Associate Degree | 1,326 (82.0%) | 291 (18.0%) |
| Bachelor's Degree or higher | 851 (89.1%) | 104 (10.9%) |
Occupancy by Age of Householder in Boundary County
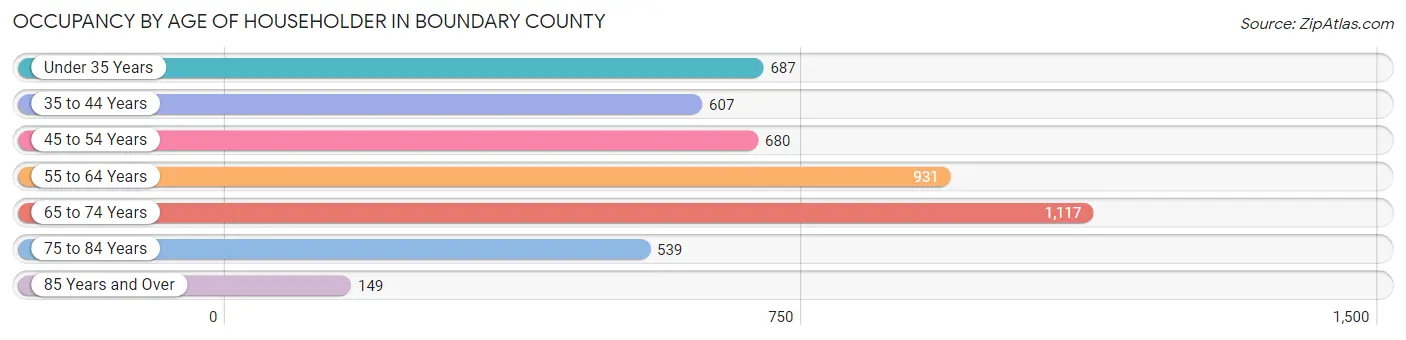
| Age Bracket | # Households | % Households |
| Under 35 Years | 687 | 14.6% |
| 35 to 44 Years | 607 | 12.9% |
| 45 to 54 Years | 680 | 14.4% |
| 55 to 64 Years | 931 | 19.8% |
| 65 to 74 Years | 1,117 | 23.7% |
| 75 to 84 Years | 539 | 11.4% |
| 85 Years and Over | 149 | 3.2% |
| Total | 4,710 | 100.0% |
Housing Finances in Boundary County
Median Income by Occupancy in Boundary County
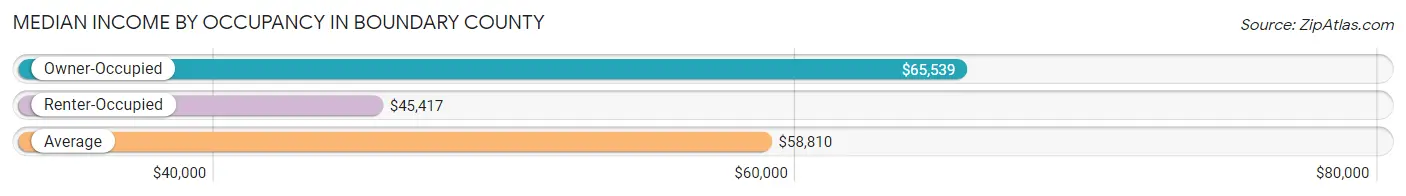
| Occupancy Type | # Households | Median Income |
| Owner-Occupied | 3,651 (77.5%) | $65,539 |
| Renter-Occupied | 1,059 (22.5%) | $45,417 |
| Average | 4,710 (100.0%) | $58,810 |
Occupancy by Householder Income Bracket in Boundary County
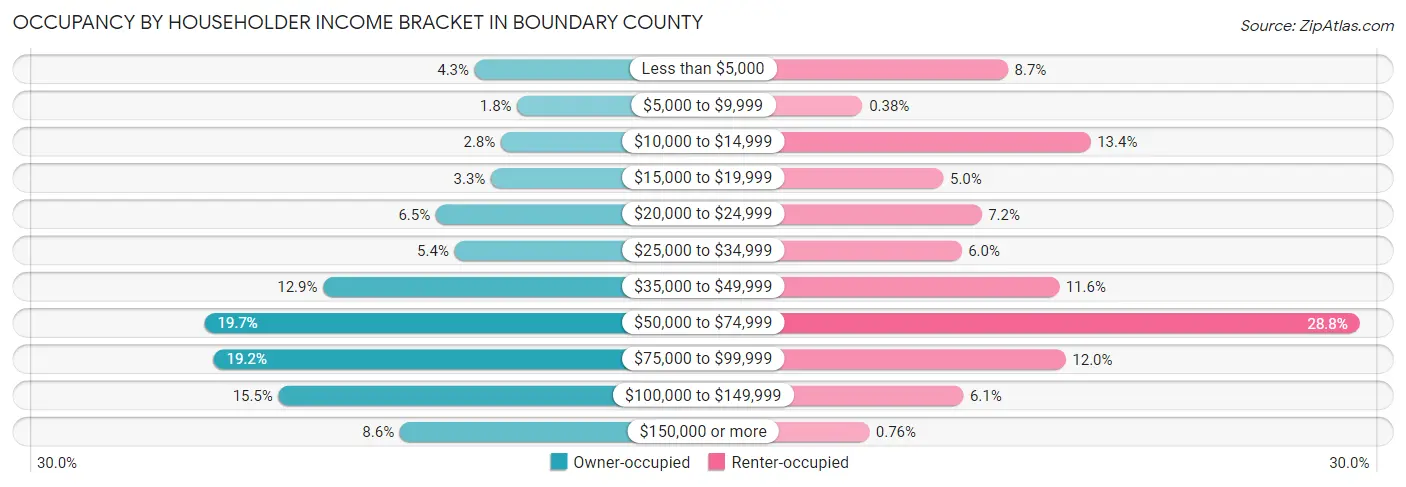
| Income Bracket | Owner-occupied | Renter-occupied |
| Less than $5,000 | 156 (4.3%) | 92 (8.7%) |
| $5,000 to $9,999 | 67 (1.8%) | 4 (0.4%) |
| $10,000 to $14,999 | 101 (2.8%) | 142 (13.4%) |
| $15,000 to $19,999 | 122 (3.3%) | 53 (5.0%) |
| $20,000 to $24,999 | 237 (6.5%) | 76 (7.2%) |
| $25,000 to $34,999 | 198 (5.4%) | 64 (6.0%) |
| $35,000 to $49,999 | 472 (12.9%) | 123 (11.6%) |
| $50,000 to $74,999 | 720 (19.7%) | 305 (28.8%) |
| $75,000 to $99,999 | 701 (19.2%) | 127 (12.0%) |
| $100,000 to $149,999 | 565 (15.5%) | 65 (6.1%) |
| $150,000 or more | 312 (8.6%) | 8 (0.8%) |
| Total | 3,651 (100.0%) | 1,059 (100.0%) |
Monthly Housing Cost Tiers in Boundary County

| Monthly Cost | Owner-occupied | Renter-occupied |
| Less than $300 | 713 (19.5%) | 74 (7.0%) |
| $300 to $499 | 773 (21.2%) | 65 (6.1%) |
| $500 to $799 | 381 (10.4%) | 258 (24.4%) |
| $800 to $999 | 252 (6.9%) | 143 (13.5%) |
| $1,000 to $1,499 | 813 (22.3%) | 236 (22.3%) |
| $1,500 to $1,999 | 417 (11.4%) | 23 (2.2%) |
| $2,000 to $2,499 | 163 (4.5%) | 0 (0.0%) |
| $2,500 to $2,999 | 36 (1.0%) | 0 (0.0%) |
| $3,000 or more | 103 (2.8%) | 0 (0.0%) |
| Total | 3,651 (100.0%) | 1,059 (100.0%) |
Physical Housing Characteristics in Boundary County
Housing Structures in Boundary County
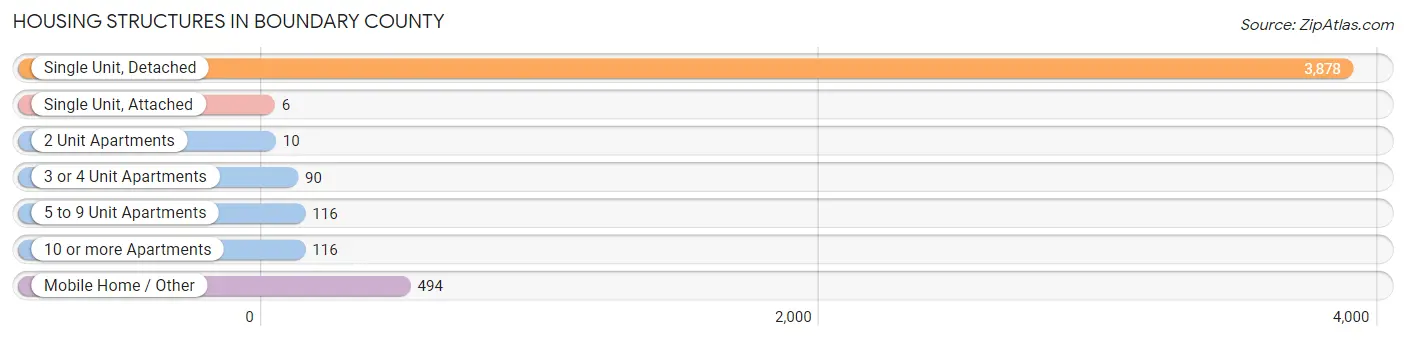
| Structure Type | # Housing Units | % Housing Units |
| Single Unit, Detached | 3,878 | 82.3% |
| Single Unit, Attached | 6 | 0.1% |
| 2 Unit Apartments | 10 | 0.2% |
| 3 or 4 Unit Apartments | 90 | 1.9% |
| 5 to 9 Unit Apartments | 116 | 2.5% |
| 10 or more Apartments | 116 | 2.5% |
| Mobile Home / Other | 494 | 10.5% |
| Total | 4,710 | 100.0% |
Housing Structures by Occupancy in Boundary County
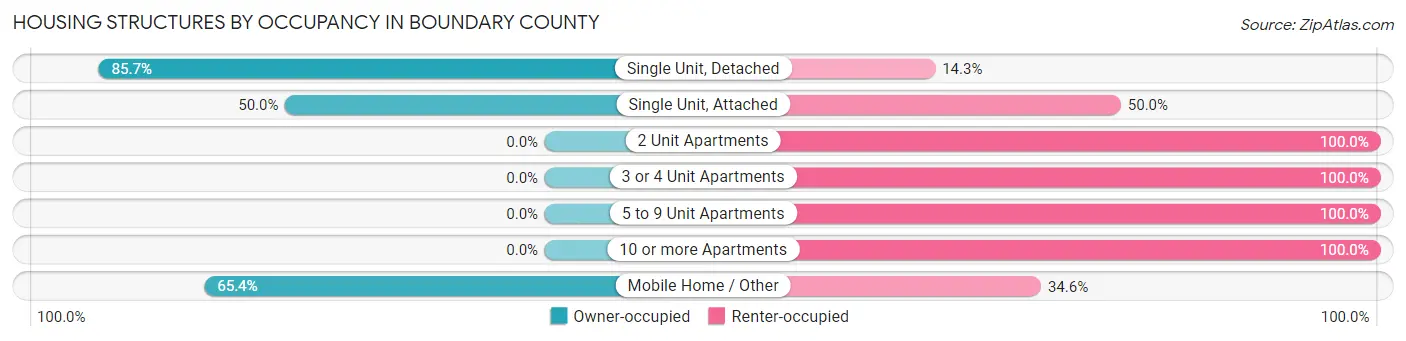
| Structure Type | Owner-occupied | Renter-occupied |
| Single Unit, Detached | 3,325 (85.7%) | 553 (14.3%) |
| Single Unit, Attached | 3 (50.0%) | 3 (50.0%) |
| 2 Unit Apartments | 0 (0.0%) | 10 (100.0%) |
| 3 or 4 Unit Apartments | 0 (0.0%) | 90 (100.0%) |
| 5 to 9 Unit Apartments | 0 (0.0%) | 116 (100.0%) |
| 10 or more Apartments | 0 (0.0%) | 116 (100.0%) |
| Mobile Home / Other | 323 (65.4%) | 171 (34.6%) |
| Total | 3,651 (77.5%) | 1,059 (22.5%) |
Housing Structures by Number of Rooms in Boundary County
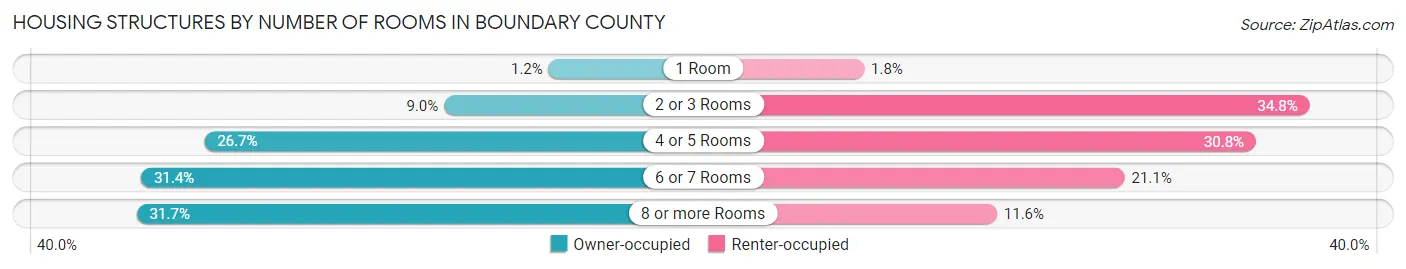
| Number of Rooms | Owner-occupied | Renter-occupied |
| 1 Room | 45 (1.2%) | 19 (1.8%) |
| 2 or 3 Rooms | 327 (9.0%) | 368 (34.7%) |
| 4 or 5 Rooms | 975 (26.7%) | 326 (30.8%) |
| 6 or 7 Rooms | 1,146 (31.4%) | 223 (21.1%) |
| 8 or more Rooms | 1,158 (31.7%) | 123 (11.6%) |
| Total | 3,651 (100.0%) | 1,059 (100.0%) |
Housing Structure by Heating Type in Boundary County
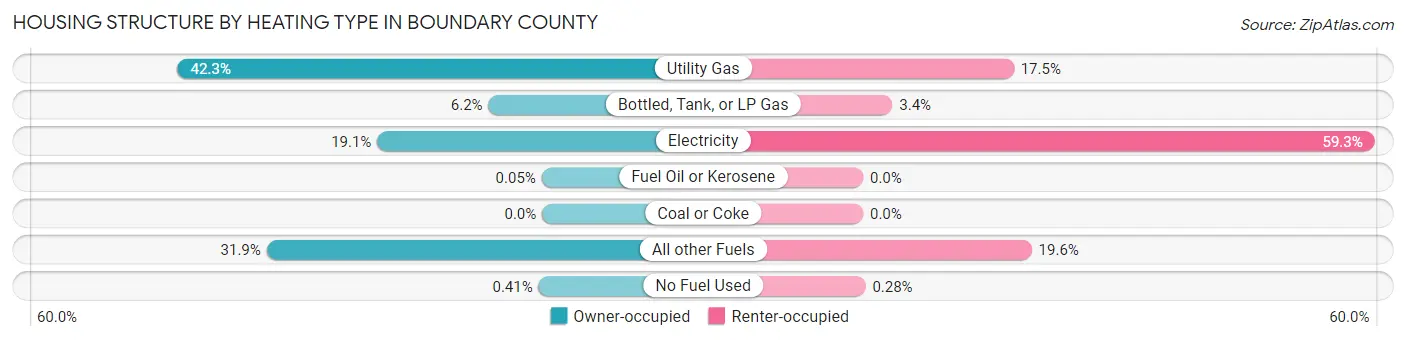
| Heating Type | Owner-occupied | Renter-occupied |
| Utility Gas | 1,543 (42.3%) | 185 (17.5%) |
| Bottled, Tank, or LP Gas | 227 (6.2%) | 36 (3.4%) |
| Electricity | 698 (19.1%) | 628 (59.3%) |
| Fuel Oil or Kerosene | 2 (0.1%) | 0 (0.0%) |
| Coal or Coke | 0 (0.0%) | 0 (0.0%) |
| All other Fuels | 1,166 (31.9%) | 207 (19.6%) |
| No Fuel Used | 15 (0.4%) | 3 (0.3%) |
| Total | 3,651 (100.0%) | 1,059 (100.0%) |
Household Vehicle Usage in Boundary County
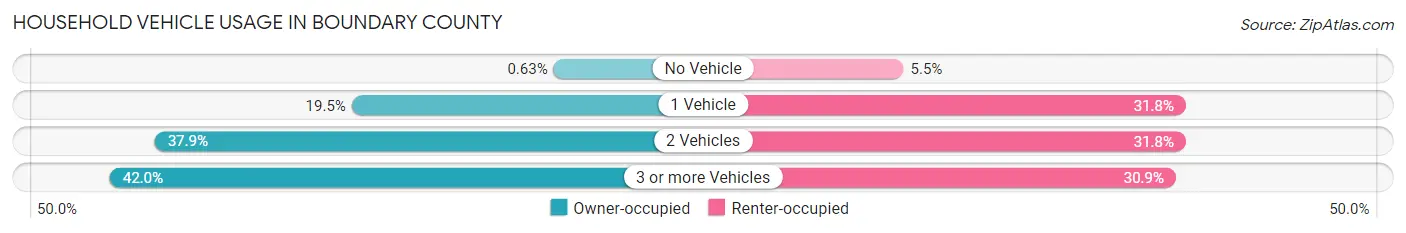
| Vehicles per Household | Owner-occupied | Renter-occupied |
| No Vehicle | 23 (0.6%) | 58 (5.5%) |
| 1 Vehicle | 711 (19.5%) | 337 (31.8%) |
| 2 Vehicles | 1,382 (37.9%) | 337 (31.8%) |
| 3 or more Vehicles | 1,535 (42.0%) | 327 (30.9%) |
| Total | 3,651 (100.0%) | 1,059 (100.0%) |
Real Estate & Mortgages in Boundary County
Real Estate and Mortgage Overview in Boundary County
| Characteristic | Without Mortgage | With Mortgage |
| Housing Units | 2,009 | 1,642 |
| Median Property Value | $321,100 | $314,800 |
| Median Household Income | $53,036 | $209 |
| Monthly Housing Costs | $369 | $103 |
| Real Estate Taxes | $1,343 | $6 |
Property Value by Mortgage Status in Boundary County
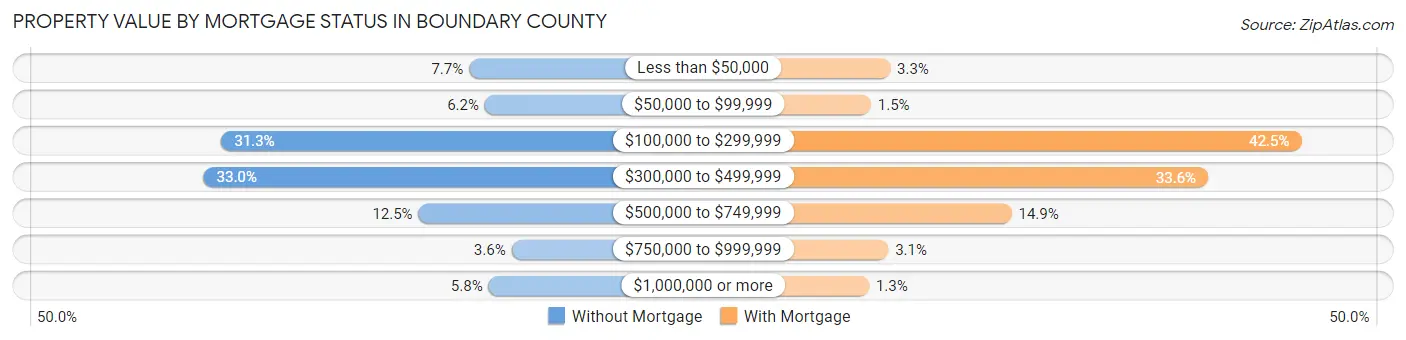
| Property Value | Without Mortgage | With Mortgage |
| Less than $50,000 | 154 (7.7%) | 54 (3.3%) |
| $50,000 to $99,999 | 124 (6.2%) | 24 (1.5%) |
| $100,000 to $299,999 | 628 (31.3%) | 697 (42.4%) |
| $300,000 to $499,999 | 662 (33.0%) | 551 (33.6%) |
| $500,000 to $749,999 | 251 (12.5%) | 244 (14.9%) |
| $750,000 to $999,999 | 73 (3.6%) | 51 (3.1%) |
| $1,000,000 or more | 117 (5.8%) | 21 (1.3%) |
| Total | 2,009 (100.0%) | 1,642 (100.0%) |
Household Income by Mortgage Status in Boundary County
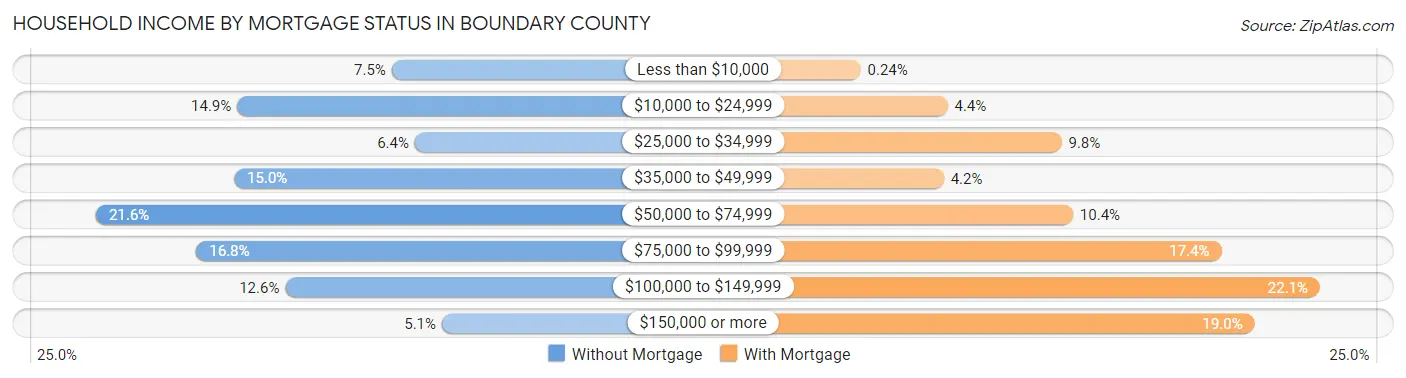
| Household Income | Without Mortgage | With Mortgage |
| Less than $10,000 | 151 (7.5%) | 4 (0.2%) |
| $10,000 to $24,999 | 299 (14.9%) | 72 (4.4%) |
| $25,000 to $34,999 | 129 (6.4%) | 161 (9.8%) |
| $35,000 to $49,999 | 302 (15.0%) | 69 (4.2%) |
| $50,000 to $74,999 | 434 (21.6%) | 170 (10.3%) |
| $75,000 to $99,999 | 338 (16.8%) | 286 (17.4%) |
| $100,000 to $149,999 | 253 (12.6%) | 363 (22.1%) |
| $150,000 or more | 103 (5.1%) | 312 (19.0%) |
| Total | 2,009 (100.0%) | 1,642 (100.0%) |
Property Value to Household Income Ratio in Boundary County
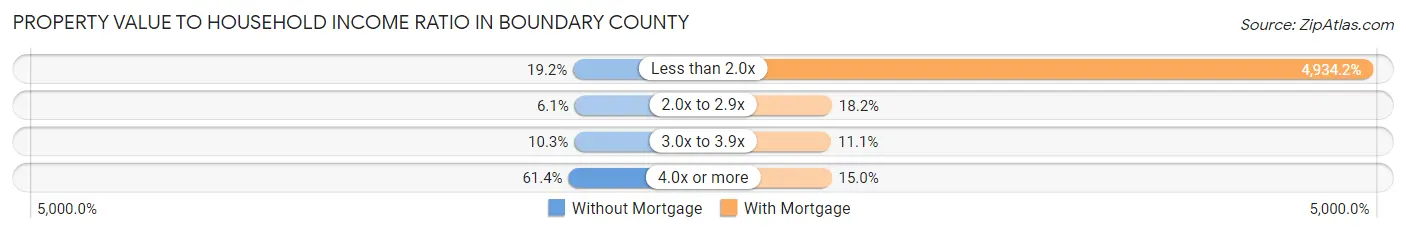
| Value-to-Income Ratio | Without Mortgage | With Mortgage |
| Less than 2.0x | 385 (19.2%) | 81,019 (4,934.2%) |
| 2.0x to 2.9x | 122 (6.1%) | 299 (18.2%) |
| 3.0x to 3.9x | 206 (10.2%) | 182 (11.1%) |
| 4.0x or more | 1,234 (61.4%) | 247 (15.0%) |
| Total | 2,009 (100.0%) | 1,642 (100.0%) |
Real Estate Taxes by Mortgage Status in Boundary County
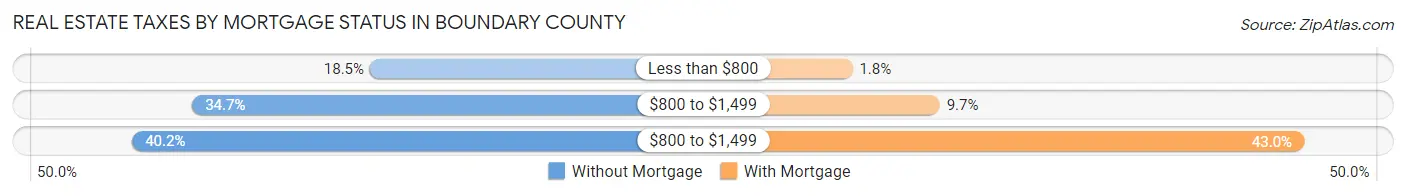
| Property Taxes | Without Mortgage | With Mortgage |
| Less than $800 | 371 (18.5%) | 29 (1.8%) |
| $800 to $1,499 | 697 (34.7%) | 160 (9.7%) |
| $800 to $1,499 | 807 (40.2%) | 706 (43.0%) |
| Total | 2,009 (100.0%) | 1,642 (100.0%) |
Health & Disability in Boundary County
Health Insurance Coverage by Age in Boundary County
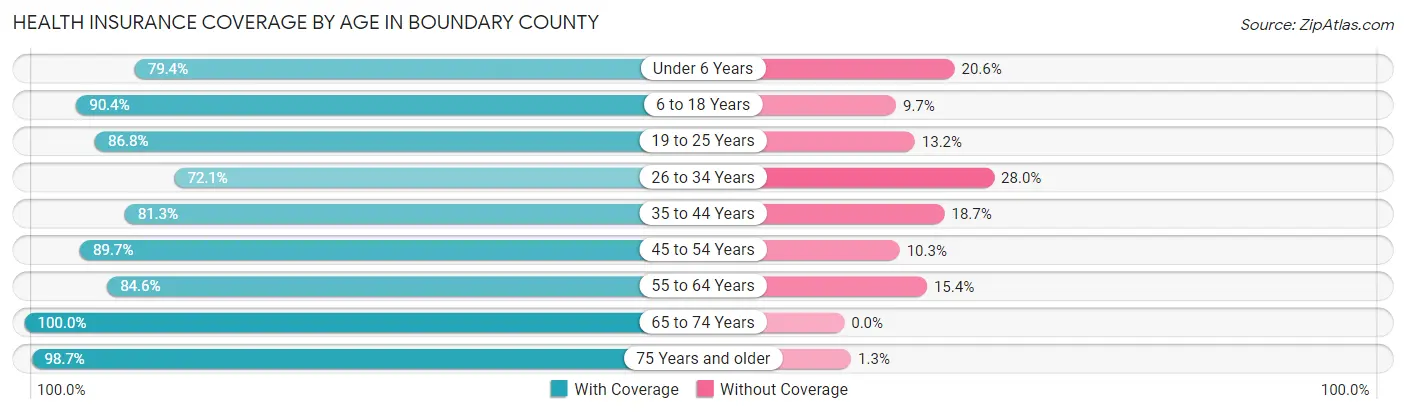
| Age Bracket | With Coverage | Without Coverage |
| Under 6 Years | 734 (79.4%) | 190 (20.6%) |
| 6 to 18 Years | 1,825 (90.3%) | 195 (9.7%) |
| 19 to 25 Years | 838 (86.8%) | 127 (13.2%) |
| 26 to 34 Years | 740 (72.1%) | 287 (28.0%) |
| 35 to 44 Years | 1,044 (81.3%) | 240 (18.7%) |
| 45 to 54 Years | 1,240 (89.7%) | 143 (10.3%) |
| 55 to 64 Years | 1,470 (84.6%) | 268 (15.4%) |
| 65 to 74 Years | 1,816 (100.0%) | 0 (0.0%) |
| 75 Years and older | 1,005 (98.7%) | 13 (1.3%) |
| Total | 10,712 (88.0%) | 1,463 (12.0%) |
Health Insurance Coverage by Citizenship Status in Boundary County
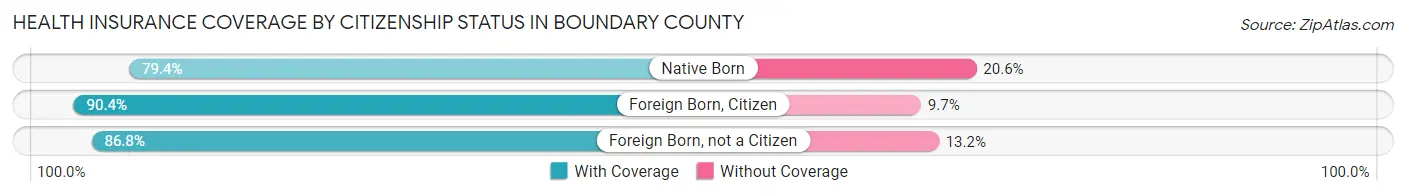
| Citizenship Status | With Coverage | Without Coverage |
| Native Born | 734 (79.4%) | 190 (20.6%) |
| Foreign Born, Citizen | 1,825 (90.3%) | 195 (9.7%) |
| Foreign Born, not a Citizen | 838 (86.8%) | 127 (13.2%) |
Health Insurance Coverage by Household Income in Boundary County
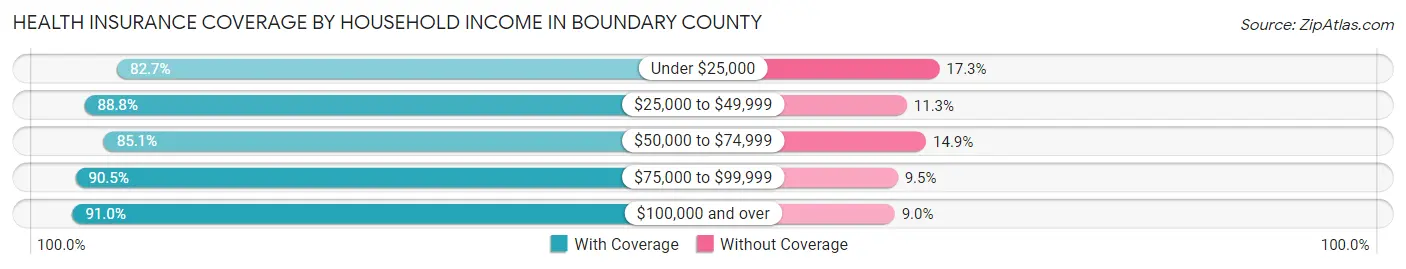
| Household Income | With Coverage | Without Coverage |
| Under $25,000 | 1,625 (82.7%) | 341 (17.3%) |
| $25,000 to $49,999 | 1,491 (88.7%) | 189 (11.3%) |
| $50,000 to $74,999 | 2,217 (85.1%) | 387 (14.9%) |
| $75,000 to $99,999 | 2,191 (90.5%) | 231 (9.5%) |
| $100,000 and over | 3,153 (91.0%) | 311 (9.0%) |
Public vs Private Health Insurance Coverage by Age in Boundary County
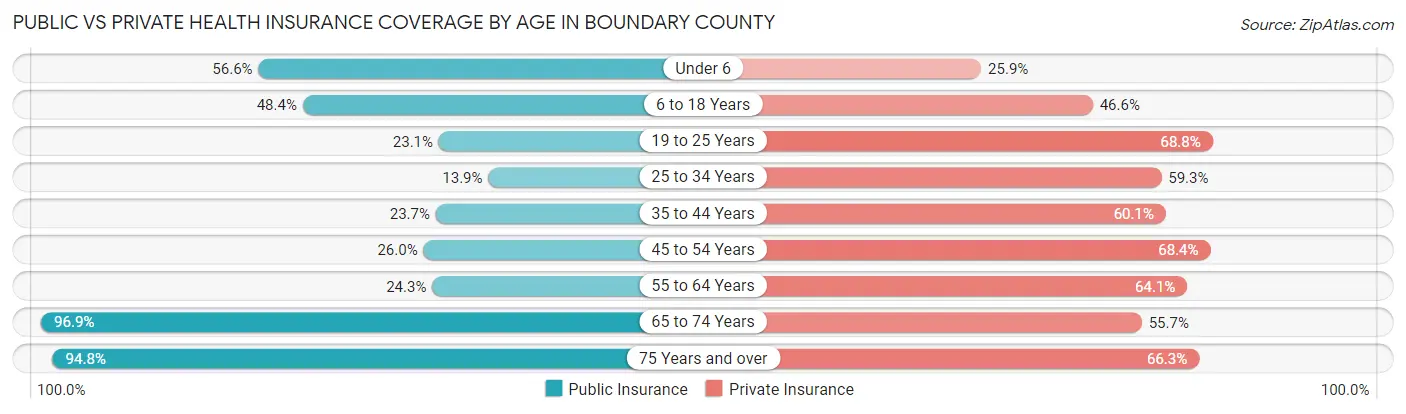
| Age Bracket | Public Insurance | Private Insurance |
| Under 6 | 523 (56.6%) | 239 (25.9%) |
| 6 to 18 Years | 977 (48.4%) | 941 (46.6%) |
| 19 to 25 Years | 223 (23.1%) | 664 (68.8%) |
| 25 to 34 Years | 143 (13.9%) | 609 (59.3%) |
| 35 to 44 Years | 304 (23.7%) | 772 (60.1%) |
| 45 to 54 Years | 359 (26.0%) | 946 (68.4%) |
| 55 to 64 Years | 423 (24.3%) | 1,114 (64.1%) |
| 65 to 74 Years | 1,760 (96.9%) | 1,011 (55.7%) |
| 75 Years and over | 965 (94.8%) | 675 (66.3%) |
| Total | 5,677 (46.6%) | 6,971 (57.3%) |
Disability Status by Sex by Age in Boundary County
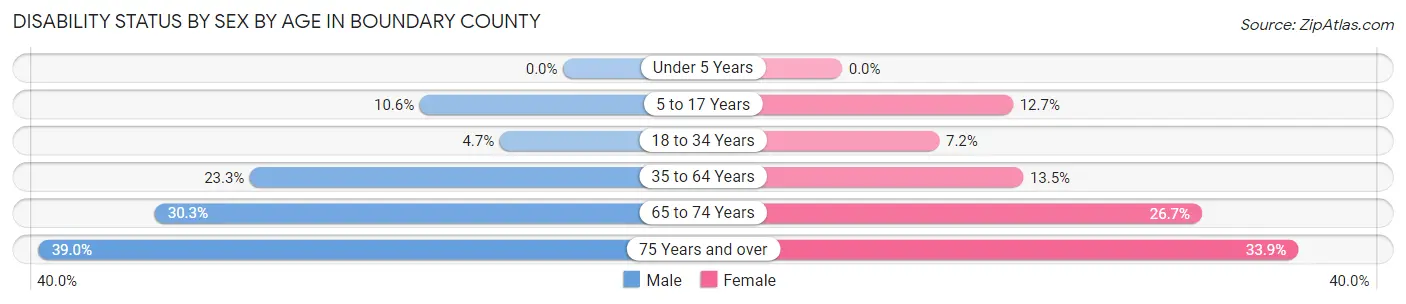
| Age Bracket | Male | Female |
| Under 5 Years | 0 (0.0%) | 0 (0.0%) |
| 5 to 17 Years | 113 (10.6%) | 125 (12.7%) |
| 18 to 34 Years | 51 (4.7%) | 72 (7.2%) |
| 35 to 64 Years | 509 (23.3%) | 298 (13.5%) |
| 65 to 74 Years | 283 (30.3%) | 236 (26.7%) |
| 75 Years and over | 178 (39.0%) | 190 (33.9%) |
Disability Class by Sex by Age in Boundary County
Disability Class: Hearing Difficulty
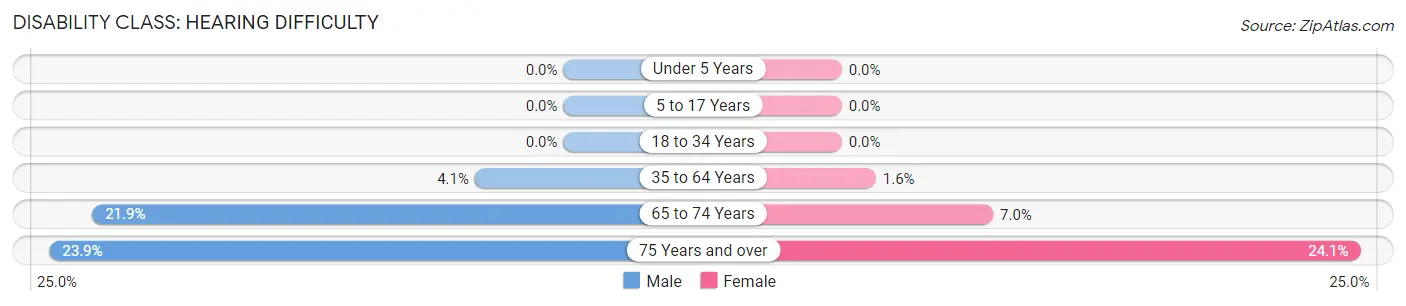
| Age Bracket | Male | Female |
| Under 5 Years | 0 (0.0%) | 0 (0.0%) |
| 5 to 17 Years | 0 (0.0%) | 0 (0.0%) |
| 18 to 34 Years | 0 (0.0%) | 0 (0.0%) |
| 35 to 64 Years | 90 (4.1%) | 35 (1.6%) |
| 65 to 74 Years | 204 (21.9%) | 62 (7.0%) |
| 75 Years and over | 109 (23.8%) | 135 (24.1%) |
Disability Class: Vision Difficulty
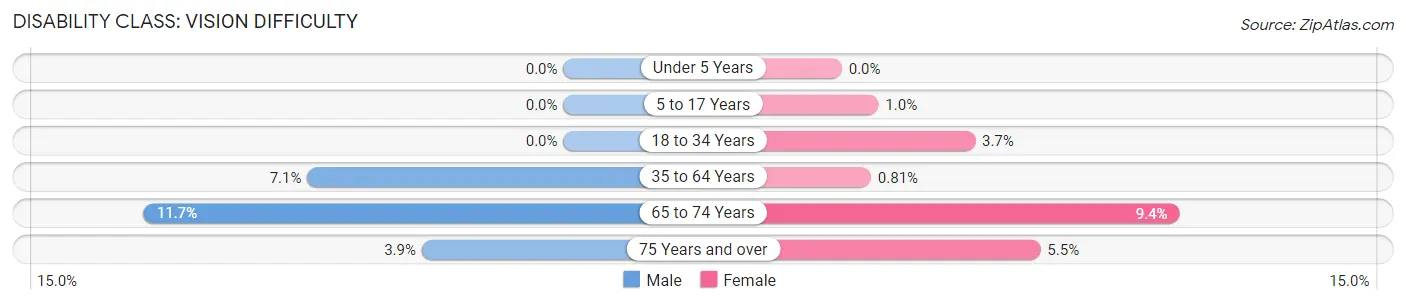
| Age Bracket | Male | Female |
| Under 5 Years | 0 (0.0%) | 0 (0.0%) |
| 5 to 17 Years | 0 (0.0%) | 10 (1.0%) |
| 18 to 34 Years | 0 (0.0%) | 37 (3.7%) |
| 35 to 64 Years | 156 (7.1%) | 18 (0.8%) |
| 65 to 74 Years | 109 (11.7%) | 83 (9.4%) |
| 75 Years and over | 18 (3.9%) | 31 (5.5%) |
Disability Class: Cognitive Difficulty

| Age Bracket | Male | Female |
| 5 to 17 Years | 67 (6.3%) | 100 (10.2%) |
| 18 to 34 Years | 27 (2.5%) | 67 (6.7%) |
| 35 to 64 Years | 108 (4.9%) | 151 (6.8%) |
| 65 to 74 Years | 96 (10.3%) | 80 (9.1%) |
| 75 Years and over | 41 (9.0%) | 78 (13.9%) |
Disability Class: Ambulatory Difficulty
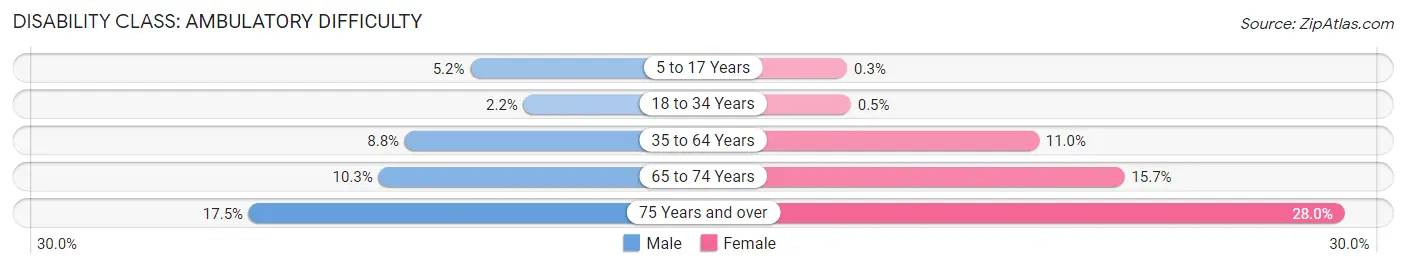
| Age Bracket | Male | Female |
| 5 to 17 Years | 55 (5.2%) | 3 (0.3%) |
| 18 to 34 Years | 24 (2.2%) | 5 (0.5%) |
| 35 to 64 Years | 193 (8.8%) | 243 (11.0%) |
| 65 to 74 Years | 96 (10.3%) | 139 (15.7%) |
| 75 Years and over | 80 (17.5%) | 157 (28.0%) |
Disability Class: Self-Care Difficulty
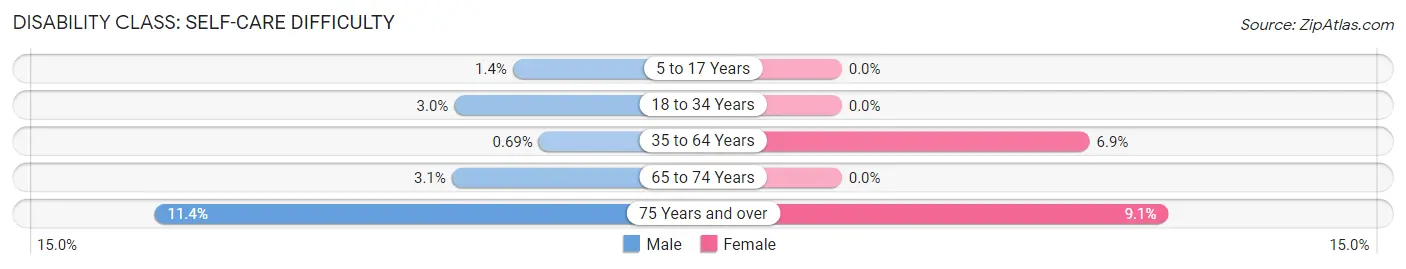
| Age Bracket | Male | Female |
| 5 to 17 Years | 15 (1.4%) | 0 (0.0%) |
| 18 to 34 Years | 33 (3.0%) | 0 (0.0%) |
| 35 to 64 Years | 15 (0.7%) | 153 (6.9%) |
| 65 to 74 Years | 29 (3.1%) | 0 (0.0%) |
| 75 Years and over | 52 (11.4%) | 51 (9.1%) |
Technology Access in Boundary County
Computing Device Access in Boundary County
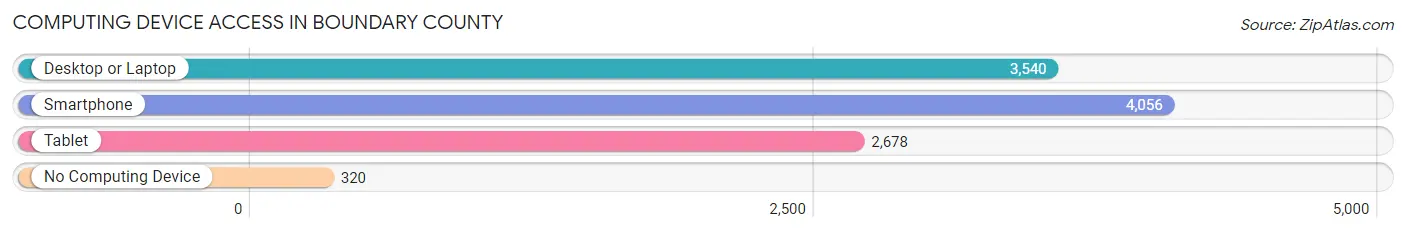
| Device Type | # Households | % Households |
| Desktop or Laptop | 3,540 | 75.2% |
| Smartphone | 4,056 | 86.1% |
| Tablet | 2,678 | 56.9% |
| No Computing Device | 320 | 6.8% |
| Total | 4,710 | 100.0% |
Internet Access in Boundary County
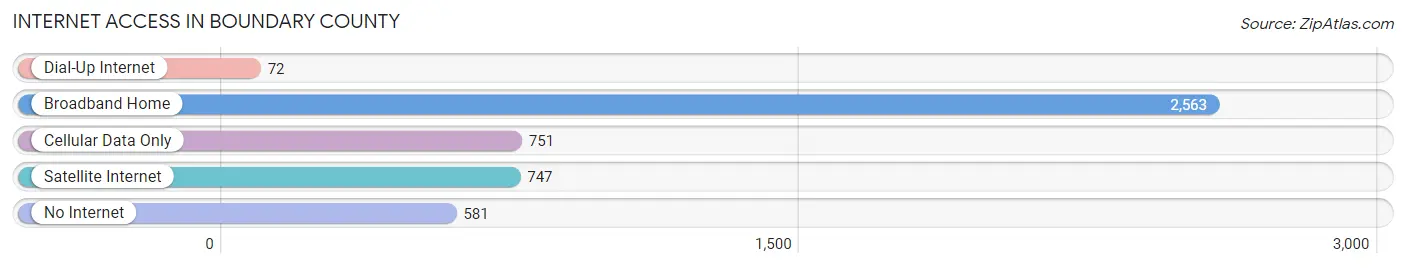
| Internet Type | # Households | % Households |
| Dial-Up Internet | 72 | 1.5% |
| Broadband Home | 2,563 | 54.4% |
| Cellular Data Only | 751 | 15.9% |
| Satellite Internet | 747 | 15.9% |
| No Internet | 581 | 12.3% |
| Total | 4,710 | 100.0% |
Boundary County Summary
Boundary County is located in the northernmost part of the state of Idaho, and is bordered by Canada to the north, Bonner County to the east, Kootenai County to the south, and Pend Oreille County to the west. The county seat is Bonners Ferry, and the county has a total area of 1,722 square miles, making it the fourth largest county in Idaho. As of the 2010 census, the population was 10,972, making it the fourth least populous county in the state.
History
Boundary County was established in 1915, and was named for its location on the boundary between the United States and Canada. The county was originally part of Kootenai County, and was created to provide better government services to the area. The county seat was originally located in Naples, but was moved to Bonners Ferry in 1916.
The area was originally inhabited by the Kootenai and Salish Native American tribes, and was later explored by fur traders and missionaries. The first permanent settlement in the area was established in 1864, when a group of miners and prospectors arrived in search of gold. The area was also home to a number of logging camps, and the railroad arrived in the area in 1891.
Geography
Boundary County is located in the northernmost part of the state of Idaho, and is bordered by Canada to the north, Bonner County to the east, Kootenai County to the south, and Pend Oreille County to the west. The county has a total area of 1,722 square miles, making it the fourth largest county in Idaho. The county is mostly mountainous, with the Selkirk Mountains to the north and the Cabinet Mountains to the south. The Kootenai River flows through the county, and there are several lakes, including Priest Lake, Moyie Lake, and Kootenai Lake.
Economy
The economy of Boundary County is largely based on agriculture, forestry, and tourism. The county is home to a number of farms, and the main crops grown are hay, wheat, barley, and potatoes. The county is also home to a number of logging camps, and the timber industry is an important part of the local economy. Tourism is also an important part of the economy, with visitors coming to the area to enjoy the natural beauty of the area, as well as the many outdoor activities available.
Demographics
As of the 2010 census, the population of Boundary County was 10,972, making it the fourth least populous county in the state. The population density was 6.4 people per square mile. The racial makeup of the county was 94.3% White, 0.3% African American, 1.2% Native American, 0.3% Asian, 0.1% Pacific Islander, 1.2% from other races, and 2.5% from two or more races. Hispanic or Latino of any race were 4.2% of the population.
The median income for a household in the county was $35,945, and the median income for a family was $41,944. The per capita income for the county was $17,945. About 13.2% of families and 17.2% of the population were below the poverty line, including 22.2% of those under age 18 and 8.7% of those age 65 or over.
Common Questions
What is the Total Population of Boundary County?
Total Population of Boundary County is 12,335.
What is the Total Male Population of Boundary County?
Total Male Population of Boundary County is 6,230.
What is the Total Female Population of Boundary County?
Total Female Population of Boundary County is 6,105.
What is the Ratio of Males per 100 Females in Boundary County?
There are 102.05 Males per 100 Females in Boundary County.
What is the Ratio of Females per 100 Males in Boundary County?
There are 97.99 Females per 100 Males in Boundary County.
What is the Median Population Age in Boundary County?
Median Population Age in Boundary County is 43.6 Years.
What is the Average Family Size in Boundary County
Average Family Size in Boundary County is 3.0 People.
What is the Average Household Size in Boundary County
Average Household Size in Boundary County is 2.6 People.
What is Per Capita Income in Boundary County?
Per Capita income in Boundary County is $27,287.
What is the Median Family Income in Boundary County?
Median Family Income in Boundary County is $65,122.
What is the Median Household income in Boundary County?
Median Household Income in Boundary County is $58,810.
What is Income or Wage Gap in Boundary County?
Income or Wage Gap in Boundary County is 38.2%.
Women in Boundary County earn 61.8 cents for every dollar earned by a man.
What is Inequality or Gini Index in Boundary County?
Inequality or Gini Index in Boundary County is 0.41.
How Large is the Labor Force in Boundary County?
There are 5,002 People in the Labor Forcein in Boundary County.
What is the Percentage of People in the Labor Force in Boundary County?
51.1% of People are in the Labor Force in Boundary County.
What is the Unemployment Rate in Boundary County?
Unemployment Rate in Boundary County is 3.8%.