Bonneville County, ID
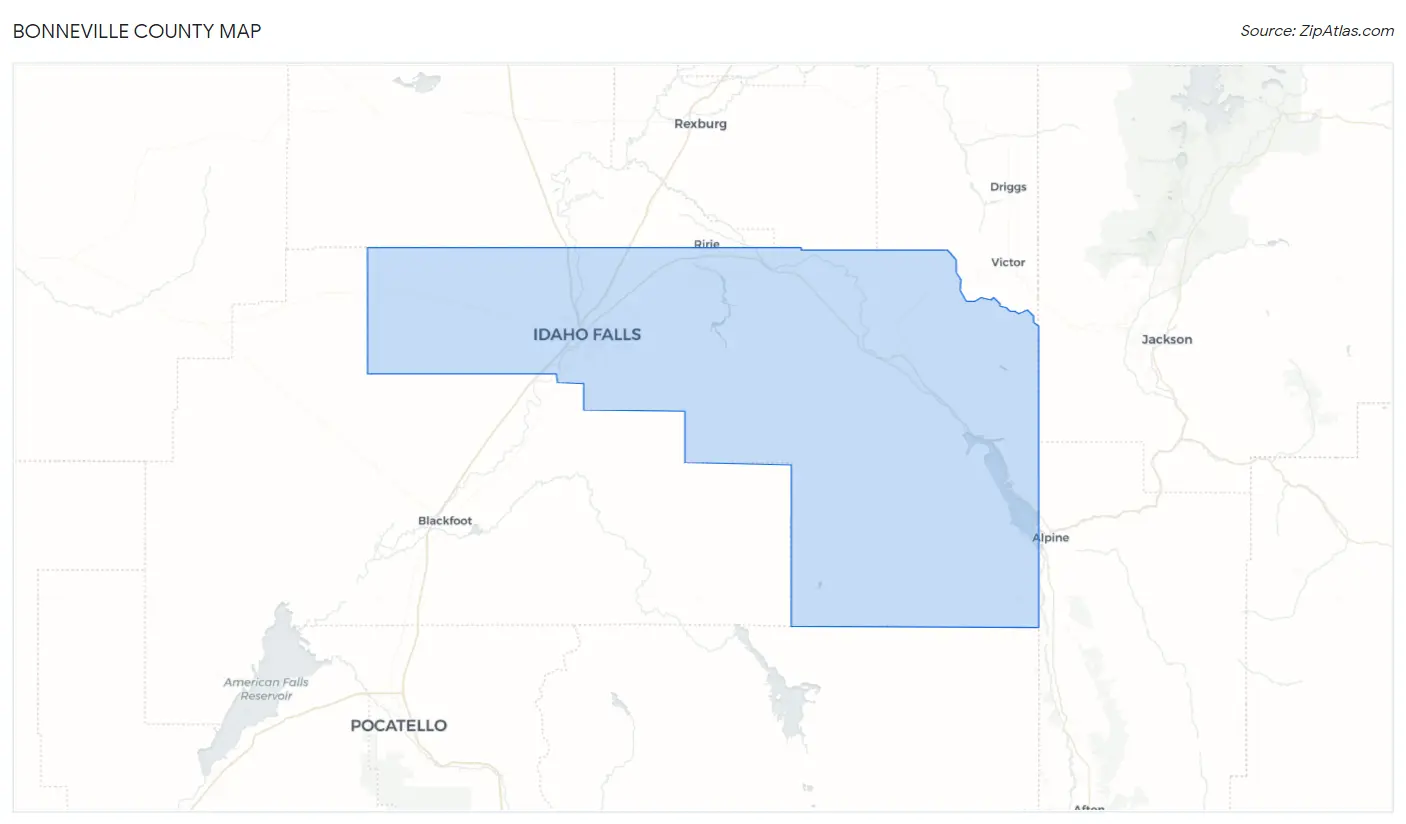
Bonneville County Map
Bonneville County Overview
124,490
TOTAL POPULATION
62,477
MALE POPULATION
62,013
FEMALE POPULATION
100.75
MALES / 100 FEMALES
99.26
FEMALES / 100 MALES
33.2
MEDIAN AGE
3.5
AVG FAMILY SIZE
2.9
AVG HOUSEHOLD SIZE
$33,008
PER CAPITA INCOME
$86,252
AVG FAMILY INCOME
$73,103
AVG HOUSEHOLD INCOME
45.3%
WAGE / INCOME GAP [ % ]
54.7¢/ $1
WAGE / INCOME GAP [ $ ]
$9,756
FAMILY INCOME DEFICIT
0.43
INEQUALITY / GINI INDEX
58,932
LABOR FORCE [ PEOPLE ]
64.8%
PERCENT IN LABOR FORCE
4.6%
UNEMPLOYMENT RATE
Bonneville County Area Codes
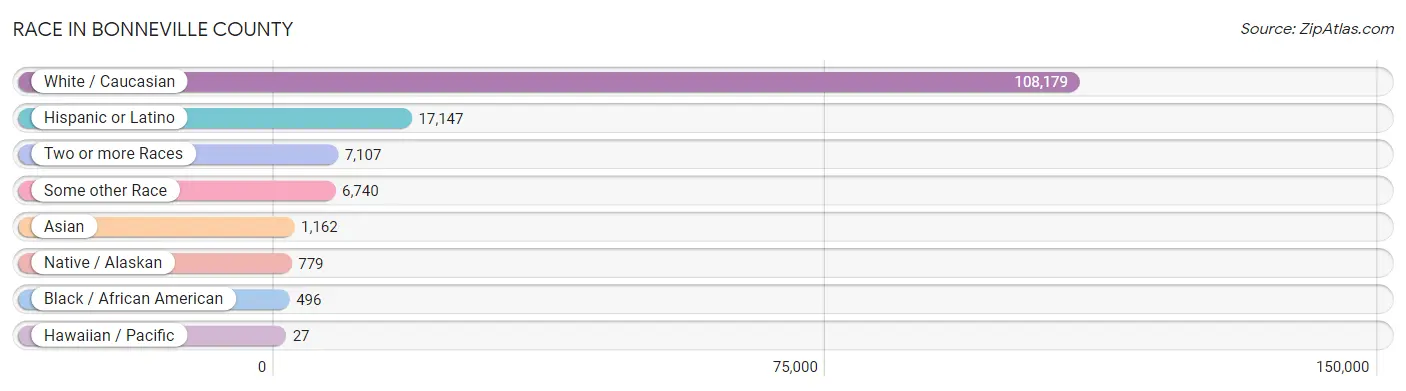
Race in Bonneville County
The most populous races in Bonneville County are White / Caucasian (108,179 | 86.9%), Hispanic or Latino (17,147 | 13.8%), and Two or more Races (7,107 | 5.7%).
| Race | # Population | % Population |
| Asian | 1,162 | 0.9% |
| Black / African American | 496 | 0.4% |
| Hawaiian / Pacific | 27 | 0.0% |
| Hispanic or Latino | 17,147 | 13.8% |
| Native / Alaskan | 779 | 0.6% |
| White / Caucasian | 108,179 | 86.9% |
| Two or more Races | 7,107 | 5.7% |
| Some other Race | 6,740 | 5.4% |
| Total | 124,490 | 100.0% |
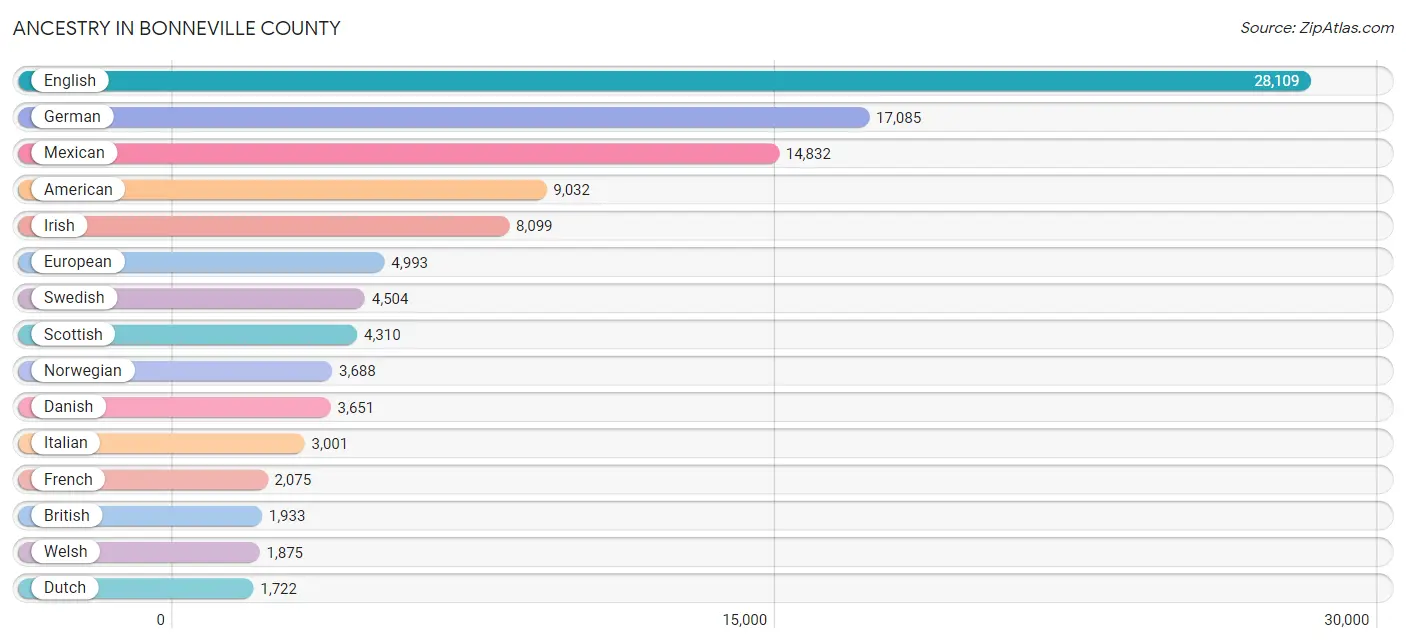
Ancestry in Bonneville County
The most populous ancestries reported in Bonneville County are English (28,109 | 22.6%), German (17,085 | 13.7%), Mexican (14,832 | 11.9%), American (9,032 | 7.3%), and Irish (8,099 | 6.5%), together accounting for 62.0% of all Bonneville County residents.
| Ancestry | # Population | % Population |
| African | 65 | 0.1% |
| Albanian | 44 | 0.0% |
| Aleut | 5 | 0.0% |
| American | 9,032 | 7.3% |
| Apache | 56 | 0.0% |
| Arab | 151 | 0.1% |
| Arapaho | 11 | 0.0% |
| Armenian | 29 | 0.0% |
| Australian | 15 | 0.0% |
| Austrian | 135 | 0.1% |
| Basque | 59 | 0.1% |
| Belgian | 64 | 0.1% |
| Bhutanese | 738 | 0.6% |
| Blackfeet | 130 | 0.1% |
| Brazilian | 56 | 0.0% |
| British | 1,933 | 1.5% |
| Bulgarian | 5 | 0.0% |
| Burmese | 178 | 0.1% |
| Canadian | 320 | 0.3% |
| Celtic | 20 | 0.0% |
| Central American | 581 | 0.5% |
| Central American Indian | 166 | 0.1% |
| Cherokee | 159 | 0.1% |
| Cheyenne | 27 | 0.0% |
| Chickasaw | 17 | 0.0% |
| Chippewa | 13 | 0.0% |
| Choctaw | 105 | 0.1% |
| Colville | 10 | 0.0% |
| Comanche | 96 | 0.1% |
| Costa Rican | 40 | 0.0% |
| Cree | 29 | 0.0% |
| Croatian | 81 | 0.1% |
| Cuban | 101 | 0.1% |
| Czech | 288 | 0.2% |
| Czechoslovakian | 141 | 0.1% |
| Danish | 3,651 | 2.9% |
| Dominican | 65 | 0.1% |
| Dutch | 1,722 | 1.4% |
| Eastern European | 96 | 0.1% |
| Ecuadorian | 24 | 0.0% |
| Egyptian | 16 | 0.0% |
| English | 28,109 | 22.6% |
| European | 4,993 | 4.0% |
| Fijian | 20 | 0.0% |
| Finnish | 578 | 0.5% |
| French | 2,075 | 1.7% |
| French Canadian | 610 | 0.5% |
| German | 17,085 | 13.7% |
| Ghanaian | 86 | 0.1% |
| Greek | 173 | 0.1% |
| Guatemalan | 384 | 0.3% |
| Haitian | 26 | 0.0% |
| Honduran | 33 | 0.0% |
| Hopi | 6 | 0.0% |
| Hungarian | 215 | 0.2% |
| Icelander | 16 | 0.0% |
| Indian (Asian) | 414 | 0.3% |
| Iranian | 7 | 0.0% |
| Irish | 8,099 | 6.5% |
| Iroquois | 11 | 0.0% |
| Israeli | 9 | 0.0% |
| Italian | 3,001 | 2.4% |
| Jamaican | 40 | 0.0% |
| Japanese | 9 | 0.0% |
| Kiowa | 6 | 0.0% |
| Korean | 587 | 0.5% |
| Latvian | 11 | 0.0% |
| Lebanese | 100 | 0.1% |
| Lithuanian | 69 | 0.1% |
| Lumbee | 9 | 0.0% |
| Macedonian | 2 | 0.0% |
| Mexican | 14,832 | 11.9% |
| Mexican American Indian | 91 | 0.1% |
| Moroccan | 8 | 0.0% |
| Native Hawaiian | 86 | 0.1% |
| Navajo | 84 | 0.1% |
| New Zealander | 57 | 0.1% |
| Nicaraguan | 63 | 0.1% |
| Nigerian | 5 | 0.0% |
| Northern European | 207 | 0.2% |
| Norwegian | 3,688 | 3.0% |
| Paiute | 33 | 0.0% |
| Pakistani | 74 | 0.1% |
| Pennsylvania German | 10 | 0.0% |
| Peruvian | 84 | 0.1% |
| Pima | 2 | 0.0% |
| Polish | 1,085 | 0.9% |
| Portuguese | 410 | 0.3% |
| Potawatomi | 7 | 0.0% |
| Puerto Rican | 356 | 0.3% |
| Puget Sound Salish | 17 | 0.0% |
| Romanian | 107 | 0.1% |
| Russian | 288 | 0.2% |
| Salvadoran | 61 | 0.1% |
| Scandinavian | 1,337 | 1.1% |
| Scotch-Irish | 1,117 | 0.9% |
| Scottish | 4,310 | 3.5% |
| Serbian | 15 | 0.0% |
| Shoshone | 12 | 0.0% |
| Sierra Leonean | 12 | 0.0% |
| Sioux | 13 | 0.0% |
| Slavic | 19 | 0.0% |
| Slovak | 54 | 0.0% |
| South American | 157 | 0.1% |
| Spaniard | 297 | 0.2% |
| Spanish | 292 | 0.2% |
| Sri Lankan | 32 | 0.0% |
| Subsaharan African | 168 | 0.1% |
| Swedish | 4,504 | 3.6% |
| Swiss | 1,374 | 1.1% |
| Syrian | 19 | 0.0% |
| Thai | 139 | 0.1% |
| Tlingit-Haida | 67 | 0.1% |
| Tongan | 118 | 0.1% |
| Ukrainian | 256 | 0.2% |
| Venezuelan | 49 | 0.0% |
| Welsh | 1,875 | 1.5% |
| Yakama | 26 | 0.0% |
| Yugoslavian | 91 | 0.1% | View All 119 Rows |
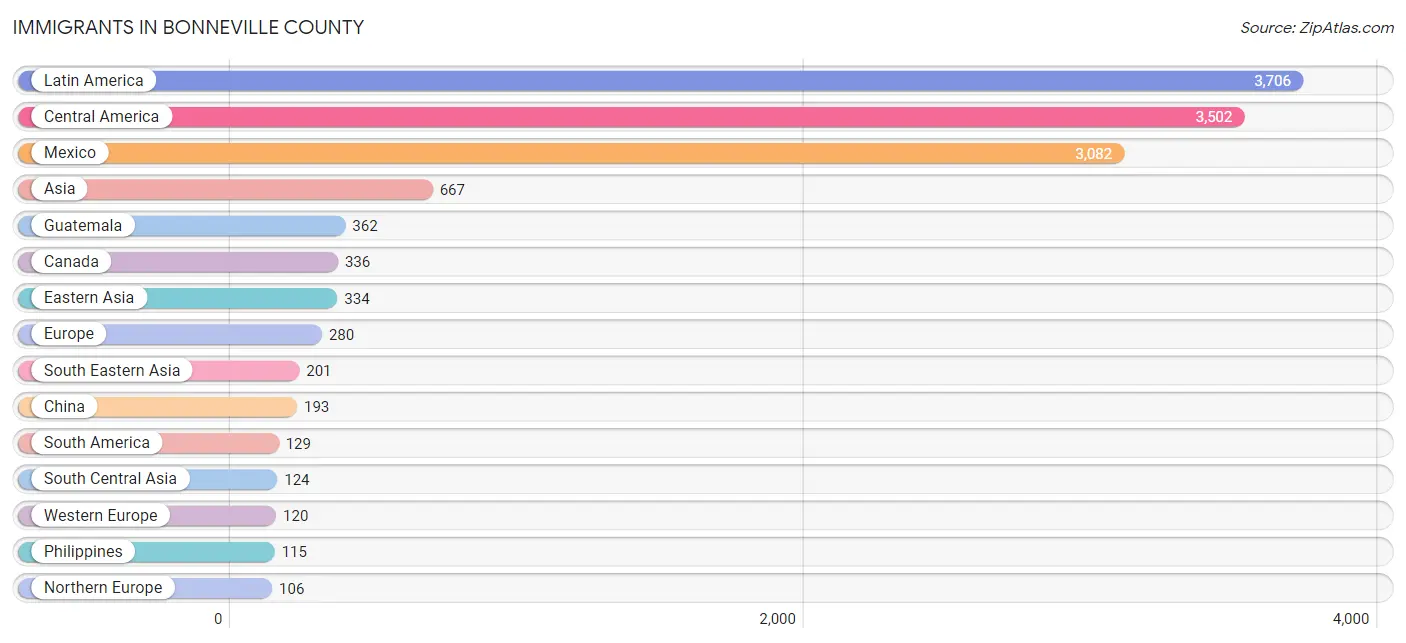
Immigrants in Bonneville County
The most numerous immigrant groups reported in Bonneville County came from Latin America (3,706 | 3.0%), Central America (3,502 | 2.8%), Mexico (3,082 | 2.5%), Asia (667 | 0.5%), and Guatemala (362 | 0.3%), together accounting for 9.1% of all Bonneville County residents.
| Immigration Origin | # Population | % Population |
| Africa | 90 | 0.1% |
| Asia | 667 | 0.5% |
| Brazil | 42 | 0.0% |
| Cambodia | 9 | 0.0% |
| Canada | 336 | 0.3% |
| Caribbean | 75 | 0.1% |
| Central America | 3,502 | 2.8% |
| China | 193 | 0.2% |
| Costa Rica | 40 | 0.0% |
| Cuba | 75 | 0.1% |
| Czechoslovakia | 19 | 0.0% |
| Eastern Asia | 334 | 0.3% |
| Eastern Europe | 33 | 0.0% |
| Ecuador | 27 | 0.0% |
| Egypt | 16 | 0.0% |
| El Salvador | 18 | 0.0% |
| England | 54 | 0.0% |
| Europe | 280 | 0.2% |
| Germany | 72 | 0.1% |
| Ghana | 14 | 0.0% |
| Guatemala | 362 | 0.3% |
| India | 71 | 0.1% |
| Iran | 7 | 0.0% |
| Ireland | 6 | 0.0% |
| Japan | 49 | 0.0% |
| Kazakhstan | 19 | 0.0% |
| Korea | 92 | 0.1% |
| Latin America | 3,706 | 3.0% |
| Mexico | 3,082 | 2.5% |
| Nepal | 27 | 0.0% |
| Netherlands | 48 | 0.0% |
| Nigeria | 18 | 0.0% |
| Northern Africa | 28 | 0.0% |
| Northern Europe | 106 | 0.1% |
| Norway | 17 | 0.0% |
| Oceania | 21 | 0.0% |
| Peru | 11 | 0.0% |
| Philippines | 115 | 0.1% |
| Romania | 8 | 0.0% |
| Russia | 6 | 0.0% |
| Scotland | 11 | 0.0% |
| Sierra Leone | 12 | 0.0% |
| Singapore | 23 | 0.0% |
| South Africa | 18 | 0.0% |
| South America | 129 | 0.1% |
| South Central Asia | 124 | 0.1% |
| South Eastern Asia | 201 | 0.2% |
| Southern Europe | 21 | 0.0% |
| Spain | 21 | 0.0% |
| Sweden | 6 | 0.0% |
| Taiwan | 16 | 0.0% |
| Thailand | 39 | 0.0% |
| Venezuela | 49 | 0.0% |
| Vietnam | 15 | 0.0% |
| Western Africa | 44 | 0.0% |
| Western Asia | 8 | 0.0% |
| Western Europe | 120 | 0.1% | View All 57 Rows |
Sex and Age in Bonneville County
Sex and Age in Bonneville County
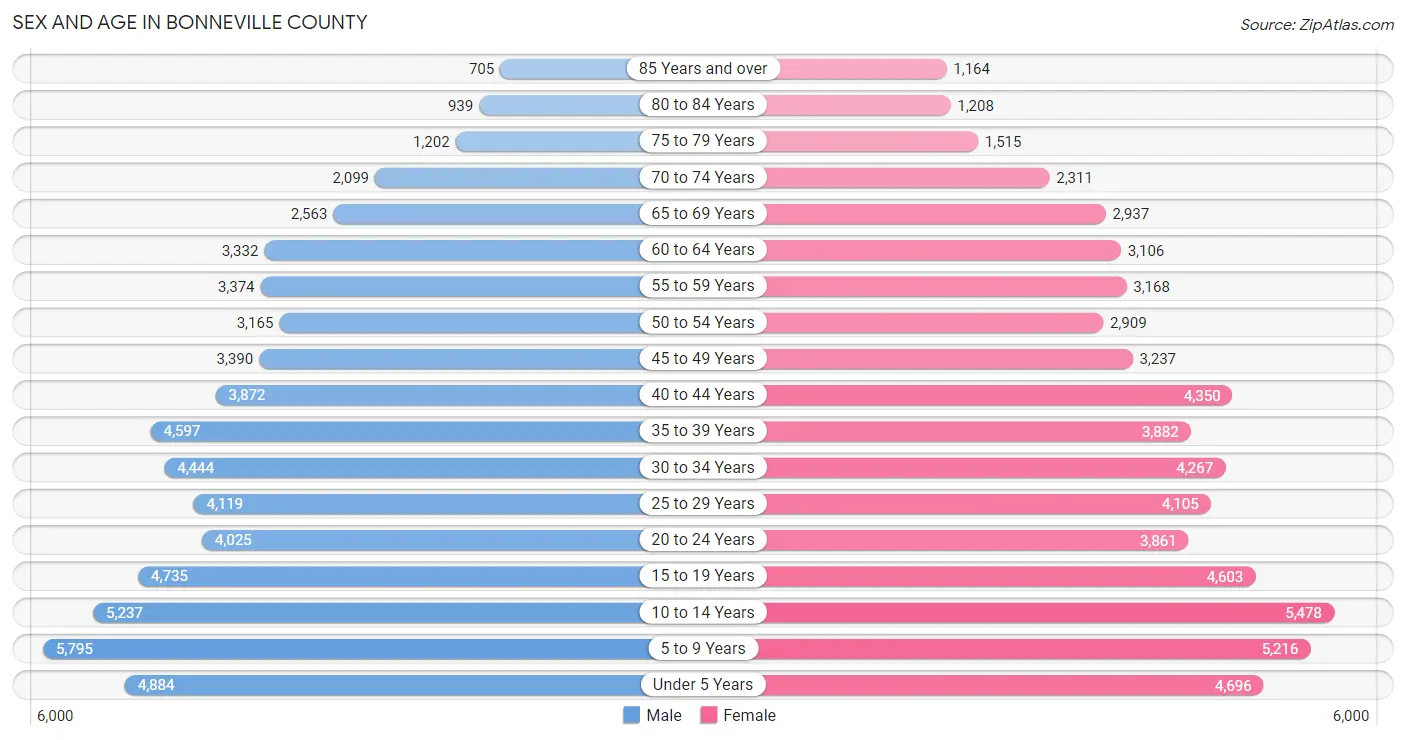
The most populous age groups in Bonneville County are 5 to 9 Years (5,795 | 9.3%) for men and 10 to 14 Years (5,478 | 8.8%) for women.
| Age Bracket | Male | Female |
| Under 5 Years | 4,884 (7.8%) | 4,696 (7.6%) |
| 5 to 9 Years | 5,795 (9.3%) | 5,216 (8.4%) |
| 10 to 14 Years | 5,237 (8.4%) | 5,478 (8.8%) |
| 15 to 19 Years | 4,735 (7.6%) | 4,603 (7.4%) |
| 20 to 24 Years | 4,025 (6.4%) | 3,861 (6.2%) |
| 25 to 29 Years | 4,119 (6.6%) | 4,105 (6.6%) |
| 30 to 34 Years | 4,444 (7.1%) | 4,267 (6.9%) |
| 35 to 39 Years | 4,597 (7.4%) | 3,882 (6.3%) |
| 40 to 44 Years | 3,872 (6.2%) | 4,350 (7.0%) |
| 45 to 49 Years | 3,390 (5.4%) | 3,237 (5.2%) |
| 50 to 54 Years | 3,165 (5.1%) | 2,909 (4.7%) |
| 55 to 59 Years | 3,374 (5.4%) | 3,168 (5.1%) |
| 60 to 64 Years | 3,332 (5.3%) | 3,106 (5.0%) |
| 65 to 69 Years | 2,563 (4.1%) | 2,937 (4.7%) |
| 70 to 74 Years | 2,099 (3.4%) | 2,311 (3.7%) |
| 75 to 79 Years | 1,202 (1.9%) | 1,515 (2.4%) |
| 80 to 84 Years | 939 (1.5%) | 1,208 (1.9%) |
| 85 Years and over | 705 (1.1%) | 1,164 (1.9%) |
| Total | 62,477 (100.0%) | 62,013 (100.0%) |
Families and Households in Bonneville County
Median Family Size in Bonneville County
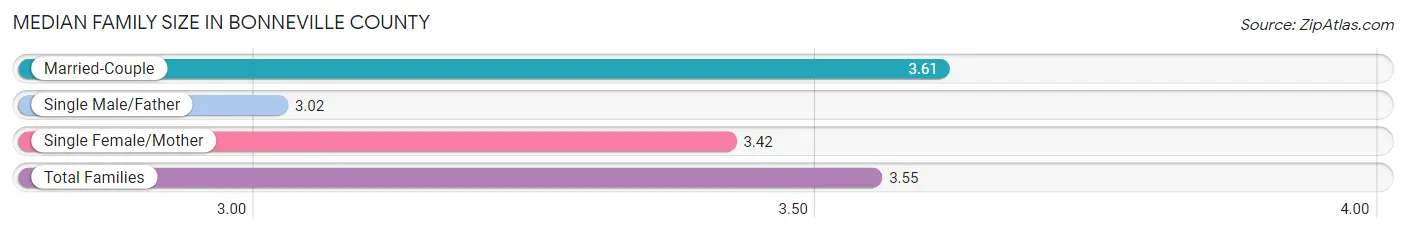
The median family size in Bonneville County is 3.55 persons per family, with married-couple families (23,379 | 79.1%) accounting for the largest median family size of 3.61 persons per family. On the other hand, single male/father families (1,690 | 5.7%) represent the smallest median family size with 3.02 persons per family.
| Family Type | # Families | Family Size |
| Married-Couple | 23,379 (79.1%) | 3.61 |
| Single Male/Father | 1,690 (5.7%) | 3.02 |
| Single Female/Mother | 4,476 (15.1%) | 3.42 |
| Total Families | 29,545 (100.0%) | 3.55 |
Median Household Size in Bonneville County
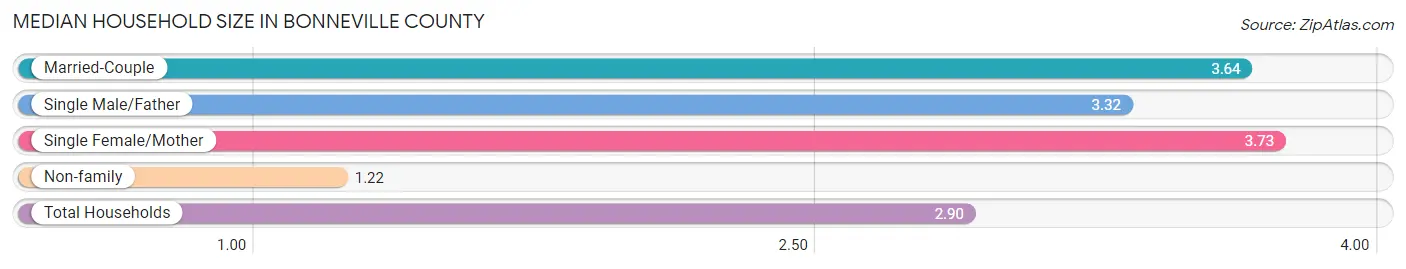
The median household size in Bonneville County is 2.90 persons per household, with single female/mother households (4,476 | 10.6%) accounting for the largest median household size of 3.73 persons per household. non-family households (12,857 | 30.3%) represent the smallest median household size with 1.22 persons per household.
| Household Type | # Households | Household Size |
| Married-Couple | 23,379 (55.1%) | 3.64 |
| Single Male/Father | 1,690 (4.0%) | 3.32 |
| Single Female/Mother | 4,476 (10.6%) | 3.73 |
| Non-family | 12,857 (30.3%) | 1.22 |
| Total Households | 42,402 (100.0%) | 2.90 |
Household Size by Marriage Status in Bonneville County
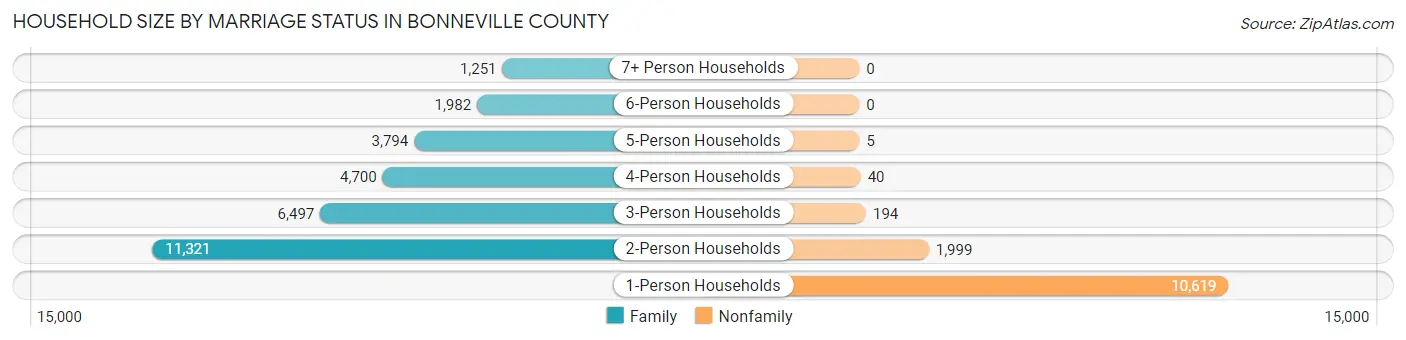
Out of a total of 42,402 households in Bonneville County, 29,545 (69.7%) are family households, while 12,857 (30.3%) are nonfamily households. The most numerous type of family households are 2-person households, comprising 11,321, and the most common type of nonfamily households are 1-person households, comprising 10,619.
| Household Size | Family Households | Nonfamily Households |
| 1-Person Households | - | 10,619 (25.0%) |
| 2-Person Households | 11,321 (26.7%) | 1,999 (4.7%) |
| 3-Person Households | 6,497 (15.3%) | 194 (0.5%) |
| 4-Person Households | 4,700 (11.1%) | 40 (0.1%) |
| 5-Person Households | 3,794 (8.9%) | 5 (0.0%) |
| 6-Person Households | 1,982 (4.7%) | 0 (0.0%) |
| 7+ Person Households | 1,251 (2.9%) | 0 (0.0%) |
| Total | 29,545 (69.7%) | 12,857 (30.3%) |
Female Fertility in Bonneville County
Fertility by Age in Bonneville County
Average fertility rate in Bonneville County is 89.0 births per 1,000 women. Women in the age bracket of 20 to 34 years have the highest fertility rate with 174.0 births per 1,000 women. Women in the age bracket of 20 to 34 years acount for 83.0% of all women with births.
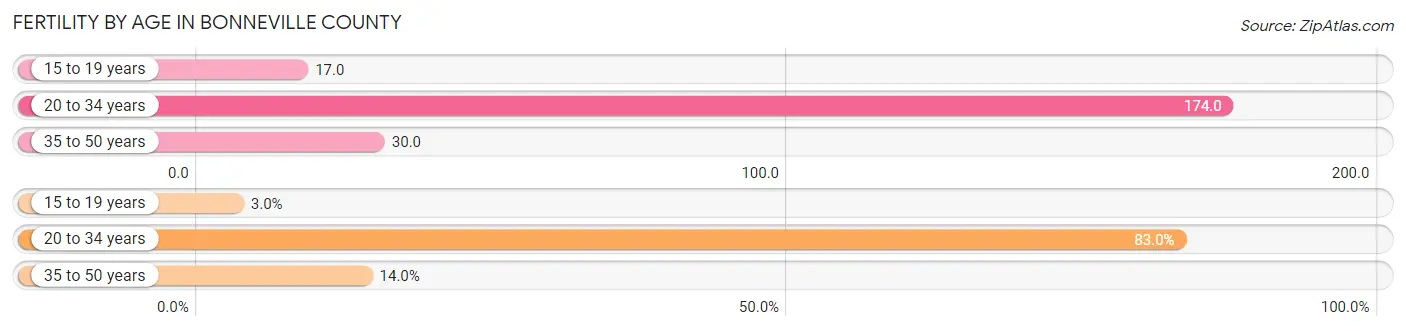
| Age Bracket | Women with Births | Births / 1,000 Women |
| 15 to 19 years | 78 (3.0%) | 17.0 |
| 20 to 34 years | 2,129 (83.0%) | 174.0 |
| 35 to 50 years | 358 (14.0%) | 30.0 |
| Total | 2,565 (100.0%) | 89.0 |
Fertility by Age by Marriage Status in Bonneville County
76.8% of women with births (2,565) in Bonneville County are married. The highest percentage of unmarried women with births falls into 15 to 19 years age bracket with 100.0% of them unmarried at the time of birth, while the lowest percentage of unmarried women with births belong to 35 to 50 years age bracket with 6.4% of them unmarried.
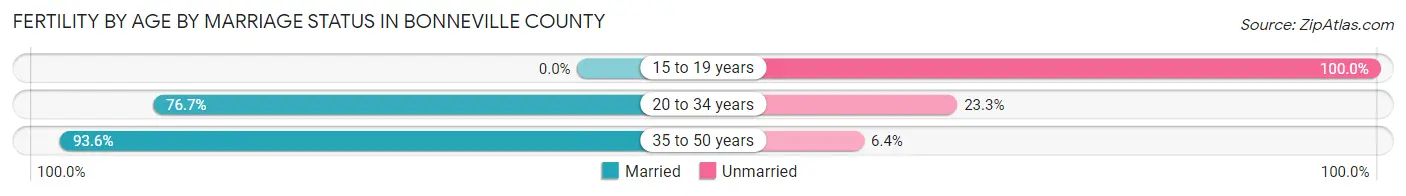
| Age Bracket | Married | Unmarried |
| 15 to 19 years | 0 (0.0%) | 78 (100.0%) |
| 20 to 34 years | 1,633 (76.7%) | 496 (23.3%) |
| 35 to 50 years | 335 (93.6%) | 23 (6.4%) |
| Total | 1,970 (76.8%) | 595 (23.2%) |
Fertility by Education in Bonneville County
Average fertility rate in Bonneville County is 89.0 births per 1,000 women. Women with the education attainment of bachelor's degree have the highest fertility rate of 133.0 births per 1,000 women, while women with the education attainment of less than high school have the lowest fertility at 29.0 births per 1,000 women. Women with the education attainment of college or associate's degree represent 31.7% of all women with births.
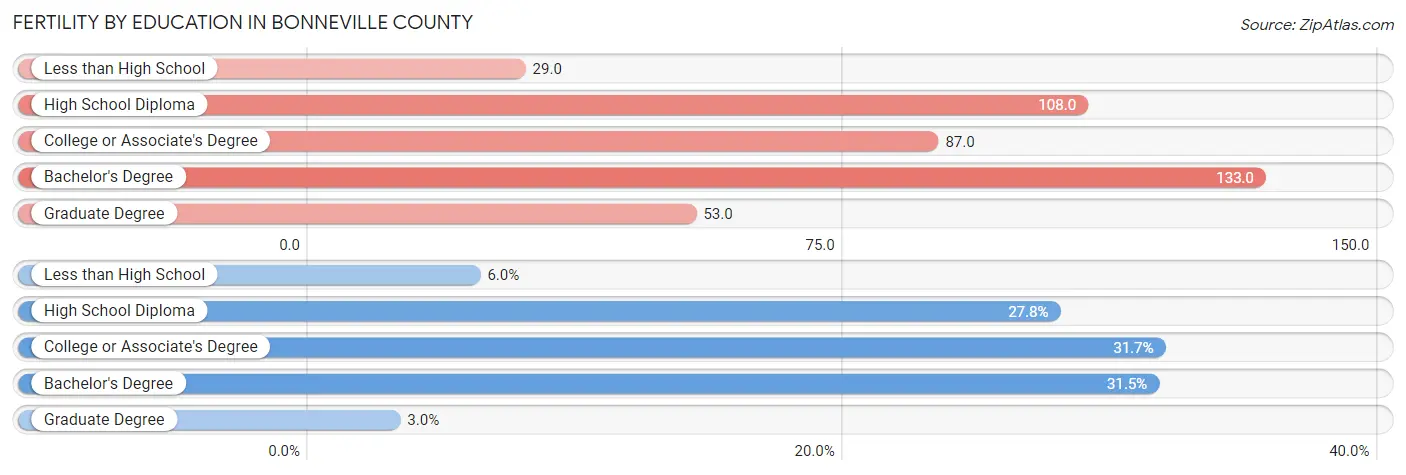
| Educational Attainment | Women with Births | Births / 1,000 Women |
| Less than High School | 155 (6.0%) | 29.0 |
| High School Diploma | 712 (27.8%) | 108.0 |
| College or Associate's Degree | 813 (31.7%) | 87.0 |
| Bachelor's Degree | 807 (31.5%) | 133.0 |
| Graduate Degree | 78 (3.0%) | 53.0 |
| Total | 2,565 (100.0%) | 89.0 |
Fertility by Education by Marriage Status in Bonneville County
23.2% of women with births in Bonneville County are unmarried. Women with the educational attainment of graduate degree are most likely to be married with 100.0% of them married at childbirth, while women with the educational attainment of high school diploma are least likely to be married with 63.9% of them unmarried at childbirth.
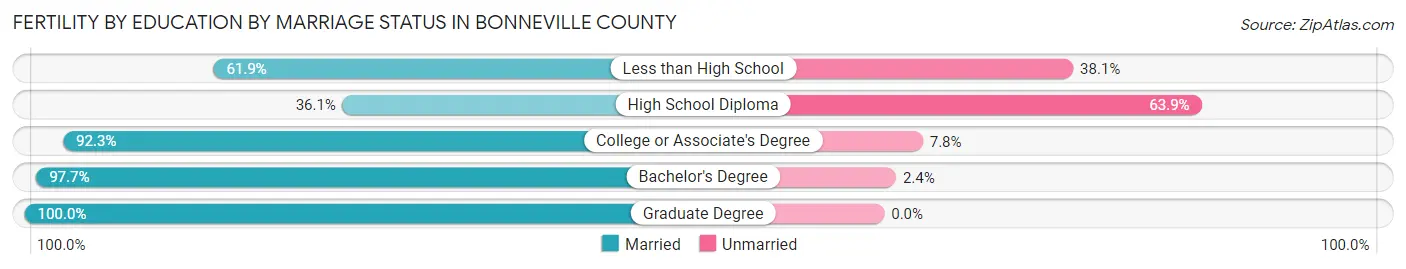
| Educational Attainment | Married | Unmarried |
| Less than High School | 96 (61.9%) | 59 (38.1%) |
| High School Diploma | 257 (36.1%) | 455 (63.9%) |
| College or Associate's Degree | 750 (92.2%) | 63 (7.7%) |
| Bachelor's Degree | 788 (97.7%) | 19 (2.4%) |
| Graduate Degree | 78 (100.0%) | 0 (0.0%) |
| Total | 1,970 (76.8%) | 595 (23.2%) |
Income in Bonneville County
Income Overview in Bonneville County
Per Capita Income in Bonneville County is $33,008, while median incomes of families and households are $86,252 and $73,103 respectively.
| Characteristic | Number | Measure |
| Per Capita Income | 124,490 | $33,008 |
| Median Family Income | 29,545 | $86,252 |
| Mean Family Income | 29,545 | $107,971 |
| Median Household Income | 42,402 | $73,103 |
| Mean Household Income | 42,402 | $94,934 |
| Income Deficit | 29,545 | $9,756 |
| Wage / Income Gap (%) | 124,490 | 45.28% |
| Wage / Income Gap ($) | 124,490 | 54.72¢ per $1 |
| Gini / Inequality Index | 124,490 | 0.43 |
Earnings by Sex in Bonneville County
Average Earnings in Bonneville County are $33,944, $46,029 for men and $25,189 for women, a difference of 45.3%.
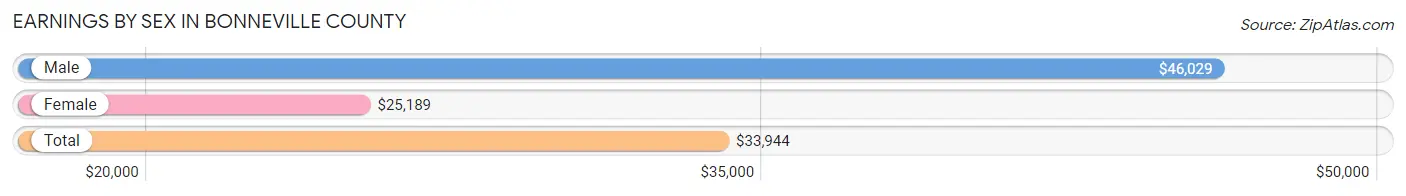
| Sex | Number | Average Earnings |
| Male | 34,473 (54.8%) | $46,029 |
| Female | 28,480 (45.2%) | $25,189 |
| Total | 62,953 (100.0%) | $33,944 |
Earnings by Sex by Income Bracket in Bonneville County
The most common earnings brackets in Bonneville County are $100,000+ for men (6,387 | 18.5%) and $2,499 or less for women (2,607 | 9.1%).
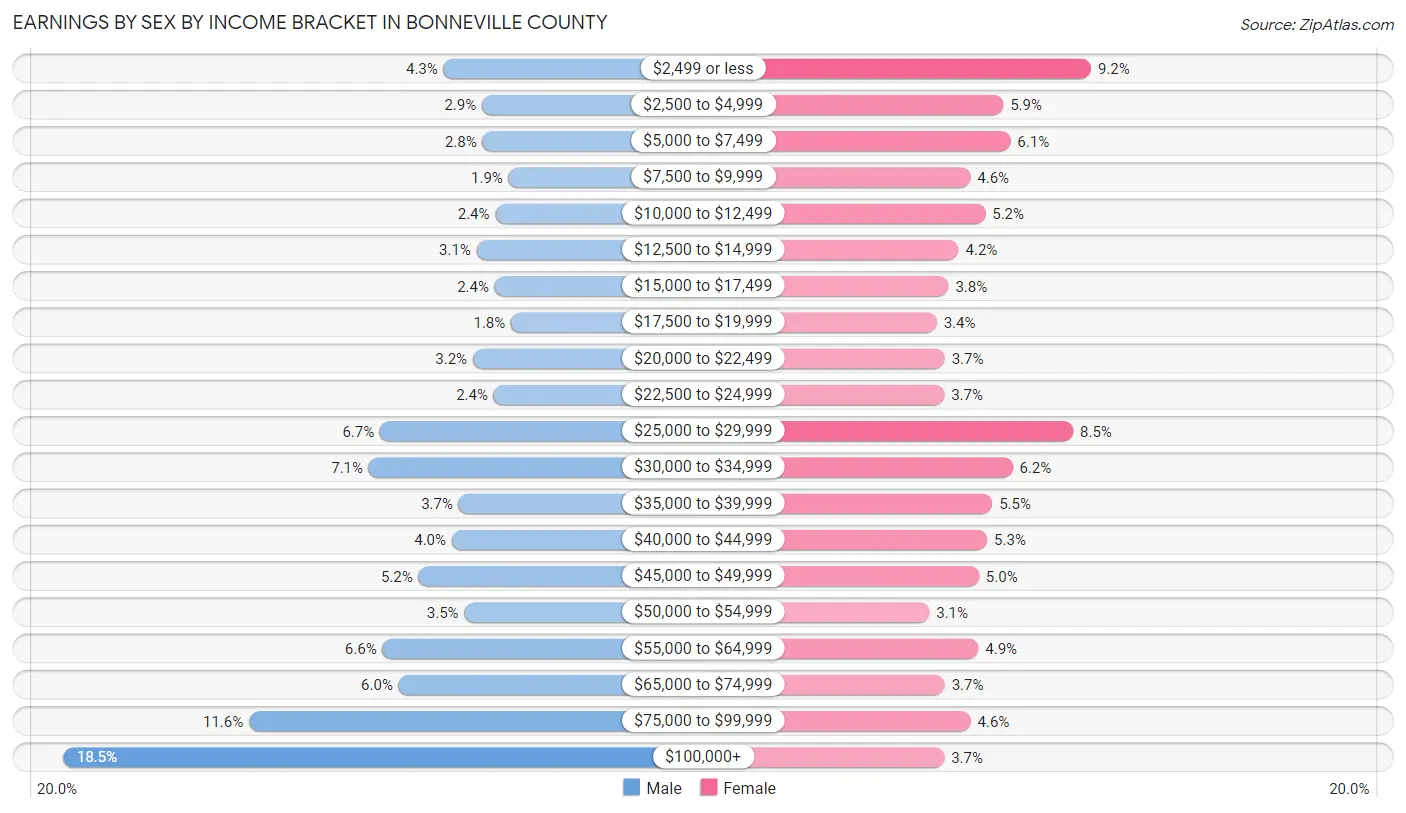
| Income | Male | Female |
| $2,499 or less | 1,482 (4.3%) | 2,607 (9.1%) |
| $2,500 to $4,999 | 986 (2.9%) | 1,669 (5.9%) |
| $5,000 to $7,499 | 979 (2.8%) | 1,746 (6.1%) |
| $7,500 to $9,999 | 640 (1.9%) | 1,319 (4.6%) |
| $10,000 to $12,499 | 815 (2.4%) | 1,479 (5.2%) |
| $12,500 to $14,999 | 1,054 (3.1%) | 1,193 (4.2%) |
| $15,000 to $17,499 | 820 (2.4%) | 1,085 (3.8%) |
| $17,500 to $19,999 | 611 (1.8%) | 960 (3.4%) |
| $20,000 to $22,499 | 1,104 (3.2%) | 1,045 (3.7%) |
| $22,500 to $24,999 | 833 (2.4%) | 1,040 (3.6%) |
| $25,000 to $29,999 | 2,302 (6.7%) | 2,415 (8.5%) |
| $30,000 to $34,999 | 2,447 (7.1%) | 1,770 (6.2%) |
| $35,000 to $39,999 | 1,286 (3.7%) | 1,552 (5.4%) |
| $40,000 to $44,999 | 1,377 (4.0%) | 1,499 (5.3%) |
| $45,000 to $49,999 | 1,807 (5.2%) | 1,409 (5.0%) |
| $50,000 to $54,999 | 1,212 (3.5%) | 879 (3.1%) |
| $55,000 to $64,999 | 2,271 (6.6%) | 1,405 (4.9%) |
| $65,000 to $74,999 | 2,063 (6.0%) | 1,046 (3.7%) |
| $75,000 to $99,999 | 3,997 (11.6%) | 1,322 (4.6%) |
| $100,000+ | 6,387 (18.5%) | 1,040 (3.6%) |
| Total | 34,473 (100.0%) | 28,480 (100.0%) |
Earnings by Sex by Educational Attainment in Bonneville County
Average earnings in Bonneville County are $55,589 for men and $29,396 for women, a difference of 47.1%. Men with an educational attainment of graduate degree enjoy the highest average annual earnings of $110,956, while those with less than high school education earn the least with $34,364. Women with an educational attainment of graduate degree earn the most with the average annual earnings of $56,172, while those with high school diploma education have the smallest earnings of $21,759.
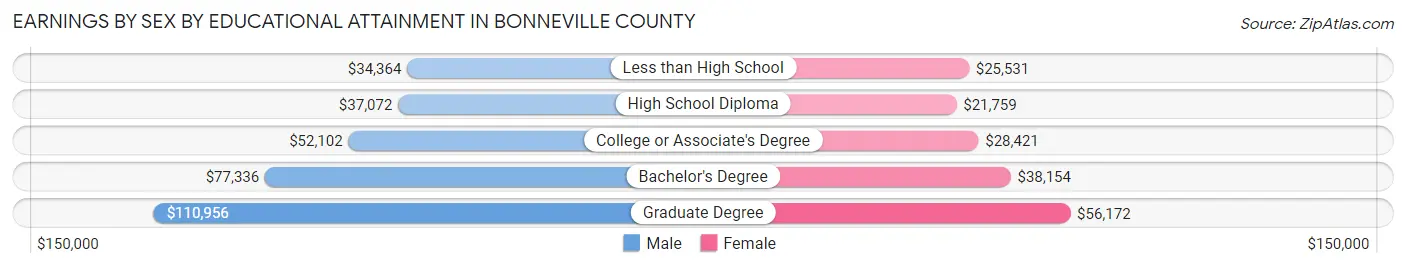
| Educational Attainment | Male Income | Female Income |
| Less than High School | $34,364 | $25,531 |
| High School Diploma | $37,072 | $21,759 |
| College or Associate's Degree | $52,102 | $28,421 |
| Bachelor's Degree | $77,336 | $38,154 |
| Graduate Degree | $110,956 | $56,172 |
| Total | $55,589 | $29,396 |
Family Income in Bonneville County
Family Income Brackets in Bonneville County
According to the Bonneville County family income data, there are 6,411 families falling into the $100,000 to $149,999 income range, which is the most common income bracket and makes up 21.7% of all families. Conversely, the $10,000 to $14,999 income bracket is the least frequent group with only 295 families (1.0%) belonging to this category.
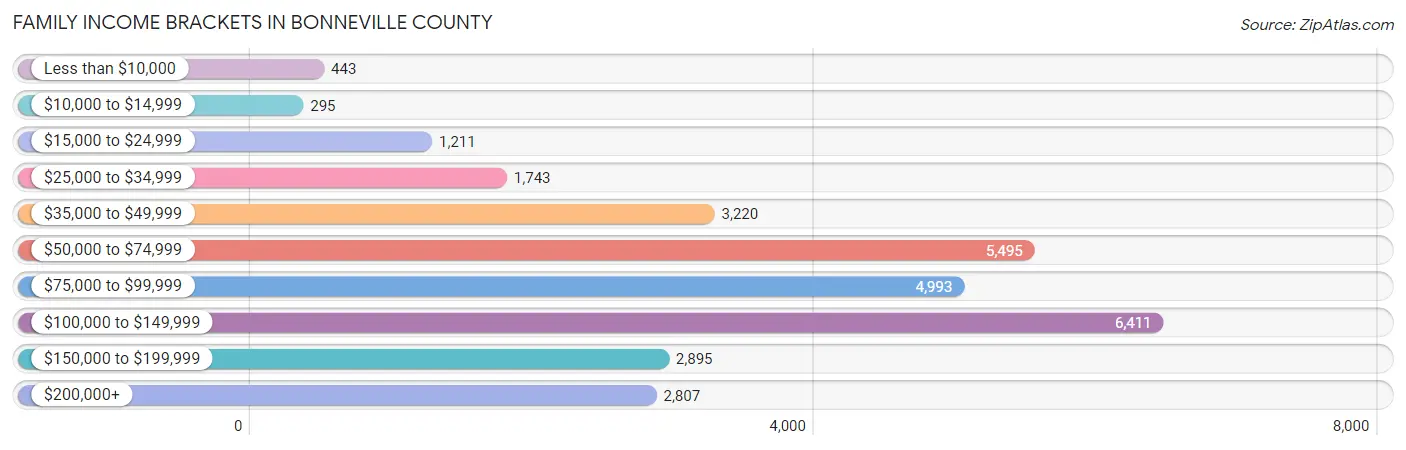
| Income Bracket | # Families | % Families |
| Less than $10,000 | 443 | 1.5% |
| $10,000 to $14,999 | 295 | 1.0% |
| $15,000 to $24,999 | 1,211 | 4.1% |
| $25,000 to $34,999 | 1,743 | 5.9% |
| $35,000 to $49,999 | 3,220 | 10.9% |
| $50,000 to $74,999 | 5,495 | 18.6% |
| $75,000 to $99,999 | 4,993 | 16.9% |
| $100,000 to $149,999 | 6,411 | 21.7% |
| $150,000 to $199,999 | 2,895 | 9.8% |
| $200,000+ | 2,807 | 9.5% |
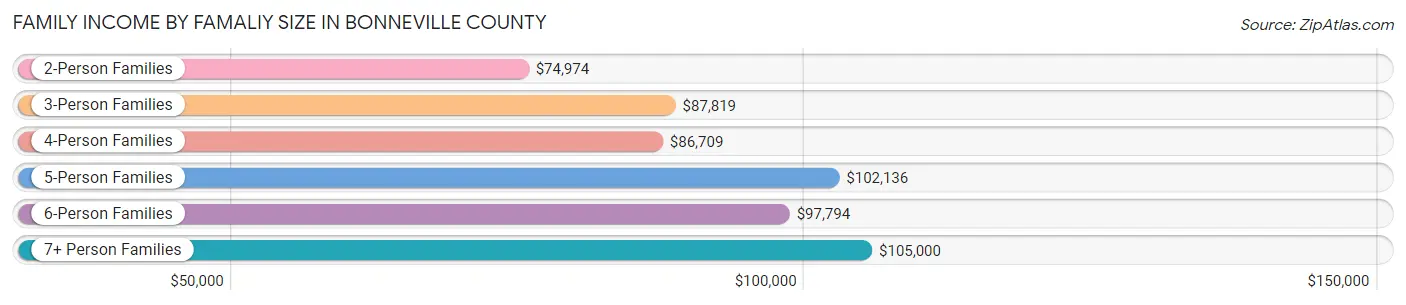
Family Income by Famaliy Size in Bonneville County
7+ person families (1,222 | 4.1%) account for the highest median family income in Bonneville County with $105,000 per family, while 2-person families (12,245 | 41.4%) have the highest median income of $37,487 per family member.
| Income Bracket | # Families | Median Income |
| 2-Person Families | 12,245 (41.4%) | $74,974 |
| 3-Person Families | 6,101 (20.6%) | $87,819 |
| 4-Person Families | 4,658 (15.8%) | $86,709 |
| 5-Person Families | 3,473 (11.7%) | $102,136 |
| 6-Person Families | 1,846 (6.2%) | $97,794 |
| 7+ Person Families | 1,222 (4.1%) | $105,000 |
| Total | 29,545 (100.0%) | $86,252 |
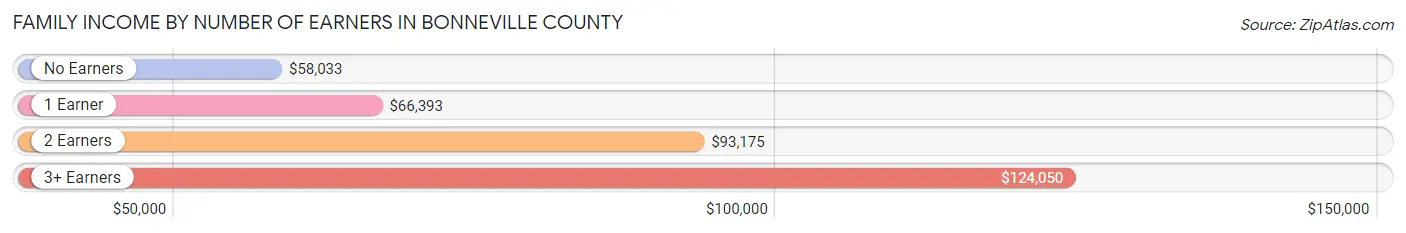
Family Income by Number of Earners in Bonneville County
The median family income in Bonneville County is $86,252, with families comprising 3+ earners (4,006) having the highest median family income of $124,050, while families with no earners (3,825) have the lowest median family income of $58,033, accounting for 13.6% and 13.0% of families, respectively.
| Number of Earners | # Families | Median Income |
| No Earners | 3,825 (13.0%) | $58,033 |
| 1 Earner | 8,880 (30.1%) | $66,393 |
| 2 Earners | 12,834 (43.4%) | $93,175 |
| 3+ Earners | 4,006 (13.6%) | $124,050 |
| Total | 29,545 (100.0%) | $86,252 |
Household Income in Bonneville County
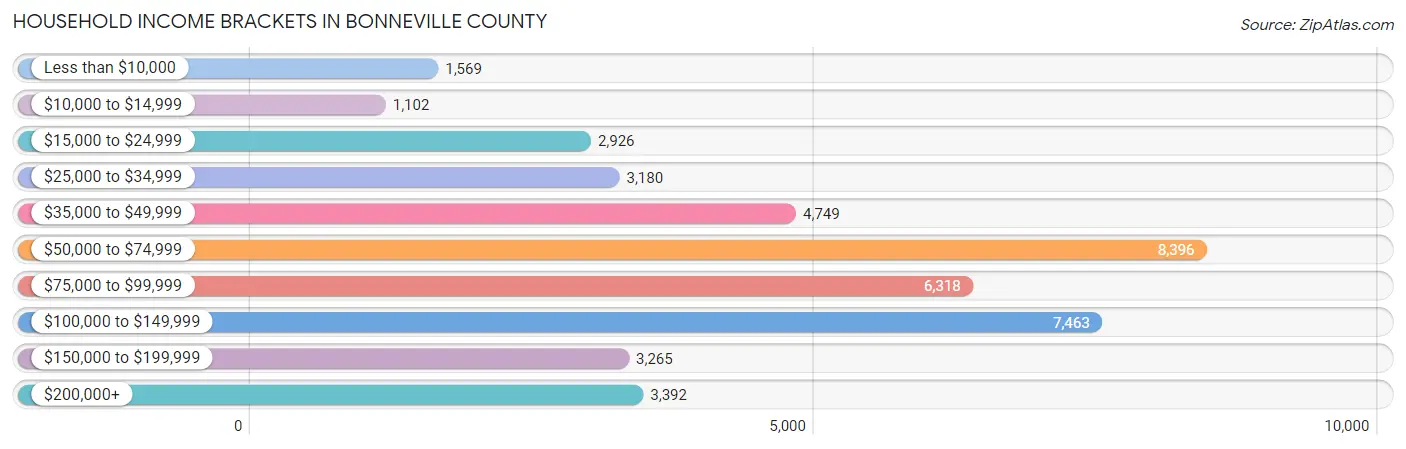
Household Income Brackets in Bonneville County
With 8,396 households falling in the category, the $50,000 to $74,999 income range is the most frequent in Bonneville County, accounting for 19.8% of all households. In contrast, only 1,102 households (2.6%) fall into the $10,000 to $14,999 income bracket, making it the least populous group.
| Income Bracket | # Households | % Households |
| Less than $10,000 | 1,569 | 3.7% |
| $10,000 to $14,999 | 1,102 | 2.6% |
| $15,000 to $24,999 | 2,926 | 6.9% |
| $25,000 to $34,999 | 3,180 | 7.5% |
| $35,000 to $49,999 | 4,749 | 11.2% |
| $50,000 to $74,999 | 8,396 | 19.8% |
| $75,000 to $99,999 | 6,318 | 14.9% |
| $100,000 to $149,999 | 7,463 | 17.6% |
| $150,000 to $199,999 | 3,265 | 7.7% |
| $200,000+ | 3,392 | 8.0% |
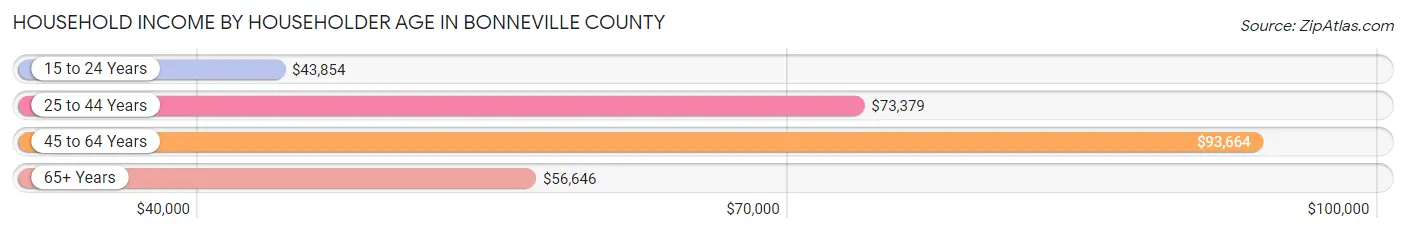
Household Income by Householder Age in Bonneville County
The median household income in Bonneville County is $73,103, with the highest median household income of $93,664 found in the 45 to 64 years age bracket for the primary householder. A total of 13,515 households (31.9%) fall into this category. Meanwhile, the 15 to 24 years age bracket for the primary householder has the lowest median household income of $43,854, with 2,158 households (5.1%) in this group.
| Income Bracket | # Households | Median Income |
| 15 to 24 Years | 2,158 (5.1%) | $43,854 |
| 25 to 44 Years | 15,935 (37.6%) | $73,379 |
| 45 to 64 Years | 13,515 (31.9%) | $93,664 |
| 65+ Years | 10,794 (25.5%) | $56,646 |
| Total | 42,402 (100.0%) | $73,103 |
Poverty in Bonneville County
Income Below Poverty by Sex and Age in Bonneville County
With 7.9% poverty level for males and 11.0% for females among the residents of Bonneville County, 5 year old males and 18 to 24 year old females are the most vulnerable to poverty, with 147 males (14.8%) and 1,035 females (19.4%) in their respective age groups living below the poverty level.
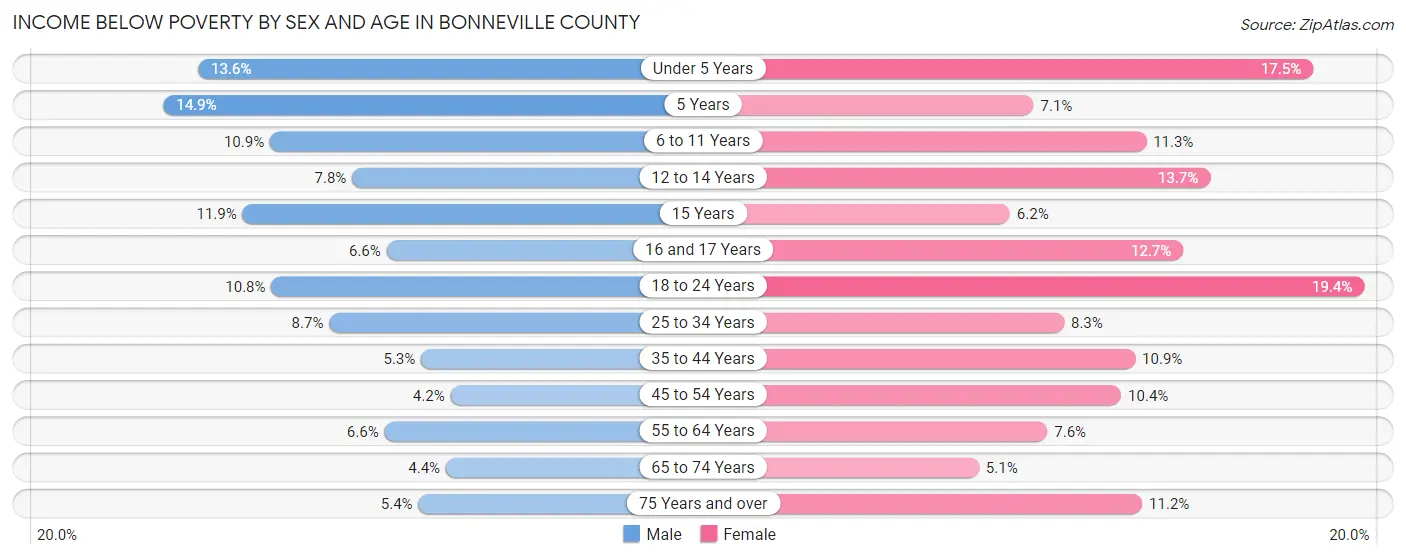
| Age Bracket | Male | Female |
| Under 5 Years | 656 (13.6%) | 818 (17.5%) |
| 5 Years | 147 (14.8%) | 71 (7.1%) |
| 6 to 11 Years | 691 (10.9%) | 707 (11.3%) |
| 12 to 14 Years | 283 (7.8%) | 450 (13.7%) |
| 15 Years | 140 (11.9%) | 66 (6.2%) |
| 16 and 17 Years | 132 (6.6%) | 258 (12.7%) |
| 18 to 24 Years | 595 (10.8%) | 1,035 (19.4%) |
| 25 to 34 Years | 734 (8.7%) | 688 (8.3%) |
| 35 to 44 Years | 436 (5.3%) | 884 (10.9%) |
| 45 to 54 Years | 272 (4.2%) | 622 (10.4%) |
| 55 to 64 Years | 442 (6.6%) | 471 (7.6%) |
| 65 to 74 Years | 202 (4.4%) | 264 (5.1%) |
| 75 Years and over | 151 (5.4%) | 426 (11.2%) |
| Total | 4,881 (7.9%) | 6,760 (11.0%) |
Income Above Poverty by Sex and Age in Bonneville County
According to the poverty statistics in Bonneville County, males aged 45 to 54 years and females aged 65 to 74 years are the age groups that are most secure financially, with 95.8% of males and 94.9% of females in these age groups living above the poverty line.
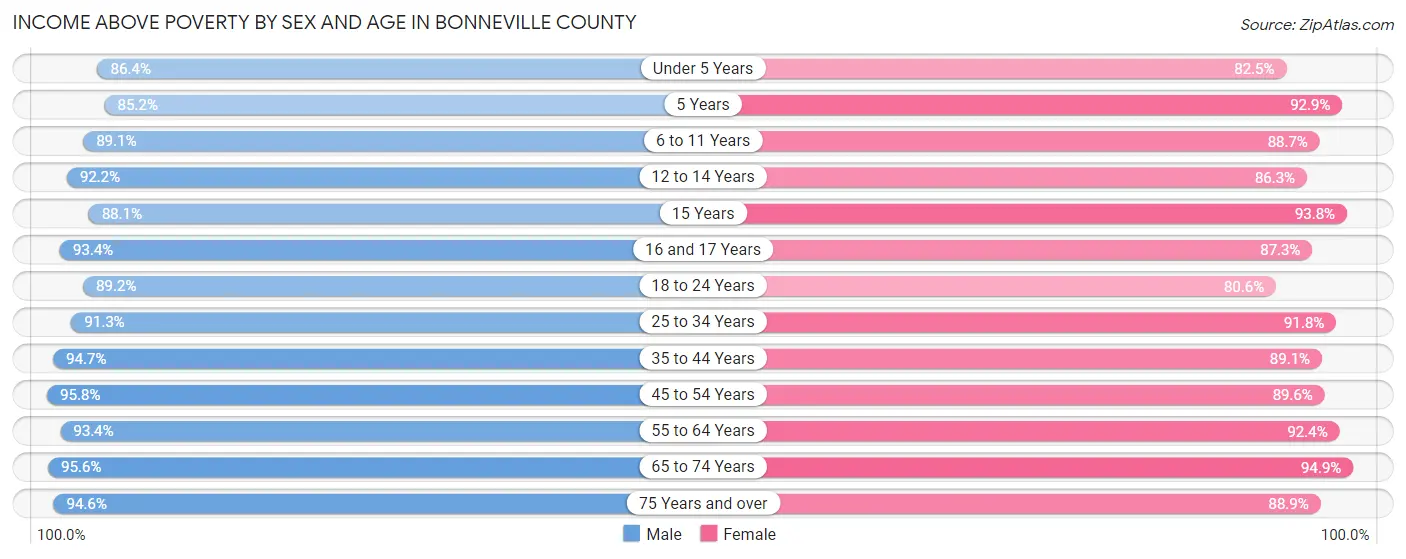
| Age Bracket | Male | Female |
| Under 5 Years | 4,181 (86.4%) | 3,860 (82.5%) |
| 5 Years | 843 (85.2%) | 926 (92.9%) |
| 6 to 11 Years | 5,657 (89.1%) | 5,552 (88.7%) |
| 12 to 14 Years | 3,328 (92.2%) | 2,841 (86.3%) |
| 15 Years | 1,035 (88.1%) | 992 (93.8%) |
| 16 and 17 Years | 1,881 (93.4%) | 1,779 (87.3%) |
| 18 to 24 Years | 4,894 (89.2%) | 4,302 (80.6%) |
| 25 to 34 Years | 7,710 (91.3%) | 7,655 (91.7%) |
| 35 to 44 Years | 7,828 (94.7%) | 7,230 (89.1%) |
| 45 to 54 Years | 6,227 (95.8%) | 5,376 (89.6%) |
| 55 to 64 Years | 6,214 (93.4%) | 5,700 (92.4%) |
| 65 to 74 Years | 4,430 (95.6%) | 4,922 (94.9%) |
| 75 Years and over | 2,658 (94.6%) | 3,395 (88.8%) |
| Total | 56,886 (92.1%) | 54,530 (89.0%) |
Income Below Poverty Among Married-Couple Families in Bonneville County
The poverty statistics for married-couple families in Bonneville County show that 3.2% or 738 of the total 23,379 families live below the poverty line. Families with 5 or more children have the highest poverty rate of 10.3%, comprising of 64 families. On the other hand, families with no children have the lowest poverty rate of 2.0%, which includes 231 families.
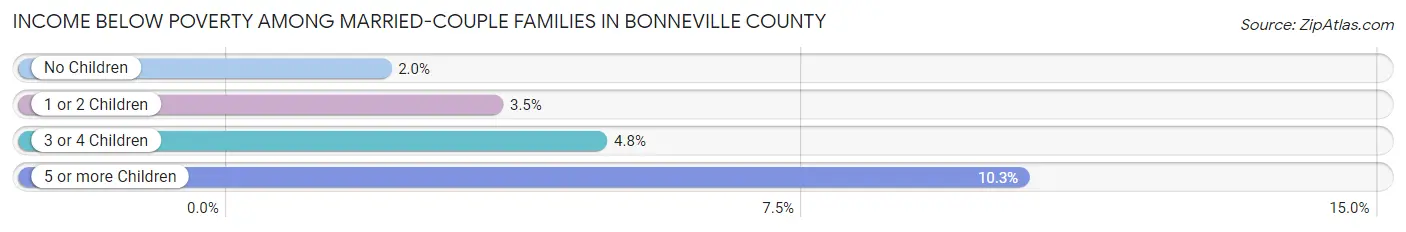
| Children | Above Poverty | Below Poverty |
| No Children | 11,323 (98.0%) | 231 (2.0%) |
| 1 or 2 Children | 6,891 (96.5%) | 247 (3.5%) |
| 3 or 4 Children | 3,872 (95.2%) | 196 (4.8%) |
| 5 or more Children | 555 (89.7%) | 64 (10.3%) |
| Total | 22,641 (96.8%) | 738 (3.2%) |
Income Below Poverty Among Single-Parent Households in Bonneville County
According to the poverty data in Bonneville County, 7.6% or 128 single-father households and 23.1% or 1,034 single-mother households are living below the poverty line. Among single-father households, those with 1 or 2 children have the highest poverty rate, with 94 households (11.2%) experiencing poverty. Likewise, among single-mother households, those with 3 or 4 children have the highest poverty rate, with 403 households (60.7%) falling below the poverty line.
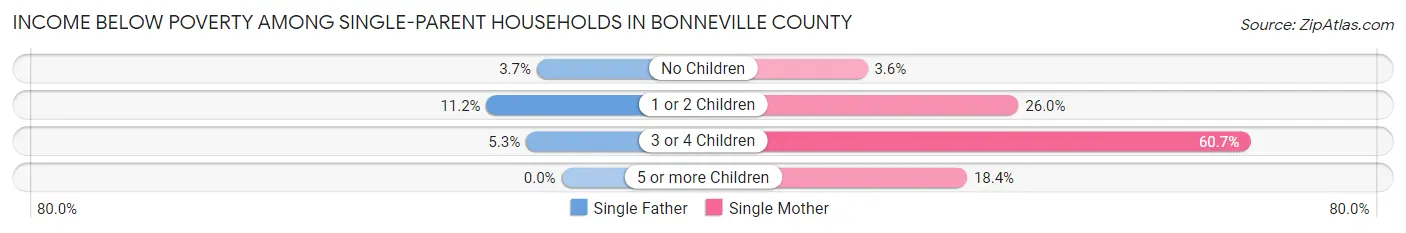
| Children | Single Father | Single Mother |
| No Children | 25 (3.7%) | 54 (3.5%) |
| 1 or 2 Children | 94 (11.2%) | 532 (26.0%) |
| 3 or 4 Children | 9 (5.3%) | 403 (60.7%) |
| 5 or more Children | 0 (0.0%) | 45 (18.4%) |
| Total | 128 (7.6%) | 1,034 (23.1%) |
Income Below Poverty Among Married-Couple vs Single-Parent Households in Bonneville County
The poverty data for Bonneville County shows that 738 of the married-couple family households (3.2%) and 1,162 of the single-parent households (18.9%) are living below the poverty level. Within the married-couple family households, those with 5 or more children have the highest poverty rate, with 64 households (10.3%) falling below the poverty line. Among the single-parent households, those with 3 or 4 children have the highest poverty rate, with 412 household (49.4%) living below poverty.
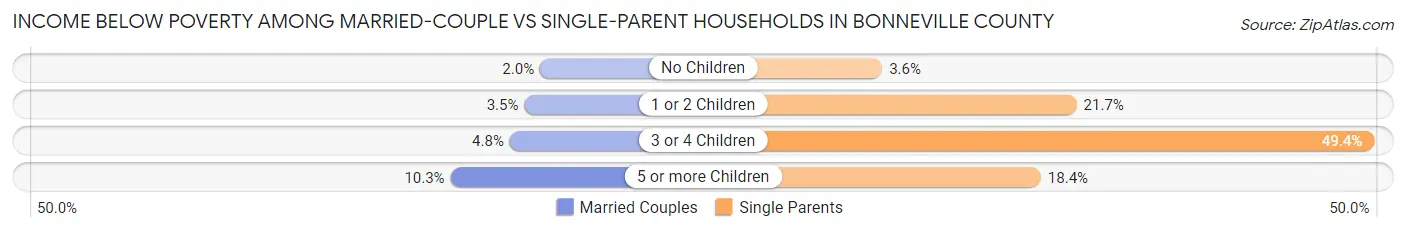
| Children | Married-Couple Families | Single-Parent Households |
| No Children | 231 (2.0%) | 79 (3.6%) |
| 1 or 2 Children | 247 (3.5%) | 626 (21.7%) |
| 3 or 4 Children | 196 (4.8%) | 412 (49.4%) |
| 5 or more Children | 64 (10.3%) | 45 (18.4%) |
| Total | 738 (3.2%) | 1,162 (18.9%) |
Employment Characteristics in Bonneville County
Employment by Class of Employer in Bonneville County
Among the 55,030 employed individuals in Bonneville County, private company employees (37,054 | 67.3%), local government employees (3,701 | 6.7%), and not-for-profit organizations (3,332 | 6.0%) make up the most common classes of employment.
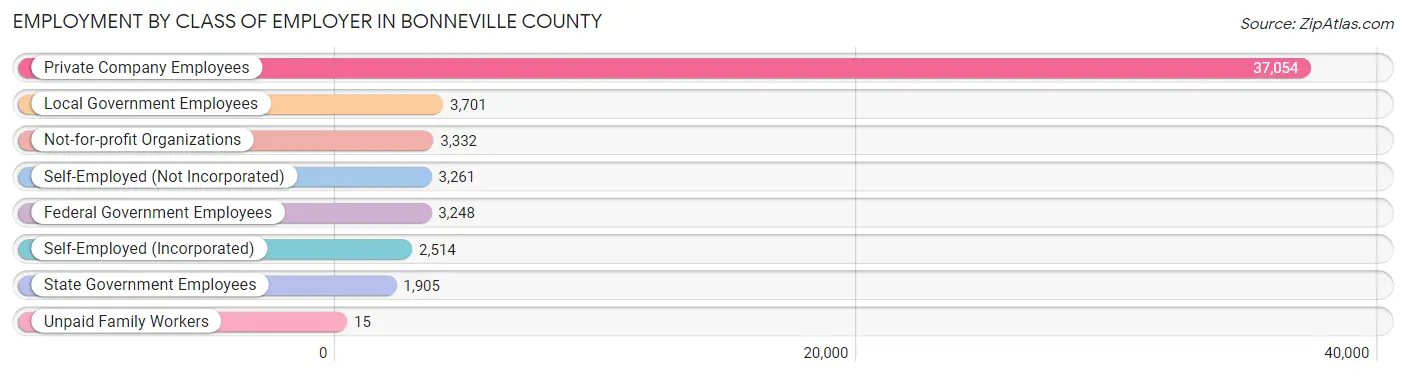
| Employer Class | # Employees | % Employees |
| Private Company Employees | 37,054 | 67.3% |
| Self-Employed (Incorporated) | 2,514 | 4.6% |
| Self-Employed (Not Incorporated) | 3,261 | 5.9% |
| Not-for-profit Organizations | 3,332 | 6.0% |
| Local Government Employees | 3,701 | 6.7% |
| State Government Employees | 1,905 | 3.5% |
| Federal Government Employees | 3,248 | 5.9% |
| Unpaid Family Workers | 15 | 0.0% |
| Total | 55,030 | 100.0% |
Employment Status by Age in Bonneville County
According to the labor force statistics for Bonneville County, out of the total population over 16 years of age (90,945), 64.8% or 58,932 individuals are in the labor force, with 4.6% or 2,711 of them unemployed. The age group with the highest labor force participation rate is 20 to 24 years, with 83.5% or 6,585 individuals in the labor force. Within the labor force, the 16 to 19 years age range has the highest percentage of unemployed individuals, with 14.8% or 559 of them being unemployed.
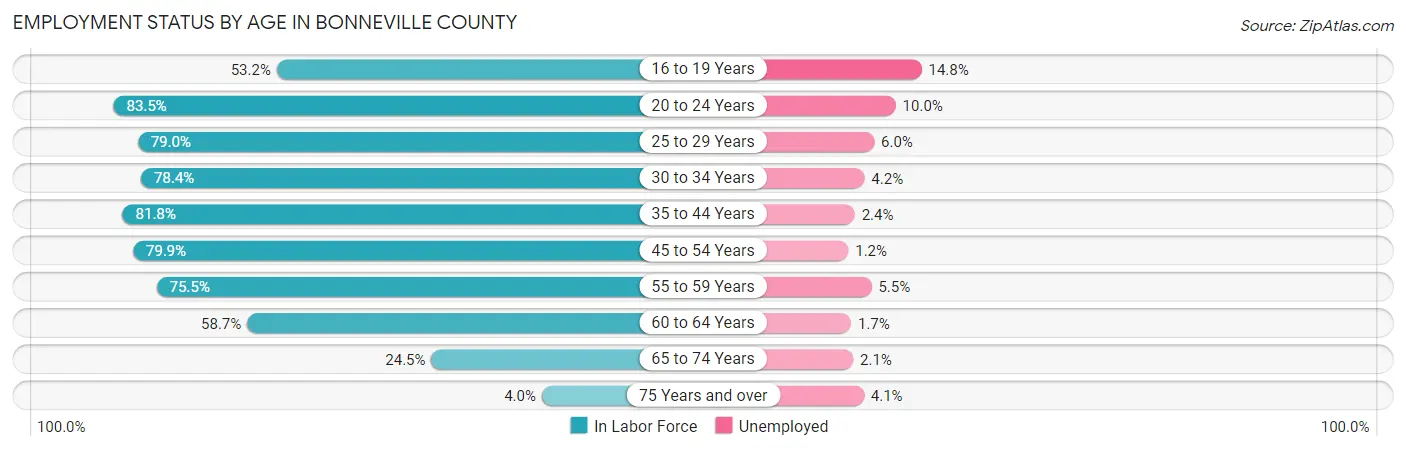
| Age Bracket | In Labor Force | Unemployed |
| 16 to 19 Years | 3,777 (53.2%) | 559 (14.8%) |
| 20 to 24 Years | 6,585 (83.5%) | 658 (10.0%) |
| 25 to 29 Years | 6,497 (79.0%) | 390 (6.0%) |
| 30 to 34 Years | 6,829 (78.4%) | 287 (4.2%) |
| 35 to 44 Years | 13,661 (81.8%) | 328 (2.4%) |
| 45 to 54 Years | 10,148 (79.9%) | 122 (1.2%) |
| 55 to 59 Years | 4,939 (75.5%) | 272 (5.5%) |
| 60 to 64 Years | 3,779 (58.7%) | 64 (1.7%) |
| 65 to 74 Years | 2,428 (24.5%) | 51 (2.1%) |
| 75 Years and over | 269 (4.0%) | 11 (4.1%) |
| Total | 58,932 (64.8%) | 2,711 (4.6%) |
Employment Status by Educational Attainment in Bonneville County
According to labor force statistics for Bonneville County, 77.3% of individuals (45,852) out of the total population between 25 and 64 years of age (59,317) are in the labor force, with 3.2% or 1,467 of them being unemployed. The group with the highest labor force participation rate are those with the educational attainment of bachelor's degree or higher, with 82.8% or 15,723 individuals in the labor force. Within the labor force, individuals with less than high school education have the highest percentage of unemployment, with 5.0% or 171 of them being unemployed.
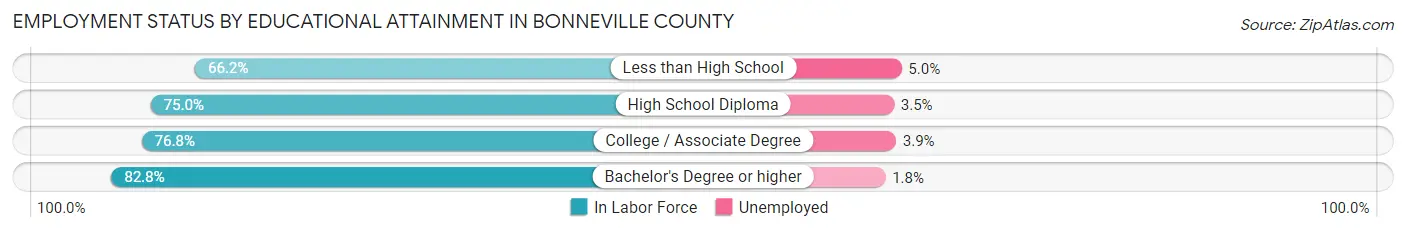
| Educational Attainment | In Labor Force | Unemployed |
| Less than High School | 3,428 (66.2%) | 259 (5.0%) |
| High School Diploma | 10,998 (75.0%) | 513 (3.5%) |
| College / Associate Degree | 15,732 (76.8%) | 799 (3.9%) |
| Bachelor's Degree or higher | 15,723 (82.8%) | 342 (1.8%) |
| Total | 45,852 (77.3%) | 1,898 (3.2%) |
Employment Occupations by Sex in Bonneville County
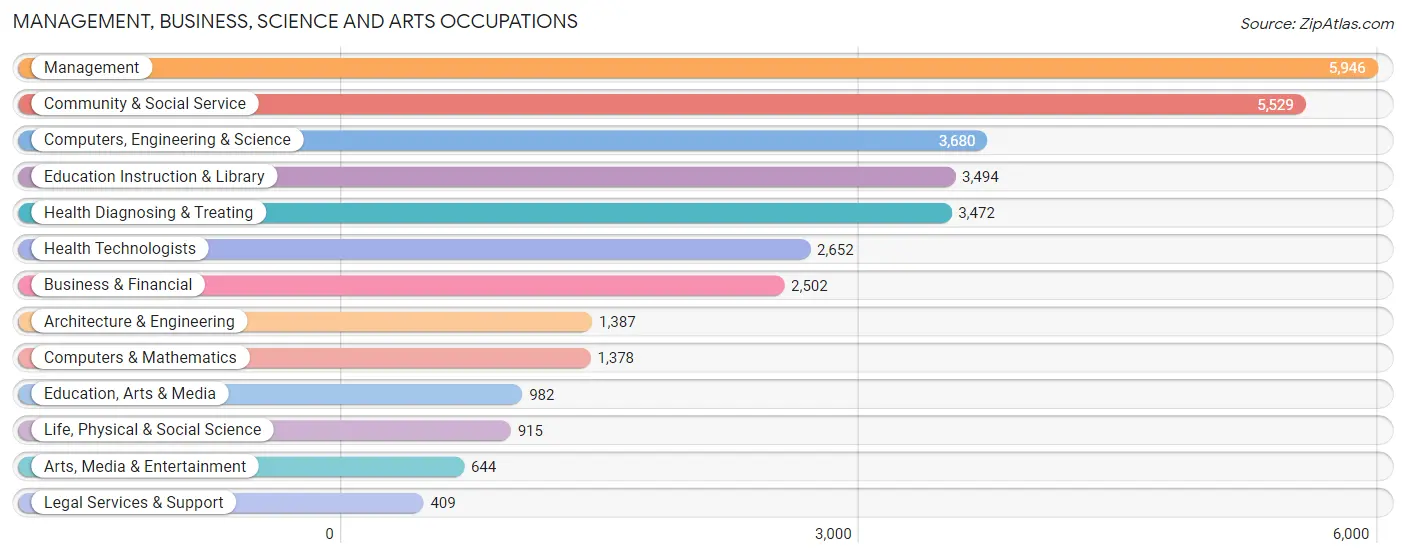
Management, Business, Science and Arts Occupations
The most common Management, Business, Science and Arts occupations in Bonneville County are Management (5,946 | 10.6%), Community & Social Service (5,529 | 9.9%), Computers, Engineering & Science (3,680 | 6.6%), Education Instruction & Library (3,494 | 6.2%), and Health Diagnosing & Treating (3,472 | 6.2%).
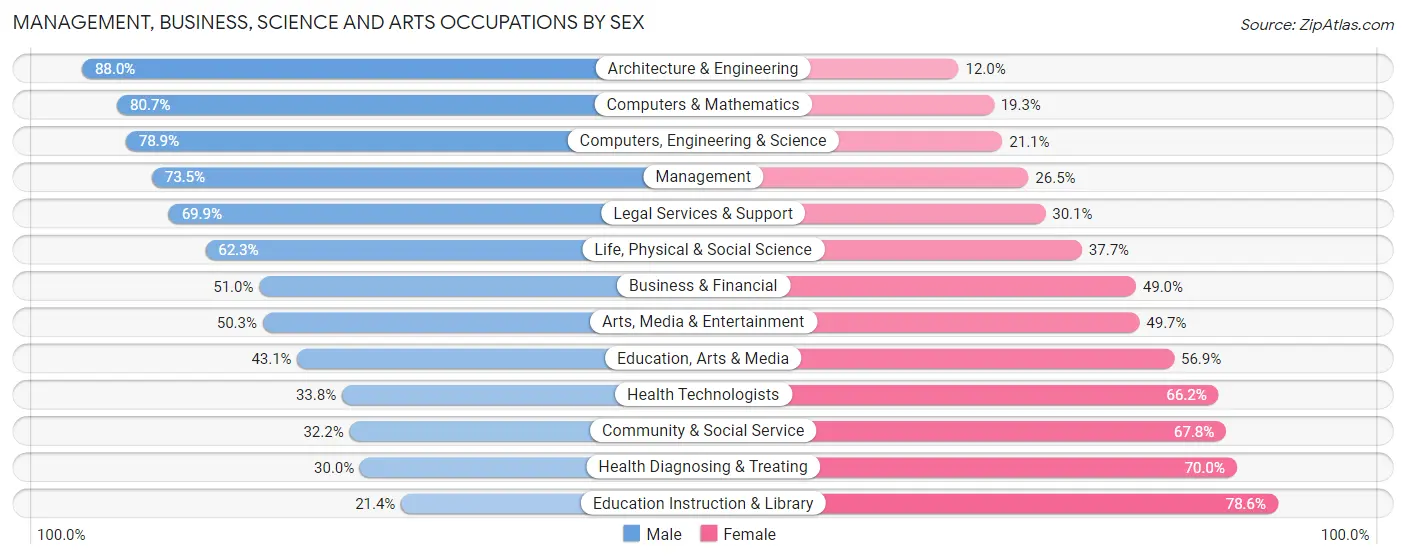
Management, Business, Science and Arts Occupations by Sex
Within the Management, Business, Science and Arts occupations in Bonneville County, the most male-oriented occupations are Architecture & Engineering (88.0%), Computers & Mathematics (80.7%), and Computers, Engineering & Science (78.9%), while the most female-oriented occupations are Education Instruction & Library (78.6%), Health Diagnosing & Treating (70.0%), and Community & Social Service (67.8%).
| Occupation | Male | Female |
| Management | 4,368 (73.5%) | 1,578 (26.5%) |
| Business & Financial | 1,277 (51.0%) | 1,225 (49.0%) |
| Computers, Engineering & Science | 2,903 (78.9%) | 777 (21.1%) |
| Computers & Mathematics | 1,112 (80.7%) | 266 (19.3%) |
| Architecture & Engineering | 1,221 (88.0%) | 166 (12.0%) |
| Life, Physical & Social Science | 570 (62.3%) | 345 (37.7%) |
| Community & Social Service | 1,782 (32.2%) | 3,747 (67.8%) |
| Education, Arts & Media | 423 (43.1%) | 559 (56.9%) |
| Legal Services & Support | 286 (69.9%) | 123 (30.1%) |
| Education Instruction & Library | 749 (21.4%) | 2,745 (78.6%) |
| Arts, Media & Entertainment | 324 (50.3%) | 320 (49.7%) |
| Health Diagnosing & Treating | 1,042 (30.0%) | 2,430 (70.0%) |
| Health Technologists | 896 (33.8%) | 1,756 (66.2%) |
| Total (Category) | 11,372 (53.8%) | 9,757 (46.2%) |
| Total (Overall) | 30,935 (55.2%) | 25,080 (44.8%) |
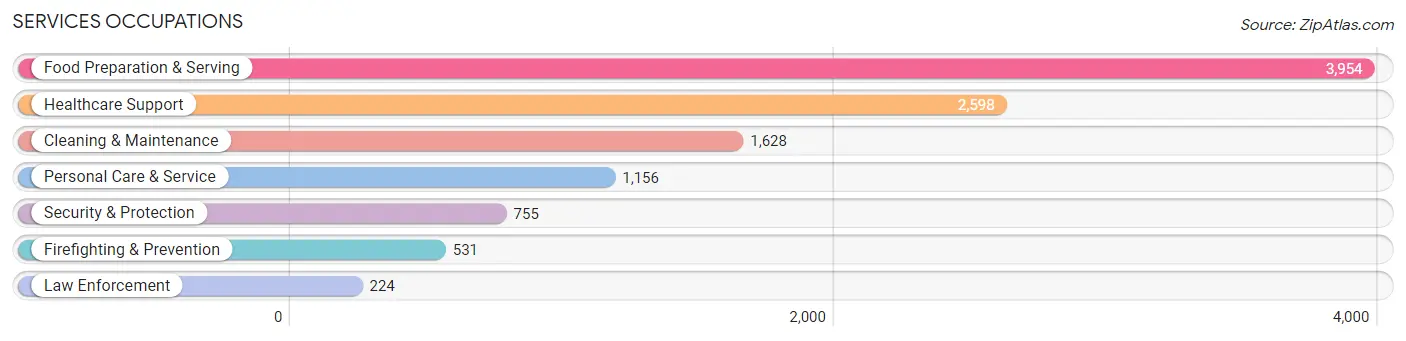
Services Occupations
The most common Services occupations in Bonneville County are Food Preparation & Serving (3,954 | 7.1%), Healthcare Support (2,598 | 4.6%), Cleaning & Maintenance (1,628 | 2.9%), Personal Care & Service (1,156 | 2.1%), and Security & Protection (755 | 1.3%).
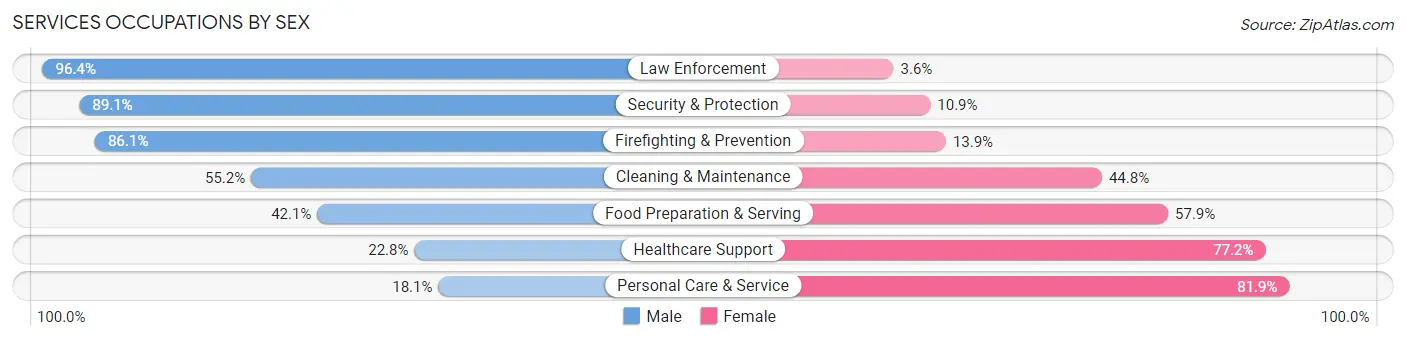
Services Occupations by Sex
Within the Services occupations in Bonneville County, the most male-oriented occupations are Law Enforcement (96.4%), Security & Protection (89.1%), and Firefighting & Prevention (86.1%), while the most female-oriented occupations are Personal Care & Service (81.9%), Healthcare Support (77.2%), and Food Preparation & Serving (57.9%).
| Occupation | Male | Female |
| Healthcare Support | 593 (22.8%) | 2,005 (77.2%) |
| Security & Protection | 673 (89.1%) | 82 (10.9%) |
| Firefighting & Prevention | 457 (86.1%) | 74 (13.9%) |
| Law Enforcement | 216 (96.4%) | 8 (3.6%) |
| Food Preparation & Serving | 1,663 (42.1%) | 2,291 (57.9%) |
| Cleaning & Maintenance | 898 (55.2%) | 730 (44.8%) |
| Personal Care & Service | 209 (18.1%) | 947 (81.9%) |
| Total (Category) | 4,036 (40.0%) | 6,055 (60.0%) |
| Total (Overall) | 30,935 (55.2%) | 25,080 (44.8%) |
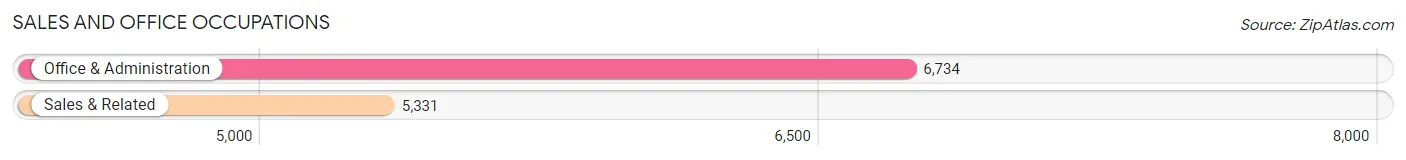
Sales and Office Occupations
The most common Sales and Office occupations in Bonneville County are Office & Administration (6,734 | 12.0%), and Sales & Related (5,331 | 9.5%).
Sales and Office Occupations by Sex
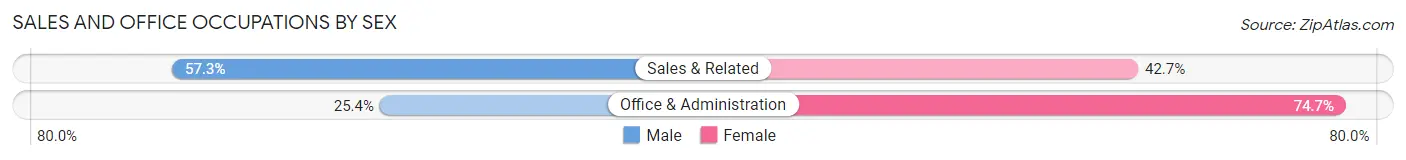
| Occupation | Male | Female |
| Sales & Related | 3,055 (57.3%) | 2,276 (42.7%) |
| Office & Administration | 1,707 (25.4%) | 5,027 (74.7%) |
| Total (Category) | 4,762 (39.5%) | 7,303 (60.5%) |
| Total (Overall) | 30,935 (55.2%) | 25,080 (44.8%) |
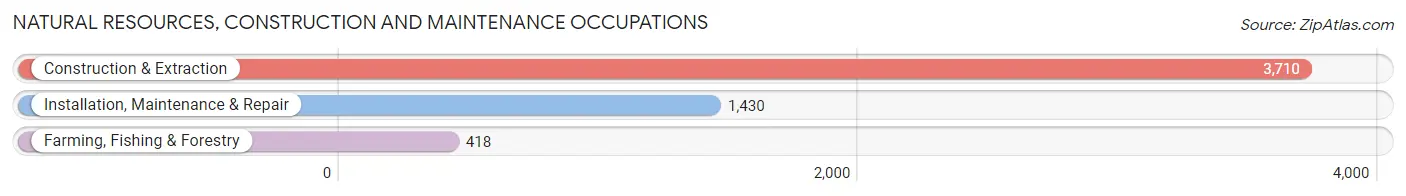
Natural Resources, Construction and Maintenance Occupations
The most common Natural Resources, Construction and Maintenance occupations in Bonneville County are Construction & Extraction (3,710 | 6.6%), Installation, Maintenance & Repair (1,430 | 2.5%), and Farming, Fishing & Forestry (418 | 0.7%).
Natural Resources, Construction and Maintenance Occupations by Sex
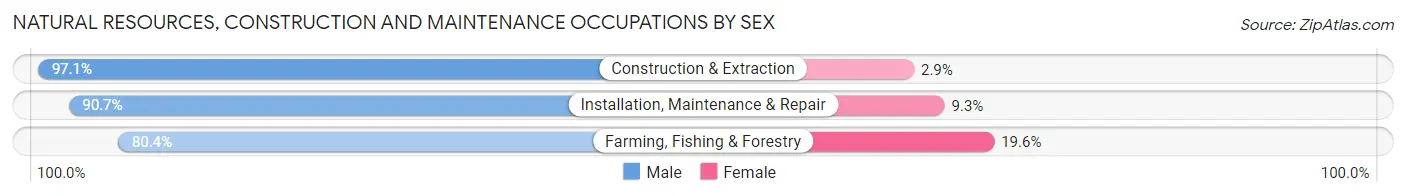
| Occupation | Male | Female |
| Farming, Fishing & Forestry | 336 (80.4%) | 82 (19.6%) |
| Construction & Extraction | 3,601 (97.1%) | 109 (2.9%) |
| Installation, Maintenance & Repair | 1,297 (90.7%) | 133 (9.3%) |
| Total (Category) | 5,234 (94.2%) | 324 (5.8%) |
| Total (Overall) | 30,935 (55.2%) | 25,080 (44.8%) |
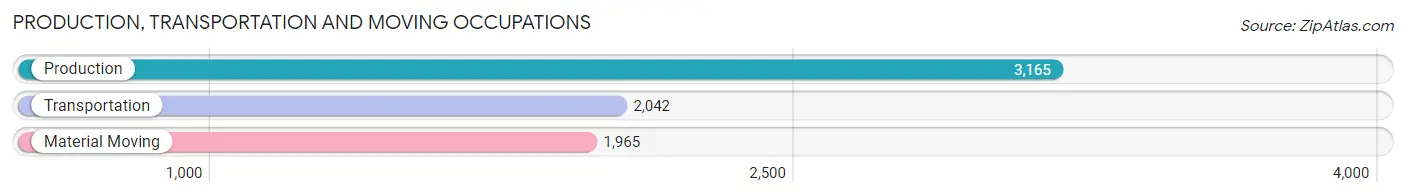
Production, Transportation and Moving Occupations
The most common Production, Transportation and Moving occupations in Bonneville County are Production (3,165 | 5.7%), Transportation (2,042 | 3.6%), and Material Moving (1,965 | 3.5%).
Production, Transportation and Moving Occupations by Sex
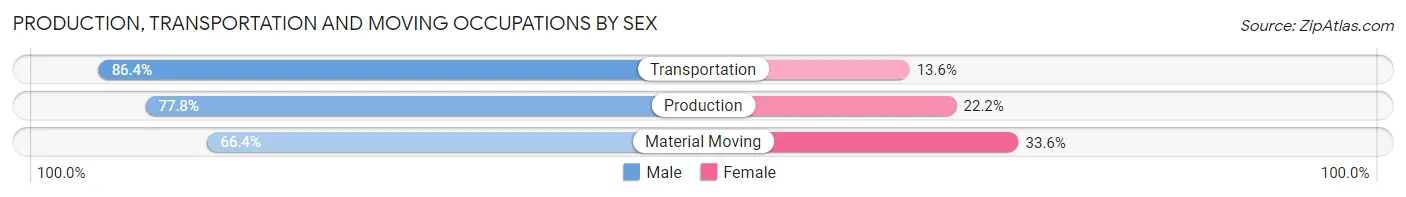
| Occupation | Male | Female |
| Production | 2,462 (77.8%) | 703 (22.2%) |
| Transportation | 1,764 (86.4%) | 278 (13.6%) |
| Material Moving | 1,305 (66.4%) | 660 (33.6%) |
| Total (Category) | 5,531 (77.1%) | 1,641 (22.9%) |
| Total (Overall) | 30,935 (55.2%) | 25,080 (44.8%) |
Employment Industries by Sex in Bonneville County
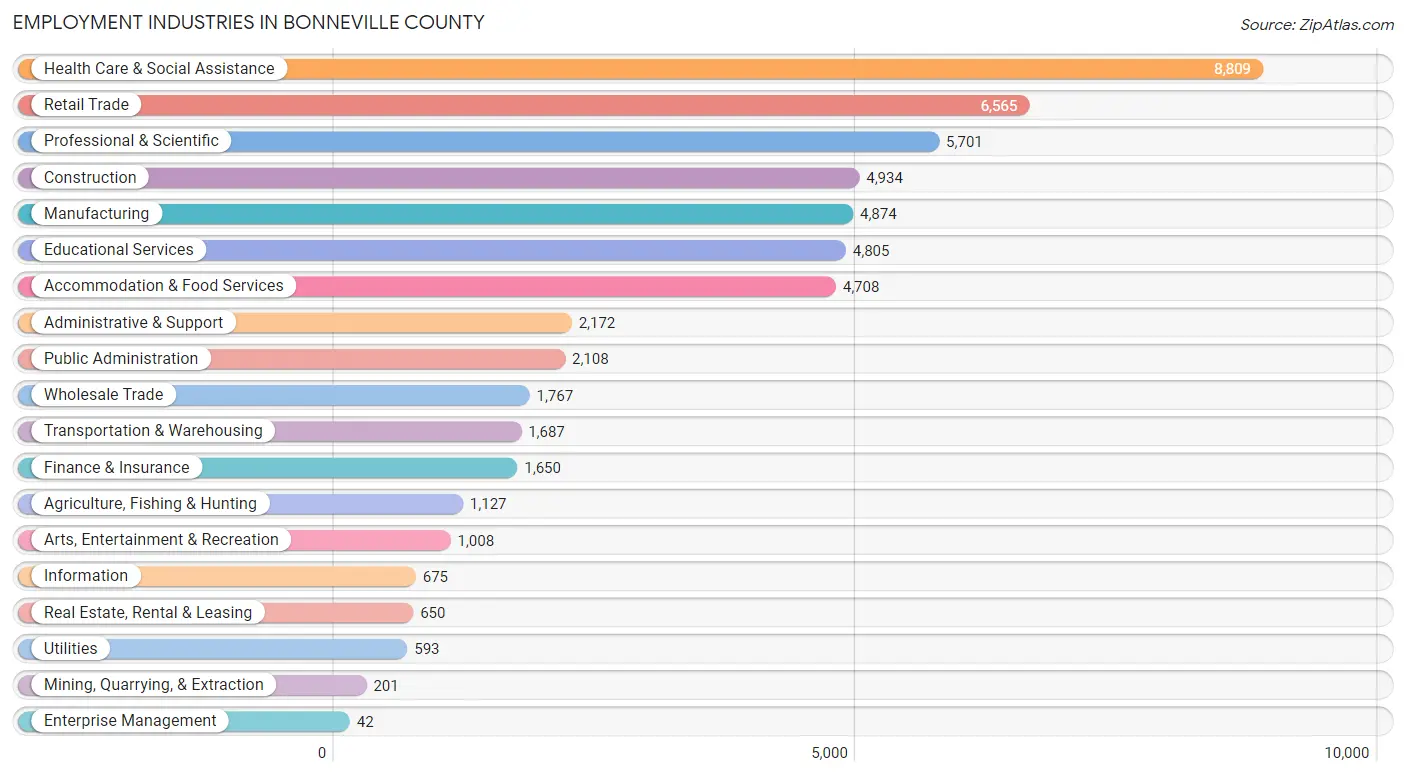
Employment Industries in Bonneville County
The major employment industries in Bonneville County include Health Care & Social Assistance (8,809 | 15.7%), Retail Trade (6,565 | 11.7%), Professional & Scientific (5,701 | 10.2%), Construction (4,934 | 8.8%), and Manufacturing (4,874 | 8.7%).
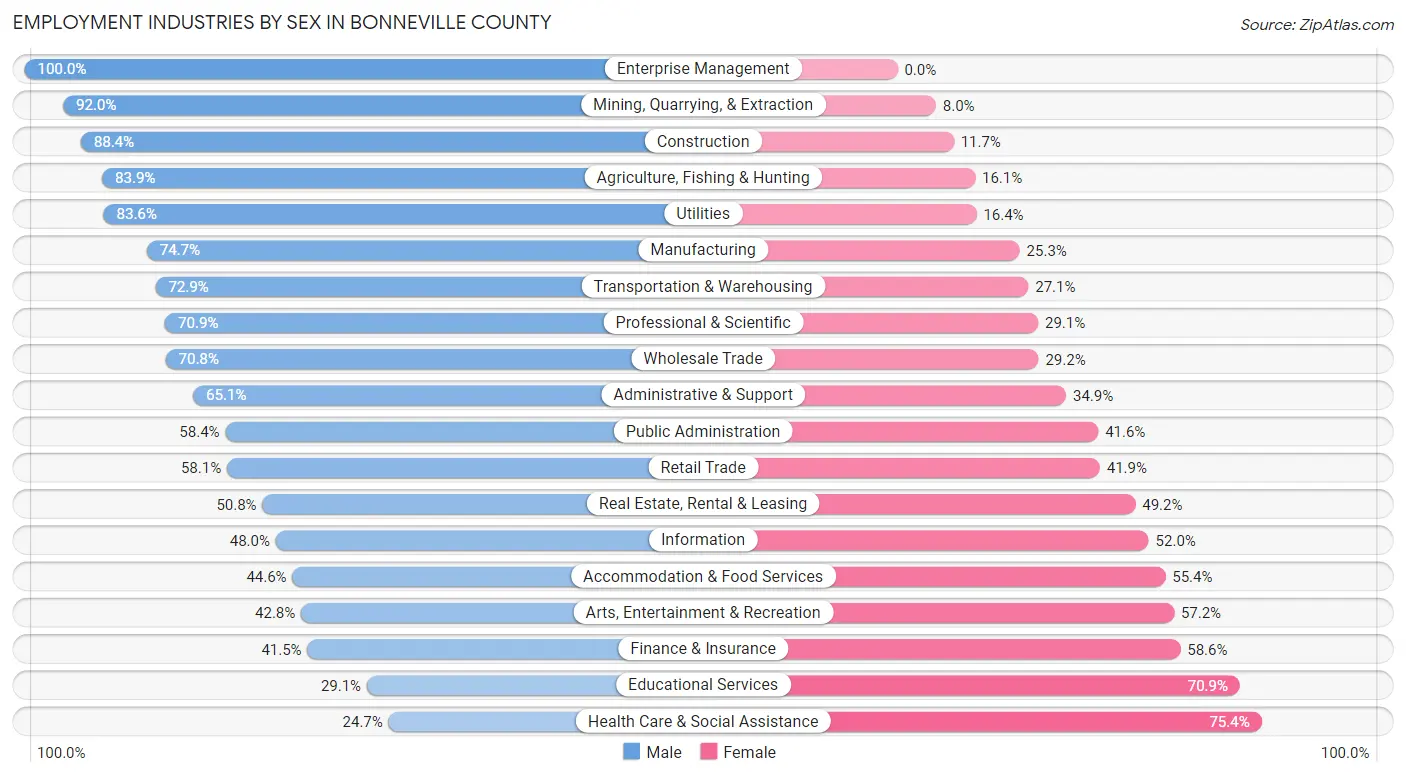
Employment Industries by Sex in Bonneville County
The Bonneville County industries that see more men than women are Enterprise Management (100.0%), Mining, Quarrying, & Extraction (92.0%), and Construction (88.3%), whereas the industries that tend to have a higher number of women are Health Care & Social Assistance (75.3%), Educational Services (70.9%), and Finance & Insurance (58.6%).
| Industry | Male | Female |
| Agriculture, Fishing & Hunting | 946 (83.9%) | 181 (16.1%) |
| Mining, Quarrying, & Extraction | 185 (92.0%) | 16 (8.0%) |
| Construction | 4,359 (88.3%) | 575 (11.7%) |
| Manufacturing | 3,641 (74.7%) | 1,233 (25.3%) |
| Wholesale Trade | 1,251 (70.8%) | 516 (29.2%) |
| Retail Trade | 3,815 (58.1%) | 2,750 (41.9%) |
| Transportation & Warehousing | 1,230 (72.9%) | 457 (27.1%) |
| Utilities | 496 (83.6%) | 97 (16.4%) |
| Information | 324 (48.0%) | 351 (52.0%) |
| Finance & Insurance | 684 (41.4%) | 966 (58.6%) |
| Real Estate, Rental & Leasing | 330 (50.8%) | 320 (49.2%) |
| Professional & Scientific | 4,042 (70.9%) | 1,659 (29.1%) |
| Enterprise Management | 42 (100.0%) | 0 (0.0%) |
| Administrative & Support | 1,414 (65.1%) | 758 (34.9%) |
| Educational Services | 1,400 (29.1%) | 3,405 (70.9%) |
| Health Care & Social Assistance | 2,171 (24.6%) | 6,638 (75.3%) |
| Arts, Entertainment & Recreation | 431 (42.8%) | 577 (57.2%) |
| Accommodation & Food Services | 2,098 (44.6%) | 2,610 (55.4%) |
| Public Administration | 1,232 (58.4%) | 876 (41.6%) |
| Total | 30,935 (55.2%) | 25,080 (44.8%) |
Education in Bonneville County
School Enrollment in Bonneville County
The most common levels of schooling among the 35,677 students in Bonneville County are middle school (8,884 | 24.9%), elementary school (8,747 | 24.5%), and high school (8,021 | 22.5%).
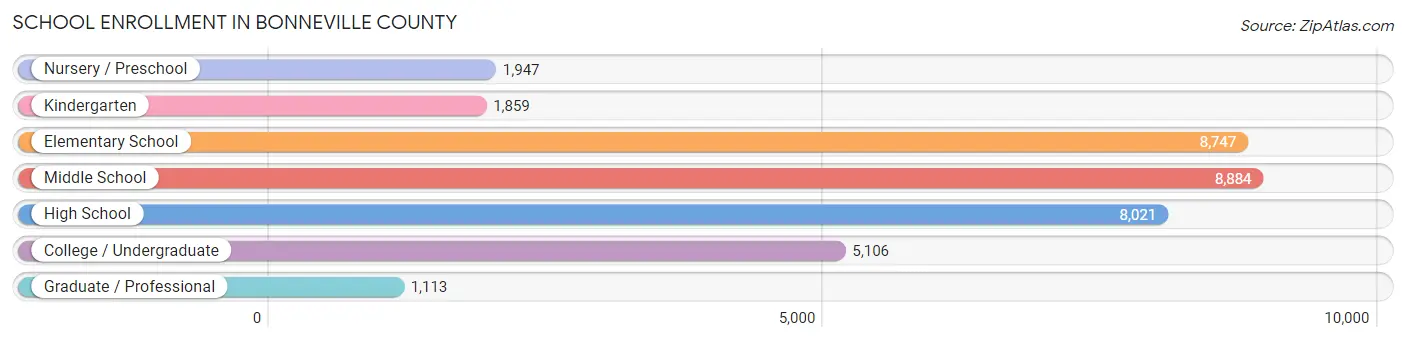
| School Level | # Students | % Students |
| Nursery / Preschool | 1,947 | 5.5% |
| Kindergarten | 1,859 | 5.2% |
| Elementary School | 8,747 | 24.5% |
| Middle School | 8,884 | 24.9% |
| High School | 8,021 | 22.5% |
| College / Undergraduate | 5,106 | 14.3% |
| Graduate / Professional | 1,113 | 3.1% |
| Total | 35,677 | 100.0% |
School Enrollment by Age by Funding Source in Bonneville County
Out of a total of 35,677 students who are enrolled in schools in Bonneville County, 5,423 (15.2%) attend a private institution, while the remaining 30,254 (84.8%) are enrolled in public schools. The age group of 3 to 4 year olds has the highest likelihood of being enrolled in private schools, with 628 (46.6% in the age bracket) enrolled. Conversely, the age group of 15 to 17 year olds has the lowest likelihood of being enrolled in a private school, with 5,394 (94.8% in the age bracket) attending a public institution.
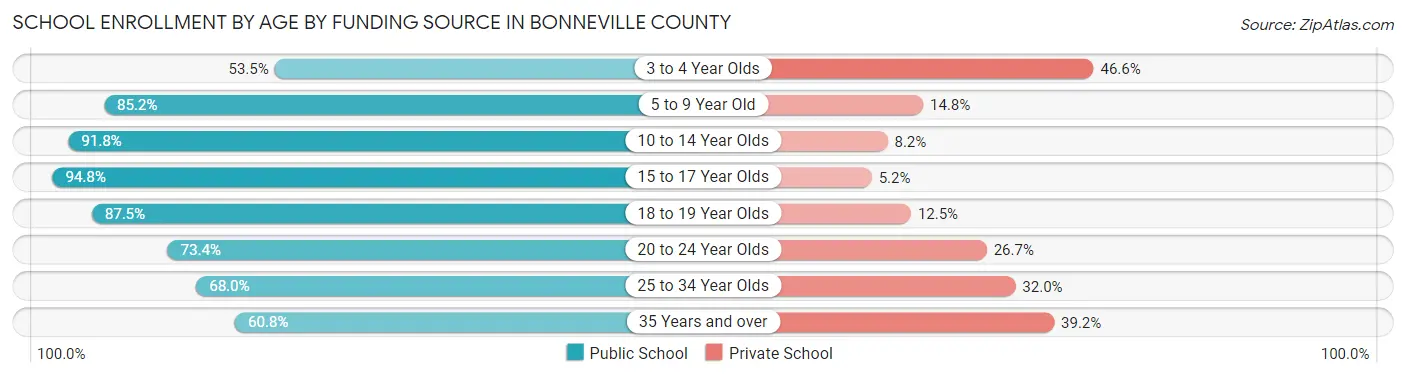
| Age Bracket | Public School | Private School |
| 3 to 4 Year Olds | 721 (53.4%) | 628 (46.6%) |
| 5 to 9 Year Old | 8,871 (85.2%) | 1,541 (14.8%) |
| 10 to 14 Year Olds | 9,740 (91.8%) | 867 (8.2%) |
| 15 to 17 Year Olds | 5,394 (94.8%) | 297 (5.2%) |
| 18 to 19 Year Olds | 1,626 (87.5%) | 233 (12.5%) |
| 20 to 24 Year Olds | 1,409 (73.4%) | 512 (26.7%) |
| 25 to 34 Year Olds | 1,401 (68.0%) | 659 (32.0%) |
| 35 Years and over | 1,081 (60.8%) | 697 (39.2%) |
| Total | 30,254 (84.8%) | 5,423 (15.2%) |
Educational Attainment by Field of Study in Bonneville County
Business (4,048 | 15.6%), education (3,775 | 14.6%), science & technology (3,660 | 14.1%), engineering (3,015 | 11.7%), and bio, nature & agricultural (2,067 | 8.0%) are the most common fields of study among 25,887 individuals in Bonneville County who have obtained a bachelor's degree or higher.
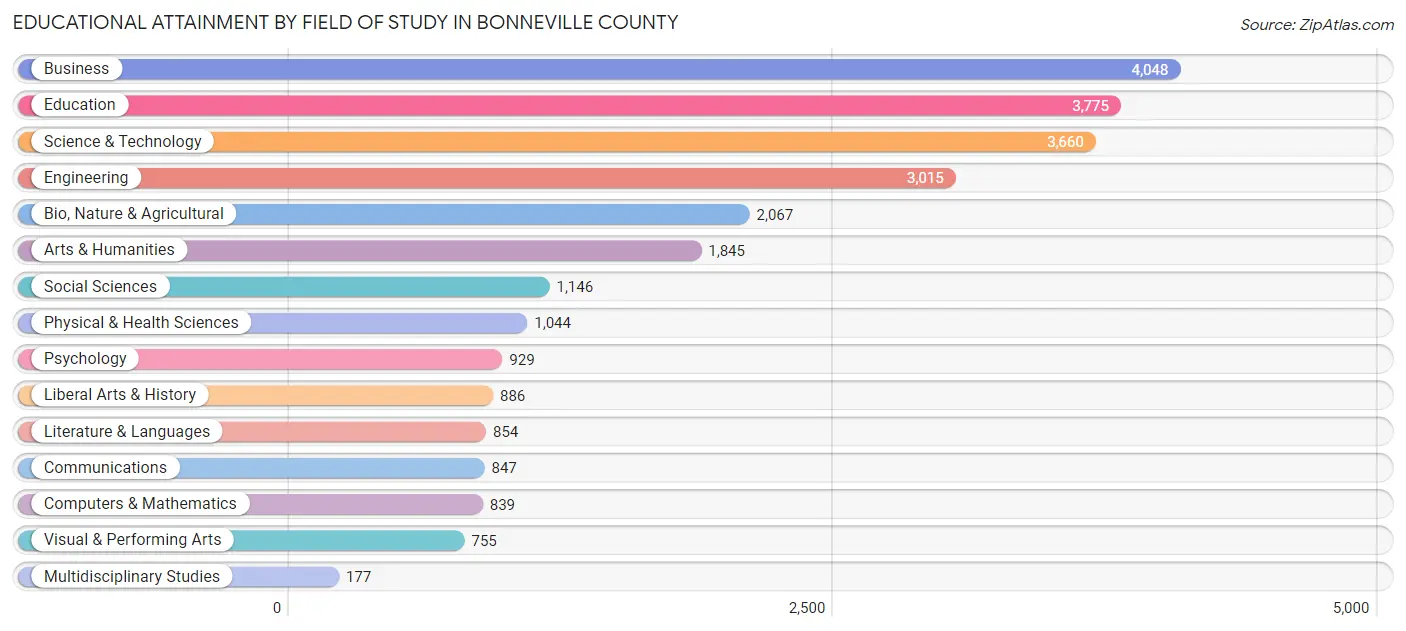
| Field of Study | # Graduates | % Graduates |
| Computers & Mathematics | 839 | 3.2% |
| Bio, Nature & Agricultural | 2,067 | 8.0% |
| Physical & Health Sciences | 1,044 | 4.0% |
| Psychology | 929 | 3.6% |
| Social Sciences | 1,146 | 4.4% |
| Engineering | 3,015 | 11.7% |
| Multidisciplinary Studies | 177 | 0.7% |
| Science & Technology | 3,660 | 14.1% |
| Business | 4,048 | 15.6% |
| Education | 3,775 | 14.6% |
| Literature & Languages | 854 | 3.3% |
| Liberal Arts & History | 886 | 3.4% |
| Visual & Performing Arts | 755 | 2.9% |
| Communications | 847 | 3.3% |
| Arts & Humanities | 1,845 | 7.1% |
| Total | 25,887 | 100.0% |
Transportation & Commute in Bonneville County
Vehicle Availability by Sex in Bonneville County
The most prevalent vehicle ownership categories in Bonneville County are males with 2 vehicles (12,031, accounting for 39.5%) and females with 2 vehicles (8,889, making up 49.2%).
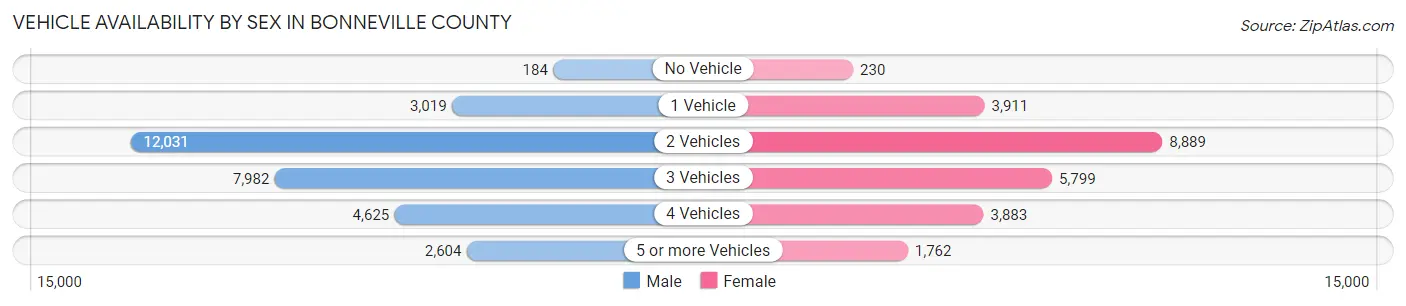
| Vehicles Available | Male | Female |
| No Vehicle | 184 (0.6%) | 230 (0.9%) |
| 1 Vehicle | 3,019 (9.9%) | 3,911 (16.0%) |
| 2 Vehicles | 12,031 (39.5%) | 8,889 (36.3%) |
| 3 Vehicles | 7,982 (26.2%) | 5,799 (23.7%) |
| 4 Vehicles | 4,625 (15.2%) | 3,883 (15.9%) |
| 5 or more Vehicles | 2,604 (8.6%) | 1,762 (7.2%) |
| Total | 30,445 (100.0%) | 24,474 (100.0%) |
Commute Time in Bonneville County
The most frequently occuring commute durations in Bonneville County are 15 to 19 minutes (11,334 commuters, 22.6%), 10 to 14 minutes (10,908 commuters, 21.7%), and 5 to 9 minutes (9,129 commuters, 18.2%).
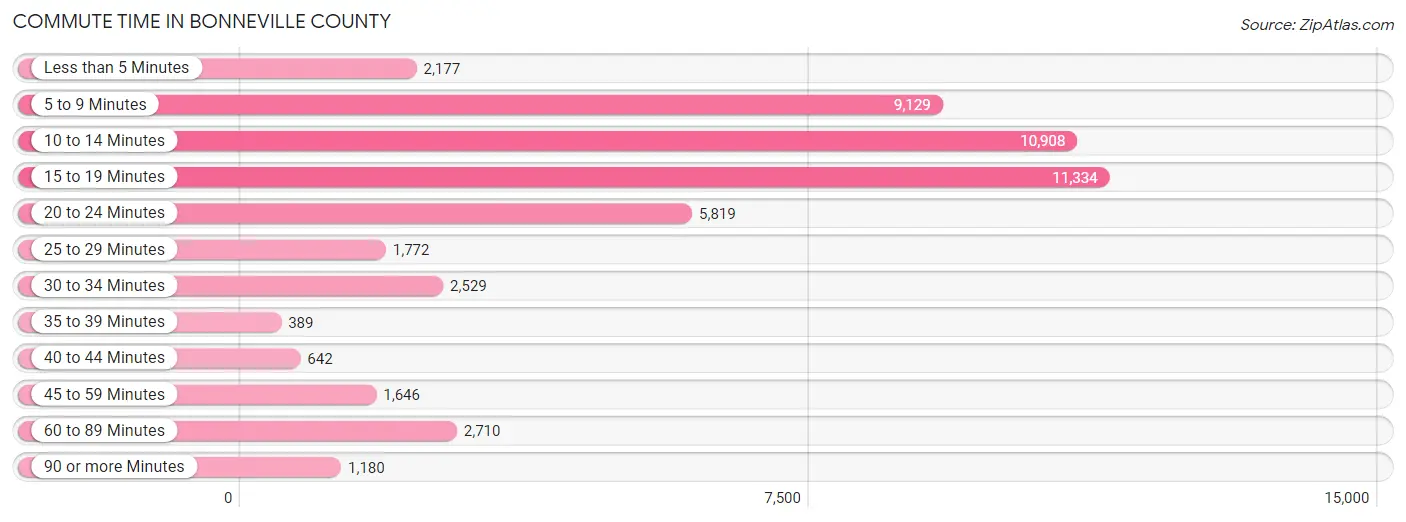
| Commute Time | # Commuters | % Commuters |
| Less than 5 Minutes | 2,177 | 4.3% |
| 5 to 9 Minutes | 9,129 | 18.2% |
| 10 to 14 Minutes | 10,908 | 21.7% |
| 15 to 19 Minutes | 11,334 | 22.6% |
| 20 to 24 Minutes | 5,819 | 11.6% |
| 25 to 29 Minutes | 1,772 | 3.5% |
| 30 to 34 Minutes | 2,529 | 5.0% |
| 35 to 39 Minutes | 389 | 0.8% |
| 40 to 44 Minutes | 642 | 1.3% |
| 45 to 59 Minutes | 1,646 | 3.3% |
| 60 to 89 Minutes | 2,710 | 5.4% |
| 90 or more Minutes | 1,180 | 2.4% |
Commute Time by Sex in Bonneville County
The most common commute times in Bonneville County are 15 to 19 minutes (6,156 commuters, 21.8%) for males and 10 to 14 minutes (5,432 commuters, 24.7%) for females.
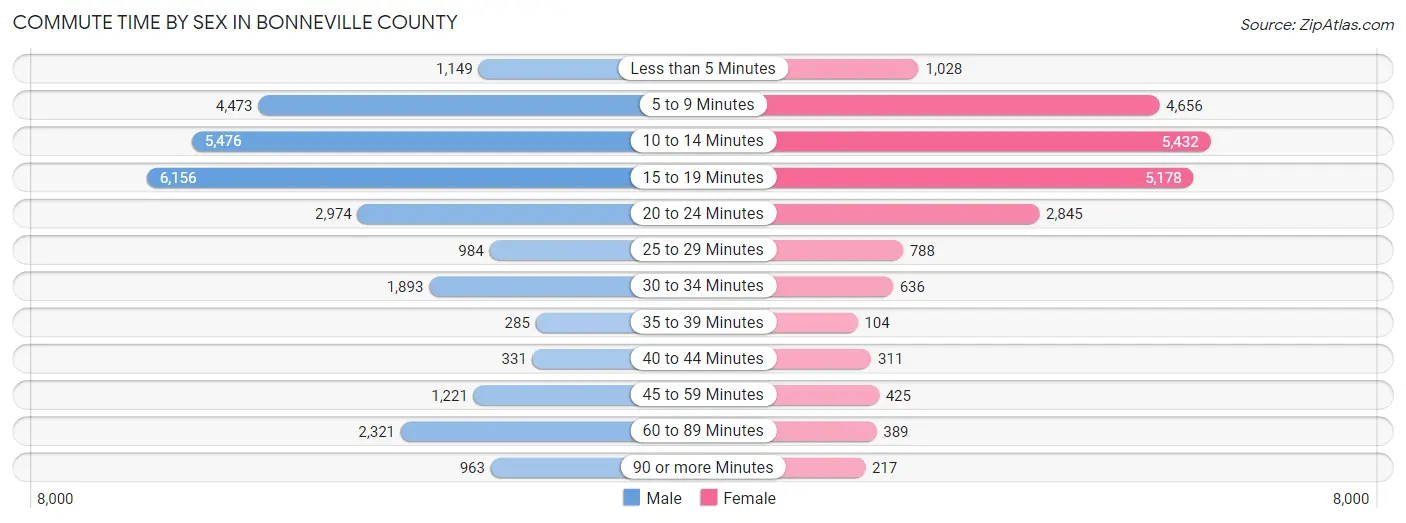
| Commute Time | Male | Female |
| Less than 5 Minutes | 1,149 (4.1%) | 1,028 (4.7%) |
| 5 to 9 Minutes | 4,473 (15.9%) | 4,656 (21.1%) |
| 10 to 14 Minutes | 5,476 (19.4%) | 5,432 (24.7%) |
| 15 to 19 Minutes | 6,156 (21.8%) | 5,178 (23.5%) |
| 20 to 24 Minutes | 2,974 (10.5%) | 2,845 (12.9%) |
| 25 to 29 Minutes | 984 (3.5%) | 788 (3.6%) |
| 30 to 34 Minutes | 1,893 (6.7%) | 636 (2.9%) |
| 35 to 39 Minutes | 285 (1.0%) | 104 (0.5%) |
| 40 to 44 Minutes | 331 (1.2%) | 311 (1.4%) |
| 45 to 59 Minutes | 1,221 (4.3%) | 425 (1.9%) |
| 60 to 89 Minutes | 2,321 (8.2%) | 389 (1.8%) |
| 90 or more Minutes | 963 (3.4%) | 217 (1.0%) |
Time of Departure to Work by Sex in Bonneville County
The most frequent times of departure to work in Bonneville County are 7:30 AM to 7:59 AM (3,660, 13.0%) for males and 7:30 AM to 7:59 AM (4,005, 18.2%) for females.
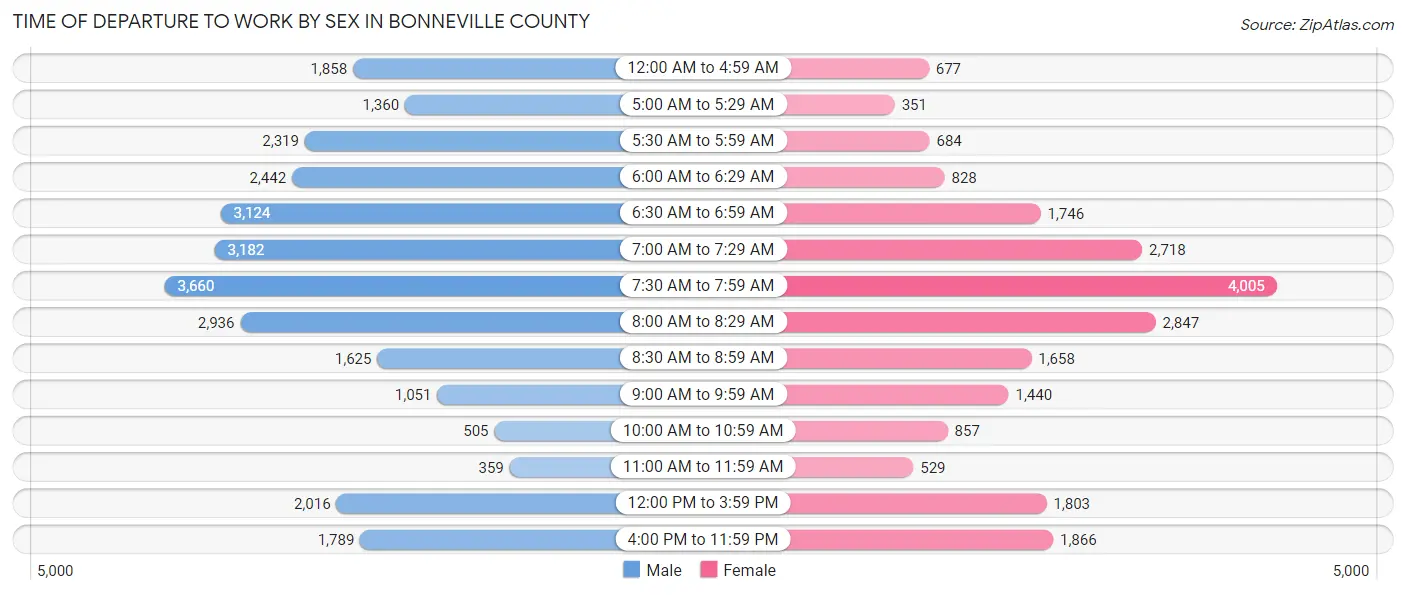
| Time of Departure | Male | Female |
| 12:00 AM to 4:59 AM | 1,858 (6.6%) | 677 (3.1%) |
| 5:00 AM to 5:29 AM | 1,360 (4.8%) | 351 (1.6%) |
| 5:30 AM to 5:59 AM | 2,319 (8.2%) | 684 (3.1%) |
| 6:00 AM to 6:29 AM | 2,442 (8.6%) | 828 (3.8%) |
| 6:30 AM to 6:59 AM | 3,124 (11.1%) | 1,746 (7.9%) |
| 7:00 AM to 7:29 AM | 3,182 (11.3%) | 2,718 (12.3%) |
| 7:30 AM to 7:59 AM | 3,660 (13.0%) | 4,005 (18.2%) |
| 8:00 AM to 8:29 AM | 2,936 (10.4%) | 2,847 (12.9%) |
| 8:30 AM to 8:59 AM | 1,625 (5.8%) | 1,658 (7.5%) |
| 9:00 AM to 9:59 AM | 1,051 (3.7%) | 1,440 (6.5%) |
| 10:00 AM to 10:59 AM | 505 (1.8%) | 857 (3.9%) |
| 11:00 AM to 11:59 AM | 359 (1.3%) | 529 (2.4%) |
| 12:00 PM to 3:59 PM | 2,016 (7.1%) | 1,803 (8.2%) |
| 4:00 PM to 11:59 PM | 1,789 (6.3%) | 1,866 (8.5%) |
| Total | 28,226 (100.0%) | 22,009 (100.0%) |
Housing Occupancy in Bonneville County
Occupancy by Ownership in Bonneville County
Of the total 42,402 dwellings in Bonneville County, owner-occupied units account for 30,105 (71.0%), while renter-occupied units make up 12,297 (29.0%).
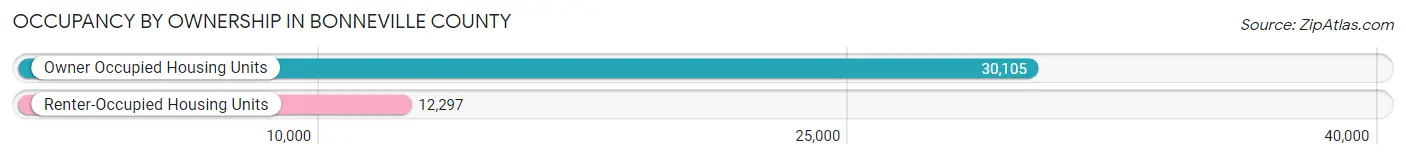
| Occupancy | # Housing Units | % Housing Units |
| Owner Occupied Housing Units | 30,105 | 71.0% |
| Renter-Occupied Housing Units | 12,297 | 29.0% |
| Total Occupied Housing Units | 42,402 | 100.0% |
Occupancy by Household Size in Bonneville County
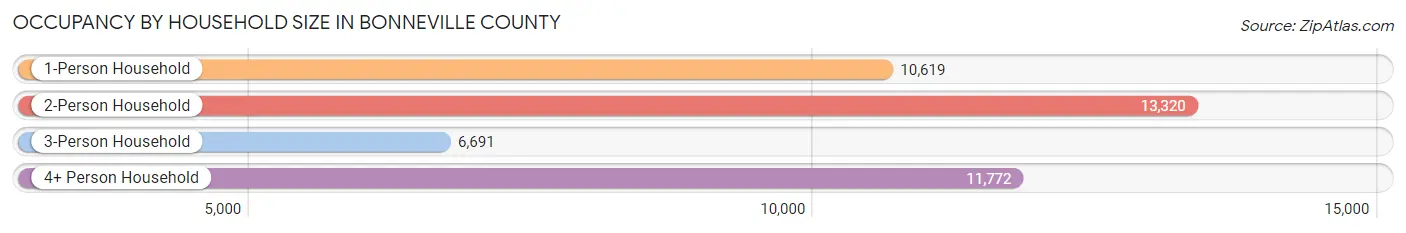
| Household Size | # Housing Units | % Housing Units |
| 1-Person Household | 10,619 | 25.0% |
| 2-Person Household | 13,320 | 31.4% |
| 3-Person Household | 6,691 | 15.8% |
| 4+ Person Household | 11,772 | 27.8% |
| Total Housing Units | 42,402 | 100.0% |
Occupancy by Ownership by Household Size in Bonneville County
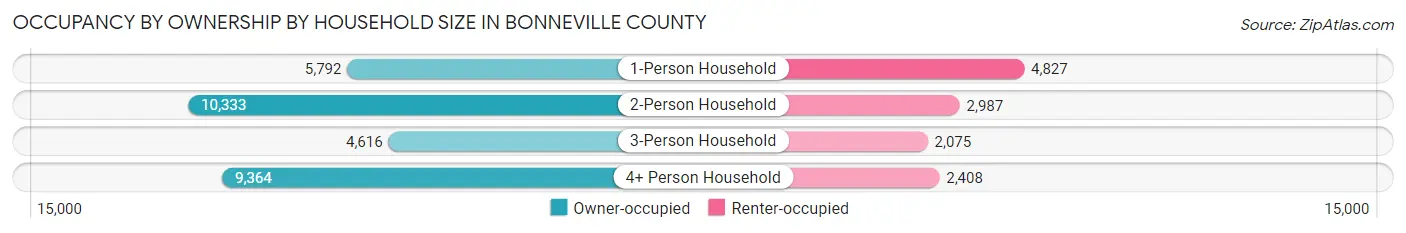
| Household Size | Owner-occupied | Renter-occupied |
| 1-Person Household | 5,792 (54.5%) | 4,827 (45.5%) |
| 2-Person Household | 10,333 (77.6%) | 2,987 (22.4%) |
| 3-Person Household | 4,616 (69.0%) | 2,075 (31.0%) |
| 4+ Person Household | 9,364 (79.5%) | 2,408 (20.5%) |
| Total Housing Units | 30,105 (71.0%) | 12,297 (29.0%) |
Occupancy by Educational Attainment in Bonneville County
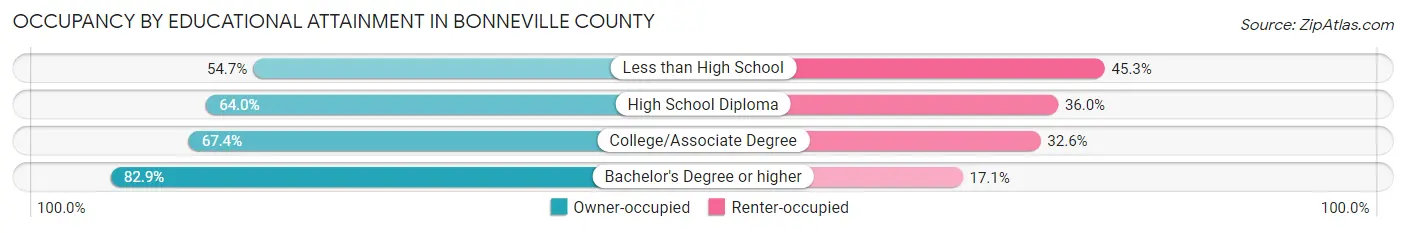
| Household Size | Owner-occupied | Renter-occupied |
| Less than High School | 1,497 (54.7%) | 1,239 (45.3%) |
| High School Diploma | 6,640 (64.0%) | 3,742 (36.0%) |
| College/Associate Degree | 10,058 (67.4%) | 4,856 (32.6%) |
| Bachelor's Degree or higher | 11,910 (82.9%) | 2,460 (17.1%) |
Occupancy by Age of Householder in Bonneville County
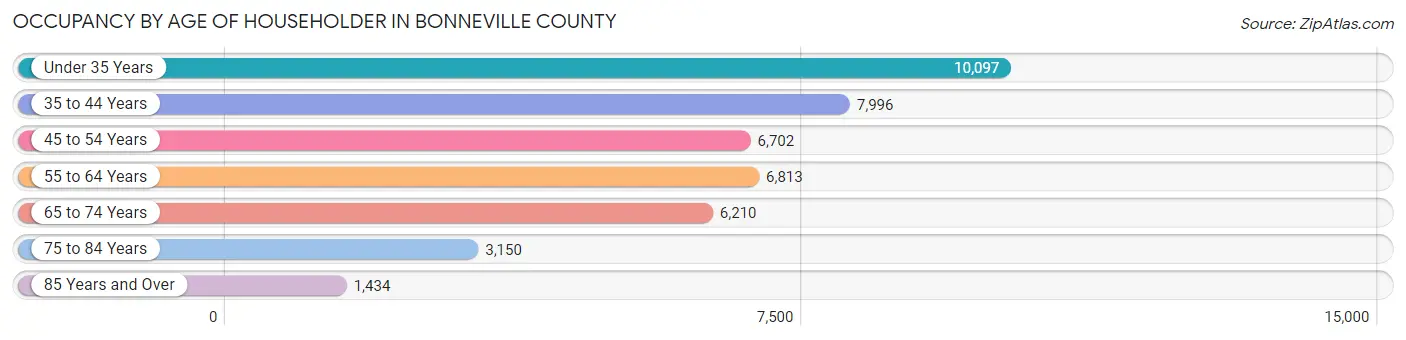
| Age Bracket | # Households | % Households |
| Under 35 Years | 10,097 | 23.8% |
| 35 to 44 Years | 7,996 | 18.9% |
| 45 to 54 Years | 6,702 | 15.8% |
| 55 to 64 Years | 6,813 | 16.1% |
| 65 to 74 Years | 6,210 | 14.6% |
| 75 to 84 Years | 3,150 | 7.4% |
| 85 Years and Over | 1,434 | 3.4% |
| Total | 42,402 | 100.0% |
Housing Finances in Bonneville County
Median Income by Occupancy in Bonneville County
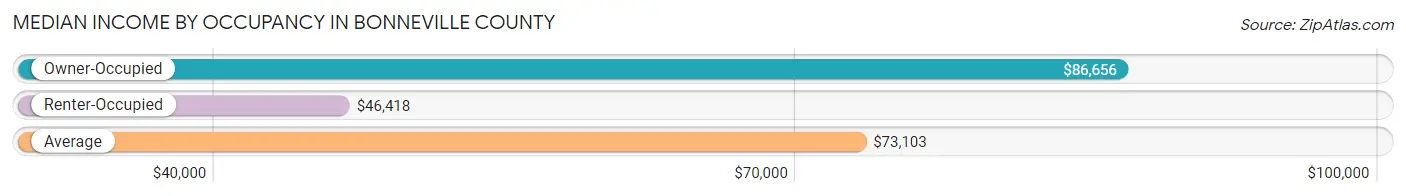
| Occupancy Type | # Households | Median Income |
| Owner-Occupied | 30,105 (71.0%) | $86,656 |
| Renter-Occupied | 12,297 (29.0%) | $46,418 |
| Average | 42,402 (100.0%) | $73,103 |
Occupancy by Householder Income Bracket in Bonneville County
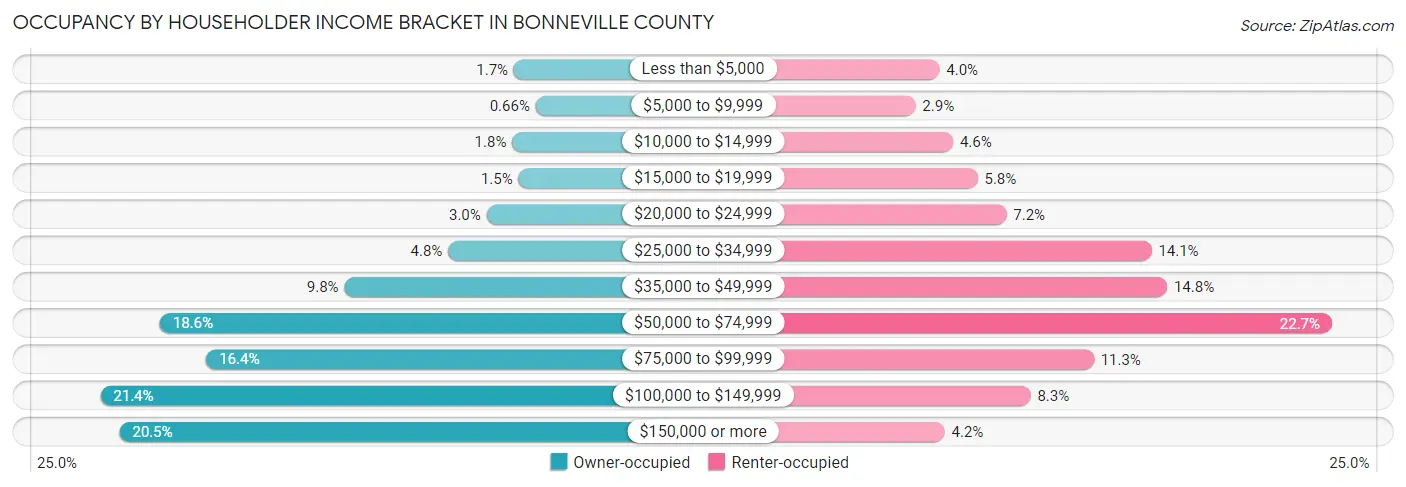
| Income Bracket | Owner-occupied | Renter-occupied |
| Less than $5,000 | 512 (1.7%) | 491 (4.0%) |
| $5,000 to $9,999 | 198 (0.7%) | 351 (2.9%) |
| $10,000 to $14,999 | 536 (1.8%) | 570 (4.6%) |
| $15,000 to $19,999 | 445 (1.5%) | 715 (5.8%) |
| $20,000 to $24,999 | 903 (3.0%) | 883 (7.2%) |
| $25,000 to $34,999 | 1,454 (4.8%) | 1,733 (14.1%) |
| $35,000 to $49,999 | 2,940 (9.8%) | 1,824 (14.8%) |
| $50,000 to $74,999 | 5,587 (18.6%) | 2,789 (22.7%) |
| $75,000 to $99,999 | 4,923 (16.4%) | 1,395 (11.3%) |
| $100,000 to $149,999 | 6,439 (21.4%) | 1,024 (8.3%) |
| $150,000 or more | 6,168 (20.5%) | 522 (4.2%) |
| Total | 30,105 (100.0%) | 12,297 (100.0%) |
Monthly Housing Cost Tiers in Bonneville County
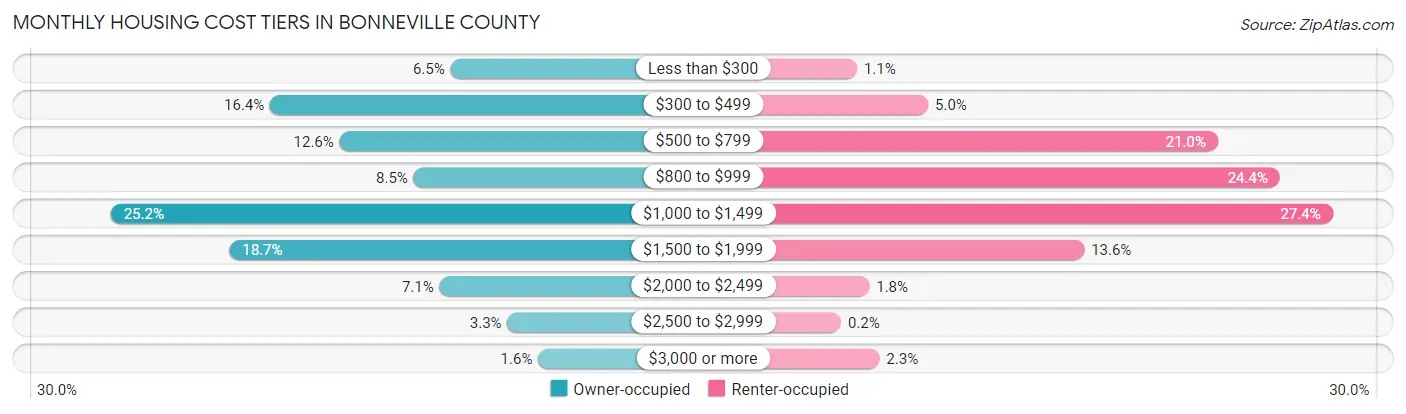
| Monthly Cost | Owner-occupied | Renter-occupied |
| Less than $300 | 1,947 (6.5%) | 133 (1.1%) |
| $300 to $499 | 4,949 (16.4%) | 616 (5.0%) |
| $500 to $799 | 3,792 (12.6%) | 2,584 (21.0%) |
| $800 to $999 | 2,562 (8.5%) | 3,004 (24.4%) |
| $1,000 to $1,499 | 7,600 (25.2%) | 3,363 (27.4%) |
| $1,500 to $1,999 | 5,627 (18.7%) | 1,676 (13.6%) |
| $2,000 to $2,499 | 2,132 (7.1%) | 216 (1.8%) |
| $2,500 to $2,999 | 1,004 (3.3%) | 24 (0.2%) |
| $3,000 or more | 492 (1.6%) | 285 (2.3%) |
| Total | 30,105 (100.0%) | 12,297 (100.0%) |
Physical Housing Characteristics in Bonneville County
Housing Structures in Bonneville County
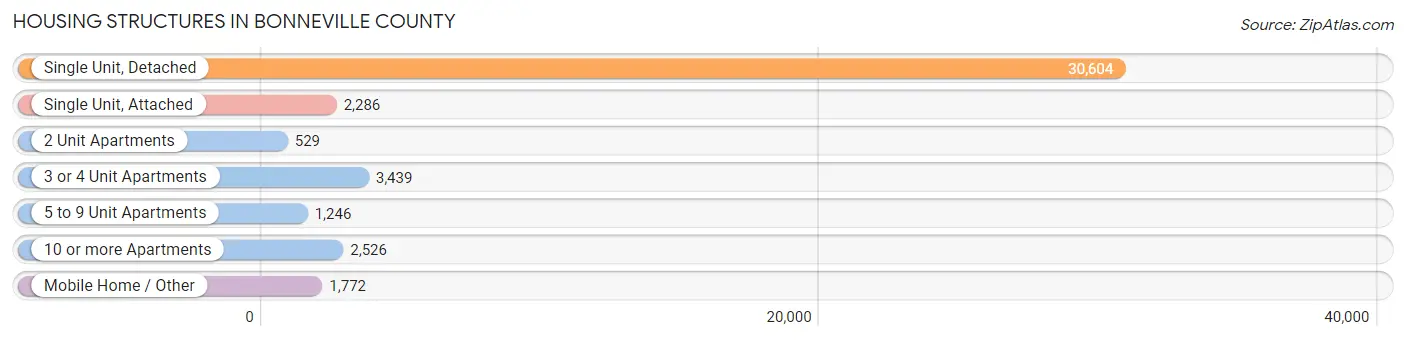
| Structure Type | # Housing Units | % Housing Units |
| Single Unit, Detached | 30,604 | 72.2% |
| Single Unit, Attached | 2,286 | 5.4% |
| 2 Unit Apartments | 529 | 1.3% |
| 3 or 4 Unit Apartments | 3,439 | 8.1% |
| 5 to 9 Unit Apartments | 1,246 | 2.9% |
| 10 or more Apartments | 2,526 | 6.0% |
| Mobile Home / Other | 1,772 | 4.2% |
| Total | 42,402 | 100.0% |
Housing Structures by Occupancy in Bonneville County
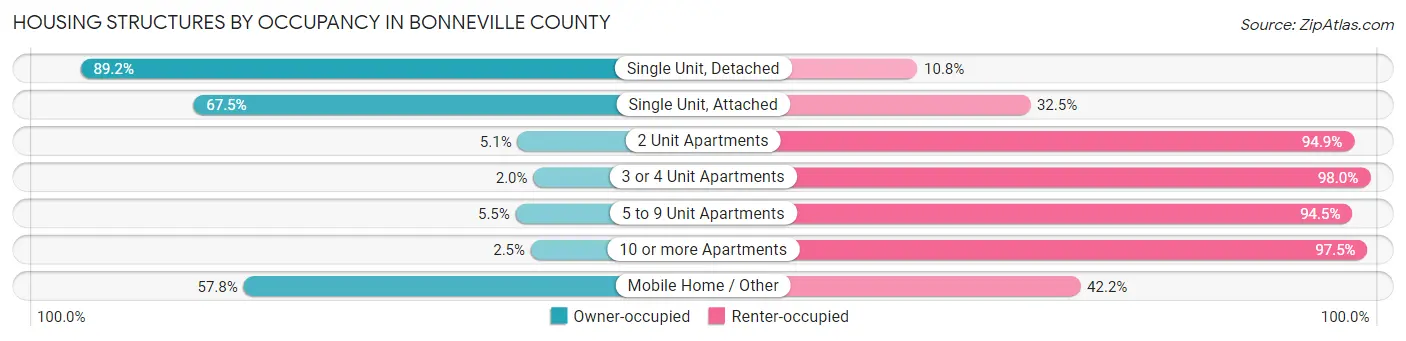
| Structure Type | Owner-occupied | Renter-occupied |
| Single Unit, Detached | 27,308 (89.2%) | 3,296 (10.8%) |
| Single Unit, Attached | 1,543 (67.5%) | 743 (32.5%) |
| 2 Unit Apartments | 27 (5.1%) | 502 (94.9%) |
| 3 or 4 Unit Apartments | 70 (2.0%) | 3,369 (98.0%) |
| 5 to 9 Unit Apartments | 68 (5.5%) | 1,178 (94.5%) |
| 10 or more Apartments | 64 (2.5%) | 2,462 (97.5%) |
| Mobile Home / Other | 1,025 (57.8%) | 747 (42.2%) |
| Total | 30,105 (71.0%) | 12,297 (29.0%) |
Housing Structures by Number of Rooms in Bonneville County
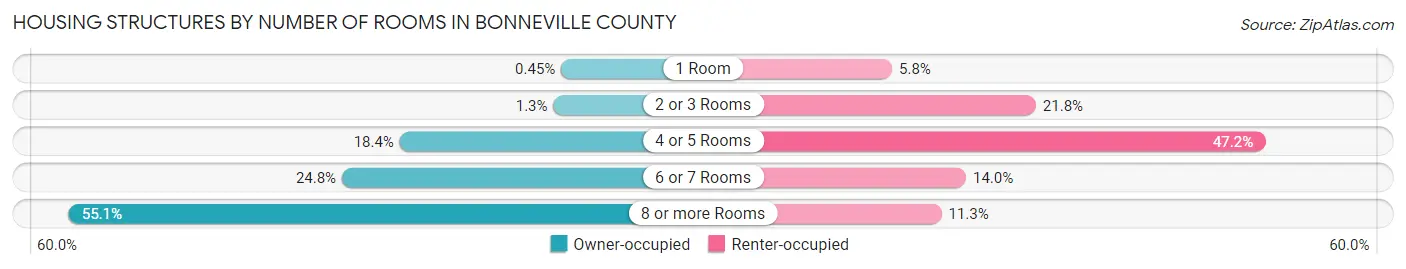
| Number of Rooms | Owner-occupied | Renter-occupied |
| 1 Room | 135 (0.4%) | 712 (5.8%) |
| 2 or 3 Rooms | 396 (1.3%) | 2,675 (21.7%) |
| 4 or 5 Rooms | 5,529 (18.4%) | 5,801 (47.2%) |
| 6 or 7 Rooms | 7,459 (24.8%) | 1,722 (14.0%) |
| 8 or more Rooms | 16,586 (55.1%) | 1,387 (11.3%) |
| Total | 30,105 (100.0%) | 12,297 (100.0%) |
Housing Structure by Heating Type in Bonneville County
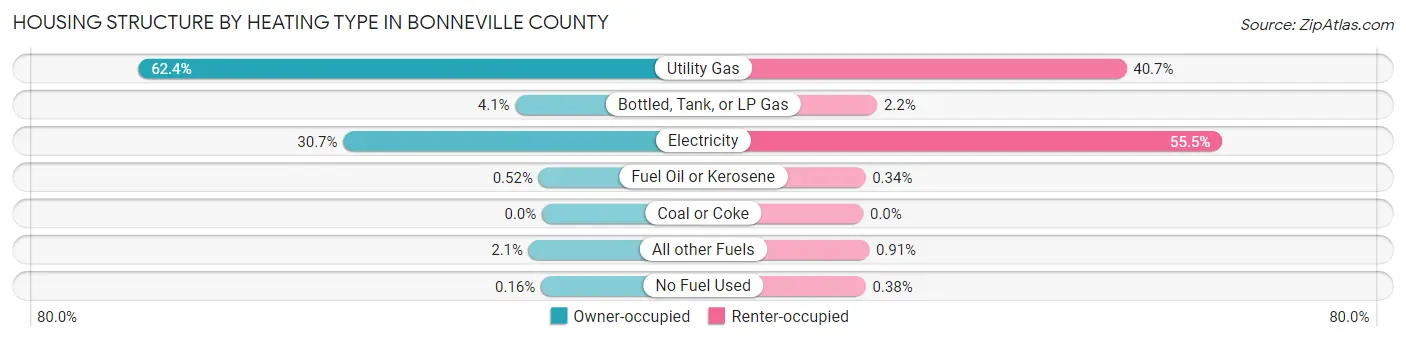
| Heating Type | Owner-occupied | Renter-occupied |
| Utility Gas | 18,796 (62.4%) | 5,005 (40.7%) |
| Bottled, Tank, or LP Gas | 1,239 (4.1%) | 265 (2.1%) |
| Electricity | 9,247 (30.7%) | 6,826 (55.5%) |
| Fuel Oil or Kerosene | 157 (0.5%) | 42 (0.3%) |
| Coal or Coke | 0 (0.0%) | 0 (0.0%) |
| All other Fuels | 617 (2.1%) | 112 (0.9%) |
| No Fuel Used | 49 (0.2%) | 47 (0.4%) |
| Total | 30,105 (100.0%) | 12,297 (100.0%) |
Household Vehicle Usage in Bonneville County
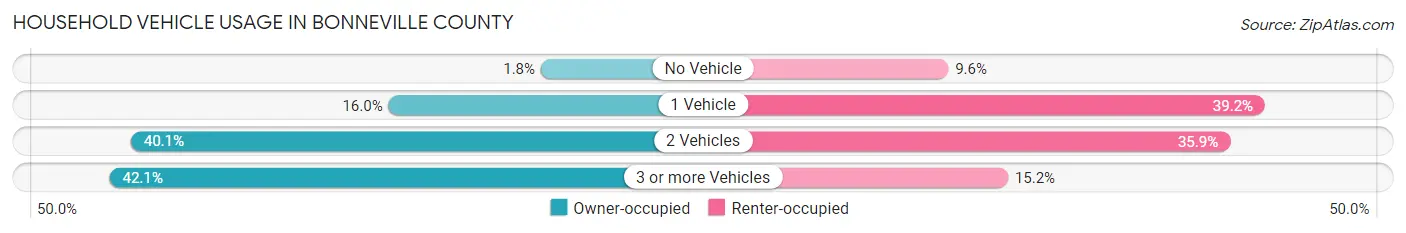
| Vehicles per Household | Owner-occupied | Renter-occupied |
| No Vehicle | 546 (1.8%) | 1,186 (9.6%) |
| 1 Vehicle | 4,827 (16.0%) | 4,820 (39.2%) |
| 2 Vehicles | 12,066 (40.1%) | 4,419 (35.9%) |
| 3 or more Vehicles | 12,666 (42.1%) | 1,872 (15.2%) |
| Total | 30,105 (100.0%) | 12,297 (100.0%) |
Real Estate & Mortgages in Bonneville County
Real Estate and Mortgage Overview in Bonneville County
| Characteristic | Without Mortgage | With Mortgage |
| Housing Units | 10,003 | 20,102 |
| Median Property Value | $269,200 | $296,700 |
| Median Household Income | $72,252 | $4,287 |
| Monthly Housing Costs | $424 | $481 |
| Real Estate Taxes | $1,640 | $454 |
Property Value by Mortgage Status in Bonneville County
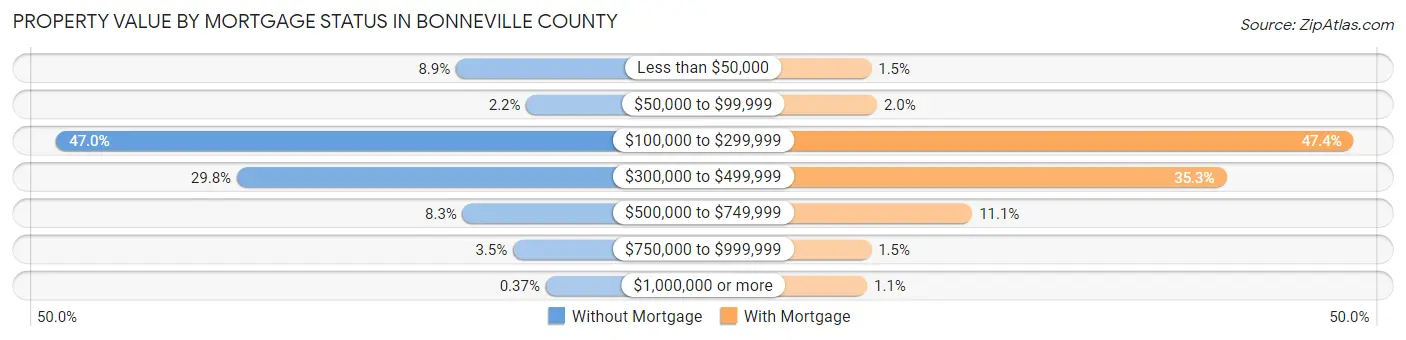
| Property Value | Without Mortgage | With Mortgage |
| Less than $50,000 | 891 (8.9%) | 302 (1.5%) |
| $50,000 to $99,999 | 221 (2.2%) | 411 (2.0%) |
| $100,000 to $299,999 | 4,699 (47.0%) | 9,536 (47.4%) |
| $300,000 to $499,999 | 2,979 (29.8%) | 7,099 (35.3%) |
| $500,000 to $749,999 | 828 (8.3%) | 2,234 (11.1%) |
| $750,000 to $999,999 | 348 (3.5%) | 299 (1.5%) |
| $1,000,000 or more | 37 (0.4%) | 221 (1.1%) |
| Total | 10,003 (100.0%) | 20,102 (100.0%) |
Household Income by Mortgage Status in Bonneville County
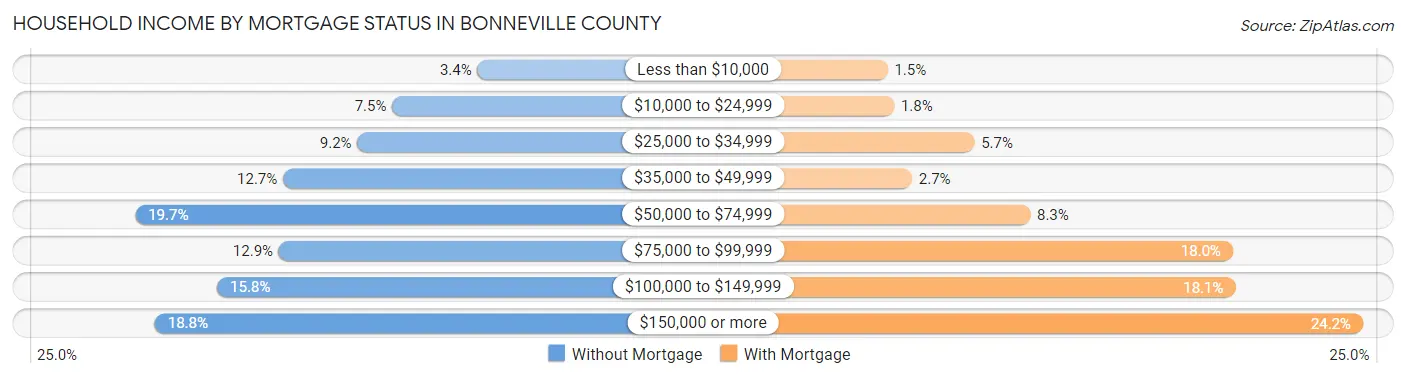
| Household Income | Without Mortgage | With Mortgage |
| Less than $10,000 | 343 (3.4%) | 305 (1.5%) |
| $10,000 to $24,999 | 749 (7.5%) | 367 (1.8%) |
| $25,000 to $34,999 | 915 (9.1%) | 1,135 (5.7%) |
| $35,000 to $49,999 | 1,269 (12.7%) | 539 (2.7%) |
| $50,000 to $74,999 | 1,974 (19.7%) | 1,671 (8.3%) |
| $75,000 to $99,999 | 1,289 (12.9%) | 3,613 (18.0%) |
| $100,000 to $149,999 | 1,583 (15.8%) | 3,634 (18.1%) |
| $150,000 or more | 1,881 (18.8%) | 4,856 (24.2%) |
| Total | 10,003 (100.0%) | 20,102 (100.0%) |
Property Value to Household Income Ratio in Bonneville County
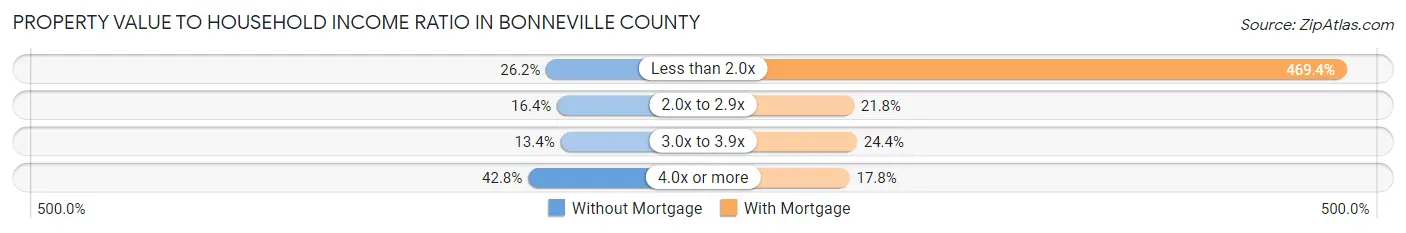
| Value-to-Income Ratio | Without Mortgage | With Mortgage |
| Less than 2.0x | 2,624 (26.2%) | 94,358 (469.4%) |
| 2.0x to 2.9x | 1,641 (16.4%) | 4,372 (21.7%) |
| 3.0x to 3.9x | 1,339 (13.4%) | 4,910 (24.4%) |
| 4.0x or more | 4,278 (42.8%) | 3,582 (17.8%) |
| Total | 10,003 (100.0%) | 20,102 (100.0%) |
Real Estate Taxes by Mortgage Status in Bonneville County
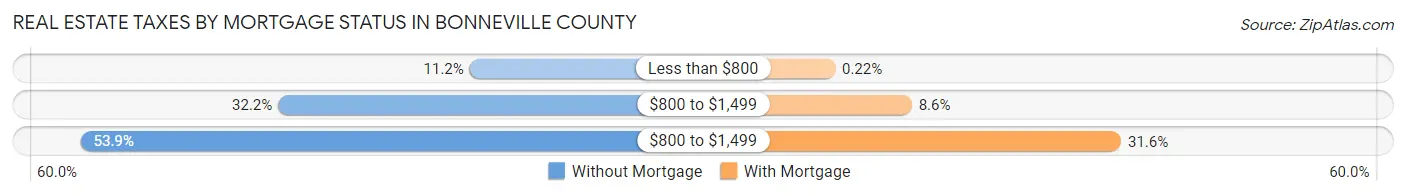
| Property Taxes | Without Mortgage | With Mortgage |
| Less than $800 | 1,123 (11.2%) | 44 (0.2%) |
| $800 to $1,499 | 3,223 (32.2%) | 1,733 (8.6%) |
| $800 to $1,499 | 5,388 (53.9%) | 6,345 (31.6%) |
| Total | 10,003 (100.0%) | 20,102 (100.0%) |
Health & Disability in Bonneville County
Health Insurance Coverage by Age in Bonneville County
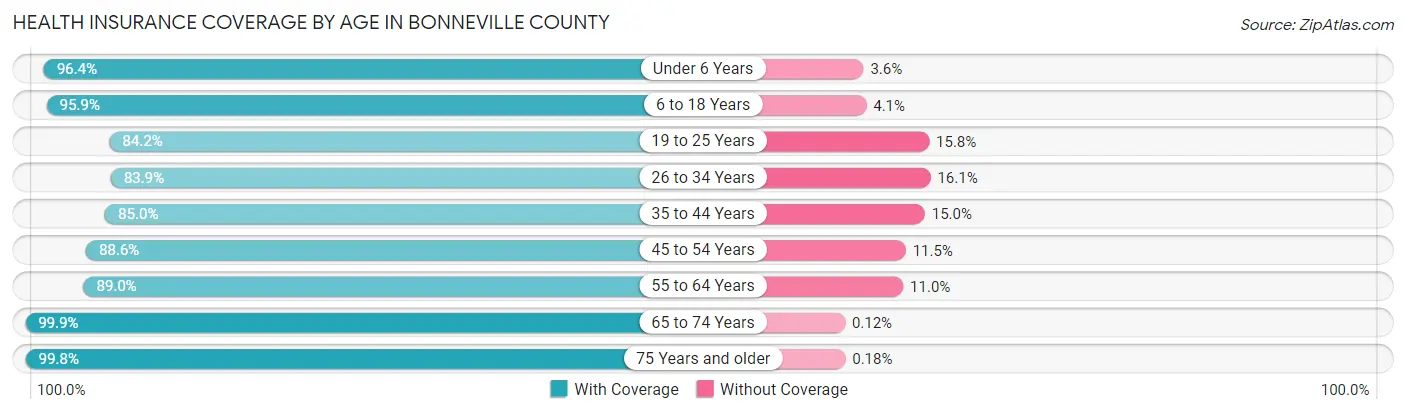
| Age Bracket | With Coverage | Without Coverage |
| Under 6 Years | 11,153 (96.4%) | 414 (3.6%) |
| 6 to 18 Years | 26,457 (95.9%) | 1,131 (4.1%) |
| 19 to 25 Years | 9,017 (84.2%) | 1,695 (15.8%) |
| 26 to 34 Years | 12,663 (83.9%) | 2,424 (16.1%) |
| 35 to 44 Years | 13,915 (85.0%) | 2,459 (15.0%) |
| 45 to 54 Years | 11,066 (88.5%) | 1,431 (11.5%) |
| 55 to 64 Years | 11,418 (89.0%) | 1,409 (11.0%) |
| 65 to 74 Years | 9,806 (99.9%) | 12 (0.1%) |
| 75 Years and older | 6,618 (99.8%) | 12 (0.2%) |
| Total | 112,113 (91.1%) | 10,987 (8.9%) |
Health Insurance Coverage by Citizenship Status in Bonneville County
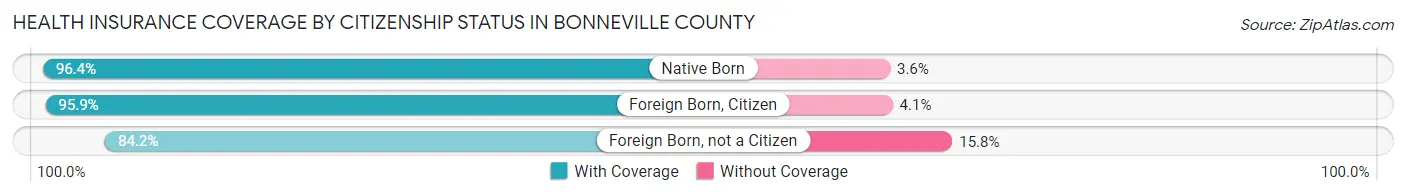
| Citizenship Status | With Coverage | Without Coverage |
| Native Born | 11,153 (96.4%) | 414 (3.6%) |
| Foreign Born, Citizen | 26,457 (95.9%) | 1,131 (4.1%) |
| Foreign Born, not a Citizen | 9,017 (84.2%) | 1,695 (15.8%) |
Health Insurance Coverage by Household Income in Bonneville County
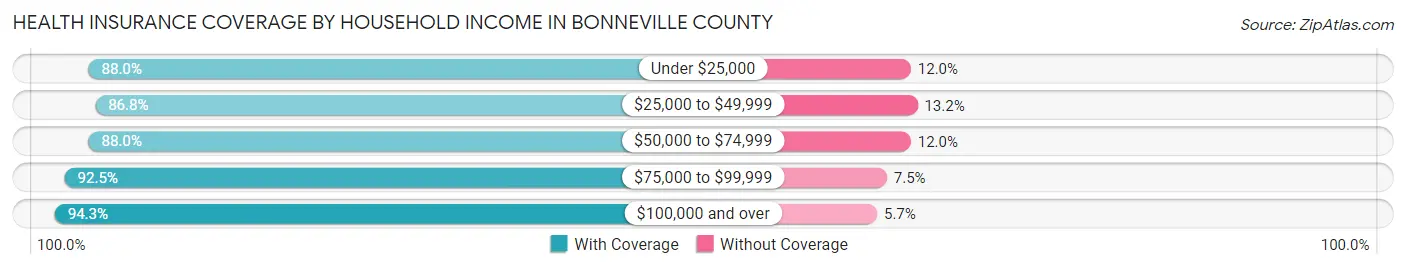
| Household Income | With Coverage | Without Coverage |
| Under $25,000 | 8,544 (88.0%) | 1,165 (12.0%) |
| $25,000 to $49,999 | 16,389 (86.8%) | 2,502 (13.2%) |
| $50,000 to $74,999 | 20,494 (88.0%) | 2,792 (12.0%) |
| $75,000 to $99,999 | 18,225 (92.5%) | 1,480 (7.5%) |
| $100,000 and over | 48,270 (94.3%) | 2,900 (5.7%) |
Public vs Private Health Insurance Coverage by Age in Bonneville County
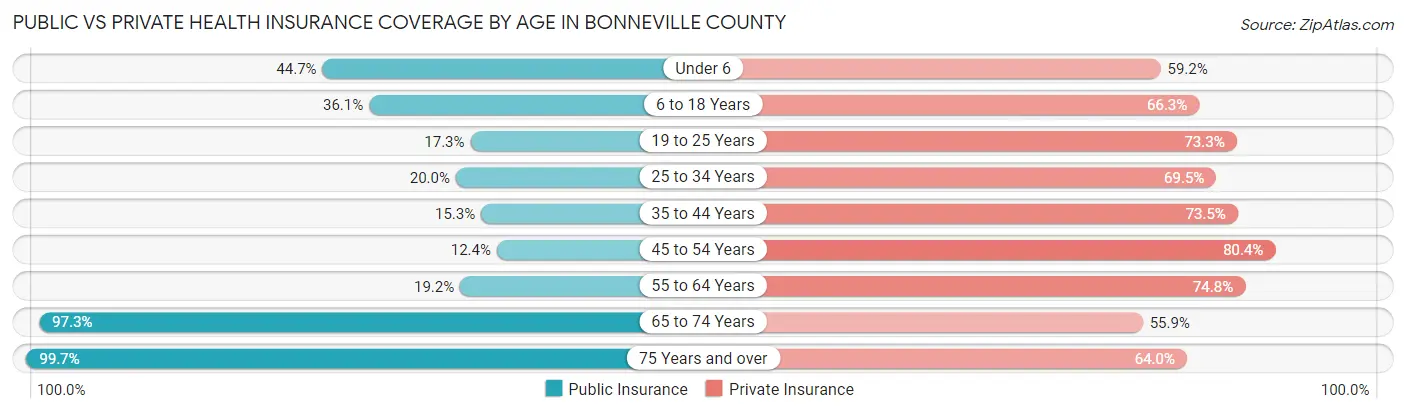
| Age Bracket | Public Insurance | Private Insurance |
| Under 6 | 5,173 (44.7%) | 6,843 (59.2%) |
| 6 to 18 Years | 9,948 (36.1%) | 18,296 (66.3%) |
| 19 to 25 Years | 1,849 (17.3%) | 7,847 (73.3%) |
| 25 to 34 Years | 3,013 (20.0%) | 10,482 (69.5%) |
| 35 to 44 Years | 2,502 (15.3%) | 12,032 (73.5%) |
| 45 to 54 Years | 1,544 (12.3%) | 10,053 (80.4%) |
| 55 to 64 Years | 2,459 (19.2%) | 9,598 (74.8%) |
| 65 to 74 Years | 9,552 (97.3%) | 5,483 (55.8%) |
| 75 Years and over | 6,608 (99.7%) | 4,245 (64.0%) |
| Total | 42,648 (34.6%) | 84,879 (69.0%) |
Disability Status by Sex by Age in Bonneville County
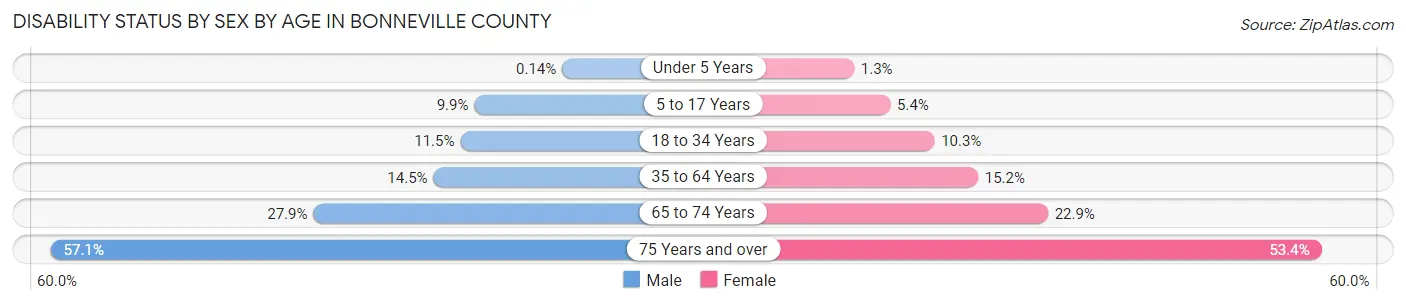
| Age Bracket | Male | Female |
| Under 5 Years | 7 (0.1%) | 63 (1.3%) |
| 5 to 17 Years | 1,411 (9.9%) | 739 (5.4%) |
| 18 to 34 Years | 1,580 (11.5%) | 1,406 (10.3%) |
| 35 to 64 Years | 3,099 (14.5%) | 3,073 (15.1%) |
| 65 to 74 Years | 1,290 (27.9%) | 1,189 (22.9%) |
| 75 Years and over | 1,604 (57.1%) | 2,041 (53.4%) |
Disability Class by Sex by Age in Bonneville County
Disability Class: Hearing Difficulty
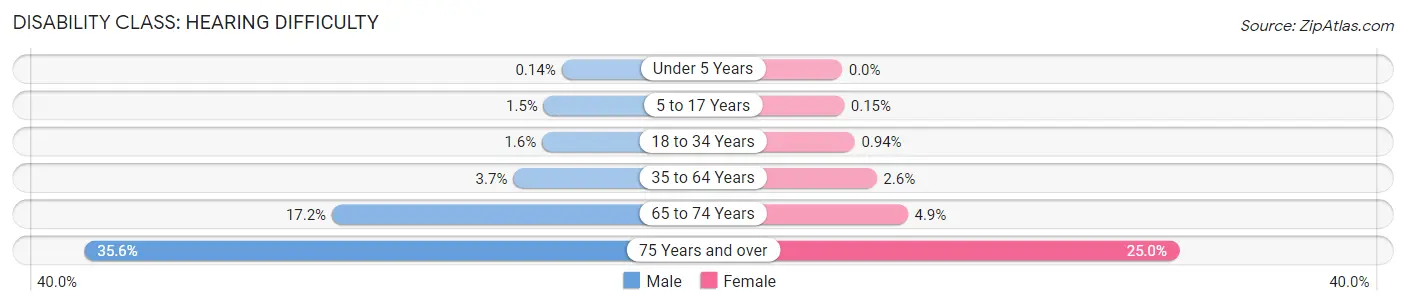
| Age Bracket | Male | Female |
| Under 5 Years | 7 (0.1%) | 0 (0.0%) |
| 5 to 17 Years | 207 (1.5%) | 21 (0.2%) |
| 18 to 34 Years | 218 (1.6%) | 129 (0.9%) |
| 35 to 64 Years | 797 (3.7%) | 521 (2.6%) |
| 65 to 74 Years | 796 (17.2%) | 253 (4.9%) |
| 75 Years and over | 999 (35.6%) | 956 (25.0%) |
Disability Class: Vision Difficulty
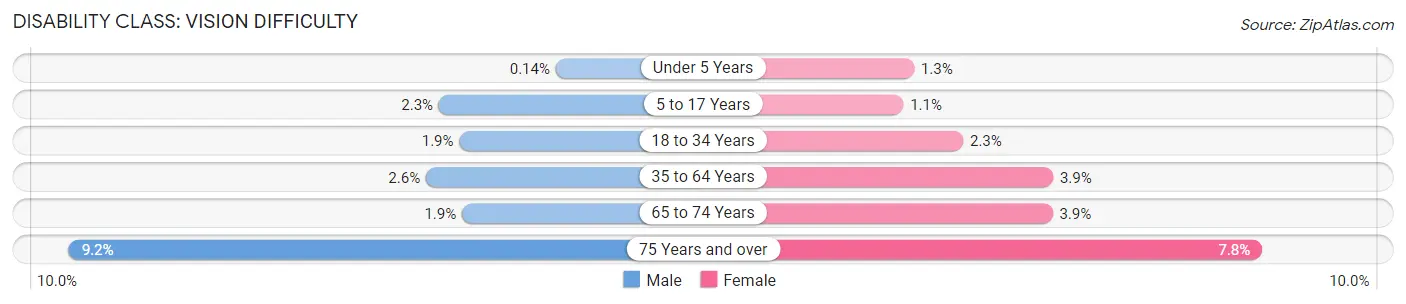
| Age Bracket | Male | Female |
| Under 5 Years | 7 (0.1%) | 63 (1.3%) |
| 5 to 17 Years | 329 (2.3%) | 157 (1.1%) |
| 18 to 34 Years | 266 (1.9%) | 308 (2.2%) |
| 35 to 64 Years | 546 (2.5%) | 796 (3.9%) |
| 65 to 74 Years | 87 (1.9%) | 203 (3.9%) |
| 75 Years and over | 258 (9.2%) | 298 (7.8%) |
Disability Class: Cognitive Difficulty
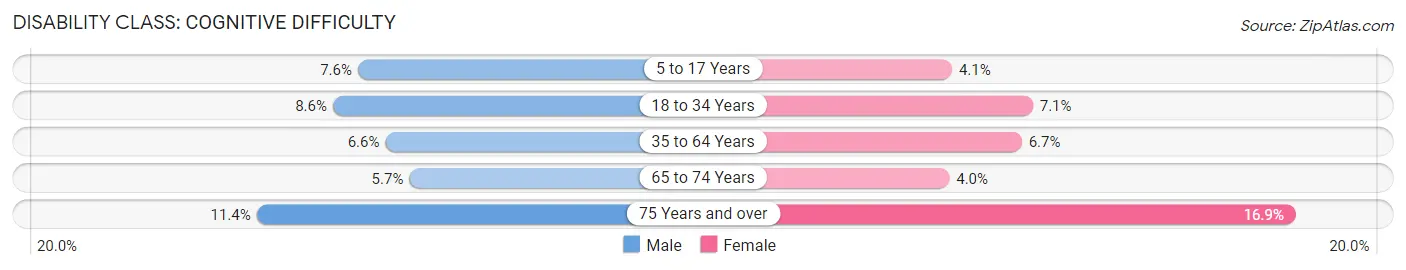
| Age Bracket | Male | Female |
| 5 to 17 Years | 1,085 (7.6%) | 562 (4.1%) |
| 18 to 34 Years | 1,178 (8.6%) | 969 (7.1%) |
| 35 to 64 Years | 1,416 (6.6%) | 1,355 (6.7%) |
| 65 to 74 Years | 265 (5.7%) | 207 (4.0%) |
| 75 Years and over | 320 (11.4%) | 644 (16.9%) |
Disability Class: Ambulatory Difficulty
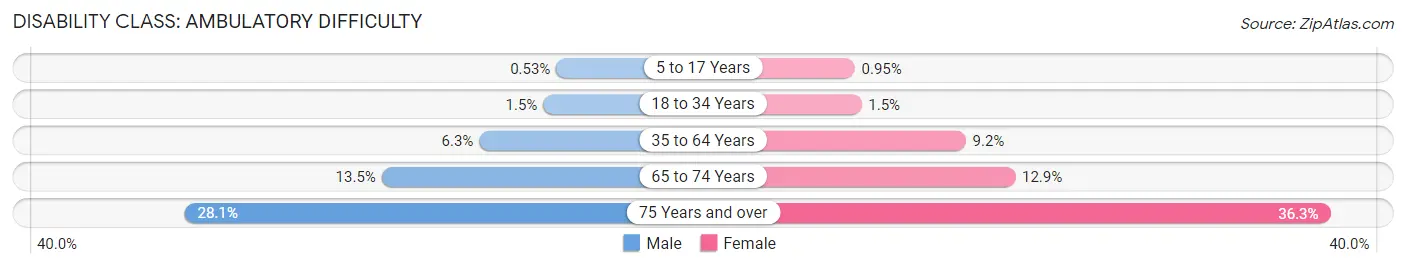
| Age Bracket | Male | Female |
| 5 to 17 Years | 76 (0.5%) | 131 (0.9%) |
| 18 to 34 Years | 207 (1.5%) | 198 (1.5%) |
| 35 to 64 Years | 1,339 (6.2%) | 1,864 (9.2%) |
| 65 to 74 Years | 625 (13.5%) | 667 (12.9%) |
| 75 Years and over | 790 (28.1%) | 1,386 (36.3%) |
Disability Class: Self-Care Difficulty
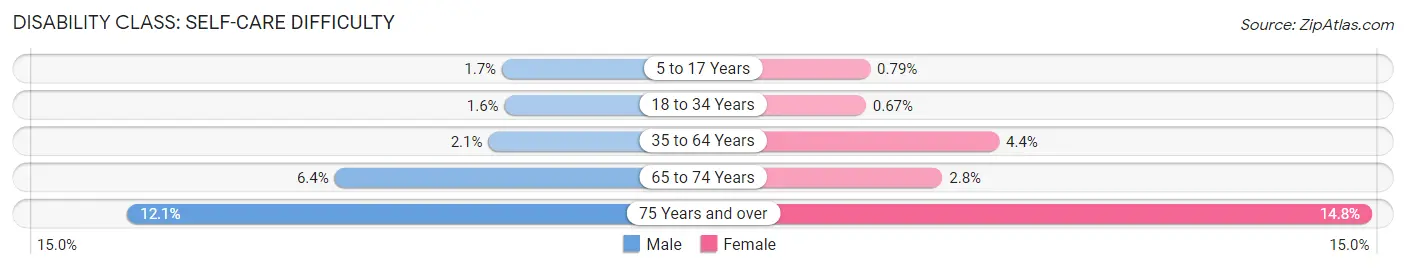
| Age Bracket | Male | Female |
| 5 to 17 Years | 243 (1.7%) | 109 (0.8%) |
| 18 to 34 Years | 226 (1.6%) | 92 (0.7%) |
| 35 to 64 Years | 448 (2.1%) | 889 (4.4%) |
| 65 to 74 Years | 295 (6.4%) | 145 (2.8%) |
| 75 Years and over | 341 (12.1%) | 564 (14.8%) |
Technology Access in Bonneville County
Computing Device Access in Bonneville County
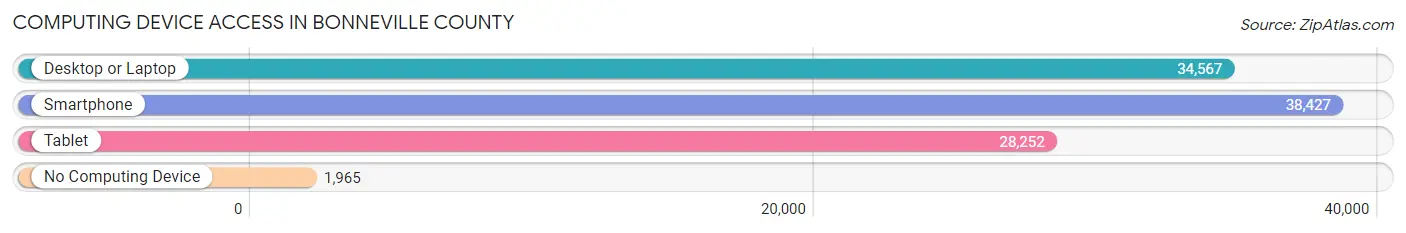
| Device Type | # Households | % Households |
| Desktop or Laptop | 34,567 | 81.5% |
| Smartphone | 38,427 | 90.6% |
| Tablet | 28,252 | 66.6% |
| No Computing Device | 1,965 | 4.6% |
| Total | 42,402 | 100.0% |
Internet Access in Bonneville County
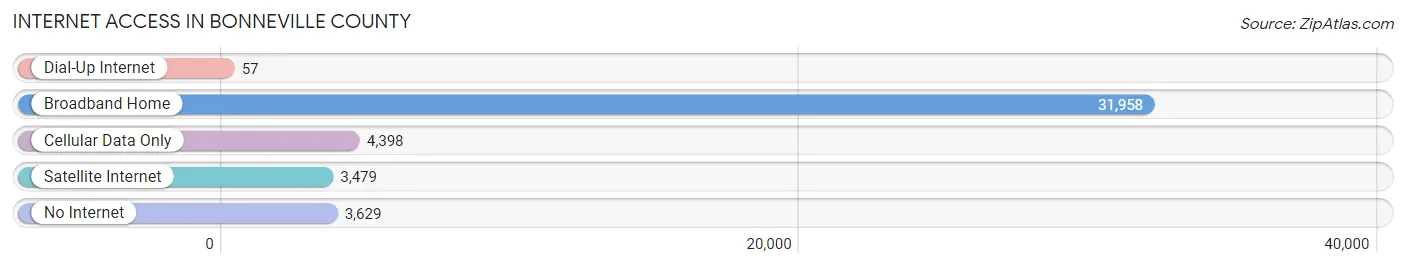
| Internet Type | # Households | % Households |
| Dial-Up Internet | 57 | 0.1% |
| Broadband Home | 31,958 | 75.4% |
| Cellular Data Only | 4,398 | 10.4% |
| Satellite Internet | 3,479 | 8.2% |
| No Internet | 3,629 | 8.6% |
| Total | 42,402 | 100.0% |
Bonneville County Summary
Bonneville County, Idaho is located in the southeastern corner of the state and is part of the Idaho Falls Metropolitan Statistical Area. It is bordered by Madison County to the north, Jefferson County to the east, Bingham County to the south, and Caribou County to the west. The county seat is Idaho Falls, which is also the largest city in the county. Bonneville County covers an area of 1,822 square miles and has a population of 104,234 as of the 2020 census.
History
Bonneville County was established in 1911 and named after Benjamin Bonneville, an explorer and fur trader who explored the area in the early 1800s. The county was originally part of Bingham County, which was created in 1885. The county was created to provide better government services to the growing population in the area.
The county was initially populated by Native American tribes, including the Shoshone, Bannock, and Paiute. The first white settlers arrived in the area in the late 1800s, and the county was officially established in 1911.
Geography
Bonneville County is located in the southeastern corner of Idaho and is part of the Idaho Falls Metropolitan Statistical Area. It is bordered by Madison County to the north, Jefferson County to the east, Bingham County to the south, and Caribou County to the west. The county covers an area of 1,822 square miles and has a population of 104,234 as of the 2020 census.
The county is located in the Snake River Plain, which is a flat, arid region of the state. The Snake River runs through the county, and there are several smaller rivers and streams in the area. The county is also home to several lakes, including American Falls Reservoir, Island Park Reservoir, and Henrys Lake.
Economy
Bonneville County has a diverse economy that is driven by agriculture, manufacturing, and tourism. Agriculture is the largest sector of the economy, and the county is home to several large farms and ranches. The county is also home to several manufacturing companies, including Idahoan Foods, Idaho Milk Products, and Idaho Steel.
Tourism is also an important part of the economy, and the county is home to several popular attractions, including the Idaho Falls Zoo, the Museum of Idaho, and the Idaho Falls Greenbelt.
Demographics
As of the 2020 census, Bonneville County had a population of 104,234. The population is predominantly white (90.2%), with smaller percentages of Hispanic (4.2%), Asian (2.2%), and African American (1.2%) residents. The median household income in the county is $50,945, and the median age is 34.7 years. The county has a poverty rate of 11.2%, and the unemployment rate is 3.7%.
Common Questions
What is the Total Population of Bonneville County?
Total Population of Bonneville County is 124,490.
What is the Total Male Population of Bonneville County?
Total Male Population of Bonneville County is 62,477.
What is the Total Female Population of Bonneville County?
Total Female Population of Bonneville County is 62,013.
What is the Ratio of Males per 100 Females in Bonneville County?
There are 100.75 Males per 100 Females in Bonneville County.
What is the Ratio of Females per 100 Males in Bonneville County?
There are 99.26 Females per 100 Males in Bonneville County.
What is the Median Population Age in Bonneville County?
Median Population Age in Bonneville County is 33.2 Years.
What is the Average Family Size in Bonneville County
Average Family Size in Bonneville County is 3.5 People.
What is the Average Household Size in Bonneville County
Average Household Size in Bonneville County is 2.9 People.
What is Per Capita Income in Bonneville County?
Per Capita income in Bonneville County is $33,008.
What is the Median Family Income in Bonneville County?
Median Family Income in Bonneville County is $86,252.
What is the Median Household income in Bonneville County?
Median Household Income in Bonneville County is $73,103.
What is Income or Wage Gap in Bonneville County?
Income or Wage Gap in Bonneville County is 45.3%.
Women in Bonneville County earn 54.7 cents for every dollar earned by a man.
What is Family Income Deficit in Bonneville County?
Family Income Deficit in Bonneville County is $9,756.
Families that are below poverty line in Bonneville County earn $9,756 less on average than the poverty threshold level.
What is Inequality or Gini Index in Bonneville County?
Inequality or Gini Index in Bonneville County is 0.43.
How Large is the Labor Force in Bonneville County?
There are 58,932 People in the Labor Forcein in Bonneville County.
What is the Percentage of People in the Labor Force in Bonneville County?
64.8% of People are in the Labor Force in Bonneville County.
What is the Unemployment Rate in Bonneville County?
Unemployment Rate in Bonneville County is 4.6%.