Bonner County, ID
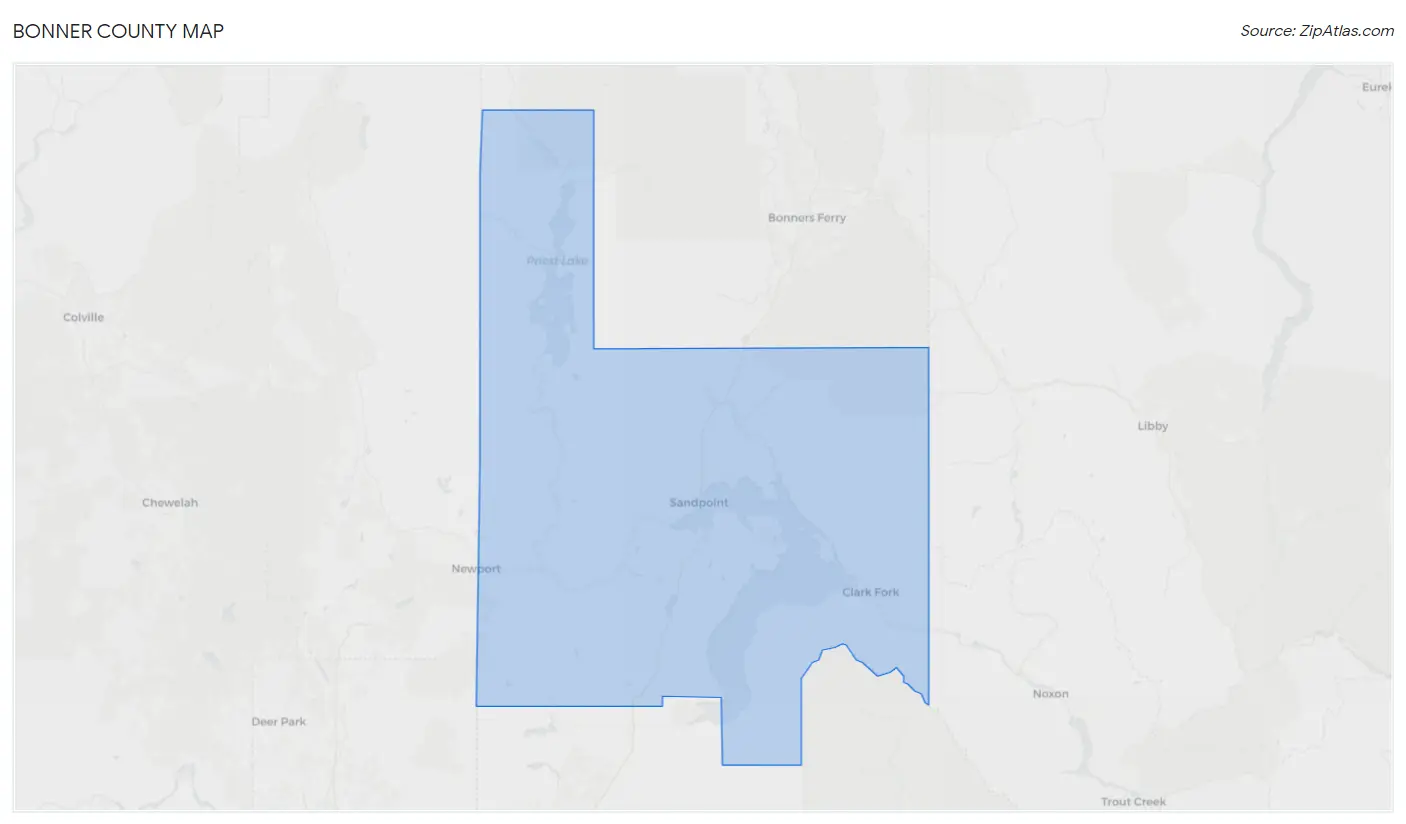
Bonner County Map
Bonner County Overview
47,976
TOTAL POPULATION
24,159
MALE POPULATION
23,817
FEMALE POPULATION
101.44
MALES / 100 FEMALES
98.58
FEMALES / 100 MALES
48.3
MEDIAN AGE
2.9
AVG FAMILY SIZE
2.5
AVG HOUSEHOLD SIZE
$35,275
PER CAPITA INCOME
$75,275
AVG FAMILY INCOME
$61,816
AVG HOUSEHOLD INCOME
39.8%
WAGE / INCOME GAP [ % ]
60.2¢/ $1
WAGE / INCOME GAP [ $ ]
$9,314
FAMILY INCOME DEFICIT
0.45
INEQUALITY / GINI INDEX
20,727
LABOR FORCE [ PEOPLE ]
52.1%
PERCENT IN LABOR FORCE
3.5%
UNEMPLOYMENT RATE
Bonner County Area Codes
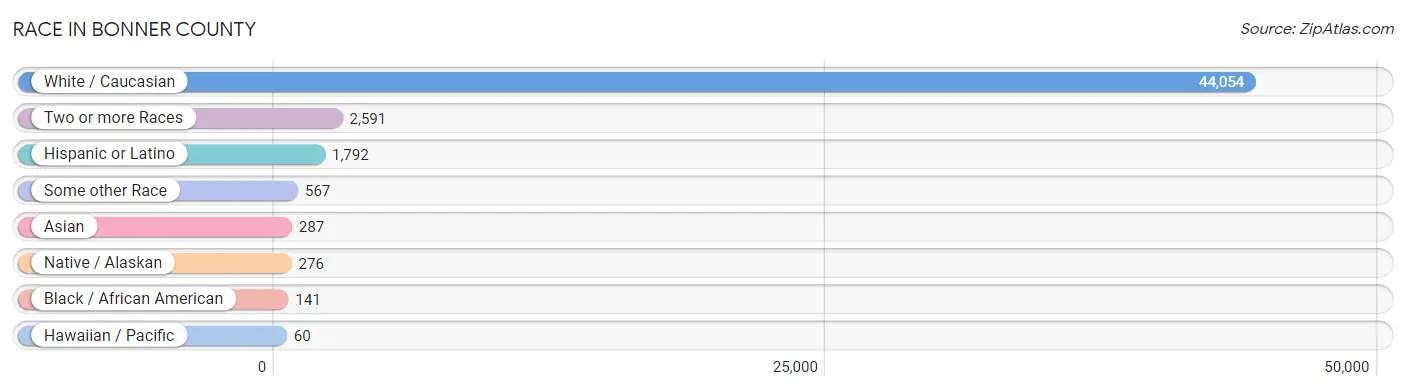
Race in Bonner County
The most populous races in Bonner County are White / Caucasian (44,054 | 91.8%), Two or more Races (2,591 | 5.4%), and Hispanic or Latino (1,792 | 3.7%).
| Race | # Population | % Population |
| Asian | 287 | 0.6% |
| Black / African American | 141 | 0.3% |
| Hawaiian / Pacific | 60 | 0.1% |
| Hispanic or Latino | 1,792 | 3.7% |
| Native / Alaskan | 276 | 0.6% |
| White / Caucasian | 44,054 | 91.8% |
| Two or more Races | 2,591 | 5.4% |
| Some other Race | 567 | 1.2% |
| Total | 47,976 | 100.0% |
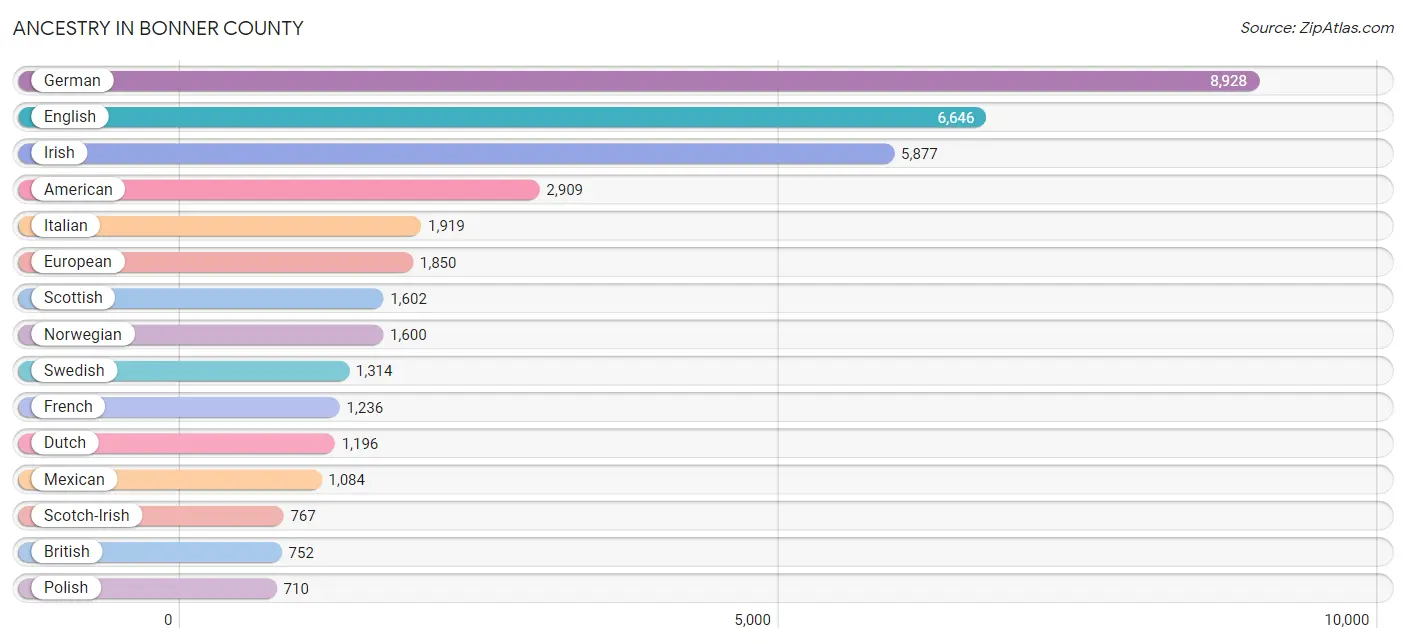
Ancestry in Bonner County
The most populous ancestries reported in Bonner County are German (8,928 | 18.6%), English (6,646 | 13.9%), Irish (5,877 | 12.2%), American (2,909 | 6.1%), and Italian (1,919 | 4.0%), together accounting for 54.8% of all Bonner County residents.
| Ancestry | # Population | % Population |
| African | 2 | 0.0% |
| American | 2,909 | 6.1% |
| Apache | 3 | 0.0% |
| Arab | 132 | 0.3% |
| Argentinean | 36 | 0.1% |
| Australian | 23 | 0.1% |
| Austrian | 165 | 0.3% |
| Basque | 28 | 0.1% |
| Belgian | 15 | 0.0% |
| Belizean | 26 | 0.1% |
| Bhutanese | 259 | 0.5% |
| Blackfeet | 43 | 0.1% |
| Brazilian | 27 | 0.1% |
| British | 752 | 1.6% |
| Burmese | 84 | 0.2% |
| Cajun | 1 | 0.0% |
| Canadian | 142 | 0.3% |
| Celtic | 11 | 0.0% |
| Central American | 61 | 0.1% |
| Cherokee | 465 | 1.0% |
| Chickasaw | 14 | 0.0% |
| Chinese | 1 | 0.0% |
| Chippewa | 16 | 0.0% |
| Choctaw | 44 | 0.1% |
| Colombian | 21 | 0.0% |
| Colville | 31 | 0.1% |
| Cree | 1 | 0.0% |
| Croatian | 127 | 0.3% |
| Cuban | 87 | 0.2% |
| Czech | 160 | 0.3% |
| Czechoslovakian | 19 | 0.0% |
| Danish | 365 | 0.8% |
| Dutch | 1,196 | 2.5% |
| Eastern European | 108 | 0.2% |
| Egyptian | 2 | 0.0% |
| English | 6,646 | 13.9% |
| Ethiopian | 9 | 0.0% |
| European | 1,850 | 3.9% |
| Fijian | 8 | 0.0% |
| Finnish | 206 | 0.4% |
| French | 1,236 | 2.6% |
| French American Indian | 41 | 0.1% |
| French Canadian | 257 | 0.5% |
| German | 8,928 | 18.6% |
| Greek | 124 | 0.3% |
| Hungarian | 177 | 0.4% |
| Icelander | 30 | 0.1% |
| Indian (Asian) | 177 | 0.4% |
| Inupiat | 19 | 0.0% |
| Irish | 5,877 | 12.2% |
| Iroquois | 3 | 0.0% |
| Italian | 1,919 | 4.0% |
| Korean | 185 | 0.4% |
| Lebanese | 130 | 0.3% |
| Lithuanian | 169 | 0.4% |
| Luxembourger | 26 | 0.1% |
| Macedonian | 3 | 0.0% |
| Mexican | 1,084 | 2.3% |
| Mexican American Indian | 100 | 0.2% |
| Native Hawaiian | 107 | 0.2% |
| Navajo | 3 | 0.0% |
| Nicaraguan | 44 | 0.1% |
| Northern European | 136 | 0.3% |
| Norwegian | 1,600 | 3.3% |
| Osage | 2 | 0.0% |
| Pakistani | 47 | 0.1% |
| Pennsylvania German | 14 | 0.0% |
| Peruvian | 80 | 0.2% |
| Polish | 710 | 1.5% |
| Portuguese | 164 | 0.3% |
| Puerto Rican | 69 | 0.1% |
| Puget Sound Salish | 11 | 0.0% |
| Romanian | 223 | 0.5% |
| Russian | 218 | 0.4% |
| Salvadoran | 17 | 0.0% |
| Scandinavian | 368 | 0.8% |
| Scotch-Irish | 767 | 1.6% |
| Scottish | 1,602 | 3.3% |
| Shoshone | 11 | 0.0% |
| Slavic | 27 | 0.1% |
| Slovak | 15 | 0.0% |
| Slovene | 73 | 0.2% |
| South African | 16 | 0.0% |
| South American | 137 | 0.3% |
| Spaniard | 184 | 0.4% |
| Spanish | 98 | 0.2% |
| Sri Lankan | 19 | 0.0% |
| Subsaharan African | 27 | 0.1% |
| Swedish | 1,314 | 2.7% |
| Swiss | 198 | 0.4% |
| Thai | 7 | 0.0% |
| Tlingit-Haida | 49 | 0.1% |
| Tongan | 5 | 0.0% |
| Ukrainian | 111 | 0.2% |
| Welsh | 246 | 0.5% |
| Yakama | 31 | 0.1% |
| Yugoslavian | 15 | 0.0% | View All 97 Rows |
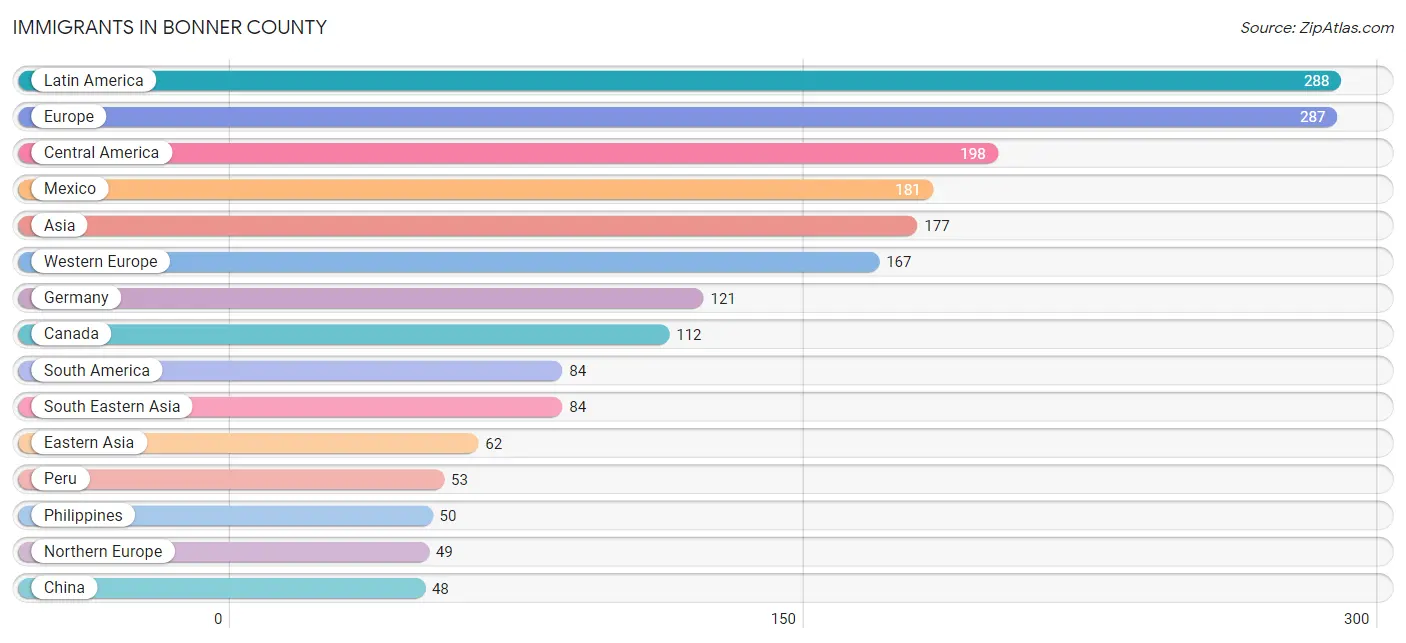
Immigrants in Bonner County
The most numerous immigrant groups reported in Bonner County came from Latin America (288 | 0.6%), Europe (287 | 0.6%), Central America (198 | 0.4%), Mexico (181 | 0.4%), and Asia (177 | 0.4%), together accounting for 2.4% of all Bonner County residents.
| Immigration Origin | # Population | % Population |
| Africa | 27 | 0.1% |
| Argentina | 8 | 0.0% |
| Asia | 177 | 0.4% |
| Australia | 8 | 0.0% |
| Austria | 2 | 0.0% |
| Belgium | 6 | 0.0% |
| Canada | 112 | 0.2% |
| Caribbean | 6 | 0.0% |
| Central America | 198 | 0.4% |
| China | 48 | 0.1% |
| Colombia | 21 | 0.0% |
| Cuba | 6 | 0.0% |
| Czechoslovakia | 5 | 0.0% |
| Eastern Africa | 9 | 0.0% |
| Eastern Asia | 62 | 0.1% |
| Eastern Europe | 40 | 0.1% |
| Egypt | 2 | 0.0% |
| El Salvador | 17 | 0.0% |
| England | 19 | 0.0% |
| Ethiopia | 9 | 0.0% |
| Europe | 287 | 0.6% |
| France | 22 | 0.1% |
| Germany | 121 | 0.3% |
| Guyana | 2 | 0.0% |
| Hungary | 9 | 0.0% |
| Indonesia | 13 | 0.0% |
| Italy | 9 | 0.0% |
| Korea | 14 | 0.0% |
| Latin America | 288 | 0.6% |
| Mexico | 181 | 0.4% |
| Nepal | 31 | 0.1% |
| Netherlands | 16 | 0.0% |
| North Macedonia | 3 | 0.0% |
| Northern Africa | 2 | 0.0% |
| Northern Europe | 49 | 0.1% |
| Norway | 11 | 0.0% |
| Oceania | 8 | 0.0% |
| Peru | 53 | 0.1% |
| Philippines | 50 | 0.1% |
| Poland | 3 | 0.0% |
| Portugal | 9 | 0.0% |
| Romania | 8 | 0.0% |
| Russia | 1 | 0.0% |
| South Africa | 16 | 0.0% |
| South America | 84 | 0.2% |
| South Central Asia | 31 | 0.1% |
| South Eastern Asia | 84 | 0.2% |
| Southern Europe | 18 | 0.0% |
| Sweden | 7 | 0.0% |
| Thailand | 18 | 0.0% |
| Ukraine | 11 | 0.0% |
| Vietnam | 3 | 0.0% |
| Western Europe | 167 | 0.4% | View All 53 Rows |
Sex and Age in Bonner County
Sex and Age in Bonner County
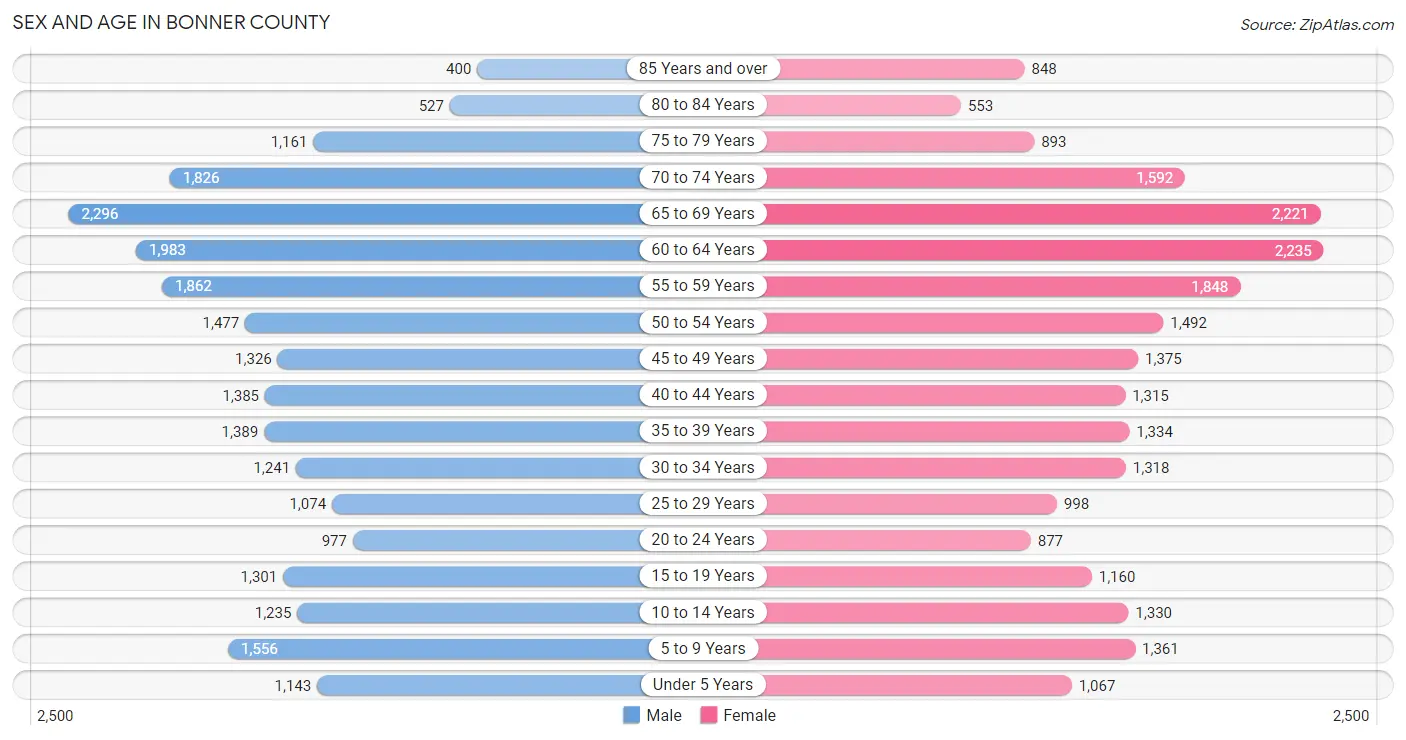
The most populous age groups in Bonner County are 65 to 69 Years (2,296 | 9.5%) for men and 60 to 64 Years (2,235 | 9.4%) for women.
| Age Bracket | Male | Female |
| Under 5 Years | 1,143 (4.7%) | 1,067 (4.5%) |
| 5 to 9 Years | 1,556 (6.4%) | 1,361 (5.7%) |
| 10 to 14 Years | 1,235 (5.1%) | 1,330 (5.6%) |
| 15 to 19 Years | 1,301 (5.4%) | 1,160 (4.9%) |
| 20 to 24 Years | 977 (4.0%) | 877 (3.7%) |
| 25 to 29 Years | 1,074 (4.4%) | 998 (4.2%) |
| 30 to 34 Years | 1,241 (5.1%) | 1,318 (5.5%) |
| 35 to 39 Years | 1,389 (5.8%) | 1,334 (5.6%) |
| 40 to 44 Years | 1,385 (5.7%) | 1,315 (5.5%) |
| 45 to 49 Years | 1,326 (5.5%) | 1,375 (5.8%) |
| 50 to 54 Years | 1,477 (6.1%) | 1,492 (6.3%) |
| 55 to 59 Years | 1,862 (7.7%) | 1,848 (7.8%) |
| 60 to 64 Years | 1,983 (8.2%) | 2,235 (9.4%) |
| 65 to 69 Years | 2,296 (9.5%) | 2,221 (9.3%) |
| 70 to 74 Years | 1,826 (7.6%) | 1,592 (6.7%) |
| 75 to 79 Years | 1,161 (4.8%) | 893 (3.7%) |
| 80 to 84 Years | 527 (2.2%) | 553 (2.3%) |
| 85 Years and over | 400 (1.7%) | 848 (3.6%) |
| Total | 24,159 (100.0%) | 23,817 (100.0%) |
Families and Households in Bonner County
Median Family Size in Bonner County
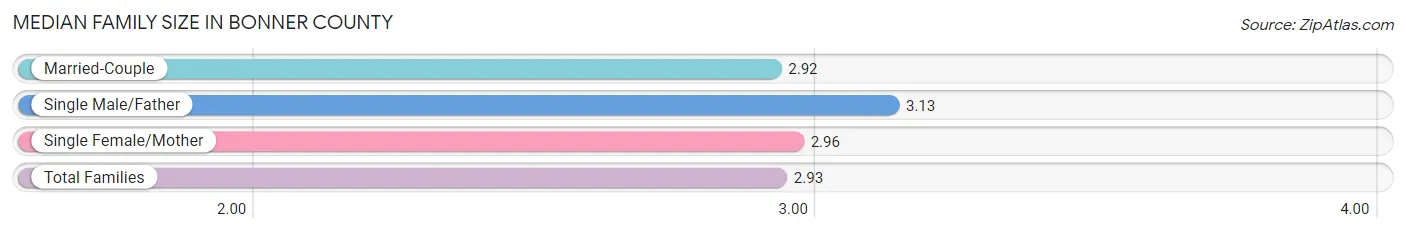
The median family size in Bonner County is 2.93 persons per family, with single male/father families (791 | 6.0%) accounting for the largest median family size of 3.13 persons per family. On the other hand, married-couple families (11,097 | 84.5%) represent the smallest median family size with 2.92 persons per family.
| Family Type | # Families | Family Size |
| Married-Couple | 11,097 (84.5%) | 2.92 |
| Single Male/Father | 791 (6.0%) | 3.13 |
| Single Female/Mother | 1,252 (9.5%) | 2.96 |
| Total Families | 13,140 (100.0%) | 2.93 |
Median Household Size in Bonner County
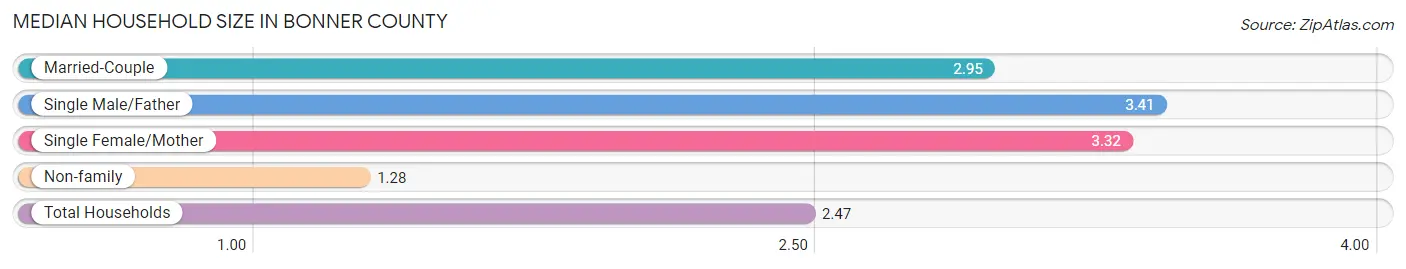
The median household size in Bonner County is 2.47 persons per household, with single male/father households (791 | 4.1%) accounting for the largest median household size of 3.41 persons per household. non-family households (6,088 | 31.7%) represent the smallest median household size with 1.28 persons per household.
| Household Type | # Households | Household Size |
| Married-Couple | 11,097 (57.7%) | 2.95 |
| Single Male/Father | 791 (4.1%) | 3.41 |
| Single Female/Mother | 1,252 (6.5%) | 3.32 |
| Non-family | 6,088 (31.7%) | 1.28 |
| Total Households | 19,228 (100.0%) | 2.47 |
Household Size by Marriage Status in Bonner County
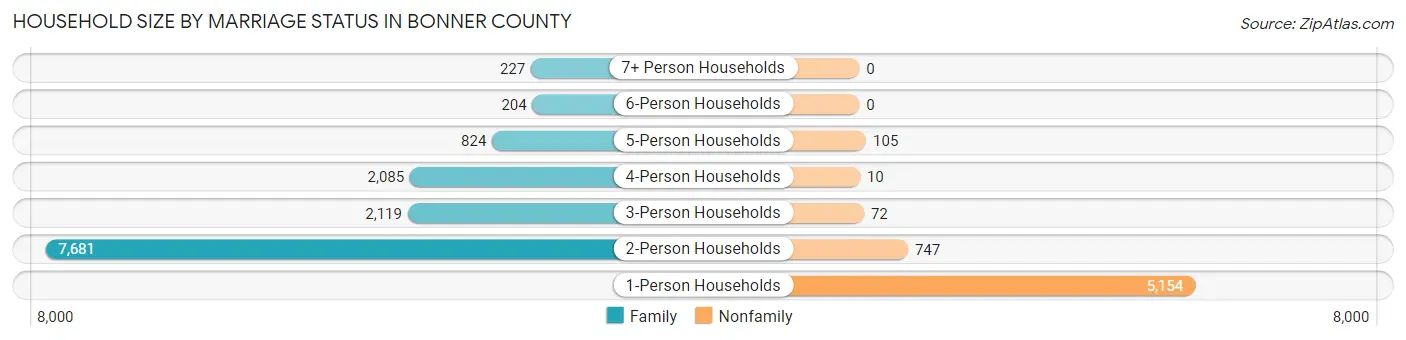
Out of a total of 19,228 households in Bonner County, 13,140 (68.3%) are family households, while 6,088 (31.7%) are nonfamily households. The most numerous type of family households are 2-person households, comprising 7,681, and the most common type of nonfamily households are 1-person households, comprising 5,154.
| Household Size | Family Households | Nonfamily Households |
| 1-Person Households | - | 5,154 (26.8%) |
| 2-Person Households | 7,681 (40.0%) | 747 (3.9%) |
| 3-Person Households | 2,119 (11.0%) | 72 (0.4%) |
| 4-Person Households | 2,085 (10.8%) | 10 (0.1%) |
| 5-Person Households | 824 (4.3%) | 105 (0.5%) |
| 6-Person Households | 204 (1.1%) | 0 (0.0%) |
| 7+ Person Households | 227 (1.2%) | 0 (0.0%) |
| Total | 13,140 (68.3%) | 6,088 (31.7%) |
Female Fertility in Bonner County
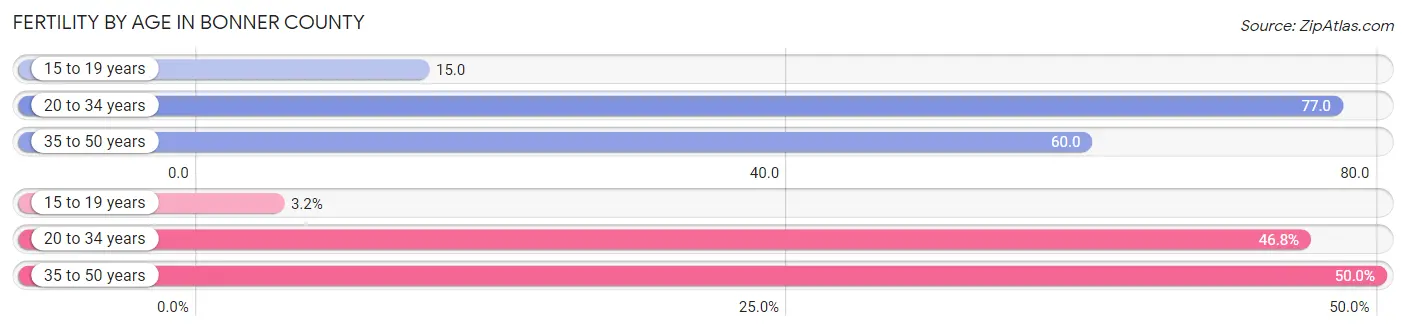
Fertility by Age in Bonner County
Average fertility rate in Bonner County is 60.0 births per 1,000 women. Women in the age bracket of 20 to 34 years have the highest fertility rate with 77.0 births per 1,000 women. Women in the age bracket of 35 to 50 years acount for 50.0% of all women with births.
| Age Bracket | Women with Births | Births / 1,000 Women |
| 15 to 19 years | 17 (3.2%) | 15.0 |
| 20 to 34 years | 247 (46.8%) | 77.0 |
| 35 to 50 years | 264 (50.0%) | 60.0 |
| Total | 528 (100.0%) | 60.0 |
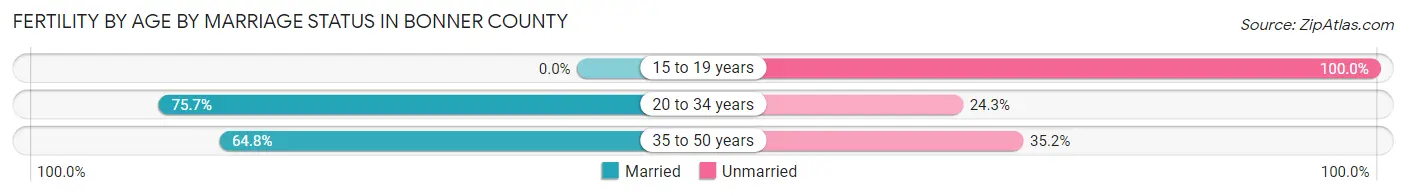
Fertility by Age by Marriage Status in Bonner County
67.8% of women with births (528) in Bonner County are married. The highest percentage of unmarried women with births falls into 15 to 19 years age bracket with 100.0% of them unmarried at the time of birth, while the lowest percentage of unmarried women with births belong to 20 to 34 years age bracket with 24.3% of them unmarried.
| Age Bracket | Married | Unmarried |
| 15 to 19 years | 0 (0.0%) | 17 (100.0%) |
| 20 to 34 years | 187 (75.7%) | 60 (24.3%) |
| 35 to 50 years | 171 (64.8%) | 93 (35.2%) |
| Total | 358 (67.8%) | 170 (32.2%) |
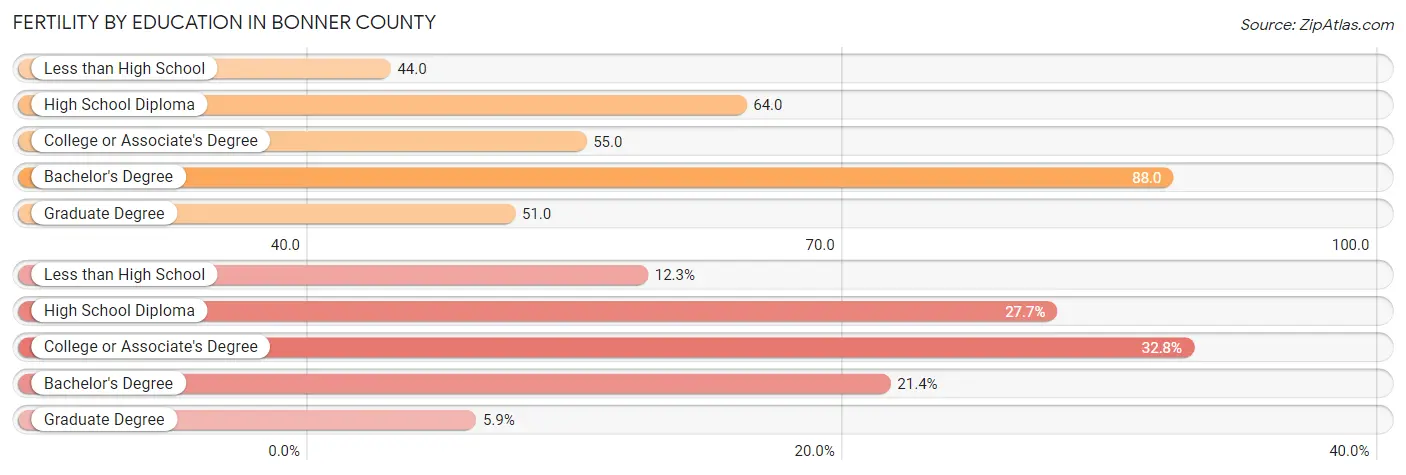
Fertility by Education in Bonner County
Average fertility rate in Bonner County is 60.0 births per 1,000 women. Women with the education attainment of bachelor's degree have the highest fertility rate of 88.0 births per 1,000 women, while women with the education attainment of less than high school have the lowest fertility at 44.0 births per 1,000 women. Women with the education attainment of college or associate's degree represent 32.8% of all women with births.
| Educational Attainment | Women with Births | Births / 1,000 Women |
| Less than High School | 65 (12.3%) | 44.0 |
| High School Diploma | 146 (27.7%) | 64.0 |
| College or Associate's Degree | 173 (32.8%) | 55.0 |
| Bachelor's Degree | 113 (21.4%) | 88.0 |
| Graduate Degree | 31 (5.9%) | 51.0 |
| Total | 528 (100.0%) | 60.0 |
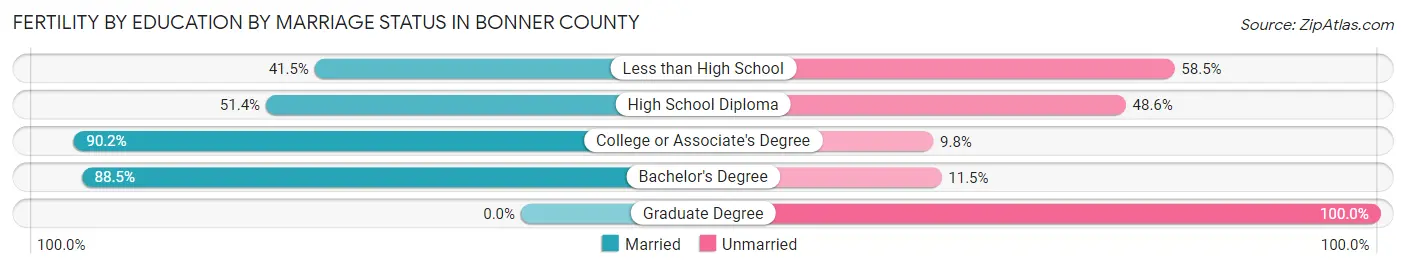
Fertility by Education by Marriage Status in Bonner County
32.2% of women with births in Bonner County are unmarried. Women with the educational attainment of college or associate's degree are most likely to be married with 90.2% of them married at childbirth, while women with the educational attainment of graduate degree are least likely to be married with 100.0% of them unmarried at childbirth.
| Educational Attainment | Married | Unmarried |
| Less than High School | 27 (41.5%) | 38 (58.5%) |
| High School Diploma | 75 (51.4%) | 71 (48.6%) |
| College or Associate's Degree | 156 (90.2%) | 17 (9.8%) |
| Bachelor's Degree | 100 (88.5%) | 13 (11.5%) |
| Graduate Degree | 0 (0.0%) | 31 (100.0%) |
| Total | 358 (67.8%) | 170 (32.2%) |
Income in Bonner County
Income Overview in Bonner County
Per Capita Income in Bonner County is $35,275, while median incomes of families and households are $75,275 and $61,816 respectively.
| Characteristic | Number | Measure |
| Per Capita Income | 47,976 | $35,275 |
| Median Family Income | 13,140 | $75,275 |
| Mean Family Income | 13,140 | $94,653 |
| Median Household Income | 19,228 | $61,816 |
| Mean Household Income | 19,228 | $83,879 |
| Income Deficit | 13,140 | $9,314 |
| Wage / Income Gap (%) | 47,976 | 39.79% |
| Wage / Income Gap ($) | 47,976 | 60.21¢ per $1 |
| Gini / Inequality Index | 47,976 | 0.45 |
Earnings by Sex in Bonner County
Average Earnings in Bonner County are $32,943, $41,612 for men and $25,054 for women, a difference of 39.8%.
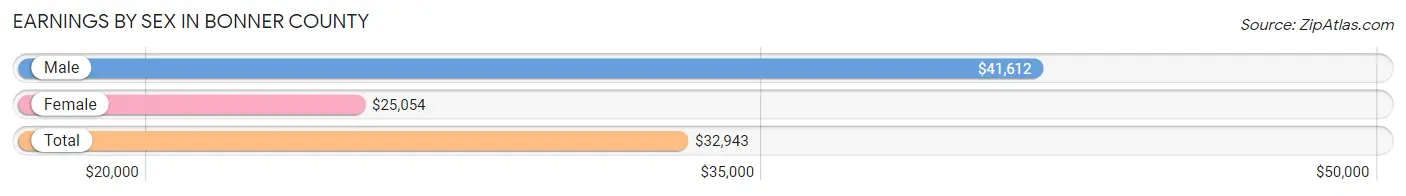
| Sex | Number | Average Earnings |
| Male | 12,090 (53.0%) | $41,612 |
| Female | 10,730 (47.0%) | $25,054 |
| Total | 22,820 (100.0%) | $32,943 |
Earnings by Sex by Income Bracket in Bonner County
The most common earnings brackets in Bonner County are $100,000+ for men (1,499 | 12.4%) and $2,499 or less for women (1,212 | 11.3%).
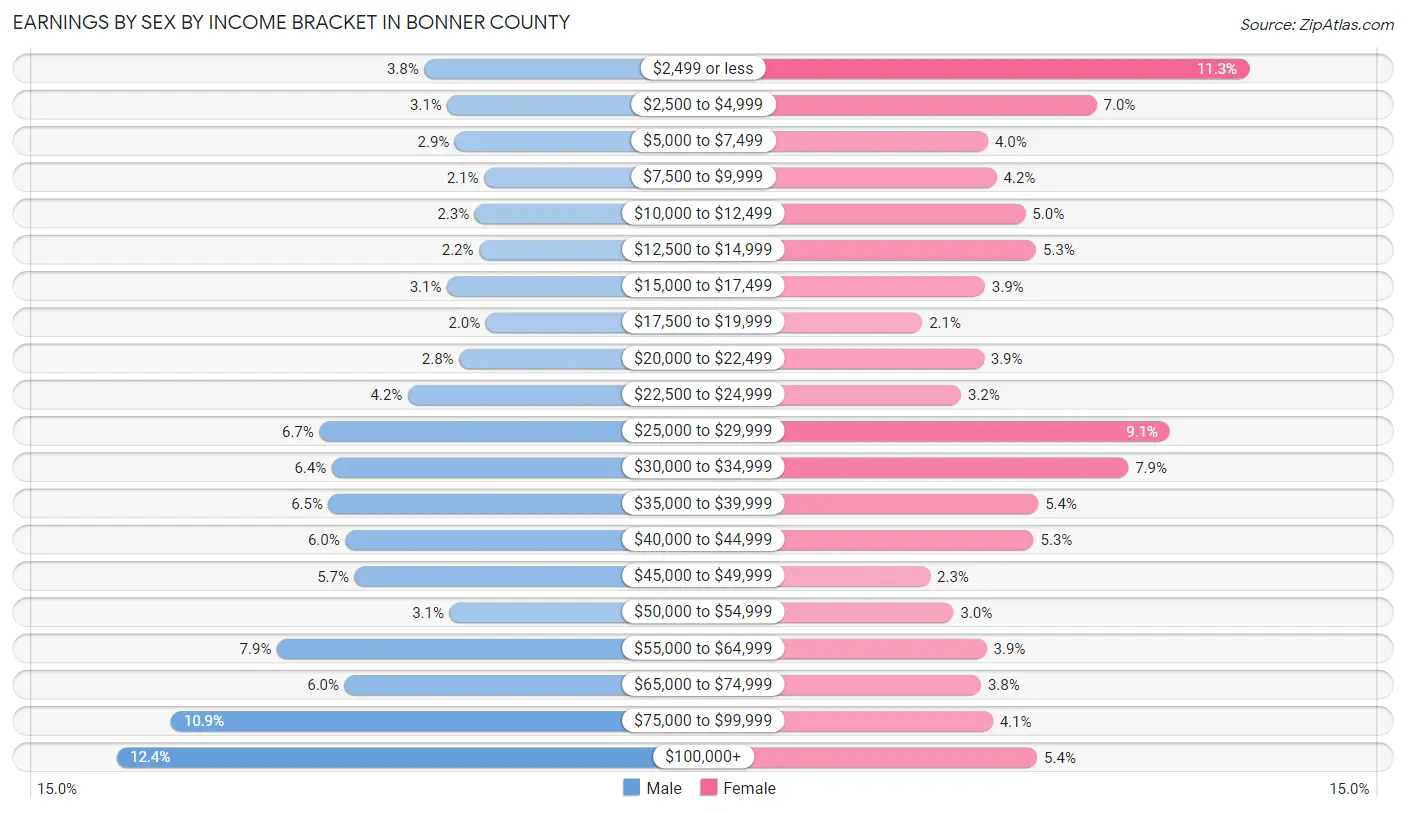
| Income | Male | Female |
| $2,499 or less | 454 (3.8%) | 1,212 (11.3%) |
| $2,500 to $4,999 | 376 (3.1%) | 753 (7.0%) |
| $5,000 to $7,499 | 351 (2.9%) | 426 (4.0%) |
| $7,500 to $9,999 | 251 (2.1%) | 452 (4.2%) |
| $10,000 to $12,499 | 283 (2.3%) | 539 (5.0%) |
| $12,500 to $14,999 | 268 (2.2%) | 571 (5.3%) |
| $15,000 to $17,499 | 377 (3.1%) | 416 (3.9%) |
| $17,500 to $19,999 | 245 (2.0%) | 228 (2.1%) |
| $20,000 to $22,499 | 336 (2.8%) | 413 (3.8%) |
| $22,500 to $24,999 | 510 (4.2%) | 344 (3.2%) |
| $25,000 to $29,999 | 811 (6.7%) | 974 (9.1%) |
| $30,000 to $34,999 | 769 (6.4%) | 849 (7.9%) |
| $35,000 to $39,999 | 780 (6.5%) | 577 (5.4%) |
| $40,000 to $44,999 | 723 (6.0%) | 563 (5.2%) |
| $45,000 to $49,999 | 691 (5.7%) | 251 (2.3%) |
| $50,000 to $54,999 | 369 (3.0%) | 322 (3.0%) |
| $55,000 to $64,999 | 955 (7.9%) | 422 (3.9%) |
| $65,000 to $74,999 | 726 (6.0%) | 404 (3.8%) |
| $75,000 to $99,999 | 1,316 (10.9%) | 440 (4.1%) |
| $100,000+ | 1,499 (12.4%) | 574 (5.3%) |
| Total | 12,090 (100.0%) | 10,730 (100.0%) |
Earnings by Sex by Educational Attainment in Bonner County
Average earnings in Bonner County are $45,232 for men and $28,253 for women, a difference of 37.5%. Men with an educational attainment of graduate degree enjoy the highest average annual earnings of $84,896, while those with less than high school education earn the least with $32,019. Women with an educational attainment of graduate degree earn the most with the average annual earnings of $51,618, while those with high school diploma education have the smallest earnings of $25,119.
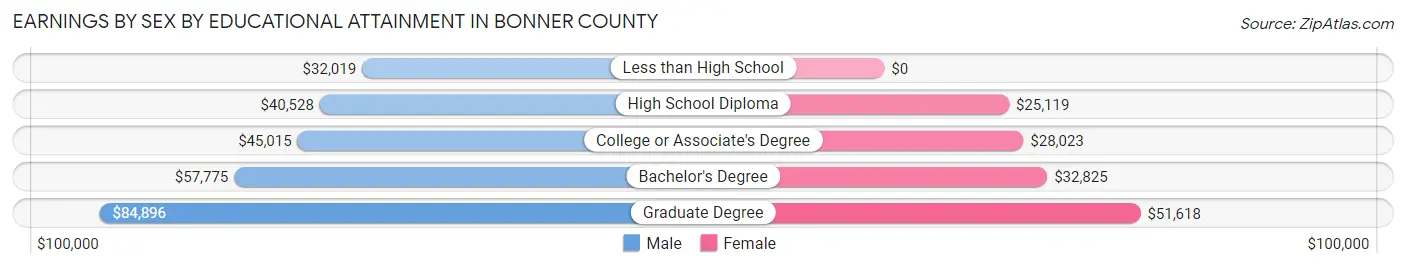
| Educational Attainment | Male Income | Female Income |
| Less than High School | $32,019 | $0 |
| High School Diploma | $40,528 | $25,119 |
| College or Associate's Degree | $45,015 | $28,023 |
| Bachelor's Degree | $57,775 | $32,825 |
| Graduate Degree | $84,896 | $51,618 |
| Total | $45,232 | $28,253 |
Family Income in Bonner County
Family Income Brackets in Bonner County
According to the Bonner County family income data, there are 2,654 families falling into the $50,000 to $74,999 income range, which is the most common income bracket and makes up 20.2% of all families. Conversely, the $10,000 to $14,999 income bracket is the least frequent group with only 276 families (2.1%) belonging to this category.
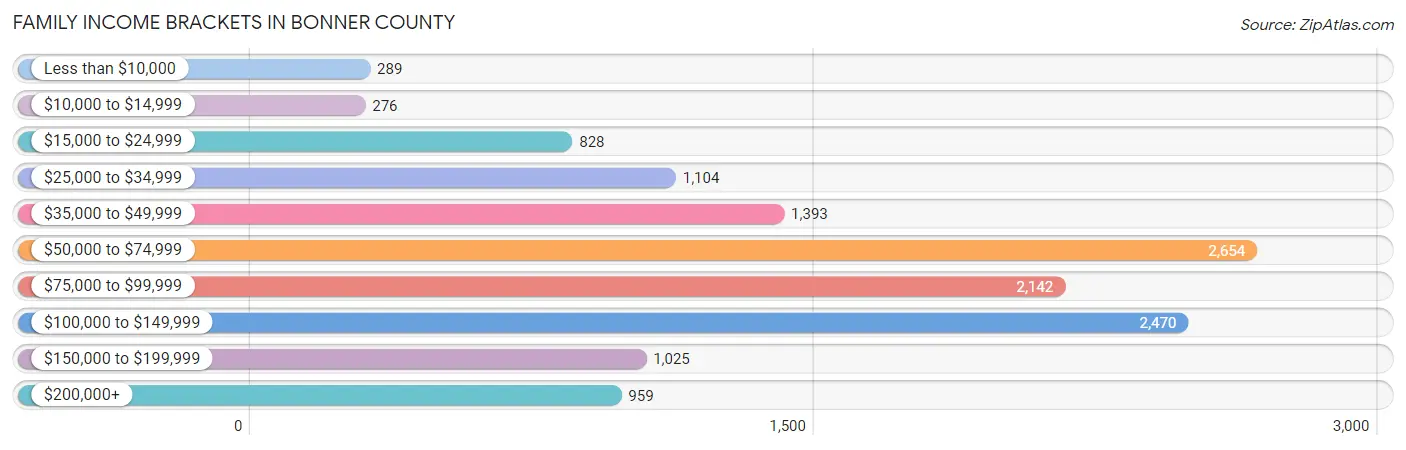
| Income Bracket | # Families | % Families |
| Less than $10,000 | 289 | 2.2% |
| $10,000 to $14,999 | 276 | 2.1% |
| $15,000 to $24,999 | 828 | 6.3% |
| $25,000 to $34,999 | 1,104 | 8.4% |
| $35,000 to $49,999 | 1,393 | 10.6% |
| $50,000 to $74,999 | 2,654 | 20.2% |
| $75,000 to $99,999 | 2,142 | 16.3% |
| $100,000 to $149,999 | 2,470 | 18.8% |
| $150,000 to $199,999 | 1,025 | 7.8% |
| $200,000+ | 959 | 7.3% |
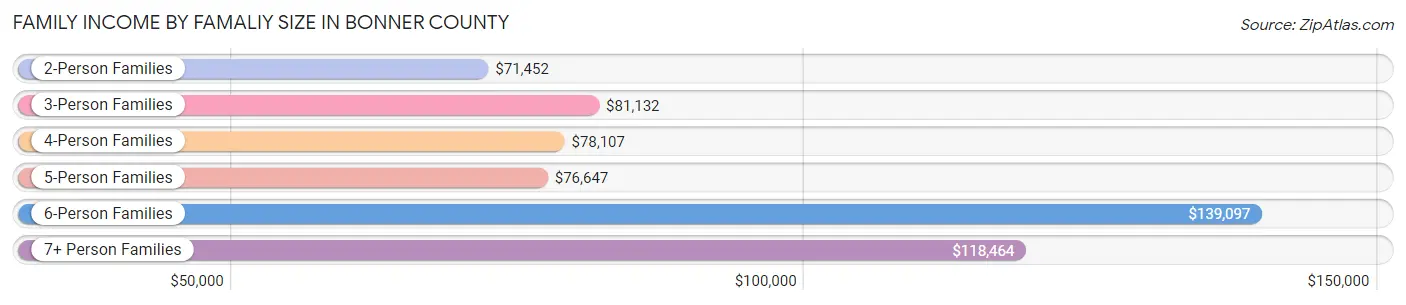
Family Income by Famaliy Size in Bonner County
6-person families (251 | 1.9%) account for the highest median family income in Bonner County with $139,097 per family, while 2-person families (7,921 | 60.3%) have the highest median income of $35,726 per family member.
| Income Bracket | # Families | Median Income |
| 2-Person Families | 7,921 (60.3%) | $71,452 |
| 3-Person Families | 2,196 (16.7%) | $81,132 |
| 4-Person Families | 1,848 (14.1%) | $78,107 |
| 5-Person Families | 771 (5.9%) | $76,647 |
| 6-Person Families | 251 (1.9%) | $139,097 |
| 7+ Person Families | 153 (1.2%) | $118,464 |
| Total | 13,140 (100.0%) | $75,275 |
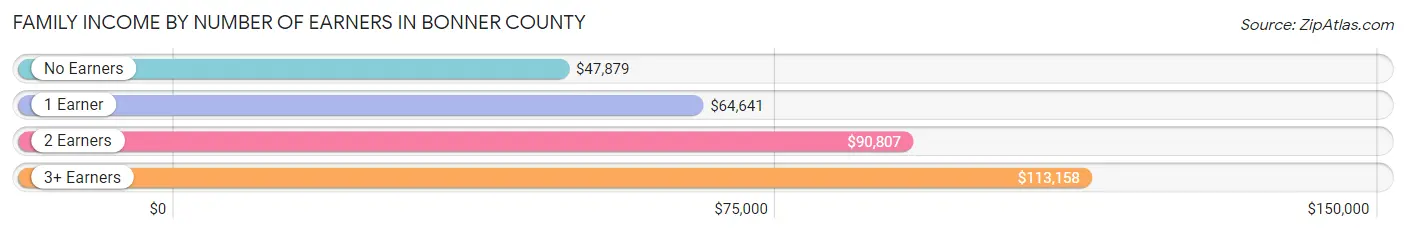
Family Income by Number of Earners in Bonner County
The median family income in Bonner County is $75,275, with families comprising 3+ earners (1,032) having the highest median family income of $113,158, while families with no earners (3,267) have the lowest median family income of $47,879, accounting for 7.9% and 24.9% of families, respectively.
| Number of Earners | # Families | Median Income |
| No Earners | 3,267 (24.9%) | $47,879 |
| 1 Earner | 4,130 (31.4%) | $64,641 |
| 2 Earners | 4,711 (35.8%) | $90,807 |
| 3+ Earners | 1,032 (7.9%) | $113,158 |
| Total | 13,140 (100.0%) | $75,275 |
Household Income in Bonner County
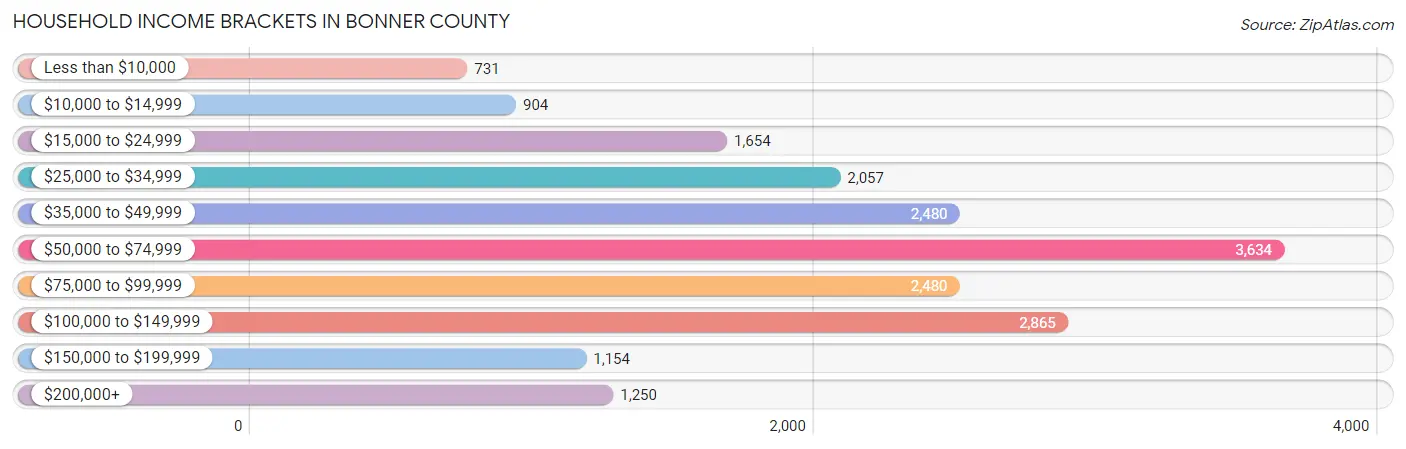
Household Income Brackets in Bonner County
With 3,634 households falling in the category, the $50,000 to $74,999 income range is the most frequent in Bonner County, accounting for 18.9% of all households. In contrast, only 731 households (3.8%) fall into the less than $10,000 income bracket, making it the least populous group.
| Income Bracket | # Households | % Households |
| Less than $10,000 | 731 | 3.8% |
| $10,000 to $14,999 | 904 | 4.7% |
| $15,000 to $24,999 | 1,654 | 8.6% |
| $25,000 to $34,999 | 2,057 | 10.7% |
| $35,000 to $49,999 | 2,480 | 12.9% |
| $50,000 to $74,999 | 3,634 | 18.9% |
| $75,000 to $99,999 | 2,480 | 12.9% |
| $100,000 to $149,999 | 2,865 | 14.9% |
| $150,000 to $199,999 | 1,154 | 6.0% |
| $200,000+ | 1,250 | 6.5% |
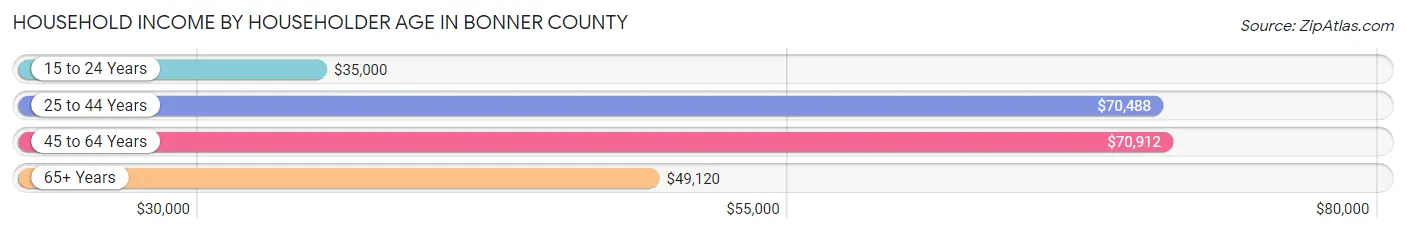
Household Income by Householder Age in Bonner County
The median household income in Bonner County is $61,816, with the highest median household income of $70,912 found in the 45 to 64 years age bracket for the primary householder. A total of 7,530 households (39.2%) fall into this category. Meanwhile, the 15 to 24 years age bracket for the primary householder has the lowest median household income of $35,000, with 308 households (1.6%) in this group.
| Income Bracket | # Households | Median Income |
| 15 to 24 Years | 308 (1.6%) | $35,000 |
| 25 to 44 Years | 4,342 (22.6%) | $70,488 |
| 45 to 64 Years | 7,530 (39.2%) | $70,912 |
| 65+ Years | 7,048 (36.6%) | $49,120 |
| Total | 19,228 (100.0%) | $61,816 |
Poverty in Bonner County
Income Below Poverty by Sex and Age in Bonner County
With 11.0% poverty level for males and 12.8% for females among the residents of Bonner County, 18 to 24 year old males and 16 and 17 year old females are the most vulnerable to poverty, with 332 males (23.8%) and 166 females (27.2%) in their respective age groups living below the poverty level.
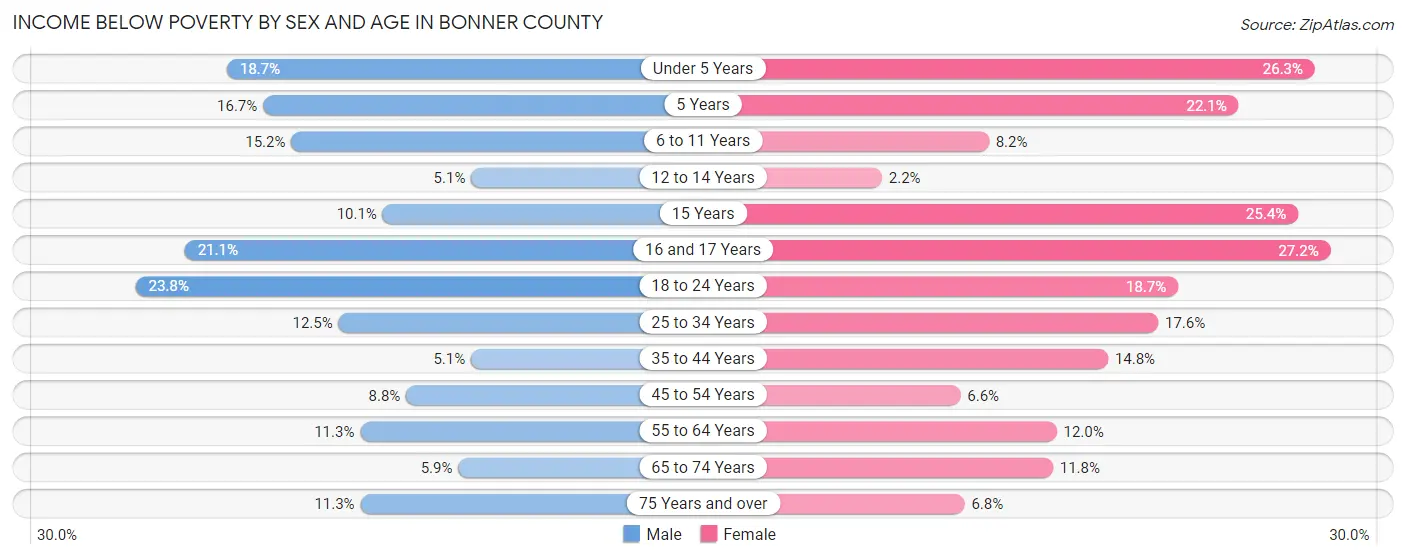
| Age Bracket | Male | Female |
| Under 5 Years | 209 (18.7%) | 281 (26.3%) |
| 5 Years | 55 (16.7%) | 72 (22.1%) |
| 6 to 11 Years | 272 (15.1%) | 118 (8.2%) |
| 12 to 14 Years | 33 (5.1%) | 18 (2.2%) |
| 15 Years | 32 (10.1%) | 46 (25.4%) |
| 16 and 17 Years | 117 (21.1%) | 166 (27.2%) |
| 18 to 24 Years | 332 (23.8%) | 231 (18.7%) |
| 25 to 34 Years | 286 (12.5%) | 407 (17.6%) |
| 35 to 44 Years | 142 (5.1%) | 391 (14.8%) |
| 45 to 54 Years | 244 (8.7%) | 188 (6.6%) |
| 55 to 64 Years | 429 (11.3%) | 485 (12.0%) |
| 65 to 74 Years | 241 (5.9%) | 447 (11.7%) |
| 75 Years and over | 232 (11.3%) | 147 (6.8%) |
| Total | 2,624 (11.0%) | 2,997 (12.8%) |
Income Above Poverty by Sex and Age in Bonner County
According to the poverty statistics in Bonner County, males aged 12 to 14 years and females aged 12 to 14 years are the age groups that are most secure financially, with 94.9% of males and 97.8% of females in these age groups living above the poverty line.
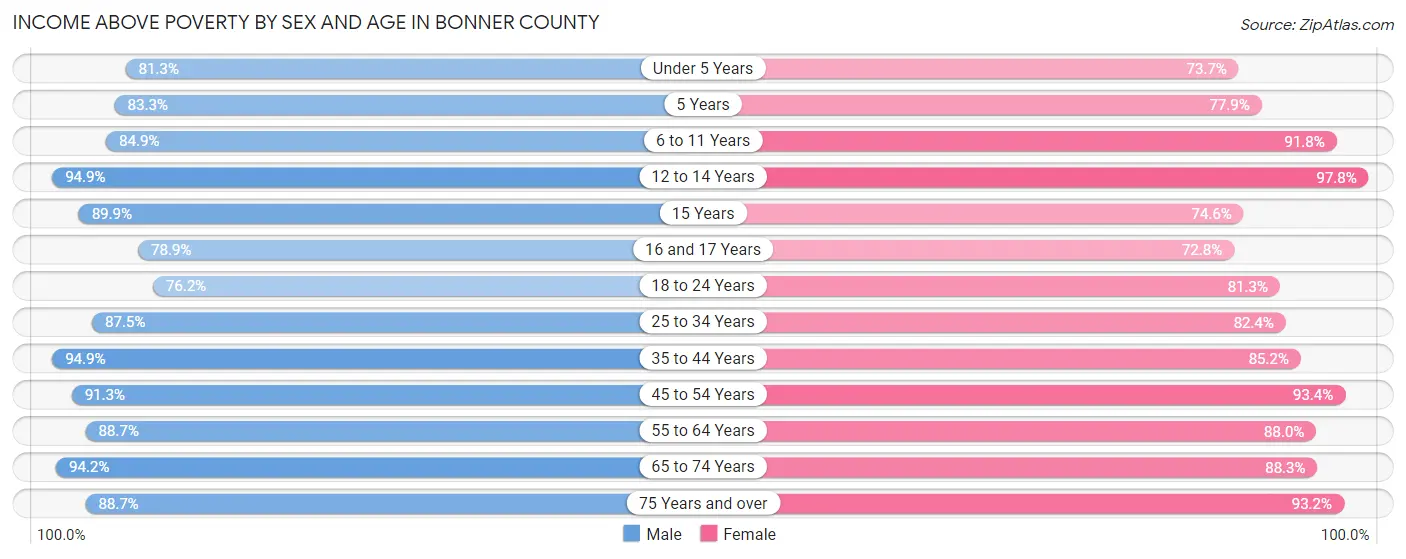
| Age Bracket | Male | Female |
| Under 5 Years | 906 (81.3%) | 786 (73.7%) |
| 5 Years | 274 (83.3%) | 254 (77.9%) |
| 6 to 11 Years | 1,523 (84.9%) | 1,324 (91.8%) |
| 12 to 14 Years | 610 (94.9%) | 788 (97.8%) |
| 15 Years | 286 (89.9%) | 135 (74.6%) |
| 16 and 17 Years | 438 (78.9%) | 444 (72.8%) |
| 18 to 24 Years | 1,062 (76.2%) | 1,003 (81.3%) |
| 25 to 34 Years | 1,998 (87.5%) | 1,904 (82.4%) |
| 35 to 44 Years | 2,618 (94.9%) | 2,248 (85.2%) |
| 45 to 54 Years | 2,545 (91.2%) | 2,662 (93.4%) |
| 55 to 64 Years | 3,365 (88.7%) | 3,569 (88.0%) |
| 65 to 74 Years | 3,876 (94.2%) | 3,358 (88.2%) |
| 75 Years and over | 1,821 (88.7%) | 2,004 (93.2%) |
| Total | 21,322 (89.0%) | 20,479 (87.2%) |
Income Below Poverty Among Married-Couple Families in Bonner County
The poverty statistics for married-couple families in Bonner County show that 5.2% or 577 of the total 11,097 families live below the poverty line. Families with 5 or more children have the highest poverty rate of 21.3%, comprising of 16 families. On the other hand, families with 1 or 2 children have the lowest poverty rate of 4.6%, which includes 118 families.
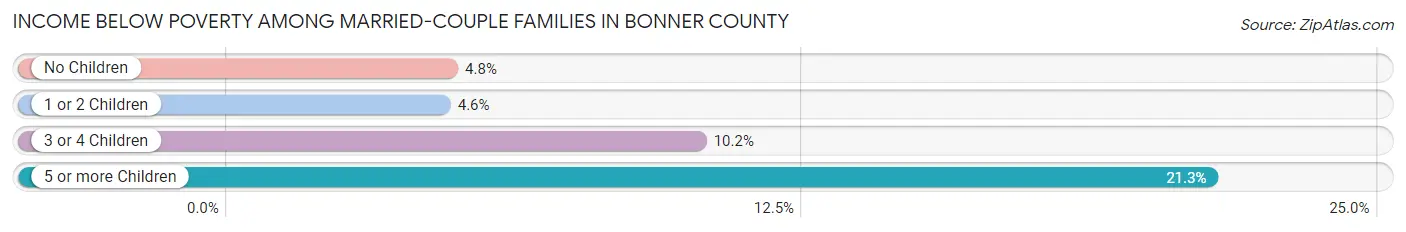
| Children | Above Poverty | Below Poverty |
| No Children | 7,417 (95.2%) | 373 (4.8%) |
| 1 or 2 Children | 2,428 (95.4%) | 118 (4.6%) |
| 3 or 4 Children | 616 (89.8%) | 70 (10.2%) |
| 5 or more Children | 59 (78.7%) | 16 (21.3%) |
| Total | 10,520 (94.8%) | 577 (5.2%) |
Income Below Poverty Among Single-Parent Households in Bonner County
According to the poverty data in Bonner County, 13.3% or 105 single-father households and 35.1% or 439 single-mother households are living below the poverty line. Among single-father households, those with 3 or 4 children have the highest poverty rate, with 43 households (39.8%) experiencing poverty. Likewise, among single-mother households, those with 3 or 4 children have the highest poverty rate, with 109 households (89.3%) falling below the poverty line.
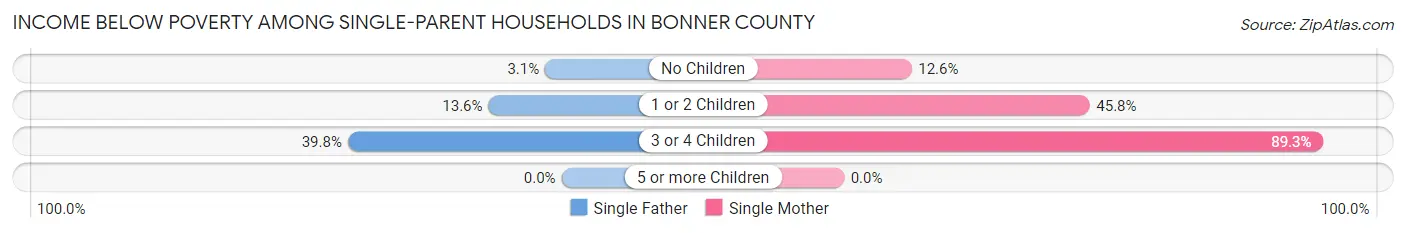
| Children | Single Father | Single Mother |
| No Children | 9 (3.1%) | 71 (12.6%) |
| 1 or 2 Children | 53 (13.6%) | 259 (45.8%) |
| 3 or 4 Children | 43 (39.8%) | 109 (89.3%) |
| 5 or more Children | 0 (0.0%) | 0 (0.0%) |
| Total | 105 (13.3%) | 439 (35.1%) |
Income Below Poverty Among Married-Couple vs Single-Parent Households in Bonner County
The poverty data for Bonner County shows that 577 of the married-couple family households (5.2%) and 544 of the single-parent households (26.6%) are living below the poverty level. Within the married-couple family households, those with 5 or more children have the highest poverty rate, with 16 households (21.3%) falling below the poverty line. Among the single-parent households, those with 3 or 4 children have the highest poverty rate, with 152 household (66.1%) living below poverty.
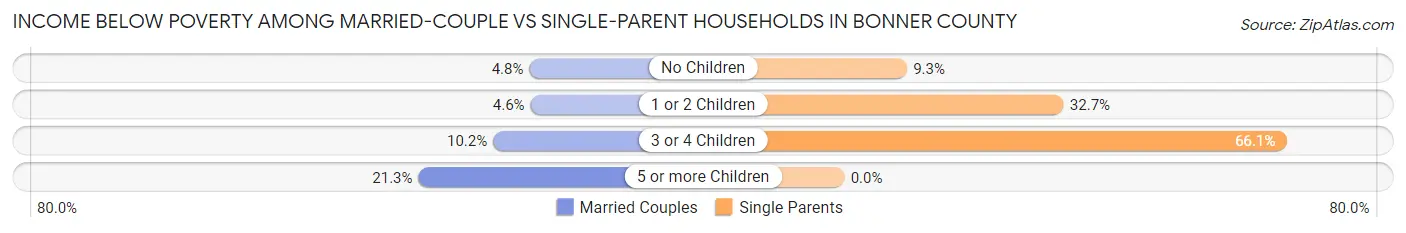
| Children | Married-Couple Families | Single-Parent Households |
| No Children | 373 (4.8%) | 80 (9.3%) |
| 1 or 2 Children | 118 (4.6%) | 312 (32.7%) |
| 3 or 4 Children | 70 (10.2%) | 152 (66.1%) |
| 5 or more Children | 16 (21.3%) | 0 (0.0%) |
| Total | 577 (5.2%) | 544 (26.6%) |
Employment Characteristics in Bonner County
Employment by Class of Employer in Bonner County
Among the 19,490 employed individuals in Bonner County, private company employees (11,730 | 60.2%), self-employed (not incorporated) (2,518 | 12.9%), and self-employed (incorporated) (1,615 | 8.3%) make up the most common classes of employment.
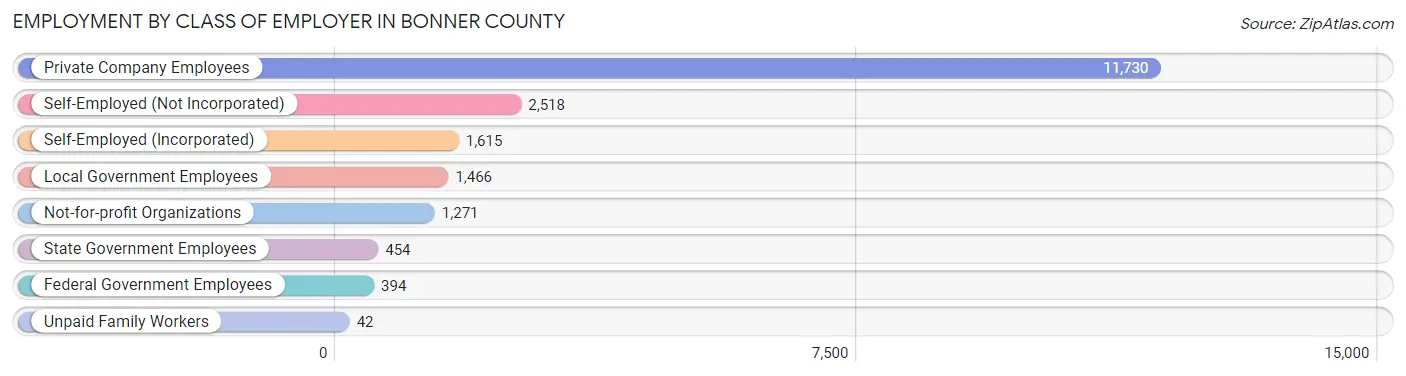
| Employer Class | # Employees | % Employees |
| Private Company Employees | 11,730 | 60.2% |
| Self-Employed (Incorporated) | 1,615 | 8.3% |
| Self-Employed (Not Incorporated) | 2,518 | 12.9% |
| Not-for-profit Organizations | 1,271 | 6.5% |
| Local Government Employees | 1,466 | 7.5% |
| State Government Employees | 454 | 2.3% |
| Federal Government Employees | 394 | 2.0% |
| Unpaid Family Workers | 42 | 0.2% |
| Total | 19,490 | 100.0% |
Employment Status by Age in Bonner County
According to the labor force statistics for Bonner County, out of the total population over 16 years of age (39,783), 52.1% or 20,727 individuals are in the labor force, with 3.5% or 725 of them unemployed. The age group with the highest labor force participation rate is 20 to 24 years, with 82.0% or 1,520 individuals in the labor force. Within the labor force, the 16 to 19 years age range has the highest percentage of unemployed individuals, with 21.3% or 167 of them being unemployed.
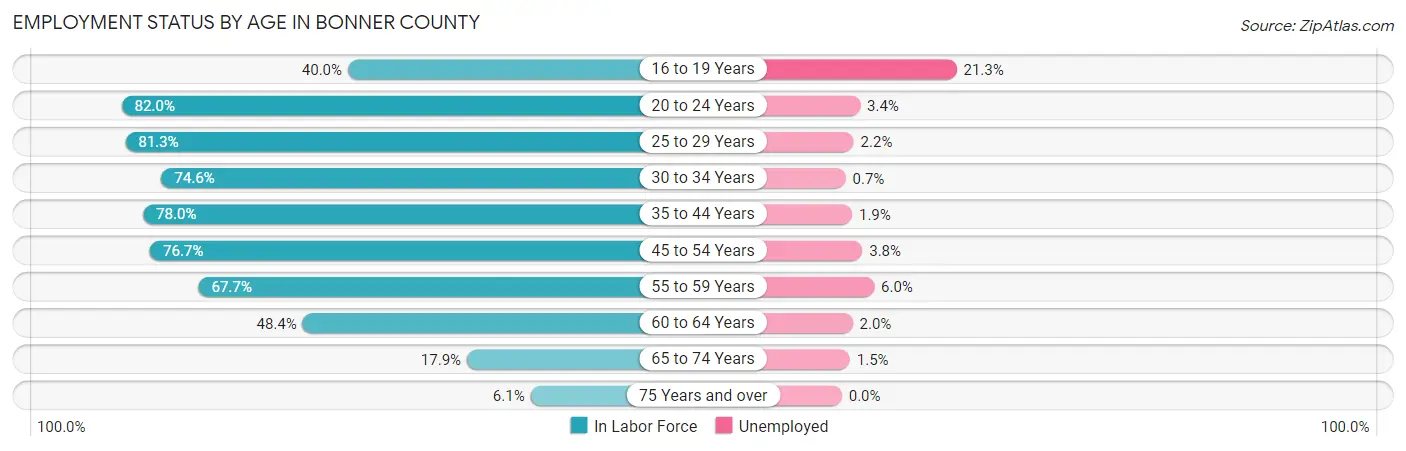
| Age Bracket | In Labor Force | Unemployed |
| 16 to 19 Years | 784 (40.0%) | 167 (21.3%) |
| 20 to 24 Years | 1,520 (82.0%) | 52 (3.4%) |
| 25 to 29 Years | 1,685 (81.3%) | 37 (2.2%) |
| 30 to 34 Years | 1,909 (74.6%) | 13 (0.7%) |
| 35 to 44 Years | 4,230 (78.0%) | 80 (1.9%) |
| 45 to 54 Years | 4,349 (76.7%) | 165 (3.8%) |
| 55 to 59 Years | 2,512 (67.7%) | 151 (6.0%) |
| 60 to 64 Years | 2,042 (48.4%) | 41 (2.0%) |
| 65 to 74 Years | 1,420 (17.9%) | 21 (1.5%) |
| 75 Years and over | 267 (6.1%) | 0 (0.0%) |
| Total | 20,727 (52.1%) | 725 (3.5%) |
Employment Status by Educational Attainment in Bonner County
According to labor force statistics for Bonner County, 70.7% of individuals (16,722) out of the total population between 25 and 64 years of age (23,652) are in the labor force, with 2.9% or 485 of them being unemployed. The group with the highest labor force participation rate are those with the educational attainment of bachelor's degree or higher, with 73.9% or 4,490 individuals in the labor force. Within the labor force, individuals with high school diploma education have the highest percentage of unemployment, with 4.1% or 205 of them being unemployed.
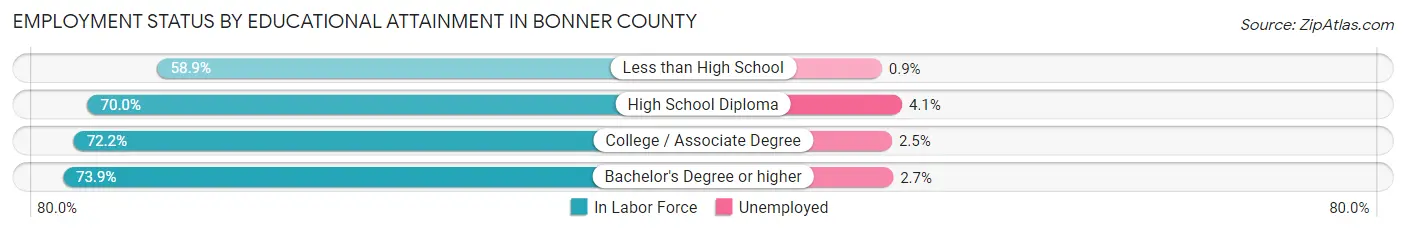
| Educational Attainment | In Labor Force | Unemployed |
| Less than High School | 1,277 (58.9%) | 20 (0.9%) |
| High School Diploma | 4,997 (70.0%) | 293 (4.1%) |
| College / Associate Degree | 5,971 (72.2%) | 207 (2.5%) |
| Bachelor's Degree or higher | 4,490 (73.9%) | 164 (2.7%) |
| Total | 16,722 (70.7%) | 686 (2.9%) |
Employment Occupations by Sex in Bonner County
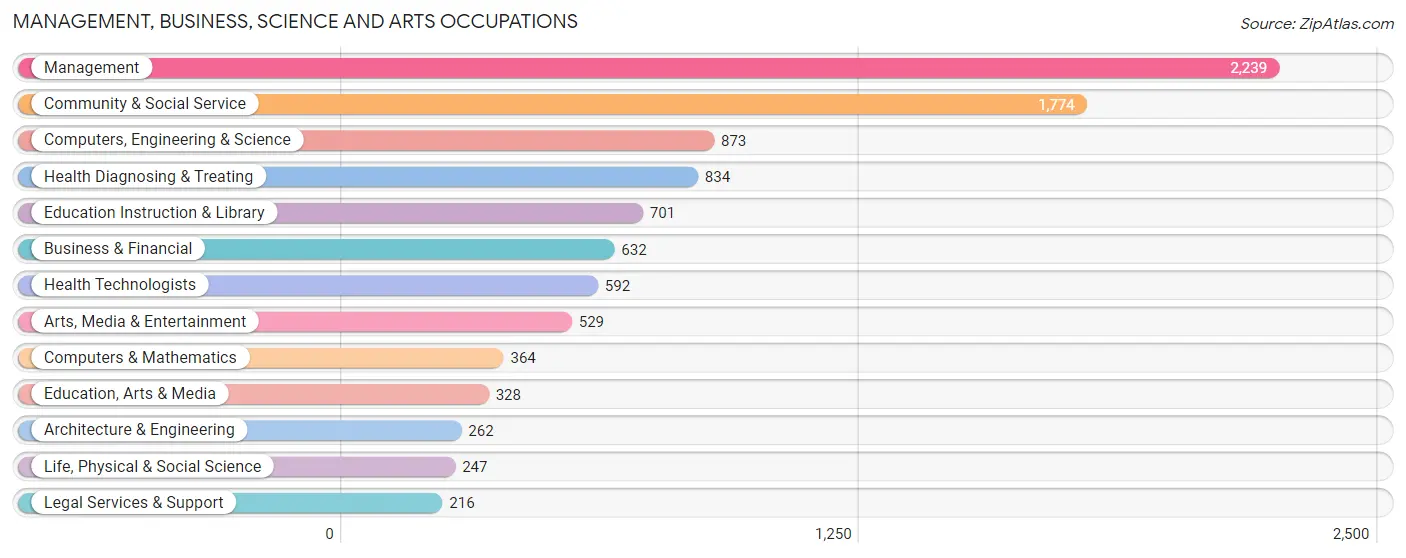
Management, Business, Science and Arts Occupations
The most common Management, Business, Science and Arts occupations in Bonner County are Management (2,239 | 11.2%), Community & Social Service (1,774 | 8.9%), Computers, Engineering & Science (873 | 4.4%), Health Diagnosing & Treating (834 | 4.2%), and Education Instruction & Library (701 | 3.5%).
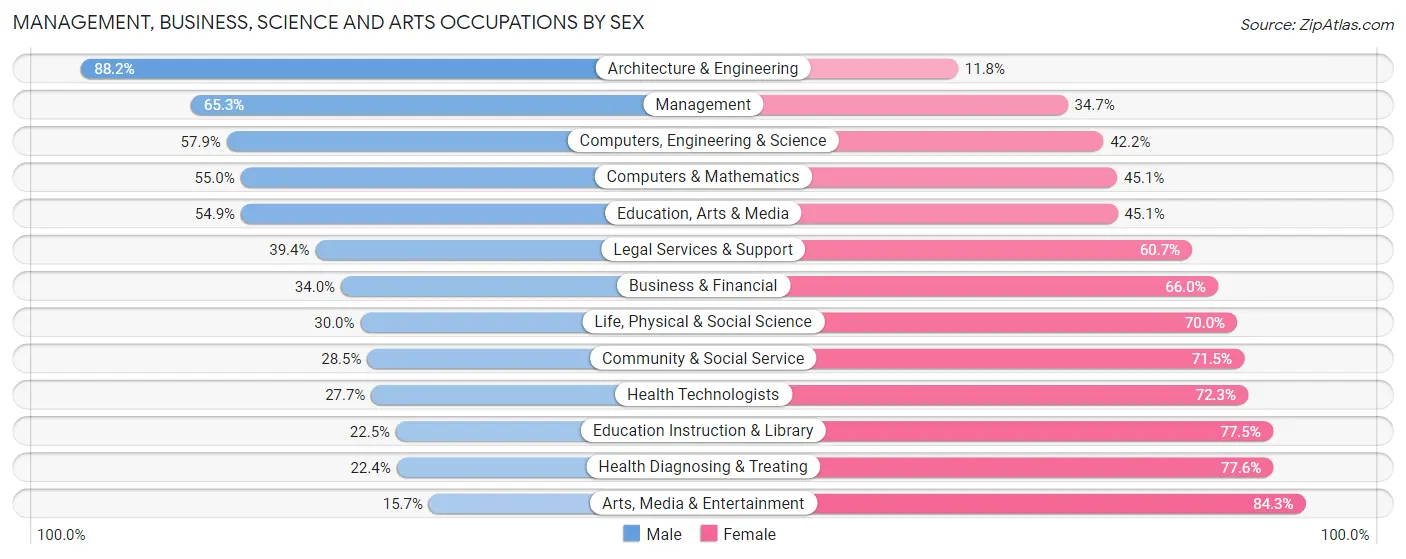
Management, Business, Science and Arts Occupations by Sex
Within the Management, Business, Science and Arts occupations in Bonner County, the most male-oriented occupations are Architecture & Engineering (88.2%), Management (65.3%), and Computers, Engineering & Science (57.9%), while the most female-oriented occupations are Arts, Media & Entertainment (84.3%), Health Diagnosing & Treating (77.6%), and Education Instruction & Library (77.5%).
| Occupation | Male | Female |
| Management | 1,462 (65.3%) | 777 (34.7%) |
| Business & Financial | 215 (34.0%) | 417 (66.0%) |
| Computers, Engineering & Science | 505 (57.9%) | 368 (42.1%) |
| Computers & Mathematics | 200 (54.9%) | 164 (45.1%) |
| Architecture & Engineering | 231 (88.2%) | 31 (11.8%) |
| Life, Physical & Social Science | 74 (30.0%) | 173 (70.0%) |
| Community & Social Service | 506 (28.5%) | 1,268 (71.5%) |
| Education, Arts & Media | 180 (54.9%) | 148 (45.1%) |
| Legal Services & Support | 85 (39.4%) | 131 (60.7%) |
| Education Instruction & Library | 158 (22.5%) | 543 (77.5%) |
| Arts, Media & Entertainment | 83 (15.7%) | 446 (84.3%) |
| Health Diagnosing & Treating | 187 (22.4%) | 647 (77.6%) |
| Health Technologists | 164 (27.7%) | 428 (72.3%) |
| Total (Category) | 2,875 (45.3%) | 3,477 (54.7%) |
| Total (Overall) | 10,741 (53.7%) | 9,250 (46.3%) |
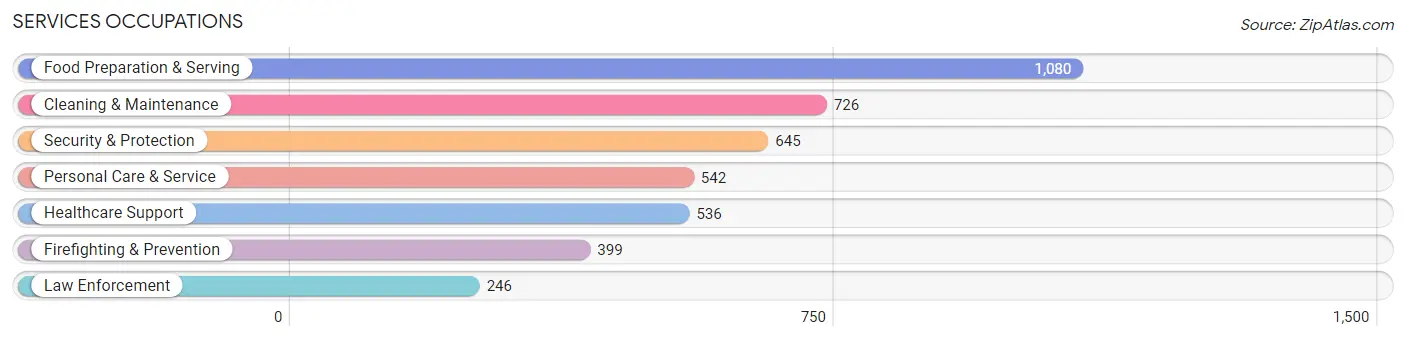
Services Occupations
The most common Services occupations in Bonner County are Food Preparation & Serving (1,080 | 5.4%), Cleaning & Maintenance (726 | 3.6%), Security & Protection (645 | 3.2%), Personal Care & Service (542 | 2.7%), and Healthcare Support (536 | 2.7%).
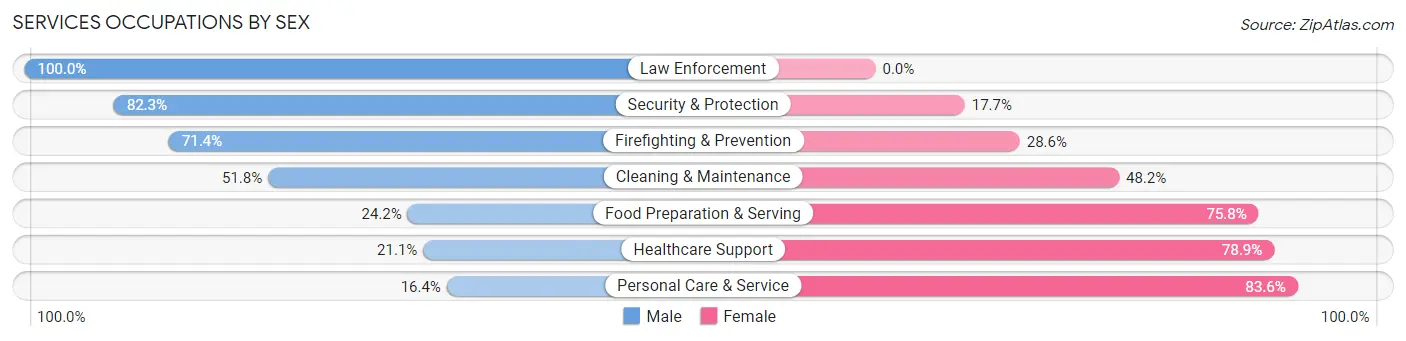
Services Occupations by Sex
Within the Services occupations in Bonner County, the most male-oriented occupations are Law Enforcement (100.0%), Security & Protection (82.3%), and Firefighting & Prevention (71.4%), while the most female-oriented occupations are Personal Care & Service (83.6%), Healthcare Support (78.9%), and Food Preparation & Serving (75.8%).
| Occupation | Male | Female |
| Healthcare Support | 113 (21.1%) | 423 (78.9%) |
| Security & Protection | 531 (82.3%) | 114 (17.7%) |
| Firefighting & Prevention | 285 (71.4%) | 114 (28.6%) |
| Law Enforcement | 246 (100.0%) | 0 (0.0%) |
| Food Preparation & Serving | 261 (24.2%) | 819 (75.8%) |
| Cleaning & Maintenance | 376 (51.8%) | 350 (48.2%) |
| Personal Care & Service | 89 (16.4%) | 453 (83.6%) |
| Total (Category) | 1,370 (38.8%) | 2,159 (61.2%) |
| Total (Overall) | 10,741 (53.7%) | 9,250 (46.3%) |
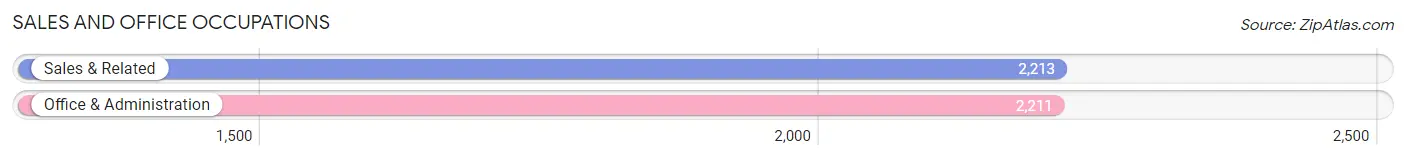
Sales and Office Occupations
The most common Sales and Office occupations in Bonner County are Sales & Related (2,213 | 11.1%), and Office & Administration (2,211 | 11.1%).
Sales and Office Occupations by Sex
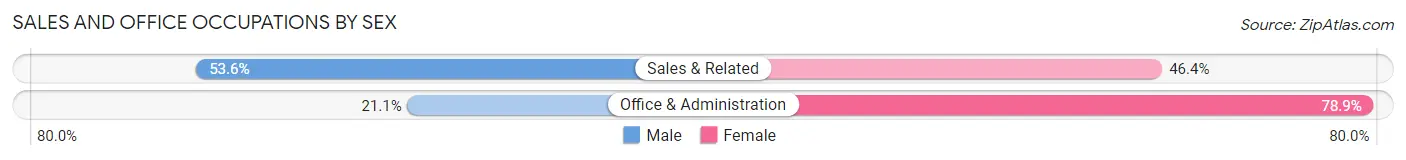
| Occupation | Male | Female |
| Sales & Related | 1,186 (53.6%) | 1,027 (46.4%) |
| Office & Administration | 466 (21.1%) | 1,745 (78.9%) |
| Total (Category) | 1,652 (37.3%) | 2,772 (62.7%) |
| Total (Overall) | 10,741 (53.7%) | 9,250 (46.3%) |
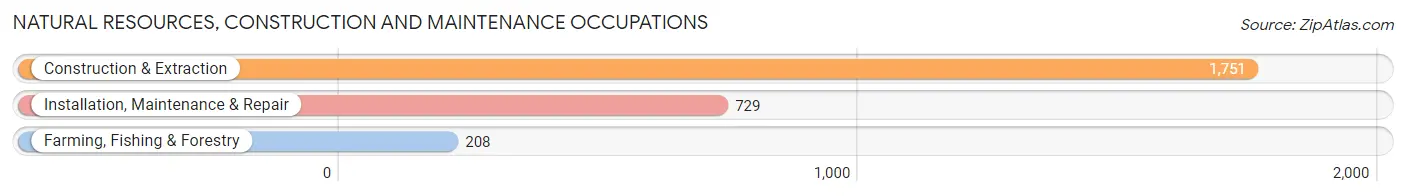
Natural Resources, Construction and Maintenance Occupations
The most common Natural Resources, Construction and Maintenance occupations in Bonner County are Construction & Extraction (1,751 | 8.8%), Installation, Maintenance & Repair (729 | 3.6%), and Farming, Fishing & Forestry (208 | 1.0%).
Natural Resources, Construction and Maintenance Occupations by Sex
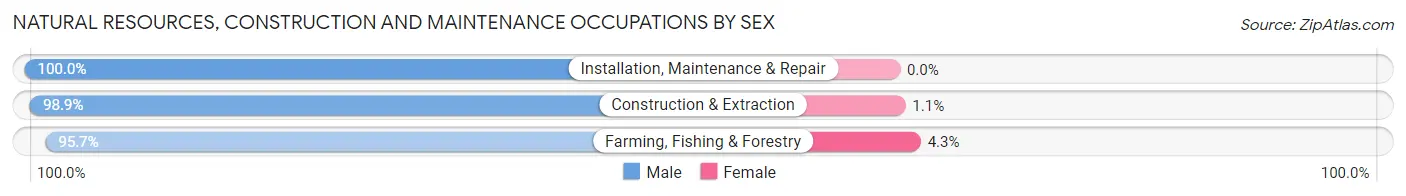
| Occupation | Male | Female |
| Farming, Fishing & Forestry | 199 (95.7%) | 9 (4.3%) |
| Construction & Extraction | 1,731 (98.9%) | 20 (1.1%) |
| Installation, Maintenance & Repair | 729 (100.0%) | 0 (0.0%) |
| Total (Category) | 2,659 (98.9%) | 29 (1.1%) |
| Total (Overall) | 10,741 (53.7%) | 9,250 (46.3%) |
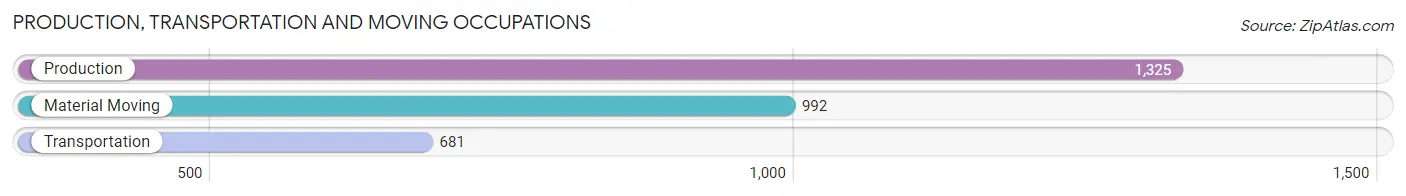
Production, Transportation and Moving Occupations
The most common Production, Transportation and Moving occupations in Bonner County are Production (1,325 | 6.6%), Material Moving (992 | 5.0%), and Transportation (681 | 3.4%).
Production, Transportation and Moving Occupations by Sex
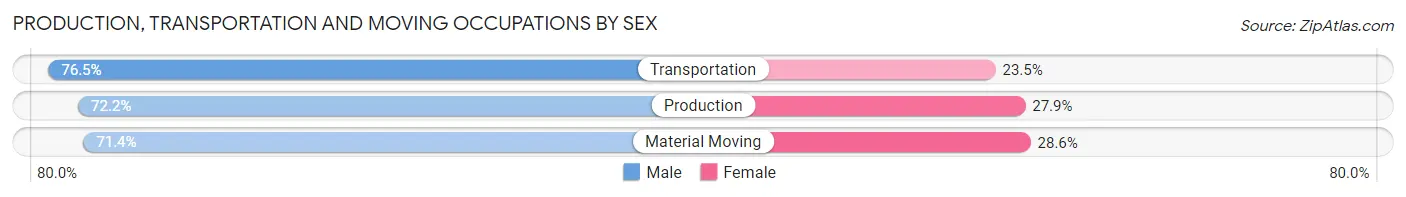
| Occupation | Male | Female |
| Production | 956 (72.2%) | 369 (27.9%) |
| Transportation | 521 (76.5%) | 160 (23.5%) |
| Material Moving | 708 (71.4%) | 284 (28.6%) |
| Total (Category) | 2,185 (72.9%) | 813 (27.1%) |
| Total (Overall) | 10,741 (53.7%) | 9,250 (46.3%) |
Employment Industries by Sex in Bonner County
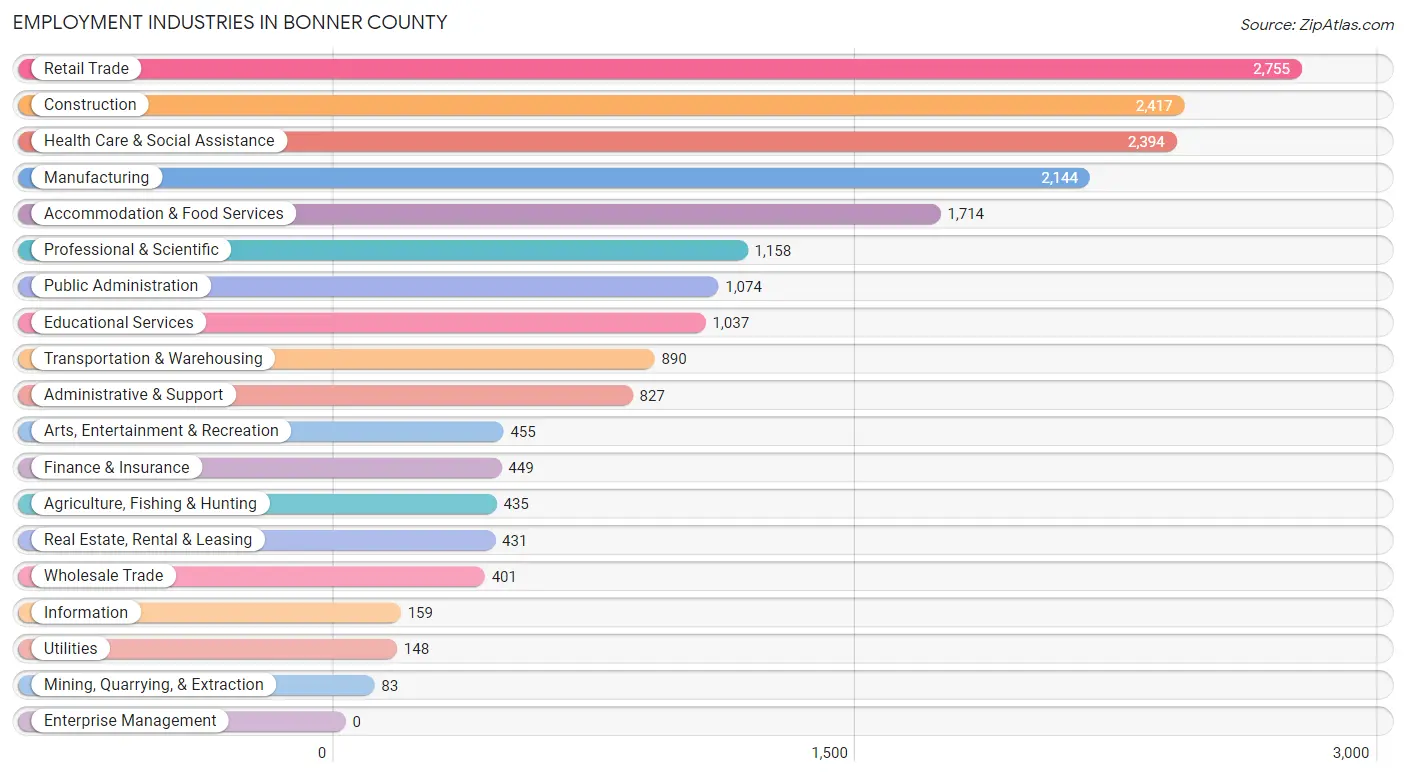
Employment Industries in Bonner County
The major employment industries in Bonner County include Retail Trade (2,755 | 13.8%), Construction (2,417 | 12.1%), Health Care & Social Assistance (2,394 | 12.0%), Manufacturing (2,144 | 10.7%), and Accommodation & Food Services (1,714 | 8.6%).
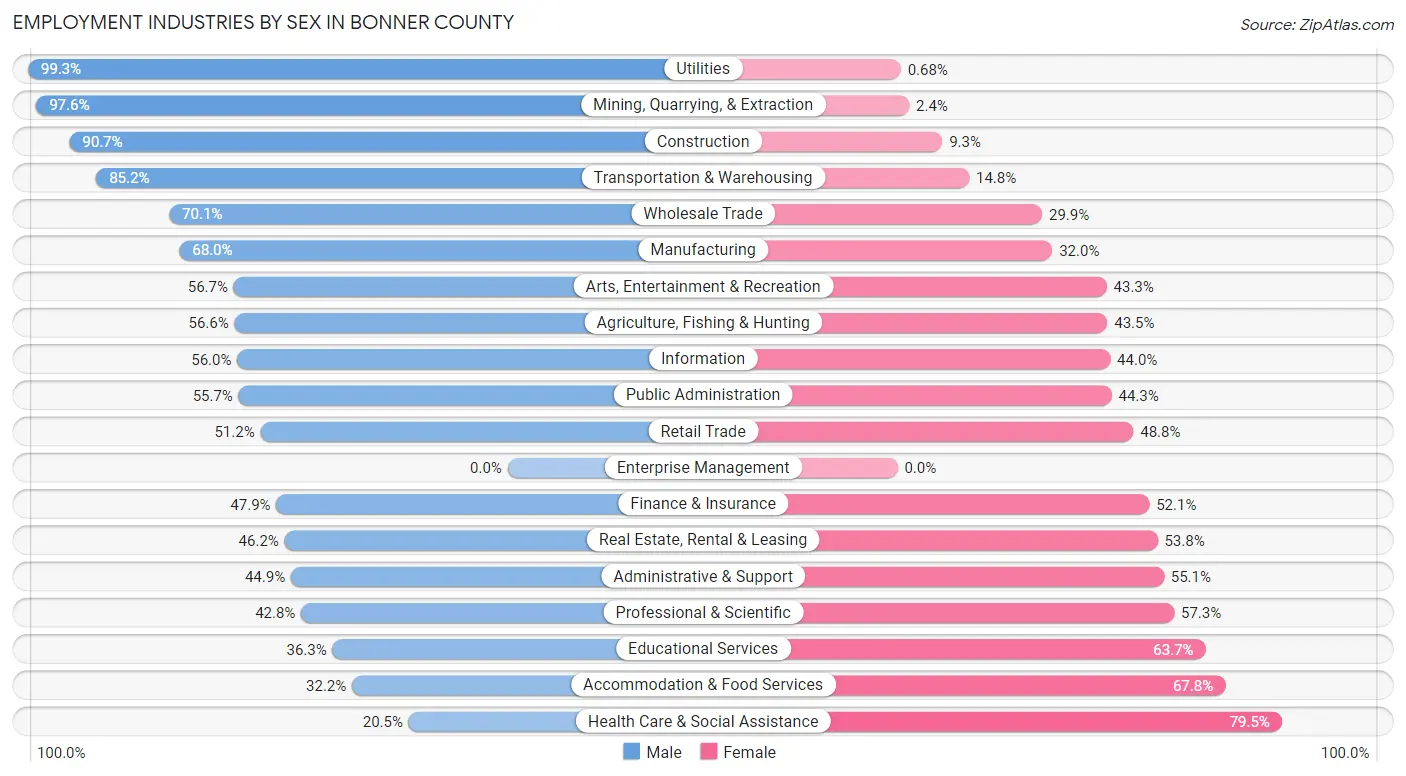
Employment Industries by Sex in Bonner County
The Bonner County industries that see more men than women are Utilities (99.3%), Mining, Quarrying, & Extraction (97.6%), and Construction (90.7%), whereas the industries that tend to have a higher number of women are Health Care & Social Assistance (79.5%), Accommodation & Food Services (67.8%), and Educational Services (63.7%).
| Industry | Male | Female |
| Agriculture, Fishing & Hunting | 246 (56.6%) | 189 (43.4%) |
| Mining, Quarrying, & Extraction | 81 (97.6%) | 2 (2.4%) |
| Construction | 2,193 (90.7%) | 224 (9.3%) |
| Manufacturing | 1,457 (68.0%) | 687 (32.0%) |
| Wholesale Trade | 281 (70.1%) | 120 (29.9%) |
| Retail Trade | 1,410 (51.2%) | 1,345 (48.8%) |
| Transportation & Warehousing | 758 (85.2%) | 132 (14.8%) |
| Utilities | 147 (99.3%) | 1 (0.7%) |
| Information | 89 (56.0%) | 70 (44.0%) |
| Finance & Insurance | 215 (47.9%) | 234 (52.1%) |
| Real Estate, Rental & Leasing | 199 (46.2%) | 232 (53.8%) |
| Professional & Scientific | 495 (42.7%) | 663 (57.3%) |
| Enterprise Management | 0 (0.0%) | 0 (0.0%) |
| Administrative & Support | 371 (44.9%) | 456 (55.1%) |
| Educational Services | 376 (36.3%) | 661 (63.7%) |
| Health Care & Social Assistance | 490 (20.5%) | 1,904 (79.5%) |
| Arts, Entertainment & Recreation | 258 (56.7%) | 197 (43.3%) |
| Accommodation & Food Services | 552 (32.2%) | 1,162 (67.8%) |
| Public Administration | 598 (55.7%) | 476 (44.3%) |
| Total | 10,741 (53.7%) | 9,250 (46.3%) |
Education in Bonner County
School Enrollment in Bonner County
The most common levels of schooling among the 8,662 students in Bonner County are elementary school (2,194 | 25.3%), middle school (2,145 | 24.8%), and high school (2,128 | 24.6%).
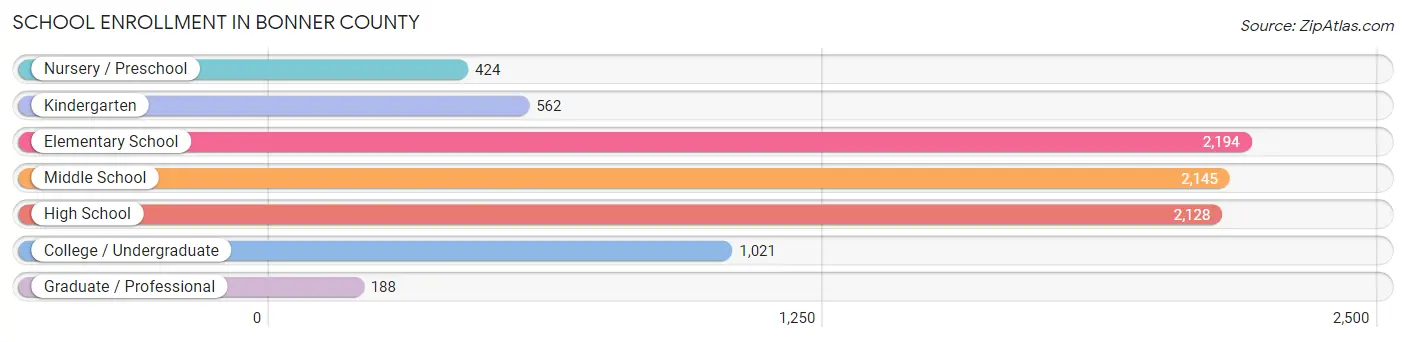
| School Level | # Students | % Students |
| Nursery / Preschool | 424 | 4.9% |
| Kindergarten | 562 | 6.5% |
| Elementary School | 2,194 | 25.3% |
| Middle School | 2,145 | 24.8% |
| High School | 2,128 | 24.6% |
| College / Undergraduate | 1,021 | 11.8% |
| Graduate / Professional | 188 | 2.2% |
| Total | 8,662 | 100.0% |
School Enrollment by Age by Funding Source in Bonner County
Out of a total of 8,662 students who are enrolled in schools in Bonner County, 1,984 (22.9%) attend a private institution, while the remaining 6,678 (77.1%) are enrolled in public schools. The age group of 3 to 4 year olds has the highest likelihood of being enrolled in private schools, with 167 (47.6% in the age bracket) enrolled. Conversely, the age group of 25 to 34 year olds has the lowest likelihood of being enrolled in a private school, with 360 (99.2% in the age bracket) attending a public institution.
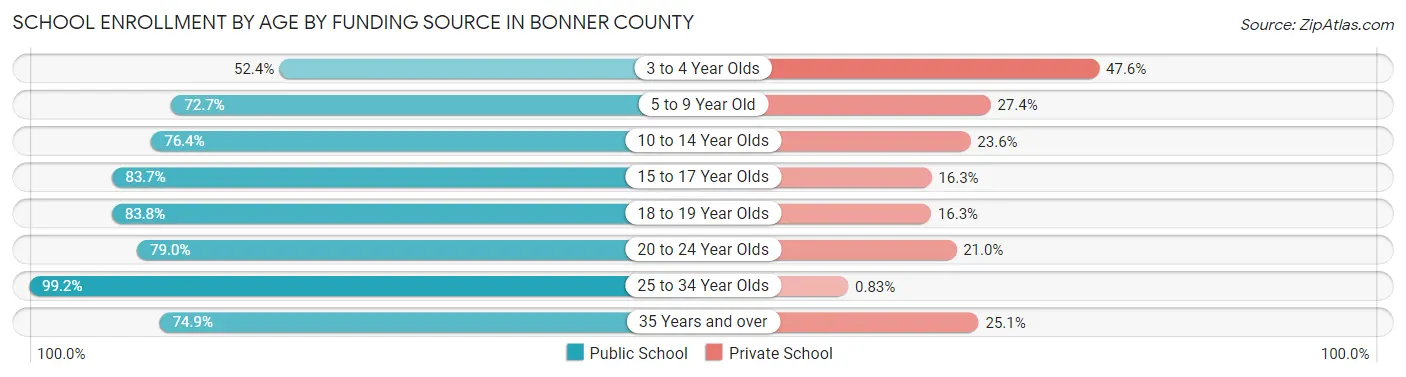
| Age Bracket | Public School | Private School |
| 3 to 4 Year Olds | 184 (52.4%) | 167 (47.6%) |
| 5 to 9 Year Old | 1,851 (72.7%) | 697 (27.4%) |
| 10 to 14 Year Olds | 1,928 (76.4%) | 596 (23.6%) |
| 15 to 17 Year Olds | 1,331 (83.7%) | 260 (16.3%) |
| 18 to 19 Year Olds | 464 (83.8%) | 90 (16.3%) |
| 20 to 24 Year Olds | 279 (79.0%) | 74 (21.0%) |
| 25 to 34 Year Olds | 360 (99.2%) | 3 (0.8%) |
| 35 Years and over | 283 (74.9%) | 95 (25.1%) |
| Total | 6,678 (77.1%) | 1,984 (22.9%) |
Educational Attainment by Field of Study in Bonner County
Education (1,671 | 15.7%), business (1,631 | 15.3%), bio, nature & agricultural (1,163 | 10.9%), science & technology (1,073 | 10.1%), and engineering (754 | 7.1%) are the most common fields of study among 10,660 individuals in Bonner County who have obtained a bachelor's degree or higher.
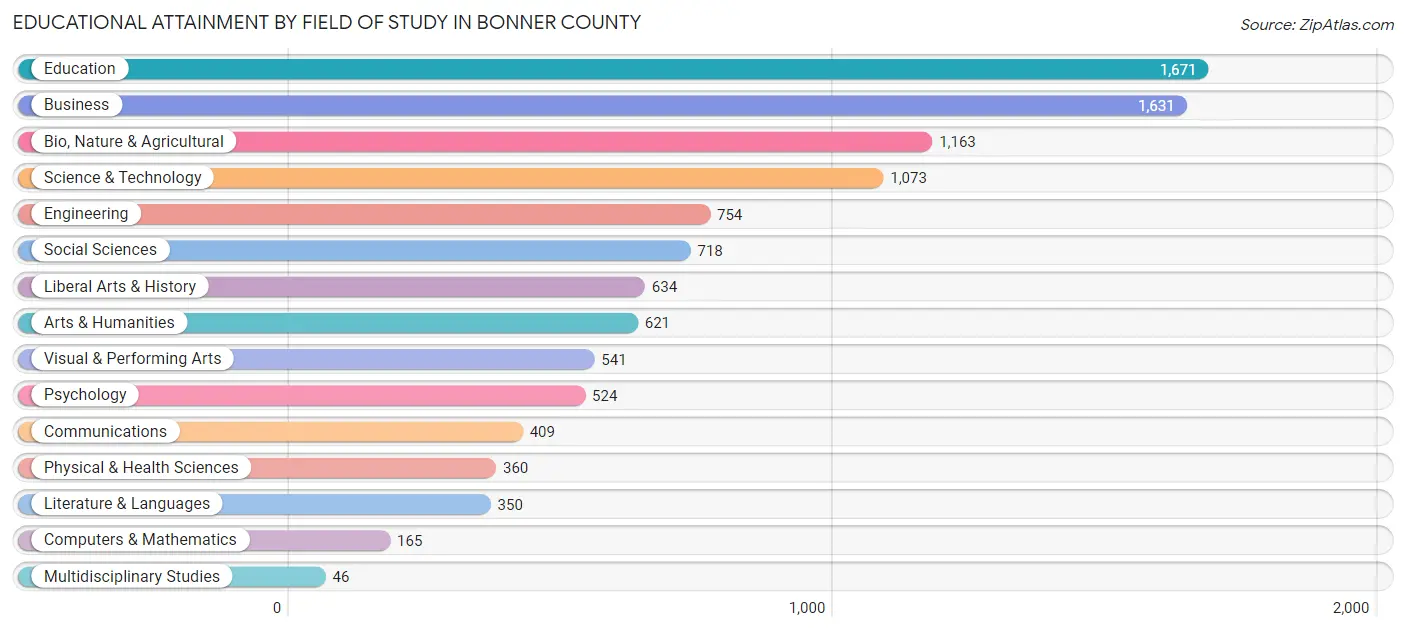
| Field of Study | # Graduates | % Graduates |
| Computers & Mathematics | 165 | 1.5% |
| Bio, Nature & Agricultural | 1,163 | 10.9% |
| Physical & Health Sciences | 360 | 3.4% |
| Psychology | 524 | 4.9% |
| Social Sciences | 718 | 6.7% |
| Engineering | 754 | 7.1% |
| Multidisciplinary Studies | 46 | 0.4% |
| Science & Technology | 1,073 | 10.1% |
| Business | 1,631 | 15.3% |
| Education | 1,671 | 15.7% |
| Literature & Languages | 350 | 3.3% |
| Liberal Arts & History | 634 | 5.9% |
| Visual & Performing Arts | 541 | 5.1% |
| Communications | 409 | 3.8% |
| Arts & Humanities | 621 | 5.8% |
| Total | 10,660 | 100.0% |
Transportation & Commute in Bonner County
Vehicle Availability by Sex in Bonner County
The most prevalent vehicle ownership categories in Bonner County are males with 2 vehicles (3,765, accounting for 35.9%) and females with 2 vehicles (3,167, making up 42.2%).
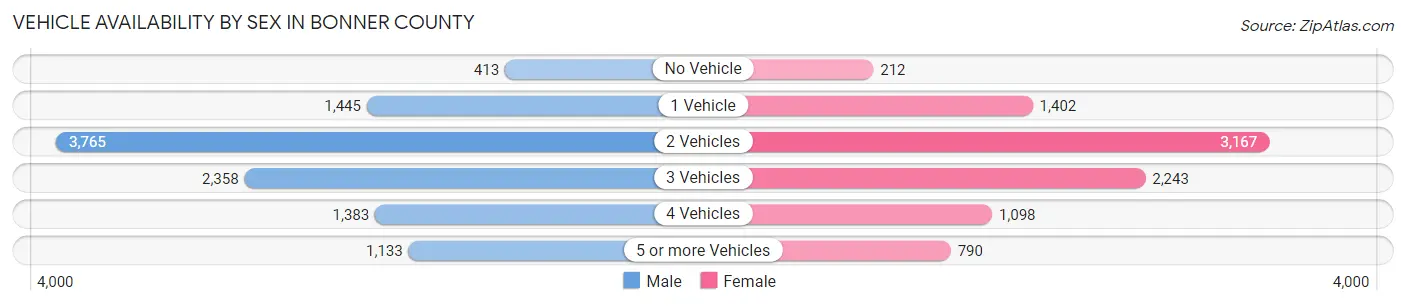
| Vehicles Available | Male | Female |
| No Vehicle | 413 (3.9%) | 212 (2.4%) |
| 1 Vehicle | 1,445 (13.8%) | 1,402 (15.7%) |
| 2 Vehicles | 3,765 (35.9%) | 3,167 (35.5%) |
| 3 Vehicles | 2,358 (22.5%) | 2,243 (25.2%) |
| 4 Vehicles | 1,383 (13.2%) | 1,098 (12.3%) |
| 5 or more Vehicles | 1,133 (10.8%) | 790 (8.9%) |
| Total | 10,497 (100.0%) | 8,912 (100.0%) |
Commute Time in Bonner County
The most frequently occuring commute durations in Bonner County are 10 to 14 minutes (3,378 commuters, 19.3%), 5 to 9 minutes (2,930 commuters, 16.8%), and 30 to 34 minutes (2,547 commuters, 14.6%).
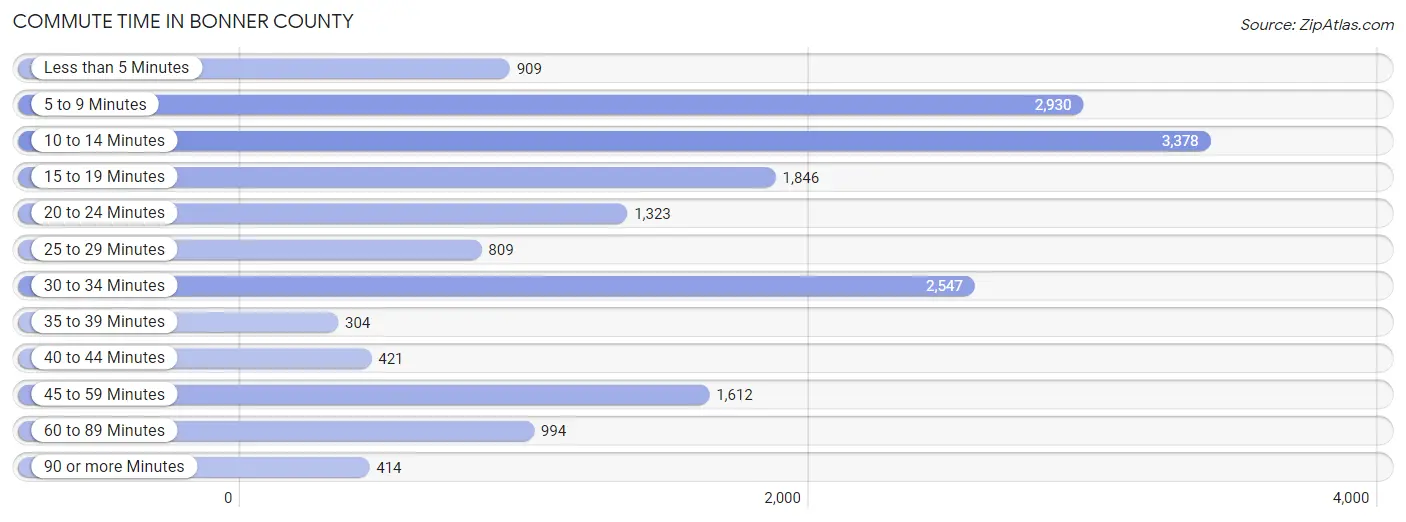
| Commute Time | # Commuters | % Commuters |
| Less than 5 Minutes | 909 | 5.2% |
| 5 to 9 Minutes | 2,930 | 16.8% |
| 10 to 14 Minutes | 3,378 | 19.3% |
| 15 to 19 Minutes | 1,846 | 10.6% |
| 20 to 24 Minutes | 1,323 | 7.6% |
| 25 to 29 Minutes | 809 | 4.6% |
| 30 to 34 Minutes | 2,547 | 14.6% |
| 35 to 39 Minutes | 304 | 1.7% |
| 40 to 44 Minutes | 421 | 2.4% |
| 45 to 59 Minutes | 1,612 | 9.2% |
| 60 to 89 Minutes | 994 | 5.7% |
| 90 or more Minutes | 414 | 2.4% |
Commute Time by Sex in Bonner County
The most common commute times in Bonner County are 5 to 9 minutes (1,592 commuters, 16.6%) for males and 10 to 14 minutes (1,807 commuters, 22.8%) for females.
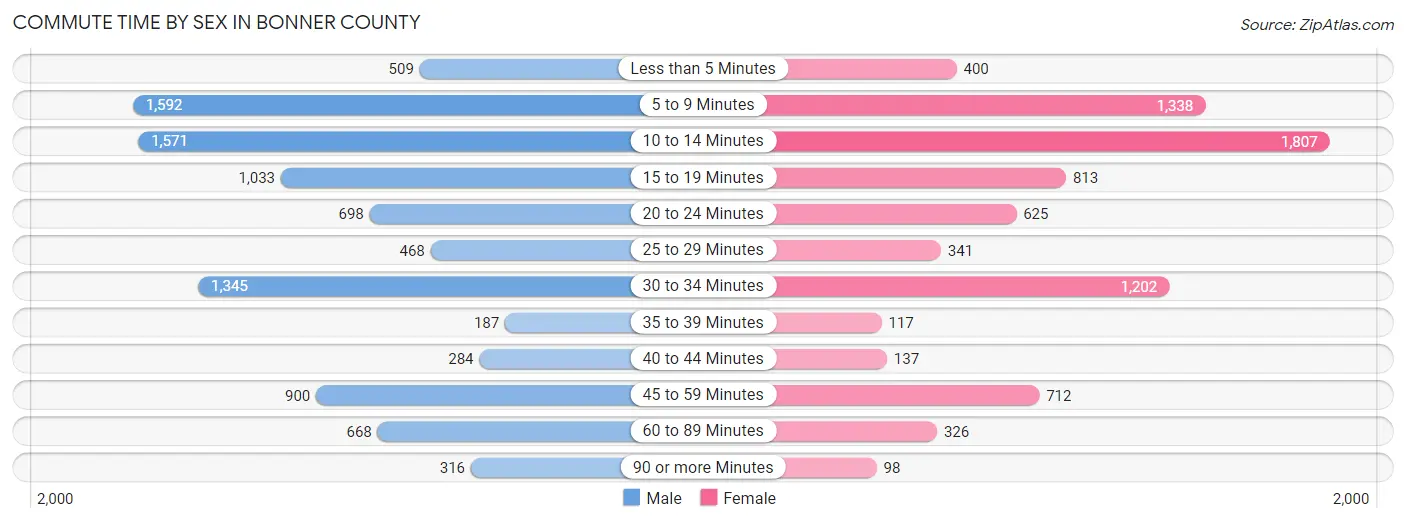
| Commute Time | Male | Female |
| Less than 5 Minutes | 509 (5.3%) | 400 (5.1%) |
| 5 to 9 Minutes | 1,592 (16.6%) | 1,338 (16.9%) |
| 10 to 14 Minutes | 1,571 (16.4%) | 1,807 (22.8%) |
| 15 to 19 Minutes | 1,033 (10.8%) | 813 (10.3%) |
| 20 to 24 Minutes | 698 (7.3%) | 625 (7.9%) |
| 25 to 29 Minutes | 468 (4.9%) | 341 (4.3%) |
| 30 to 34 Minutes | 1,345 (14.1%) | 1,202 (15.2%) |
| 35 to 39 Minutes | 187 (1.9%) | 117 (1.5%) |
| 40 to 44 Minutes | 284 (3.0%) | 137 (1.7%) |
| 45 to 59 Minutes | 900 (9.4%) | 712 (9.0%) |
| 60 to 89 Minutes | 668 (7.0%) | 326 (4.1%) |
| 90 or more Minutes | 316 (3.3%) | 98 (1.2%) |
Time of Departure to Work by Sex in Bonner County
The most frequent times of departure to work in Bonner County are 7:00 AM to 7:29 AM (1,764, 18.4%) for males and 7:30 AM to 7:59 AM (1,442, 18.2%) for females.
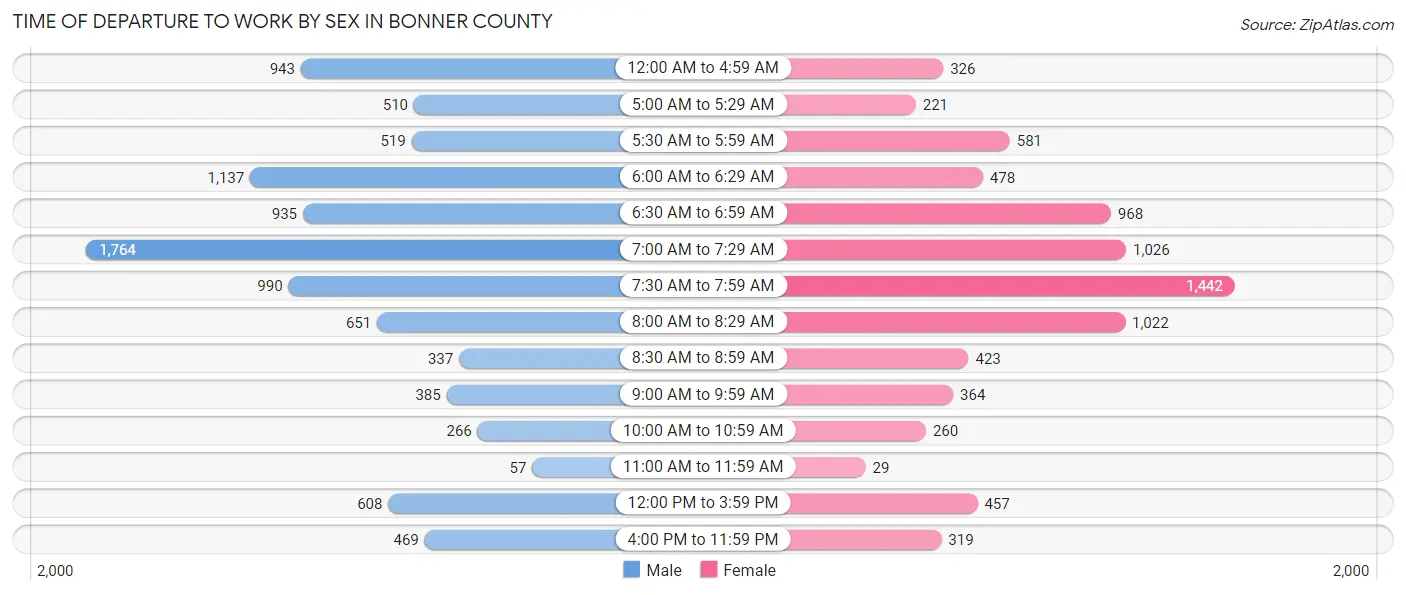
| Time of Departure | Male | Female |
| 12:00 AM to 4:59 AM | 943 (9.9%) | 326 (4.1%) |
| 5:00 AM to 5:29 AM | 510 (5.3%) | 221 (2.8%) |
| 5:30 AM to 5:59 AM | 519 (5.4%) | 581 (7.3%) |
| 6:00 AM to 6:29 AM | 1,137 (11.9%) | 478 (6.0%) |
| 6:30 AM to 6:59 AM | 935 (9.8%) | 968 (12.2%) |
| 7:00 AM to 7:29 AM | 1,764 (18.4%) | 1,026 (13.0%) |
| 7:30 AM to 7:59 AM | 990 (10.3%) | 1,442 (18.2%) |
| 8:00 AM to 8:29 AM | 651 (6.8%) | 1,022 (12.9%) |
| 8:30 AM to 8:59 AM | 337 (3.5%) | 423 (5.3%) |
| 9:00 AM to 9:59 AM | 385 (4.0%) | 364 (4.6%) |
| 10:00 AM to 10:59 AM | 266 (2.8%) | 260 (3.3%) |
| 11:00 AM to 11:59 AM | 57 (0.6%) | 29 (0.4%) |
| 12:00 PM to 3:59 PM | 608 (6.4%) | 457 (5.8%) |
| 4:00 PM to 11:59 PM | 469 (4.9%) | 319 (4.0%) |
| Total | 9,571 (100.0%) | 7,916 (100.0%) |
Housing Occupancy in Bonner County
Occupancy by Ownership in Bonner County
Of the total 19,228 dwellings in Bonner County, owner-occupied units account for 15,044 (78.2%), while renter-occupied units make up 4,184 (21.8%).
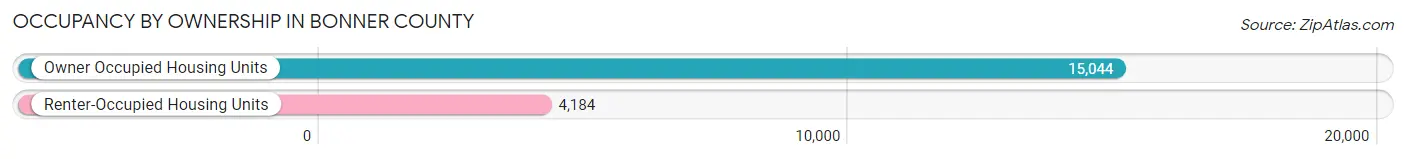
| Occupancy | # Housing Units | % Housing Units |
| Owner Occupied Housing Units | 15,044 | 78.2% |
| Renter-Occupied Housing Units | 4,184 | 21.8% |
| Total Occupied Housing Units | 19,228 | 100.0% |
Occupancy by Household Size in Bonner County
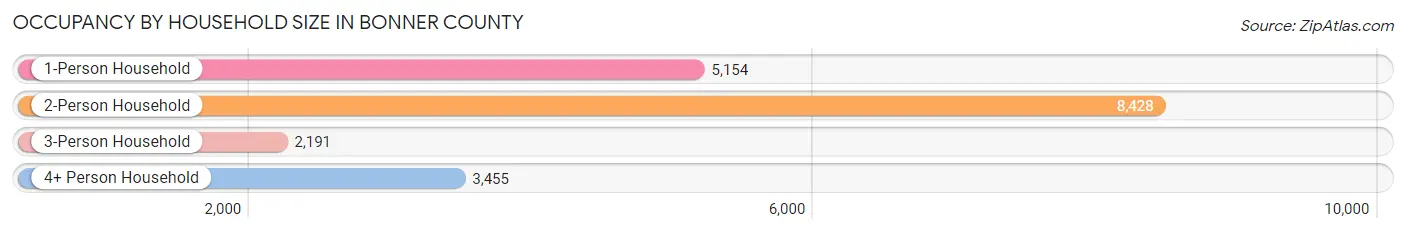
| Household Size | # Housing Units | % Housing Units |
| 1-Person Household | 5,154 | 26.8% |
| 2-Person Household | 8,428 | 43.8% |
| 3-Person Household | 2,191 | 11.4% |
| 4+ Person Household | 3,455 | 18.0% |
| Total Housing Units | 19,228 | 100.0% |
Occupancy by Ownership by Household Size in Bonner County
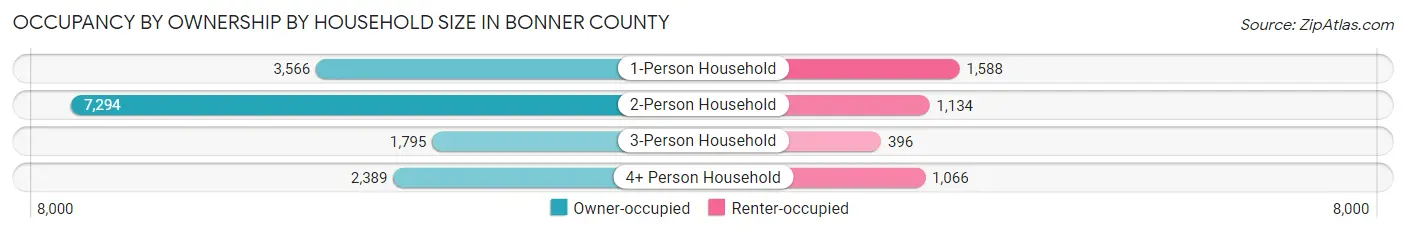
| Household Size | Owner-occupied | Renter-occupied |
| 1-Person Household | 3,566 (69.2%) | 1,588 (30.8%) |
| 2-Person Household | 7,294 (86.5%) | 1,134 (13.5%) |
| 3-Person Household | 1,795 (81.9%) | 396 (18.1%) |
| 4+ Person Household | 2,389 (69.2%) | 1,066 (30.8%) |
| Total Housing Units | 15,044 (78.2%) | 4,184 (21.8%) |
Occupancy by Educational Attainment in Bonner County
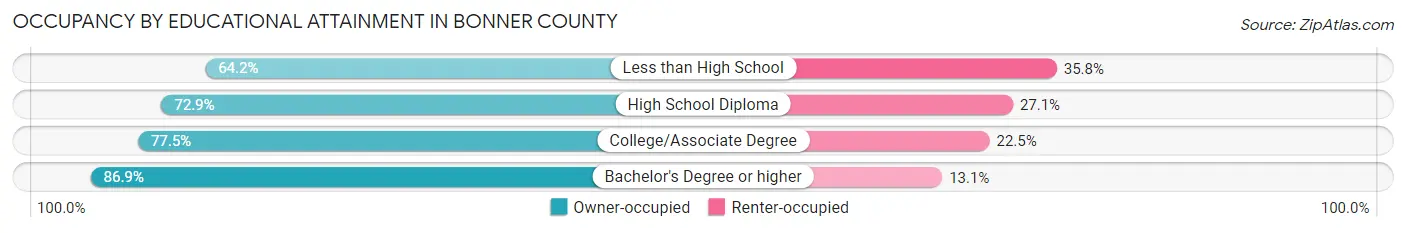
| Household Size | Owner-occupied | Renter-occupied |
| Less than High School | 821 (64.2%) | 458 (35.8%) |
| High School Diploma | 3,877 (72.9%) | 1,443 (27.1%) |
| College/Associate Degree | 5,200 (77.5%) | 1,508 (22.5%) |
| Bachelor's Degree or higher | 5,146 (86.9%) | 775 (13.1%) |
Occupancy by Age of Householder in Bonner County
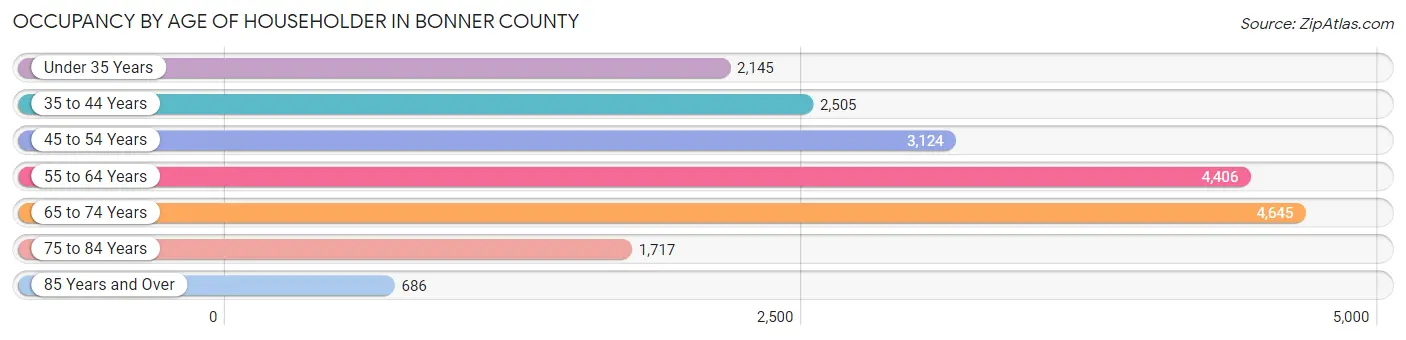
| Age Bracket | # Households | % Households |
| Under 35 Years | 2,145 | 11.2% |
| 35 to 44 Years | 2,505 | 13.0% |
| 45 to 54 Years | 3,124 | 16.3% |
| 55 to 64 Years | 4,406 | 22.9% |
| 65 to 74 Years | 4,645 | 24.2% |
| 75 to 84 Years | 1,717 | 8.9% |
| 85 Years and Over | 686 | 3.6% |
| Total | 19,228 | 100.0% |
Housing Finances in Bonner County
Median Income by Occupancy in Bonner County
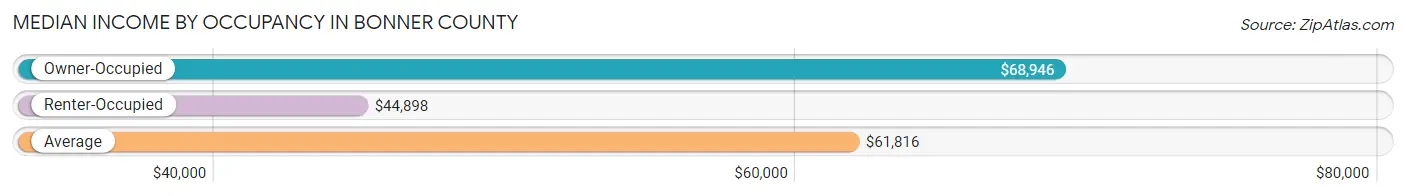
| Occupancy Type | # Households | Median Income |
| Owner-Occupied | 15,044 (78.2%) | $68,946 |
| Renter-Occupied | 4,184 (21.8%) | $44,898 |
| Average | 19,228 (100.0%) | $61,816 |
Occupancy by Householder Income Bracket in Bonner County
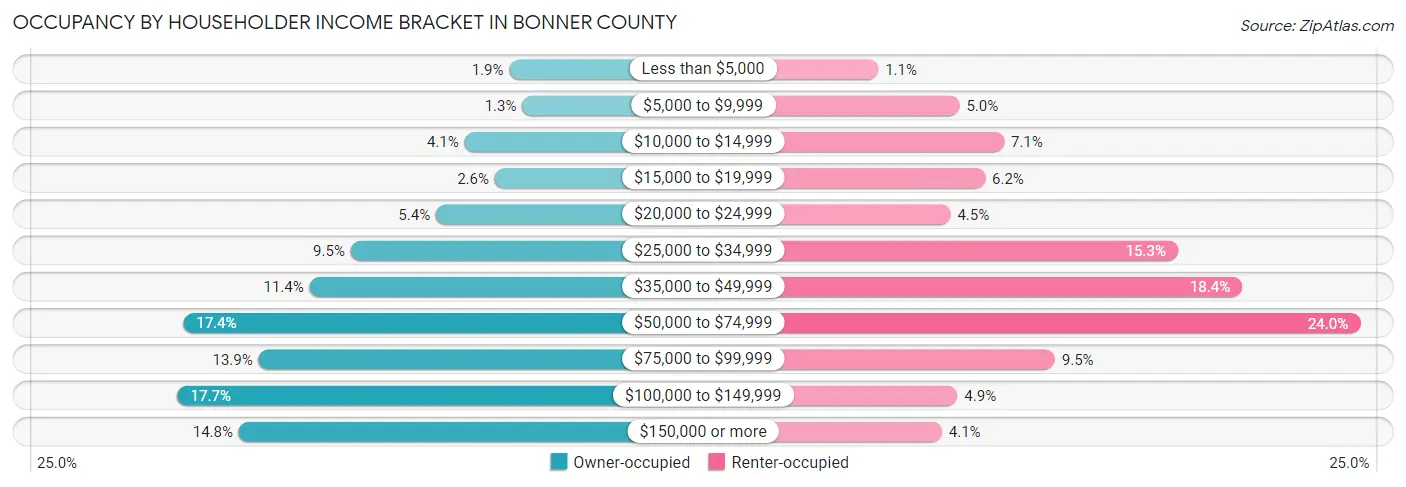
| Income Bracket | Owner-occupied | Renter-occupied |
| Less than $5,000 | 289 (1.9%) | 45 (1.1%) |
| $5,000 to $9,999 | 196 (1.3%) | 207 (5.0%) |
| $10,000 to $14,999 | 609 (4.1%) | 296 (7.1%) |
| $15,000 to $19,999 | 393 (2.6%) | 258 (6.2%) |
| $20,000 to $24,999 | 814 (5.4%) | 189 (4.5%) |
| $25,000 to $34,999 | 1,424 (9.5%) | 642 (15.3%) |
| $35,000 to $49,999 | 1,720 (11.4%) | 770 (18.4%) |
| $50,000 to $74,999 | 2,624 (17.4%) | 1,005 (24.0%) |
| $75,000 to $99,999 | 2,085 (13.9%) | 397 (9.5%) |
| $100,000 to $149,999 | 2,664 (17.7%) | 203 (4.9%) |
| $150,000 or more | 2,226 (14.8%) | 172 (4.1%) |
| Total | 15,044 (100.0%) | 4,184 (100.0%) |
Monthly Housing Cost Tiers in Bonner County
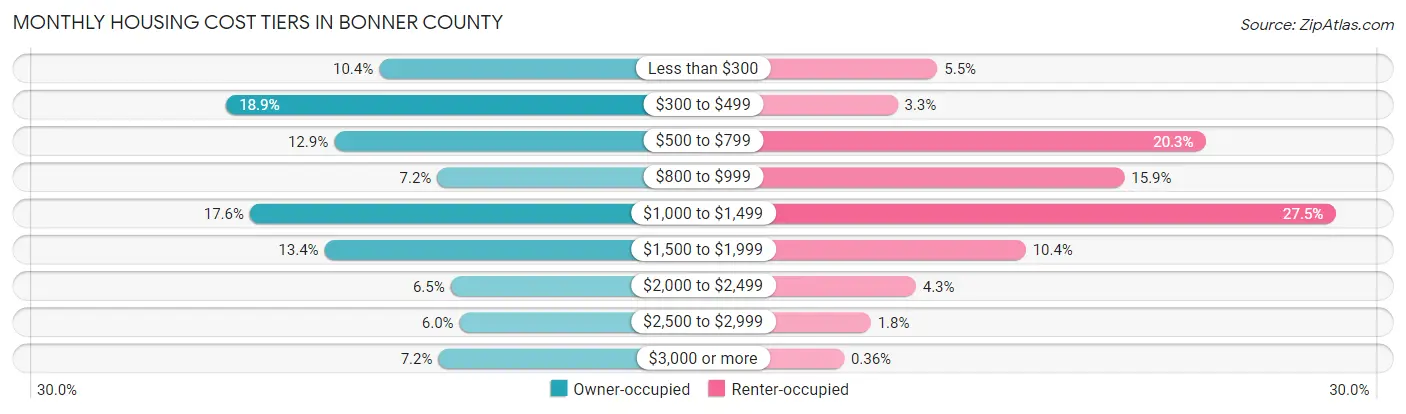
| Monthly Cost | Owner-occupied | Renter-occupied |
| Less than $300 | 1,568 (10.4%) | 231 (5.5%) |
| $300 to $499 | 2,838 (18.9%) | 139 (3.3%) |
| $500 to $799 | 1,942 (12.9%) | 850 (20.3%) |
| $800 to $999 | 1,085 (7.2%) | 663 (15.9%) |
| $1,000 to $1,499 | 2,641 (17.6%) | 1,150 (27.5%) |
| $1,500 to $1,999 | 2,022 (13.4%) | 435 (10.4%) |
| $2,000 to $2,499 | 974 (6.5%) | 181 (4.3%) |
| $2,500 to $2,999 | 899 (6.0%) | 77 (1.8%) |
| $3,000 or more | 1,075 (7.1%) | 15 (0.4%) |
| Total | 15,044 (100.0%) | 4,184 (100.0%) |
Physical Housing Characteristics in Bonner County
Housing Structures in Bonner County
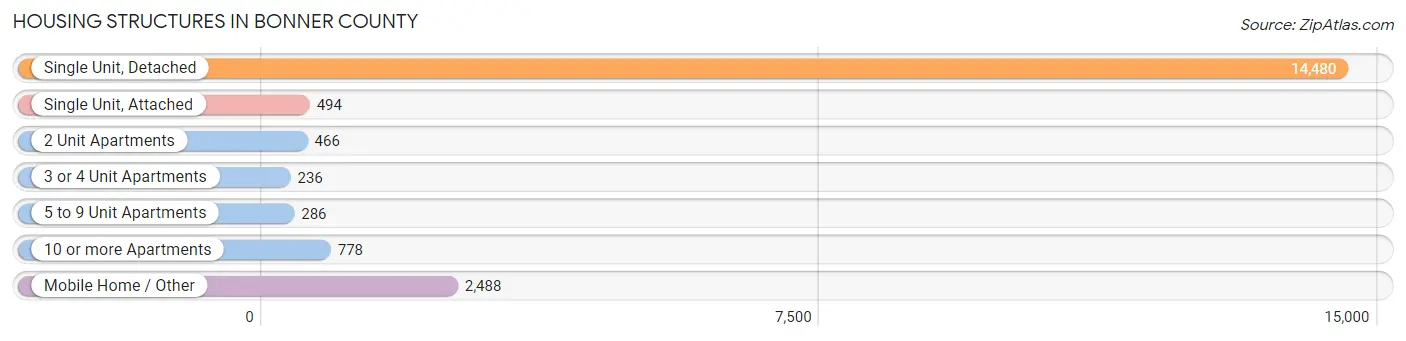
| Structure Type | # Housing Units | % Housing Units |
| Single Unit, Detached | 14,480 | 75.3% |
| Single Unit, Attached | 494 | 2.6% |
| 2 Unit Apartments | 466 | 2.4% |
| 3 or 4 Unit Apartments | 236 | 1.2% |
| 5 to 9 Unit Apartments | 286 | 1.5% |
| 10 or more Apartments | 778 | 4.1% |
| Mobile Home / Other | 2,488 | 12.9% |
| Total | 19,228 | 100.0% |
Housing Structures by Occupancy in Bonner County
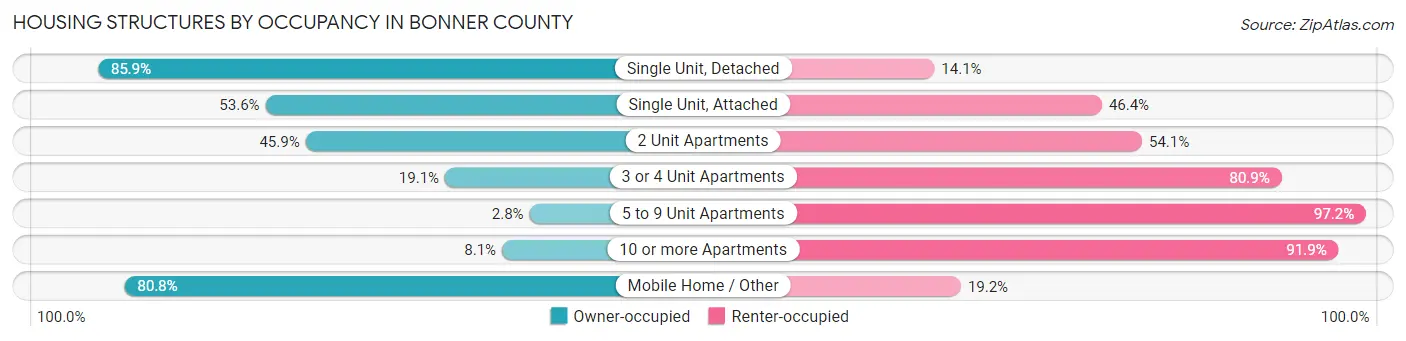
| Structure Type | Owner-occupied | Renter-occupied |
| Single Unit, Detached | 12,439 (85.9%) | 2,041 (14.1%) |
| Single Unit, Attached | 265 (53.6%) | 229 (46.4%) |
| 2 Unit Apartments | 214 (45.9%) | 252 (54.1%) |
| 3 or 4 Unit Apartments | 45 (19.1%) | 191 (80.9%) |
| 5 to 9 Unit Apartments | 8 (2.8%) | 278 (97.2%) |
| 10 or more Apartments | 63 (8.1%) | 715 (91.9%) |
| Mobile Home / Other | 2,010 (80.8%) | 478 (19.2%) |
| Total | 15,044 (78.2%) | 4,184 (21.8%) |
Housing Structures by Number of Rooms in Bonner County
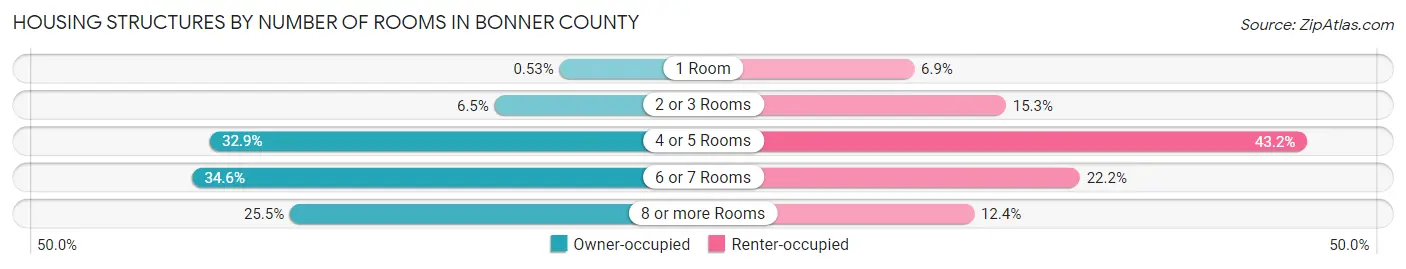
| Number of Rooms | Owner-occupied | Renter-occupied |
| 1 Room | 79 (0.5%) | 287 (6.9%) |
| 2 or 3 Rooms | 982 (6.5%) | 642 (15.3%) |
| 4 or 5 Rooms | 4,955 (32.9%) | 1,808 (43.2%) |
| 6 or 7 Rooms | 5,199 (34.6%) | 928 (22.2%) |
| 8 or more Rooms | 3,829 (25.5%) | 519 (12.4%) |
| Total | 15,044 (100.0%) | 4,184 (100.0%) |
Housing Structure by Heating Type in Bonner County
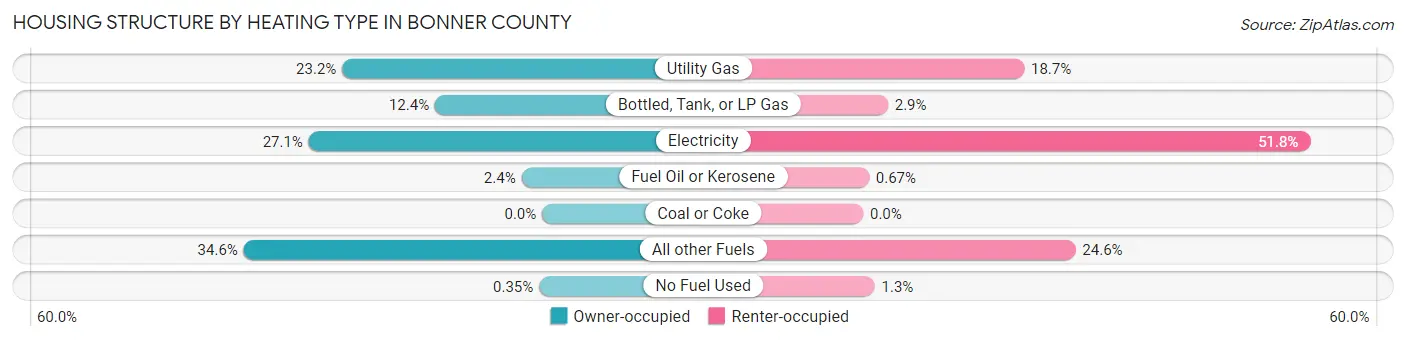
| Heating Type | Owner-occupied | Renter-occupied |
| Utility Gas | 3,487 (23.2%) | 781 (18.7%) |
| Bottled, Tank, or LP Gas | 1,869 (12.4%) | 120 (2.9%) |
| Electricity | 4,071 (27.1%) | 2,169 (51.8%) |
| Fuel Oil or Kerosene | 359 (2.4%) | 28 (0.7%) |
| Coal or Coke | 0 (0.0%) | 0 (0.0%) |
| All other Fuels | 5,205 (34.6%) | 1,030 (24.6%) |
| No Fuel Used | 53 (0.4%) | 56 (1.3%) |
| Total | 15,044 (100.0%) | 4,184 (100.0%) |
Household Vehicle Usage in Bonner County
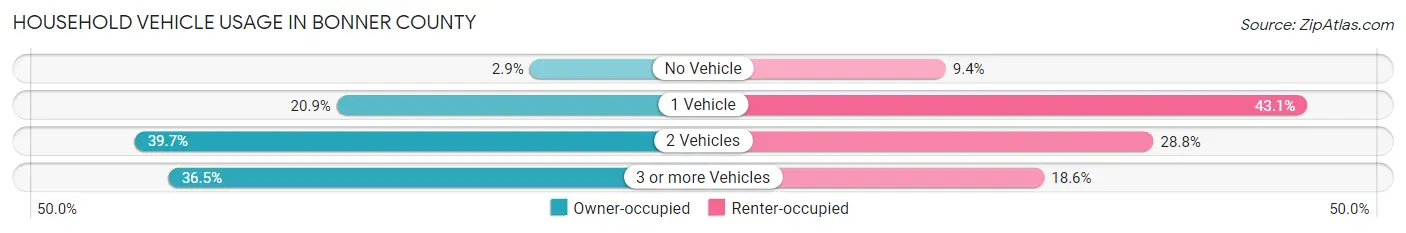
| Vehicles per Household | Owner-occupied | Renter-occupied |
| No Vehicle | 432 (2.9%) | 394 (9.4%) |
| 1 Vehicle | 3,140 (20.9%) | 1,805 (43.1%) |
| 2 Vehicles | 5,975 (39.7%) | 1,206 (28.8%) |
| 3 or more Vehicles | 5,497 (36.5%) | 779 (18.6%) |
| Total | 15,044 (100.0%) | 4,184 (100.0%) |
Real Estate & Mortgages in Bonner County
Real Estate and Mortgage Overview in Bonner County
| Characteristic | Without Mortgage | With Mortgage |
| Housing Units | 6,822 | 8,222 |
| Median Property Value | $321,400 | $424,700 |
| Median Household Income | $48,480 | $1,488 |
| Monthly Housing Costs | $434 | $1,065 |
| Real Estate Taxes | $1,394 | $97 |
Property Value by Mortgage Status in Bonner County
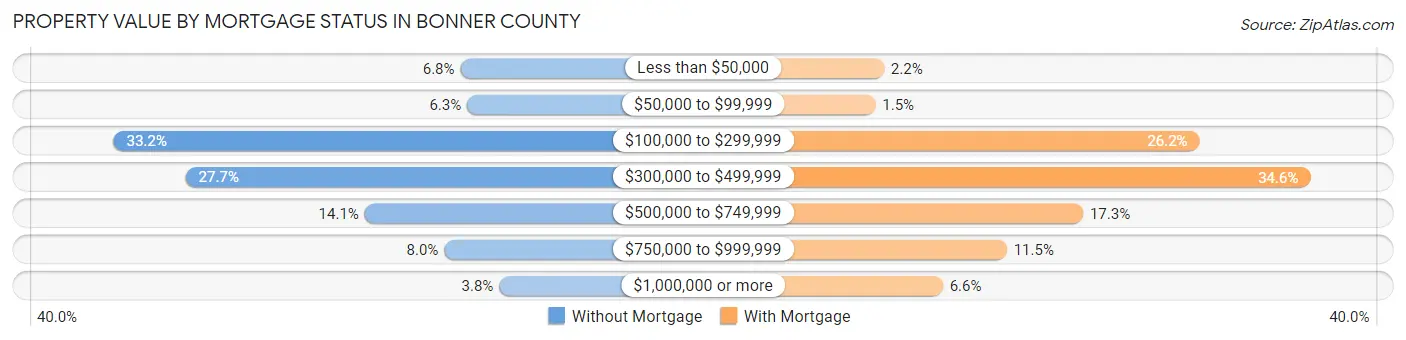
| Property Value | Without Mortgage | With Mortgage |
| Less than $50,000 | 464 (6.8%) | 178 (2.2%) |
| $50,000 to $99,999 | 429 (6.3%) | 124 (1.5%) |
| $100,000 to $299,999 | 2,266 (33.2%) | 2,154 (26.2%) |
| $300,000 to $499,999 | 1,892 (27.7%) | 2,848 (34.6%) |
| $500,000 to $749,999 | 961 (14.1%) | 1,425 (17.3%) |
| $750,000 to $999,999 | 548 (8.0%) | 947 (11.5%) |
| $1,000,000 or more | 262 (3.8%) | 546 (6.6%) |
| Total | 6,822 (100.0%) | 8,222 (100.0%) |
Household Income by Mortgage Status in Bonner County
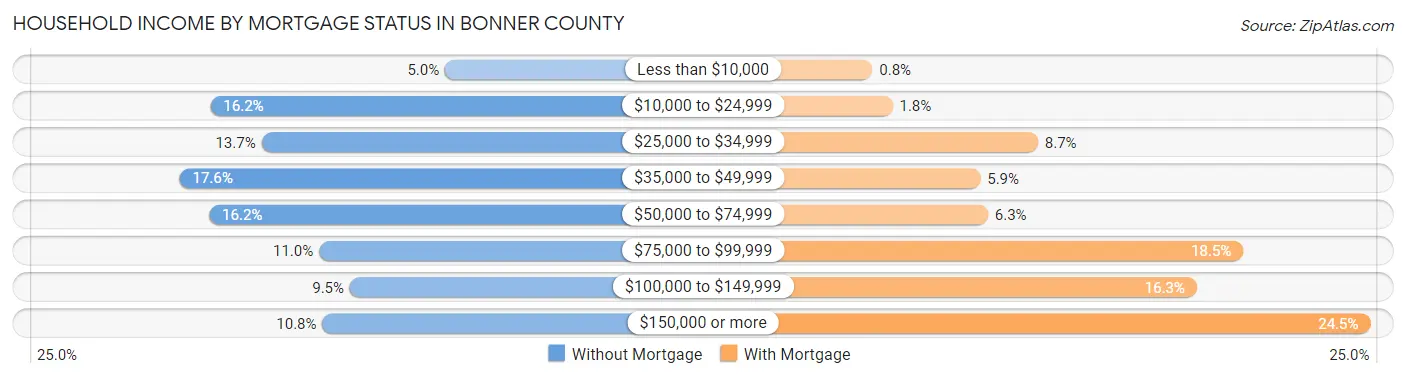
| Household Income | Without Mortgage | With Mortgage |
| Less than $10,000 | 340 (5.0%) | 66 (0.8%) |
| $10,000 to $24,999 | 1,102 (16.2%) | 145 (1.8%) |
| $25,000 to $34,999 | 936 (13.7%) | 714 (8.7%) |
| $35,000 to $49,999 | 1,202 (17.6%) | 488 (5.9%) |
| $50,000 to $74,999 | 1,106 (16.2%) | 518 (6.3%) |
| $75,000 to $99,999 | 749 (11.0%) | 1,518 (18.5%) |
| $100,000 to $149,999 | 649 (9.5%) | 1,336 (16.3%) |
| $150,000 or more | 738 (10.8%) | 2,015 (24.5%) |
| Total | 6,822 (100.0%) | 8,222 (100.0%) |
Property Value to Household Income Ratio in Bonner County
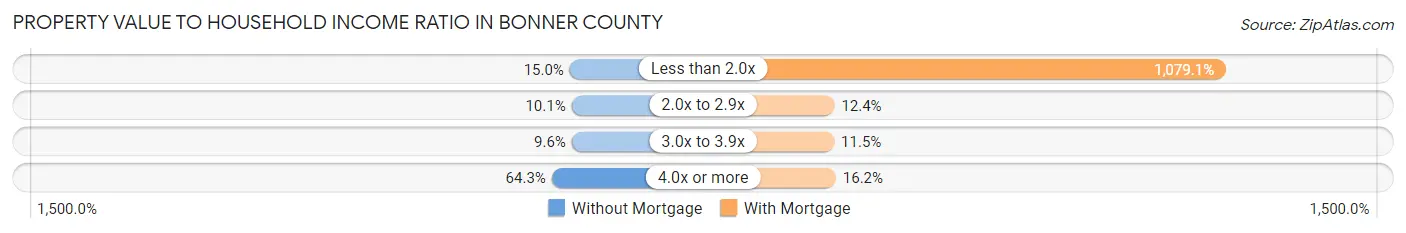
| Value-to-Income Ratio | Without Mortgage | With Mortgage |
| Less than 2.0x | 1,024 (15.0%) | 88,720 (1,079.1%) |
| 2.0x to 2.9x | 690 (10.1%) | 1,018 (12.4%) |
| 3.0x to 3.9x | 656 (9.6%) | 946 (11.5%) |
| 4.0x or more | 4,383 (64.2%) | 1,334 (16.2%) |
| Total | 6,822 (100.0%) | 8,222 (100.0%) |
Real Estate Taxes by Mortgage Status in Bonner County
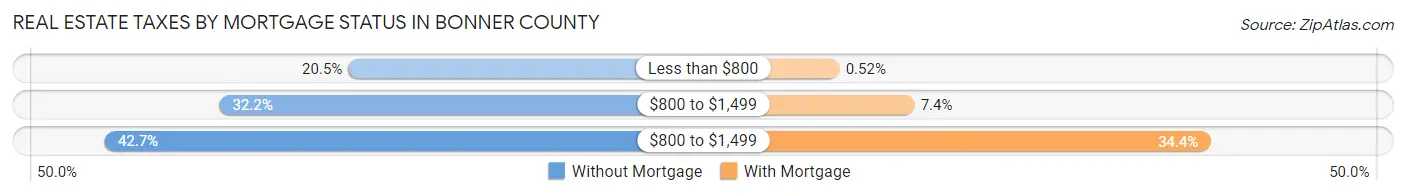
| Property Taxes | Without Mortgage | With Mortgage |
| Less than $800 | 1,395 (20.4%) | 43 (0.5%) |
| $800 to $1,499 | 2,197 (32.2%) | 606 (7.4%) |
| $800 to $1,499 | 2,910 (42.7%) | 2,832 (34.4%) |
| Total | 6,822 (100.0%) | 8,222 (100.0%) |
Health & Disability in Bonner County
Health Insurance Coverage by Age in Bonner County
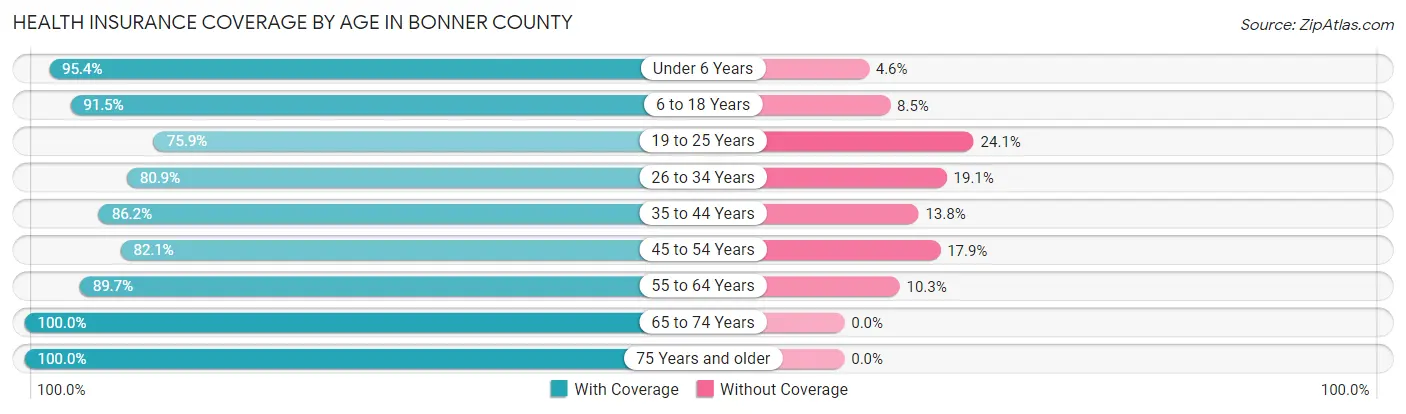
| Age Bracket | With Coverage | Without Coverage |
| Under 6 Years | 2,734 (95.4%) | 131 (4.6%) |
| 6 to 18 Years | 6,472 (91.5%) | 604 (8.5%) |
| 19 to 25 Years | 1,844 (75.9%) | 586 (24.1%) |
| 26 to 34 Years | 3,397 (80.9%) | 801 (19.1%) |
| 35 to 44 Years | 4,652 (86.2%) | 747 (13.8%) |
| 45 to 54 Years | 4,631 (82.1%) | 1,008 (17.9%) |
| 55 to 64 Years | 7,040 (89.7%) | 808 (10.3%) |
| 65 to 74 Years | 7,922 (100.0%) | 0 (0.0%) |
| 75 Years and older | 4,204 (100.0%) | 0 (0.0%) |
| Total | 42,896 (90.1%) | 4,685 (9.9%) |
Health Insurance Coverage by Citizenship Status in Bonner County
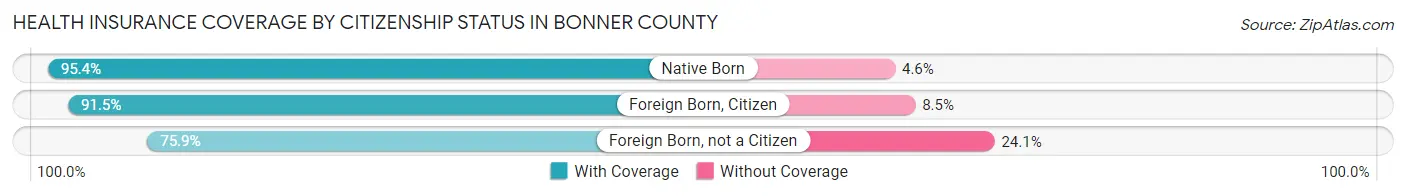
| Citizenship Status | With Coverage | Without Coverage |
| Native Born | 2,734 (95.4%) | 131 (4.6%) |
| Foreign Born, Citizen | 6,472 (91.5%) | 604 (8.5%) |
| Foreign Born, not a Citizen | 1,844 (75.9%) | 586 (24.1%) |
Health Insurance Coverage by Household Income in Bonner County
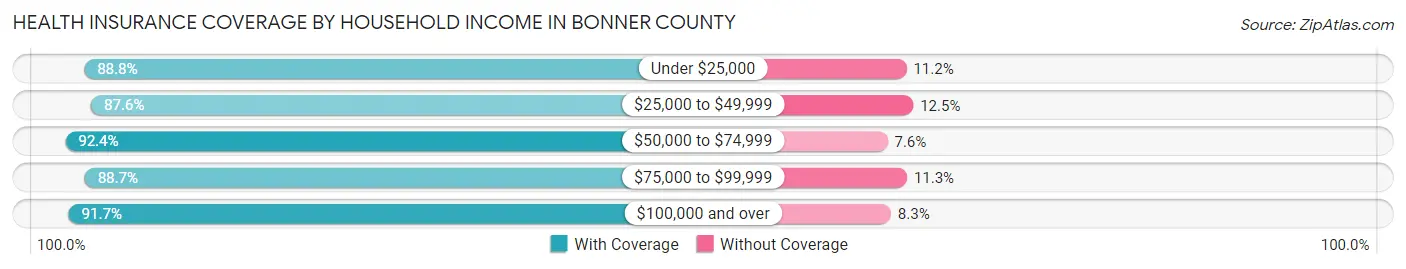
| Household Income | With Coverage | Without Coverage |
| Under $25,000 | 4,608 (88.8%) | 580 (11.2%) |
| $25,000 to $49,999 | 8,407 (87.5%) | 1,196 (12.4%) |
| $50,000 to $74,999 | 8,713 (92.4%) | 720 (7.6%) |
| $75,000 to $99,999 | 6,488 (88.7%) | 824 (11.3%) |
| $100,000 and over | 14,563 (91.7%) | 1,311 (8.3%) |
Public vs Private Health Insurance Coverage by Age in Bonner County
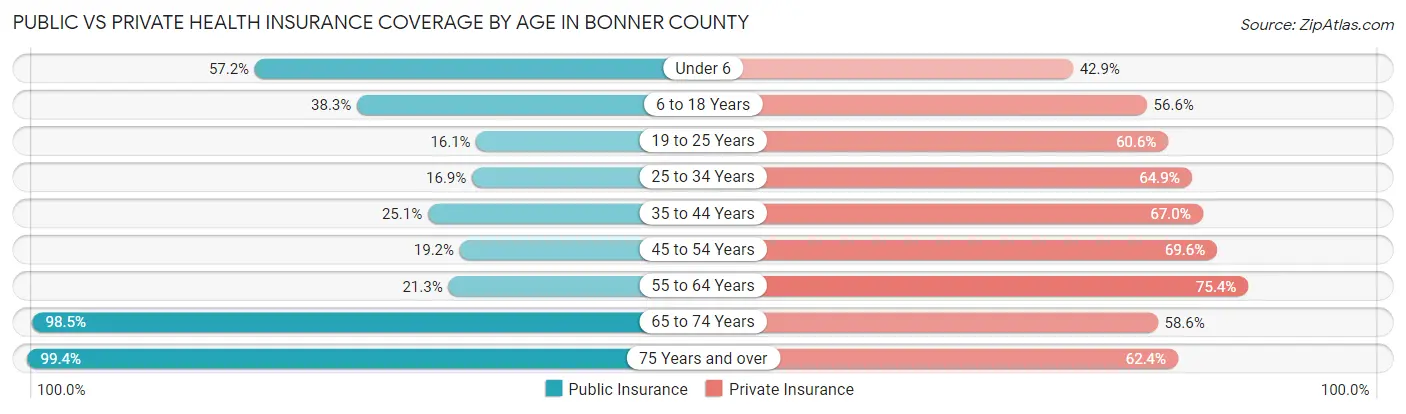
| Age Bracket | Public Insurance | Private Insurance |
| Under 6 | 1,640 (57.2%) | 1,228 (42.9%) |
| 6 to 18 Years | 2,709 (38.3%) | 4,004 (56.6%) |
| 19 to 25 Years | 392 (16.1%) | 1,472 (60.6%) |
| 25 to 34 Years | 711 (16.9%) | 2,725 (64.9%) |
| 35 to 44 Years | 1,357 (25.1%) | 3,615 (67.0%) |
| 45 to 54 Years | 1,083 (19.2%) | 3,927 (69.6%) |
| 55 to 64 Years | 1,673 (21.3%) | 5,919 (75.4%) |
| 65 to 74 Years | 7,803 (98.5%) | 4,643 (58.6%) |
| 75 Years and over | 4,180 (99.4%) | 2,622 (62.4%) |
| Total | 21,548 (45.3%) | 30,155 (63.4%) |
Disability Status by Sex by Age in Bonner County
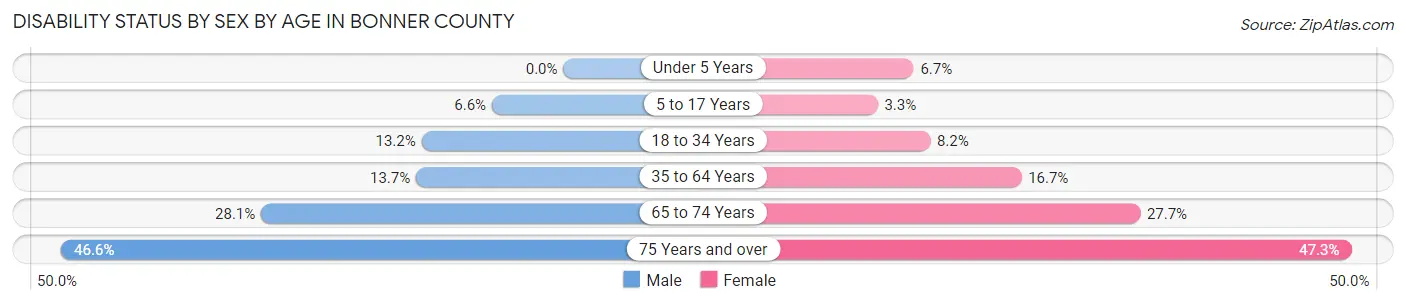
| Age Bracket | Male | Female |
| Under 5 Years | 0 (0.0%) | 71 (6.7%) |
| 5 to 17 Years | 243 (6.6%) | 115 (3.3%) |
| 18 to 34 Years | 484 (13.2%) | 290 (8.2%) |
| 35 to 64 Years | 1,277 (13.7%) | 1,589 (16.7%) |
| 65 to 74 Years | 1,155 (28.1%) | 1,053 (27.7%) |
| 75 Years and over | 957 (46.6%) | 1,017 (47.3%) |
Disability Class by Sex by Age in Bonner County
Disability Class: Hearing Difficulty
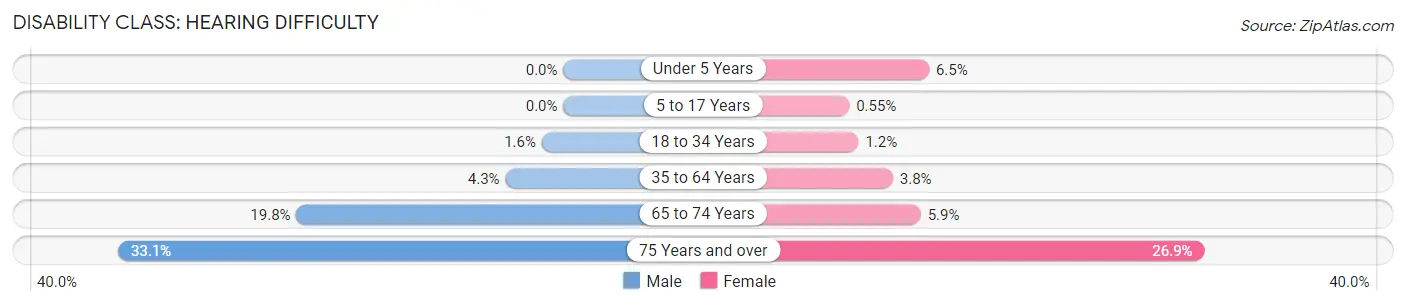
| Age Bracket | Male | Female |
| Under 5 Years | 0 (0.0%) | 69 (6.5%) |
| 5 to 17 Years | 0 (0.0%) | 19 (0.5%) |
| 18 to 34 Years | 59 (1.6%) | 44 (1.2%) |
| 35 to 64 Years | 402 (4.3%) | 362 (3.8%) |
| 65 to 74 Years | 816 (19.8%) | 223 (5.9%) |
| 75 Years and over | 679 (33.1%) | 579 (26.9%) |
Disability Class: Vision Difficulty

| Age Bracket | Male | Female |
| Under 5 Years | 0 (0.0%) | 2 (0.2%) |
| 5 to 17 Years | 64 (1.8%) | 11 (0.3%) |
| 18 to 34 Years | 135 (3.7%) | 27 (0.8%) |
| 35 to 64 Years | 290 (3.1%) | 300 (3.1%) |
| 65 to 74 Years | 156 (3.8%) | 117 (3.1%) |
| 75 Years and over | 133 (6.5%) | 142 (6.6%) |
Disability Class: Cognitive Difficulty
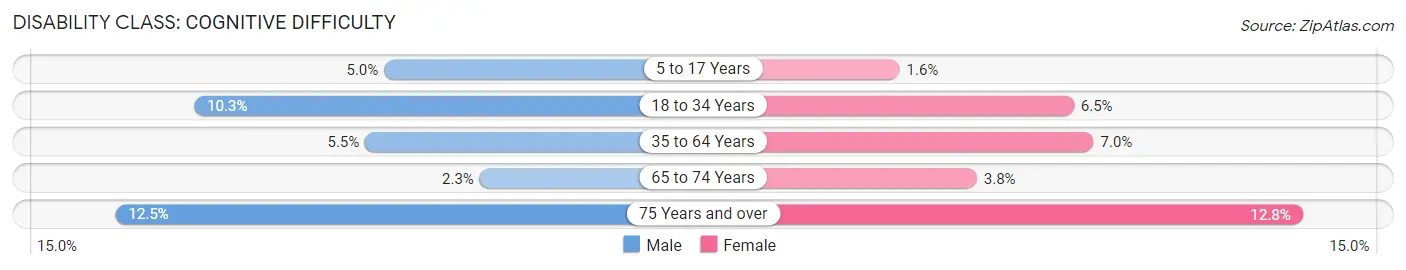
| Age Bracket | Male | Female |
| 5 to 17 Years | 183 (5.0%) | 56 (1.6%) |
| 18 to 34 Years | 378 (10.3%) | 229 (6.5%) |
| 35 to 64 Years | 516 (5.5%) | 669 (7.0%) |
| 65 to 74 Years | 96 (2.3%) | 143 (3.8%) |
| 75 Years and over | 256 (12.5%) | 276 (12.8%) |
Disability Class: Ambulatory Difficulty
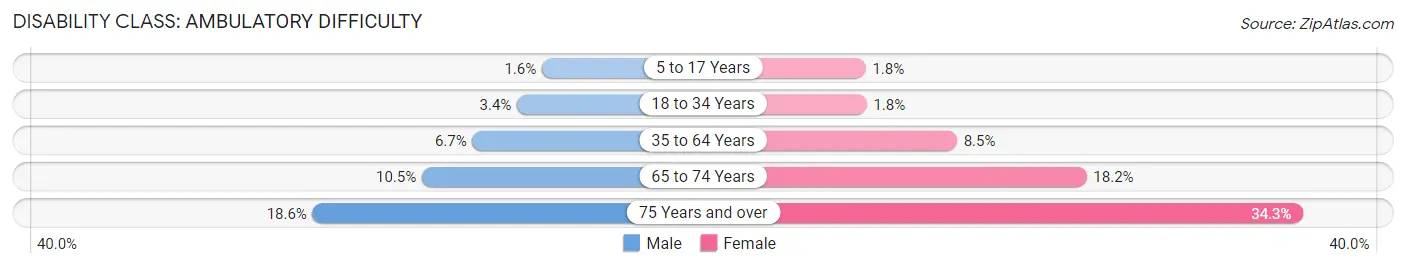
| Age Bracket | Male | Female |
| 5 to 17 Years | 58 (1.6%) | 61 (1.8%) |
| 18 to 34 Years | 126 (3.4%) | 65 (1.8%) |
| 35 to 64 Years | 630 (6.7%) | 814 (8.5%) |
| 65 to 74 Years | 432 (10.5%) | 691 (18.2%) |
| 75 Years and over | 382 (18.6%) | 737 (34.3%) |
Disability Class: Self-Care Difficulty
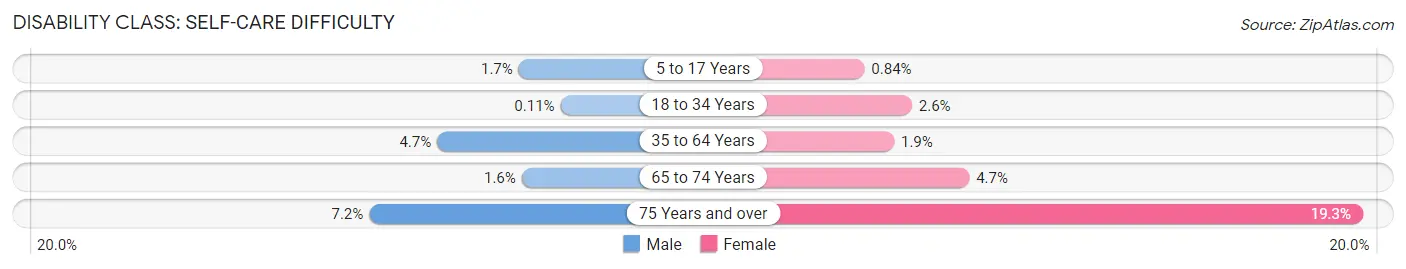
| Age Bracket | Male | Female |
| 5 to 17 Years | 61 (1.7%) | 29 (0.8%) |
| 18 to 34 Years | 4 (0.1%) | 92 (2.6%) |
| 35 to 64 Years | 438 (4.7%) | 185 (1.9%) |
| 65 to 74 Years | 64 (1.5%) | 180 (4.7%) |
| 75 Years and over | 148 (7.2%) | 416 (19.3%) |
Technology Access in Bonner County
Computing Device Access in Bonner County
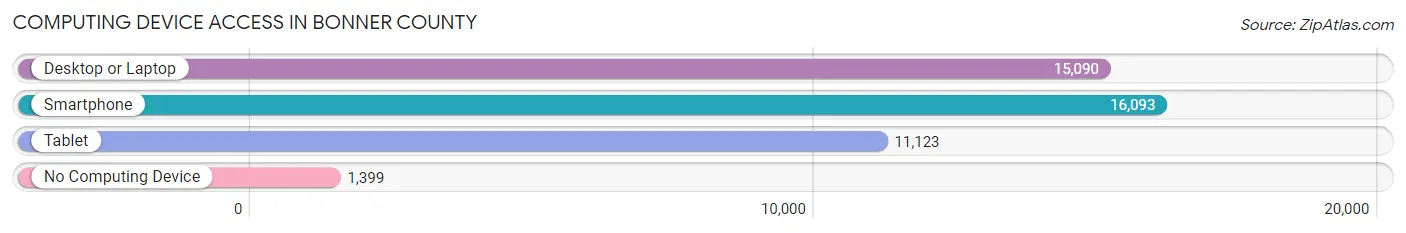
| Device Type | # Households | % Households |
| Desktop or Laptop | 15,090 | 78.5% |
| Smartphone | 16,093 | 83.7% |
| Tablet | 11,123 | 57.9% |
| No Computing Device | 1,399 | 7.3% |
| Total | 19,228 | 100.0% |
Internet Access in Bonner County
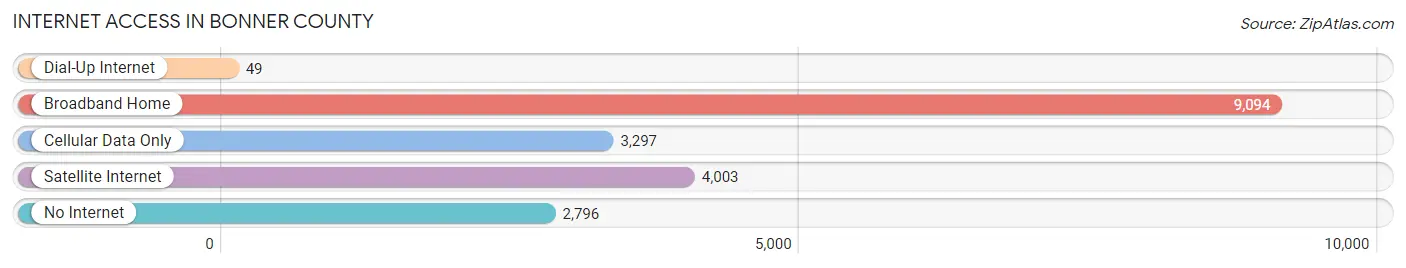
| Internet Type | # Households | % Households |
| Dial-Up Internet | 49 | 0.3% |
| Broadband Home | 9,094 | 47.3% |
| Cellular Data Only | 3,297 | 17.2% |
| Satellite Internet | 4,003 | 20.8% |
| No Internet | 2,796 | 14.5% |
| Total | 19,228 | 100.0% |
Bonner County Summary
Bonner County is located in the northern part of the state of Idaho, in the United States. It is bordered by Kootenai County to the east, Boundary County to the north, Shoshone County to the west, and Benewah County to the south. The county seat is Sandpoint, and the largest city is Ponderay. The county was established in 1907 and named after Edwin L. Bonner, an early settler in the area.
Geography
Bonner County covers an area of 1,722 square miles, making it the fourth largest county in Idaho. The county is located in the northern part of the state, and is bordered by Kootenai County to the east, Boundary County to the north, Shoshone County to the west, and Benewah County to the south. The county is mostly mountainous, with the Selkirk Mountains to the east and the Cabinet Mountains to the west. The highest point in the county is Mount Bonner, which has an elevation of 8,068 feet. The county also contains several lakes, including Priest Lake, Pend Oreille Lake, and Lake Pend Oreille.
Economy
Bonner County has a diverse economy, with a mix of agriculture, manufacturing, tourism, and services. Agriculture is the largest sector of the economy, with the county producing a variety of crops, including potatoes, wheat, barley, and hay. The county is also home to several manufacturing companies, including a paper mill, a wood products plant, and a furniture factory. Tourism is also an important part of the economy, with the county being home to several popular recreational areas, including Priest Lake State Park, Farragut State Park, and Round Lake State Park.
Demographics
As of the 2010 census, Bonner County had a population of 40,877. The population was spread out, with 24.3% under the age of 18, 8.2% from 18 to 24, 25.2% from 25 to 44, 28.2% from 45 to 64, and 14.1% who were 65 years of age or older. The median age was 40.3 years. The gender makeup of the county was 49.7% male and 50.3% female.
The median income for a household in the county was $41,945, and the median income for a family was $50,945. The per capita income for the county was $22,945. About 11.2% of the population was below the poverty line.
Conclusion
Bonner County is a diverse county located in the northern part of Idaho. It has a mix of agriculture, manufacturing, tourism, and services that make up its economy. The county has a population of 40,877, with a median age of 40.3 years and a median income of $41,945. The county is home to several popular recreational areas, making it a popular destination for tourists.
Common Questions
What is the Total Population of Bonner County?
Total Population of Bonner County is 47,976.
What is the Total Male Population of Bonner County?
Total Male Population of Bonner County is 24,159.
What is the Total Female Population of Bonner County?
Total Female Population of Bonner County is 23,817.
What is the Ratio of Males per 100 Females in Bonner County?
There are 101.44 Males per 100 Females in Bonner County.
What is the Ratio of Females per 100 Males in Bonner County?
There are 98.58 Females per 100 Males in Bonner County.
What is the Median Population Age in Bonner County?
Median Population Age in Bonner County is 48.3 Years.
What is the Average Family Size in Bonner County
Average Family Size in Bonner County is 2.9 People.
What is the Average Household Size in Bonner County
Average Household Size in Bonner County is 2.5 People.
What is Per Capita Income in Bonner County?
Per Capita income in Bonner County is $35,275.
What is the Median Family Income in Bonner County?
Median Family Income in Bonner County is $75,275.
What is the Median Household income in Bonner County?
Median Household Income in Bonner County is $61,816.
What is Income or Wage Gap in Bonner County?
Income or Wage Gap in Bonner County is 39.8%.
Women in Bonner County earn 60.2 cents for every dollar earned by a man.
What is Family Income Deficit in Bonner County?
Family Income Deficit in Bonner County is $9,314.
Families that are below poverty line in Bonner County earn $9,314 less on average than the poverty threshold level.
What is Inequality or Gini Index in Bonner County?
Inequality or Gini Index in Bonner County is 0.45.
How Large is the Labor Force in Bonner County?
There are 20,727 People in the Labor Forcein in Bonner County.
What is the Percentage of People in the Labor Force in Bonner County?
52.1% of People are in the Labor Force in Bonner County.
What is the Unemployment Rate in Bonner County?
Unemployment Rate in Bonner County is 3.5%.