Boise County, ID
Boise County Map
Boise County Overview
7,809
TOTAL POPULATION
3,907
MALE POPULATION
3,902
FEMALE POPULATION
100.13
MALES / 100 FEMALES
99.87
FEMALES / 100 MALES
53.7
MEDIAN AGE
2.7
AVG FAMILY SIZE
2.3
AVG HOUSEHOLD SIZE
$36,518
PER CAPITA INCOME
$81,897
AVG FAMILY INCOME
$70,776
AVG HOUSEHOLD INCOME
39.0%
WAGE / INCOME GAP [ % ]
61.0¢/ $1
WAGE / INCOME GAP [ $ ]
$13,060
FAMILY INCOME DEFICIT
0.38
INEQUALITY / GINI INDEX
3,532
LABOR FORCE [ PEOPLE ]
52.1%
PERCENT IN LABOR FORCE
3.4%
UNEMPLOYMENT RATE
Boise County Area Codes
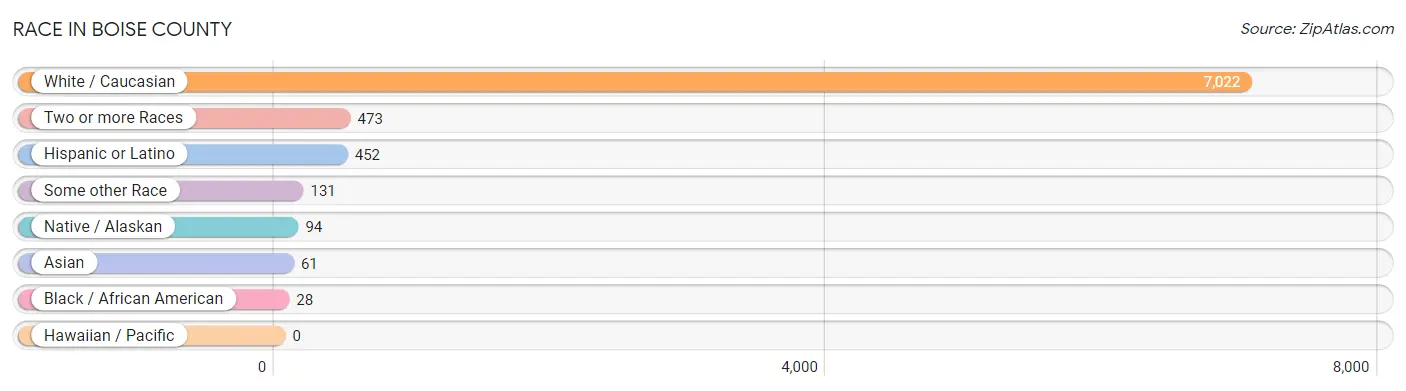
Race in Boise County
The most populous races in Boise County are White / Caucasian (7,022 | 89.9%), Two or more Races (473 | 6.1%), and Hispanic or Latino (452 | 5.8%).
| Race | # Population | % Population |
| Asian | 61 | 0.8% |
| Black / African American | 28 | 0.4% |
| Hawaiian / Pacific | 0 | 0.0% |
| Hispanic or Latino | 452 | 5.8% |
| Native / Alaskan | 94 | 1.2% |
| White / Caucasian | 7,022 | 89.9% |
| Two or more Races | 473 | 6.1% |
| Some other Race | 131 | 1.7% |
| Total | 7,809 | 100.0% |
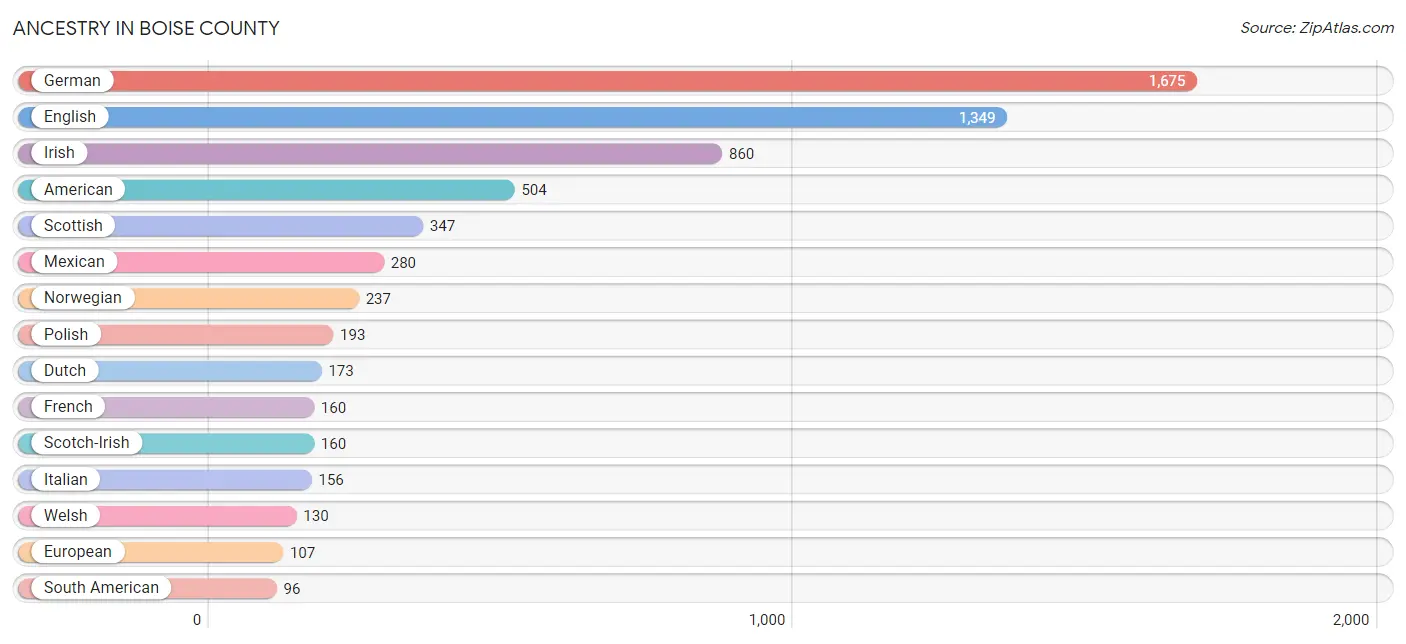
Ancestry in Boise County
The most populous ancestries reported in Boise County are German (1,675 | 21.4%), English (1,349 | 17.3%), Irish (860 | 11.0%), American (504 | 6.5%), and Scottish (347 | 4.4%), together accounting for 60.6% of all Boise County residents.
| Ancestry | # Population | % Population |
| African | 1 | 0.0% |
| American | 504 | 6.5% |
| Apache | 5 | 0.1% |
| Arab | 6 | 0.1% |
| Argentinean | 75 | 1.0% |
| Austrian | 26 | 0.3% |
| Basque | 12 | 0.2% |
| Belgian | 7 | 0.1% |
| Bhutanese | 45 | 0.6% |
| Blackfeet | 27 | 0.4% |
| British | 29 | 0.4% |
| Canadian | 3 | 0.0% |
| Carpatho Rusyn | 12 | 0.2% |
| Central American | 45 | 0.6% |
| Cherokee | 42 | 0.5% |
| Chippewa | 3 | 0.0% |
| Colombian | 21 | 0.3% |
| Croatian | 6 | 0.1% |
| Crow | 9 | 0.1% |
| Czechoslovakian | 12 | 0.2% |
| Danish | 31 | 0.4% |
| Delaware | 9 | 0.1% |
| Dominican | 14 | 0.2% |
| Dutch | 173 | 2.2% |
| Eastern European | 5 | 0.1% |
| English | 1,349 | 17.3% |
| European | 107 | 1.4% |
| Finnish | 9 | 0.1% |
| French | 160 | 2.1% |
| French Canadian | 71 | 0.9% |
| German | 1,675 | 21.4% |
| Greek | 38 | 0.5% |
| Guatemalan | 41 | 0.5% |
| Hungarian | 61 | 0.8% |
| Icelander | 14 | 0.2% |
| Irish | 860 | 11.0% |
| Italian | 156 | 2.0% |
| Jamaican | 22 | 0.3% |
| Korean | 13 | 0.2% |
| Lebanese | 6 | 0.1% |
| Luxembourger | 6 | 0.1% |
| Macedonian | 17 | 0.2% |
| Mexican | 280 | 3.6% |
| Nicaraguan | 4 | 0.1% |
| Northern European | 7 | 0.1% |
| Norwegian | 237 | 3.0% |
| Polish | 193 | 2.5% |
| Portuguese | 6 | 0.1% |
| Romanian | 1 | 0.0% |
| Russian | 47 | 0.6% |
| Scandinavian | 47 | 0.6% |
| Scotch-Irish | 160 | 2.1% |
| Scottish | 347 | 4.4% |
| Shoshone | 7 | 0.1% |
| Sioux | 19 | 0.2% |
| Slovene | 10 | 0.1% |
| South American | 96 | 1.2% |
| Spaniard | 6 | 0.1% |
| Subsaharan African | 1 | 0.0% |
| Swedish | 81 | 1.0% |
| Swiss | 35 | 0.4% |
| Ukrainian | 8 | 0.1% |
| Welsh | 130 | 1.7% |
| Yaqui | 17 | 0.2% | View All 64 Rows |
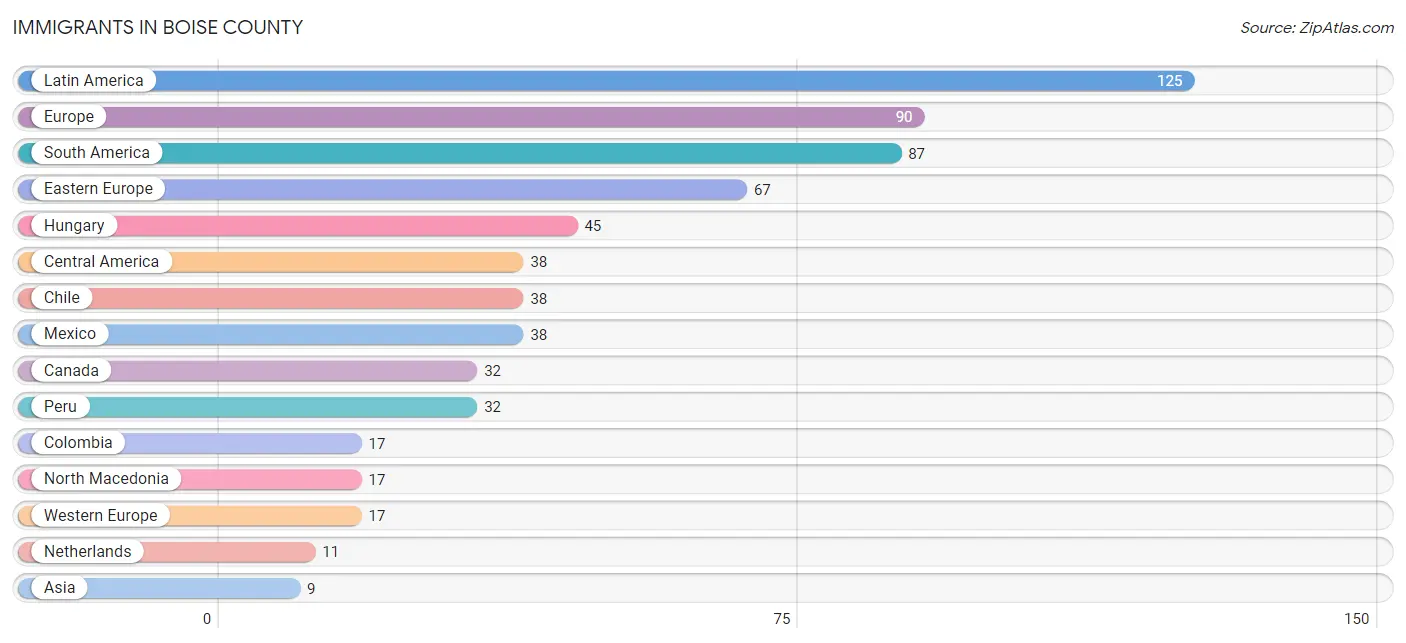
Immigrants in Boise County
The most numerous immigrant groups reported in Boise County came from Latin America (125 | 1.6%), Europe (90 | 1.1%), South America (87 | 1.1%), Eastern Europe (67 | 0.9%), and Hungary (45 | 0.6%), together accounting for 5.3% of all Boise County residents.
| Immigration Origin | # Population | % Population |
| Africa | 1 | 0.0% |
| Asia | 9 | 0.1% |
| Canada | 32 | 0.4% |
| Central America | 38 | 0.5% |
| Chile | 38 | 0.5% |
| Colombia | 17 | 0.2% |
| Eastern Europe | 67 | 0.9% |
| Europe | 90 | 1.1% |
| Germany | 6 | 0.1% |
| Hungary | 45 | 0.6% |
| India | 9 | 0.1% |
| Latin America | 125 | 1.6% |
| Mexico | 38 | 0.5% |
| Netherlands | 11 | 0.1% |
| North Macedonia | 17 | 0.2% |
| Peru | 32 | 0.4% |
| Poland | 5 | 0.1% |
| South Africa | 1 | 0.0% |
| South America | 87 | 1.1% |
| South Central Asia | 9 | 0.1% |
| Southern Europe | 6 | 0.1% |
| Spain | 6 | 0.1% |
| Western Europe | 17 | 0.2% | View All 23 Rows |
Sex and Age in Boise County
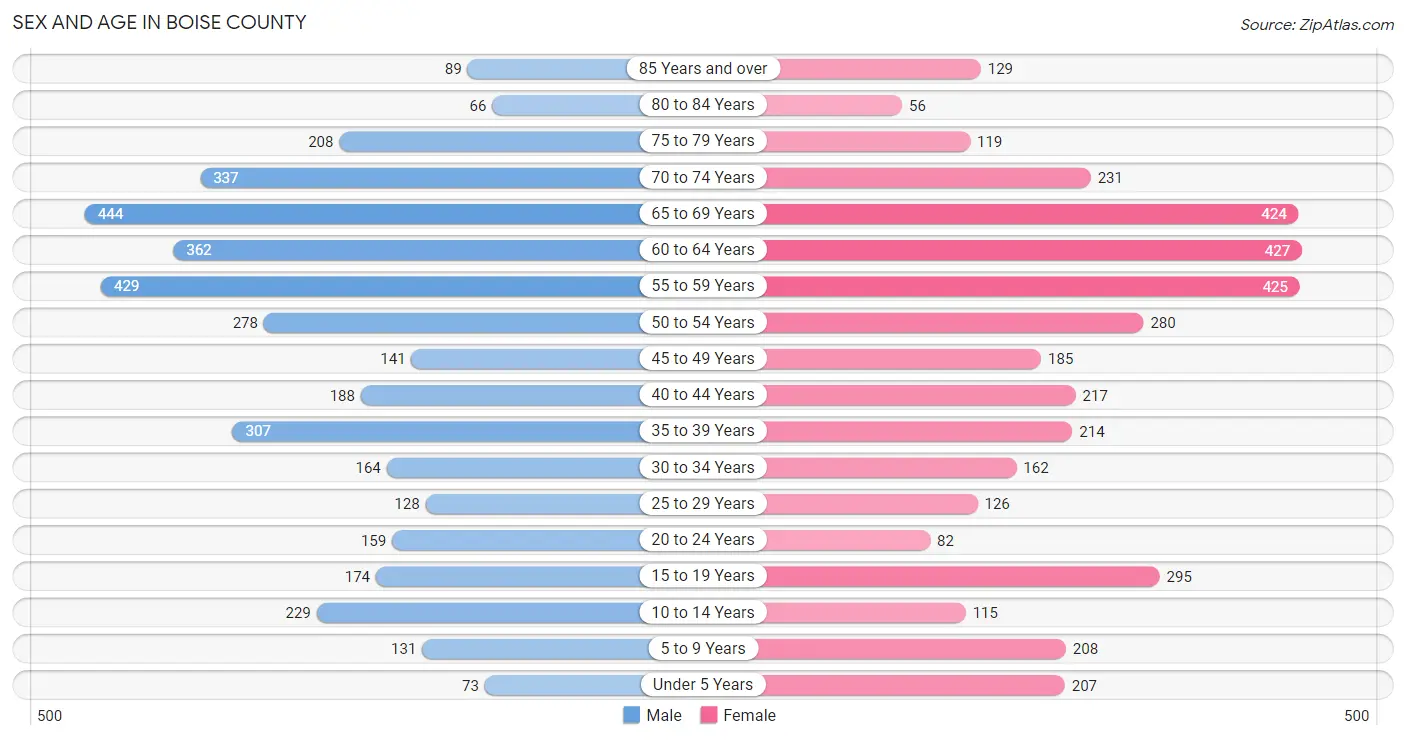
Sex and Age in Boise County
The most populous age groups in Boise County are 65 to 69 Years (444 | 11.4%) for men and 60 to 64 Years (427 | 10.9%) for women.
| Age Bracket | Male | Female |
| Under 5 Years | 73 (1.9%) | 207 (5.3%) |
| 5 to 9 Years | 131 (3.4%) | 208 (5.3%) |
| 10 to 14 Years | 229 (5.9%) | 115 (2.9%) |
| 15 to 19 Years | 174 (4.4%) | 295 (7.6%) |
| 20 to 24 Years | 159 (4.1%) | 82 (2.1%) |
| 25 to 29 Years | 128 (3.3%) | 126 (3.2%) |
| 30 to 34 Years | 164 (4.2%) | 162 (4.2%) |
| 35 to 39 Years | 307 (7.9%) | 214 (5.5%) |
| 40 to 44 Years | 188 (4.8%) | 217 (5.6%) |
| 45 to 49 Years | 141 (3.6%) | 185 (4.7%) |
| 50 to 54 Years | 278 (7.1%) | 280 (7.2%) |
| 55 to 59 Years | 429 (11.0%) | 425 (10.9%) |
| 60 to 64 Years | 362 (9.3%) | 427 (10.9%) |
| 65 to 69 Years | 444 (11.4%) | 424 (10.9%) |
| 70 to 74 Years | 337 (8.6%) | 231 (5.9%) |
| 75 to 79 Years | 208 (5.3%) | 119 (3.0%) |
| 80 to 84 Years | 66 (1.7%) | 56 (1.4%) |
| 85 Years and over | 89 (2.3%) | 129 (3.3%) |
| Total | 3,907 (100.0%) | 3,902 (100.0%) |
Families and Households in Boise County
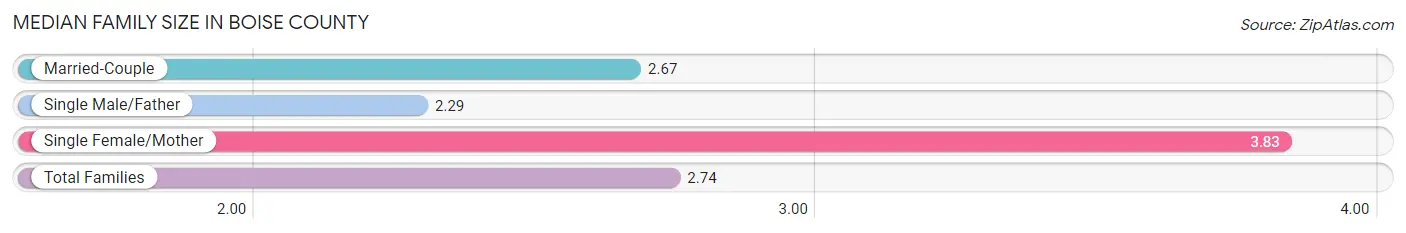
Median Family Size in Boise County
The median family size in Boise County is 2.74 persons per family, with single female/mother families (155 | 6.8%) accounting for the largest median family size of 3.83 persons per family. On the other hand, single male/father families (98 | 4.3%) represent the smallest median family size with 2.29 persons per family.
| Family Type | # Families | Family Size |
| Married-Couple | 2,041 (89.0%) | 2.67 |
| Single Male/Father | 98 (4.3%) | 2.29 |
| Single Female/Mother | 155 (6.8%) | 3.83 |
| Total Families | 2,294 (100.0%) | 2.74 |
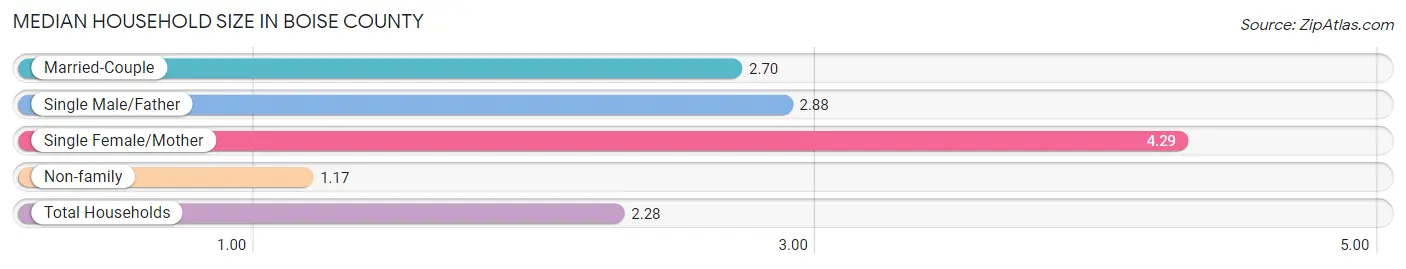
Median Household Size in Boise County
The median household size in Boise County is 2.28 persons per household, with single female/mother households (155 | 4.6%) accounting for the largest median household size of 4.29 persons per household. non-family households (1,102 | 32.5%) represent the smallest median household size with 1.17 persons per household.
| Household Type | # Households | Household Size |
| Married-Couple | 2,041 (60.1%) | 2.70 |
| Single Male/Father | 98 (2.9%) | 2.88 |
| Single Female/Mother | 155 (4.6%) | 4.29 |
| Non-family | 1,102 (32.5%) | 1.17 |
| Total Households | 3,396 (100.0%) | 2.28 |
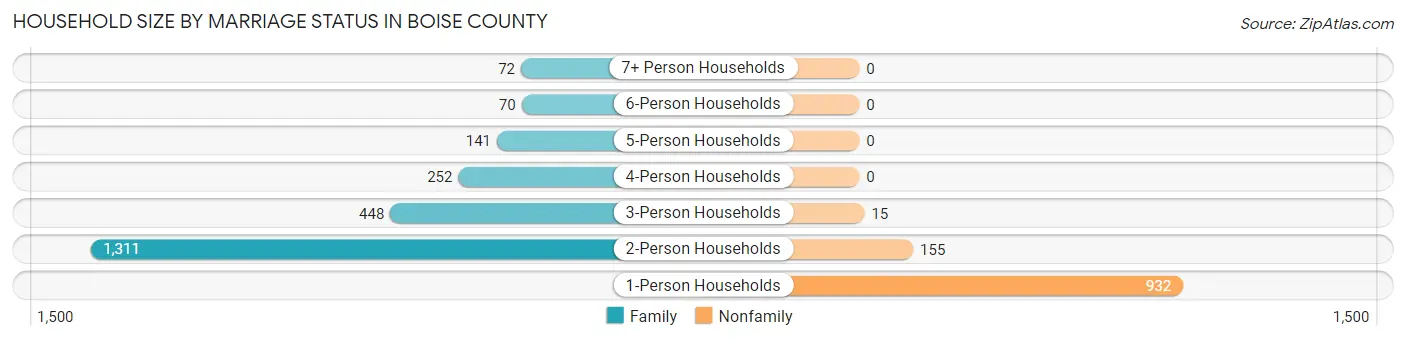
Household Size by Marriage Status in Boise County
Out of a total of 3,396 households in Boise County, 2,294 (67.5%) are family households, while 1,102 (32.5%) are nonfamily households. The most numerous type of family households are 2-person households, comprising 1,311, and the most common type of nonfamily households are 1-person households, comprising 932.
| Household Size | Family Households | Nonfamily Households |
| 1-Person Households | - | 932 (27.4%) |
| 2-Person Households | 1,311 (38.6%) | 155 (4.6%) |
| 3-Person Households | 448 (13.2%) | 15 (0.4%) |
| 4-Person Households | 252 (7.4%) | 0 (0.0%) |
| 5-Person Households | 141 (4.2%) | 0 (0.0%) |
| 6-Person Households | 70 (2.1%) | 0 (0.0%) |
| 7+ Person Households | 72 (2.1%) | 0 (0.0%) |
| Total | 2,294 (67.5%) | 1,102 (32.5%) |
Female Fertility in Boise County
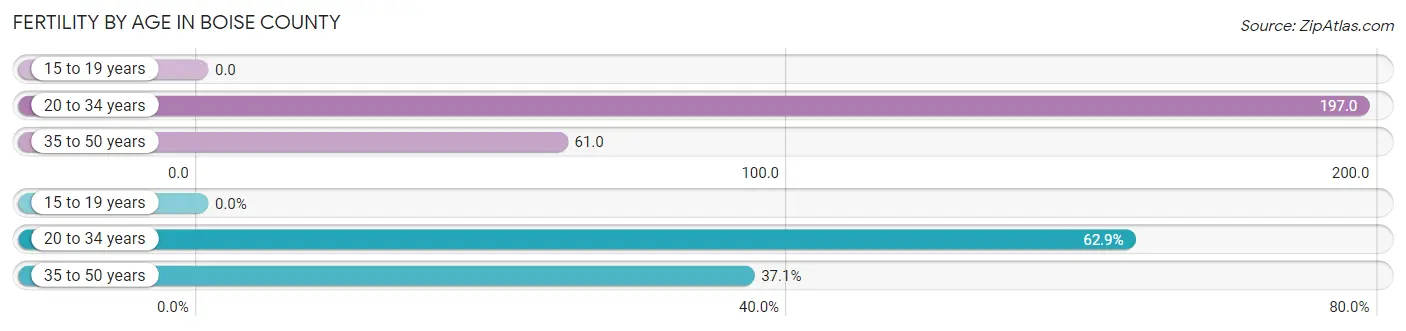
Fertility by Age in Boise County
Average fertility rate in Boise County is 85.0 births per 1,000 women. Women in the age bracket of 20 to 34 years have the highest fertility rate with 197.0 births per 1,000 women. Women in the age bracket of 20 to 34 years acount for 62.9% of all women with births.
| Age Bracket | Women with Births | Births / 1,000 Women |
| 15 to 19 years | 0 (0.0%) | 0.0 |
| 20 to 34 years | 73 (62.9%) | 197.0 |
| 35 to 50 years | 43 (37.1%) | 61.0 |
| Total | 116 (100.0%) | 85.0 |
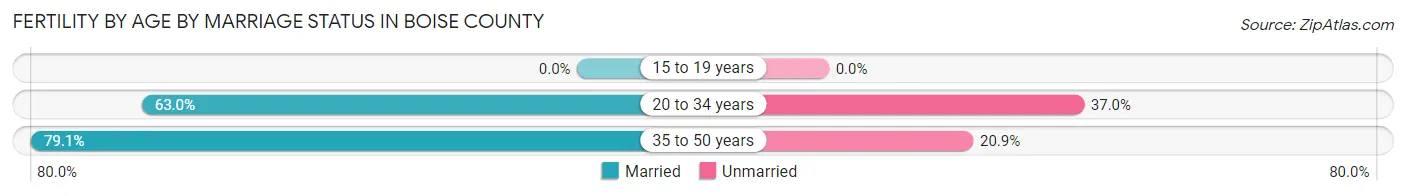
Fertility by Age by Marriage Status in Boise County
69.0% of women with births (116) in Boise County are married. The highest percentage of unmarried women with births falls into 20 to 34 years age bracket with 37.0% of them unmarried at the time of birth, while the lowest percentage of unmarried women with births belong to 35 to 50 years age bracket with 20.9% of them unmarried.
| Age Bracket | Married | Unmarried |
| 15 to 19 years | 0 (0.0%) | 0 (0.0%) |
| 20 to 34 years | 46 (63.0%) | 27 (37.0%) |
| 35 to 50 years | 34 (79.1%) | 9 (20.9%) |
| Total | 80 (69.0%) | 36 (31.0%) |
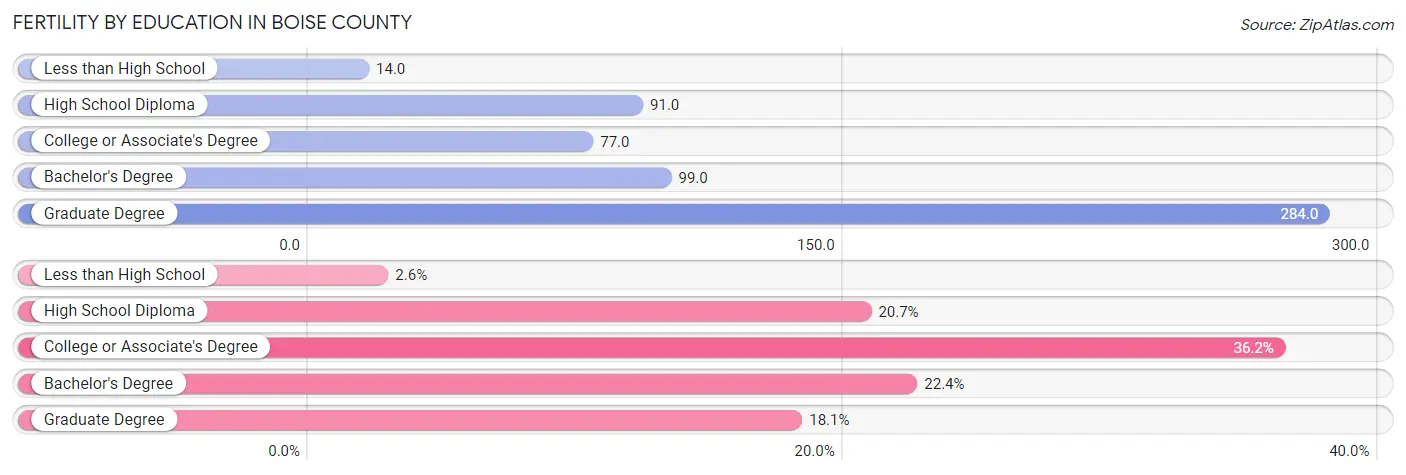
Fertility by Education in Boise County
Average fertility rate in Boise County is 85.0 births per 1,000 women. Women with the education attainment of graduate degree have the highest fertility rate of 284.0 births per 1,000 women, while women with the education attainment of less than high school have the lowest fertility at 14.0 births per 1,000 women. Women with the education attainment of college or associate's degree represent 36.2% of all women with births.
| Educational Attainment | Women with Births | Births / 1,000 Women |
| Less than High School | 3 (2.6%) | 14.0 |
| High School Diploma | 24 (20.7%) | 91.0 |
| College or Associate's Degree | 42 (36.2%) | 77.0 |
| Bachelor's Degree | 26 (22.4%) | 99.0 |
| Graduate Degree | 21 (18.1%) | 284.0 |
| Total | 116 (100.0%) | 85.0 |
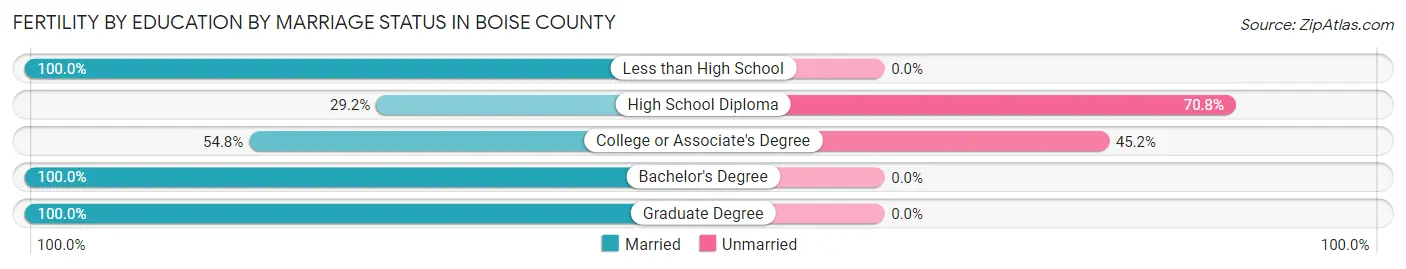
Fertility by Education by Marriage Status in Boise County
31.0% of women with births in Boise County are unmarried. Women with the educational attainment of less than high school are most likely to be married with 100.0% of them married at childbirth, while women with the educational attainment of high school diploma are least likely to be married with 70.8% of them unmarried at childbirth.
| Educational Attainment | Married | Unmarried |
| Less than High School | 3 (100.0%) | 0 (0.0%) |
| High School Diploma | 7 (29.2%) | 17 (70.8%) |
| College or Associate's Degree | 23 (54.8%) | 19 (45.2%) |
| Bachelor's Degree | 26 (100.0%) | 0 (0.0%) |
| Graduate Degree | 21 (100.0%) | 0 (0.0%) |
| Total | 80 (69.0%) | 36 (31.0%) |
Income in Boise County
Income Overview in Boise County
Per Capita Income in Boise County is $36,518, while median incomes of families and households are $81,897 and $70,776 respectively.
| Characteristic | Number | Measure |
| Per Capita Income | 7,809 | $36,518 |
| Median Family Income | 2,294 | $81,897 |
| Mean Family Income | 2,294 | $94,779 |
| Median Household Income | 3,396 | $70,776 |
| Mean Household Income | 3,396 | $81,673 |
| Income Deficit | 2,294 | $13,060 |
| Wage / Income Gap (%) | 7,809 | 39.00% |
| Wage / Income Gap ($) | 7,809 | 61.00¢ per $1 |
| Gini / Inequality Index | 7,809 | 0.38 |
Earnings by Sex in Boise County
Average Earnings in Boise County are $37,779, $49,412 for men and $30,141 for women, a difference of 39.0%.
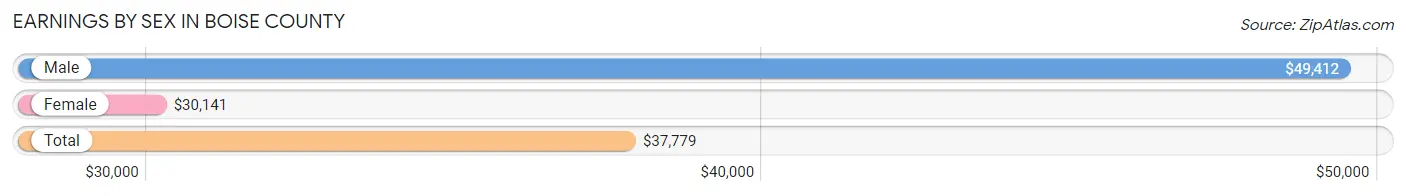
| Sex | Number | Average Earnings |
| Male | 2,016 (53.3%) | $49,412 |
| Female | 1,768 (46.7%) | $30,141 |
| Total | 3,784 (100.0%) | $37,779 |
Earnings by Sex by Income Bracket in Boise County
The most common earnings brackets in Boise County are $100,000+ for men (379 | 18.8%) and $35,000 to $39,999 for women (193 | 10.9%).
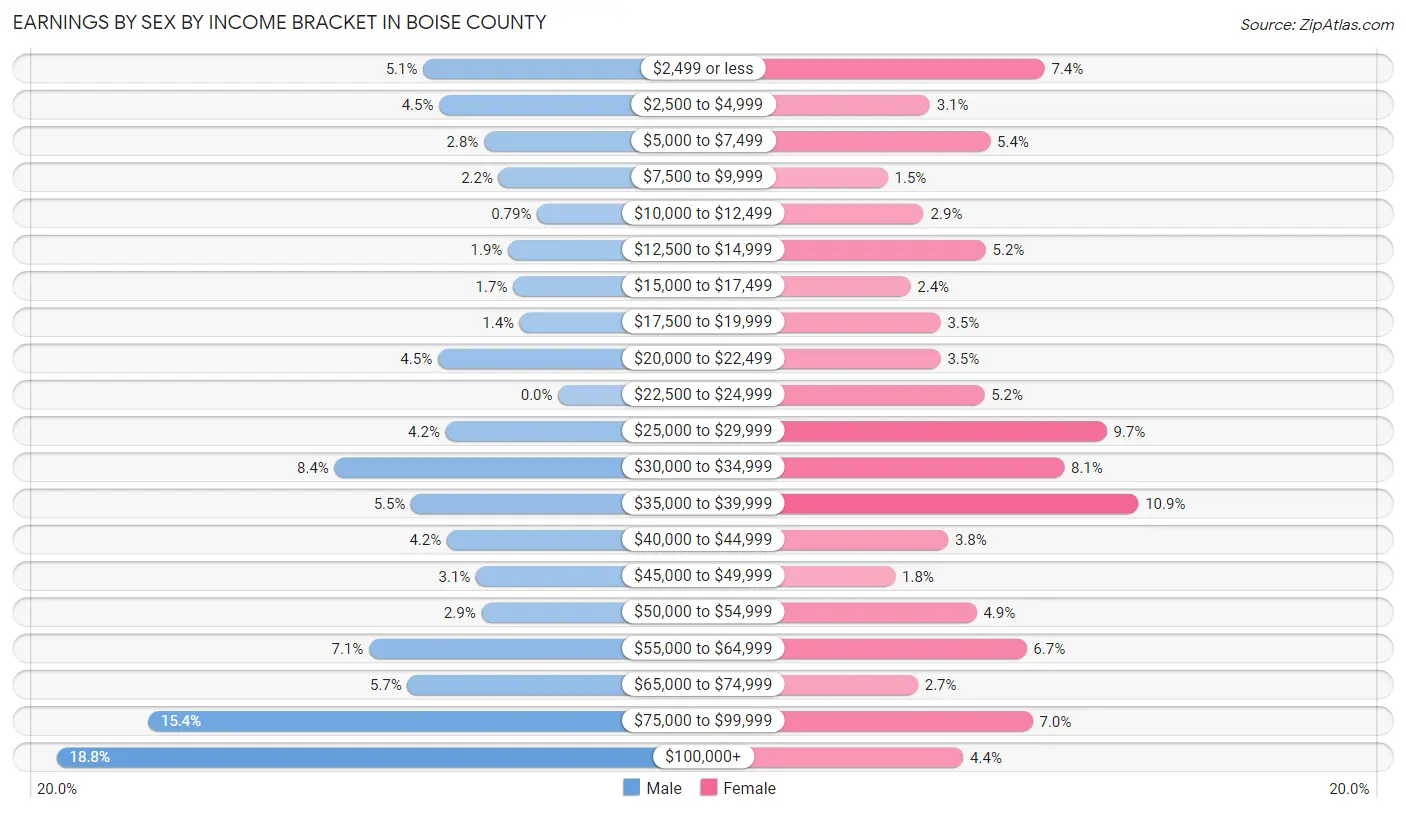
| Income | Male | Female |
| $2,499 or less | 102 (5.1%) | 131 (7.4%) |
| $2,500 to $4,999 | 90 (4.5%) | 55 (3.1%) |
| $5,000 to $7,499 | 56 (2.8%) | 95 (5.4%) |
| $7,500 to $9,999 | 45 (2.2%) | 27 (1.5%) |
| $10,000 to $12,499 | 16 (0.8%) | 51 (2.9%) |
| $12,500 to $14,999 | 38 (1.9%) | 92 (5.2%) |
| $15,000 to $17,499 | 34 (1.7%) | 42 (2.4%) |
| $17,500 to $19,999 | 29 (1.4%) | 62 (3.5%) |
| $20,000 to $22,499 | 91 (4.5%) | 62 (3.5%) |
| $22,500 to $24,999 | 0 (0.0%) | 91 (5.1%) |
| $25,000 to $29,999 | 85 (4.2%) | 172 (9.7%) |
| $30,000 to $34,999 | 169 (8.4%) | 144 (8.1%) |
| $35,000 to $39,999 | 111 (5.5%) | 193 (10.9%) |
| $40,000 to $44,999 | 84 (4.2%) | 67 (3.8%) |
| $45,000 to $49,999 | 62 (3.1%) | 32 (1.8%) |
| $50,000 to $54,999 | 58 (2.9%) | 86 (4.9%) |
| $55,000 to $64,999 | 143 (7.1%) | 119 (6.7%) |
| $65,000 to $74,999 | 114 (5.7%) | 47 (2.7%) |
| $75,000 to $99,999 | 310 (15.4%) | 123 (7.0%) |
| $100,000+ | 379 (18.8%) | 77 (4.4%) |
| Total | 2,016 (100.0%) | 1,768 (100.0%) |
Earnings by Sex by Educational Attainment in Boise County
Average earnings in Boise County are $60,380 for men and $32,791 for women, a difference of 45.7%. Men with an educational attainment of graduate degree enjoy the highest average annual earnings of $137,639, while those with less than high school education earn the least with $19,688. Women with an educational attainment of graduate degree earn the most with the average annual earnings of $83,583, while those with less than high school education have the smallest earnings of $5,625.
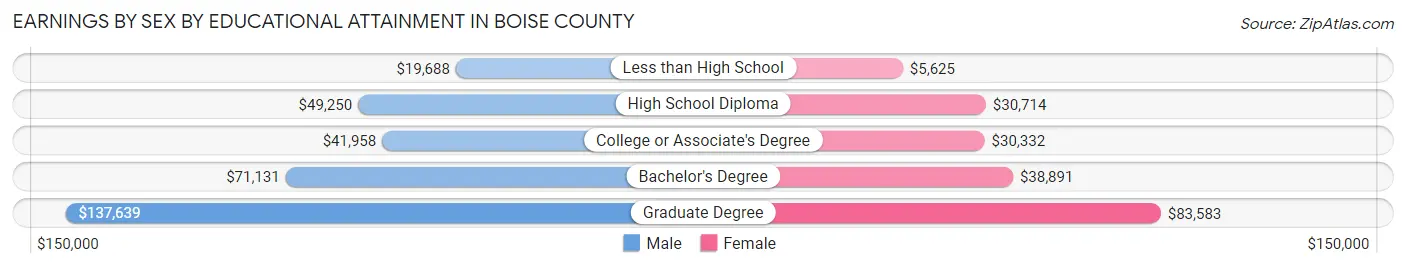
| Educational Attainment | Male Income | Female Income |
| Less than High School | $19,688 | $5,625 |
| High School Diploma | $49,250 | $30,714 |
| College or Associate's Degree | $41,958 | $30,332 |
| Bachelor's Degree | $71,131 | $38,891 |
| Graduate Degree | $137,639 | $83,583 |
| Total | $60,380 | $32,791 |
Family Income in Boise County
Family Income Brackets in Boise County
According to the Boise County family income data, there are 546 families falling into the $100,000 to $149,999 income range, which is the most common income bracket and makes up 23.8% of all families. Conversely, the $10,000 to $14,999 income bracket is the least frequent group with only 39 families (1.7%) belonging to this category.
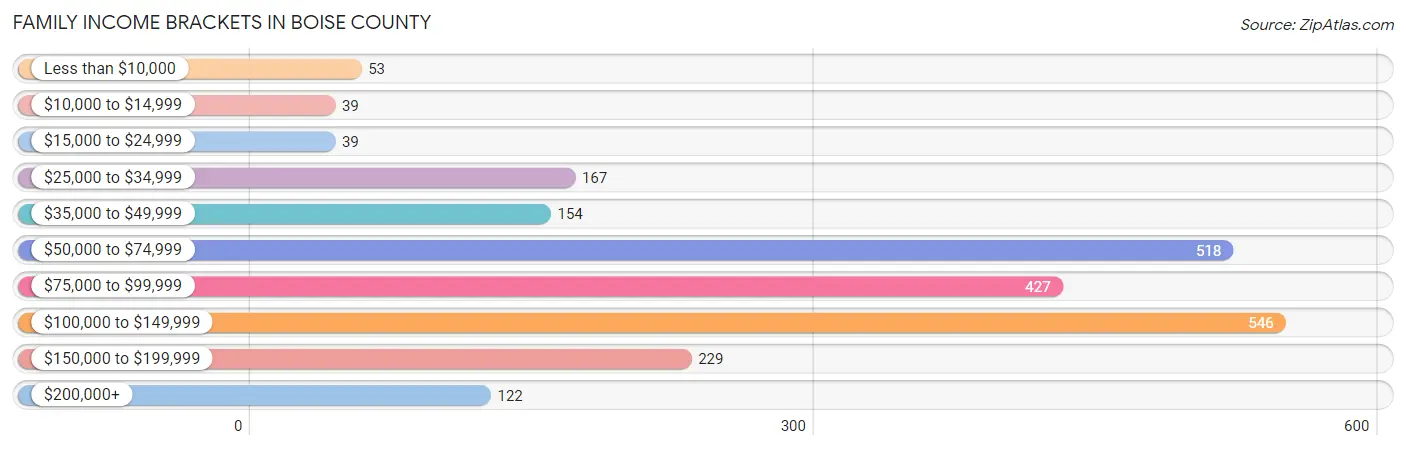
| Income Bracket | # Families | % Families |
| Less than $10,000 | 53 | 2.3% |
| $10,000 to $14,999 | 39 | 1.7% |
| $15,000 to $24,999 | 39 | 1.7% |
| $25,000 to $34,999 | 167 | 7.3% |
| $35,000 to $49,999 | 154 | 6.7% |
| $50,000 to $74,999 | 518 | 22.6% |
| $75,000 to $99,999 | 427 | 18.6% |
| $100,000 to $149,999 | 546 | 23.8% |
| $150,000 to $199,999 | 229 | 10.0% |
| $200,000+ | 122 | 5.3% |
Family Income by Famaliy Size in Boise County
6-person families (76 | 3.3%) account for the highest median family income in Boise County with $104,833 per family, while 2-person families (1,383 | 60.3%) have the highest median income of $37,038 per family member.
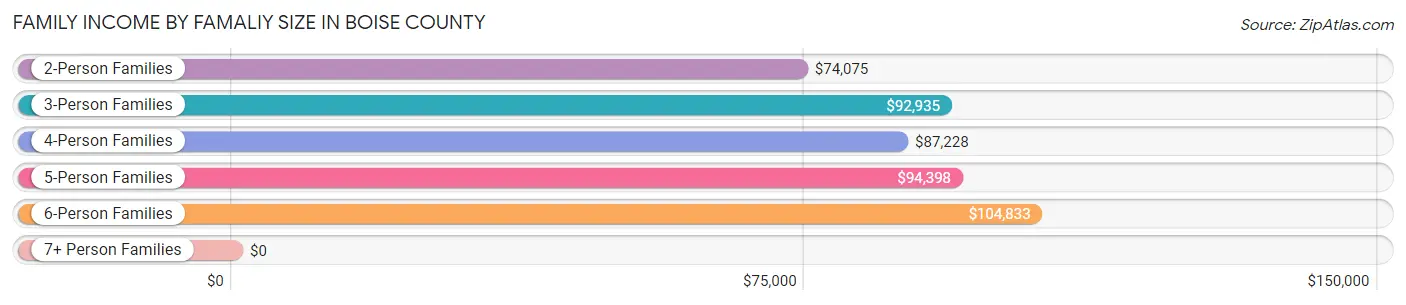
| Income Bracket | # Families | Median Income |
| 2-Person Families | 1,383 (60.3%) | $74,075 |
| 3-Person Families | 424 (18.5%) | $92,935 |
| 4-Person Families | 231 (10.1%) | $87,228 |
| 5-Person Families | 124 (5.4%) | $94,398 |
| 6-Person Families | 76 (3.3%) | $104,833 |
| 7+ Person Families | 56 (2.4%) | $0 |
| Total | 2,294 (100.0%) | $81,897 |
Family Income by Number of Earners in Boise County
The median family income in Boise County is $81,897, with families comprising 3+ earners (132) having the highest median family income of $123,750, while families with no earners (491) have the lowest median family income of $58,829, accounting for 5.8% and 21.4% of families, respectively.
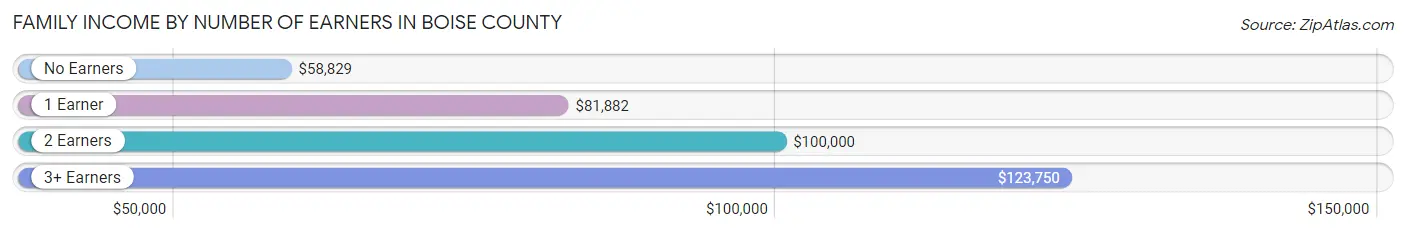
| Number of Earners | # Families | Median Income |
| No Earners | 491 (21.4%) | $58,829 |
| 1 Earner | 895 (39.0%) | $81,882 |
| 2 Earners | 776 (33.8%) | $100,000 |
| 3+ Earners | 132 (5.8%) | $123,750 |
| Total | 2,294 (100.0%) | $81,897 |
Household Income in Boise County
Household Income Brackets in Boise County
With 672 households falling in the category, the $50,000 to $74,999 income range is the most frequent in Boise County, accounting for 19.8% of all households. In contrast, only 71 households (2.1%) fall into the $10,000 to $14,999 income bracket, making it the least populous group.
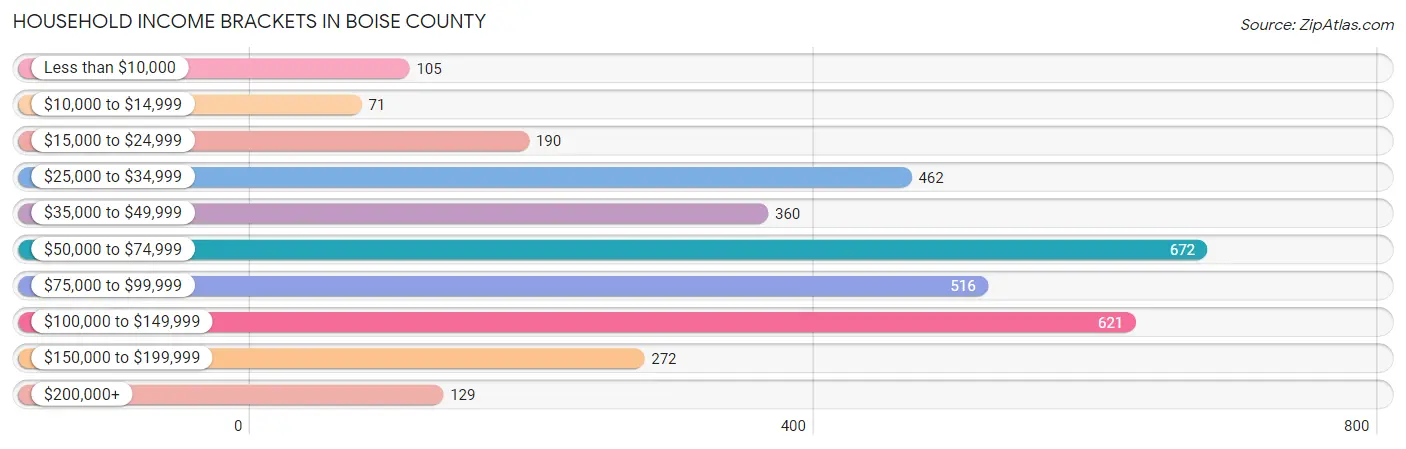
| Income Bracket | # Households | % Households |
| Less than $10,000 | 105 | 3.1% |
| $10,000 to $14,999 | 71 | 2.1% |
| $15,000 to $24,999 | 190 | 5.6% |
| $25,000 to $34,999 | 462 | 13.6% |
| $35,000 to $49,999 | 360 | 10.6% |
| $50,000 to $74,999 | 672 | 19.8% |
| $75,000 to $99,999 | 516 | 15.2% |
| $100,000 to $149,999 | 621 | 18.3% |
| $150,000 to $199,999 | 272 | 8.0% |
| $200,000+ | 129 | 3.8% |
Household Income by Householder Age in Boise County
The median household income in Boise County is $70,776, with the highest median household income of $95,033 found in the 45 to 64 years age bracket for the primary householder. A total of 1,377 households (40.6%) fall into this category. Meanwhile, the 15 to 24 years age bracket for the primary householder has the lowest median household income of $35,156, with 23 households (0.7%) in this group.
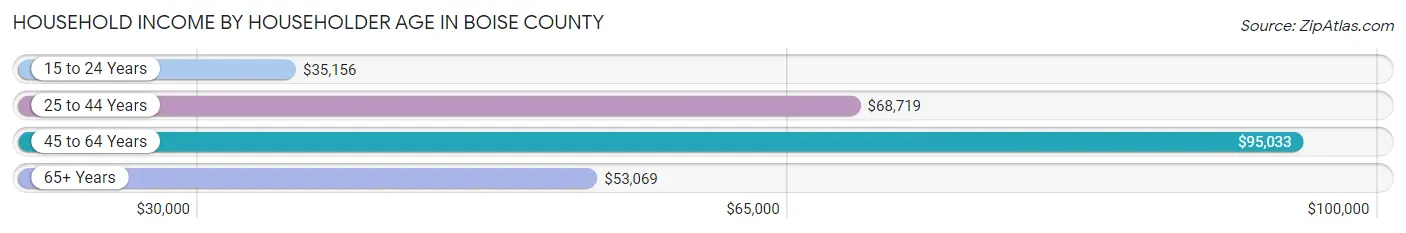
| Income Bracket | # Households | Median Income |
| 15 to 24 Years | 23 (0.7%) | $35,156 |
| 25 to 44 Years | 711 (20.9%) | $68,719 |
| 45 to 64 Years | 1,377 (40.6%) | $95,033 |
| 65+ Years | 1,285 (37.8%) | $53,069 |
| Total | 3,396 (100.0%) | $70,776 |
Poverty in Boise County
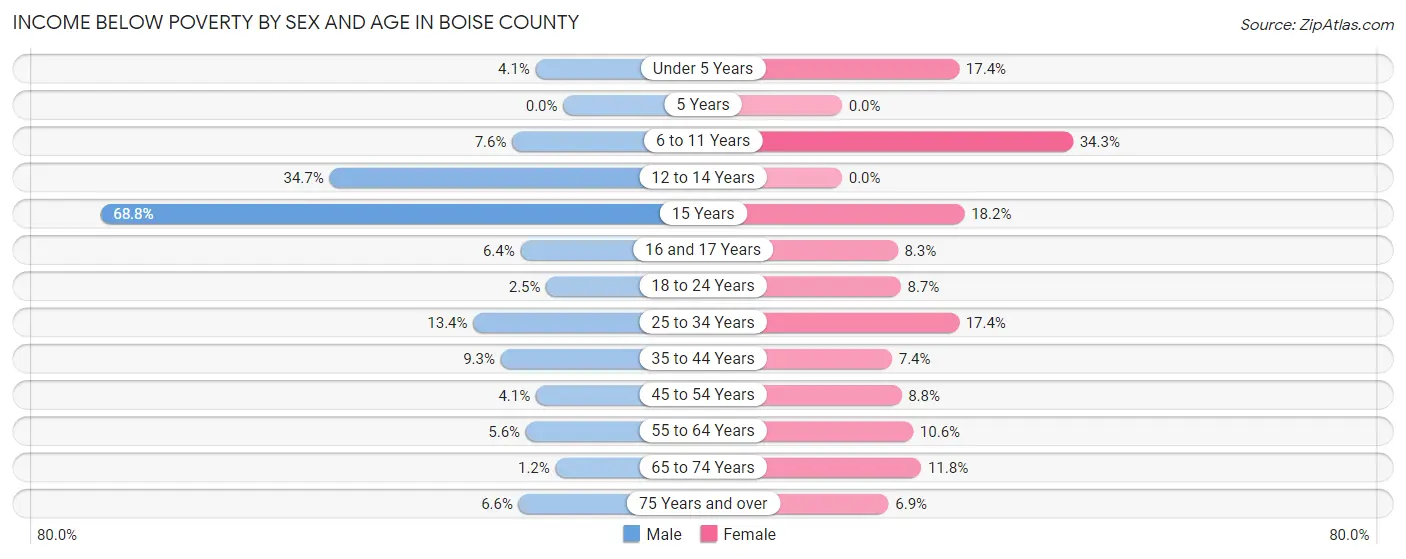
Income Below Poverty by Sex and Age in Boise County
With 7.1% poverty level for males and 11.7% for females among the residents of Boise County, 15 year old males and 6 to 11 year old females are the most vulnerable to poverty, with 22 males (68.8%) and 72 females (34.3%) in their respective age groups living below the poverty level.
| Age Bracket | Male | Female |
| Under 5 Years | 3 (4.1%) | 36 (17.4%) |
| 5 Years | 0 (0.0%) | 0 (0.0%) |
| 6 to 11 Years | 15 (7.6%) | 72 (34.3%) |
| 12 to 14 Years | 50 (34.7%) | 0 (0.0%) |
| 15 Years | 22 (68.8%) | 6 (18.2%) |
| 16 and 17 Years | 4 (6.4%) | 10 (8.3%) |
| 18 to 24 Years | 6 (2.5%) | 19 (8.7%) |
| 25 to 34 Years | 39 (13.4%) | 50 (17.4%) |
| 35 to 44 Years | 46 (9.3%) | 32 (7.4%) |
| 45 to 54 Years | 17 (4.1%) | 41 (8.8%) |
| 55 to 64 Years | 44 (5.6%) | 90 (10.6%) |
| 65 to 74 Years | 9 (1.1%) | 77 (11.8%) |
| 75 Years and over | 24 (6.6%) | 21 (6.9%) |
| Total | 279 (7.1%) | 454 (11.7%) |
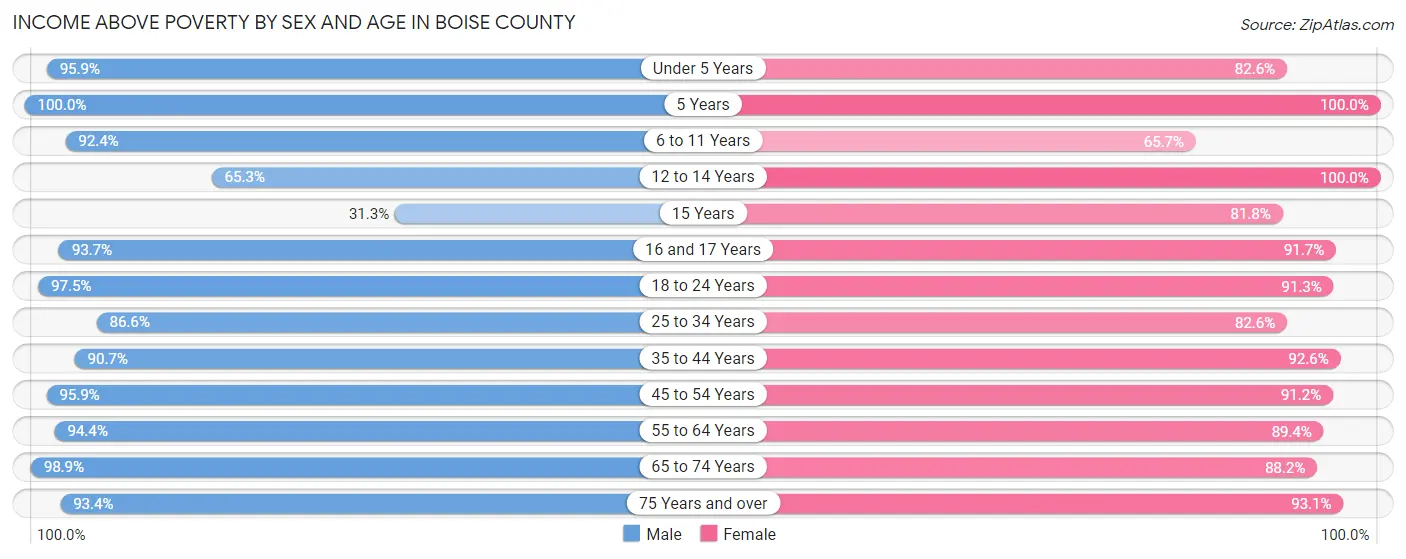
Income Above Poverty by Sex and Age in Boise County
According to the poverty statistics in Boise County, males aged 5 years and females aged 5 years are the age groups that are most secure financially, with 100.0% of males and 100.0% of females in these age groups living above the poverty line.
| Age Bracket | Male | Female |
| Under 5 Years | 70 (95.9%) | 171 (82.6%) |
| 5 Years | 18 (100.0%) | 60 (100.0%) |
| 6 to 11 Years | 183 (92.4%) | 138 (65.7%) |
| 12 to 14 Years | 94 (65.3%) | 47 (100.0%) |
| 15 Years | 10 (31.2%) | 27 (81.8%) |
| 16 and 17 Years | 59 (93.6%) | 111 (91.7%) |
| 18 to 24 Years | 232 (97.5%) | 199 (91.3%) |
| 25 to 34 Years | 253 (86.6%) | 238 (82.6%) |
| 35 to 44 Years | 449 (90.7%) | 399 (92.6%) |
| 45 to 54 Years | 402 (95.9%) | 424 (91.2%) |
| 55 to 64 Years | 747 (94.4%) | 762 (89.4%) |
| 65 to 74 Years | 772 (98.9%) | 578 (88.2%) |
| 75 Years and over | 339 (93.4%) | 283 (93.1%) |
| Total | 3,628 (92.9%) | 3,437 (88.3%) |
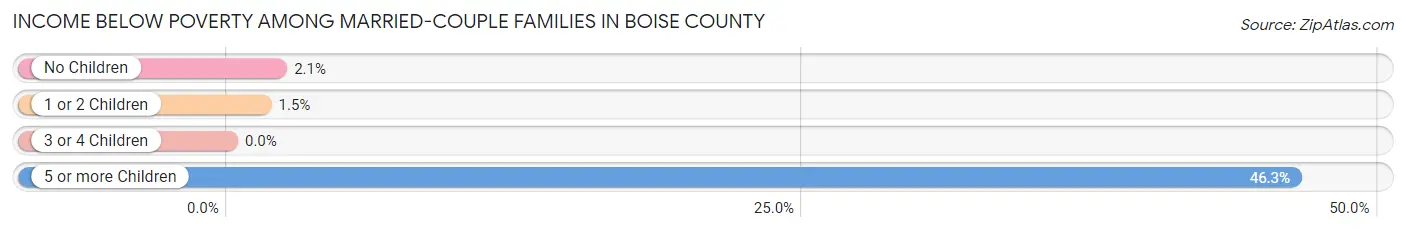
Income Below Poverty Among Married-Couple Families in Boise County
The poverty statistics for married-couple families in Boise County show that 3.1% or 63 of the total 2,041 families live below the poverty line. Families with 5 or more children have the highest poverty rate of 46.3%, comprising of 25 families. On the other hand, families with 3 or 4 children have the lowest poverty rate of 0.0%, which includes 0 families.
| Children | Above Poverty | Below Poverty |
| No Children | 1,417 (97.9%) | 31 (2.1%) |
| 1 or 2 Children | 471 (98.5%) | 7 (1.5%) |
| 3 or 4 Children | 61 (100.0%) | 0 (0.0%) |
| 5 or more Children | 29 (53.7%) | 25 (46.3%) |
| Total | 1,978 (96.9%) | 63 (3.1%) |
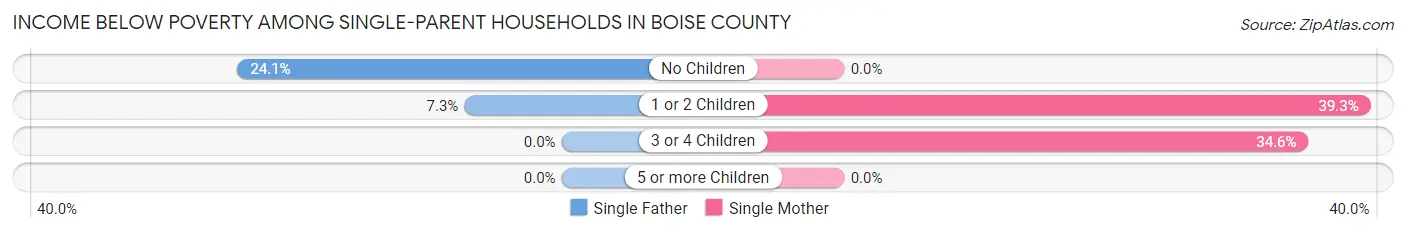
Income Below Poverty Among Single-Parent Households in Boise County
According to the poverty data in Boise County, 12.2% or 12 single-father households and 32.9% or 51 single-mother households are living below the poverty line. Among single-father households, those with no children have the highest poverty rate, with 7 households (24.1%) experiencing poverty. Likewise, among single-mother households, those with 1 or 2 children have the highest poverty rate, with 42 households (39.3%) falling below the poverty line.
| Children | Single Father | Single Mother |
| No Children | 7 (24.1%) | 0 (0.0%) |
| 1 or 2 Children | 5 (7.2%) | 42 (39.3%) |
| 3 or 4 Children | 0 (0.0%) | 9 (34.6%) |
| 5 or more Children | 0 (0.0%) | 0 (0.0%) |
| Total | 12 (12.2%) | 51 (32.9%) |
Income Below Poverty Among Married-Couple vs Single-Parent Households in Boise County
The poverty data for Boise County shows that 63 of the married-couple family households (3.1%) and 63 of the single-parent households (24.9%) are living below the poverty level. Within the married-couple family households, those with 5 or more children have the highest poverty rate, with 25 households (46.3%) falling below the poverty line. Among the single-parent households, those with 3 or 4 children have the highest poverty rate, with 9 household (34.6%) living below poverty.
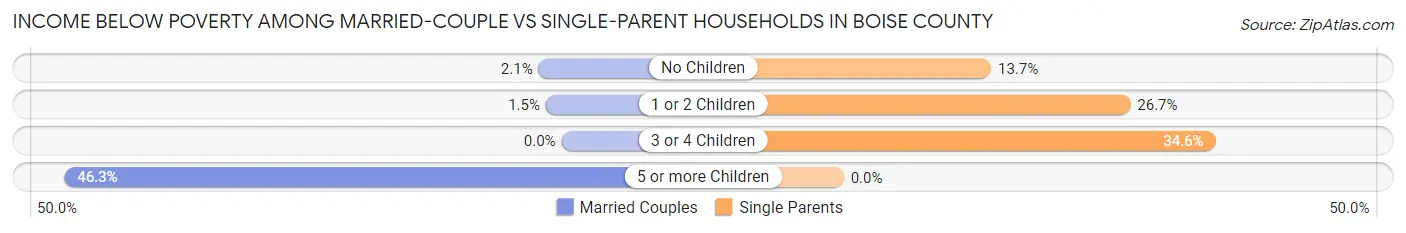
| Children | Married-Couple Families | Single-Parent Households |
| No Children | 31 (2.1%) | 7 (13.7%) |
| 1 or 2 Children | 7 (1.5%) | 47 (26.7%) |
| 3 or 4 Children | 0 (0.0%) | 9 (34.6%) |
| 5 or more Children | 25 (46.3%) | 0 (0.0%) |
| Total | 63 (3.1%) | 63 (24.9%) |
Employment Characteristics in Boise County
Employment by Class of Employer in Boise County
Among the 3,322 employed individuals in Boise County, private company employees (1,850 | 55.7%), self-employed (not incorporated) (356 | 10.7%), and local government employees (349 | 10.5%) make up the most common classes of employment.
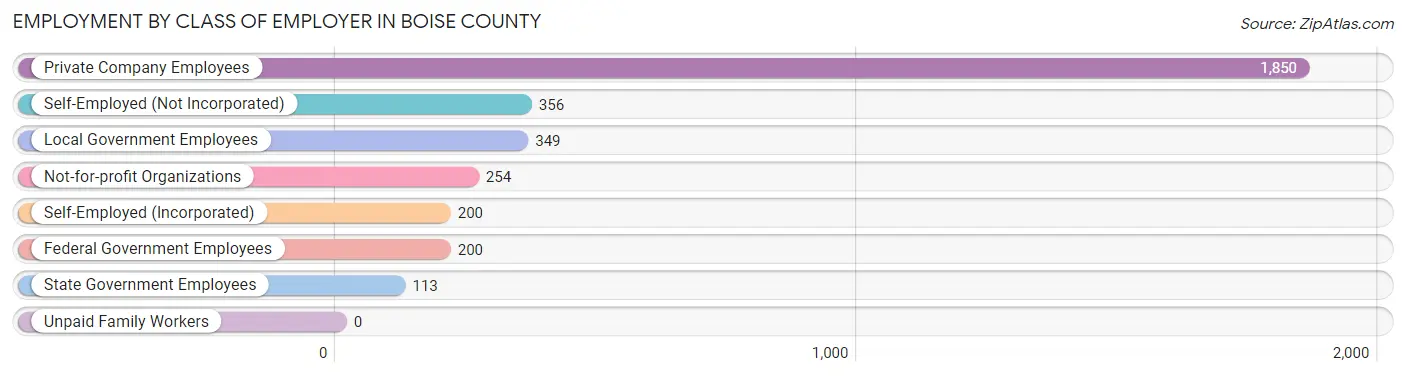
| Employer Class | # Employees | % Employees |
| Private Company Employees | 1,850 | 55.7% |
| Self-Employed (Incorporated) | 200 | 6.0% |
| Self-Employed (Not Incorporated) | 356 | 10.7% |
| Not-for-profit Organizations | 254 | 7.6% |
| Local Government Employees | 349 | 10.5% |
| State Government Employees | 113 | 3.4% |
| Federal Government Employees | 200 | 6.0% |
| Unpaid Family Workers | 0 | 0.0% |
| Total | 3,322 | 100.0% |
Employment Status by Age in Boise County
According to the labor force statistics for Boise County, out of the total population over 16 years of age (6,779), 52.1% or 3,532 individuals are in the labor force, with 3.4% or 120 of them unemployed. The age group with the highest labor force participation rate is 20 to 24 years, with 83.8% or 202 individuals in the labor force. Within the labor force, the 16 to 19 years age range has the highest percentage of unemployed individuals, with 13.4% or 18 of them being unemployed.
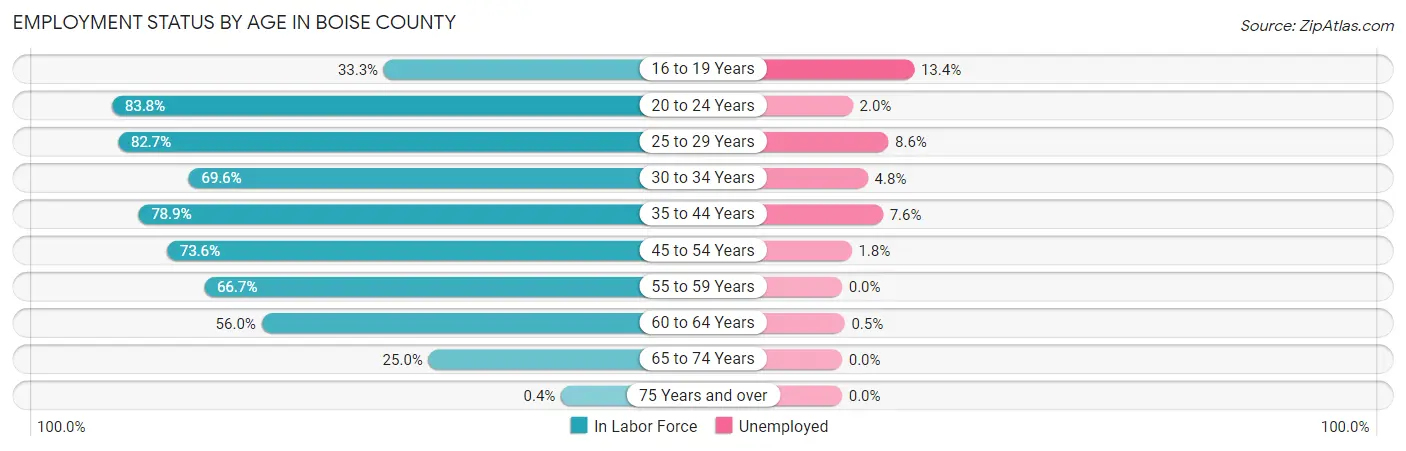
| Age Bracket | In Labor Force | Unemployed |
| 16 to 19 Years | 134 (33.3%) | 18 (13.4%) |
| 20 to 24 Years | 202 (83.8%) | 4 (2.0%) |
| 25 to 29 Years | 210 (82.7%) | 18 (8.6%) |
| 30 to 34 Years | 227 (69.6%) | 11 (4.8%) |
| 35 to 44 Years | 731 (78.9%) | 56 (7.6%) |
| 45 to 54 Years | 651 (73.6%) | 12 (1.8%) |
| 55 to 59 Years | 570 (66.7%) | 0 (0.0%) |
| 60 to 64 Years | 442 (56.0%) | 2 (0.5%) |
| 65 to 74 Years | 359 (25.0%) | 0 (0.0%) |
| 75 Years and over | 3 (0.4%) | 0 (0.0%) |
| Total | 3,532 (52.1%) | 120 (3.4%) |
Employment Status by Educational Attainment in Boise County
According to labor force statistics for Boise County, 70.2% of individuals (2,831) out of the total population between 25 and 64 years of age (4,033) are in the labor force, with 3.4% or 96 of them being unemployed. The group with the highest labor force participation rate are those with the educational attainment of bachelor's degree or higher, with 79.2% or 889 individuals in the labor force. Within the labor force, individuals with high school diploma education have the highest percentage of unemployment, with 9.9% or 76 of them being unemployed.
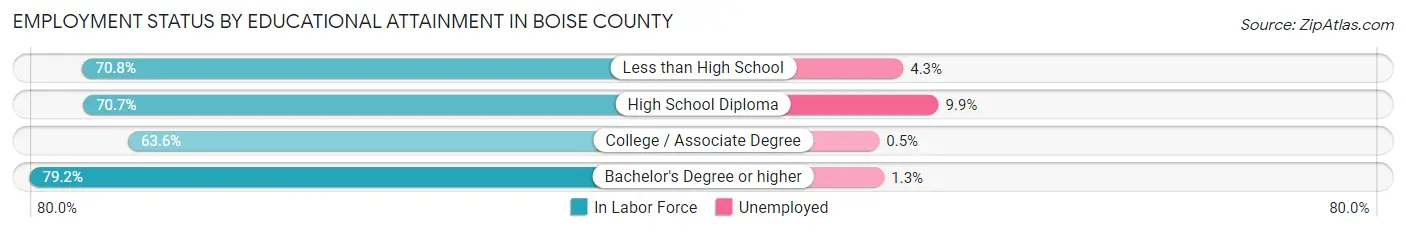
| Educational Attainment | In Labor Force | Unemployed |
| Less than High School | 138 (70.8%) | 8 (4.3%) |
| High School Diploma | 770 (70.7%) | 108 (9.9%) |
| College / Associate Degree | 1,034 (63.6%) | 8 (0.5%) |
| Bachelor's Degree or higher | 889 (79.2%) | 15 (1.3%) |
| Total | 2,831 (70.2%) | 137 (3.4%) |
Employment Occupations by Sex in Boise County
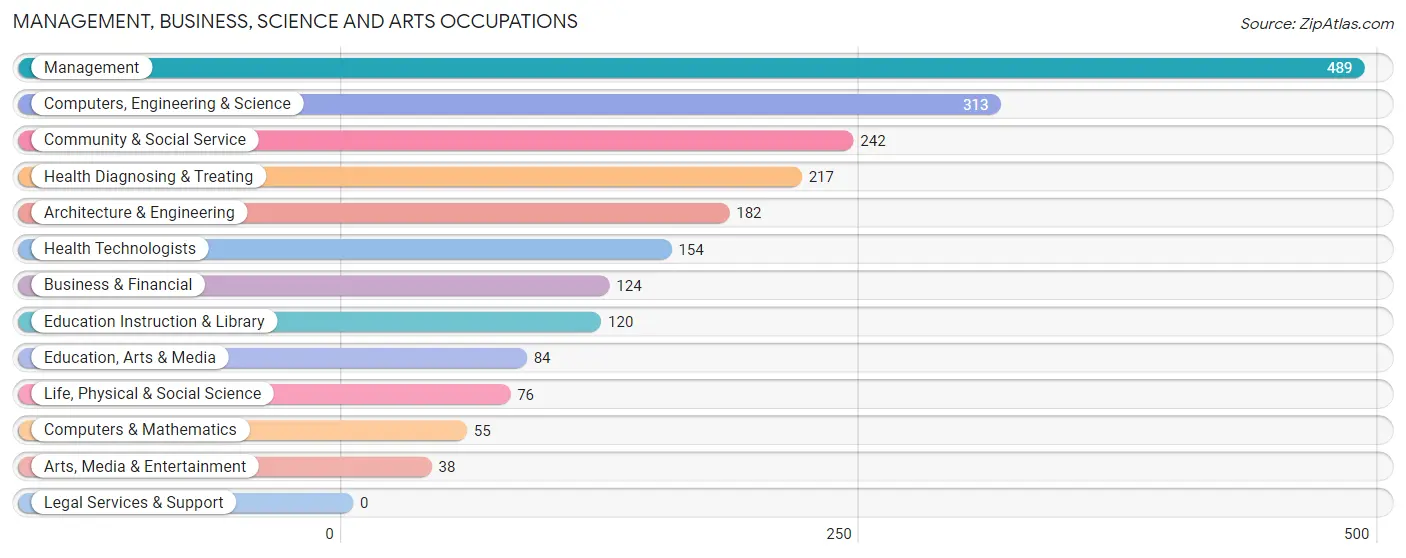
Management, Business, Science and Arts Occupations
The most common Management, Business, Science and Arts occupations in Boise County are Management (489 | 14.5%), Computers, Engineering & Science (313 | 9.3%), Community & Social Service (242 | 7.2%), Health Diagnosing & Treating (217 | 6.4%), and Architecture & Engineering (182 | 5.4%).
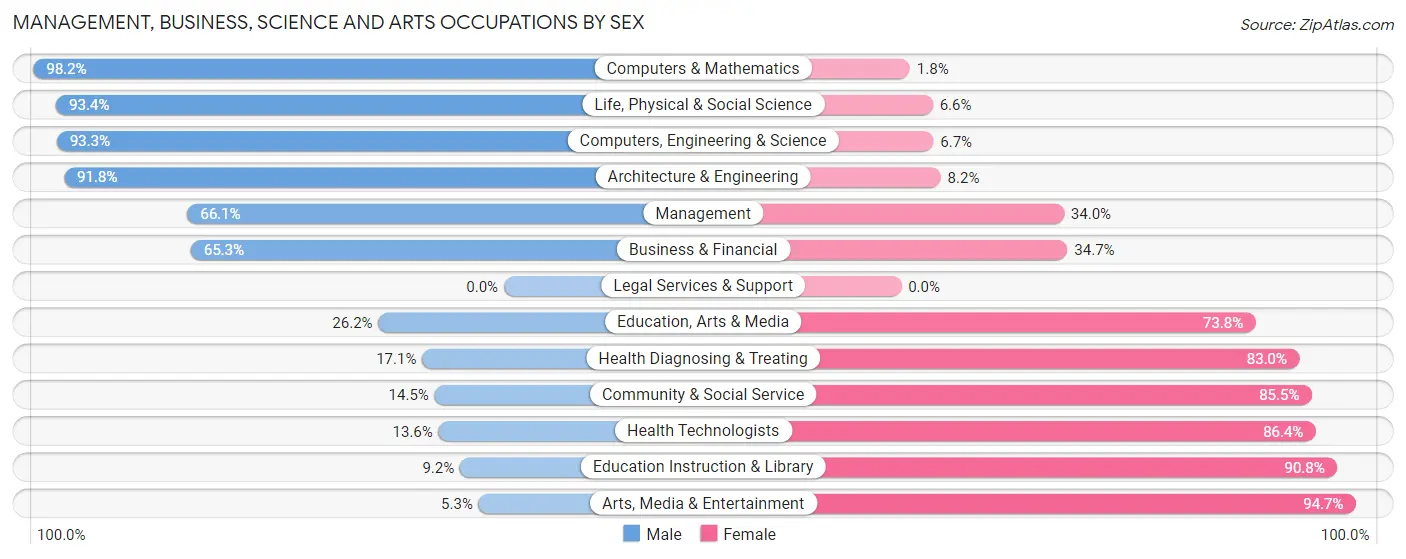
Management, Business, Science and Arts Occupations by Sex
Within the Management, Business, Science and Arts occupations in Boise County, the most male-oriented occupations are Computers & Mathematics (98.2%), Life, Physical & Social Science (93.4%), and Computers, Engineering & Science (93.3%), while the most female-oriented occupations are Arts, Media & Entertainment (94.7%), Education Instruction & Library (90.8%), and Health Technologists (86.4%).
| Occupation | Male | Female |
| Management | 323 (66.0%) | 166 (34.0%) |
| Business & Financial | 81 (65.3%) | 43 (34.7%) |
| Computers, Engineering & Science | 292 (93.3%) | 21 (6.7%) |
| Computers & Mathematics | 54 (98.2%) | 1 (1.8%) |
| Architecture & Engineering | 167 (91.8%) | 15 (8.2%) |
| Life, Physical & Social Science | 71 (93.4%) | 5 (6.6%) |
| Community & Social Service | 35 (14.5%) | 207 (85.5%) |
| Education, Arts & Media | 22 (26.2%) | 62 (73.8%) |
| Legal Services & Support | 0 (0.0%) | 0 (0.0%) |
| Education Instruction & Library | 11 (9.2%) | 109 (90.8%) |
| Arts, Media & Entertainment | 2 (5.3%) | 36 (94.7%) |
| Health Diagnosing & Treating | 37 (17.1%) | 180 (83.0%) |
| Health Technologists | 21 (13.6%) | 133 (86.4%) |
| Total (Category) | 768 (55.4%) | 617 (44.6%) |
| Total (Overall) | 1,744 (51.7%) | 1,631 (48.3%) |
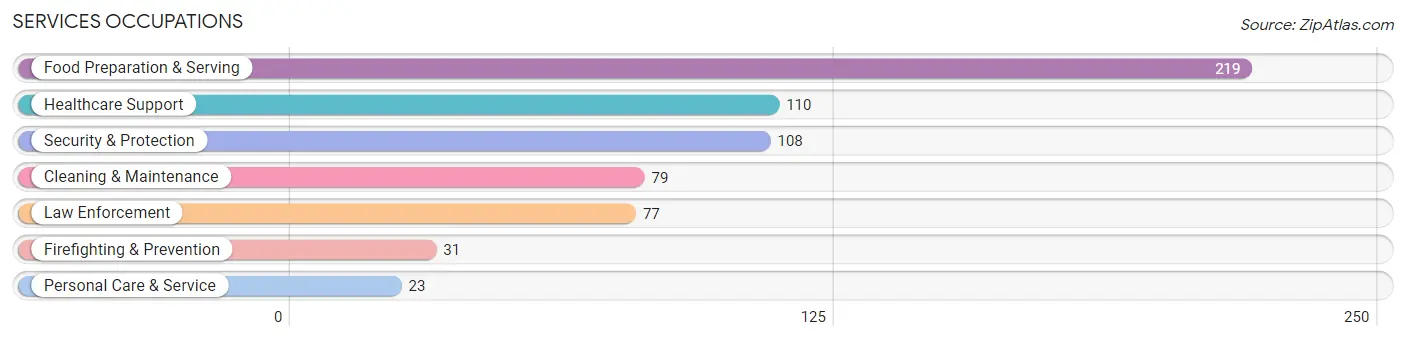
Services Occupations
The most common Services occupations in Boise County are Food Preparation & Serving (219 | 6.5%), Healthcare Support (110 | 3.3%), Security & Protection (108 | 3.2%), Cleaning & Maintenance (79 | 2.3%), and Law Enforcement (77 | 2.3%).
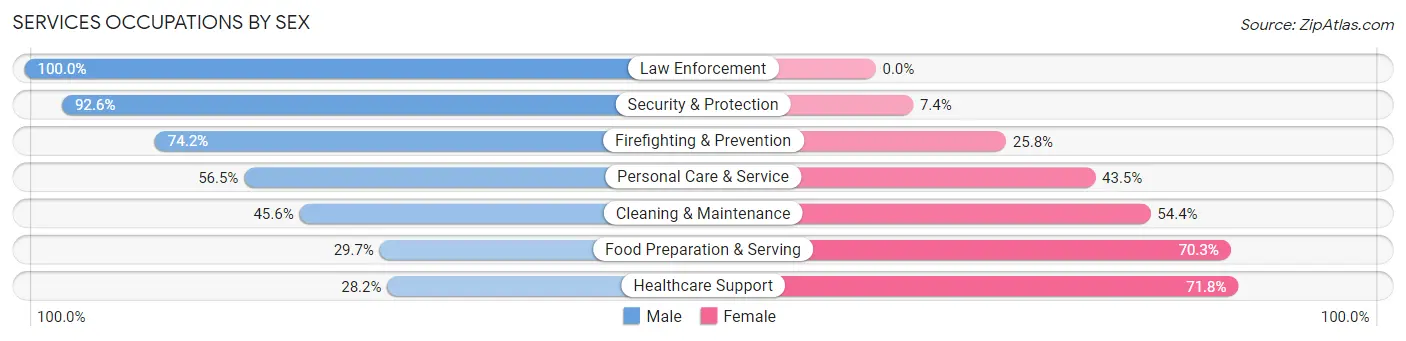
Services Occupations by Sex
Within the Services occupations in Boise County, the most male-oriented occupations are Law Enforcement (100.0%), Security & Protection (92.6%), and Firefighting & Prevention (74.2%), while the most female-oriented occupations are Healthcare Support (71.8%), Food Preparation & Serving (70.3%), and Cleaning & Maintenance (54.4%).
| Occupation | Male | Female |
| Healthcare Support | 31 (28.2%) | 79 (71.8%) |
| Security & Protection | 100 (92.6%) | 8 (7.4%) |
| Firefighting & Prevention | 23 (74.2%) | 8 (25.8%) |
| Law Enforcement | 77 (100.0%) | 0 (0.0%) |
| Food Preparation & Serving | 65 (29.7%) | 154 (70.3%) |
| Cleaning & Maintenance | 36 (45.6%) | 43 (54.4%) |
| Personal Care & Service | 13 (56.5%) | 10 (43.5%) |
| Total (Category) | 245 (45.5%) | 294 (54.5%) |
| Total (Overall) | 1,744 (51.7%) | 1,631 (48.3%) |
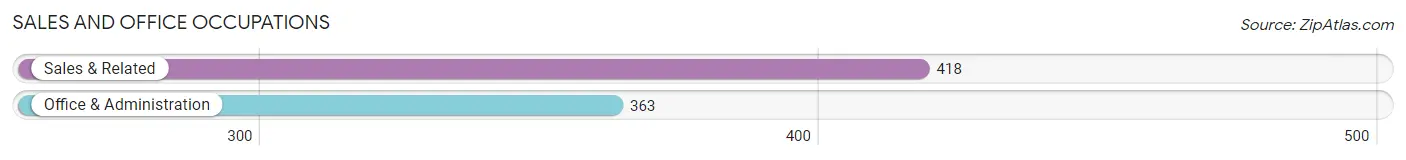
Sales and Office Occupations
The most common Sales and Office occupations in Boise County are Sales & Related (418 | 12.4%), and Office & Administration (363 | 10.8%).
Sales and Office Occupations by Sex
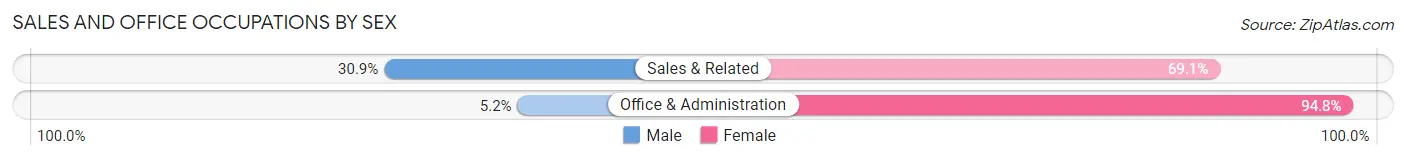
| Occupation | Male | Female |
| Sales & Related | 129 (30.9%) | 289 (69.1%) |
| Office & Administration | 19 (5.2%) | 344 (94.8%) |
| Total (Category) | 148 (19.0%) | 633 (81.0%) |
| Total (Overall) | 1,744 (51.7%) | 1,631 (48.3%) |
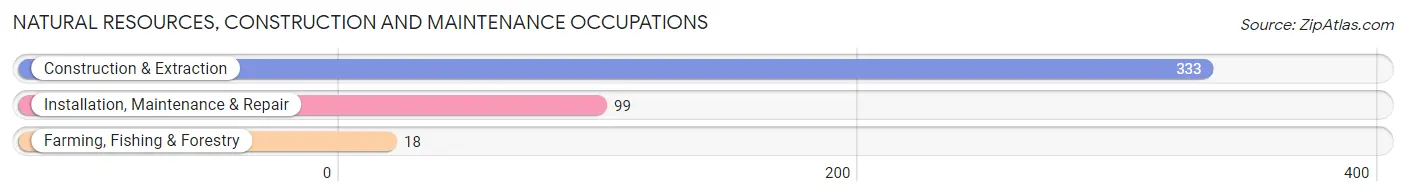
Natural Resources, Construction and Maintenance Occupations
The most common Natural Resources, Construction and Maintenance occupations in Boise County are Construction & Extraction (333 | 9.9%), Installation, Maintenance & Repair (99 | 2.9%), and Farming, Fishing & Forestry (18 | 0.5%).
Natural Resources, Construction and Maintenance Occupations by Sex
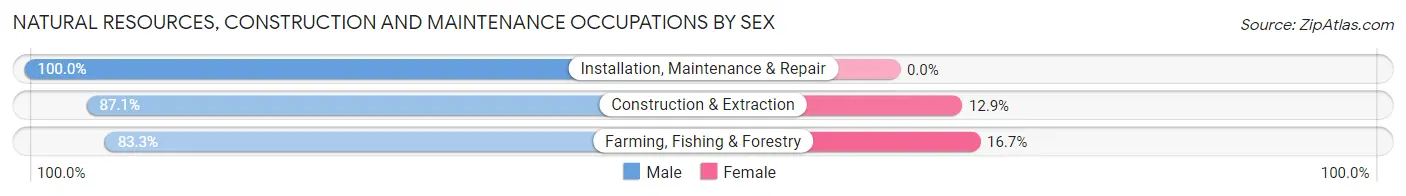
| Occupation | Male | Female |
| Farming, Fishing & Forestry | 15 (83.3%) | 3 (16.7%) |
| Construction & Extraction | 290 (87.1%) | 43 (12.9%) |
| Installation, Maintenance & Repair | 99 (100.0%) | 0 (0.0%) |
| Total (Category) | 404 (89.8%) | 46 (10.2%) |
| Total (Overall) | 1,744 (51.7%) | 1,631 (48.3%) |
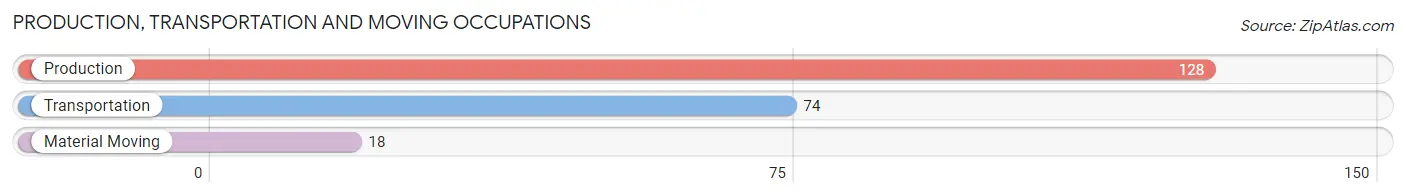
Production, Transportation and Moving Occupations
The most common Production, Transportation and Moving occupations in Boise County are Production (128 | 3.8%), Transportation (74 | 2.2%), and Material Moving (18 | 0.5%).
Production, Transportation and Moving Occupations by Sex
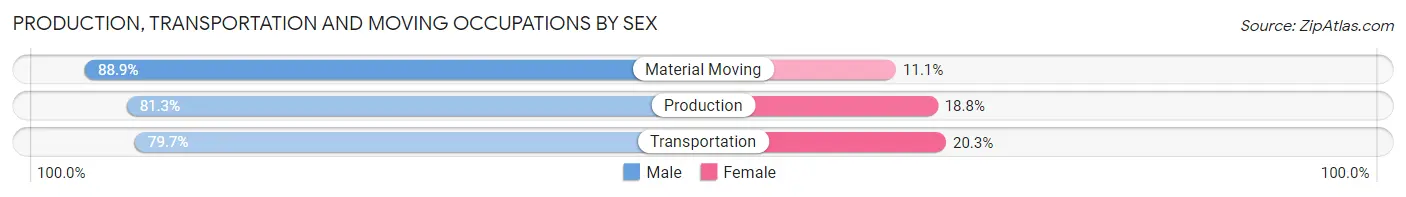
| Occupation | Male | Female |
| Production | 104 (81.2%) | 24 (18.8%) |
| Transportation | 59 (79.7%) | 15 (20.3%) |
| Material Moving | 16 (88.9%) | 2 (11.1%) |
| Total (Category) | 179 (81.4%) | 41 (18.6%) |
| Total (Overall) | 1,744 (51.7%) | 1,631 (48.3%) |
Employment Industries by Sex in Boise County
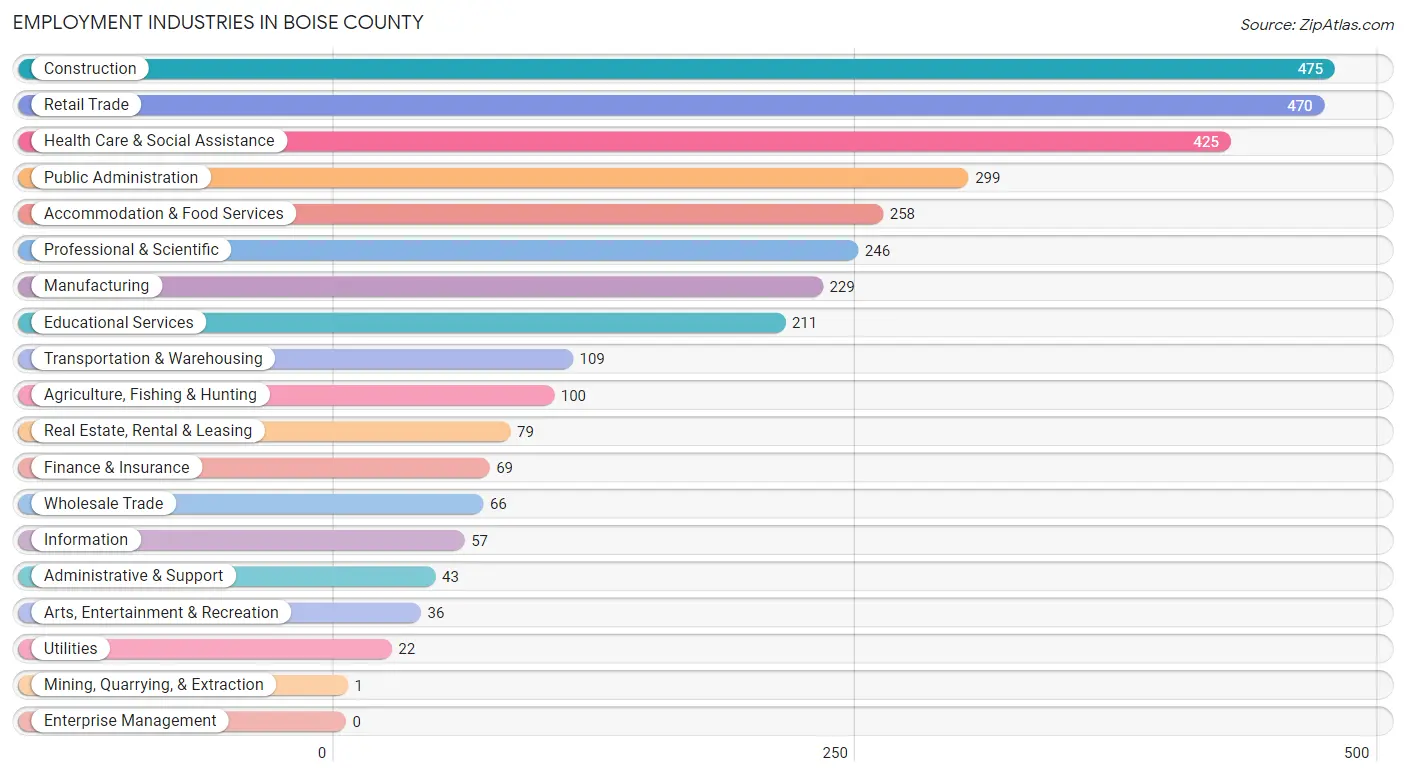
Employment Industries in Boise County
The major employment industries in Boise County include Construction (475 | 14.1%), Retail Trade (470 | 13.9%), Health Care & Social Assistance (425 | 12.6%), Public Administration (299 | 8.9%), and Accommodation & Food Services (258 | 7.6%).
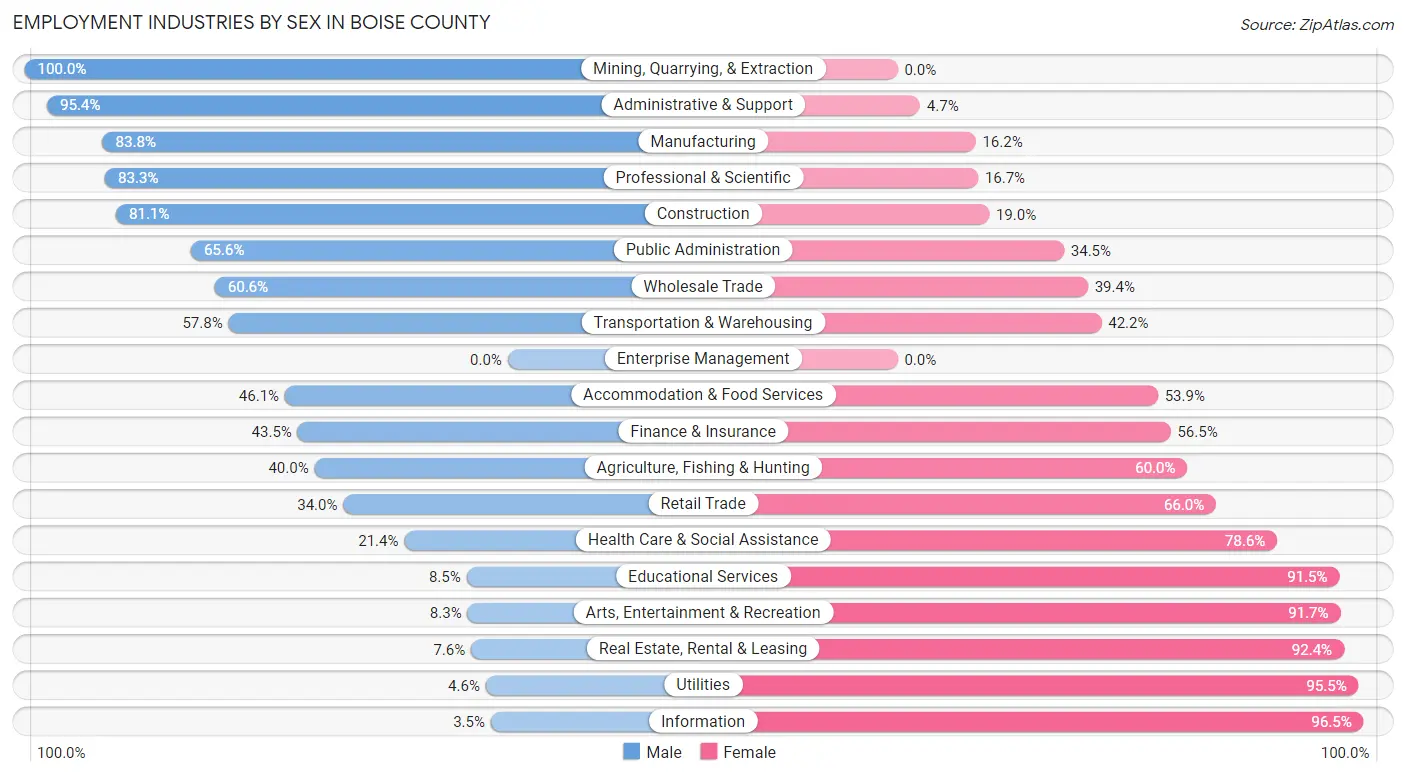
Employment Industries by Sex in Boise County
The Boise County industries that see more men than women are Mining, Quarrying, & Extraction (100.0%), Administrative & Support (95.4%), and Manufacturing (83.8%), whereas the industries that tend to have a higher number of women are Information (96.5%), Utilities (95.5%), and Real Estate, Rental & Leasing (92.4%).
| Industry | Male | Female |
| Agriculture, Fishing & Hunting | 40 (40.0%) | 60 (60.0%) |
| Mining, Quarrying, & Extraction | 1 (100.0%) | 0 (0.0%) |
| Construction | 385 (81.0%) | 90 (19.0%) |
| Manufacturing | 192 (83.8%) | 37 (16.2%) |
| Wholesale Trade | 40 (60.6%) | 26 (39.4%) |
| Retail Trade | 160 (34.0%) | 310 (66.0%) |
| Transportation & Warehousing | 63 (57.8%) | 46 (42.2%) |
| Utilities | 1 (4.5%) | 21 (95.5%) |
| Information | 2 (3.5%) | 55 (96.5%) |
| Finance & Insurance | 30 (43.5%) | 39 (56.5%) |
| Real Estate, Rental & Leasing | 6 (7.6%) | 73 (92.4%) |
| Professional & Scientific | 205 (83.3%) | 41 (16.7%) |
| Enterprise Management | 0 (0.0%) | 0 (0.0%) |
| Administrative & Support | 41 (95.4%) | 2 (4.6%) |
| Educational Services | 18 (8.5%) | 193 (91.5%) |
| Health Care & Social Assistance | 91 (21.4%) | 334 (78.6%) |
| Arts, Entertainment & Recreation | 3 (8.3%) | 33 (91.7%) |
| Accommodation & Food Services | 119 (46.1%) | 139 (53.9%) |
| Public Administration | 196 (65.5%) | 103 (34.4%) |
| Total | 1,744 (51.7%) | 1,631 (48.3%) |
Education in Boise County
School Enrollment in Boise County
The most common levels of schooling among the 1,122 students in Boise County are high school (305 | 27.2%), middle school (260 | 23.2%), and elementary school (237 | 21.1%).
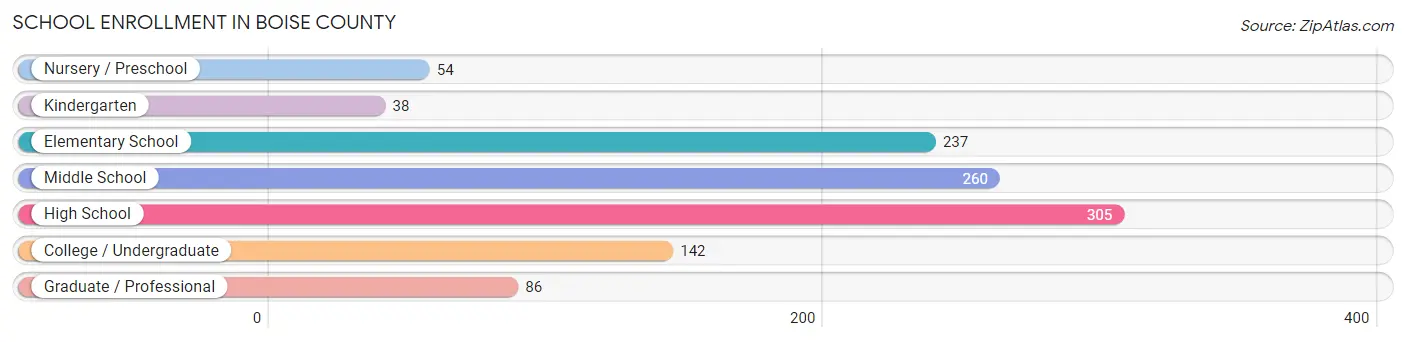
| School Level | # Students | % Students |
| Nursery / Preschool | 54 | 4.8% |
| Kindergarten | 38 | 3.4% |
| Elementary School | 237 | 21.1% |
| Middle School | 260 | 23.2% |
| High School | 305 | 27.2% |
| College / Undergraduate | 142 | 12.7% |
| Graduate / Professional | 86 | 7.7% |
| Total | 1,122 | 100.0% |
School Enrollment by Age by Funding Source in Boise County
Out of a total of 1,122 students who are enrolled in schools in Boise County, 242 (21.6%) attend a private institution, while the remaining 880 (78.4%) are enrolled in public schools. The age group of 18 to 19 year olds has the highest likelihood of being enrolled in private schools, with 43 (64.2% in the age bracket) enrolled. Conversely, the age group of 3 to 4 year olds has the lowest likelihood of being enrolled in a private school, with 24 (100.0% in the age bracket) attending a public institution.
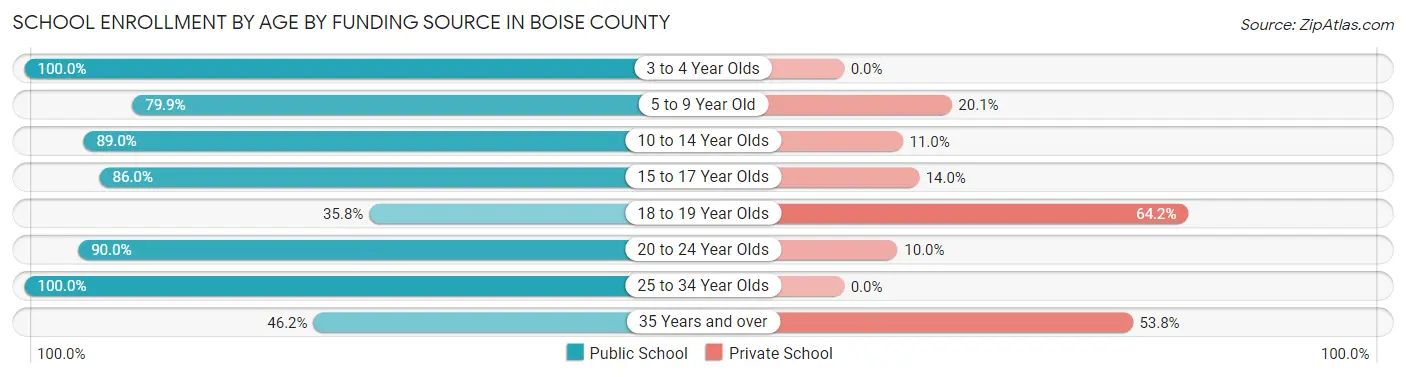
| Age Bracket | Public School | Private School |
| 3 to 4 Year Olds | 24 (100.0%) | 0 (0.0%) |
| 5 to 9 Year Old | 223 (79.9%) | 56 (20.1%) |
| 10 to 14 Year Olds | 284 (89.0%) | 35 (11.0%) |
| 15 to 17 Year Olds | 197 (86.0%) | 32 (14.0%) |
| 18 to 19 Year Olds | 24 (35.8%) | 43 (64.2%) |
| 20 to 24 Year Olds | 45 (90.0%) | 5 (10.0%) |
| 25 to 34 Year Olds | 22 (100.0%) | 0 (0.0%) |
| 35 Years and over | 61 (46.2%) | 71 (53.8%) |
| Total | 880 (78.4%) | 242 (21.6%) |
Educational Attainment by Field of Study in Boise County
Bio, nature & agricultural (257 | 14.6%), education (244 | 13.9%), business (202 | 11.5%), arts & humanities (197 | 11.2%), and science & technology (164 | 9.3%) are the most common fields of study among 1,758 individuals in Boise County who have obtained a bachelor's degree or higher.
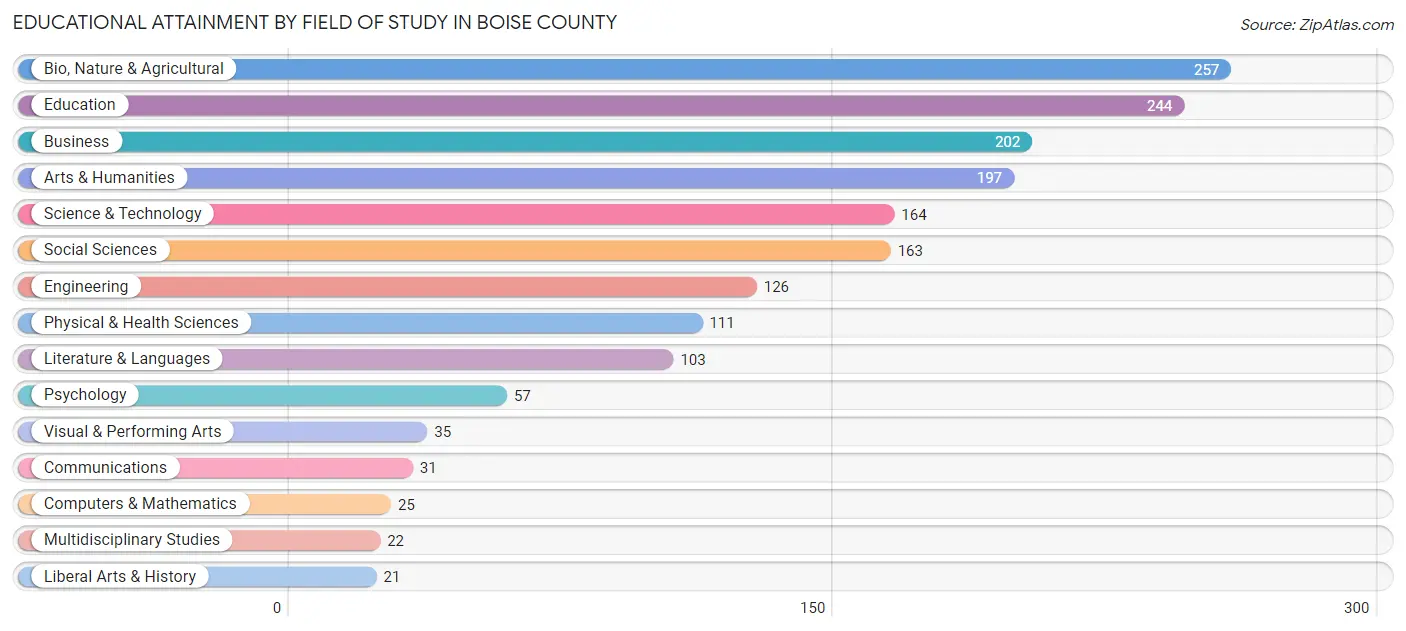
| Field of Study | # Graduates | % Graduates |
| Computers & Mathematics | 25 | 1.4% |
| Bio, Nature & Agricultural | 257 | 14.6% |
| Physical & Health Sciences | 111 | 6.3% |
| Psychology | 57 | 3.2% |
| Social Sciences | 163 | 9.3% |
| Engineering | 126 | 7.2% |
| Multidisciplinary Studies | 22 | 1.3% |
| Science & Technology | 164 | 9.3% |
| Business | 202 | 11.5% |
| Education | 244 | 13.9% |
| Literature & Languages | 103 | 5.9% |
| Liberal Arts & History | 21 | 1.2% |
| Visual & Performing Arts | 35 | 2.0% |
| Communications | 31 | 1.8% |
| Arts & Humanities | 197 | 11.2% |
| Total | 1,758 | 100.0% |
Transportation & Commute in Boise County
Vehicle Availability by Sex in Boise County
The most prevalent vehicle ownership categories in Boise County are males with 2 vehicles (593, accounting for 34.7%) and females with 2 vehicles (494, making up 37.9%).
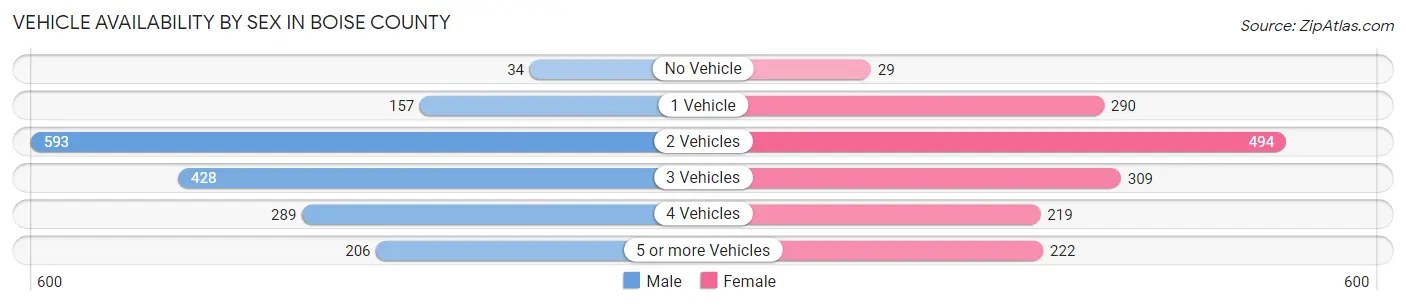
| Vehicles Available | Male | Female |
| No Vehicle | 34 (2.0%) | 29 (1.9%) |
| 1 Vehicle | 157 (9.2%) | 290 (18.5%) |
| 2 Vehicles | 593 (34.7%) | 494 (31.6%) |
| 3 Vehicles | 428 (25.1%) | 309 (19.8%) |
| 4 Vehicles | 289 (16.9%) | 219 (14.0%) |
| 5 or more Vehicles | 206 (12.1%) | 222 (14.2%) |
| Total | 1,707 (100.0%) | 1,563 (100.0%) |
Commute Time in Boise County
The most frequently occuring commute durations in Boise County are 45 to 59 minutes (548 commuters, 19.3%), 60 to 89 minutes (399 commuters, 14.1%), and less than 5 minutes (295 commuters, 10.4%).
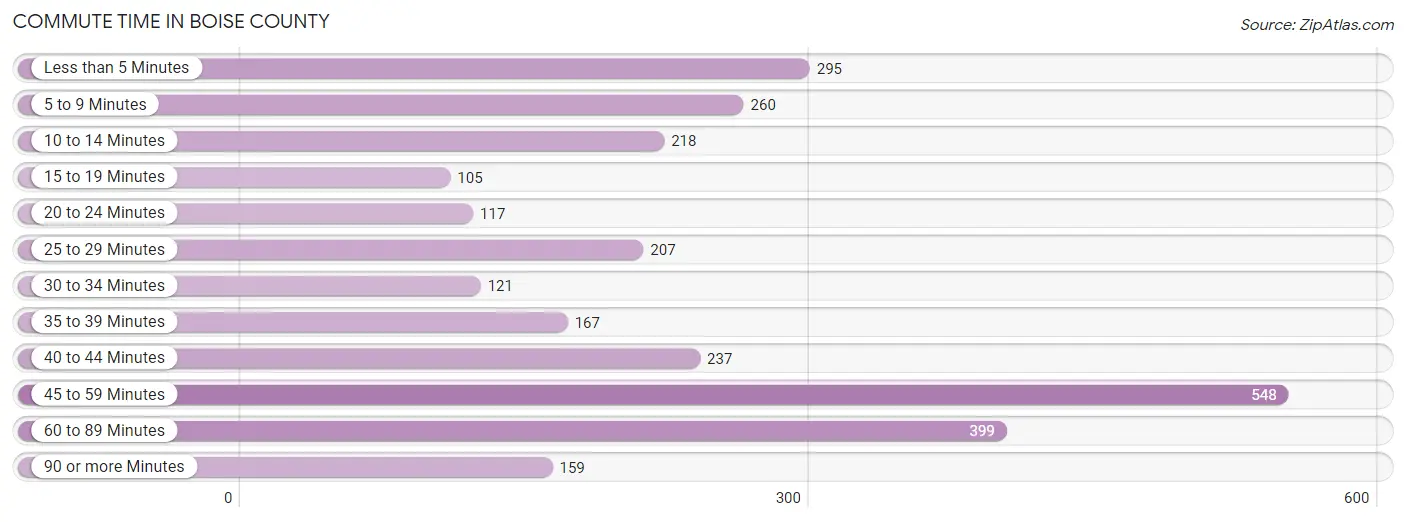
| Commute Time | # Commuters | % Commuters |
| Less than 5 Minutes | 295 | 10.4% |
| 5 to 9 Minutes | 260 | 9.2% |
| 10 to 14 Minutes | 218 | 7.7% |
| 15 to 19 Minutes | 105 | 3.7% |
| 20 to 24 Minutes | 117 | 4.1% |
| 25 to 29 Minutes | 207 | 7.3% |
| 30 to 34 Minutes | 121 | 4.3% |
| 35 to 39 Minutes | 167 | 5.9% |
| 40 to 44 Minutes | 237 | 8.4% |
| 45 to 59 Minutes | 548 | 19.3% |
| 60 to 89 Minutes | 399 | 14.1% |
| 90 or more Minutes | 159 | 5.6% |
Commute Time by Sex in Boise County
The most common commute times in Boise County are 45 to 59 minutes (291 commuters, 18.9%) for males and 45 to 59 minutes (257 commuters, 19.8%) for females.
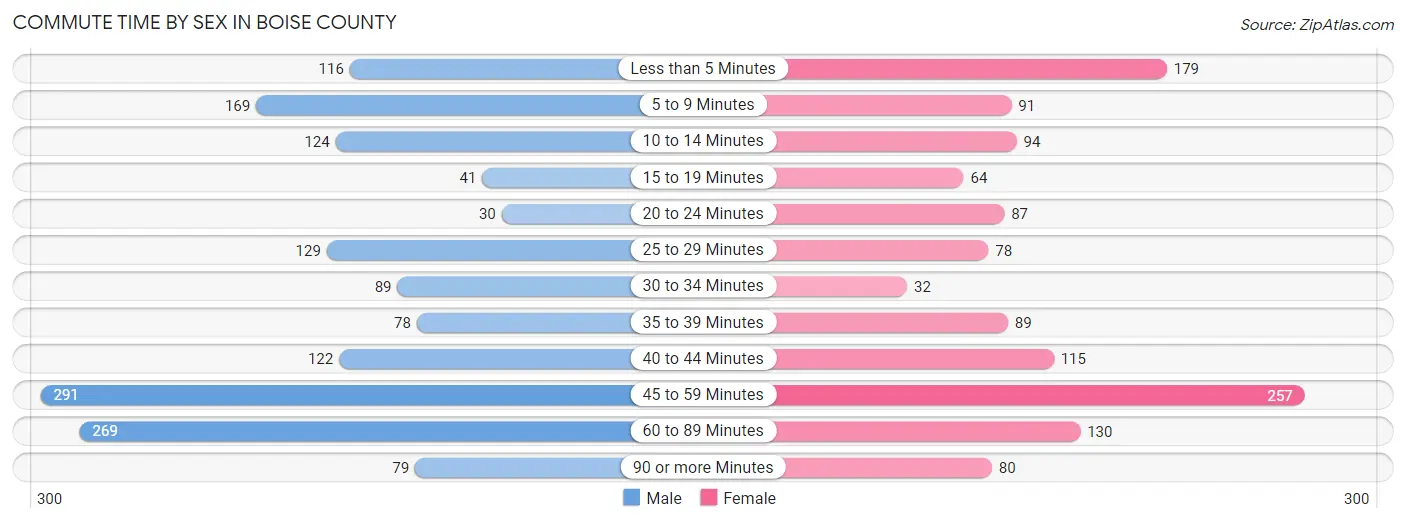
| Commute Time | Male | Female |
| Less than 5 Minutes | 116 (7.5%) | 179 (13.8%) |
| 5 to 9 Minutes | 169 (11.0%) | 91 (7.0%) |
| 10 to 14 Minutes | 124 (8.1%) | 94 (7.2%) |
| 15 to 19 Minutes | 41 (2.7%) | 64 (4.9%) |
| 20 to 24 Minutes | 30 (1.9%) | 87 (6.7%) |
| 25 to 29 Minutes | 129 (8.4%) | 78 (6.0%) |
| 30 to 34 Minutes | 89 (5.8%) | 32 (2.5%) |
| 35 to 39 Minutes | 78 (5.1%) | 89 (6.9%) |
| 40 to 44 Minutes | 122 (7.9%) | 115 (8.9%) |
| 45 to 59 Minutes | 291 (18.9%) | 257 (19.8%) |
| 60 to 89 Minutes | 269 (17.5%) | 130 (10.0%) |
| 90 or more Minutes | 79 (5.1%) | 80 (6.2%) |
Time of Departure to Work by Sex in Boise County
The most frequent times of departure to work in Boise County are 6:00 AM to 6:29 AM (283, 18.4%) for males and 7:30 AM to 7:59 AM (256, 19.8%) for females.
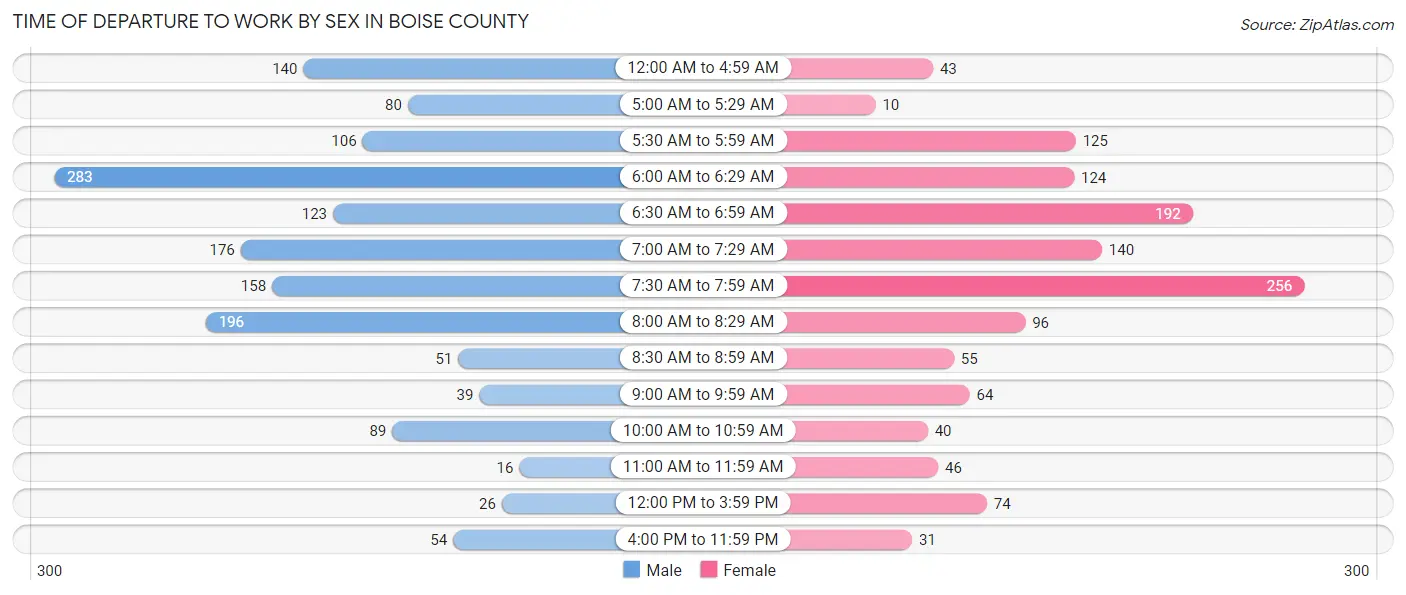
| Time of Departure | Male | Female |
| 12:00 AM to 4:59 AM | 140 (9.1%) | 43 (3.3%) |
| 5:00 AM to 5:29 AM | 80 (5.2%) | 10 (0.8%) |
| 5:30 AM to 5:59 AM | 106 (6.9%) | 125 (9.7%) |
| 6:00 AM to 6:29 AM | 283 (18.4%) | 124 (9.6%) |
| 6:30 AM to 6:59 AM | 123 (8.0%) | 192 (14.8%) |
| 7:00 AM to 7:29 AM | 176 (11.5%) | 140 (10.8%) |
| 7:30 AM to 7:59 AM | 158 (10.3%) | 256 (19.8%) |
| 8:00 AM to 8:29 AM | 196 (12.8%) | 96 (7.4%) |
| 8:30 AM to 8:59 AM | 51 (3.3%) | 55 (4.2%) |
| 9:00 AM to 9:59 AM | 39 (2.5%) | 64 (4.9%) |
| 10:00 AM to 10:59 AM | 89 (5.8%) | 40 (3.1%) |
| 11:00 AM to 11:59 AM | 16 (1.0%) | 46 (3.5%) |
| 12:00 PM to 3:59 PM | 26 (1.7%) | 74 (5.7%) |
| 4:00 PM to 11:59 PM | 54 (3.5%) | 31 (2.4%) |
| Total | 1,537 (100.0%) | 1,296 (100.0%) |
Housing Occupancy in Boise County
Occupancy by Ownership in Boise County
Of the total 3,396 dwellings in Boise County, owner-occupied units account for 2,922 (86.0%), while renter-occupied units make up 474 (14.0%).
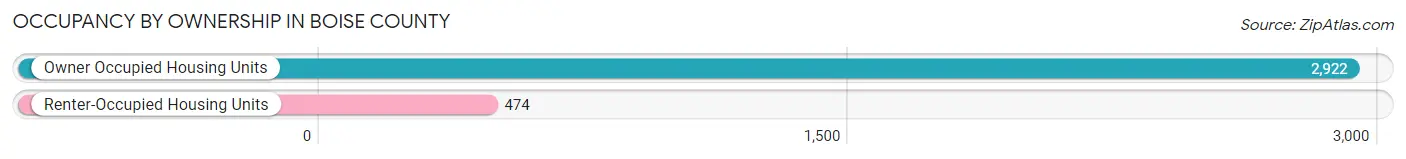
| Occupancy | # Housing Units | % Housing Units |
| Owner Occupied Housing Units | 2,922 | 86.0% |
| Renter-Occupied Housing Units | 474 | 14.0% |
| Total Occupied Housing Units | 3,396 | 100.0% |
Occupancy by Household Size in Boise County
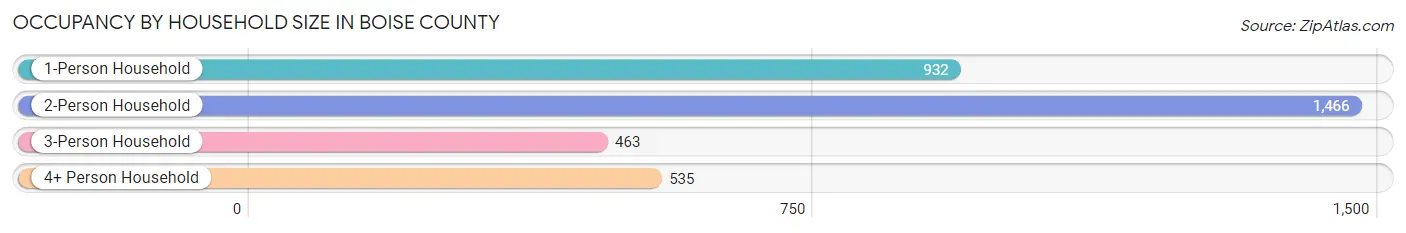
| Household Size | # Housing Units | % Housing Units |
| 1-Person Household | 932 | 27.4% |
| 2-Person Household | 1,466 | 43.2% |
| 3-Person Household | 463 | 13.6% |
| 4+ Person Household | 535 | 15.8% |
| Total Housing Units | 3,396 | 100.0% |
Occupancy by Ownership by Household Size in Boise County
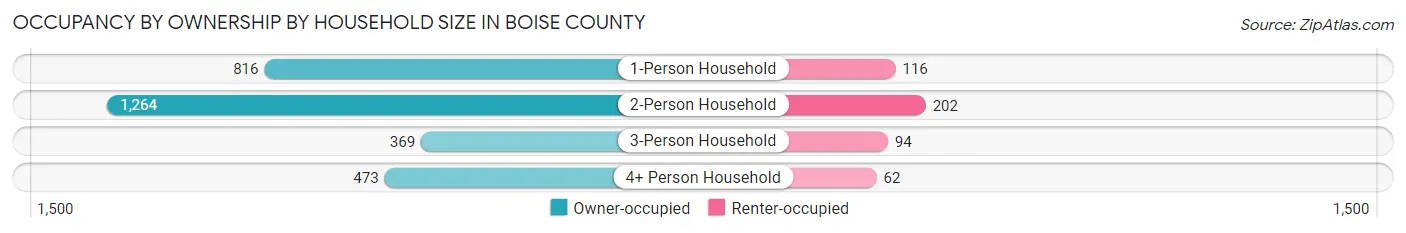
| Household Size | Owner-occupied | Renter-occupied |
| 1-Person Household | 816 (87.5%) | 116 (12.4%) |
| 2-Person Household | 1,264 (86.2%) | 202 (13.8%) |
| 3-Person Household | 369 (79.7%) | 94 (20.3%) |
| 4+ Person Household | 473 (88.4%) | 62 (11.6%) |
| Total Housing Units | 2,922 (86.0%) | 474 (14.0%) |
Occupancy by Educational Attainment in Boise County
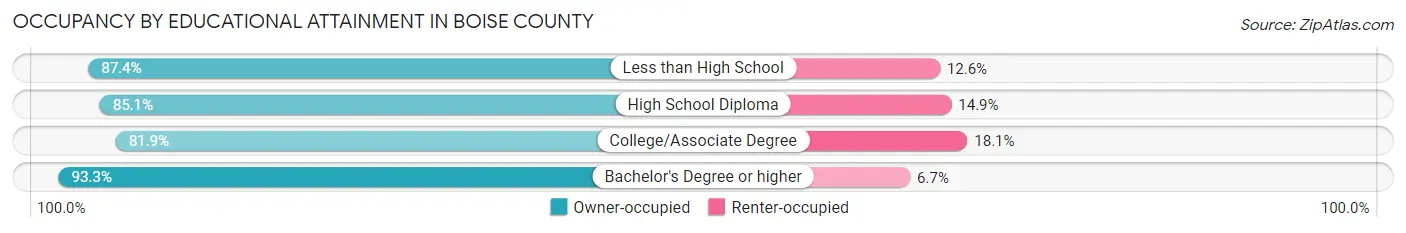
| Household Size | Owner-occupied | Renter-occupied |
| Less than High School | 76 (87.4%) | 11 (12.6%) |
| High School Diploma | 782 (85.1%) | 137 (14.9%) |
| College/Associate Degree | 1,192 (81.9%) | 263 (18.1%) |
| Bachelor's Degree or higher | 872 (93.3%) | 63 (6.7%) |
Occupancy by Age of Householder in Boise County
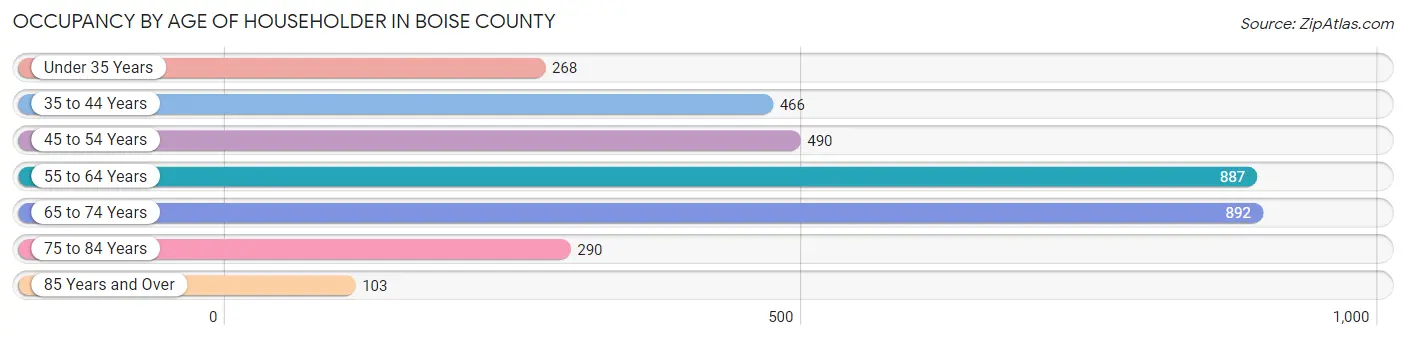
| Age Bracket | # Households | % Households |
| Under 35 Years | 268 | 7.9% |
| 35 to 44 Years | 466 | 13.7% |
| 45 to 54 Years | 490 | 14.4% |
| 55 to 64 Years | 887 | 26.1% |
| 65 to 74 Years | 892 | 26.3% |
| 75 to 84 Years | 290 | 8.5% |
| 85 Years and Over | 103 | 3.0% |
| Total | 3,396 | 100.0% |
Housing Finances in Boise County
Median Income by Occupancy in Boise County
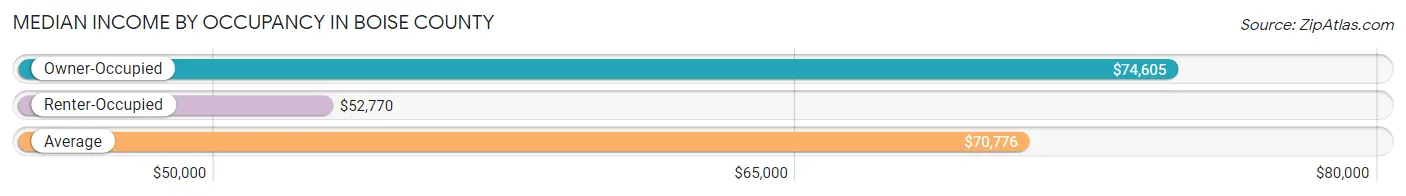
| Occupancy Type | # Households | Median Income |
| Owner-Occupied | 2,922 (86.0%) | $74,605 |
| Renter-Occupied | 474 (14.0%) | $52,770 |
| Average | 3,396 (100.0%) | $70,776 |
Occupancy by Householder Income Bracket in Boise County
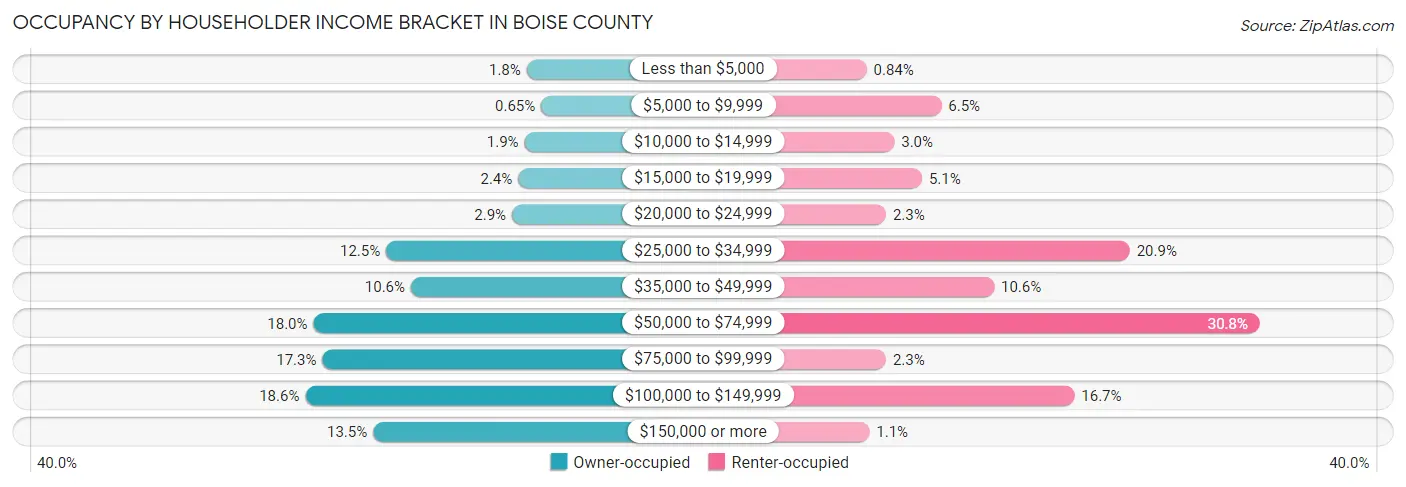
| Income Bracket | Owner-occupied | Renter-occupied |
| Less than $5,000 | 51 (1.8%) | 4 (0.8%) |
| $5,000 to $9,999 | 19 (0.6%) | 31 (6.5%) |
| $10,000 to $14,999 | 56 (1.9%) | 14 (2.9%) |
| $15,000 to $19,999 | 70 (2.4%) | 24 (5.1%) |
| $20,000 to $24,999 | 84 (2.9%) | 11 (2.3%) |
| $25,000 to $34,999 | 364 (12.5%) | 99 (20.9%) |
| $35,000 to $49,999 | 309 (10.6%) | 50 (10.5%) |
| $50,000 to $74,999 | 526 (18.0%) | 146 (30.8%) |
| $75,000 to $99,999 | 506 (17.3%) | 11 (2.3%) |
| $100,000 to $149,999 | 544 (18.6%) | 79 (16.7%) |
| $150,000 or more | 393 (13.5%) | 5 (1.1%) |
| Total | 2,922 (100.0%) | 474 (100.0%) |
Monthly Housing Cost Tiers in Boise County
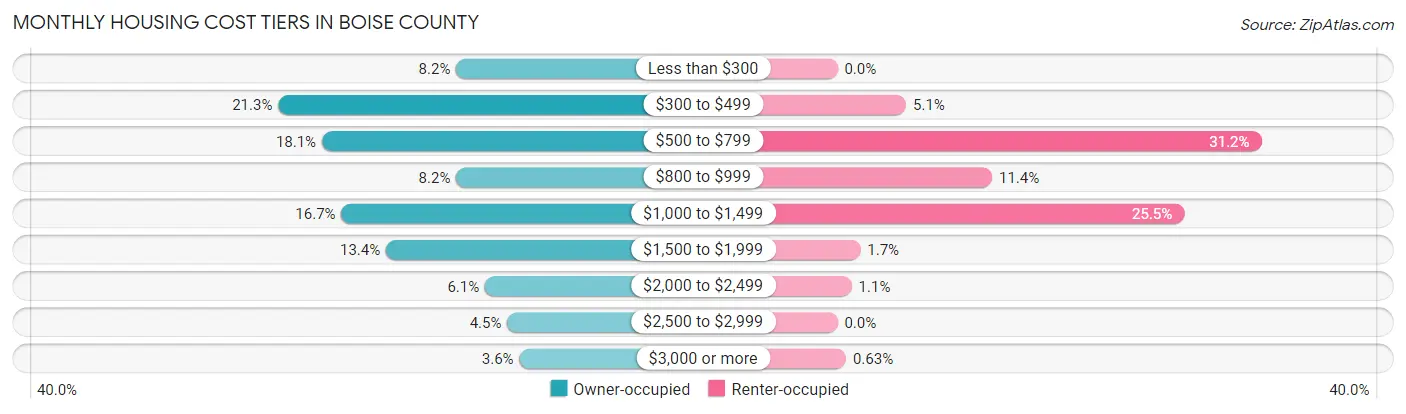
| Monthly Cost | Owner-occupied | Renter-occupied |
| Less than $300 | 240 (8.2%) | 0 (0.0%) |
| $300 to $499 | 623 (21.3%) | 24 (5.1%) |
| $500 to $799 | 529 (18.1%) | 148 (31.2%) |
| $800 to $999 | 240 (8.2%) | 54 (11.4%) |
| $1,000 to $1,499 | 487 (16.7%) | 121 (25.5%) |
| $1,500 to $1,999 | 391 (13.4%) | 8 (1.7%) |
| $2,000 to $2,499 | 178 (6.1%) | 5 (1.1%) |
| $2,500 to $2,999 | 130 (4.4%) | 0 (0.0%) |
| $3,000 or more | 104 (3.6%) | 3 (0.6%) |
| Total | 2,922 (100.0%) | 474 (100.0%) |
Physical Housing Characteristics in Boise County
Housing Structures in Boise County
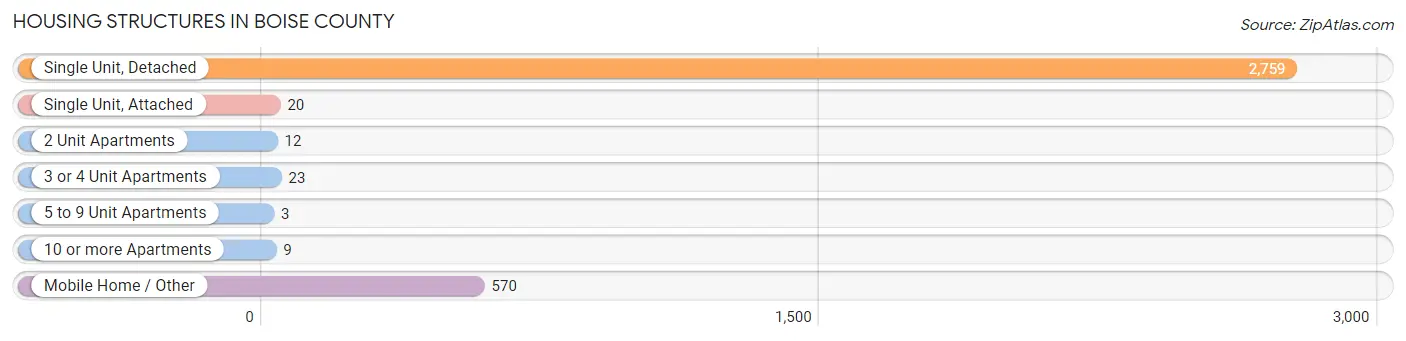
| Structure Type | # Housing Units | % Housing Units |
| Single Unit, Detached | 2,759 | 81.2% |
| Single Unit, Attached | 20 | 0.6% |
| 2 Unit Apartments | 12 | 0.4% |
| 3 or 4 Unit Apartments | 23 | 0.7% |
| 5 to 9 Unit Apartments | 3 | 0.1% |
| 10 or more Apartments | 9 | 0.3% |
| Mobile Home / Other | 570 | 16.8% |
| Total | 3,396 | 100.0% |
Housing Structures by Occupancy in Boise County
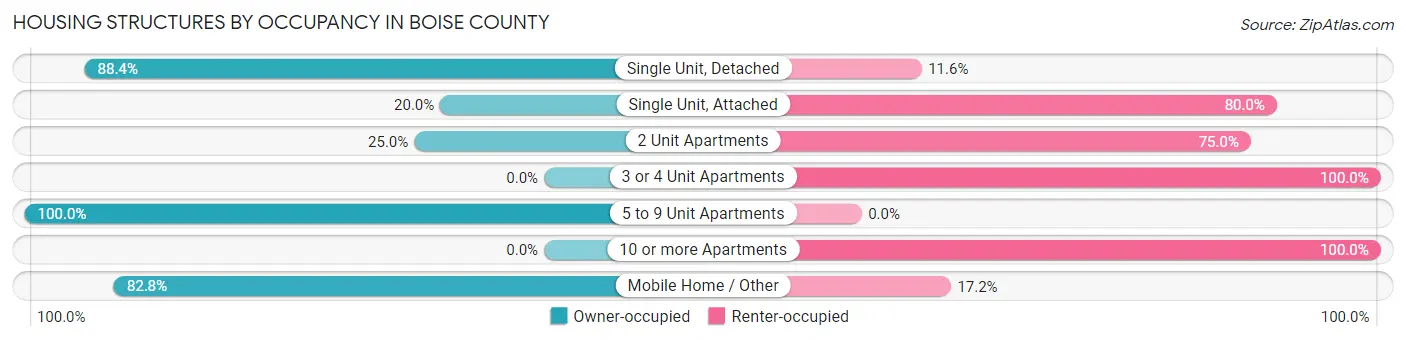
| Structure Type | Owner-occupied | Renter-occupied |
| Single Unit, Detached | 2,440 (88.4%) | 319 (11.6%) |
| Single Unit, Attached | 4 (20.0%) | 16 (80.0%) |
| 2 Unit Apartments | 3 (25.0%) | 9 (75.0%) |
| 3 or 4 Unit Apartments | 0 (0.0%) | 23 (100.0%) |
| 5 to 9 Unit Apartments | 3 (100.0%) | 0 (0.0%) |
| 10 or more Apartments | 0 (0.0%) | 9 (100.0%) |
| Mobile Home / Other | 472 (82.8%) | 98 (17.2%) |
| Total | 2,922 (86.0%) | 474 (14.0%) |
Housing Structures by Number of Rooms in Boise County
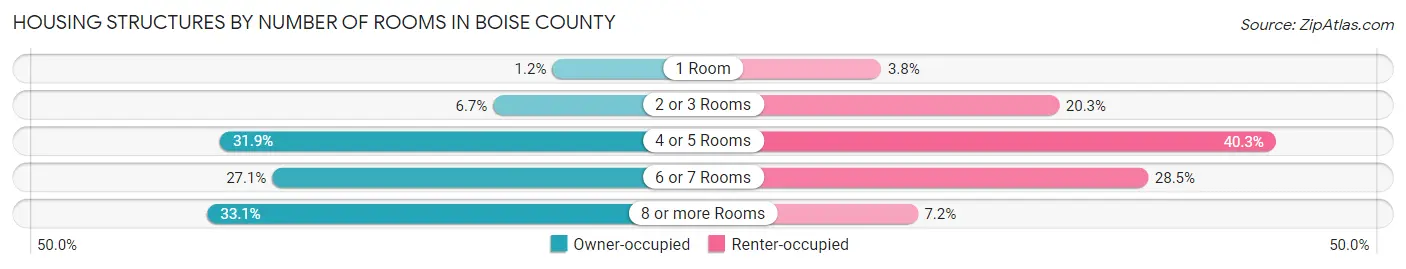
| Number of Rooms | Owner-occupied | Renter-occupied |
| 1 Room | 35 (1.2%) | 18 (3.8%) |
| 2 or 3 Rooms | 195 (6.7%) | 96 (20.3%) |
| 4 or 5 Rooms | 933 (31.9%) | 191 (40.3%) |
| 6 or 7 Rooms | 792 (27.1%) | 135 (28.5%) |
| 8 or more Rooms | 967 (33.1%) | 34 (7.2%) |
| Total | 2,922 (100.0%) | 474 (100.0%) |
Housing Structure by Heating Type in Boise County
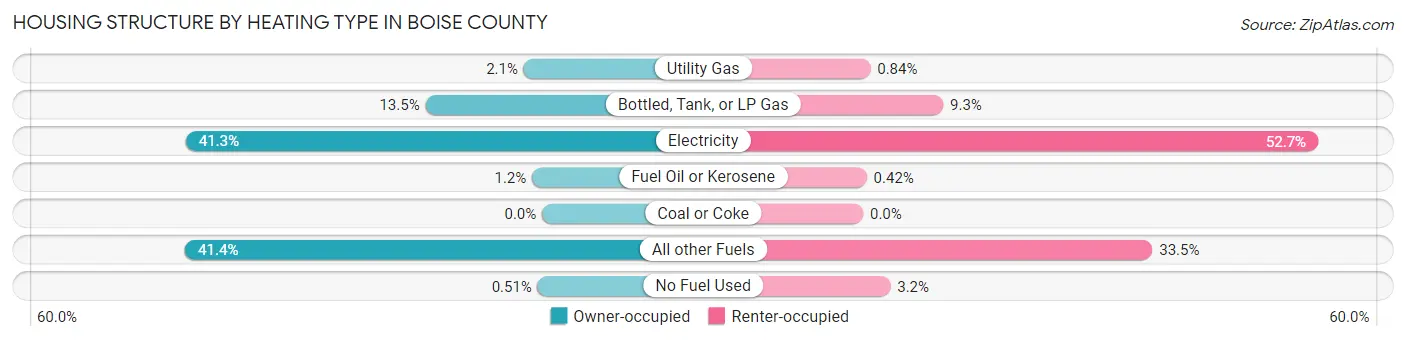
| Heating Type | Owner-occupied | Renter-occupied |
| Utility Gas | 62 (2.1%) | 4 (0.8%) |
| Bottled, Tank, or LP Gas | 395 (13.5%) | 44 (9.3%) |
| Electricity | 1,207 (41.3%) | 250 (52.7%) |
| Fuel Oil or Kerosene | 34 (1.2%) | 2 (0.4%) |
| Coal or Coke | 0 (0.0%) | 0 (0.0%) |
| All other Fuels | 1,209 (41.4%) | 159 (33.5%) |
| No Fuel Used | 15 (0.5%) | 15 (3.2%) |
| Total | 2,922 (100.0%) | 474 (100.0%) |
Household Vehicle Usage in Boise County
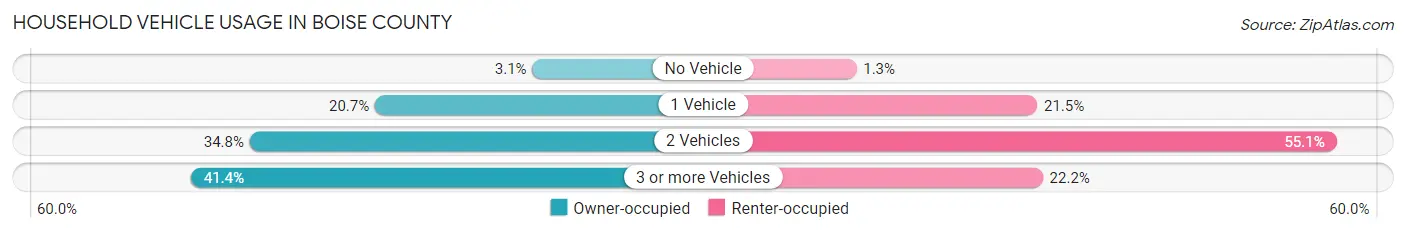
| Vehicles per Household | Owner-occupied | Renter-occupied |
| No Vehicle | 91 (3.1%) | 6 (1.3%) |
| 1 Vehicle | 606 (20.7%) | 102 (21.5%) |
| 2 Vehicles | 1,016 (34.8%) | 261 (55.1%) |
| 3 or more Vehicles | 1,209 (41.4%) | 105 (22.2%) |
| Total | 2,922 (100.0%) | 474 (100.0%) |
Real Estate & Mortgages in Boise County
Real Estate and Mortgage Overview in Boise County
| Characteristic | Without Mortgage | With Mortgage |
| Housing Units | 1,495 | 1,427 |
| Median Property Value | $331,500 | $406,300 |
| Median Household Income | $57,049 | $290 |
| Monthly Housing Costs | $466 | $104 |
| Real Estate Taxes | $1,592 | $13 |
Property Value by Mortgage Status in Boise County

| Property Value | Without Mortgage | With Mortgage |
| Less than $50,000 | 158 (10.6%) | 46 (3.2%) |
| $50,000 to $99,999 | 119 (8.0%) | 15 (1.1%) |
| $100,000 to $299,999 | 416 (27.8%) | 472 (33.1%) |
| $300,000 to $499,999 | 359 (24.0%) | 396 (27.8%) |
| $500,000 to $749,999 | 194 (13.0%) | 280 (19.6%) |
| $750,000 to $999,999 | 82 (5.5%) | 179 (12.5%) |
| $1,000,000 or more | 167 (11.2%) | 39 (2.7%) |
| Total | 1,495 (100.0%) | 1,427 (100.0%) |
Household Income by Mortgage Status in Boise County
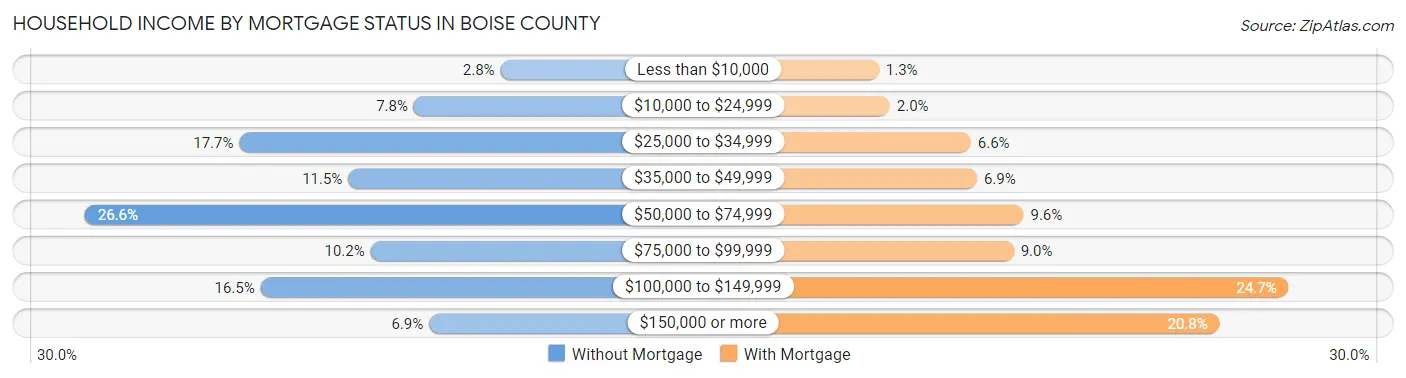
| Household Income | Without Mortgage | With Mortgage |
| Less than $10,000 | 42 (2.8%) | 19 (1.3%) |
| $10,000 to $24,999 | 116 (7.8%) | 28 (2.0%) |
| $25,000 to $34,999 | 265 (17.7%) | 94 (6.6%) |
| $35,000 to $49,999 | 172 (11.5%) | 99 (6.9%) |
| $50,000 to $74,999 | 397 (26.6%) | 137 (9.6%) |
| $75,000 to $99,999 | 153 (10.2%) | 129 (9.0%) |
| $100,000 to $149,999 | 247 (16.5%) | 353 (24.7%) |
| $150,000 or more | 103 (6.9%) | 297 (20.8%) |
| Total | 1,495 (100.0%) | 1,427 (100.0%) |
Property Value to Household Income Ratio in Boise County
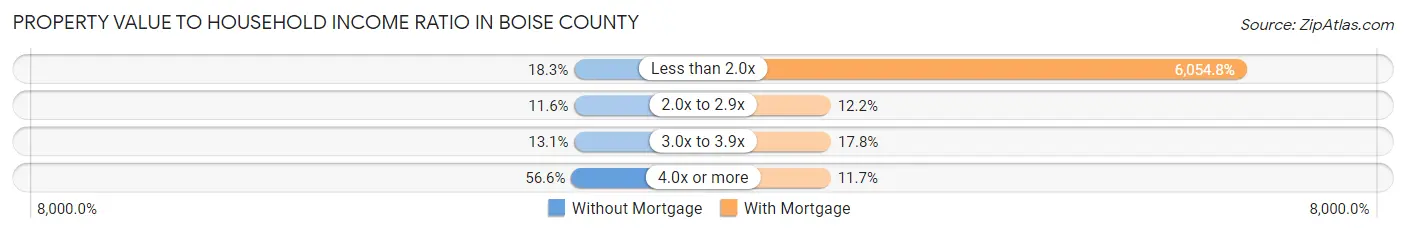
| Value-to-Income Ratio | Without Mortgage | With Mortgage |
| Less than 2.0x | 273 (18.3%) | 86,402 (6,054.8%) |
| 2.0x to 2.9x | 174 (11.6%) | 174 (12.2%) |
| 3.0x to 3.9x | 196 (13.1%) | 254 (17.8%) |
| 4.0x or more | 846 (56.6%) | 167 (11.7%) |
| Total | 1,495 (100.0%) | 1,427 (100.0%) |
Real Estate Taxes by Mortgage Status in Boise County
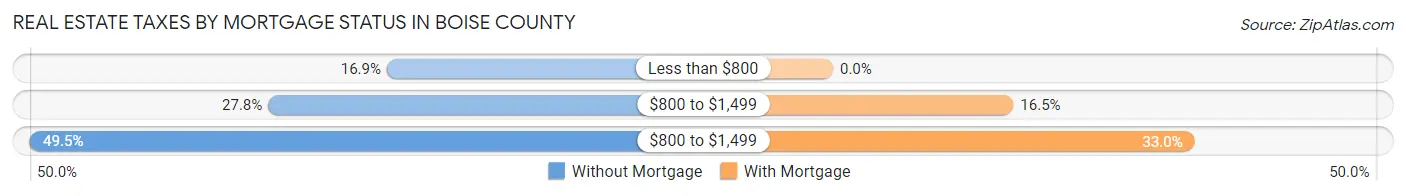
| Property Taxes | Without Mortgage | With Mortgage |
| Less than $800 | 253 (16.9%) | 0 (0.0%) |
| $800 to $1,499 | 415 (27.8%) | 235 (16.5%) |
| $800 to $1,499 | 740 (49.5%) | 471 (33.0%) |
| Total | 1,495 (100.0%) | 1,427 (100.0%) |
Health & Disability in Boise County
Health Insurance Coverage by Age in Boise County
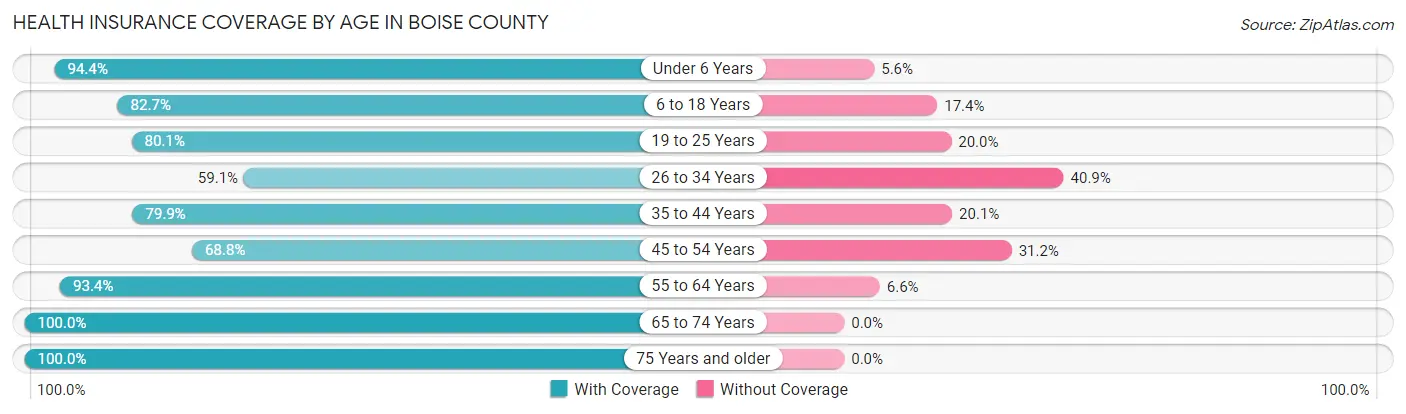
| Age Bracket | With Coverage | Without Coverage |
| Under 6 Years | 338 (94.4%) | 20 (5.6%) |
| 6 to 18 Years | 824 (82.7%) | 173 (17.3%) |
| 19 to 25 Years | 301 (80.0%) | 75 (20.0%) |
| 26 to 34 Years | 302 (59.1%) | 209 (40.9%) |
| 35 to 44 Years | 711 (79.9%) | 179 (20.1%) |
| 45 to 54 Years | 608 (68.8%) | 276 (31.2%) |
| 55 to 64 Years | 1,534 (93.4%) | 109 (6.6%) |
| 65 to 74 Years | 1,436 (100.0%) | 0 (0.0%) |
| 75 Years and older | 667 (100.0%) | 0 (0.0%) |
| Total | 6,721 (86.6%) | 1,041 (13.4%) |
Health Insurance Coverage by Citizenship Status in Boise County
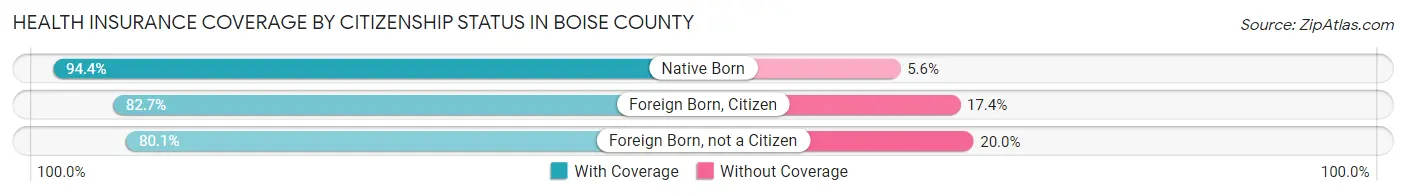
| Citizenship Status | With Coverage | Without Coverage |
| Native Born | 338 (94.4%) | 20 (5.6%) |
| Foreign Born, Citizen | 824 (82.7%) | 173 (17.3%) |
| Foreign Born, not a Citizen | 301 (80.0%) | 75 (20.0%) |
Health Insurance Coverage by Household Income in Boise County
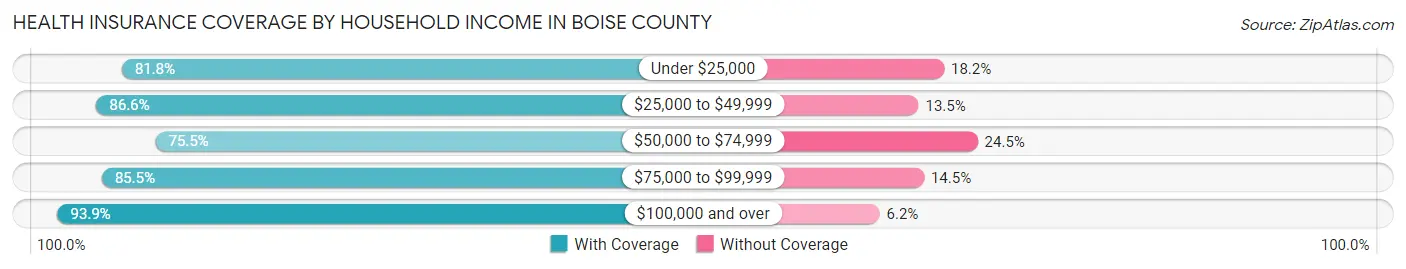
| Household Income | With Coverage | Without Coverage |
| Under $25,000 | 543 (81.8%) | 121 (18.2%) |
| $25,000 to $49,999 | 1,190 (86.6%) | 185 (13.5%) |
| $50,000 to $74,999 | 1,130 (75.5%) | 367 (24.5%) |
| $75,000 to $99,999 | 1,094 (85.5%) | 185 (14.5%) |
| $100,000 and over | 2,717 (93.9%) | 178 (6.1%) |
Public vs Private Health Insurance Coverage by Age in Boise County
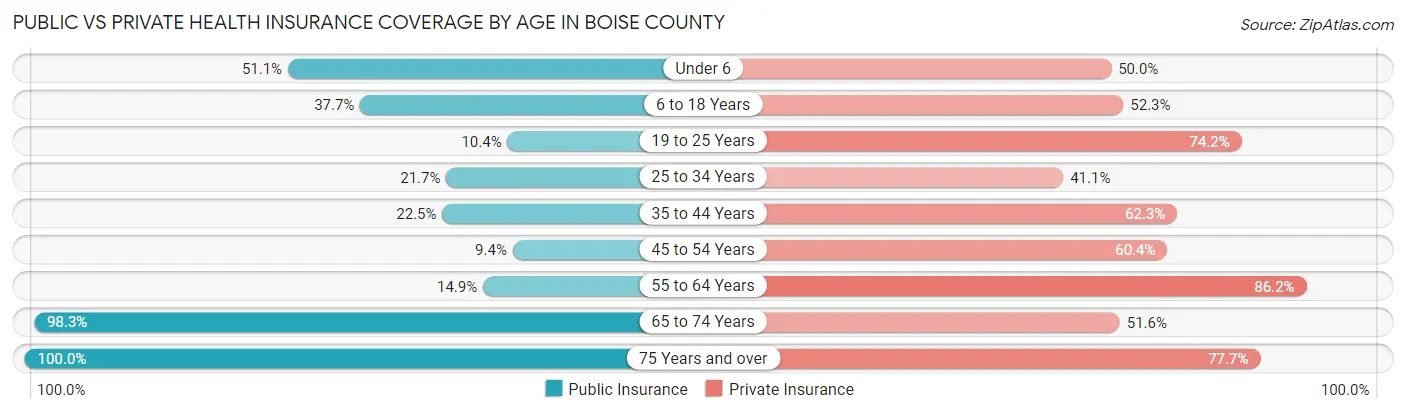
| Age Bracket | Public Insurance | Private Insurance |
| Under 6 | 183 (51.1%) | 179 (50.0%) |
| 6 to 18 Years | 376 (37.7%) | 521 (52.3%) |
| 19 to 25 Years | 39 (10.4%) | 279 (74.2%) |
| 25 to 34 Years | 111 (21.7%) | 210 (41.1%) |
| 35 to 44 Years | 200 (22.5%) | 554 (62.3%) |
| 45 to 54 Years | 83 (9.4%) | 534 (60.4%) |
| 55 to 64 Years | 245 (14.9%) | 1,417 (86.2%) |
| 65 to 74 Years | 1,411 (98.3%) | 741 (51.6%) |
| 75 Years and over | 667 (100.0%) | 518 (77.7%) |
| Total | 3,315 (42.7%) | 4,953 (63.8%) |
Disability Status by Sex by Age in Boise County
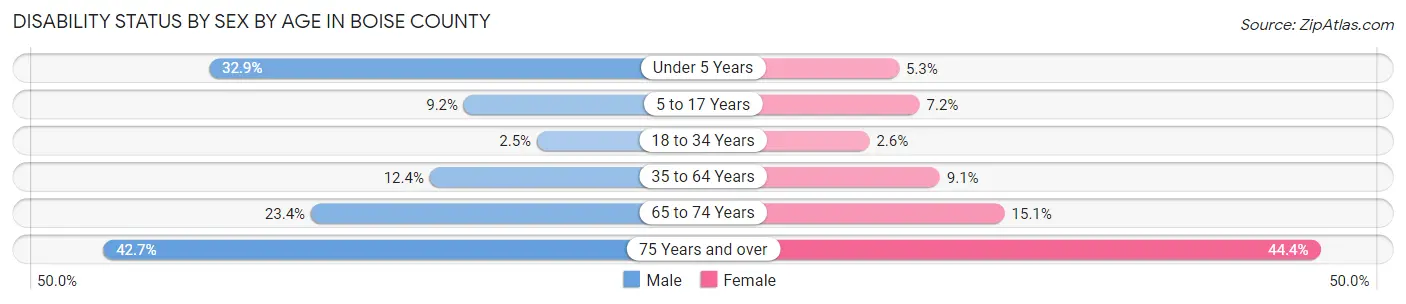
| Age Bracket | Male | Female |
| Under 5 Years | 24 (32.9%) | 11 (5.3%) |
| 5 to 17 Years | 42 (9.2%) | 34 (7.2%) |
| 18 to 34 Years | 13 (2.5%) | 13 (2.6%) |
| 35 to 64 Years | 207 (12.4%) | 159 (9.1%) |
| 65 to 74 Years | 183 (23.4%) | 99 (15.1%) |
| 75 Years and over | 155 (42.7%) | 135 (44.4%) |
Disability Class by Sex by Age in Boise County
Disability Class: Hearing Difficulty
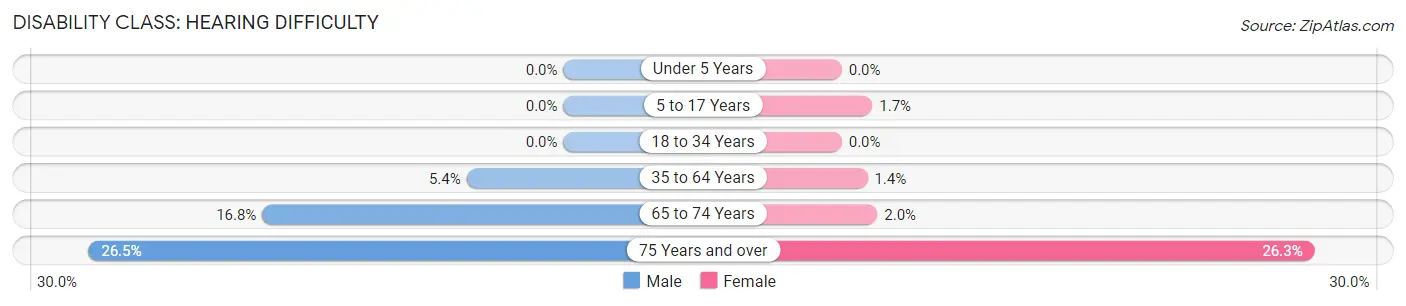
| Age Bracket | Male | Female |
| Under 5 Years | 0 (0.0%) | 0 (0.0%) |
| 5 to 17 Years | 0 (0.0%) | 8 (1.7%) |
| 18 to 34 Years | 0 (0.0%) | 0 (0.0%) |
| 35 to 64 Years | 90 (5.4%) | 25 (1.4%) |
| 65 to 74 Years | 131 (16.8%) | 13 (2.0%) |
| 75 Years and over | 96 (26.5%) | 80 (26.3%) |
Disability Class: Vision Difficulty
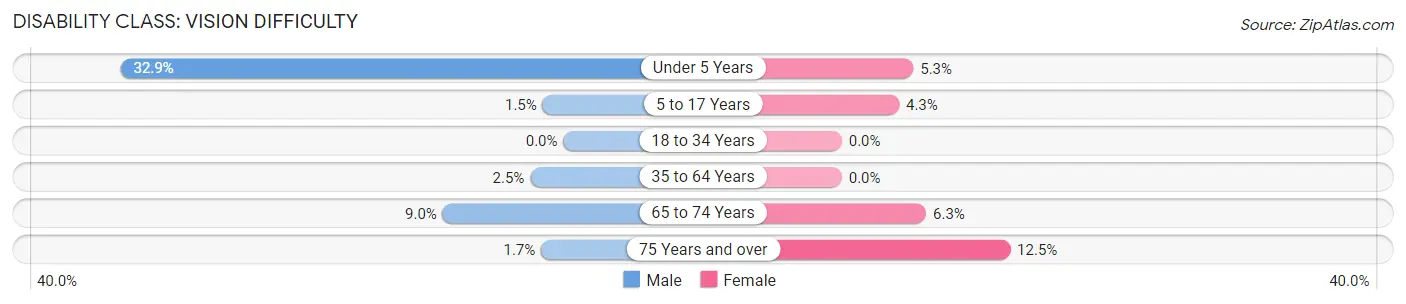
| Age Bracket | Male | Female |
| Under 5 Years | 24 (32.9%) | 11 (5.3%) |
| 5 to 17 Years | 7 (1.5%) | 20 (4.3%) |
| 18 to 34 Years | 0 (0.0%) | 0 (0.0%) |
| 35 to 64 Years | 41 (2.5%) | 0 (0.0%) |
| 65 to 74 Years | 70 (9.0%) | 41 (6.3%) |
| 75 Years and over | 6 (1.7%) | 38 (12.5%) |
Disability Class: Cognitive Difficulty
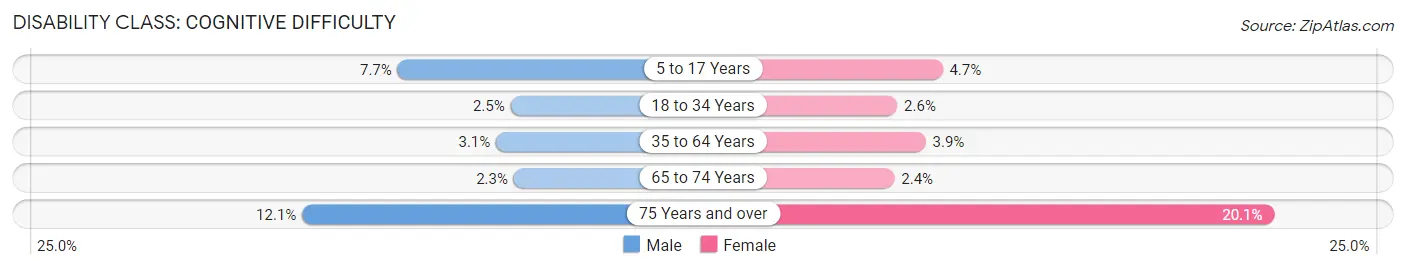
| Age Bracket | Male | Female |
| 5 to 17 Years | 35 (7.7%) | 22 (4.7%) |
| 18 to 34 Years | 13 (2.5%) | 13 (2.6%) |
| 35 to 64 Years | 52 (3.1%) | 68 (3.9%) |
| 65 to 74 Years | 18 (2.3%) | 16 (2.4%) |
| 75 Years and over | 44 (12.1%) | 61 (20.1%) |
Disability Class: Ambulatory Difficulty
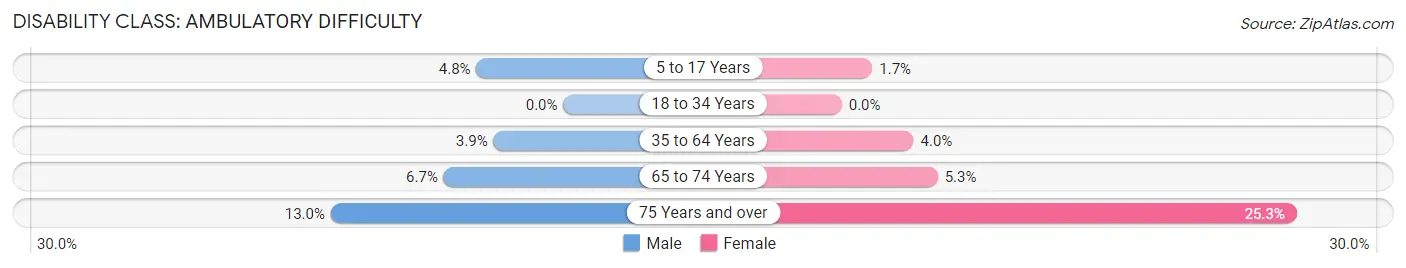
| Age Bracket | Male | Female |
| 5 to 17 Years | 22 (4.8%) | 8 (1.7%) |
| 18 to 34 Years | 0 (0.0%) | 0 (0.0%) |
| 35 to 64 Years | 65 (3.9%) | 70 (4.0%) |
| 65 to 74 Years | 52 (6.7%) | 35 (5.3%) |
| 75 Years and over | 47 (13.0%) | 77 (25.3%) |
Disability Class: Self-Care Difficulty
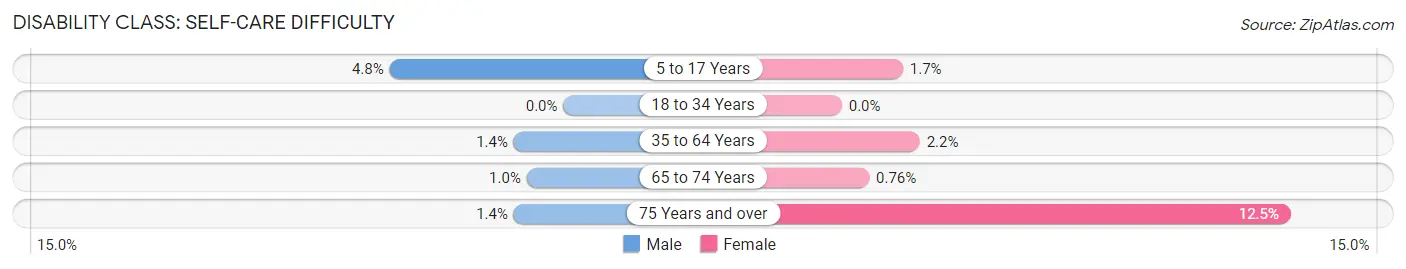
| Age Bracket | Male | Female |
| 5 to 17 Years | 22 (4.8%) | 8 (1.7%) |
| 18 to 34 Years | 0 (0.0%) | 0 (0.0%) |
| 35 to 64 Years | 23 (1.4%) | 38 (2.2%) |
| 65 to 74 Years | 8 (1.0%) | 5 (0.8%) |
| 75 Years and over | 5 (1.4%) | 38 (12.5%) |
Technology Access in Boise County
Computing Device Access in Boise County
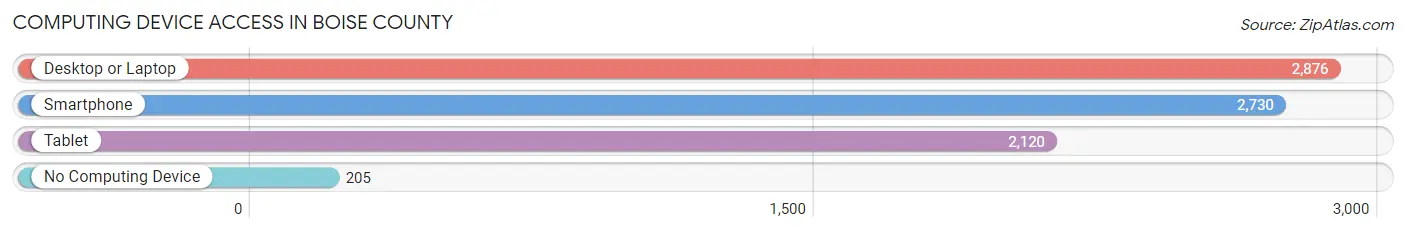
| Device Type | # Households | % Households |
| Desktop or Laptop | 2,876 | 84.7% |
| Smartphone | 2,730 | 80.4% |
| Tablet | 2,120 | 62.4% |
| No Computing Device | 205 | 6.0% |
| Total | 3,396 | 100.0% |
Internet Access in Boise County
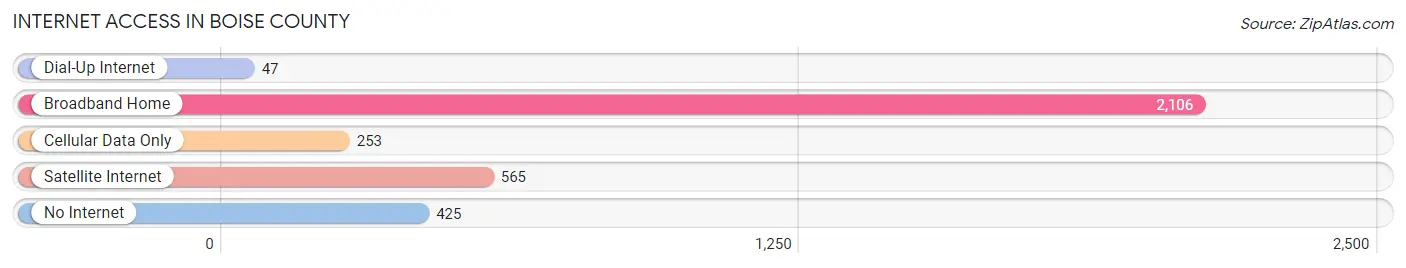
| Internet Type | # Households | % Households |
| Dial-Up Internet | 47 | 1.4% |
| Broadband Home | 2,106 | 62.0% |
| Cellular Data Only | 253 | 7.4% |
| Satellite Internet | 565 | 16.6% |
| No Internet | 425 | 12.5% |
| Total | 3,396 | 100.0% |
Boise County Summary
Boise County, Idaho is located in the southwestern part of the state and is bordered by Ada County to the north, Elmore County to the east, Owyhee County to the south, and Gem County to the west. The county seat is located in the city of Idaho City, which is the largest city in the county. Boise County is part of the Boise Metropolitan Statistical Area and is home to a population of approximately 7,000 people.
Geography
Boise County is located in the western part of the state of Idaho and is bordered by Ada County to the north, Elmore County to the east, Owyhee County to the south, and Gem County to the west. The county covers an area of 1,845 square miles and is the second largest county in the state. The terrain of the county is mostly mountainous and is part of the Rocky Mountains. The highest point in the county is the summit of Pilot Peak, which is 8,919 feet above sea level. The county is home to several rivers, including the Boise River, Payette River, and Weiser River.
Climate
Boise County has a semi-arid climate, with hot summers and cold winters. The average annual temperature is around 50 degrees Fahrenheit, with temperatures ranging from the low 30s in the winter to the high 90s in the summer. The average annual precipitation is around 12 inches, with most of the precipitation occurring in the winter months.
Demographics
As of the 2010 census, there were 6,871 people, 2,717 households, and 1,845 families residing in the county. The population density was 3.7 people per square mile. The racial makeup of the county was 94.3% White, 0.3% African American, 0.7% Native American, 0.4% Asian, 0.1% Pacific Islander, 1.7% from other races, and 2.4% from two or more races. Hispanic or Latino of any race were 4.2% of the population.
Economy
The economy of Boise County is largely based on agriculture and tourism. The county is home to several farms and ranches, which produce a variety of crops, including potatoes, wheat, barley, and hay. The county is also home to several tourist attractions, including the Idaho City Historic District, the Boise National Forest, and the Payette National Forest.
Boise County is also home to several businesses, including a number of restaurants, retail stores, and service providers. The county is also home to several manufacturing companies, including a paper mill and a wood products plant.
Conclusion
Boise County, Idaho is a rural county located in the western part of the state. The county is home to a population of approximately 7,000 people and is largely based on agriculture and tourism. The county is home to several farms and ranches, as well as several tourist attractions. The county is also home to several businesses, including restaurants, retail stores, and manufacturing companies.
Common Questions
What is the Total Population of Boise County?
Total Population of Boise County is 7,809.
What is the Total Male Population of Boise County?
Total Male Population of Boise County is 3,907.
What is the Total Female Population of Boise County?
Total Female Population of Boise County is 3,902.
What is the Ratio of Males per 100 Females in Boise County?
There are 100.13 Males per 100 Females in Boise County.
What is the Ratio of Females per 100 Males in Boise County?
There are 99.87 Females per 100 Males in Boise County.
What is the Median Population Age in Boise County?
Median Population Age in Boise County is 53.7 Years.
What is the Average Family Size in Boise County
Average Family Size in Boise County is 2.7 People.
What is the Average Household Size in Boise County
Average Household Size in Boise County is 2.3 People.
What is Per Capita Income in Boise County?
Per Capita income in Boise County is $36,518.
What is the Median Family Income in Boise County?
Median Family Income in Boise County is $81,897.
What is the Median Household income in Boise County?
Median Household Income in Boise County is $70,776.
What is Income or Wage Gap in Boise County?
Income or Wage Gap in Boise County is 39.0%.
Women in Boise County earn 61.0 cents for every dollar earned by a man.
What is Family Income Deficit in Boise County?
Family Income Deficit in Boise County is $13,060.
Families that are below poverty line in Boise County earn $13,060 less on average than the poverty threshold level.
What is Inequality or Gini Index in Boise County?
Inequality or Gini Index in Boise County is 0.38.
How Large is the Labor Force in Boise County?
There are 3,532 People in the Labor Forcein in Boise County.
What is the Percentage of People in the Labor Force in Boise County?
52.1% of People are in the Labor Force in Boise County.
What is the Unemployment Rate in Boise County?
Unemployment Rate in Boise County is 3.4%.