Blaine County, ID
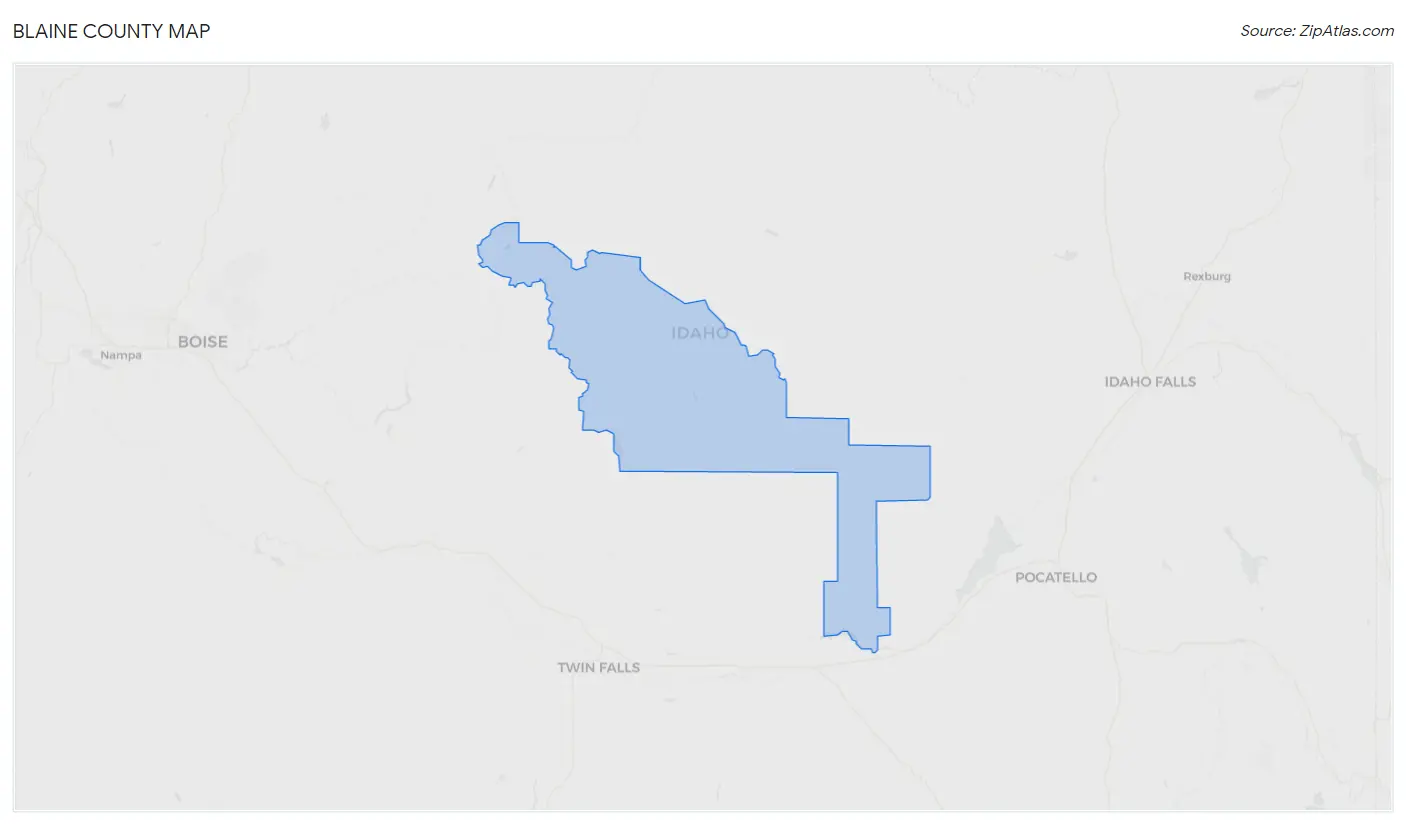
Blaine County Map
Blaine County Overview
24,248
TOTAL POPULATION
12,648
MALE POPULATION
11,600
FEMALE POPULATION
109.03
MALES / 100 FEMALES
91.71
FEMALES / 100 MALES
44.5
MEDIAN AGE
3.2
AVG FAMILY SIZE
2.6
AVG HOUSEHOLD SIZE
$47,151
PER CAPITA INCOME
$87,544
AVG FAMILY INCOME
$81,794
AVG HOUSEHOLD INCOME
12.7%
WAGE / INCOME GAP [ % ]
87.3¢/ $1
WAGE / INCOME GAP [ $ ]
0.46
INEQUALITY / GINI INDEX
13,934
LABOR FORCE [ PEOPLE ]
70.0%
PERCENT IN LABOR FORCE
2.3%
UNEMPLOYMENT RATE
Blaine County Area Codes
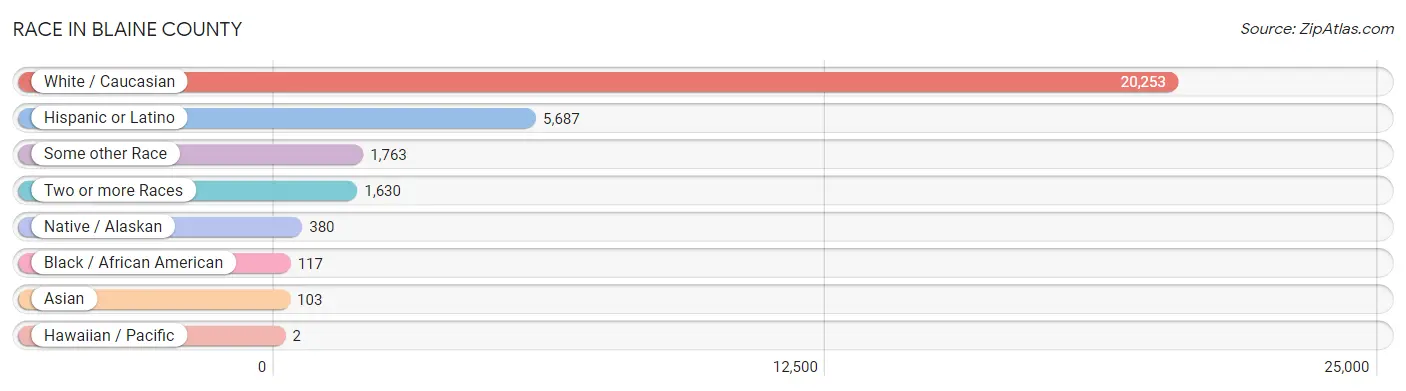
Race in Blaine County
The most populous races in Blaine County are White / Caucasian (20,253 | 83.5%), Hispanic or Latino (5,687 | 23.4%), and Some other Race (1,763 | 7.3%).
| Race | # Population | % Population |
| Asian | 103 | 0.4% |
| Black / African American | 117 | 0.5% |
| Hawaiian / Pacific | 2 | 0.0% |
| Hispanic or Latino | 5,687 | 23.4% |
| Native / Alaskan | 380 | 1.6% |
| White / Caucasian | 20,253 | 83.5% |
| Two or more Races | 1,630 | 6.7% |
| Some other Race | 1,763 | 7.3% |
| Total | 24,248 | 100.0% |
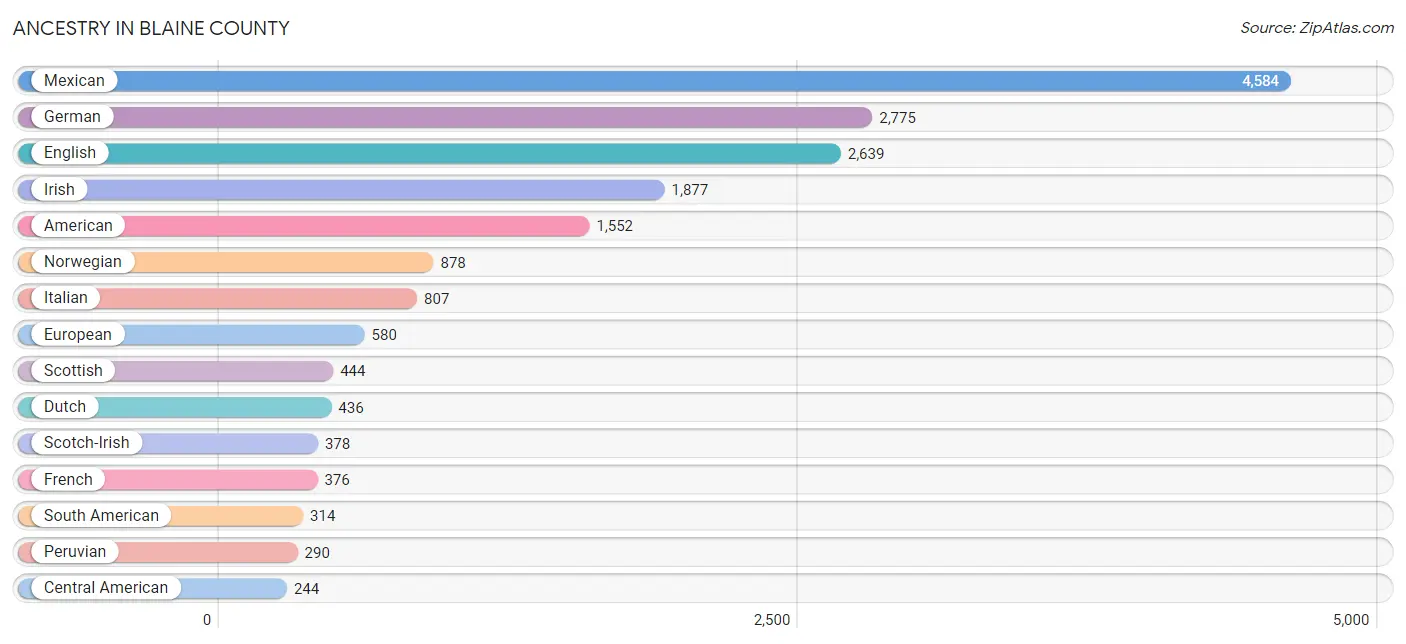
Ancestry in Blaine County
The most populous ancestries reported in Blaine County are Mexican (4,584 | 18.9%), German (2,775 | 11.4%), English (2,639 | 10.9%), Irish (1,877 | 7.7%), and American (1,552 | 6.4%), together accounting for 55.4% of all Blaine County residents.
| Ancestry | # Population | % Population |
| African | 72 | 0.3% |
| American | 1,552 | 6.4% |
| Arab | 52 | 0.2% |
| Australian | 62 | 0.3% |
| Austrian | 116 | 0.5% |
| Basque | 81 | 0.3% |
| Brazilian | 35 | 0.1% |
| British | 111 | 0.5% |
| Canadian | 122 | 0.5% |
| Central American | 244 | 1.0% |
| Cherokee | 53 | 0.2% |
| Chilean | 24 | 0.1% |
| Croatian | 17 | 0.1% |
| Czech | 146 | 0.6% |
| Danish | 204 | 0.8% |
| Dutch | 436 | 1.8% |
| Eastern European | 45 | 0.2% |
| Egyptian | 52 | 0.2% |
| English | 2,639 | 10.9% |
| European | 580 | 2.4% |
| Finnish | 180 | 0.7% |
| French | 376 | 1.5% |
| French Canadian | 9 | 0.0% |
| German | 2,775 | 11.4% |
| German Russian | 16 | 0.1% |
| Greek | 200 | 0.8% |
| Guatemalan | 244 | 1.0% |
| Hungarian | 90 | 0.4% |
| Indian (Asian) | 117 | 0.5% |
| Irish | 1,877 | 7.7% |
| Italian | 807 | 3.3% |
| Macedonian | 37 | 0.2% |
| Mexican | 4,584 | 18.9% |
| Mexican American Indian | 18 | 0.1% |
| Native Hawaiian | 2 | 0.0% |
| New Zealander | 9 | 0.0% |
| Northern European | 128 | 0.5% |
| Norwegian | 878 | 3.6% |
| Peruvian | 290 | 1.2% |
| Polish | 44 | 0.2% |
| Portuguese | 23 | 0.1% |
| Pueblo | 32 | 0.1% |
| Puerto Rican | 64 | 0.3% |
| Russian | 36 | 0.2% |
| Scandinavian | 224 | 0.9% |
| Scotch-Irish | 378 | 1.6% |
| Scottish | 444 | 1.8% |
| Sioux | 10 | 0.0% |
| Slavic | 24 | 0.1% |
| Slovak | 9 | 0.0% |
| South American | 314 | 1.3% |
| Spaniard | 88 | 0.4% |
| Spanish | 143 | 0.6% |
| Subsaharan African | 72 | 0.3% |
| Swedish | 138 | 0.6% |
| Swiss | 171 | 0.7% |
| Ukrainian | 43 | 0.2% |
| Welsh | 105 | 0.4% |
| Yugoslavian | 4 | 0.0% | View All 59 Rows |
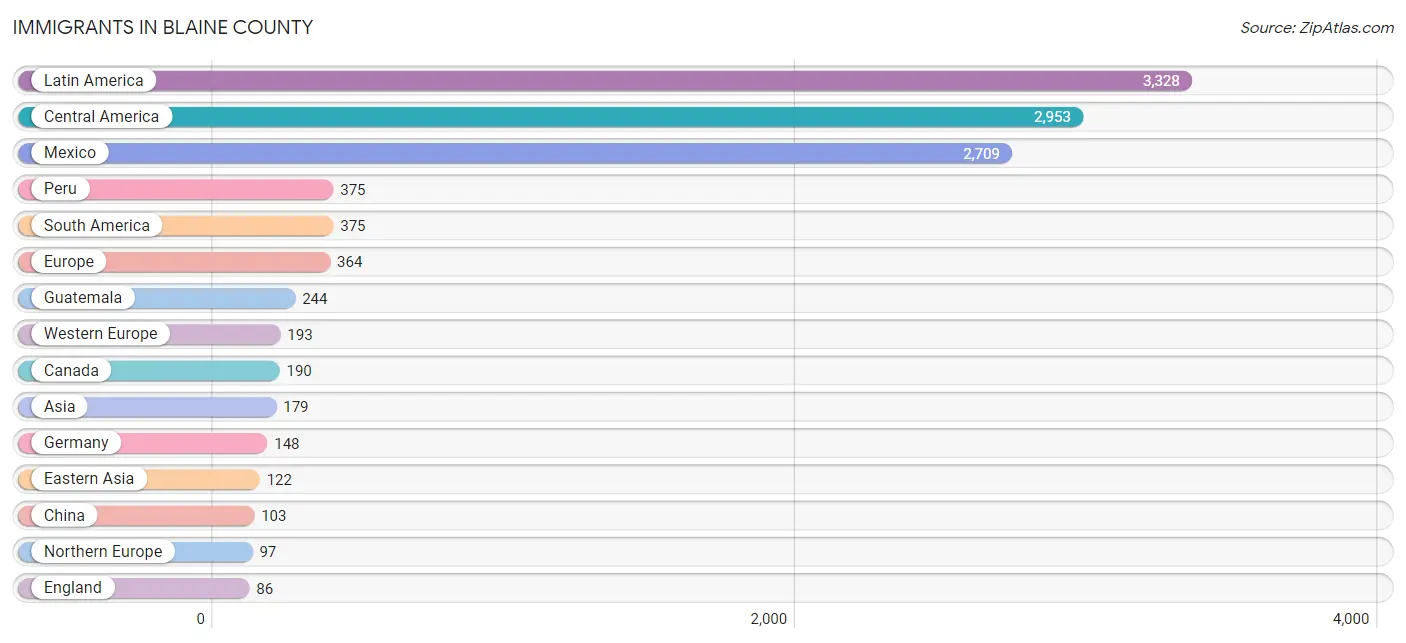
Immigrants in Blaine County
The most numerous immigrant groups reported in Blaine County came from Latin America (3,328 | 13.7%), Central America (2,953 | 12.2%), Mexico (2,709 | 11.2%), Peru (375 | 1.5%), and South America (375 | 1.5%), together accounting for 40.2% of all Blaine County residents.
| Immigration Origin | # Population | % Population |
| Africa | 20 | 0.1% |
| Asia | 179 | 0.7% |
| Australia | 25 | 0.1% |
| Bosnia and Herzegovina | 2 | 0.0% |
| Canada | 190 | 0.8% |
| Central America | 2,953 | 12.2% |
| China | 103 | 0.4% |
| Eastern Africa | 4 | 0.0% |
| Eastern Asia | 122 | 0.5% |
| Eastern Europe | 74 | 0.3% |
| Egypt | 16 | 0.1% |
| England | 86 | 0.4% |
| Europe | 364 | 1.5% |
| Germany | 148 | 0.6% |
| Guatemala | 244 | 1.0% |
| Hong Kong | 14 | 0.1% |
| Hungary | 20 | 0.1% |
| India | 26 | 0.1% |
| Ireland | 7 | 0.0% |
| Israel | 5 | 0.0% |
| Japan | 19 | 0.1% |
| Kuwait | 26 | 0.1% |
| Latin America | 3,328 | 13.7% |
| Mexico | 2,709 | 11.2% |
| Netherlands | 7 | 0.0% |
| North Macedonia | 37 | 0.2% |
| Northern Africa | 16 | 0.1% |
| Northern Europe | 97 | 0.4% |
| Oceania | 34 | 0.1% |
| Peru | 375 | 1.5% |
| South America | 375 | 1.5% |
| South Central Asia | 26 | 0.1% |
| Sweden | 4 | 0.0% |
| Switzerland | 38 | 0.2% |
| Ukraine | 15 | 0.1% |
| Western Asia | 31 | 0.1% |
| Western Europe | 193 | 0.8% | View All 37 Rows |
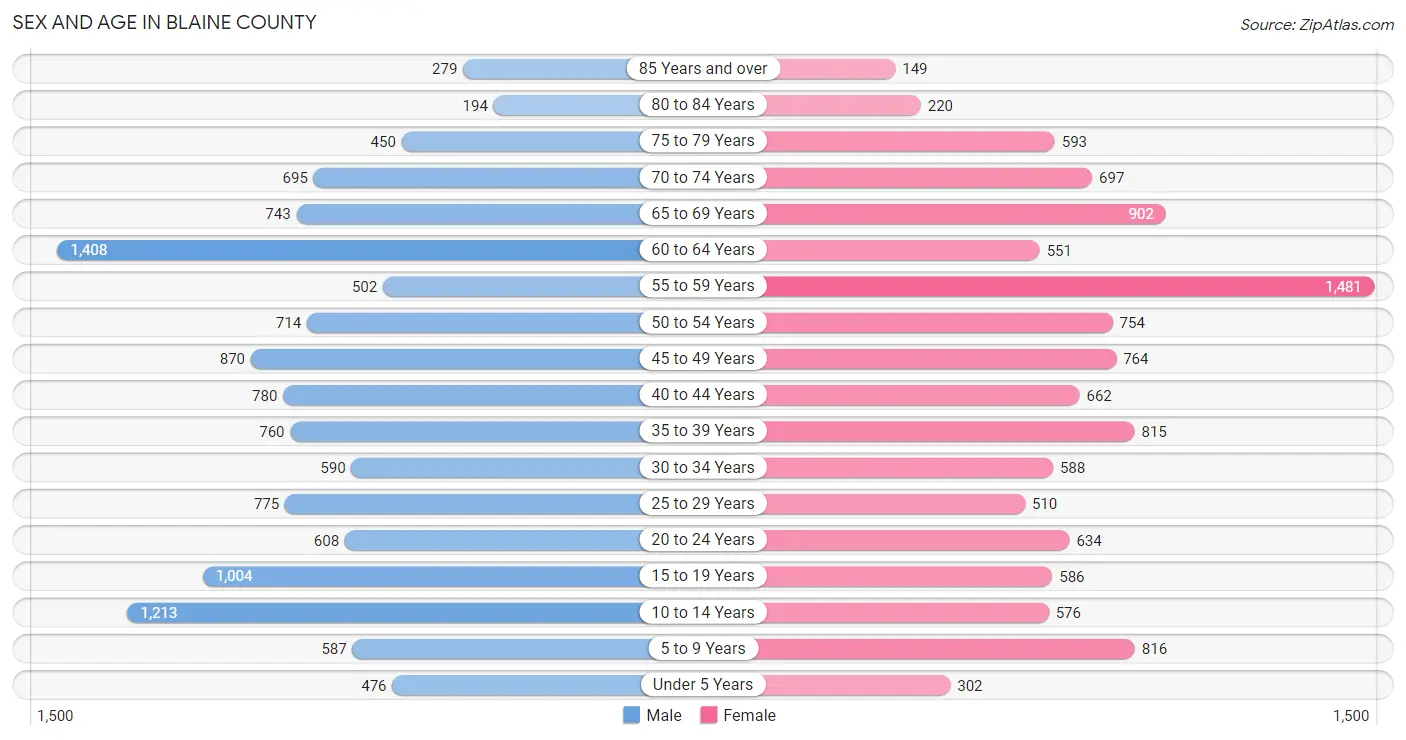
Sex and Age in Blaine County
Sex and Age in Blaine County
The most populous age groups in Blaine County are 60 to 64 Years (1,408 | 11.1%) for men and 55 to 59 Years (1,481 | 12.8%) for women.
| Age Bracket | Male | Female |
| Under 5 Years | 476 (3.8%) | 302 (2.6%) |
| 5 to 9 Years | 587 (4.6%) | 816 (7.0%) |
| 10 to 14 Years | 1,213 (9.6%) | 576 (5.0%) |
| 15 to 19 Years | 1,004 (7.9%) | 586 (5.1%) |
| 20 to 24 Years | 608 (4.8%) | 634 (5.5%) |
| 25 to 29 Years | 775 (6.1%) | 510 (4.4%) |
| 30 to 34 Years | 590 (4.7%) | 588 (5.1%) |
| 35 to 39 Years | 760 (6.0%) | 815 (7.0%) |
| 40 to 44 Years | 780 (6.2%) | 662 (5.7%) |
| 45 to 49 Years | 870 (6.9%) | 764 (6.6%) |
| 50 to 54 Years | 714 (5.7%) | 754 (6.5%) |
| 55 to 59 Years | 502 (4.0%) | 1,481 (12.8%) |
| 60 to 64 Years | 1,408 (11.1%) | 551 (4.8%) |
| 65 to 69 Years | 743 (5.9%) | 902 (7.8%) |
| 70 to 74 Years | 695 (5.5%) | 697 (6.0%) |
| 75 to 79 Years | 450 (3.6%) | 593 (5.1%) |
| 80 to 84 Years | 194 (1.5%) | 220 (1.9%) |
| 85 Years and over | 279 (2.2%) | 149 (1.3%) |
| Total | 12,648 (100.0%) | 11,600 (100.0%) |
Families and Households in Blaine County
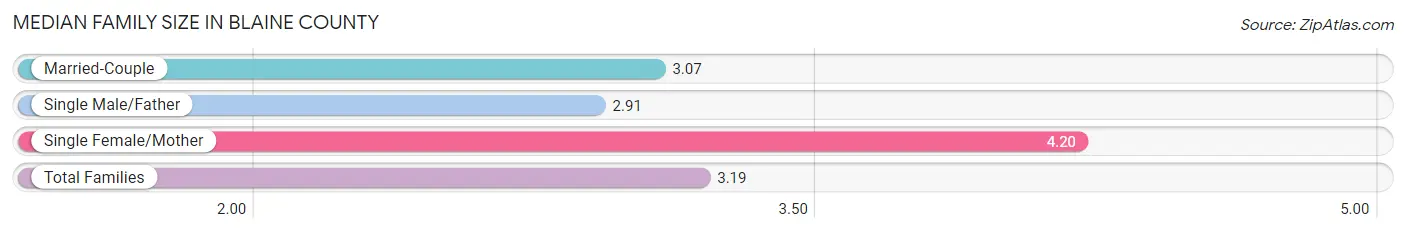
Median Family Size in Blaine County
The median family size in Blaine County is 3.19 persons per family, with single female/mother families (663 | 10.9%) accounting for the largest median family size of 4.2 persons per family. On the other hand, single male/father families (338 | 5.5%) represent the smallest median family size with 2.91 persons per family.
| Family Type | # Families | Family Size |
| Married-Couple | 5,097 (83.6%) | 3.07 |
| Single Male/Father | 338 (5.5%) | 2.91 |
| Single Female/Mother | 663 (10.9%) | 4.20 |
| Total Families | 6,098 (100.0%) | 3.19 |
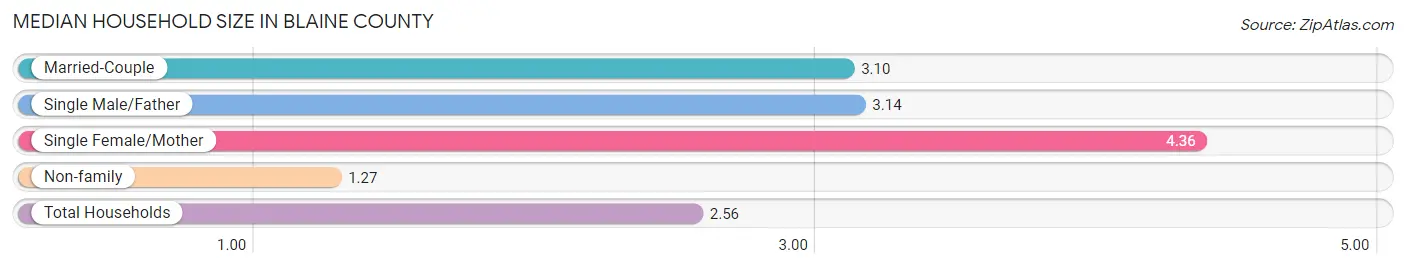
Median Household Size in Blaine County
The median household size in Blaine County is 2.56 persons per household, with single female/mother households (663 | 7.1%) accounting for the largest median household size of 4.36 persons per household. non-family households (3,200 | 34.4%) represent the smallest median household size with 1.27 persons per household.
| Household Type | # Households | Household Size |
| Married-Couple | 5,097 (54.8%) | 3.10 |
| Single Male/Father | 338 (3.6%) | 3.14 |
| Single Female/Mother | 663 (7.1%) | 4.36 |
| Non-family | 3,200 (34.4%) | 1.27 |
| Total Households | 9,298 (100.0%) | 2.56 |
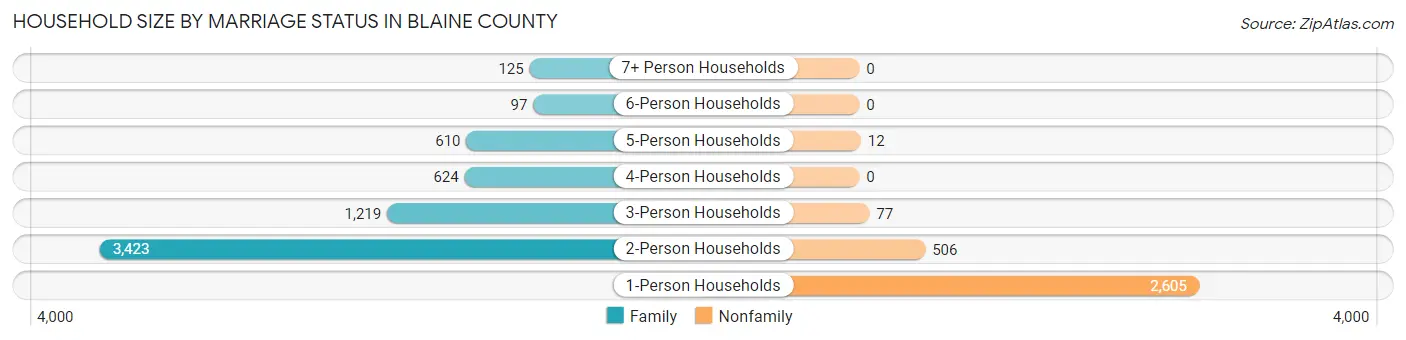
Household Size by Marriage Status in Blaine County
Out of a total of 9,298 households in Blaine County, 6,098 (65.6%) are family households, while 3,200 (34.4%) are nonfamily households. The most numerous type of family households are 2-person households, comprising 3,423, and the most common type of nonfamily households are 1-person households, comprising 2,605.
| Household Size | Family Households | Nonfamily Households |
| 1-Person Households | - | 2,605 (28.0%) |
| 2-Person Households | 3,423 (36.8%) | 506 (5.4%) |
| 3-Person Households | 1,219 (13.1%) | 77 (0.8%) |
| 4-Person Households | 624 (6.7%) | 0 (0.0%) |
| 5-Person Households | 610 (6.6%) | 12 (0.1%) |
| 6-Person Households | 97 (1.0%) | 0 (0.0%) |
| 7+ Person Households | 125 (1.3%) | 0 (0.0%) |
| Total | 6,098 (65.6%) | 3,200 (34.4%) |
Female Fertility in Blaine County
Fertility by Age in Blaine County
Average fertility rate in Blaine County is 56.0 births per 1,000 women. Women in the age bracket of 15 to 19 years have the highest fertility rate with 80.0 births per 1,000 women. Women in the age bracket of 20 to 34 years acount for 45.3% of all women with births.
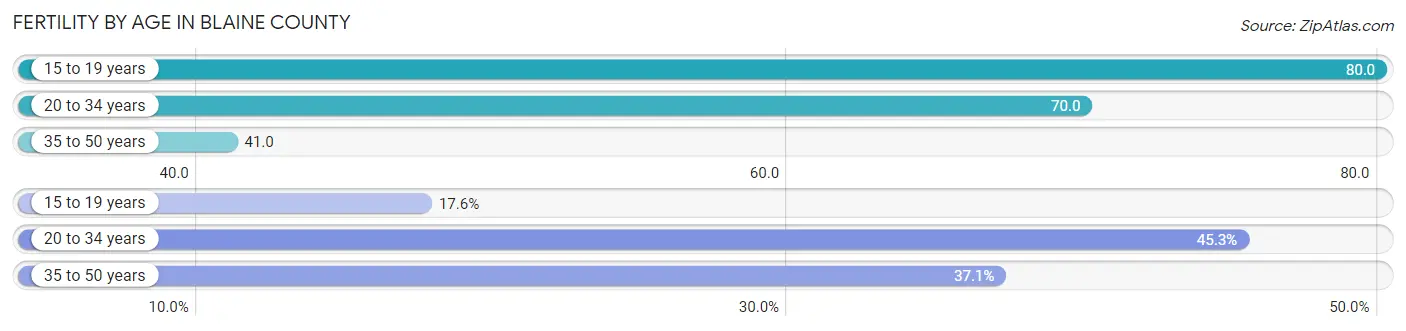
| Age Bracket | Women with Births | Births / 1,000 Women |
| 15 to 19 years | 47 (17.6%) | 80.0 |
| 20 to 34 years | 121 (45.3%) | 70.0 |
| 35 to 50 years | 99 (37.1%) | 41.0 |
| Total | 267 (100.0%) | 56.0 |
Fertility by Age by Marriage Status in Blaine County
82.4% of women with births (267) in Blaine County are married. The highest percentage of unmarried women with births falls into 15 to 19 years age bracket with 100.0% of them unmarried at the time of birth, while the lowest percentage of unmarried women with births belong to 20 to 34 years age bracket with 0.0% of them unmarried.
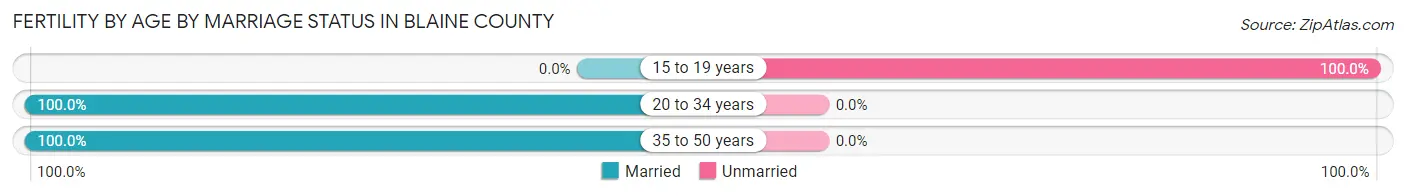
| Age Bracket | Married | Unmarried |
| 15 to 19 years | 0 (0.0%) | 47 (100.0%) |
| 20 to 34 years | 121 (100.0%) | 0 (0.0%) |
| 35 to 50 years | 99 (100.0%) | 0 (0.0%) |
| Total | 220 (82.4%) | 47 (17.6%) |
Fertility by Education in Blaine County
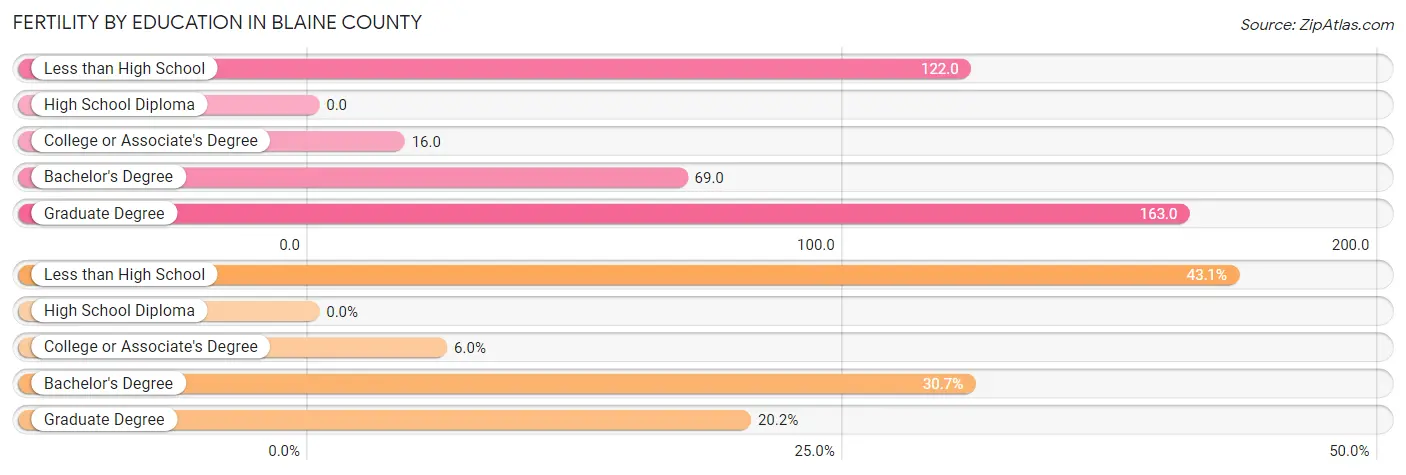
| Educational Attainment | Women with Births | Births / 1,000 Women |
| Less than High School | 115 (43.1%) | 122.0 |
| High School Diploma | 0 (0.0%) | 0.0 |
| College or Associate's Degree | 16 (6.0%) | 16.0 |
| Bachelor's Degree | 82 (30.7%) | 69.0 |
| Graduate Degree | 54 (20.2%) | 163.0 |
| Total | 267 (100.0%) | 56.0 |
Fertility by Education by Marriage Status in Blaine County
17.6% of women with births in Blaine County are unmarried. Women with the educational attainment of college or associate's degree are most likely to be married with 100.0% of them married at childbirth, while women with the educational attainment of less than high school are least likely to be married with 40.9% of them unmarried at childbirth.
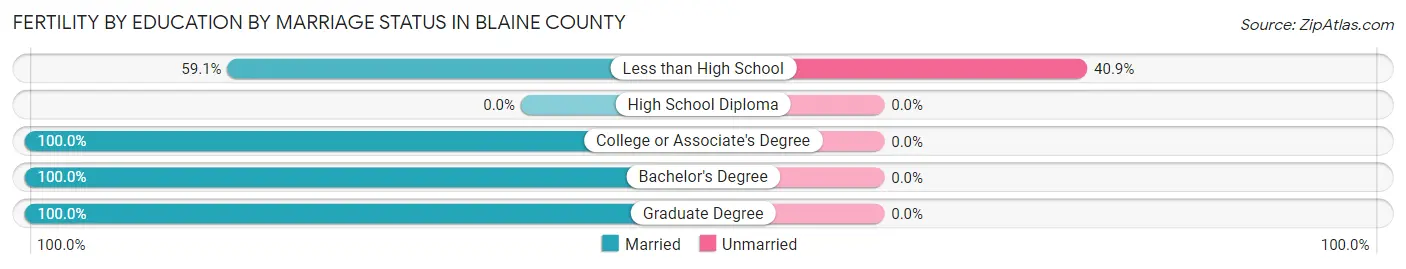
| Educational Attainment | Married | Unmarried |
| Less than High School | 68 (59.1%) | 47 (40.9%) |
| High School Diploma | 0 (0.0%) | 0 (0.0%) |
| College or Associate's Degree | 16 (100.0%) | 0 (0.0%) |
| Bachelor's Degree | 82 (100.0%) | 0 (0.0%) |
| Graduate Degree | 54 (100.0%) | 0 (0.0%) |
| Total | 220 (82.4%) | 47 (17.6%) |
Income in Blaine County
Income Overview in Blaine County
Per Capita Income in Blaine County is $47,151, while median incomes of families and households are $87,544 and $81,794 respectively.
| Characteristic | Number | Measure |
| Per Capita Income | 24,248 | $47,151 |
| Median Family Income | 6,098 | $87,544 |
| Mean Family Income | 6,098 | $119,956 |
| Median Household Income | 9,298 | $81,794 |
| Mean Household Income | 9,298 | $115,132 |
| Income Deficit | 6,098 | $0 |
| Wage / Income Gap (%) | 24,248 | 12.69% |
| Wage / Income Gap ($) | 24,248 | 87.31¢ per $1 |
| Gini / Inequality Index | 24,248 | 0.46 |
Earnings by Sex in Blaine County
Average Earnings in Blaine County are $36,789, $39,209 for men and $34,234 for women, a difference of 12.7%.
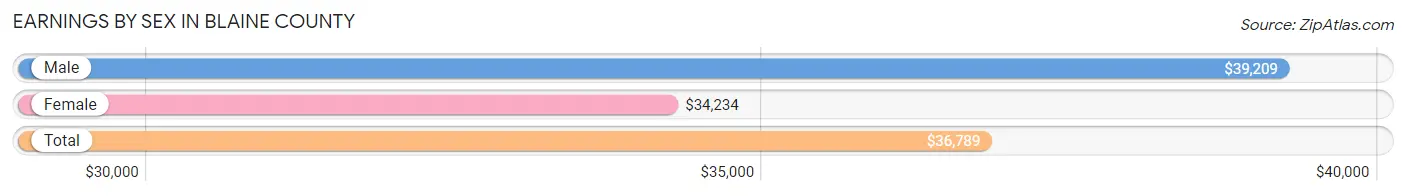
| Sex | Number | Average Earnings |
| Male | 8,116 (56.2%) | $39,209 |
| Female | 6,321 (43.8%) | $34,234 |
| Total | 14,437 (100.0%) | $36,789 |
Earnings by Sex by Income Bracket in Blaine County
The most common earnings brackets in Blaine County are $100,000+ for men (941 | 11.6%) and $30,000 to $34,999 for women (631 | 10.0%).
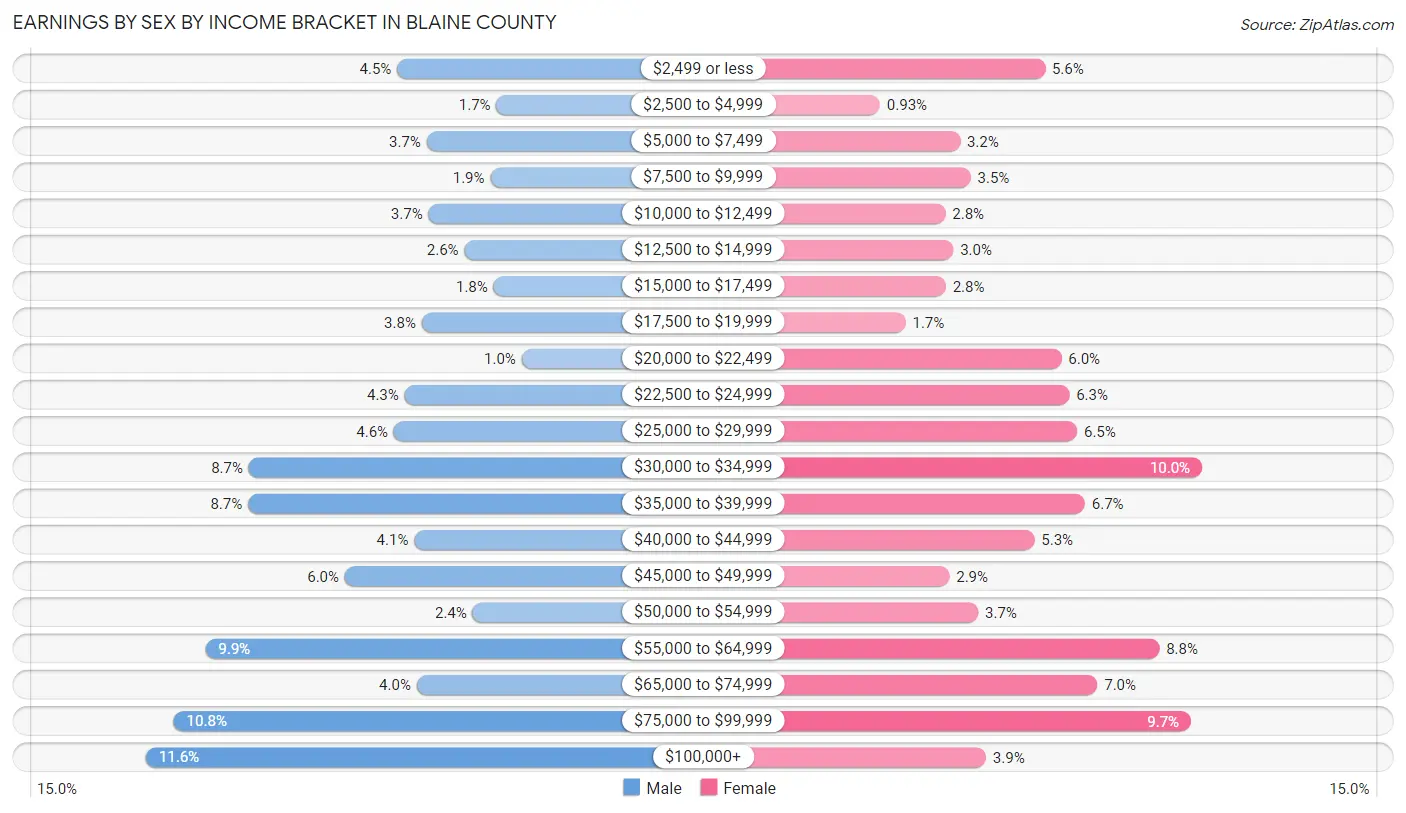
| Income | Male | Female |
| $2,499 or less | 368 (4.5%) | 352 (5.6%) |
| $2,500 to $4,999 | 141 (1.7%) | 59 (0.9%) |
| $5,000 to $7,499 | 300 (3.7%) | 201 (3.2%) |
| $7,500 to $9,999 | 155 (1.9%) | 220 (3.5%) |
| $10,000 to $12,499 | 296 (3.6%) | 175 (2.8%) |
| $12,500 to $14,999 | 214 (2.6%) | 189 (3.0%) |
| $15,000 to $17,499 | 148 (1.8%) | 176 (2.8%) |
| $17,500 to $19,999 | 312 (3.8%) | 104 (1.7%) |
| $20,000 to $22,499 | 84 (1.0%) | 381 (6.0%) |
| $22,500 to $24,999 | 351 (4.3%) | 395 (6.2%) |
| $25,000 to $29,999 | 375 (4.6%) | 409 (6.5%) |
| $30,000 to $34,999 | 706 (8.7%) | 631 (10.0%) |
| $35,000 to $39,999 | 708 (8.7%) | 423 (6.7%) |
| $40,000 to $44,999 | 329 (4.1%) | 333 (5.3%) |
| $45,000 to $49,999 | 487 (6.0%) | 182 (2.9%) |
| $50,000 to $54,999 | 196 (2.4%) | 233 (3.7%) |
| $55,000 to $64,999 | 805 (9.9%) | 555 (8.8%) |
| $65,000 to $74,999 | 323 (4.0%) | 445 (7.0%) |
| $75,000 to $99,999 | 877 (10.8%) | 611 (9.7%) |
| $100,000+ | 941 (11.6%) | 247 (3.9%) |
| Total | 8,116 (100.0%) | 6,321 (100.0%) |
Earnings by Sex by Educational Attainment in Blaine County
Average earnings in Blaine County are $45,332 for men and $36,071 for women, a difference of 20.4%. Men with an educational attainment of graduate degree enjoy the highest average annual earnings of $89,760, while those with less than high school education earn the least with $29,538. Women with an educational attainment of bachelor's degree earn the most with the average annual earnings of $52,292, while those with less than high school education have the smallest earnings of $11,908.
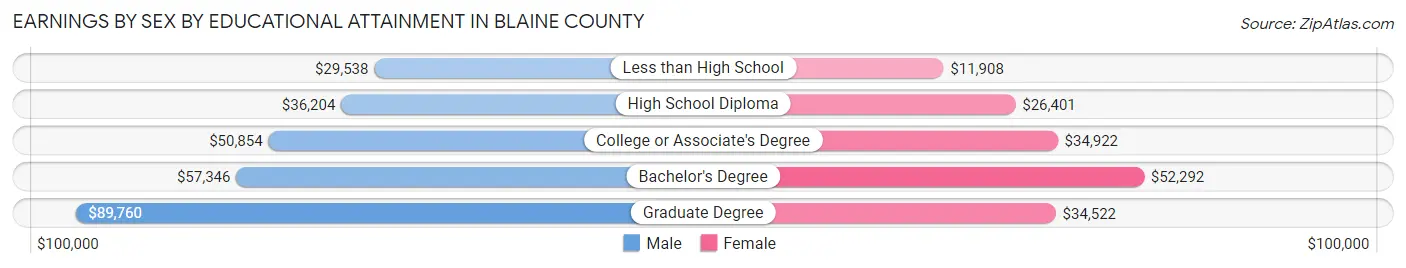
| Educational Attainment | Male Income | Female Income |
| Less than High School | $29,538 | $11,908 |
| High School Diploma | $36,204 | $26,401 |
| College or Associate's Degree | $50,854 | $34,922 |
| Bachelor's Degree | $57,346 | $52,292 |
| Graduate Degree | $89,760 | $34,522 |
| Total | $45,332 | $36,071 |
Family Income in Blaine County
Family Income Brackets in Blaine County
According to the Blaine County family income data, there are 1,348 families falling into the $75,000 to $99,999 income range, which is the most common income bracket and makes up 22.1% of all families. Conversely, the less than $10,000 income bracket is the least frequent group with only 24 families (0.4%) belonging to this category.
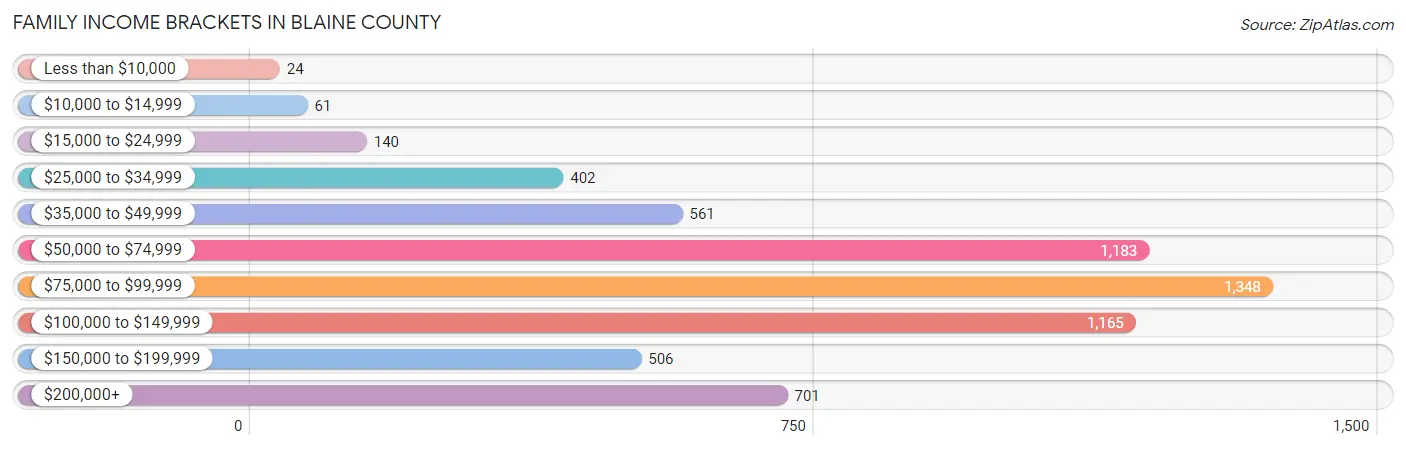
| Income Bracket | # Families | % Families |
| Less than $10,000 | 24 | 0.4% |
| $10,000 to $14,999 | 61 | 1.0% |
| $15,000 to $24,999 | 140 | 2.3% |
| $25,000 to $34,999 | 402 | 6.6% |
| $35,000 to $49,999 | 561 | 9.2% |
| $50,000 to $74,999 | 1,183 | 19.4% |
| $75,000 to $99,999 | 1,348 | 22.1% |
| $100,000 to $149,999 | 1,165 | 19.1% |
| $150,000 to $199,999 | 506 | 8.3% |
| $200,000+ | 701 | 11.5% |
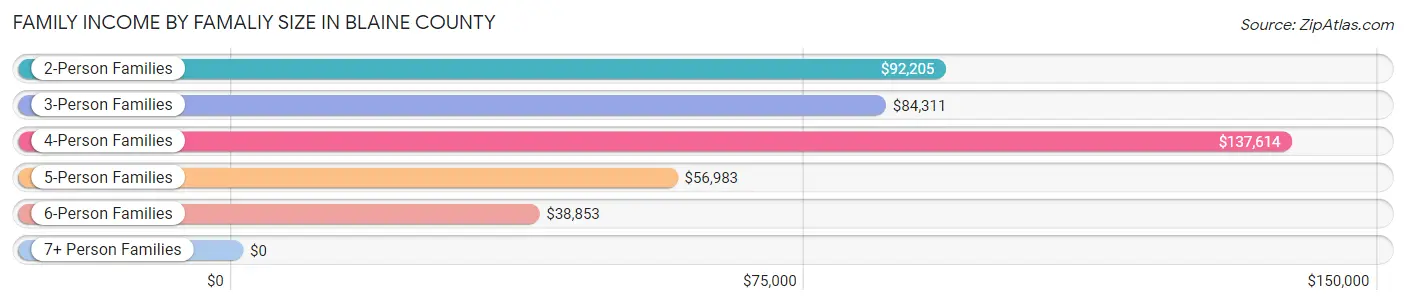
Family Income by Famaliy Size in Blaine County
4-person families (625 | 10.2%) account for the highest median family income in Blaine County with $137,614 per family, while 2-person families (3,447 | 56.5%) have the highest median income of $46,102 per family member.
| Income Bracket | # Families | Median Income |
| 2-Person Families | 3,447 (56.5%) | $92,205 |
| 3-Person Families | 1,263 (20.7%) | $84,311 |
| 4-Person Families | 625 (10.2%) | $137,614 |
| 5-Person Families | 551 (9.0%) | $56,983 |
| 6-Person Families | 92 (1.5%) | $38,853 |
| 7+ Person Families | 120 (2.0%) | $0 |
| Total | 6,098 (100.0%) | $87,544 |
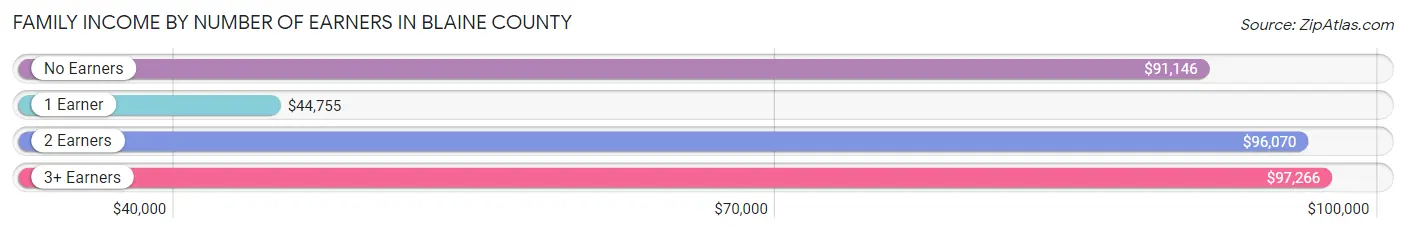
Family Income by Number of Earners in Blaine County
The median family income in Blaine County is $87,544, with families comprising 3+ earners (583) having the highest median family income of $97,266, while families with 1 earner (1,582) have the lowest median family income of $44,755, accounting for 9.6% and 25.9% of families, respectively.
| Number of Earners | # Families | Median Income |
| No Earners | 760 (12.5%) | $91,146 |
| 1 Earner | 1,582 (25.9%) | $44,755 |
| 2 Earners | 3,173 (52.0%) | $96,070 |
| 3+ Earners | 583 (9.6%) | $97,266 |
| Total | 6,098 (100.0%) | $87,544 |
Household Income in Blaine County
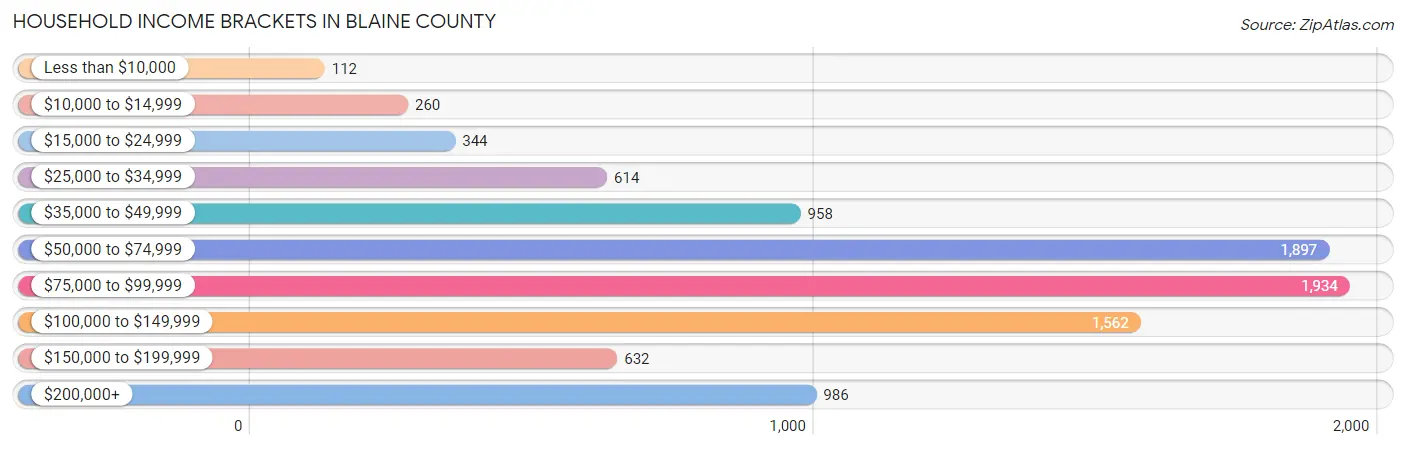
Household Income Brackets in Blaine County
With 1,934 households falling in the category, the $75,000 to $99,999 income range is the most frequent in Blaine County, accounting for 20.8% of all households. In contrast, only 112 households (1.2%) fall into the less than $10,000 income bracket, making it the least populous group.
| Income Bracket | # Households | % Households |
| Less than $10,000 | 112 | 1.2% |
| $10,000 to $14,999 | 260 | 2.8% |
| $15,000 to $24,999 | 344 | 3.7% |
| $25,000 to $34,999 | 614 | 6.6% |
| $35,000 to $49,999 | 958 | 10.3% |
| $50,000 to $74,999 | 1,897 | 20.4% |
| $75,000 to $99,999 | 1,934 | 20.8% |
| $100,000 to $149,999 | 1,562 | 16.8% |
| $150,000 to $199,999 | 632 | 6.8% |
| $200,000+ | 986 | 10.6% |
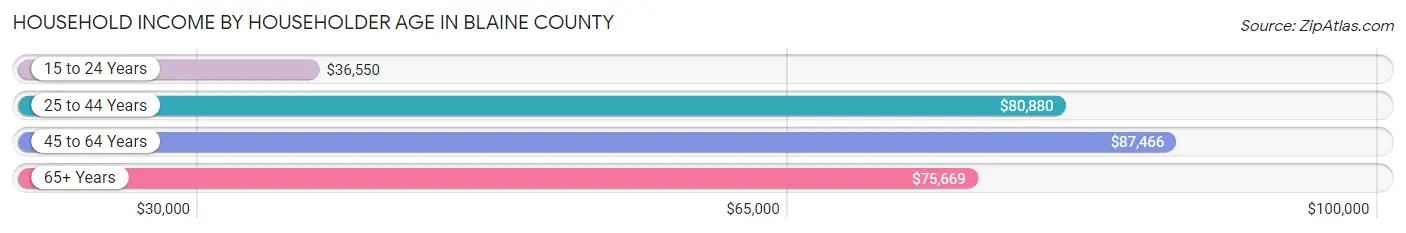
Household Income by Householder Age in Blaine County
The median household income in Blaine County is $81,794, with the highest median household income of $87,466 found in the 45 to 64 years age bracket for the primary householder. A total of 3,932 households (42.3%) fall into this category. Meanwhile, the 15 to 24 years age bracket for the primary householder has the lowest median household income of $36,550, with 86 households (0.9%) in this group.
| Income Bracket | # Households | Median Income |
| 15 to 24 Years | 86 (0.9%) | $36,550 |
| 25 to 44 Years | 2,325 (25.0%) | $80,880 |
| 45 to 64 Years | 3,932 (42.3%) | $87,466 |
| 65+ Years | 2,955 (31.8%) | $75,669 |
| Total | 9,298 (100.0%) | $81,794 |
Poverty in Blaine County
Income Below Poverty by Sex and Age in Blaine County
With 6.7% poverty level for males and 7.2% for females among the residents of Blaine County, 5 year old males and 5 year old females are the most vulnerable to poverty, with 54 males (85.7%) and 70 females (69.3%) in their respective age groups living below the poverty level.
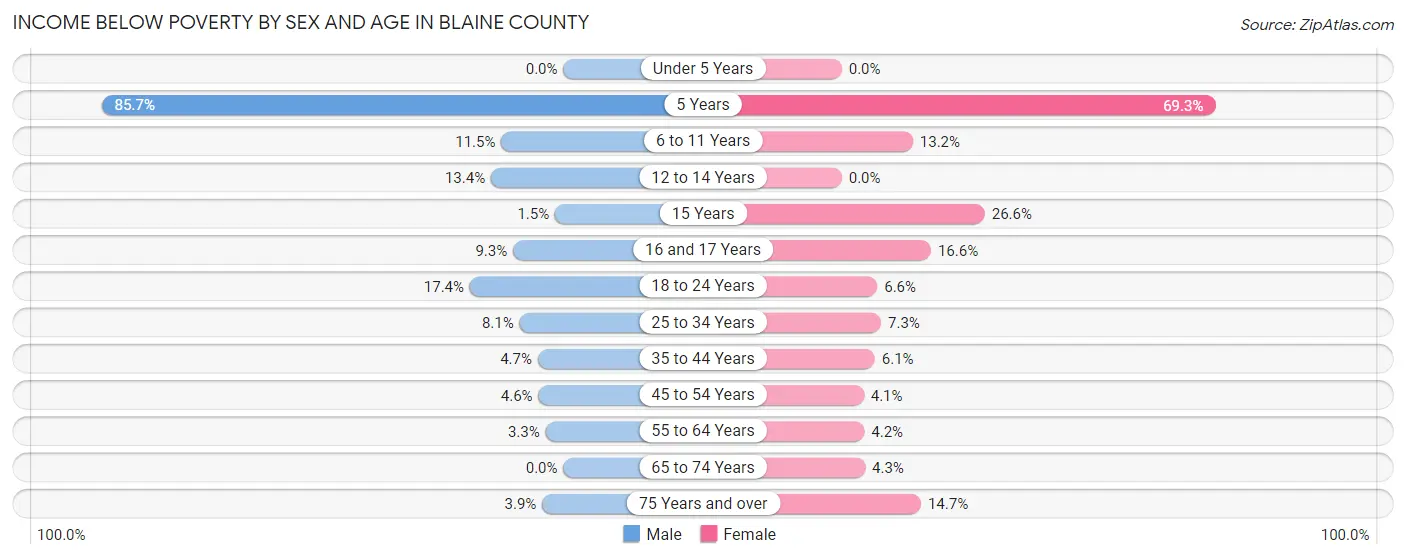
| Age Bracket | Male | Female |
| Under 5 Years | 0 (0.0%) | 0 (0.0%) |
| 5 Years | 54 (85.7%) | 70 (69.3%) |
| 6 to 11 Years | 94 (11.5%) | 112 (13.2%) |
| 12 to 14 Years | 123 (13.4%) | 0 (0.0%) |
| 15 Years | 3 (1.5%) | 47 (26.6%) |
| 16 and 17 Years | 42 (9.3%) | 27 (16.6%) |
| 18 to 24 Years | 166 (17.3%) | 58 (6.6%) |
| 25 to 34 Years | 111 (8.1%) | 80 (7.3%) |
| 35 to 44 Years | 73 (4.7%) | 90 (6.1%) |
| 45 to 54 Years | 73 (4.6%) | 62 (4.1%) |
| 55 to 64 Years | 63 (3.3%) | 85 (4.2%) |
| 65 to 74 Years | 0 (0.0%) | 69 (4.3%) |
| 75 Years and over | 36 (3.9%) | 136 (14.7%) |
| Total | 838 (6.7%) | 836 (7.2%) |
Income Above Poverty by Sex and Age in Blaine County
According to the poverty statistics in Blaine County, males aged under 5 years and females aged under 5 years are the age groups that are most secure financially, with 100.0% of males and 100.0% of females in these age groups living above the poverty line.
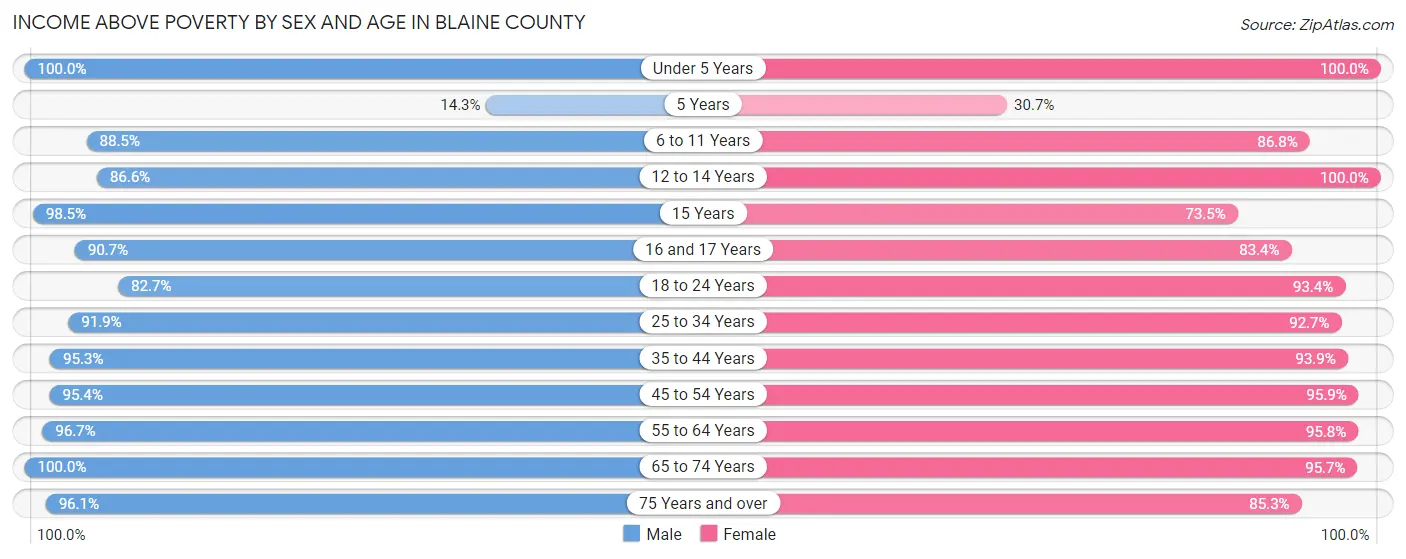
| Age Bracket | Male | Female |
| Under 5 Years | 471 (100.0%) | 297 (100.0%) |
| 5 Years | 9 (14.3%) | 31 (30.7%) |
| 6 to 11 Years | 722 (88.5%) | 737 (86.8%) |
| 12 to 14 Years | 793 (86.6%) | 442 (100.0%) |
| 15 Years | 192 (98.5%) | 130 (73.5%) |
| 16 and 17 Years | 408 (90.7%) | 136 (83.4%) |
| 18 to 24 Years | 791 (82.7%) | 822 (93.4%) |
| 25 to 34 Years | 1,254 (91.9%) | 1,018 (92.7%) |
| 35 to 44 Years | 1,467 (95.3%) | 1,379 (93.9%) |
| 45 to 54 Years | 1,504 (95.4%) | 1,456 (95.9%) |
| 55 to 64 Years | 1,844 (96.7%) | 1,947 (95.8%) |
| 65 to 74 Years | 1,431 (100.0%) | 1,530 (95.7%) |
| 75 Years and over | 879 (96.1%) | 789 (85.3%) |
| Total | 11,765 (93.3%) | 10,714 (92.8%) |
Income Below Poverty Among Married-Couple Families in Blaine County
The poverty statistics for married-couple families in Blaine County show that 1.9% or 96 of the total 5,097 families live below the poverty line. Families with 1 or 2 children have the highest poverty rate of 3.4%, comprising of 34 families. On the other hand, families with 3 or 4 children have the lowest poverty rate of 0.0%, which includes 0 families.
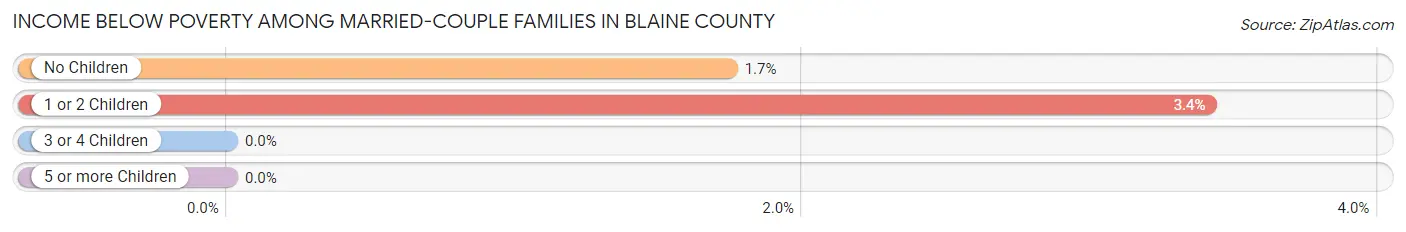
| Children | Above Poverty | Below Poverty |
| No Children | 3,499 (98.3%) | 62 (1.7%) |
| 1 or 2 Children | 963 (96.6%) | 34 (3.4%) |
| 3 or 4 Children | 473 (100.0%) | 0 (0.0%) |
| 5 or more Children | 66 (100.0%) | 0 (0.0%) |
| Total | 5,001 (98.1%) | 96 (1.9%) |
Income Below Poverty Among Single-Parent Households in Blaine County
According to the poverty data in Blaine County, 16.6% or 56 single-father households and 14.0% or 93 single-mother households are living below the poverty line. Among single-father households, those with 3 or 4 children have the highest poverty rate, with 46 households (90.2%) experiencing poverty. Likewise, among single-mother households, those with 3 or 4 children have the highest poverty rate, with 6 households (37.5%) falling below the poverty line.

| Children | Single Father | Single Mother |
| No Children | 0 (0.0%) | 0 (0.0%) |
| 1 or 2 Children | 10 (5.3%) | 87 (16.5%) |
| 3 or 4 Children | 46 (90.2%) | 6 (37.5%) |
| 5 or more Children | 0 (0.0%) | 0 (0.0%) |
| Total | 56 (16.6%) | 93 (14.0%) |
Income Below Poverty Among Married-Couple vs Single-Parent Households in Blaine County
The poverty data for Blaine County shows that 96 of the married-couple family households (1.9%) and 149 of the single-parent households (14.9%) are living below the poverty level. Within the married-couple family households, those with 1 or 2 children have the highest poverty rate, with 34 households (3.4%) falling below the poverty line. Among the single-parent households, those with 3 or 4 children have the highest poverty rate, with 52 household (77.6%) living below poverty.
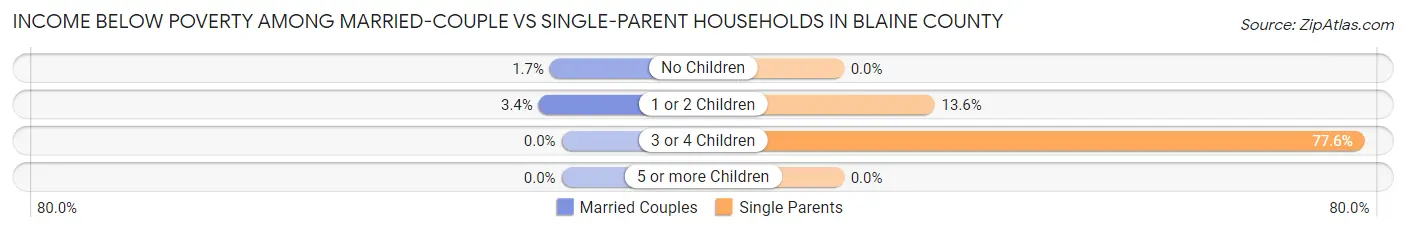
| Children | Married-Couple Families | Single-Parent Households |
| No Children | 62 (1.7%) | 0 (0.0%) |
| 1 or 2 Children | 34 (3.4%) | 97 (13.6%) |
| 3 or 4 Children | 0 (0.0%) | 52 (77.6%) |
| 5 or more Children | 0 (0.0%) | 0 (0.0%) |
| Total | 96 (1.9%) | 149 (14.9%) |
Employment Characteristics in Blaine County
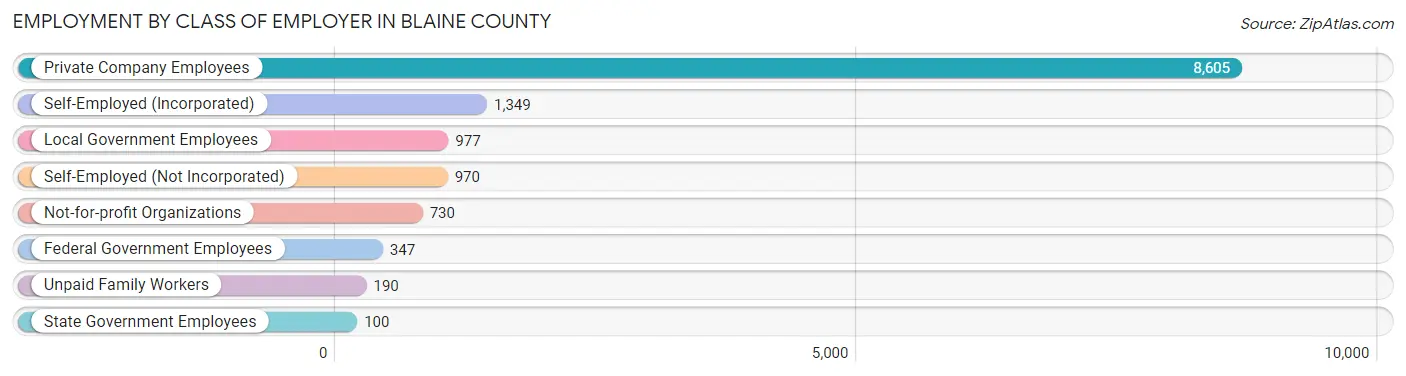
Employment by Class of Employer in Blaine County
Among the 13,268 employed individuals in Blaine County, private company employees (8,605 | 64.9%), self-employed (incorporated) (1,349 | 10.2%), and local government employees (977 | 7.4%) make up the most common classes of employment.
| Employer Class | # Employees | % Employees |
| Private Company Employees | 8,605 | 64.9% |
| Self-Employed (Incorporated) | 1,349 | 10.2% |
| Self-Employed (Not Incorporated) | 970 | 7.3% |
| Not-for-profit Organizations | 730 | 5.5% |
| Local Government Employees | 977 | 7.4% |
| State Government Employees | 100 | 0.7% |
| Federal Government Employees | 347 | 2.6% |
| Unpaid Family Workers | 190 | 1.4% |
| Total | 13,268 | 100.0% |
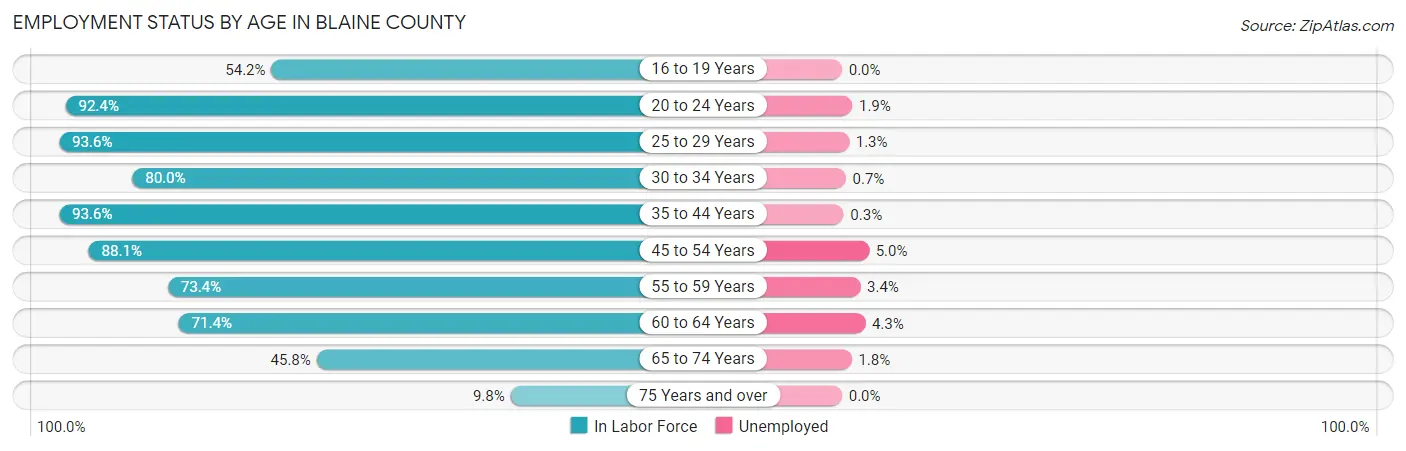
Employment Status by Age in Blaine County
According to the labor force statistics for Blaine County, out of the total population over 16 years of age (19,906), 70.0% or 13,934 individuals are in the labor force, with 2.3% or 320 of them unemployed. The age group with the highest labor force participation rate is 25 to 29 years, with 93.6% or 1,203 individuals in the labor force. Within the labor force, the 45 to 54 years age range has the highest percentage of unemployed individuals, with 5.0% or 137 of them being unemployed.
| Age Bracket | In Labor Force | Unemployed |
| 16 to 19 Years | 660 (54.2%) | 0 (0.0%) |
| 20 to 24 Years | 1,148 (92.4%) | 22 (1.9%) |
| 25 to 29 Years | 1,203 (93.6%) | 16 (1.3%) |
| 30 to 34 Years | 942 (80.0%) | 7 (0.7%) |
| 35 to 44 Years | 2,824 (93.6%) | 8 (0.3%) |
| 45 to 54 Years | 2,733 (88.1%) | 137 (5.0%) |
| 55 to 59 Years | 1,456 (73.4%) | 50 (3.4%) |
| 60 to 64 Years | 1,399 (71.4%) | 60 (4.3%) |
| 65 to 74 Years | 1,391 (45.8%) | 25 (1.8%) |
| 75 Years and over | 185 (9.8%) | 0 (0.0%) |
| Total | 13,934 (70.0%) | 320 (2.3%) |
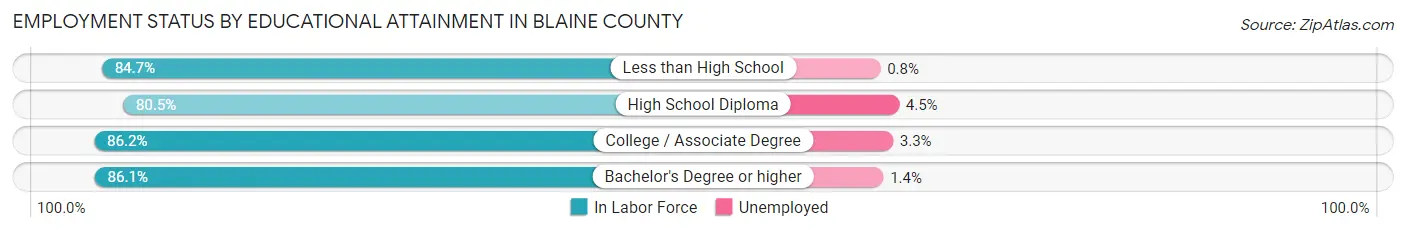
Employment Status by Educational Attainment in Blaine County
According to labor force statistics for Blaine County, 84.3% of individuals (10,558) out of the total population between 25 and 64 years of age (12,524) are in the labor force, with 2.6% or 275 of them being unemployed. The group with the highest labor force participation rate are those with the educational attainment of college / associate degree, with 86.2% or 2,278 individuals in the labor force. Within the labor force, individuals with high school diploma education have the highest percentage of unemployment, with 4.5% or 135 of them being unemployed.
| Educational Attainment | In Labor Force | Unemployed |
| Less than High School | 1,077 (84.7%) | 10 (0.8%) |
| High School Diploma | 2,994 (80.5%) | 167 (4.5%) |
| College / Associate Degree | 2,278 (86.2%) | 87 (3.3%) |
| Bachelor's Degree or higher | 4,211 (86.1%) | 68 (1.4%) |
| Total | 10,558 (84.3%) | 326 (2.6%) |
Employment Occupations by Sex in Blaine County
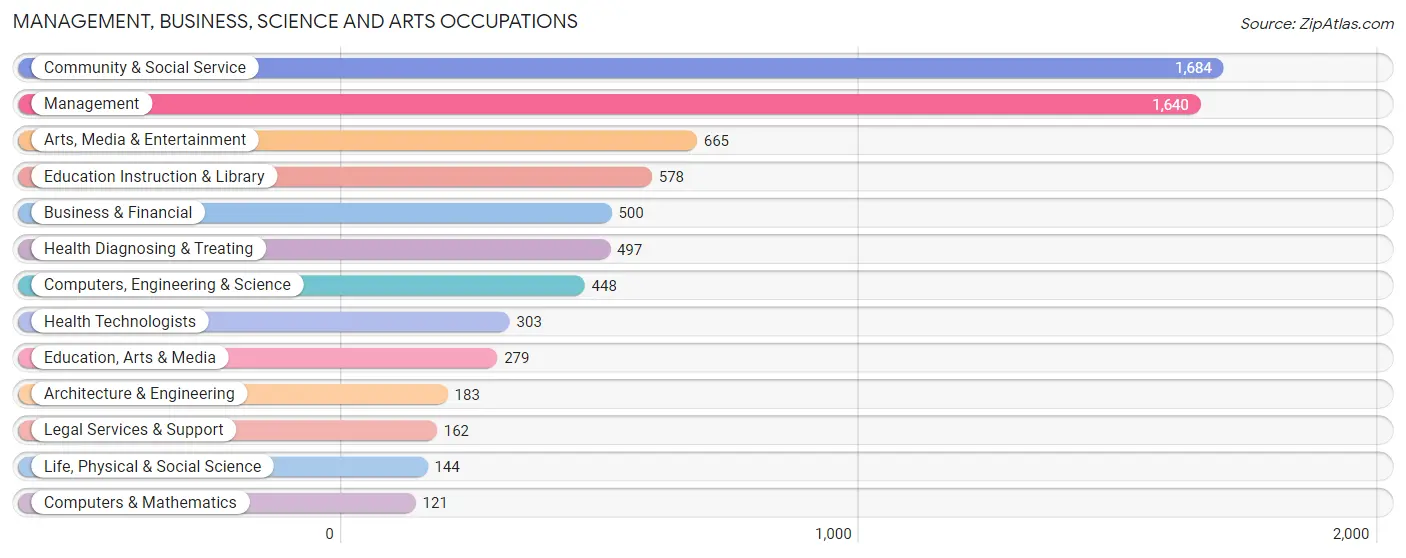
Management, Business, Science and Arts Occupations
The most common Management, Business, Science and Arts occupations in Blaine County are Community & Social Service (1,684 | 12.4%), Management (1,640 | 12.0%), Arts, Media & Entertainment (665 | 4.9%), Education Instruction & Library (578 | 4.3%), and Business & Financial (500 | 3.7%).
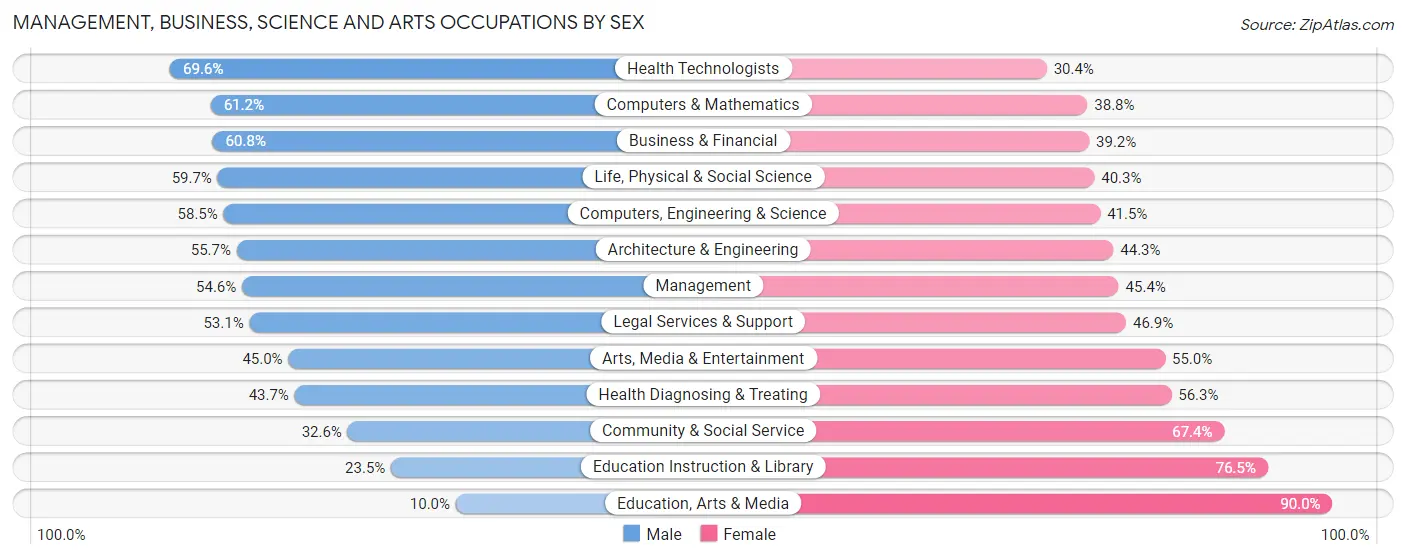
Management, Business, Science and Arts Occupations by Sex
Within the Management, Business, Science and Arts occupations in Blaine County, the most male-oriented occupations are Health Technologists (69.6%), Computers & Mathematics (61.2%), and Business & Financial (60.8%), while the most female-oriented occupations are Education, Arts & Media (90.0%), Education Instruction & Library (76.5%), and Community & Social Service (67.4%).
| Occupation | Male | Female |
| Management | 896 (54.6%) | 744 (45.4%) |
| Business & Financial | 304 (60.8%) | 196 (39.2%) |
| Computers, Engineering & Science | 262 (58.5%) | 186 (41.5%) |
| Computers & Mathematics | 74 (61.2%) | 47 (38.8%) |
| Architecture & Engineering | 102 (55.7%) | 81 (44.3%) |
| Life, Physical & Social Science | 86 (59.7%) | 58 (40.3%) |
| Community & Social Service | 549 (32.6%) | 1,135 (67.4%) |
| Education, Arts & Media | 28 (10.0%) | 251 (90.0%) |
| Legal Services & Support | 86 (53.1%) | 76 (46.9%) |
| Education Instruction & Library | 136 (23.5%) | 442 (76.5%) |
| Arts, Media & Entertainment | 299 (45.0%) | 366 (55.0%) |
| Health Diagnosing & Treating | 217 (43.7%) | 280 (56.3%) |
| Health Technologists | 211 (69.6%) | 92 (30.4%) |
| Total (Category) | 2,228 (46.7%) | 2,541 (53.3%) |
| Total (Overall) | 7,658 (56.2%) | 5,957 (43.8%) |
Services Occupations
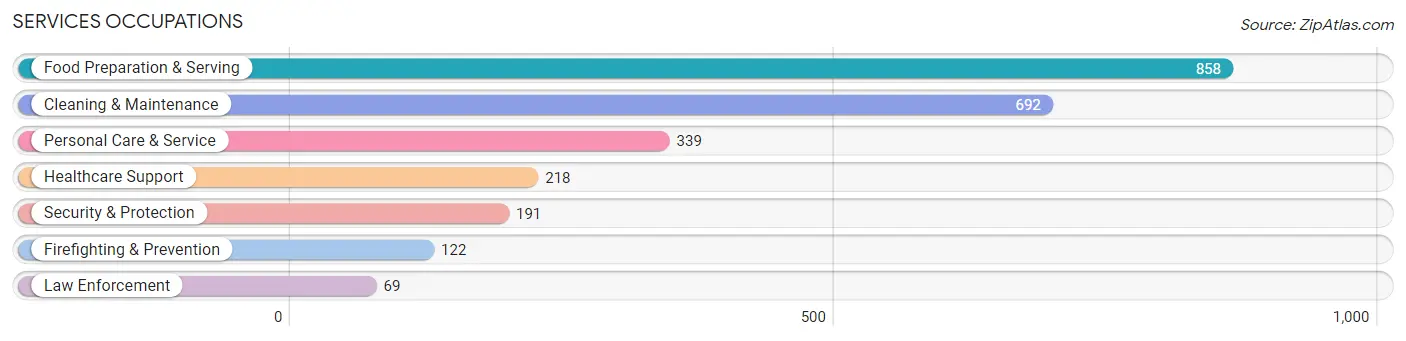
The most common Services occupations in Blaine County are Food Preparation & Serving (858 | 6.3%), Cleaning & Maintenance (692 | 5.1%), Personal Care & Service (339 | 2.5%), Healthcare Support (218 | 1.6%), and Security & Protection (191 | 1.4%).
Services Occupations by Sex
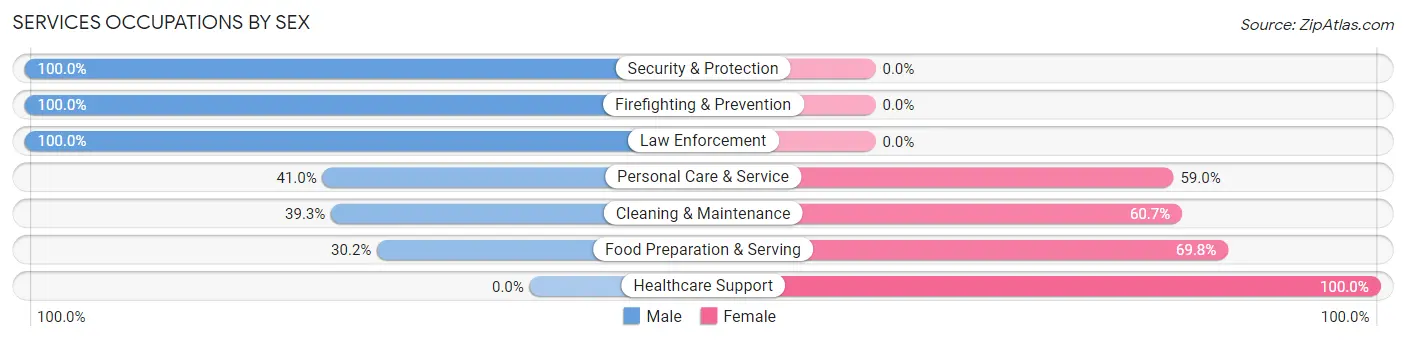
Within the Services occupations in Blaine County, the most male-oriented occupations are Security & Protection (100.0%), Firefighting & Prevention (100.0%), and Law Enforcement (100.0%), while the most female-oriented occupations are Healthcare Support (100.0%), Food Preparation & Serving (69.8%), and Cleaning & Maintenance (60.7%).
| Occupation | Male | Female |
| Healthcare Support | 0 (0.0%) | 218 (100.0%) |
| Security & Protection | 191 (100.0%) | 0 (0.0%) |
| Firefighting & Prevention | 122 (100.0%) | 0 (0.0%) |
| Law Enforcement | 69 (100.0%) | 0 (0.0%) |
| Food Preparation & Serving | 259 (30.2%) | 599 (69.8%) |
| Cleaning & Maintenance | 272 (39.3%) | 420 (60.7%) |
| Personal Care & Service | 139 (41.0%) | 200 (59.0%) |
| Total (Category) | 861 (37.5%) | 1,437 (62.5%) |
| Total (Overall) | 7,658 (56.2%) | 5,957 (43.8%) |
Sales and Office Occupations
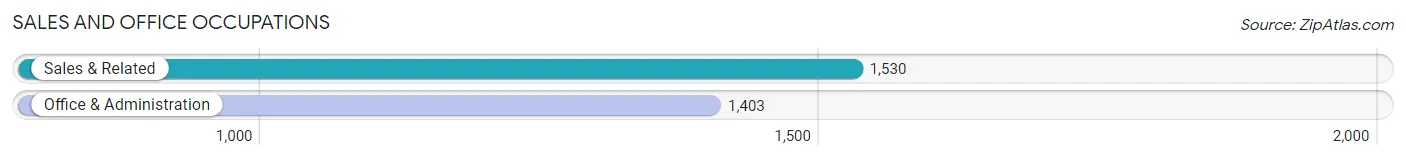
The most common Sales and Office occupations in Blaine County are Sales & Related (1,530 | 11.2%), and Office & Administration (1,403 | 10.3%).
Sales and Office Occupations by Sex
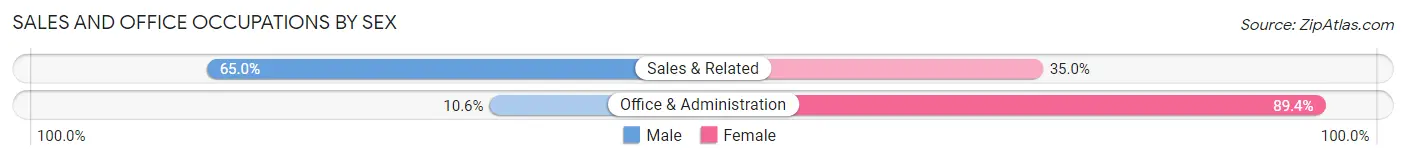
| Occupation | Male | Female |
| Sales & Related | 994 (65.0%) | 536 (35.0%) |
| Office & Administration | 149 (10.6%) | 1,254 (89.4%) |
| Total (Category) | 1,143 (39.0%) | 1,790 (61.0%) |
| Total (Overall) | 7,658 (56.2%) | 5,957 (43.8%) |
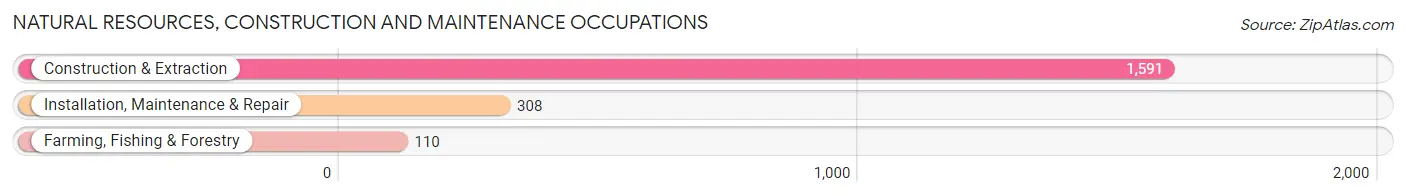
Natural Resources, Construction and Maintenance Occupations
The most common Natural Resources, Construction and Maintenance occupations in Blaine County are Construction & Extraction (1,591 | 11.7%), Installation, Maintenance & Repair (308 | 2.3%), and Farming, Fishing & Forestry (110 | 0.8%).
Natural Resources, Construction and Maintenance Occupations by Sex
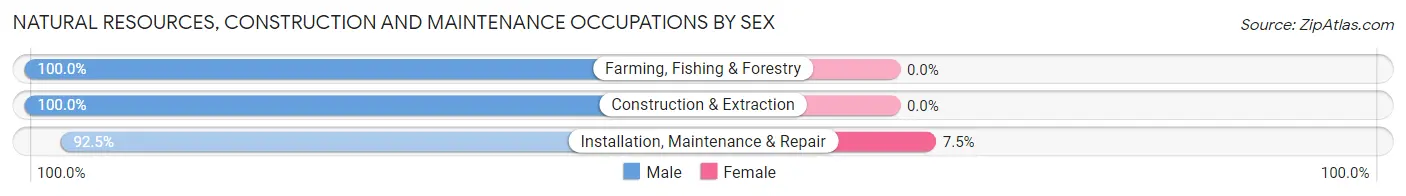
| Occupation | Male | Female |
| Farming, Fishing & Forestry | 110 (100.0%) | 0 (0.0%) |
| Construction & Extraction | 1,591 (100.0%) | 0 (0.0%) |
| Installation, Maintenance & Repair | 285 (92.5%) | 23 (7.5%) |
| Total (Category) | 1,986 (98.9%) | 23 (1.1%) |
| Total (Overall) | 7,658 (56.2%) | 5,957 (43.8%) |
Production, Transportation and Moving Occupations
The most common Production, Transportation and Moving occupations in Blaine County are Production (678 | 5.0%), Material Moving (671 | 4.9%), and Transportation (257 | 1.9%).
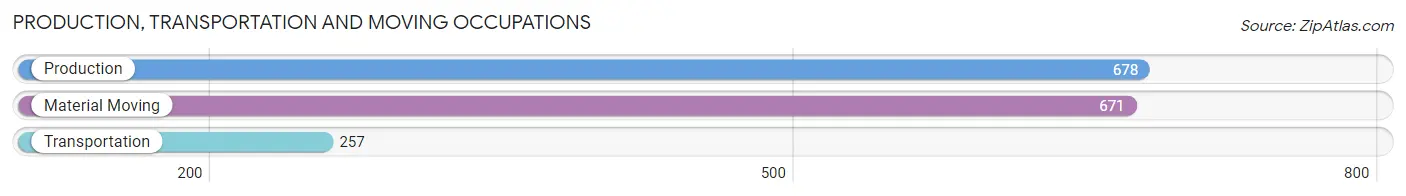
Production, Transportation and Moving Occupations by Sex
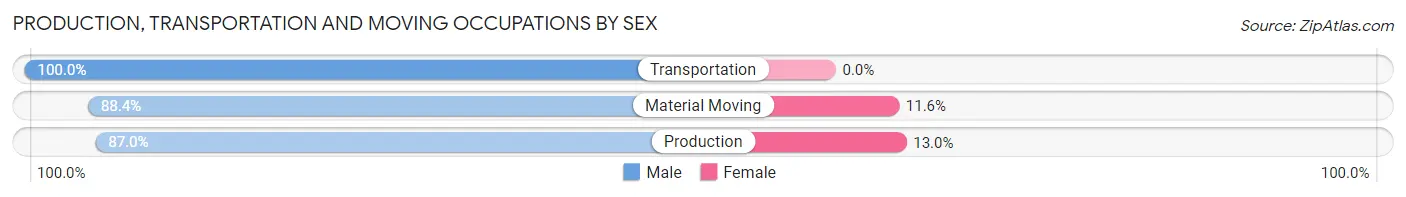
| Occupation | Male | Female |
| Production | 590 (87.0%) | 88 (13.0%) |
| Transportation | 257 (100.0%) | 0 (0.0%) |
| Material Moving | 593 (88.4%) | 78 (11.6%) |
| Total (Category) | 1,440 (89.7%) | 166 (10.3%) |
| Total (Overall) | 7,658 (56.2%) | 5,957 (43.8%) |
Employment Industries by Sex in Blaine County
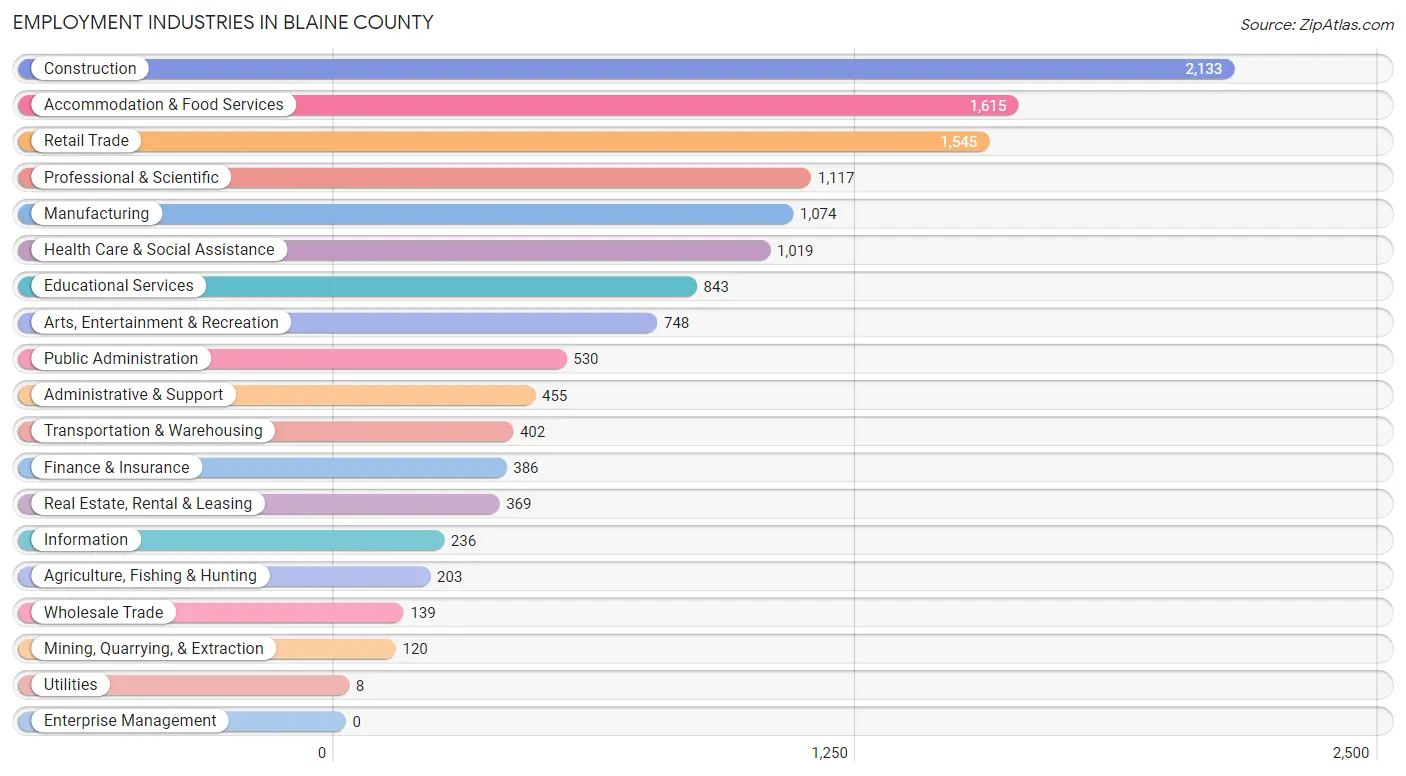
Employment Industries in Blaine County
The major employment industries in Blaine County include Construction (2,133 | 15.7%), Accommodation & Food Services (1,615 | 11.9%), Retail Trade (1,545 | 11.4%), Professional & Scientific (1,117 | 8.2%), and Manufacturing (1,074 | 7.9%).
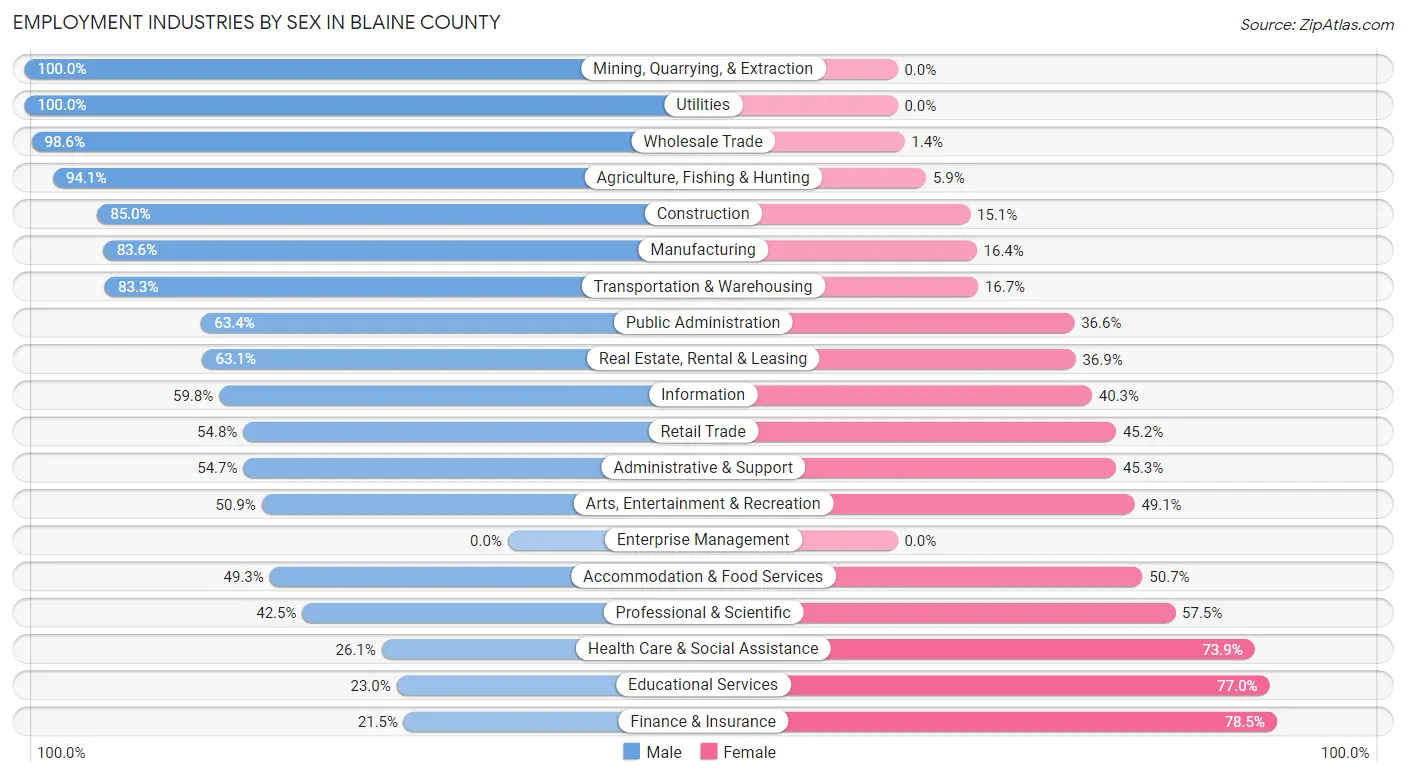
Employment Industries by Sex in Blaine County
The Blaine County industries that see more men than women are Mining, Quarrying, & Extraction (100.0%), Utilities (100.0%), and Wholesale Trade (98.6%), whereas the industries that tend to have a higher number of women are Finance & Insurance (78.5%), Educational Services (77.0%), and Health Care & Social Assistance (73.9%).
| Industry | Male | Female |
| Agriculture, Fishing & Hunting | 191 (94.1%) | 12 (5.9%) |
| Mining, Quarrying, & Extraction | 120 (100.0%) | 0 (0.0%) |
| Construction | 1,812 (85.0%) | 321 (15.0%) |
| Manufacturing | 898 (83.6%) | 176 (16.4%) |
| Wholesale Trade | 137 (98.6%) | 2 (1.4%) |
| Retail Trade | 846 (54.8%) | 699 (45.2%) |
| Transportation & Warehousing | 335 (83.3%) | 67 (16.7%) |
| Utilities | 8 (100.0%) | 0 (0.0%) |
| Information | 141 (59.8%) | 95 (40.3%) |
| Finance & Insurance | 83 (21.5%) | 303 (78.5%) |
| Real Estate, Rental & Leasing | 233 (63.1%) | 136 (36.9%) |
| Professional & Scientific | 475 (42.5%) | 642 (57.5%) |
| Enterprise Management | 0 (0.0%) | 0 (0.0%) |
| Administrative & Support | 249 (54.7%) | 206 (45.3%) |
| Educational Services | 194 (23.0%) | 649 (77.0%) |
| Health Care & Social Assistance | 266 (26.1%) | 753 (73.9%) |
| Arts, Entertainment & Recreation | 381 (50.9%) | 367 (49.1%) |
| Accommodation & Food Services | 796 (49.3%) | 819 (50.7%) |
| Public Administration | 336 (63.4%) | 194 (36.6%) |
| Total | 7,658 (56.2%) | 5,957 (43.8%) |
Education in Blaine County
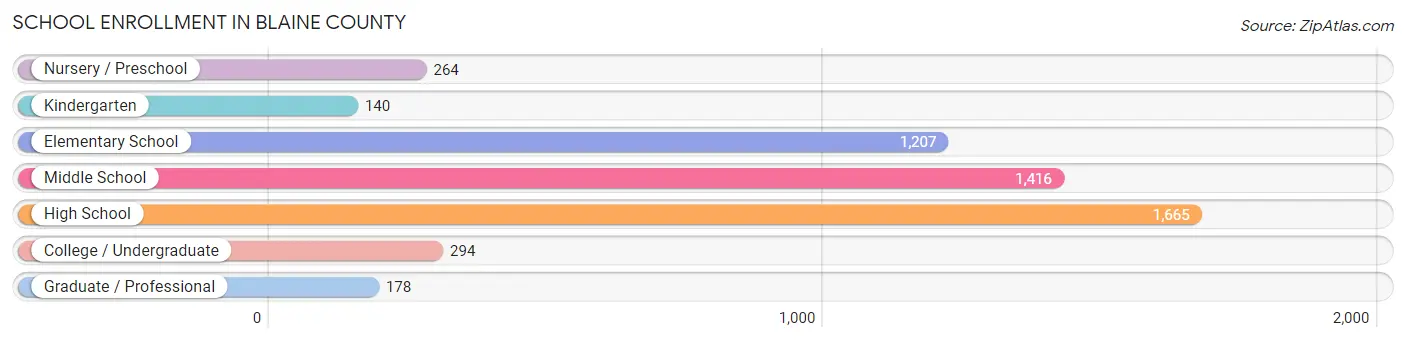
School Enrollment in Blaine County
The most common levels of schooling among the 5,164 students in Blaine County are high school (1,665 | 32.2%), middle school (1,416 | 27.4%), and elementary school (1,207 | 23.4%).
| School Level | # Students | % Students |
| Nursery / Preschool | 264 | 5.1% |
| Kindergarten | 140 | 2.7% |
| Elementary School | 1,207 | 23.4% |
| Middle School | 1,416 | 27.4% |
| High School | 1,665 | 32.2% |
| College / Undergraduate | 294 | 5.7% |
| Graduate / Professional | 178 | 3.5% |
| Total | 5,164 | 100.0% |
School Enrollment by Age by Funding Source in Blaine County
Out of a total of 5,164 students who are enrolled in schools in Blaine County, 1,126 (21.8%) attend a private institution, while the remaining 4,038 (78.2%) are enrolled in public schools. The age group of 25 to 34 year olds has the highest likelihood of being enrolled in private schools, with 92 (77.3% in the age bracket) enrolled. Conversely, the age group of 5 to 9 year old has the lowest likelihood of being enrolled in a private school, with 1,203 (86.0% in the age bracket) attending a public institution.
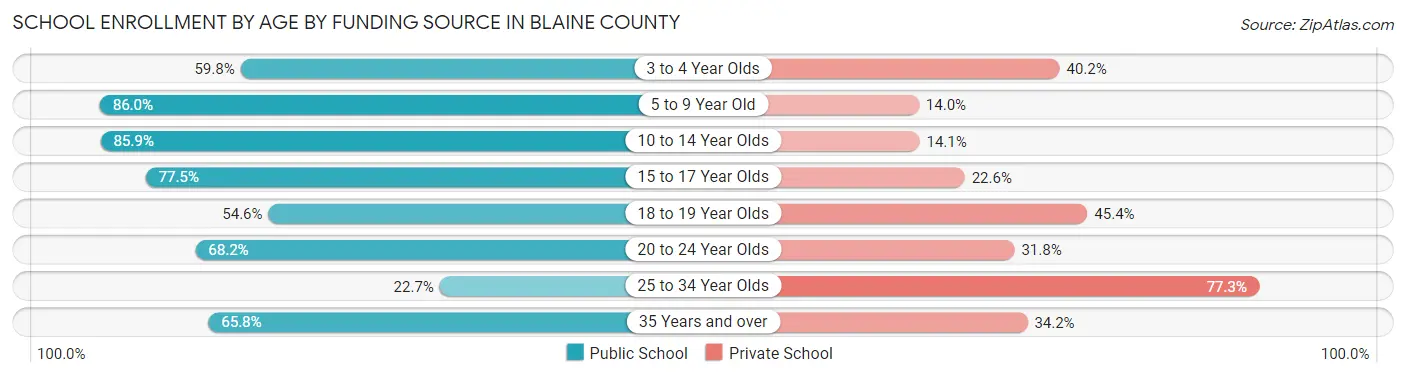
| Age Bracket | Public School | Private School |
| 3 to 4 Year Olds | 113 (59.8%) | 76 (40.2%) |
| 5 to 9 Year Old | 1,203 (86.0%) | 196 (14.0%) |
| 10 to 14 Year Olds | 1,536 (85.9%) | 253 (14.1%) |
| 15 to 17 Year Olds | 759 (77.4%) | 221 (22.6%) |
| 18 to 19 Year Olds | 267 (54.6%) | 222 (45.4%) |
| 20 to 24 Year Olds | 60 (68.2%) | 28 (31.8%) |
| 25 to 34 Year Olds | 27 (22.7%) | 92 (77.3%) |
| 35 Years and over | 73 (65.8%) | 38 (34.2%) |
| Total | 4,038 (78.2%) | 1,126 (21.8%) |
Educational Attainment by Field of Study in Blaine County
Education (1,373 | 16.8%), business (1,290 | 15.8%), visual & performing arts (873 | 10.7%), literature & languages (737 | 9.0%), and bio, nature & agricultural (654 | 8.0%) are the most common fields of study among 8,154 individuals in Blaine County who have obtained a bachelor's degree or higher.
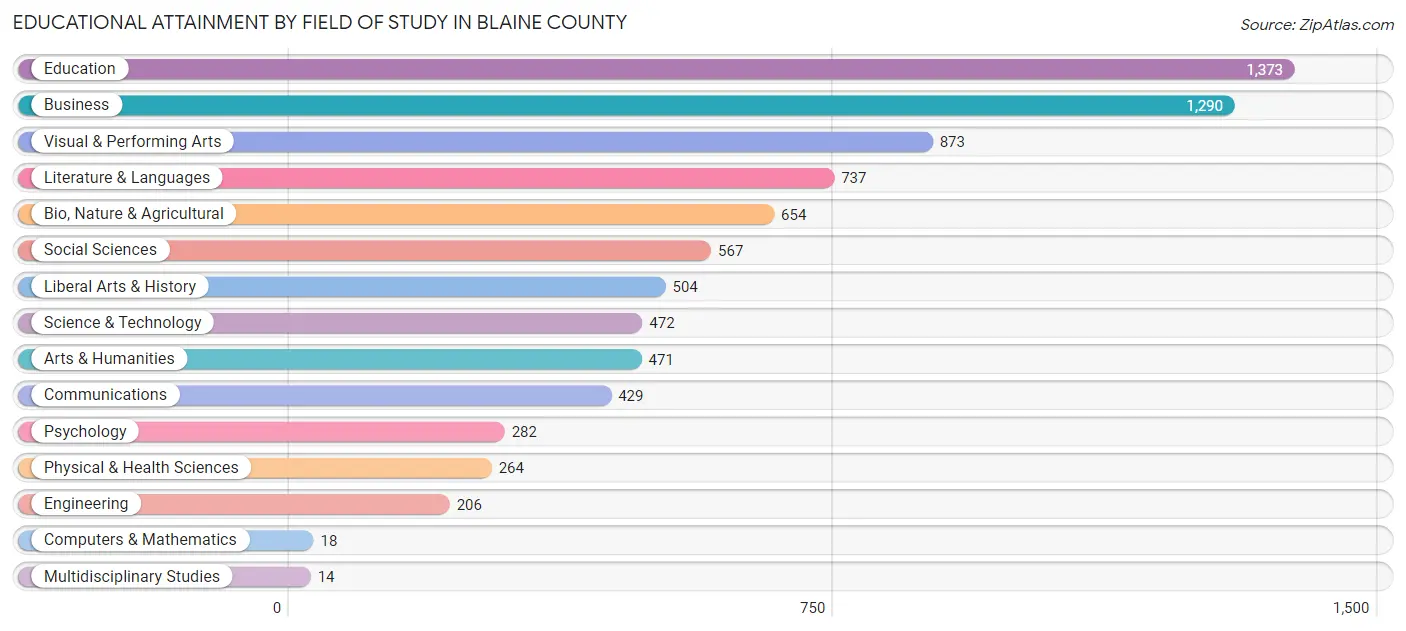
| Field of Study | # Graduates | % Graduates |
| Computers & Mathematics | 18 | 0.2% |
| Bio, Nature & Agricultural | 654 | 8.0% |
| Physical & Health Sciences | 264 | 3.2% |
| Psychology | 282 | 3.5% |
| Social Sciences | 567 | 7.0% |
| Engineering | 206 | 2.5% |
| Multidisciplinary Studies | 14 | 0.2% |
| Science & Technology | 472 | 5.8% |
| Business | 1,290 | 15.8% |
| Education | 1,373 | 16.8% |
| Literature & Languages | 737 | 9.0% |
| Liberal Arts & History | 504 | 6.2% |
| Visual & Performing Arts | 873 | 10.7% |
| Communications | 429 | 5.3% |
| Arts & Humanities | 471 | 5.8% |
| Total | 8,154 | 100.0% |
Transportation & Commute in Blaine County
Vehicle Availability by Sex in Blaine County
The most prevalent vehicle ownership categories in Blaine County are males with 2 vehicles (3,363, accounting for 46.5%) and females with 2 vehicles (2,807, making up 58.6%).
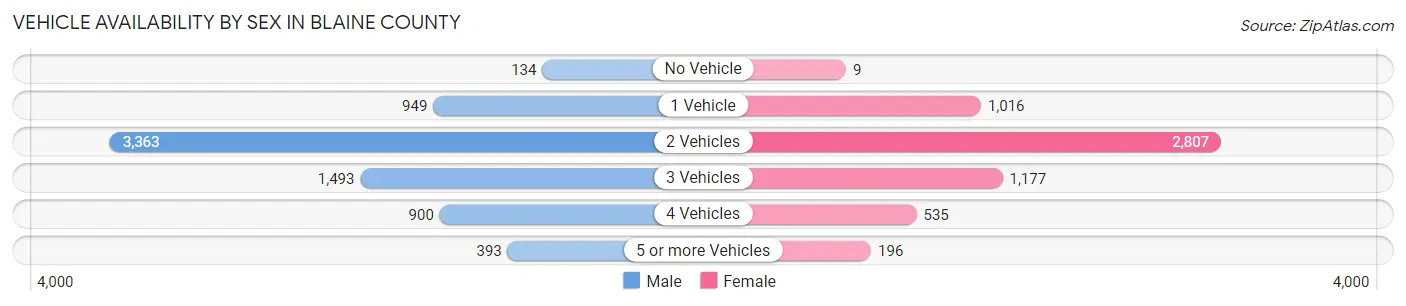
| Vehicles Available | Male | Female |
| No Vehicle | 134 (1.8%) | 9 (0.2%) |
| 1 Vehicle | 949 (13.1%) | 1,016 (17.7%) |
| 2 Vehicles | 3,363 (46.5%) | 2,807 (48.9%) |
| 3 Vehicles | 1,493 (20.6%) | 1,177 (20.5%) |
| 4 Vehicles | 900 (12.4%) | 535 (9.3%) |
| 5 or more Vehicles | 393 (5.4%) | 196 (3.4%) |
| Total | 7,232 (100.0%) | 5,740 (100.0%) |
Commute Time in Blaine County
The most frequently occuring commute durations in Blaine County are 10 to 14 minutes (3,261 commuters, 28.4%), 5 to 9 minutes (1,869 commuters, 16.3%), and 20 to 24 minutes (1,429 commuters, 12.4%).
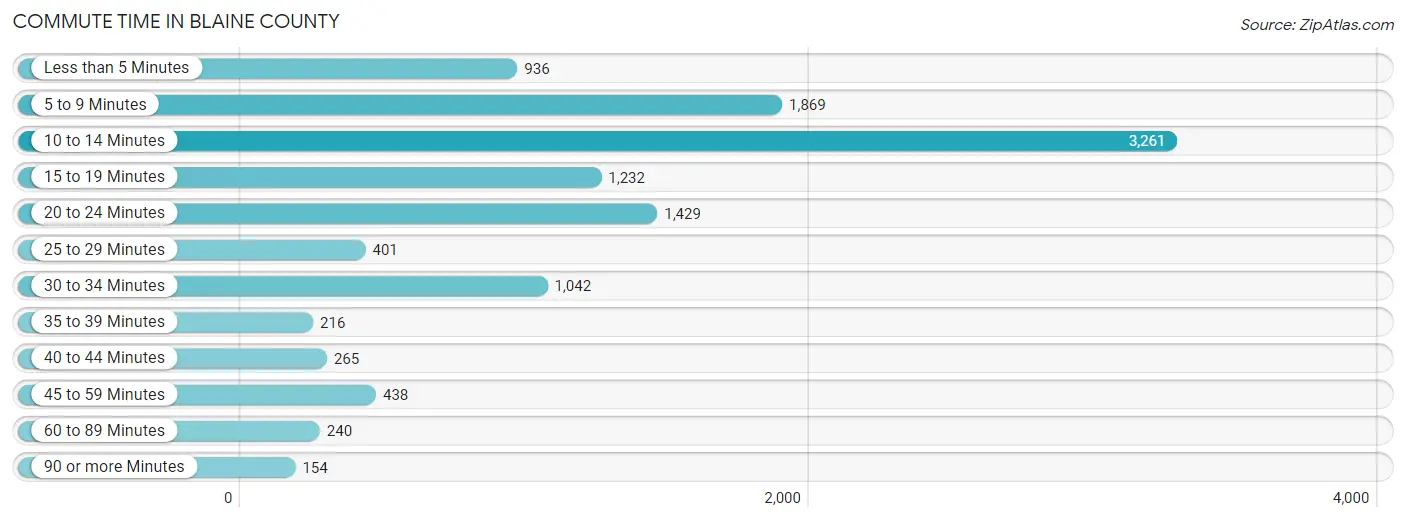
| Commute Time | # Commuters | % Commuters |
| Less than 5 Minutes | 936 | 8.2% |
| 5 to 9 Minutes | 1,869 | 16.3% |
| 10 to 14 Minutes | 3,261 | 28.4% |
| 15 to 19 Minutes | 1,232 | 10.7% |
| 20 to 24 Minutes | 1,429 | 12.4% |
| 25 to 29 Minutes | 401 | 3.5% |
| 30 to 34 Minutes | 1,042 | 9.1% |
| 35 to 39 Minutes | 216 | 1.9% |
| 40 to 44 Minutes | 265 | 2.3% |
| 45 to 59 Minutes | 438 | 3.8% |
| 60 to 89 Minutes | 240 | 2.1% |
| 90 or more Minutes | 154 | 1.3% |
Commute Time by Sex in Blaine County
The most common commute times in Blaine County are 10 to 14 minutes (1,535 commuters, 23.5%) for males and 10 to 14 minutes (1,726 commuters, 34.8%) for females.
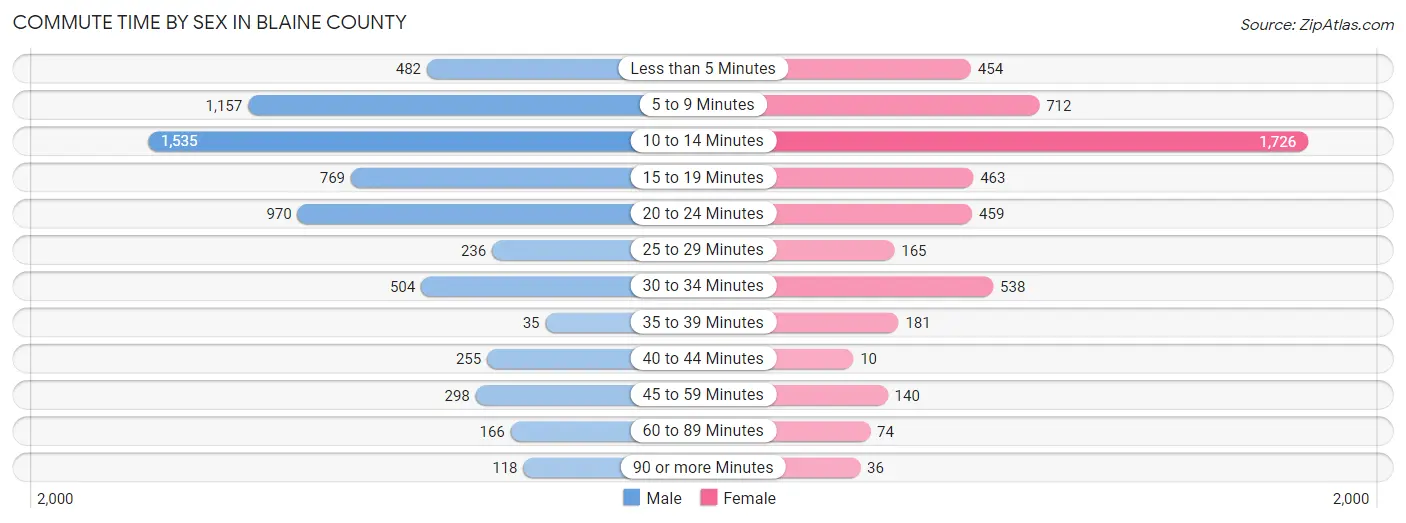
| Commute Time | Male | Female |
| Less than 5 Minutes | 482 (7.4%) | 454 (9.2%) |
| 5 to 9 Minutes | 1,157 (17.7%) | 712 (14.4%) |
| 10 to 14 Minutes | 1,535 (23.5%) | 1,726 (34.8%) |
| 15 to 19 Minutes | 769 (11.8%) | 463 (9.3%) |
| 20 to 24 Minutes | 970 (14.9%) | 459 (9.3%) |
| 25 to 29 Minutes | 236 (3.6%) | 165 (3.3%) |
| 30 to 34 Minutes | 504 (7.7%) | 538 (10.8%) |
| 35 to 39 Minutes | 35 (0.5%) | 181 (3.6%) |
| 40 to 44 Minutes | 255 (3.9%) | 10 (0.2%) |
| 45 to 59 Minutes | 298 (4.6%) | 140 (2.8%) |
| 60 to 89 Minutes | 166 (2.5%) | 74 (1.5%) |
| 90 or more Minutes | 118 (1.8%) | 36 (0.7%) |
Time of Departure to Work by Sex in Blaine County
The most frequent times of departure to work in Blaine County are 8:00 AM to 8:29 AM (1,520, 23.3%) for males and 9:00 AM to 9:59 AM (846, 17.1%) for females.
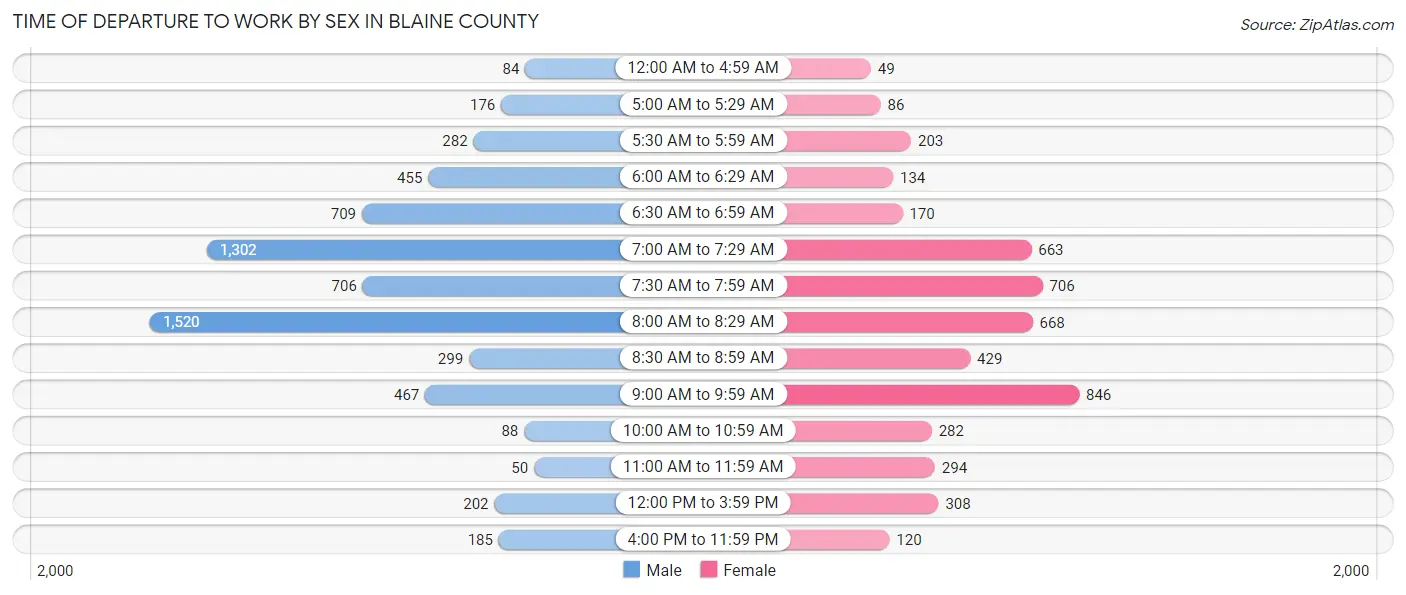
| Time of Departure | Male | Female |
| 12:00 AM to 4:59 AM | 84 (1.3%) | 49 (1.0%) |
| 5:00 AM to 5:29 AM | 176 (2.7%) | 86 (1.7%) |
| 5:30 AM to 5:59 AM | 282 (4.3%) | 203 (4.1%) |
| 6:00 AM to 6:29 AM | 455 (7.0%) | 134 (2.7%) |
| 6:30 AM to 6:59 AM | 709 (10.9%) | 170 (3.4%) |
| 7:00 AM to 7:29 AM | 1,302 (20.0%) | 663 (13.4%) |
| 7:30 AM to 7:59 AM | 706 (10.8%) | 706 (14.2%) |
| 8:00 AM to 8:29 AM | 1,520 (23.3%) | 668 (13.5%) |
| 8:30 AM to 8:59 AM | 299 (4.6%) | 429 (8.6%) |
| 9:00 AM to 9:59 AM | 467 (7.2%) | 846 (17.1%) |
| 10:00 AM to 10:59 AM | 88 (1.3%) | 282 (5.7%) |
| 11:00 AM to 11:59 AM | 50 (0.8%) | 294 (5.9%) |
| 12:00 PM to 3:59 PM | 202 (3.1%) | 308 (6.2%) |
| 4:00 PM to 11:59 PM | 185 (2.8%) | 120 (2.4%) |
| Total | 6,525 (100.0%) | 4,958 (100.0%) |
Housing Occupancy in Blaine County
Occupancy by Ownership in Blaine County
Of the total 9,298 dwellings in Blaine County, owner-occupied units account for 6,981 (75.1%), while renter-occupied units make up 2,317 (24.9%).
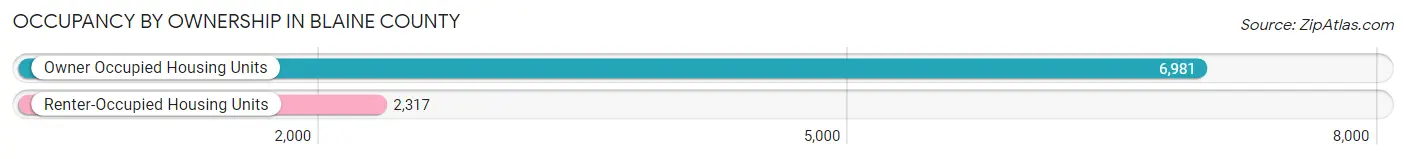
| Occupancy | # Housing Units | % Housing Units |
| Owner Occupied Housing Units | 6,981 | 75.1% |
| Renter-Occupied Housing Units | 2,317 | 24.9% |
| Total Occupied Housing Units | 9,298 | 100.0% |
Occupancy by Household Size in Blaine County
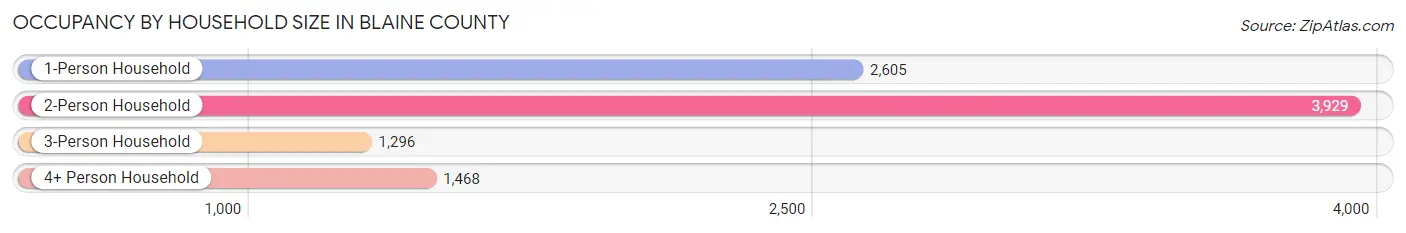
| Household Size | # Housing Units | % Housing Units |
| 1-Person Household | 2,605 | 28.0% |
| 2-Person Household | 3,929 | 42.3% |
| 3-Person Household | 1,296 | 13.9% |
| 4+ Person Household | 1,468 | 15.8% |
| Total Housing Units | 9,298 | 100.0% |
Occupancy by Ownership by Household Size in Blaine County
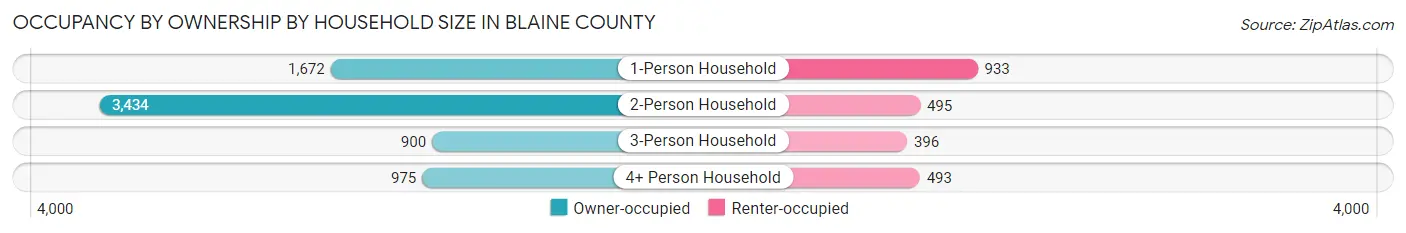
| Household Size | Owner-occupied | Renter-occupied |
| 1-Person Household | 1,672 (64.2%) | 933 (35.8%) |
| 2-Person Household | 3,434 (87.4%) | 495 (12.6%) |
| 3-Person Household | 900 (69.4%) | 396 (30.6%) |
| 4+ Person Household | 975 (66.4%) | 493 (33.6%) |
| Total Housing Units | 6,981 (75.1%) | 2,317 (24.9%) |
Occupancy by Educational Attainment in Blaine County
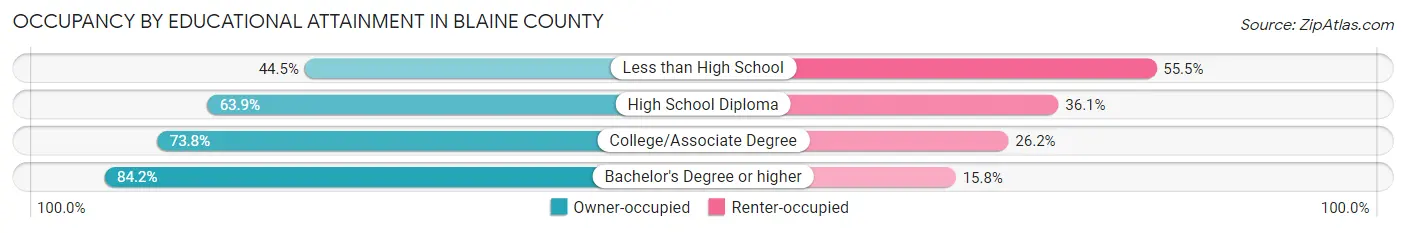
| Household Size | Owner-occupied | Renter-occupied |
| Less than High School | 305 (44.5%) | 381 (55.5%) |
| High School Diploma | 1,017 (63.9%) | 575 (36.1%) |
| College/Associate Degree | 1,792 (73.8%) | 637 (26.2%) |
| Bachelor's Degree or higher | 3,867 (84.2%) | 724 (15.8%) |
Occupancy by Age of Householder in Blaine County
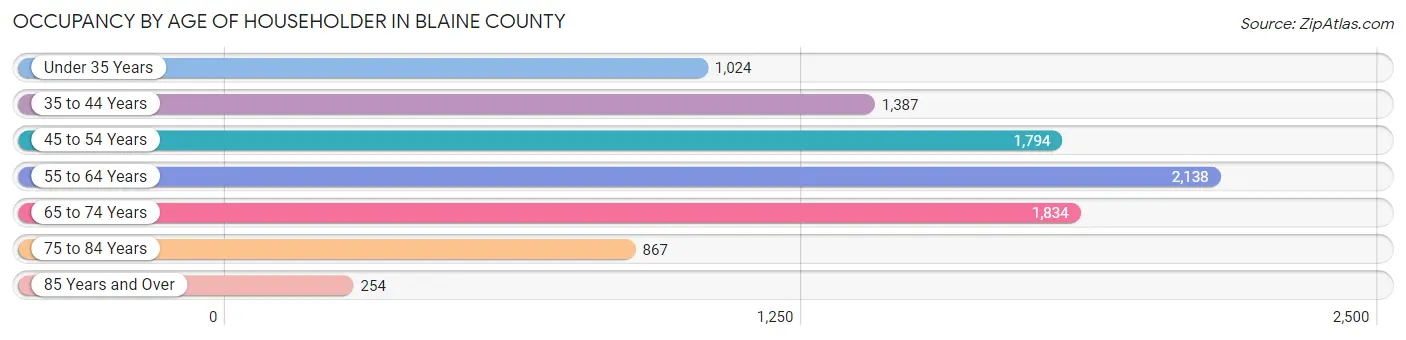
| Age Bracket | # Households | % Households |
| Under 35 Years | 1,024 | 11.0% |
| 35 to 44 Years | 1,387 | 14.9% |
| 45 to 54 Years | 1,794 | 19.3% |
| 55 to 64 Years | 2,138 | 23.0% |
| 65 to 74 Years | 1,834 | 19.7% |
| 75 to 84 Years | 867 | 9.3% |
| 85 Years and Over | 254 | 2.7% |
| Total | 9,298 | 100.0% |
Housing Finances in Blaine County
Median Income by Occupancy in Blaine County
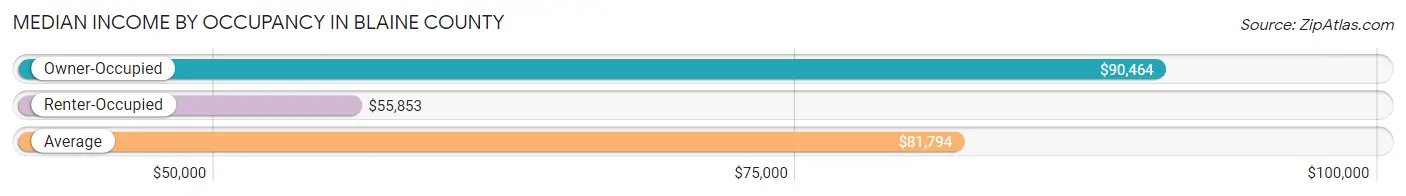
| Occupancy Type | # Households | Median Income |
| Owner-Occupied | 6,981 (75.1%) | $90,464 |
| Renter-Occupied | 2,317 (24.9%) | $55,853 |
| Average | 9,298 (100.0%) | $81,794 |
Occupancy by Householder Income Bracket in Blaine County
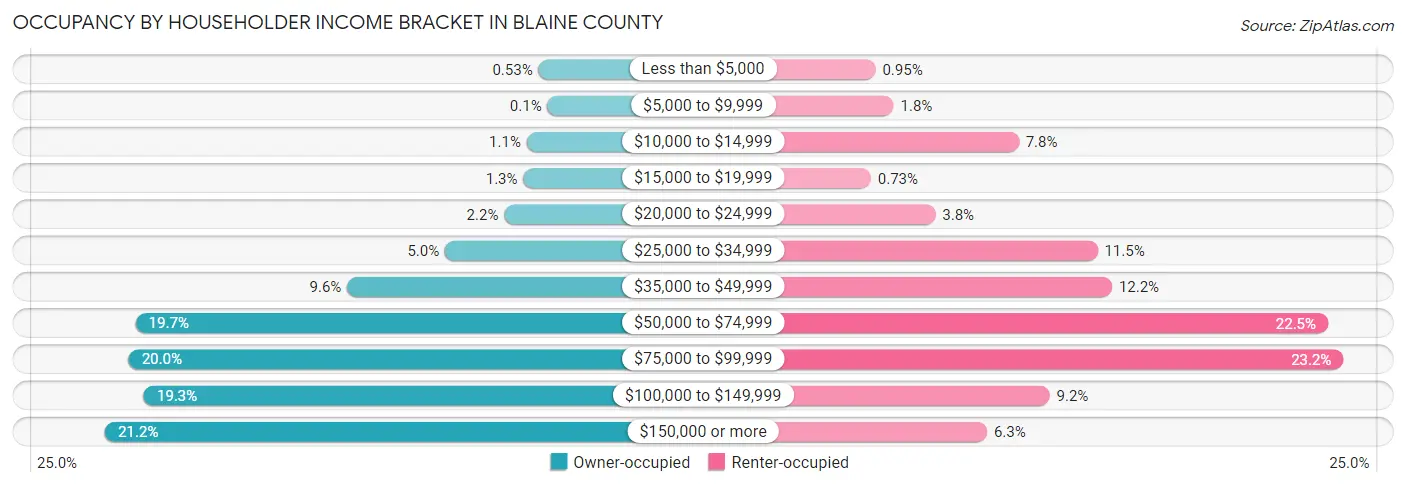
| Income Bracket | Owner-occupied | Renter-occupied |
| Less than $5,000 | 37 (0.5%) | 22 (0.9%) |
| $5,000 to $9,999 | 7 (0.1%) | 42 (1.8%) |
| $10,000 to $14,999 | 76 (1.1%) | 180 (7.8%) |
| $15,000 to $19,999 | 87 (1.3%) | 17 (0.7%) |
| $20,000 to $24,999 | 151 (2.2%) | 88 (3.8%) |
| $25,000 to $34,999 | 348 (5.0%) | 267 (11.5%) |
| $35,000 to $49,999 | 673 (9.6%) | 283 (12.2%) |
| $50,000 to $74,999 | 1,376 (19.7%) | 521 (22.5%) |
| $75,000 to $99,999 | 1,399 (20.0%) | 538 (23.2%) |
| $100,000 to $149,999 | 1,349 (19.3%) | 214 (9.2%) |
| $150,000 or more | 1,478 (21.2%) | 145 (6.3%) |
| Total | 6,981 (100.0%) | 2,317 (100.0%) |
Monthly Housing Cost Tiers in Blaine County
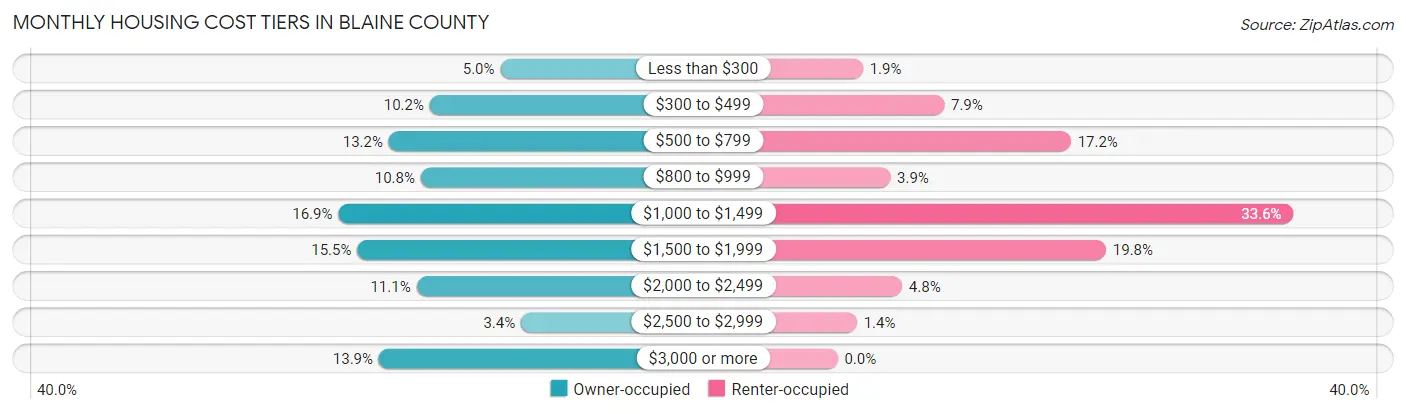
| Monthly Cost | Owner-occupied | Renter-occupied |
| Less than $300 | 346 (5.0%) | 43 (1.9%) |
| $300 to $499 | 709 (10.2%) | 182 (7.9%) |
| $500 to $799 | 920 (13.2%) | 398 (17.2%) |
| $800 to $999 | 755 (10.8%) | 90 (3.9%) |
| $1,000 to $1,499 | 1,180 (16.9%) | 778 (33.6%) |
| $1,500 to $1,999 | 1,082 (15.5%) | 458 (19.8%) |
| $2,000 to $2,499 | 778 (11.1%) | 110 (4.8%) |
| $2,500 to $2,999 | 240 (3.4%) | 33 (1.4%) |
| $3,000 or more | 971 (13.9%) | 0 (0.0%) |
| Total | 6,981 (100.0%) | 2,317 (100.0%) |
Physical Housing Characteristics in Blaine County
Housing Structures in Blaine County
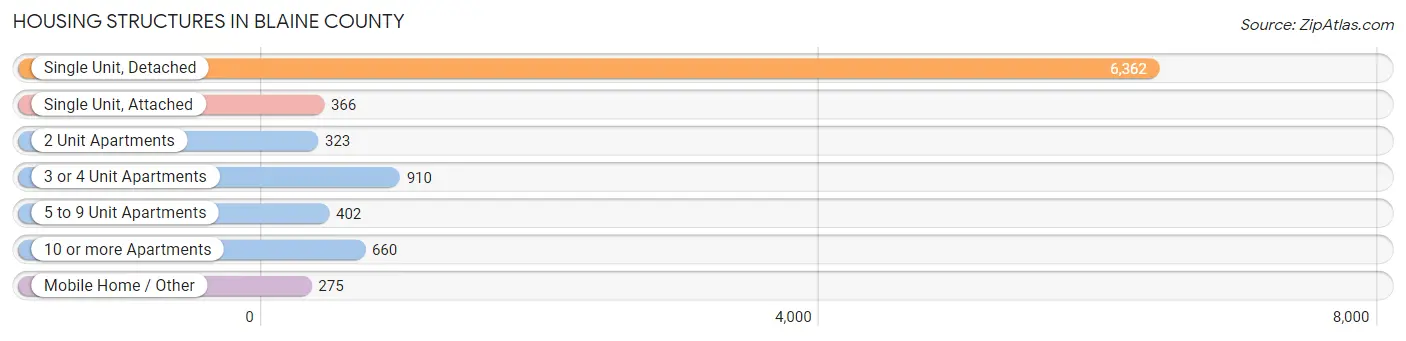
| Structure Type | # Housing Units | % Housing Units |
| Single Unit, Detached | 6,362 | 68.4% |
| Single Unit, Attached | 366 | 3.9% |
| 2 Unit Apartments | 323 | 3.5% |
| 3 or 4 Unit Apartments | 910 | 9.8% |
| 5 to 9 Unit Apartments | 402 | 4.3% |
| 10 or more Apartments | 660 | 7.1% |
| Mobile Home / Other | 275 | 3.0% |
| Total | 9,298 | 100.0% |
Housing Structures by Occupancy in Blaine County
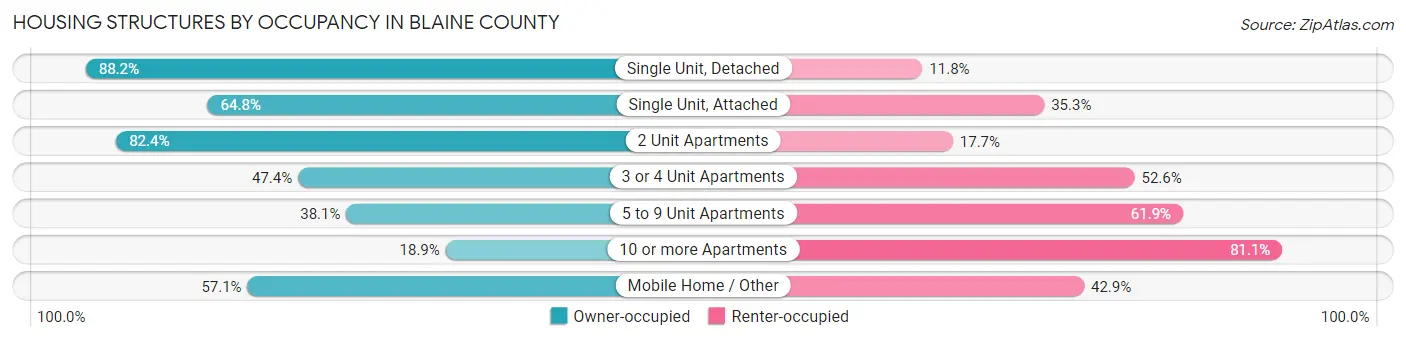
| Structure Type | Owner-occupied | Renter-occupied |
| Single Unit, Detached | 5,612 (88.2%) | 750 (11.8%) |
| Single Unit, Attached | 237 (64.7%) | 129 (35.2%) |
| 2 Unit Apartments | 266 (82.4%) | 57 (17.6%) |
| 3 or 4 Unit Apartments | 431 (47.4%) | 479 (52.6%) |
| 5 to 9 Unit Apartments | 153 (38.1%) | 249 (61.9%) |
| 10 or more Apartments | 125 (18.9%) | 535 (81.1%) |
| Mobile Home / Other | 157 (57.1%) | 118 (42.9%) |
| Total | 6,981 (75.1%) | 2,317 (24.9%) |
Housing Structures by Number of Rooms in Blaine County
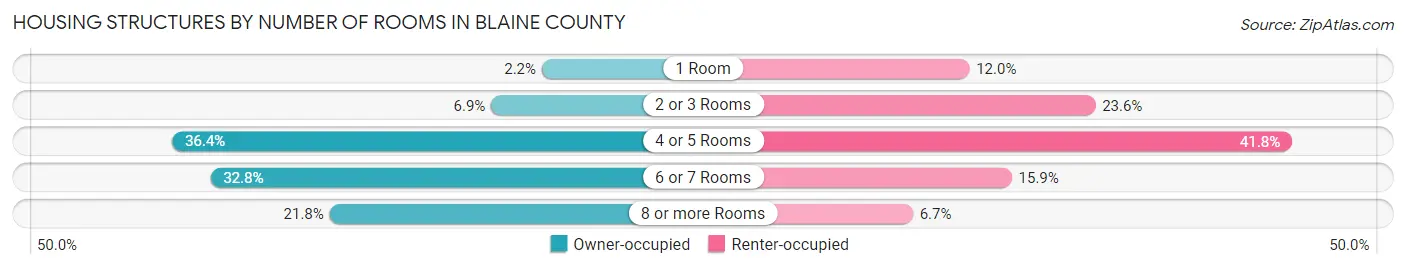
| Number of Rooms | Owner-occupied | Renter-occupied |
| 1 Room | 151 (2.2%) | 277 (12.0%) |
| 2 or 3 Rooms | 478 (6.9%) | 547 (23.6%) |
| 4 or 5 Rooms | 2,539 (36.4%) | 969 (41.8%) |
| 6 or 7 Rooms | 2,292 (32.8%) | 368 (15.9%) |
| 8 or more Rooms | 1,521 (21.8%) | 156 (6.7%) |
| Total | 6,981 (100.0%) | 2,317 (100.0%) |
Housing Structure by Heating Type in Blaine County
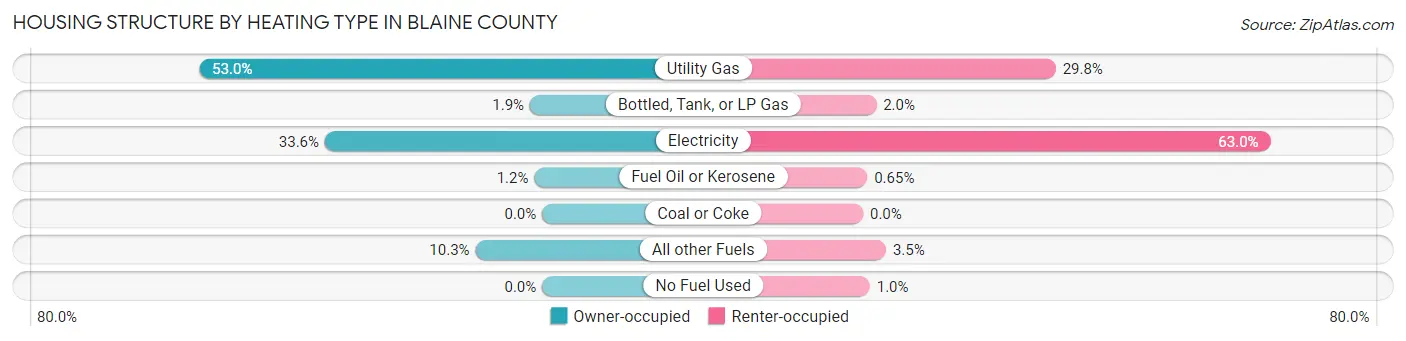
| Heating Type | Owner-occupied | Renter-occupied |
| Utility Gas | 3,702 (53.0%) | 690 (29.8%) |
| Bottled, Tank, or LP Gas | 131 (1.9%) | 47 (2.0%) |
| Electricity | 2,344 (33.6%) | 1,459 (63.0%) |
| Fuel Oil or Kerosene | 84 (1.2%) | 15 (0.6%) |
| Coal or Coke | 0 (0.0%) | 0 (0.0%) |
| All other Fuels | 720 (10.3%) | 82 (3.5%) |
| No Fuel Used | 0 (0.0%) | 24 (1.0%) |
| Total | 6,981 (100.0%) | 2,317 (100.0%) |
Household Vehicle Usage in Blaine County
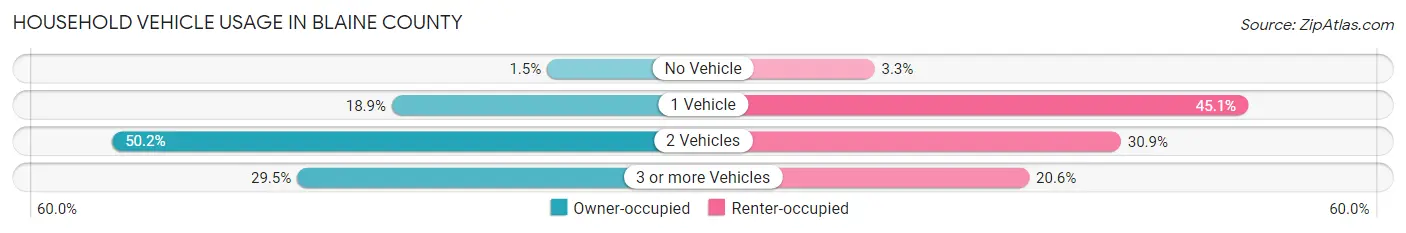
| Vehicles per Household | Owner-occupied | Renter-occupied |
| No Vehicle | 103 (1.5%) | 77 (3.3%) |
| 1 Vehicle | 1,317 (18.9%) | 1,046 (45.1%) |
| 2 Vehicles | 3,503 (50.2%) | 716 (30.9%) |
| 3 or more Vehicles | 2,058 (29.5%) | 478 (20.6%) |
| Total | 6,981 (100.0%) | 2,317 (100.0%) |
Real Estate & Mortgages in Blaine County
Real Estate and Mortgage Overview in Blaine County
| Characteristic | Without Mortgage | With Mortgage |
| Housing Units | 3,011 | 3,970 |
| Median Property Value | $624,000 | $494,100 |
| Median Household Income | $80,970 | $995 |
| Monthly Housing Costs | $658 | $903 |
| Real Estate Taxes | $2,932 | $5 |
Property Value by Mortgage Status in Blaine County
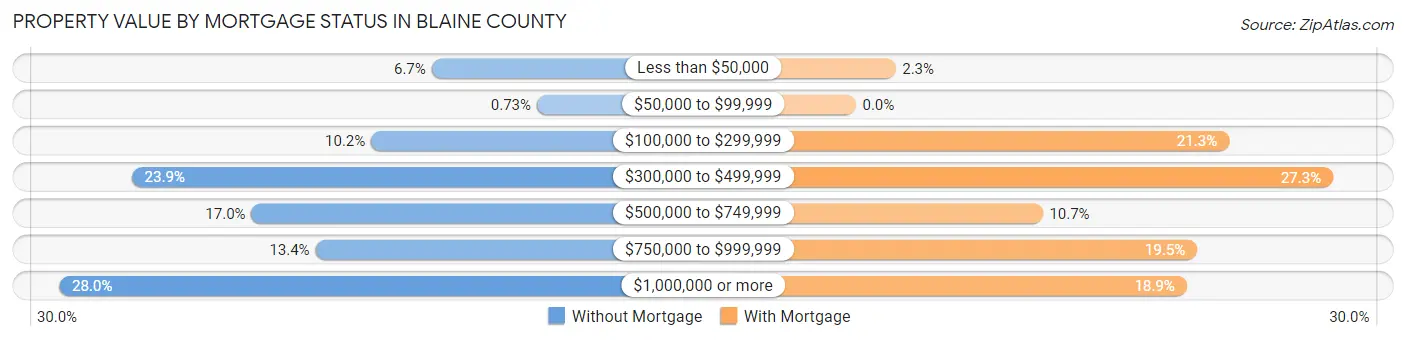
| Property Value | Without Mortgage | With Mortgage |
| Less than $50,000 | 203 (6.7%) | 90 (2.3%) |
| $50,000 to $99,999 | 22 (0.7%) | 0 (0.0%) |
| $100,000 to $299,999 | 307 (10.2%) | 847 (21.3%) |
| $300,000 to $499,999 | 719 (23.9%) | 1,083 (27.3%) |
| $500,000 to $749,999 | 513 (17.0%) | 424 (10.7%) |
| $750,000 to $999,999 | 403 (13.4%) | 775 (19.5%) |
| $1,000,000 or more | 844 (28.0%) | 751 (18.9%) |
| Total | 3,011 (100.0%) | 3,970 (100.0%) |
Household Income by Mortgage Status in Blaine County
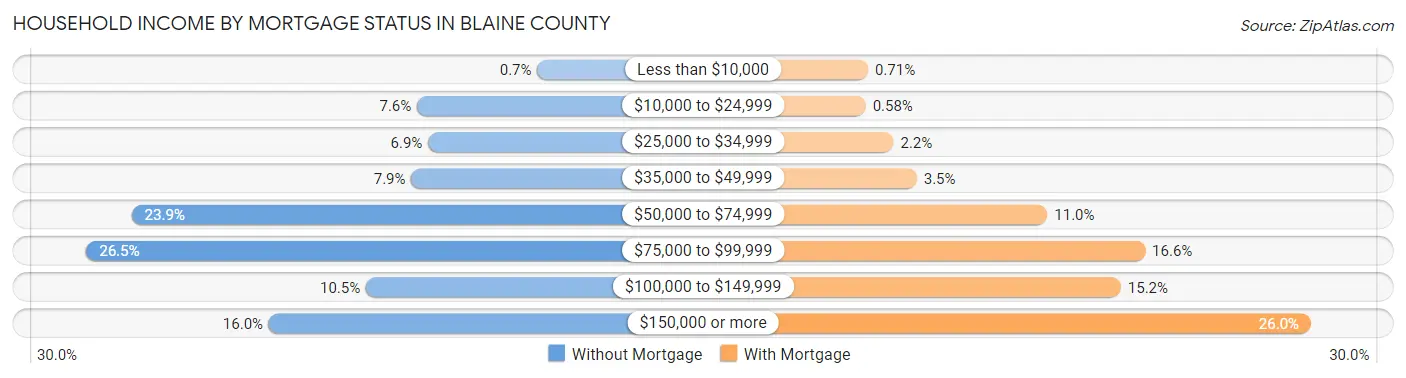
| Household Income | Without Mortgage | With Mortgage |
| Less than $10,000 | 21 (0.7%) | 28 (0.7%) |
| $10,000 to $24,999 | 228 (7.6%) | 23 (0.6%) |
| $25,000 to $34,999 | 209 (6.9%) | 86 (2.2%) |
| $35,000 to $49,999 | 238 (7.9%) | 139 (3.5%) |
| $50,000 to $74,999 | 719 (23.9%) | 435 (11.0%) |
| $75,000 to $99,999 | 797 (26.5%) | 657 (16.6%) |
| $100,000 to $149,999 | 316 (10.5%) | 602 (15.2%) |
| $150,000 or more | 483 (16.0%) | 1,033 (26.0%) |
| Total | 3,011 (100.0%) | 3,970 (100.0%) |
Property Value to Household Income Ratio in Blaine County
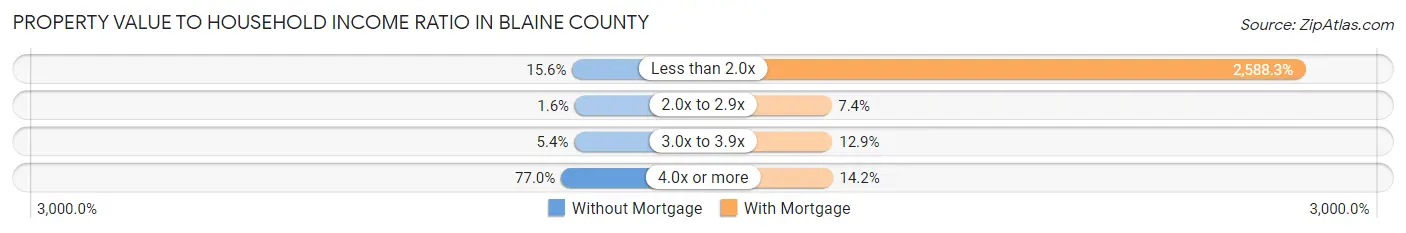
| Value-to-Income Ratio | Without Mortgage | With Mortgage |
| Less than 2.0x | 471 (15.6%) | 102,754 (2,588.3%) |
| 2.0x to 2.9x | 48 (1.6%) | 294 (7.4%) |
| 3.0x to 3.9x | 162 (5.4%) | 512 (12.9%) |
| 4.0x or more | 2,317 (76.9%) | 564 (14.2%) |
| Total | 3,011 (100.0%) | 3,970 (100.0%) |
Real Estate Taxes by Mortgage Status in Blaine County
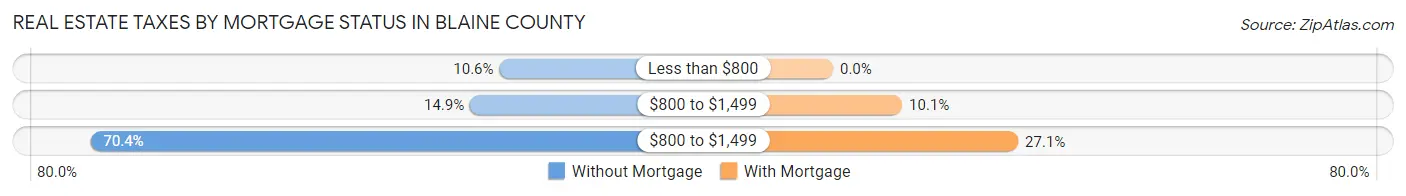
| Property Taxes | Without Mortgage | With Mortgage |
| Less than $800 | 320 (10.6%) | 0 (0.0%) |
| $800 to $1,499 | 449 (14.9%) | 401 (10.1%) |
| $800 to $1,499 | 2,119 (70.4%) | 1,074 (27.1%) |
| Total | 3,011 (100.0%) | 3,970 (100.0%) |
Health & Disability in Blaine County
Health Insurance Coverage by Age in Blaine County
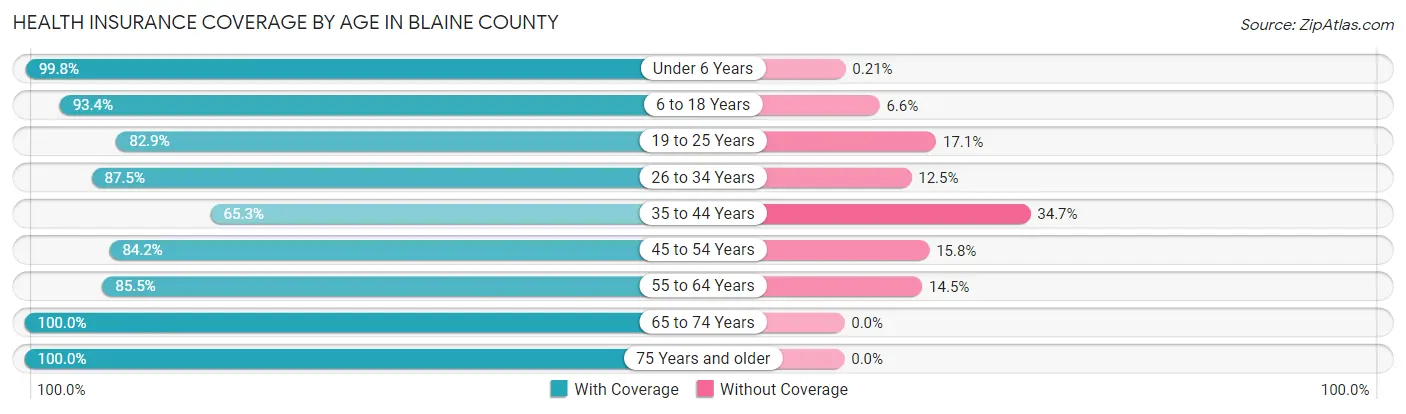
| Age Bracket | With Coverage | Without Coverage |
| Under 6 Years | 940 (99.8%) | 2 (0.2%) |
| 6 to 18 Years | 4,143 (93.4%) | 291 (6.6%) |
| 19 to 25 Years | 1,458 (82.9%) | 301 (17.1%) |
| 26 to 34 Years | 1,864 (87.5%) | 266 (12.5%) |
| 35 to 44 Years | 1,965 (65.3%) | 1,044 (34.7%) |
| 45 to 54 Years | 2,605 (84.2%) | 490 (15.8%) |
| 55 to 64 Years | 3,367 (85.5%) | 572 (14.5%) |
| 65 to 74 Years | 3,030 (100.0%) | 0 (0.0%) |
| 75 Years and older | 1,840 (100.0%) | 0 (0.0%) |
| Total | 21,212 (87.7%) | 2,966 (12.3%) |
Health Insurance Coverage by Citizenship Status in Blaine County
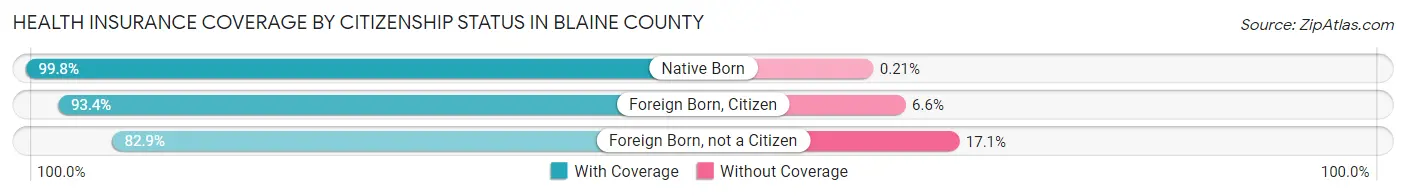
| Citizenship Status | With Coverage | Without Coverage |
| Native Born | 940 (99.8%) | 2 (0.2%) |
| Foreign Born, Citizen | 4,143 (93.4%) | 291 (6.6%) |
| Foreign Born, not a Citizen | 1,458 (82.9%) | 301 (17.1%) |
Health Insurance Coverage by Household Income in Blaine County
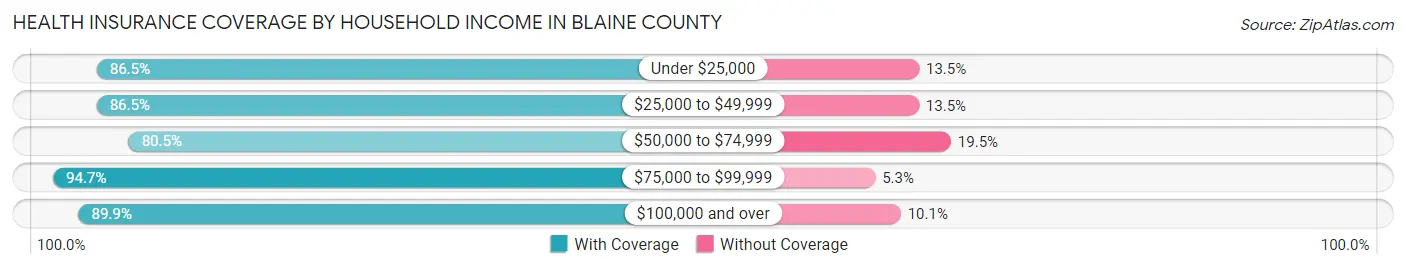
| Household Income | With Coverage | Without Coverage |
| Under $25,000 | 1,074 (86.5%) | 168 (13.5%) |
| $25,000 to $49,999 | 2,874 (86.5%) | 449 (13.5%) |
| $50,000 to $74,999 | 4,473 (80.5%) | 1,084 (19.5%) |
| $75,000 to $99,999 | 4,260 (94.7%) | 240 (5.3%) |
| $100,000 and over | 8,275 (89.9%) | 931 (10.1%) |
Public vs Private Health Insurance Coverage by Age in Blaine County
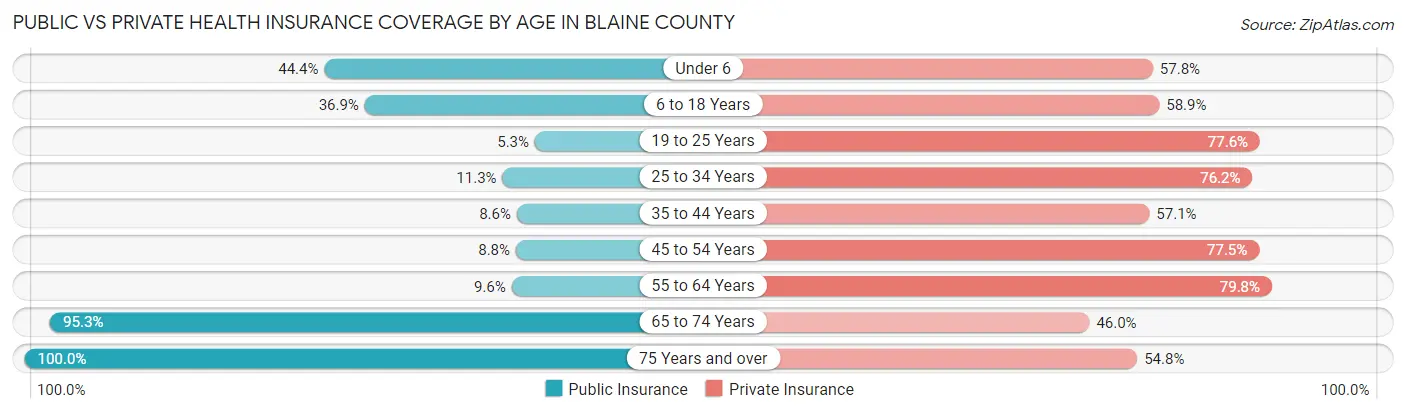
| Age Bracket | Public Insurance | Private Insurance |
| Under 6 | 418 (44.4%) | 544 (57.8%) |
| 6 to 18 Years | 1,635 (36.9%) | 2,613 (58.9%) |
| 19 to 25 Years | 93 (5.3%) | 1,365 (77.6%) |
| 25 to 34 Years | 241 (11.3%) | 1,623 (76.2%) |
| 35 to 44 Years | 260 (8.6%) | 1,718 (57.1%) |
| 45 to 54 Years | 273 (8.8%) | 2,397 (77.4%) |
| 55 to 64 Years | 379 (9.6%) | 3,144 (79.8%) |
| 65 to 74 Years | 2,886 (95.3%) | 1,393 (46.0%) |
| 75 Years and over | 1,840 (100.0%) | 1,009 (54.8%) |
| Total | 8,025 (33.2%) | 15,806 (65.4%) |
Disability Status by Sex by Age in Blaine County
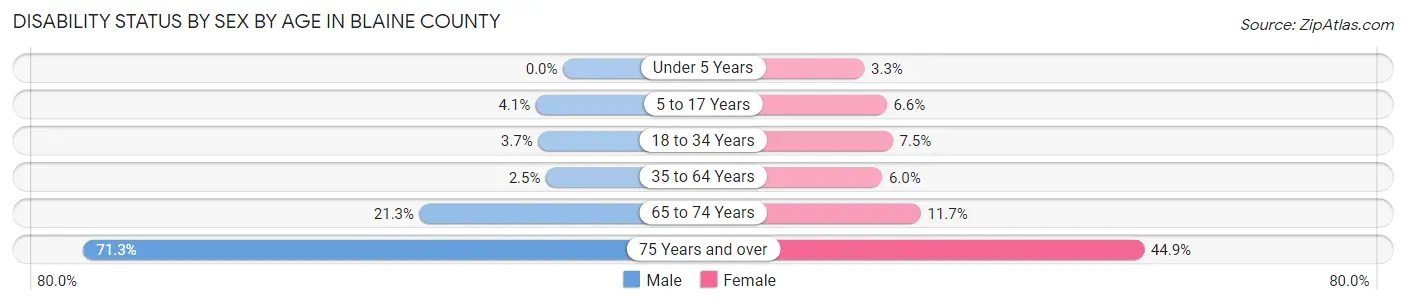
| Age Bracket | Male | Female |
| Under 5 Years | 0 (0.0%) | 10 (3.3%) |
| 5 to 17 Years | 99 (4.1%) | 115 (6.6%) |
| 18 to 34 Years | 86 (3.7%) | 149 (7.5%) |
| 35 to 64 Years | 127 (2.5%) | 299 (6.0%) |
| 65 to 74 Years | 305 (21.3%) | 187 (11.7%) |
| 75 Years and over | 652 (71.3%) | 415 (44.9%) |
Disability Class by Sex by Age in Blaine County
Disability Class: Hearing Difficulty
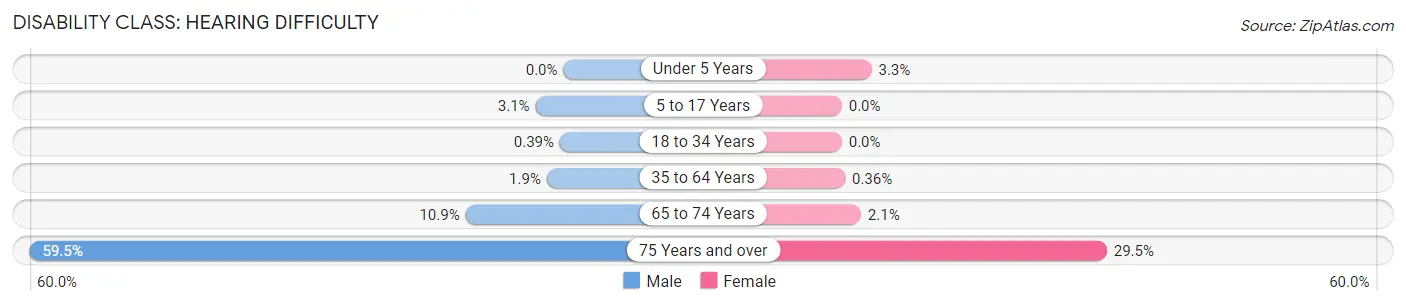
| Age Bracket | Male | Female |
| Under 5 Years | 0 (0.0%) | 10 (3.3%) |
| 5 to 17 Years | 76 (3.1%) | 0 (0.0%) |
| 18 to 34 Years | 9 (0.4%) | 0 (0.0%) |
| 35 to 64 Years | 93 (1.8%) | 18 (0.4%) |
| 65 to 74 Years | 156 (10.9%) | 34 (2.1%) |
| 75 Years and over | 544 (59.5%) | 273 (29.5%) |
Disability Class: Vision Difficulty
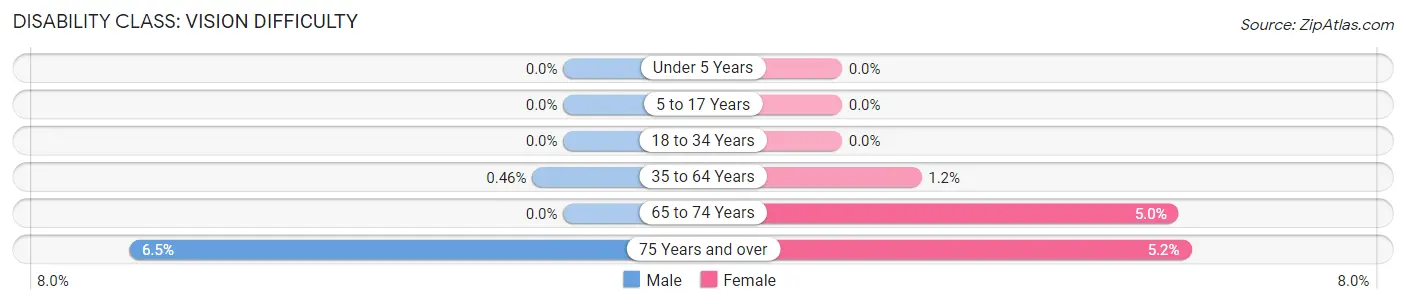
| Age Bracket | Male | Female |
| Under 5 Years | 0 (0.0%) | 0 (0.0%) |
| 5 to 17 Years | 0 (0.0%) | 0 (0.0%) |
| 18 to 34 Years | 0 (0.0%) | 0 (0.0%) |
| 35 to 64 Years | 23 (0.5%) | 59 (1.2%) |
| 65 to 74 Years | 0 (0.0%) | 80 (5.0%) |
| 75 Years and over | 59 (6.5%) | 48 (5.2%) |
Disability Class: Cognitive Difficulty
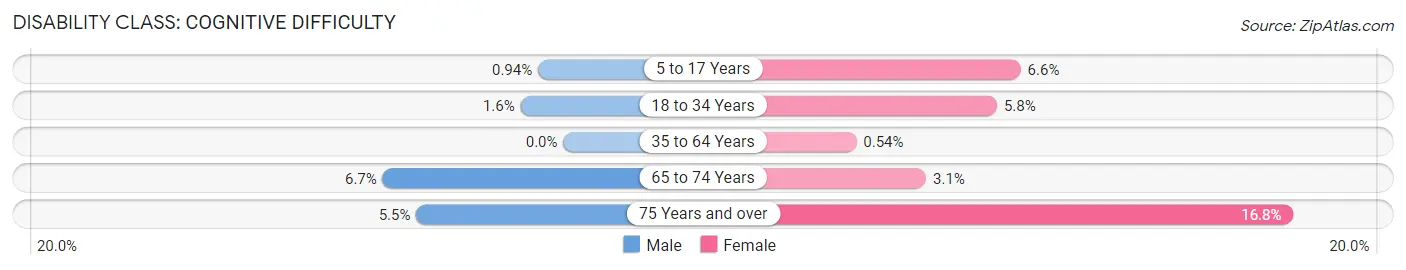
| Age Bracket | Male | Female |
| 5 to 17 Years | 23 (0.9%) | 115 (6.6%) |
| 18 to 34 Years | 37 (1.6%) | 114 (5.8%) |
| 35 to 64 Years | 0 (0.0%) | 27 (0.5%) |
| 65 to 74 Years | 96 (6.7%) | 50 (3.1%) |
| 75 Years and over | 50 (5.5%) | 155 (16.8%) |
Disability Class: Ambulatory Difficulty
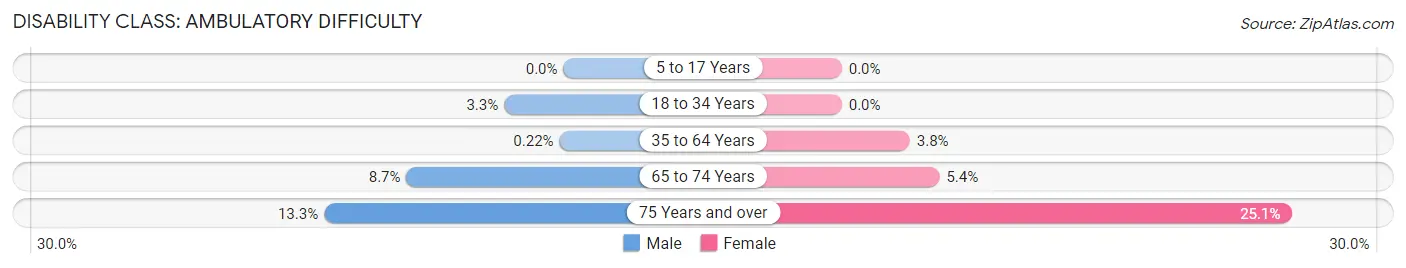
| Age Bracket | Male | Female |
| 5 to 17 Years | 0 (0.0%) | 0 (0.0%) |
| 18 to 34 Years | 77 (3.3%) | 0 (0.0%) |
| 35 to 64 Years | 11 (0.2%) | 190 (3.8%) |
| 65 to 74 Years | 125 (8.7%) | 87 (5.4%) |
| 75 Years and over | 122 (13.3%) | 232 (25.1%) |
Disability Class: Self-Care Difficulty
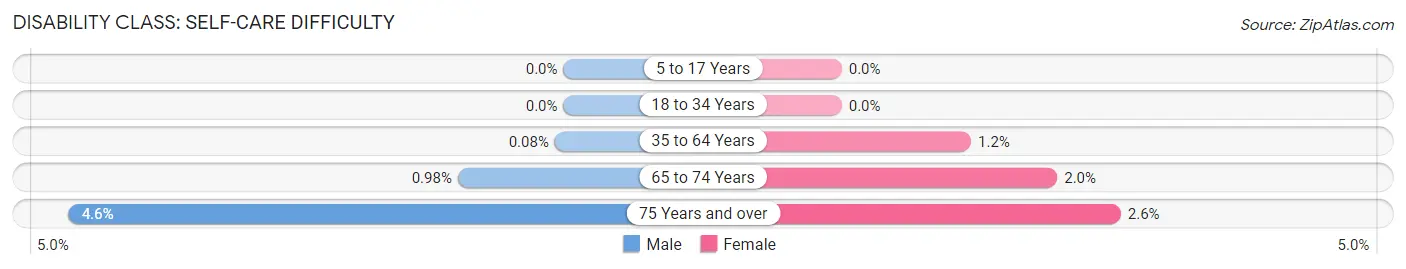
| Age Bracket | Male | Female |
| 5 to 17 Years | 0 (0.0%) | 0 (0.0%) |
| 18 to 34 Years | 0 (0.0%) | 0 (0.0%) |
| 35 to 64 Years | 4 (0.1%) | 60 (1.2%) |
| 65 to 74 Years | 14 (1.0%) | 32 (2.0%) |
| 75 Years and over | 42 (4.6%) | 24 (2.6%) |
Technology Access in Blaine County
Computing Device Access in Blaine County
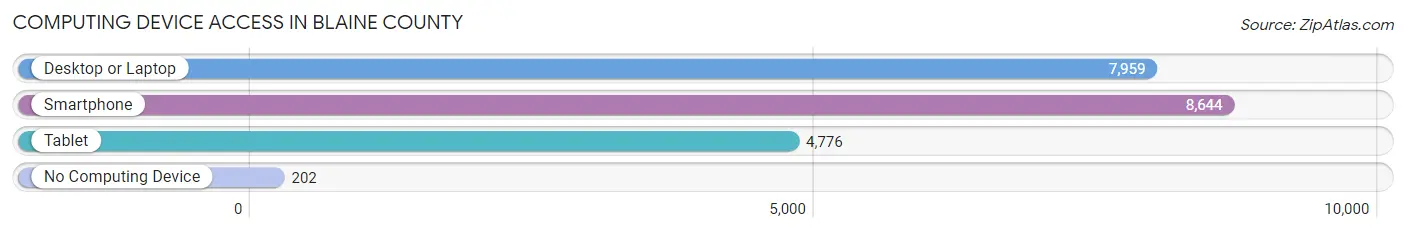
| Device Type | # Households | % Households |
| Desktop or Laptop | 7,959 | 85.6% |
| Smartphone | 8,644 | 93.0% |
| Tablet | 4,776 | 51.4% |
| No Computing Device | 202 | 2.2% |
| Total | 9,298 | 100.0% |
Internet Access in Blaine County
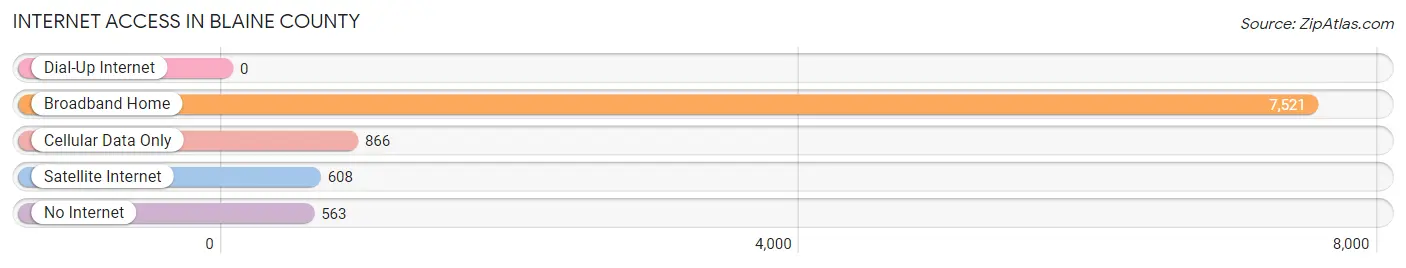
| Internet Type | # Households | % Households |
| Dial-Up Internet | 0 | 0.0% |
| Broadband Home | 7,521 | 80.9% |
| Cellular Data Only | 866 | 9.3% |
| Satellite Internet | 608 | 6.5% |
| No Internet | 563 | 6.1% |
| Total | 9,298 | 100.0% |
Blaine County Summary
Blaine County is located in the south-central part of the state of Idaho, in the United States. It is bordered by Camas County to the north, Lincoln County to the east, Gooding County to the south, and Elmore County to the west. The county seat is Hailey, and the largest city is Sun Valley. The county has a total area of 2,717 square miles, of which 2,711 square miles is land and 6 square miles is water.
History
Blaine County was established in 1895, and was named after James G. Blaine, a former United States Secretary of State. The county was originally part of Alturas County, which was created in 1864. The county was divided in 1895, and Blaine County was created.
Geography
Blaine County is located in the south-central part of Idaho, and is bordered by Camas County to the north, Lincoln County to the east, Gooding County to the south, and Elmore County to the west. The county has a total area of 2,717 square miles, of which 2,711 square miles is land and 6 square miles is water. The county is located in the Sawtooth Mountains, and is home to the Sawtooth National Recreation Area. The county is also home to the Sawtooth National Forest, which covers 1.2 million acres.
The county is home to several rivers, including the Big Wood River, the Little Wood River, and the Salmon River. The county also contains several lakes, including Alturas Lake, Redfish Lake, and Pettit Lake.
Economy
The economy of Blaine County is largely based on tourism, as the county is home to the popular Sun Valley ski resort. The county is also home to several other ski resorts, including Dollar Mountain, Bald Mountain, and Galena Summit. The county is also home to several other attractions, including the Sawtooth National Recreation Area, the Sawtooth National Forest, and the Salmon River.
The county is also home to several industries, including agriculture, manufacturing, and mining. The county is home to several large agricultural operations, including potato farms, cattle ranches, and dairy farms. The county is also home to several manufacturing companies, including furniture makers, electronics manufacturers, and food processors. The county is also home to several mining operations, including gold, silver, and copper mines.
Demographics
As of the 2010 census, the population of Blaine County was 21,376. The population density was 8 people per square mile. The racial makeup of the county was 94.3% White, 0.3% African American, 0.7% Native American, 0.7% Asian, 0.1% Pacific Islander, 1.7% from other races, and 2.1% from two or more races. Hispanic or Latino of any race were 5.2% of the population.
The median income for a household in the county was $45,945, and the median income for a family was $54,945. The per capita income for the county was $27,945. About 8.3% of families and 11.7% of the population were below the poverty line, including 15.2% of those under age 18 and 5.2% of those age 65 or over.
Common Questions
What is the Total Population of Blaine County?
Total Population of Blaine County is 24,248.
What is the Total Male Population of Blaine County?
Total Male Population of Blaine County is 12,648.
What is the Total Female Population of Blaine County?
Total Female Population of Blaine County is 11,600.
What is the Ratio of Males per 100 Females in Blaine County?
There are 109.03 Males per 100 Females in Blaine County.
What is the Ratio of Females per 100 Males in Blaine County?
There are 91.71 Females per 100 Males in Blaine County.
What is the Median Population Age in Blaine County?
Median Population Age in Blaine County is 44.5 Years.
What is the Average Family Size in Blaine County
Average Family Size in Blaine County is 3.2 People.
What is the Average Household Size in Blaine County
Average Household Size in Blaine County is 2.6 People.
What is Per Capita Income in Blaine County?
Per Capita income in Blaine County is $47,151.
What is the Median Family Income in Blaine County?
Median Family Income in Blaine County is $87,544.
What is the Median Household income in Blaine County?
Median Household Income in Blaine County is $81,794.
What is Income or Wage Gap in Blaine County?
Income or Wage Gap in Blaine County is 12.7%.
Women in Blaine County earn 87.3 cents for every dollar earned by a man.
What is Inequality or Gini Index in Blaine County?
Inequality or Gini Index in Blaine County is 0.46.
How Large is the Labor Force in Blaine County?
There are 13,934 People in the Labor Forcein in Blaine County.
What is the Percentage of People in the Labor Force in Blaine County?
70.0% of People are in the Labor Force in Blaine County.
What is the Unemployment Rate in Blaine County?
Unemployment Rate in Blaine County is 2.3%.