Bingham County, ID
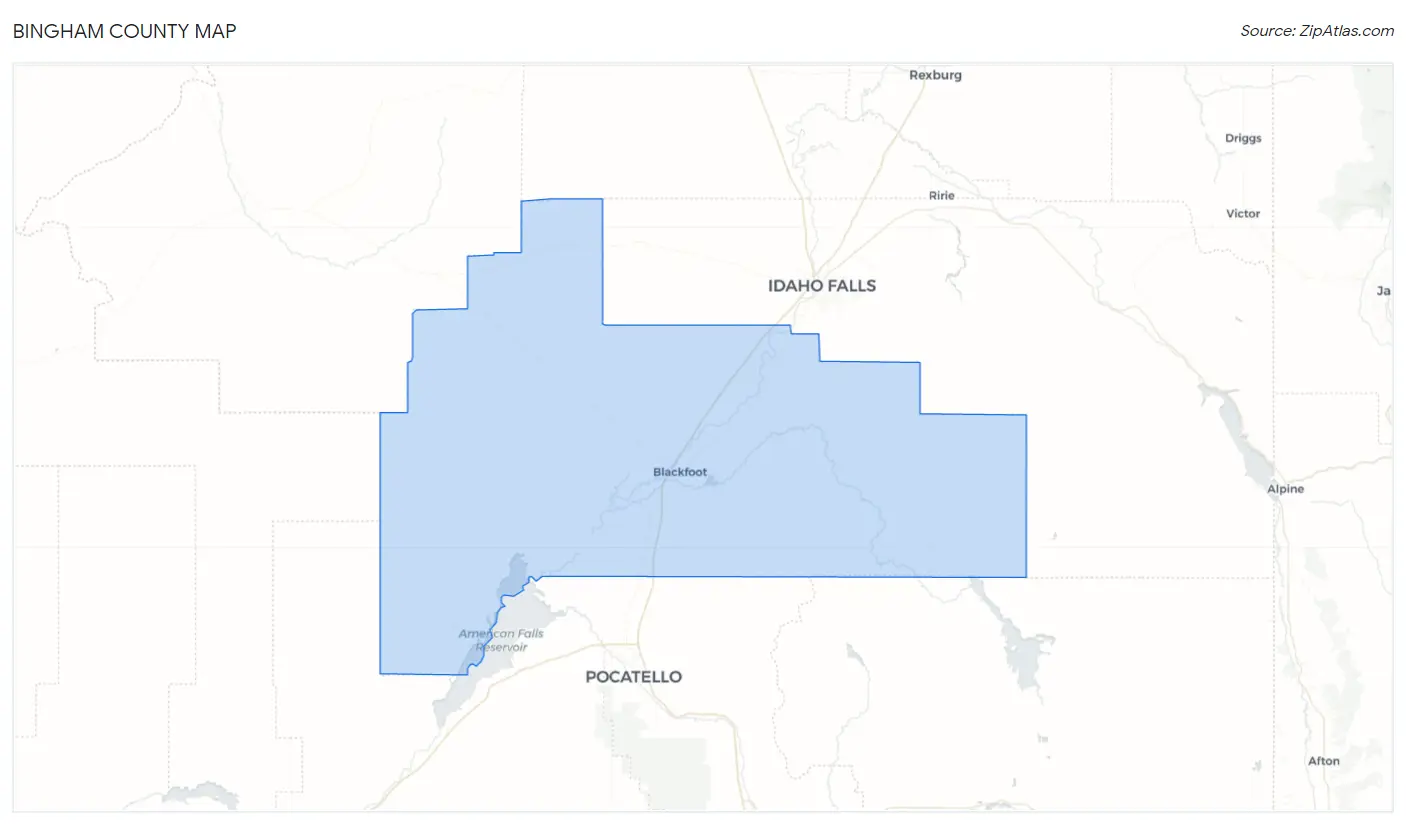
Bingham County Map
Bingham County Overview
48,253
TOTAL POPULATION
24,367
MALE POPULATION
23,886
FEMALE POPULATION
102.01
MALES / 100 FEMALES
98.03
FEMALES / 100 MALES
34.3
MEDIAN AGE
3.6
AVG FAMILY SIZE
3.1
AVG HOUSEHOLD SIZE
$29,421
PER CAPITA INCOME
$79,834
AVG FAMILY INCOME
$69,433
AVG HOUSEHOLD INCOME
40.9%
WAGE / INCOME GAP [ % ]
59.1¢/ $1
WAGE / INCOME GAP [ $ ]
$11,313
FAMILY INCOME DEFICIT
0.43
INEQUALITY / GINI INDEX
23,067
LABOR FORCE [ PEOPLE ]
64.6%
PERCENT IN LABOR FORCE
6.1%
UNEMPLOYMENT RATE
Bingham County Area Codes
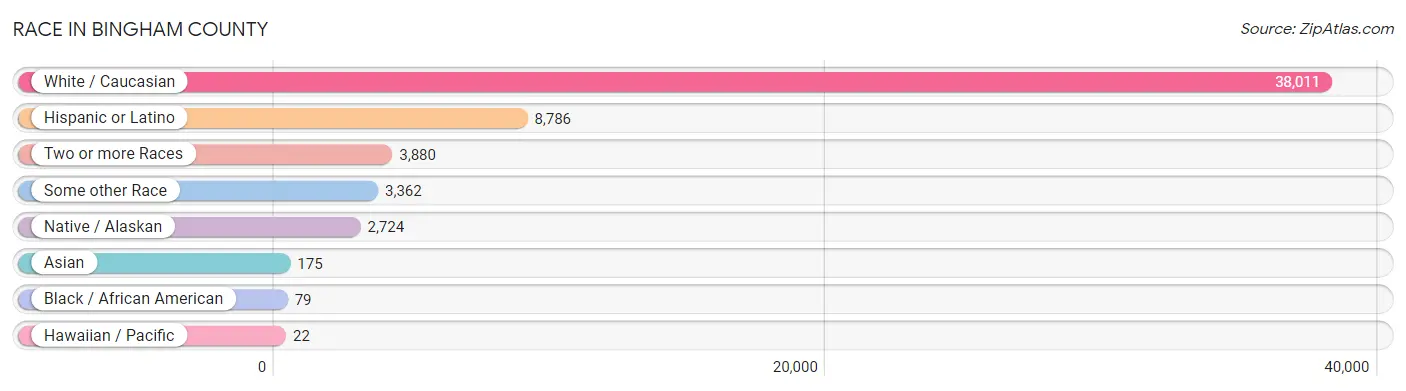
Race in Bingham County
The most populous races in Bingham County are White / Caucasian (38,011 | 78.8%), Hispanic or Latino (8,786 | 18.2%), and Two or more Races (3,880 | 8.0%).
| Race | # Population | % Population |
| Asian | 175 | 0.4% |
| Black / African American | 79 | 0.2% |
| Hawaiian / Pacific | 22 | 0.1% |
| Hispanic or Latino | 8,786 | 18.2% |
| Native / Alaskan | 2,724 | 5.7% |
| White / Caucasian | 38,011 | 78.8% |
| Two or more Races | 3,880 | 8.0% |
| Some other Race | 3,362 | 7.0% |
| Total | 48,253 | 100.0% |
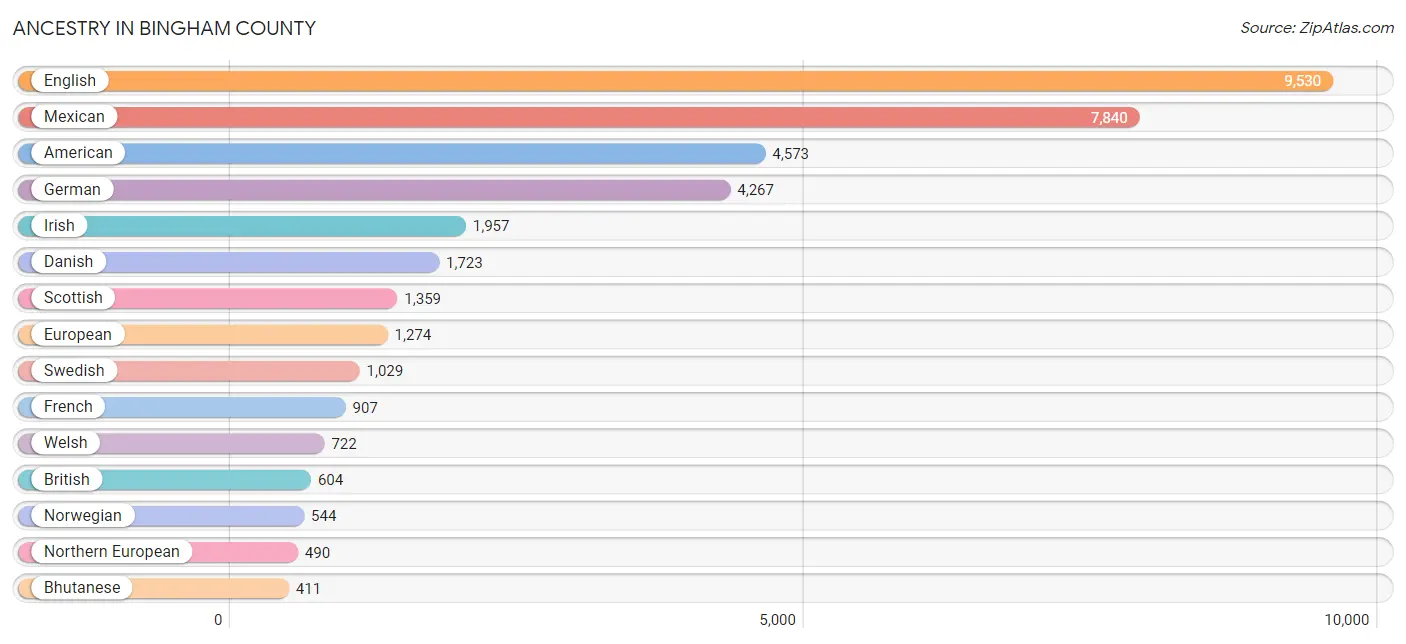
Ancestry in Bingham County
The most populous ancestries reported in Bingham County are English (9,530 | 19.8%), Mexican (7,840 | 16.3%), American (4,573 | 9.5%), German (4,267 | 8.8%), and Irish (1,957 | 4.1%), together accounting for 58.4% of all Bingham County residents.
| Ancestry | # Population | % Population |
| African | 6 | 0.0% |
| Alaska Native | 9 | 0.0% |
| American | 4,573 | 9.5% |
| Apache | 10 | 0.0% |
| Arab | 19 | 0.0% |
| Arapaho | 3 | 0.0% |
| Australian | 9 | 0.0% |
| Basque | 101 | 0.2% |
| Belgian | 77 | 0.2% |
| Bhutanese | 411 | 0.9% |
| Bolivian | 13 | 0.0% |
| British | 604 | 1.3% |
| Burmese | 165 | 0.3% |
| Canadian | 121 | 0.3% |
| Central American | 68 | 0.1% |
| Cherokee | 146 | 0.3% |
| Cheyenne | 10 | 0.0% |
| Chilean | 27 | 0.1% |
| Chippewa | 16 | 0.0% |
| Costa Rican | 1 | 0.0% |
| Czech | 27 | 0.1% |
| Czechoslovakian | 14 | 0.0% |
| Danish | 1,723 | 3.6% |
| Dutch | 229 | 0.5% |
| Eastern European | 65 | 0.1% |
| English | 9,530 | 19.8% |
| European | 1,274 | 2.6% |
| Finnish | 159 | 0.3% |
| French | 907 | 1.9% |
| French Canadian | 91 | 0.2% |
| German | 4,267 | 8.8% |
| Greek | 16 | 0.0% |
| Guatemalan | 24 | 0.1% |
| Hungarian | 32 | 0.1% |
| Indian (Asian) | 23 | 0.1% |
| Irish | 1,957 | 4.1% |
| Israeli | 4 | 0.0% |
| Italian | 402 | 0.8% |
| Korean | 157 | 0.3% |
| Lebanese | 19 | 0.0% |
| Lithuanian | 47 | 0.1% |
| Lumbee | 31 | 0.1% |
| Mexican | 7,840 | 16.3% |
| Mexican American Indian | 27 | 0.1% |
| Native Hawaiian | 90 | 0.2% |
| Navajo | 54 | 0.1% |
| Nicaraguan | 43 | 0.1% |
| Nigerian | 11 | 0.0% |
| Northern European | 490 | 1.0% |
| Norwegian | 544 | 1.1% |
| Paiute | 7 | 0.0% |
| Peruvian | 89 | 0.2% |
| Polish | 152 | 0.3% |
| Portuguese | 160 | 0.3% |
| Potawatomi | 46 | 0.1% |
| Pueblo | 52 | 0.1% |
| Puerto Rican | 28 | 0.1% |
| Puget Sound Salish | 8 | 0.0% |
| Romanian | 9 | 0.0% |
| Russian | 79 | 0.2% |
| Samoan | 202 | 0.4% |
| Scandinavian | 274 | 0.6% |
| Scotch-Irish | 174 | 0.4% |
| Scottish | 1,359 | 2.8% |
| Seminole | 1 | 0.0% |
| Shoshone | 282 | 0.6% |
| Sioux | 17 | 0.0% |
| Slovak | 16 | 0.0% |
| Slovene | 1 | 0.0% |
| South African | 10 | 0.0% |
| South American | 129 | 0.3% |
| Spaniard | 398 | 0.8% |
| Spanish | 34 | 0.1% |
| Sri Lankan | 2 | 0.0% |
| Subsaharan African | 27 | 0.1% |
| Swedish | 1,029 | 2.1% |
| Swiss | 179 | 0.4% |
| Thai | 23 | 0.1% |
| Welsh | 722 | 1.5% | View All 79 Rows |
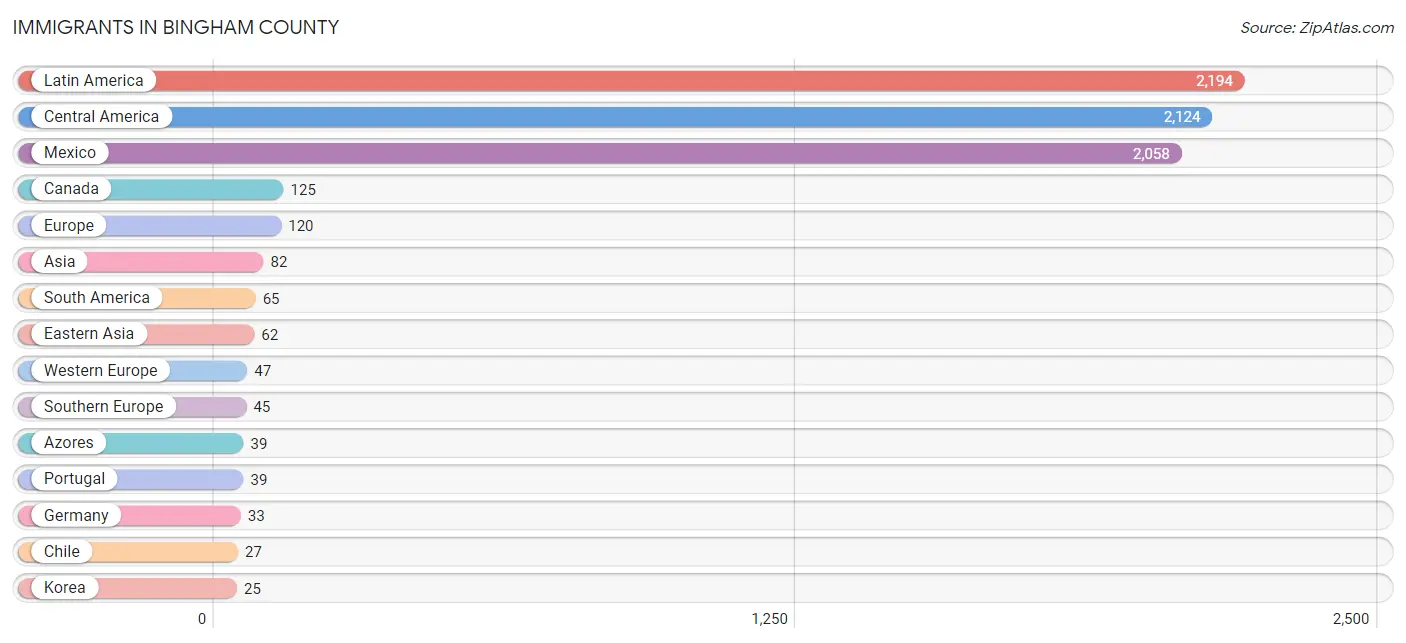
Immigrants in Bingham County
The most numerous immigrant groups reported in Bingham County came from Latin America (2,194 | 4.5%), Central America (2,124 | 4.4%), Mexico (2,058 | 4.3%), Canada (125 | 0.3%), and Europe (120 | 0.3%), together accounting for 13.7% of all Bingham County residents.
| Immigration Origin | # Population | % Population |
| Africa | 10 | 0.0% |
| Asia | 82 | 0.2% |
| Azores | 39 | 0.1% |
| Bolivia | 7 | 0.0% |
| Canada | 125 | 0.3% |
| Caribbean | 5 | 0.0% |
| Central America | 2,124 | 4.4% |
| Chile | 27 | 0.1% |
| China | 14 | 0.0% |
| Eastern Asia | 62 | 0.1% |
| Eastern Europe | 9 | 0.0% |
| El Salvador | 24 | 0.1% |
| England | 3 | 0.0% |
| Europe | 120 | 0.3% |
| France | 6 | 0.0% |
| Germany | 33 | 0.1% |
| Guatemala | 22 | 0.1% |
| Israel | 4 | 0.0% |
| Japan | 23 | 0.1% |
| Korea | 25 | 0.1% |
| Latin America | 2,194 | 4.5% |
| Mexico | 2,058 | 4.3% |
| Netherlands | 8 | 0.0% |
| Nicaragua | 20 | 0.0% |
| Northern Europe | 19 | 0.0% |
| Peru | 22 | 0.1% |
| Philippines | 14 | 0.0% |
| Portugal | 39 | 0.1% |
| Romania | 9 | 0.0% |
| Scotland | 16 | 0.0% |
| South Africa | 10 | 0.0% |
| South America | 65 | 0.1% |
| South Eastern Asia | 16 | 0.0% |
| Southern Europe | 45 | 0.1% |
| Spain | 6 | 0.0% |
| Venezuela | 9 | 0.0% |
| Vietnam | 2 | 0.0% |
| West Indies | 5 | 0.0% |
| Western Asia | 4 | 0.0% |
| Western Europe | 47 | 0.1% | View All 40 Rows |
Sex and Age in Bingham County
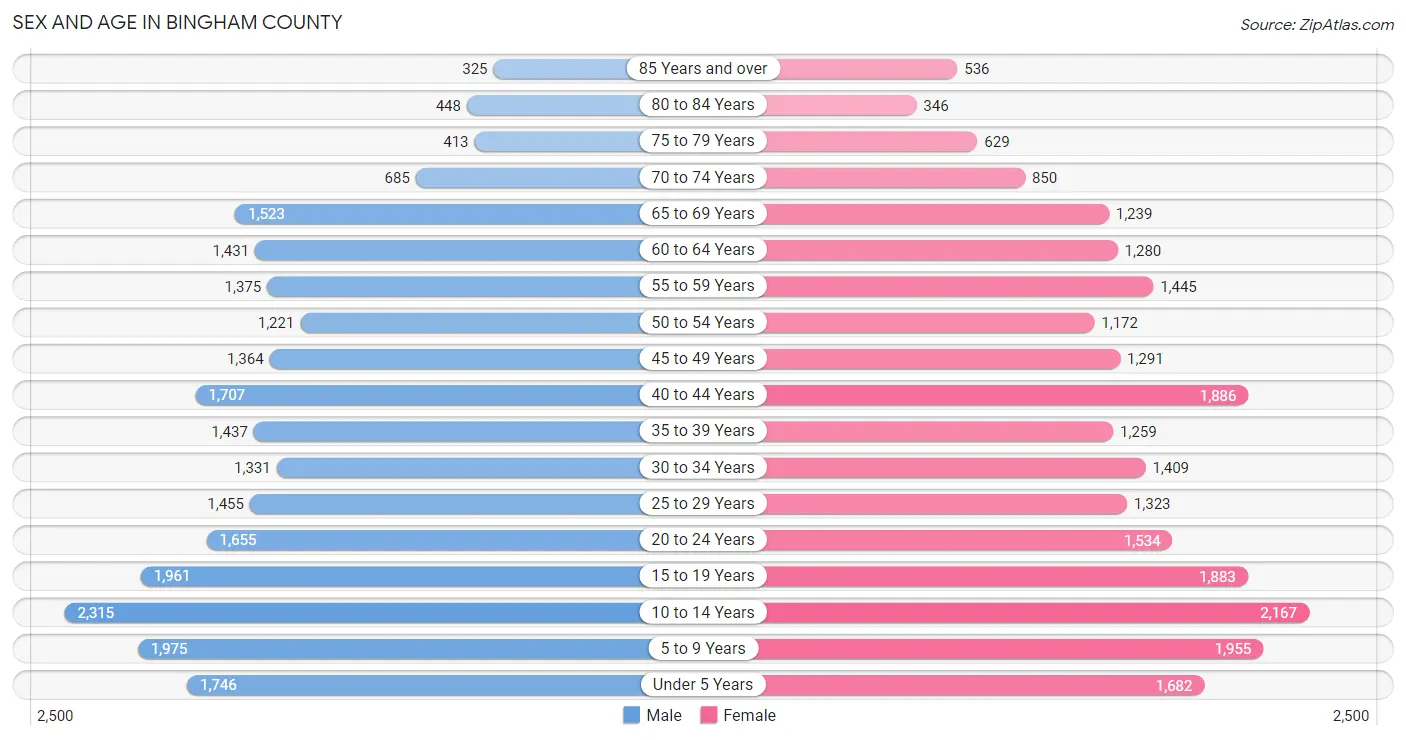
Sex and Age in Bingham County
The most populous age groups in Bingham County are 10 to 14 Years (2,315 | 9.5%) for men and 10 to 14 Years (2,167 | 9.1%) for women.
| Age Bracket | Male | Female |
| Under 5 Years | 1,746 (7.2%) | 1,682 (7.0%) |
| 5 to 9 Years | 1,975 (8.1%) | 1,955 (8.2%) |
| 10 to 14 Years | 2,315 (9.5%) | 2,167 (9.1%) |
| 15 to 19 Years | 1,961 (8.1%) | 1,883 (7.9%) |
| 20 to 24 Years | 1,655 (6.8%) | 1,534 (6.4%) |
| 25 to 29 Years | 1,455 (6.0%) | 1,323 (5.5%) |
| 30 to 34 Years | 1,331 (5.5%) | 1,409 (5.9%) |
| 35 to 39 Years | 1,437 (5.9%) | 1,259 (5.3%) |
| 40 to 44 Years | 1,707 (7.0%) | 1,886 (7.9%) |
| 45 to 49 Years | 1,364 (5.6%) | 1,291 (5.4%) |
| 50 to 54 Years | 1,221 (5.0%) | 1,172 (4.9%) |
| 55 to 59 Years | 1,375 (5.6%) | 1,445 (6.0%) |
| 60 to 64 Years | 1,431 (5.9%) | 1,280 (5.4%) |
| 65 to 69 Years | 1,523 (6.2%) | 1,239 (5.2%) |
| 70 to 74 Years | 685 (2.8%) | 850 (3.6%) |
| 75 to 79 Years | 413 (1.7%) | 629 (2.6%) |
| 80 to 84 Years | 448 (1.8%) | 346 (1.5%) |
| 85 Years and over | 325 (1.3%) | 536 (2.2%) |
| Total | 24,367 (100.0%) | 23,886 (100.0%) |
Families and Households in Bingham County
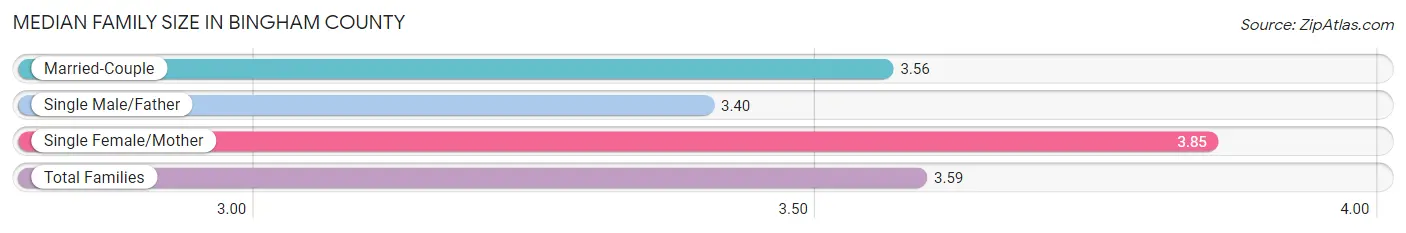
Median Family Size in Bingham County
The median family size in Bingham County is 3.59 persons per family, with single female/mother families (1,684 | 14.2%) accounting for the largest median family size of 3.85 persons per family. On the other hand, single male/father families (877 | 7.4%) represent the smallest median family size with 3.40 persons per family.
| Family Type | # Families | Family Size |
| Married-Couple | 9,284 (78.4%) | 3.56 |
| Single Male/Father | 877 (7.4%) | 3.40 |
| Single Female/Mother | 1,684 (14.2%) | 3.85 |
| Total Families | 11,845 (100.0%) | 3.59 |
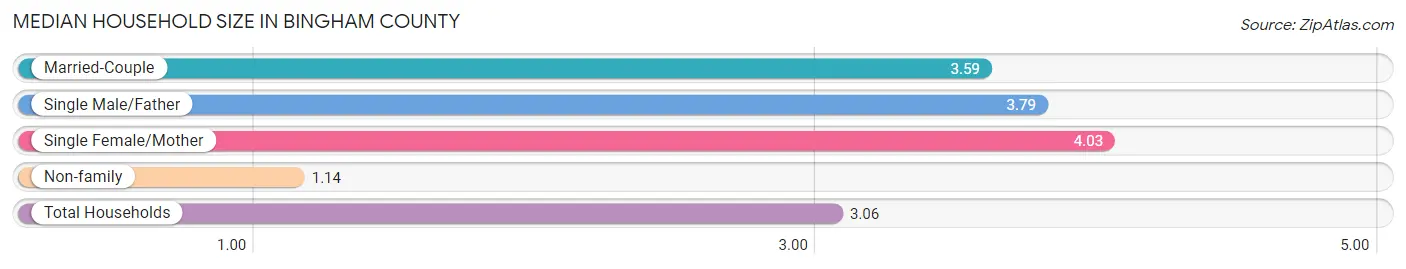
Median Household Size in Bingham County
The median household size in Bingham County is 3.06 persons per household, with single female/mother households (1,684 | 10.8%) accounting for the largest median household size of 4.03 persons per household. non-family households (3,782 | 24.2%) represent the smallest median household size with 1.14 persons per household.
| Household Type | # Households | Household Size |
| Married-Couple | 9,284 (59.4%) | 3.59 |
| Single Male/Father | 877 (5.6%) | 3.79 |
| Single Female/Mother | 1,684 (10.8%) | 4.03 |
| Non-family | 3,782 (24.2%) | 1.14 |
| Total Households | 15,627 (100.0%) | 3.06 |
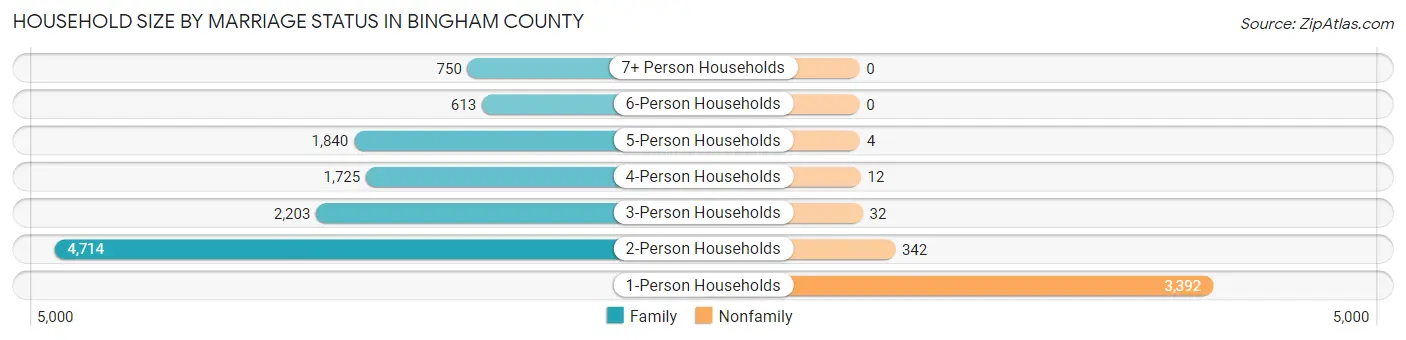
Household Size by Marriage Status in Bingham County
Out of a total of 15,627 households in Bingham County, 11,845 (75.8%) are family households, while 3,782 (24.2%) are nonfamily households. The most numerous type of family households are 2-person households, comprising 4,714, and the most common type of nonfamily households are 1-person households, comprising 3,392.
| Household Size | Family Households | Nonfamily Households |
| 1-Person Households | - | 3,392 (21.7%) |
| 2-Person Households | 4,714 (30.2%) | 342 (2.2%) |
| 3-Person Households | 2,203 (14.1%) | 32 (0.2%) |
| 4-Person Households | 1,725 (11.0%) | 12 (0.1%) |
| 5-Person Households | 1,840 (11.8%) | 4 (0.0%) |
| 6-Person Households | 613 (3.9%) | 0 (0.0%) |
| 7+ Person Households | 750 (4.8%) | 0 (0.0%) |
| Total | 11,845 (75.8%) | 3,782 (24.2%) |
Female Fertility in Bingham County
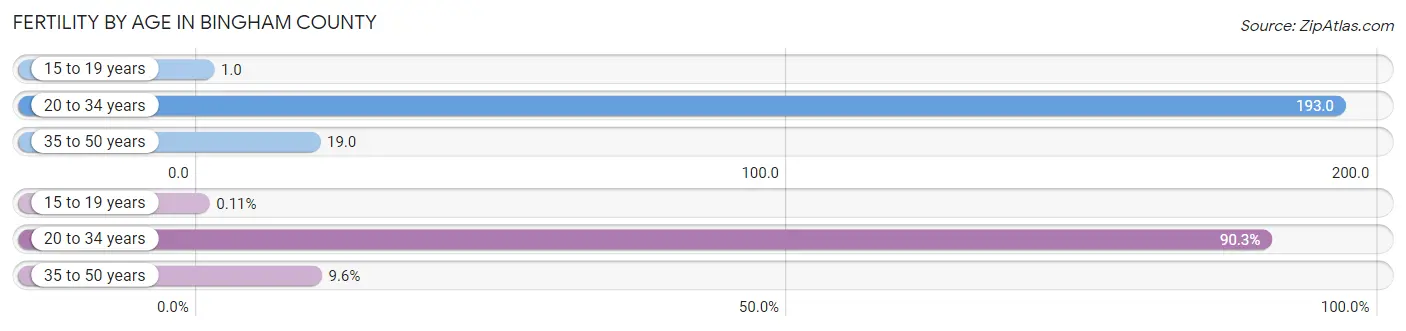
Fertility by Age in Bingham County
Average fertility rate in Bingham County is 85.0 births per 1,000 women. Women in the age bracket of 20 to 34 years have the highest fertility rate with 193.0 births per 1,000 women. Women in the age bracket of 20 to 34 years acount for 90.3% of all women with births.
| Age Bracket | Women with Births | Births / 1,000 Women |
| 15 to 19 years | 1 (0.1%) | 1.0 |
| 20 to 34 years | 825 (90.3%) | 193.0 |
| 35 to 50 years | 88 (9.6%) | 19.0 |
| Total | 914 (100.0%) | 85.0 |
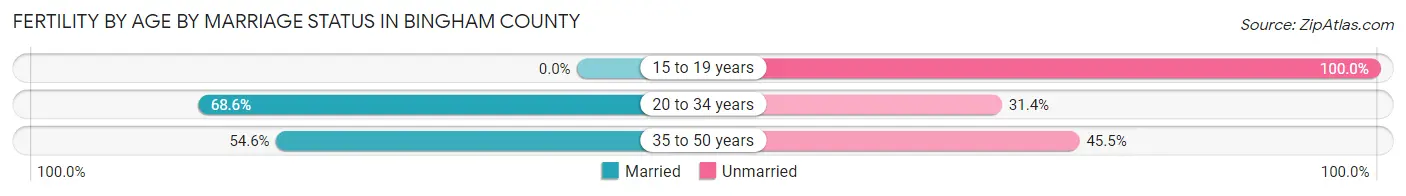
Fertility by Age by Marriage Status in Bingham County
67.2% of women with births (914) in Bingham County are married. The highest percentage of unmarried women with births falls into 15 to 19 years age bracket with 100.0% of them unmarried at the time of birth, while the lowest percentage of unmarried women with births belong to 20 to 34 years age bracket with 31.4% of them unmarried.
| Age Bracket | Married | Unmarried |
| 15 to 19 years | 0 (0.0%) | 1 (100.0%) |
| 20 to 34 years | 566 (68.6%) | 259 (31.4%) |
| 35 to 50 years | 48 (54.5%) | 40 (45.5%) |
| Total | 614 (67.2%) | 300 (32.8%) |
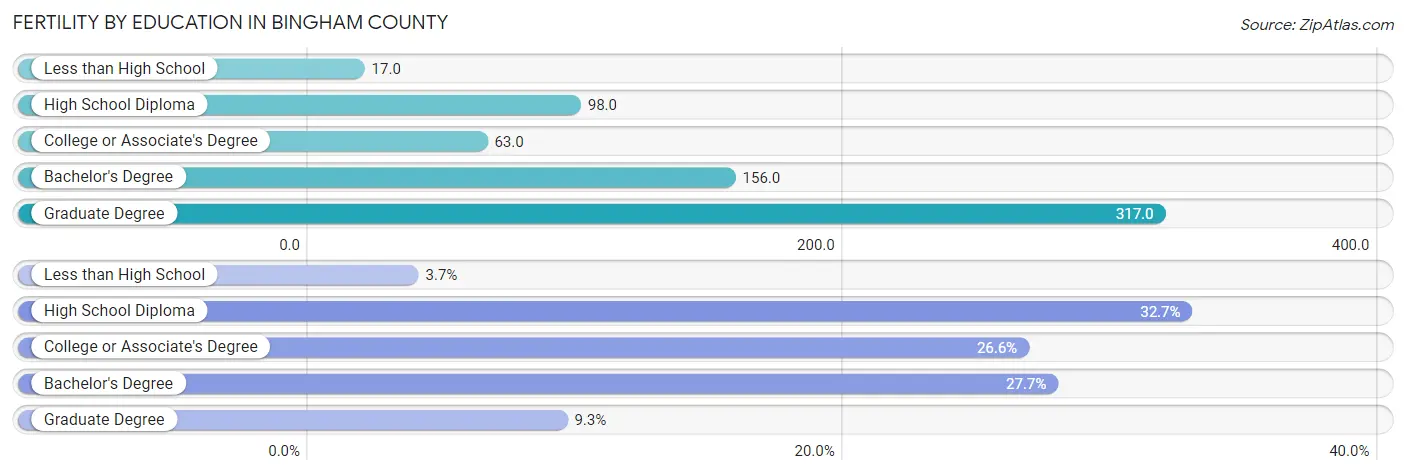
Fertility by Education in Bingham County
Average fertility rate in Bingham County is 85.0 births per 1,000 women. Women with the education attainment of graduate degree have the highest fertility rate of 317.0 births per 1,000 women, while women with the education attainment of less than high school have the lowest fertility at 17.0 births per 1,000 women. Women with the education attainment of high school diploma represent 32.7% of all women with births.
| Educational Attainment | Women with Births | Births / 1,000 Women |
| Less than High School | 34 (3.7%) | 17.0 |
| High School Diploma | 299 (32.7%) | 98.0 |
| College or Associate's Degree | 243 (26.6%) | 63.0 |
| Bachelor's Degree | 253 (27.7%) | 156.0 |
| Graduate Degree | 85 (9.3%) | 317.0 |
| Total | 914 (100.0%) | 85.0 |
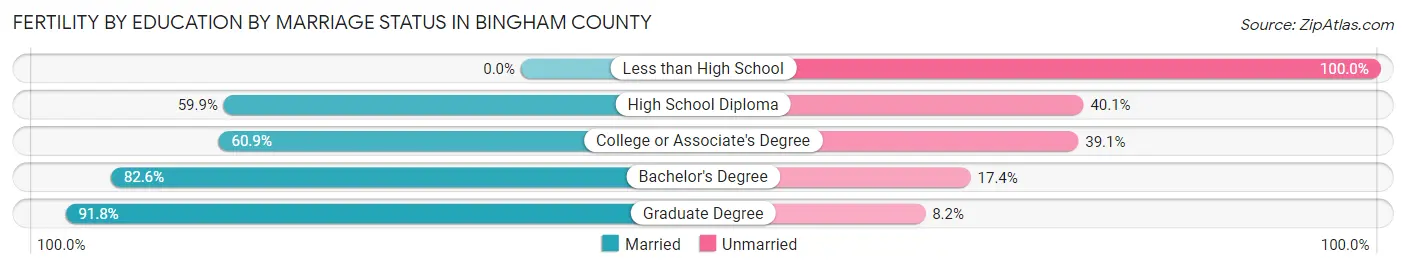
Fertility by Education by Marriage Status in Bingham County
32.8% of women with births in Bingham County are unmarried. Women with the educational attainment of graduate degree are most likely to be married with 91.8% of them married at childbirth, while women with the educational attainment of less than high school are least likely to be married with 100.0% of them unmarried at childbirth.
| Educational Attainment | Married | Unmarried |
| Less than High School | 0 (0.0%) | 34 (100.0%) |
| High School Diploma | 179 (59.9%) | 120 (40.1%) |
| College or Associate's Degree | 148 (60.9%) | 95 (39.1%) |
| Bachelor's Degree | 209 (82.6%) | 44 (17.4%) |
| Graduate Degree | 78 (91.8%) | 7 (8.2%) |
| Total | 614 (67.2%) | 300 (32.8%) |
Income in Bingham County
Income Overview in Bingham County
Per Capita Income in Bingham County is $29,421, while median incomes of families and households are $79,834 and $69,433 respectively.
| Characteristic | Number | Measure |
| Per Capita Income | 48,253 | $29,421 |
| Median Family Income | 11,845 | $79,834 |
| Mean Family Income | 11,845 | $102,829 |
| Median Household Income | 15,627 | $69,433 |
| Mean Household Income | 15,627 | $89,090 |
| Income Deficit | 11,845 | $11,313 |
| Wage / Income Gap (%) | 48,253 | 40.86% |
| Wage / Income Gap ($) | 48,253 | 59.14¢ per $1 |
| Gini / Inequality Index | 48,253 | 0.43 |
Earnings by Sex in Bingham County
Average Earnings in Bingham County are $32,815, $41,964 for men and $24,817 for women, a difference of 40.9%.
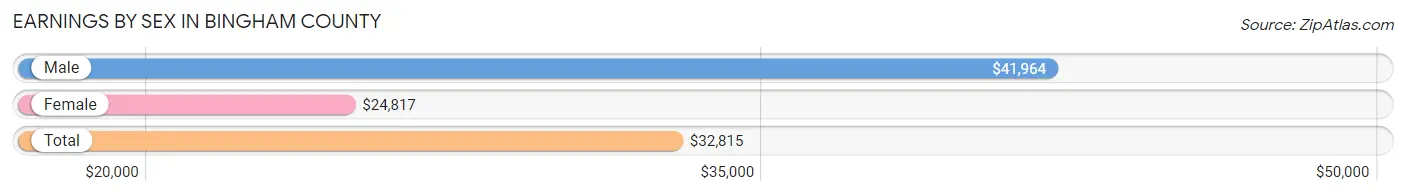
| Sex | Number | Average Earnings |
| Male | 13,415 (54.2%) | $41,964 |
| Female | 11,314 (45.8%) | $24,817 |
| Total | 24,729 (100.0%) | $32,815 |
Earnings by Sex by Income Bracket in Bingham County
The most common earnings brackets in Bingham County are $100,000+ for men (1,810 | 13.5%) and $2,499 or less for women (1,198 | 10.6%).
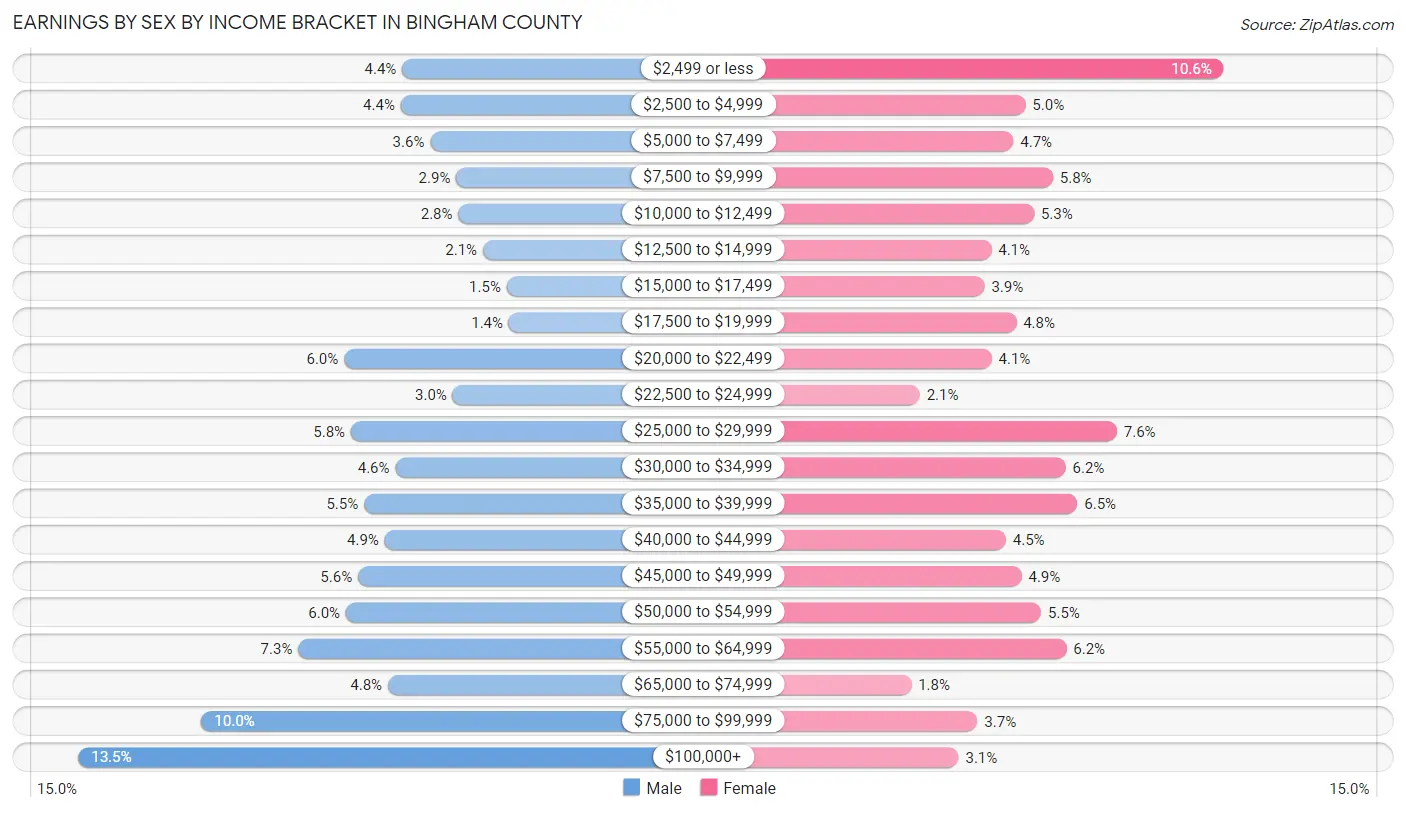
| Income | Male | Female |
| $2,499 or less | 589 (4.4%) | 1,198 (10.6%) |
| $2,500 to $4,999 | 594 (4.4%) | 568 (5.0%) |
| $5,000 to $7,499 | 483 (3.6%) | 530 (4.7%) |
| $7,500 to $9,999 | 385 (2.9%) | 655 (5.8%) |
| $10,000 to $12,499 | 377 (2.8%) | 595 (5.3%) |
| $12,500 to $14,999 | 284 (2.1%) | 459 (4.1%) |
| $15,000 to $17,499 | 194 (1.5%) | 438 (3.9%) |
| $17,500 to $19,999 | 186 (1.4%) | 538 (4.8%) |
| $20,000 to $22,499 | 807 (6.0%) | 461 (4.1%) |
| $22,500 to $24,999 | 399 (3.0%) | 232 (2.1%) |
| $25,000 to $29,999 | 782 (5.8%) | 859 (7.6%) |
| $30,000 to $34,999 | 614 (4.6%) | 696 (6.1%) |
| $35,000 to $39,999 | 733 (5.5%) | 733 (6.5%) |
| $40,000 to $44,999 | 654 (4.9%) | 506 (4.5%) |
| $45,000 to $49,999 | 755 (5.6%) | 555 (4.9%) |
| $50,000 to $54,999 | 801 (6.0%) | 618 (5.5%) |
| $55,000 to $64,999 | 981 (7.3%) | 698 (6.2%) |
| $65,000 to $74,999 | 642 (4.8%) | 205 (1.8%) |
| $75,000 to $99,999 | 1,345 (10.0%) | 415 (3.7%) |
| $100,000+ | 1,810 (13.5%) | 355 (3.1%) |
| Total | 13,415 (100.0%) | 11,314 (100.0%) |
Earnings by Sex by Educational Attainment in Bingham County
Average earnings in Bingham County are $49,787 for men and $29,792 for women, a difference of 40.2%. Men with an educational attainment of graduate degree enjoy the highest average annual earnings of $100,234, while those with less than high school education earn the least with $35,429. Women with an educational attainment of graduate degree earn the most with the average annual earnings of $60,354, while those with high school diploma education have the smallest earnings of $22,857.
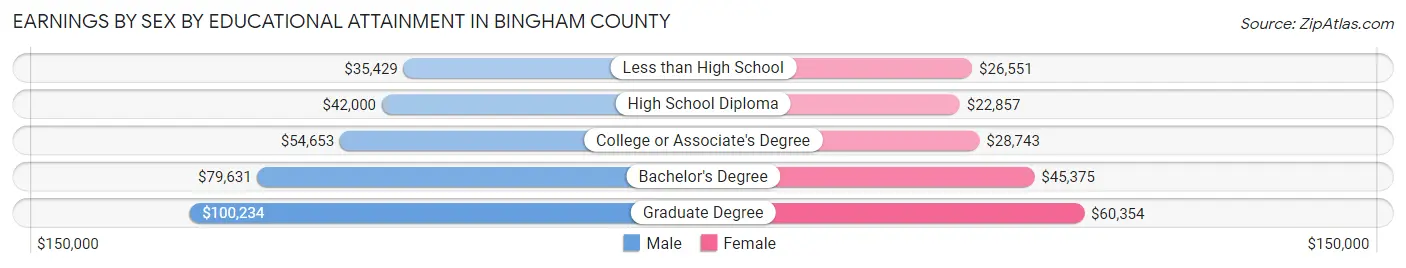
| Educational Attainment | Male Income | Female Income |
| Less than High School | $35,429 | $26,551 |
| High School Diploma | $42,000 | $22,857 |
| College or Associate's Degree | $54,653 | $28,743 |
| Bachelor's Degree | $79,631 | $45,375 |
| Graduate Degree | $100,234 | $60,354 |
| Total | $49,787 | $29,792 |
Family Income in Bingham County
Family Income Brackets in Bingham County
According to the Bingham County family income data, there are 2,760 families falling into the $100,000 to $149,999 income range, which is the most common income bracket and makes up 23.3% of all families. Conversely, the $10,000 to $14,999 income bracket is the least frequent group with only 107 families (0.9%) belonging to this category.
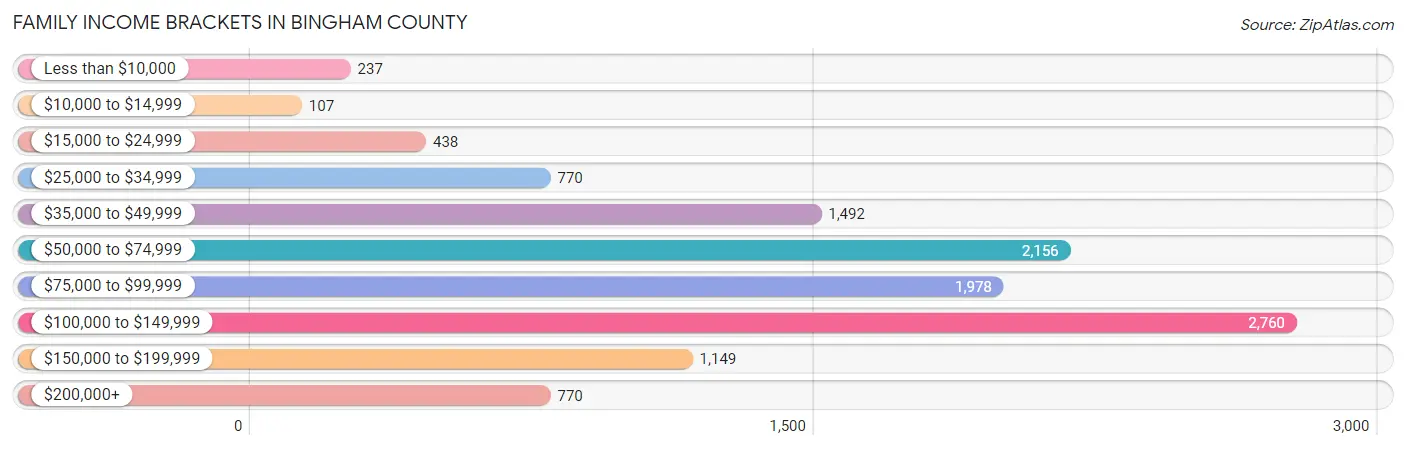
| Income Bracket | # Families | % Families |
| Less than $10,000 | 237 | 2.0% |
| $10,000 to $14,999 | 107 | 0.9% |
| $15,000 to $24,999 | 438 | 3.7% |
| $25,000 to $34,999 | 770 | 6.5% |
| $35,000 to $49,999 | 1,492 | 12.6% |
| $50,000 to $74,999 | 2,156 | 18.2% |
| $75,000 to $99,999 | 1,978 | 16.7% |
| $100,000 to $149,999 | 2,760 | 23.3% |
| $150,000 to $199,999 | 1,149 | 9.7% |
| $200,000+ | 770 | 6.5% |
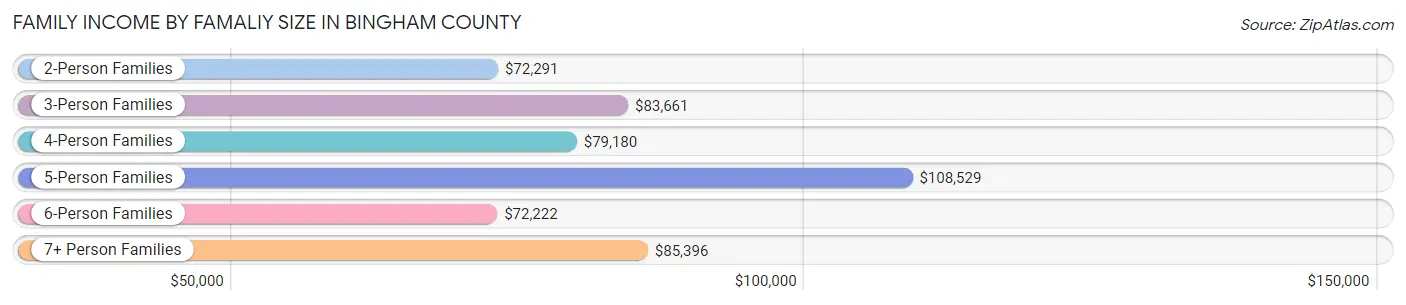
Family Income by Famaliy Size in Bingham County
5-person families (1,690 | 14.3%) account for the highest median family income in Bingham County with $108,529 per family, while 2-person families (5,027 | 42.4%) have the highest median income of $36,146 per family member.
| Income Bracket | # Families | Median Income |
| 2-Person Families | 5,027 (42.4%) | $72,291 |
| 3-Person Families | 2,035 (17.2%) | $83,661 |
| 4-Person Families | 1,790 (15.1%) | $79,180 |
| 5-Person Families | 1,690 (14.3%) | $108,529 |
| 6-Person Families | 580 (4.9%) | $72,222 |
| 7+ Person Families | 723 (6.1%) | $85,396 |
| Total | 11,845 (100.0%) | $79,834 |
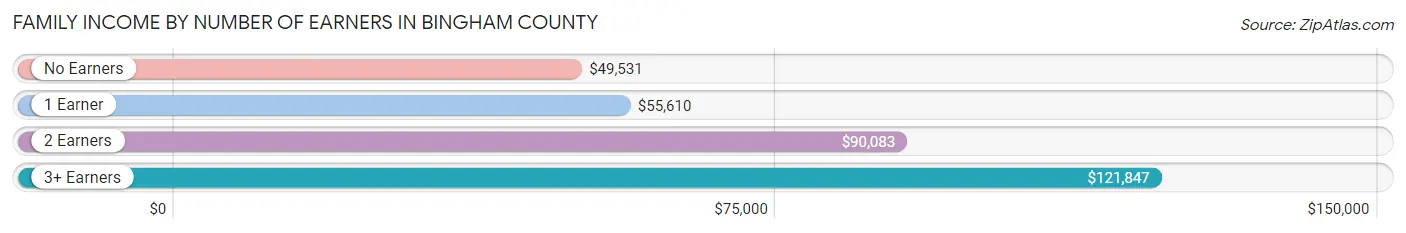
Family Income by Number of Earners in Bingham County
The median family income in Bingham County is $79,834, with families comprising 3+ earners (2,427) having the highest median family income of $121,847, while families with no earners (1,421) have the lowest median family income of $49,531, accounting for 20.5% and 12.0% of families, respectively.
| Number of Earners | # Families | Median Income |
| No Earners | 1,421 (12.0%) | $49,531 |
| 1 Earner | 3,679 (31.1%) | $55,610 |
| 2 Earners | 4,318 (36.4%) | $90,083 |
| 3+ Earners | 2,427 (20.5%) | $121,847 |
| Total | 11,845 (100.0%) | $79,834 |
Household Income in Bingham County
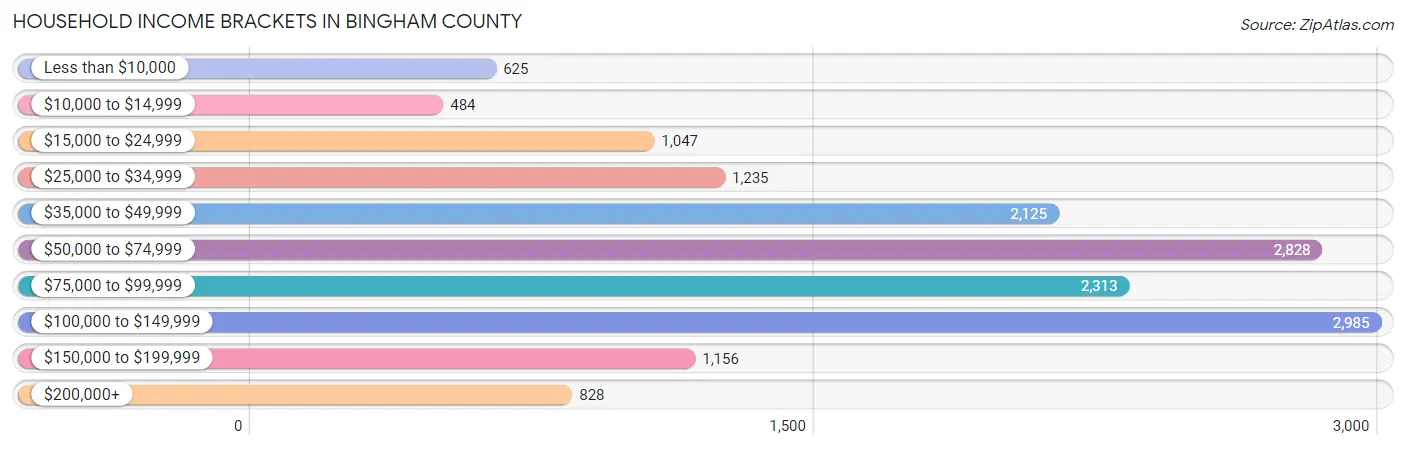
Household Income Brackets in Bingham County
With 2,985 households falling in the category, the $100,000 to $149,999 income range is the most frequent in Bingham County, accounting for 19.1% of all households. In contrast, only 484 households (3.1%) fall into the $10,000 to $14,999 income bracket, making it the least populous group.
| Income Bracket | # Households | % Households |
| Less than $10,000 | 625 | 4.0% |
| $10,000 to $14,999 | 484 | 3.1% |
| $15,000 to $24,999 | 1,047 | 6.7% |
| $25,000 to $34,999 | 1,235 | 7.9% |
| $35,000 to $49,999 | 2,125 | 13.6% |
| $50,000 to $74,999 | 2,828 | 18.1% |
| $75,000 to $99,999 | 2,313 | 14.8% |
| $100,000 to $149,999 | 2,985 | 19.1% |
| $150,000 to $199,999 | 1,156 | 7.4% |
| $200,000+ | 828 | 5.3% |
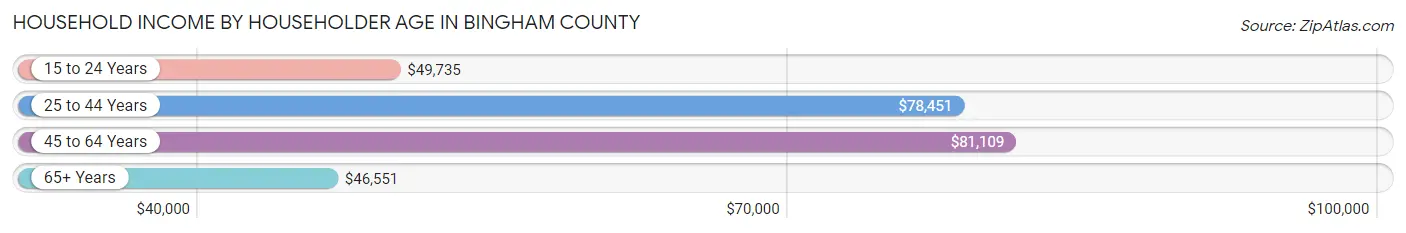
Household Income by Householder Age in Bingham County
The median household income in Bingham County is $69,433, with the highest median household income of $81,109 found in the 45 to 64 years age bracket for the primary householder. A total of 5,785 households (37.0%) fall into this category. Meanwhile, the 65+ years age bracket for the primary householder has the lowest median household income of $46,551, with 4,383 households (28.1%) in this group.
| Income Bracket | # Households | Median Income |
| 15 to 24 Years | 637 (4.1%) | $49,735 |
| 25 to 44 Years | 4,822 (30.9%) | $78,451 |
| 45 to 64 Years | 5,785 (37.0%) | $81,109 |
| 65+ Years | 4,383 (28.1%) | $46,551 |
| Total | 15,627 (100.0%) | $69,433 |
Poverty in Bingham County
Income Below Poverty by Sex and Age in Bingham County
With 10.7% poverty level for males and 10.0% for females among the residents of Bingham County, 15 year old males and 25 to 34 year old females are the most vulnerable to poverty, with 105 males (32.5%) and 385 females (14.1%) in their respective age groups living below the poverty level.
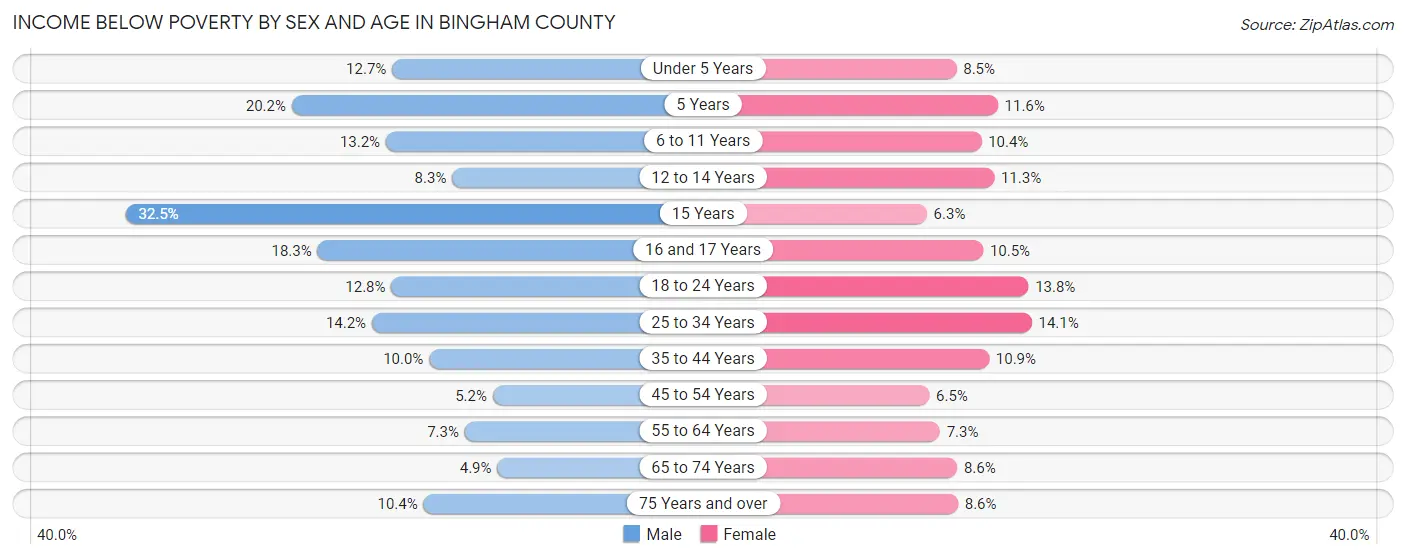
| Age Bracket | Male | Female |
| Under 5 Years | 222 (12.7%) | 143 (8.5%) |
| 5 Years | 76 (20.2%) | 39 (11.6%) |
| 6 to 11 Years | 335 (13.2%) | 250 (10.3%) |
| 12 to 14 Years | 105 (8.3%) | 137 (11.3%) |
| 15 Years | 105 (32.5%) | 24 (6.3%) |
| 16 and 17 Years | 184 (18.2%) | 90 (10.5%) |
| 18 to 24 Years | 289 (12.8%) | 296 (13.8%) |
| 25 to 34 Years | 391 (14.2%) | 385 (14.1%) |
| 35 to 44 Years | 311 (10.0%) | 343 (10.9%) |
| 45 to 54 Years | 133 (5.2%) | 157 (6.5%) |
| 55 to 64 Years | 205 (7.3%) | 196 (7.3%) |
| 65 to 74 Years | 106 (4.9%) | 175 (8.6%) |
| 75 Years and over | 119 (10.4%) | 123 (8.6%) |
| Total | 2,581 (10.7%) | 2,358 (10.0%) |
Income Above Poverty by Sex and Age in Bingham County
According to the poverty statistics in Bingham County, males aged 65 to 74 years and females aged 15 years are the age groups that are most secure financially, with 95.1% of males and 93.7% of females in these age groups living above the poverty line.
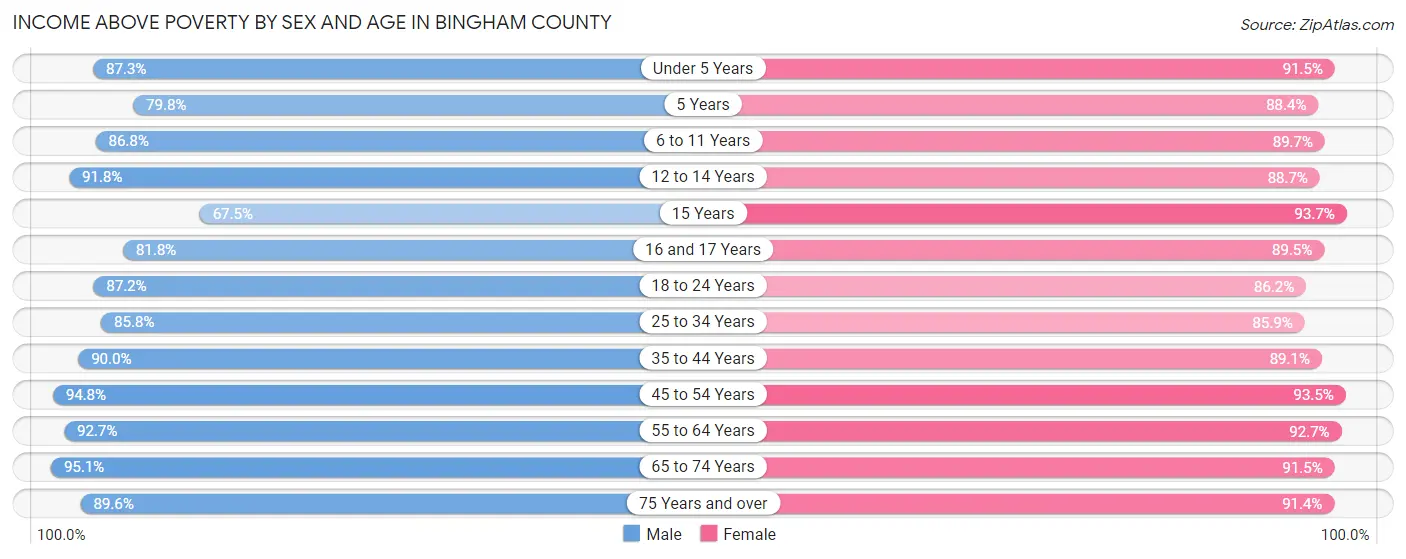
| Age Bracket | Male | Female |
| Under 5 Years | 1,524 (87.3%) | 1,539 (91.5%) |
| 5 Years | 301 (79.8%) | 298 (88.4%) |
| 6 to 11 Years | 2,208 (86.8%) | 2,165 (89.6%) |
| 12 to 14 Years | 1,168 (91.7%) | 1,075 (88.7%) |
| 15 Years | 218 (67.5%) | 357 (93.7%) |
| 16 and 17 Years | 824 (81.8%) | 769 (89.5%) |
| 18 to 24 Years | 1,975 (87.2%) | 1,843 (86.2%) |
| 25 to 34 Years | 2,360 (85.8%) | 2,347 (85.9%) |
| 35 to 44 Years | 2,811 (90.0%) | 2,797 (89.1%) |
| 45 to 54 Years | 2,405 (94.8%) | 2,265 (93.5%) |
| 55 to 64 Years | 2,595 (92.7%) | 2,500 (92.7%) |
| 65 to 74 Years | 2,056 (95.1%) | 1,871 (91.4%) |
| 75 Years and over | 1,027 (89.6%) | 1,305 (91.4%) |
| Total | 21,472 (89.3%) | 21,131 (90.0%) |
Income Below Poverty Among Married-Couple Families in Bingham County
The poverty statistics for married-couple families in Bingham County show that 3.3% or 303 of the total 9,284 families live below the poverty line. Families with 5 or more children have the highest poverty rate of 14.0%, comprising of 40 families. On the other hand, families with no children have the lowest poverty rate of 1.9%, which includes 90 families.
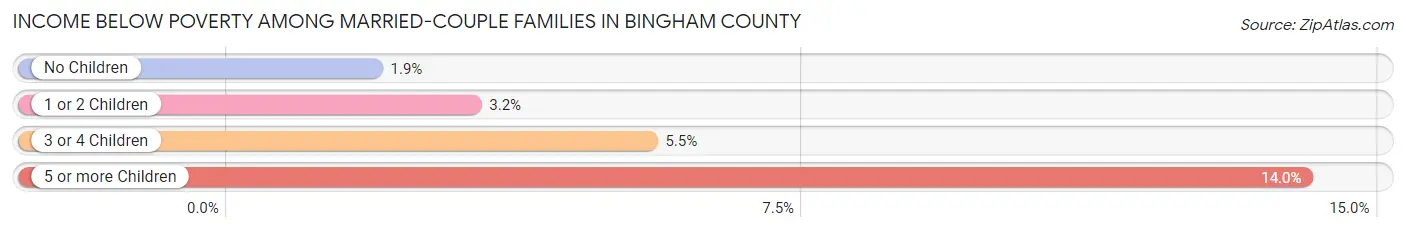
| Children | Above Poverty | Below Poverty |
| No Children | 4,657 (98.1%) | 90 (1.9%) |
| 1 or 2 Children | 2,547 (96.8%) | 84 (3.2%) |
| 3 or 4 Children | 1,532 (94.5%) | 89 (5.5%) |
| 5 or more Children | 245 (86.0%) | 40 (14.0%) |
| Total | 8,981 (96.7%) | 303 (3.3%) |
Income Below Poverty Among Single-Parent Households in Bingham County
According to the poverty data in Bingham County, 11.3% or 99 single-father households and 21.2% or 357 single-mother households are living below the poverty line. Among single-father households, those with 1 or 2 children have the highest poverty rate, with 77 households (18.8%) experiencing poverty. Likewise, among single-mother households, those with 5 or more children have the highest poverty rate, with 16 households (50.0%) falling below the poverty line.
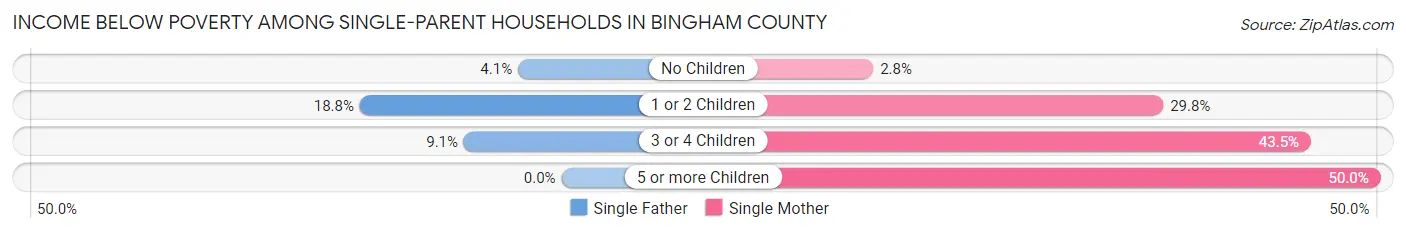
| Children | Single Father | Single Mother |
| No Children | 14 (4.1%) | 19 (2.8%) |
| 1 or 2 Children | 77 (18.8%) | 208 (29.8%) |
| 3 or 4 Children | 8 (9.1%) | 114 (43.5%) |
| 5 or more Children | 0 (0.0%) | 16 (50.0%) |
| Total | 99 (11.3%) | 357 (21.2%) |
Income Below Poverty Among Married-Couple vs Single-Parent Households in Bingham County
The poverty data for Bingham County shows that 303 of the married-couple family households (3.3%) and 456 of the single-parent households (17.8%) are living below the poverty level. Within the married-couple family households, those with 5 or more children have the highest poverty rate, with 40 households (14.0%) falling below the poverty line. Among the single-parent households, those with 3 or 4 children have the highest poverty rate, with 122 household (34.9%) living below poverty.
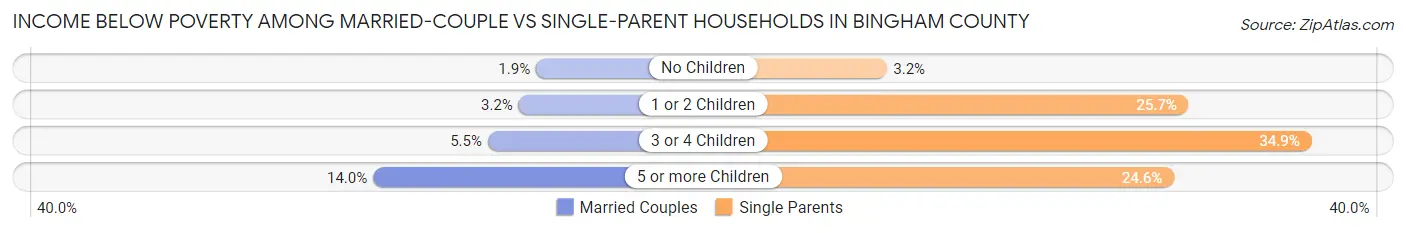
| Children | Married-Couple Families | Single-Parent Households |
| No Children | 90 (1.9%) | 33 (3.2%) |
| 1 or 2 Children | 84 (3.2%) | 285 (25.7%) |
| 3 or 4 Children | 89 (5.5%) | 122 (34.9%) |
| 5 or more Children | 40 (14.0%) | 16 (24.6%) |
| Total | 303 (3.3%) | 456 (17.8%) |
Employment Characteristics in Bingham County
Employment by Class of Employer in Bingham County
Among the 21,253 employed individuals in Bingham County, private company employees (13,983 | 65.8%), local government employees (1,776 | 8.4%), and self-employed (not incorporated) (1,757 | 8.3%) make up the most common classes of employment.
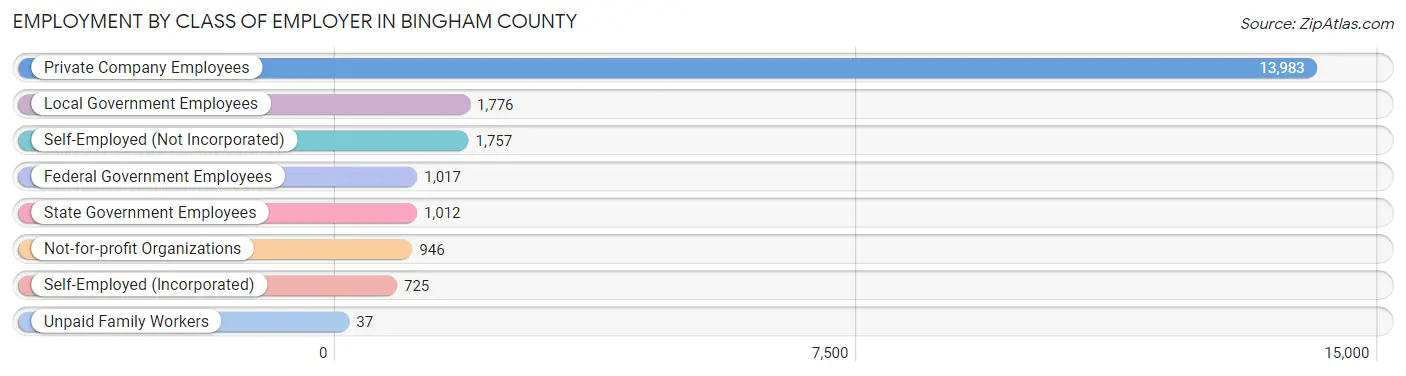
| Employer Class | # Employees | % Employees |
| Private Company Employees | 13,983 | 65.8% |
| Self-Employed (Incorporated) | 725 | 3.4% |
| Self-Employed (Not Incorporated) | 1,757 | 8.3% |
| Not-for-profit Organizations | 946 | 4.4% |
| Local Government Employees | 1,776 | 8.4% |
| State Government Employees | 1,012 | 4.8% |
| Federal Government Employees | 1,017 | 4.8% |
| Unpaid Family Workers | 37 | 0.2% |
| Total | 21,253 | 100.0% |
Employment Status by Age in Bingham County
According to the labor force statistics for Bingham County, out of the total population over 16 years of age (35,708), 64.6% or 23,067 individuals are in the labor force, with 6.1% or 1,407 of them unemployed. The age group with the highest labor force participation rate is 20 to 24 years, with 84.7% or 2,701 individuals in the labor force. Within the labor force, the 16 to 19 years age range has the highest percentage of unemployed individuals, with 19.7% or 329 of them being unemployed.
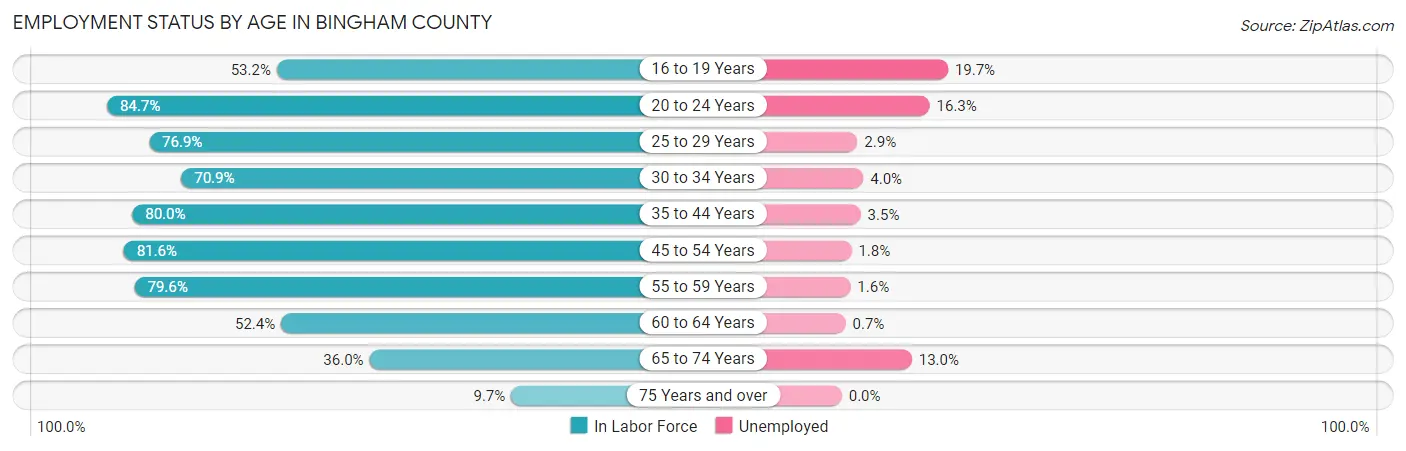
| Age Bracket | In Labor Force | Unemployed |
| 16 to 19 Years | 1,670 (53.2%) | 329 (19.7%) |
| 20 to 24 Years | 2,701 (84.7%) | 440 (16.3%) |
| 25 to 29 Years | 2,136 (76.9%) | 62 (2.9%) |
| 30 to 34 Years | 1,943 (70.9%) | 78 (4.0%) |
| 35 to 44 Years | 5,031 (80.0%) | 176 (3.5%) |
| 45 to 54 Years | 4,119 (81.6%) | 74 (1.8%) |
| 55 to 59 Years | 2,245 (79.6%) | 36 (1.6%) |
| 60 to 64 Years | 1,421 (52.4%) | 10 (0.7%) |
| 65 to 74 Years | 1,547 (36.0%) | 201 (13.0%) |
| 75 Years and over | 262 (9.7%) | 0 (0.0%) |
| Total | 23,067 (64.6%) | 1,407 (6.1%) |
Employment Status by Educational Attainment in Bingham County
According to labor force statistics for Bingham County, 75.5% of individuals (16,901) out of the total population between 25 and 64 years of age (22,386) are in the labor force, with 2.6% or 439 of them being unemployed. The group with the highest labor force participation rate are those with the educational attainment of bachelor's degree or higher, with 78.2% or 3,494 individuals in the labor force. Within the labor force, individuals with less than high school education have the highest percentage of unemployment, with 6.9% or 136 of them being unemployed.
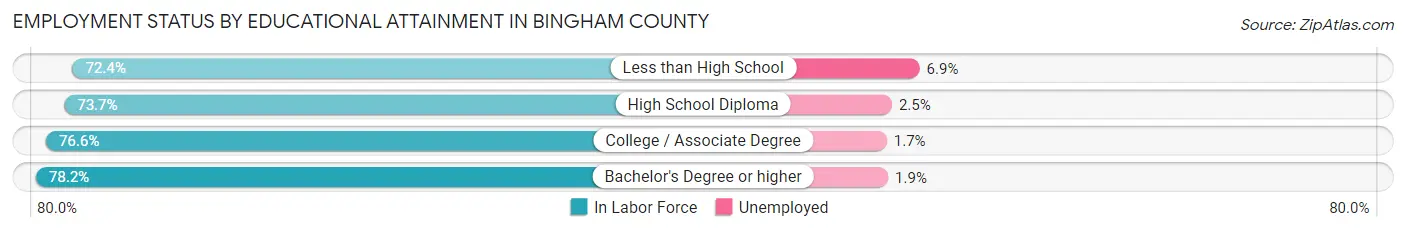
| Educational Attainment | In Labor Force | Unemployed |
| Less than High School | 1,975 (72.4%) | 188 (6.9%) |
| High School Diploma | 5,334 (73.7%) | 181 (2.5%) |
| College / Associate Degree | 6,092 (76.6%) | 135 (1.7%) |
| Bachelor's Degree or higher | 3,494 (78.2%) | 85 (1.9%) |
| Total | 16,901 (75.5%) | 582 (2.6%) |
Employment Occupations by Sex in Bingham County
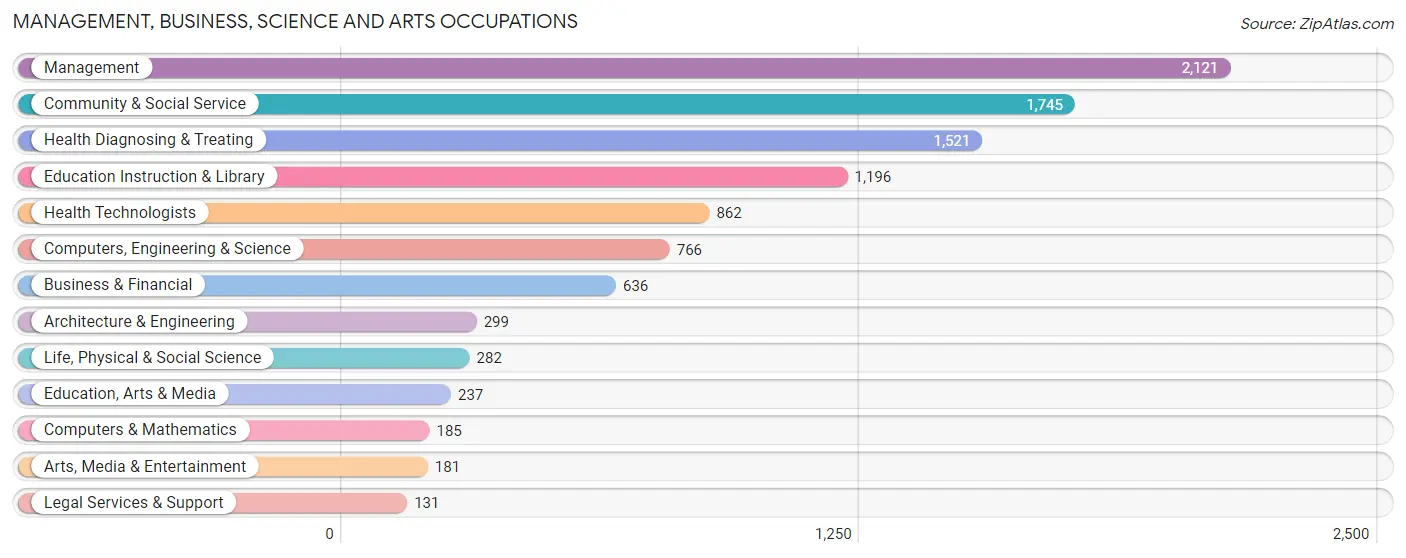
Management, Business, Science and Arts Occupations
The most common Management, Business, Science and Arts occupations in Bingham County are Management (2,121 | 9.8%), Community & Social Service (1,745 | 8.1%), Health Diagnosing & Treating (1,521 | 7.0%), Education Instruction & Library (1,196 | 5.5%), and Health Technologists (862 | 4.0%).
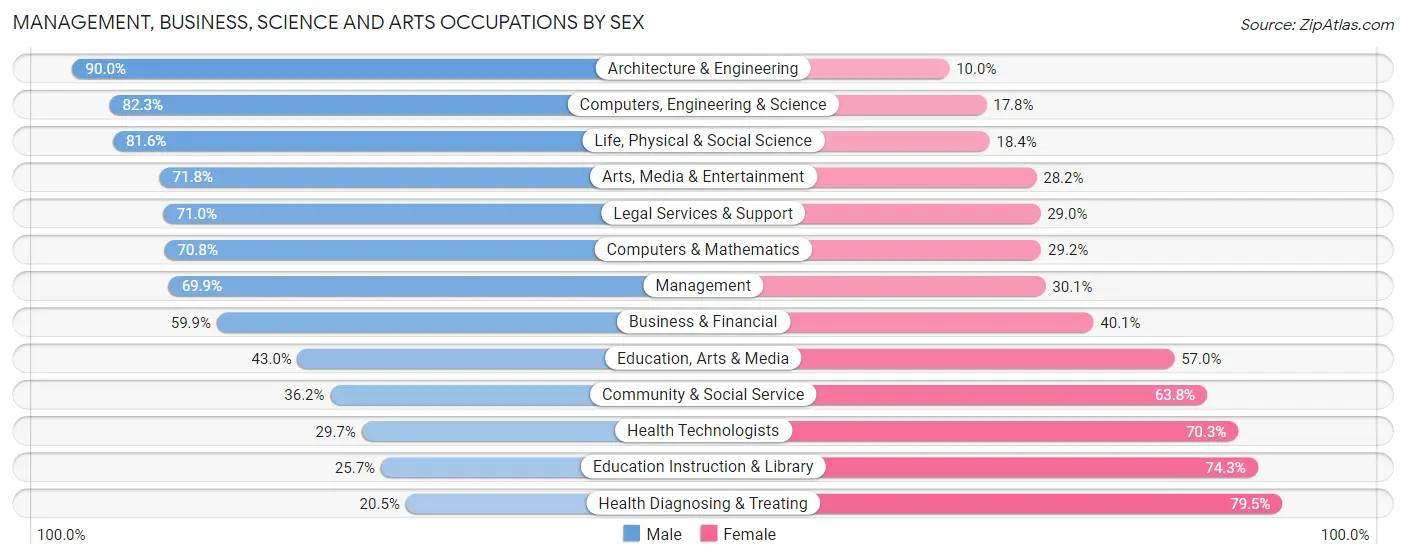
Management, Business, Science and Arts Occupations by Sex
Within the Management, Business, Science and Arts occupations in Bingham County, the most male-oriented occupations are Architecture & Engineering (90.0%), Computers, Engineering & Science (82.3%), and Life, Physical & Social Science (81.6%), while the most female-oriented occupations are Health Diagnosing & Treating (79.5%), Education Instruction & Library (74.3%), and Health Technologists (70.3%).
| Occupation | Male | Female |
| Management | 1,483 (69.9%) | 638 (30.1%) |
| Business & Financial | 381 (59.9%) | 255 (40.1%) |
| Computers, Engineering & Science | 630 (82.3%) | 136 (17.7%) |
| Computers & Mathematics | 131 (70.8%) | 54 (29.2%) |
| Architecture & Engineering | 269 (90.0%) | 30 (10.0%) |
| Life, Physical & Social Science | 230 (81.6%) | 52 (18.4%) |
| Community & Social Service | 632 (36.2%) | 1,113 (63.8%) |
| Education, Arts & Media | 102 (43.0%) | 135 (57.0%) |
| Legal Services & Support | 93 (71.0%) | 38 (29.0%) |
| Education Instruction & Library | 307 (25.7%) | 889 (74.3%) |
| Arts, Media & Entertainment | 130 (71.8%) | 51 (28.2%) |
| Health Diagnosing & Treating | 312 (20.5%) | 1,209 (79.5%) |
| Health Technologists | 256 (29.7%) | 606 (70.3%) |
| Total (Category) | 3,438 (50.6%) | 3,351 (49.4%) |
| Total (Overall) | 12,105 (55.9%) | 9,531 (44.1%) |
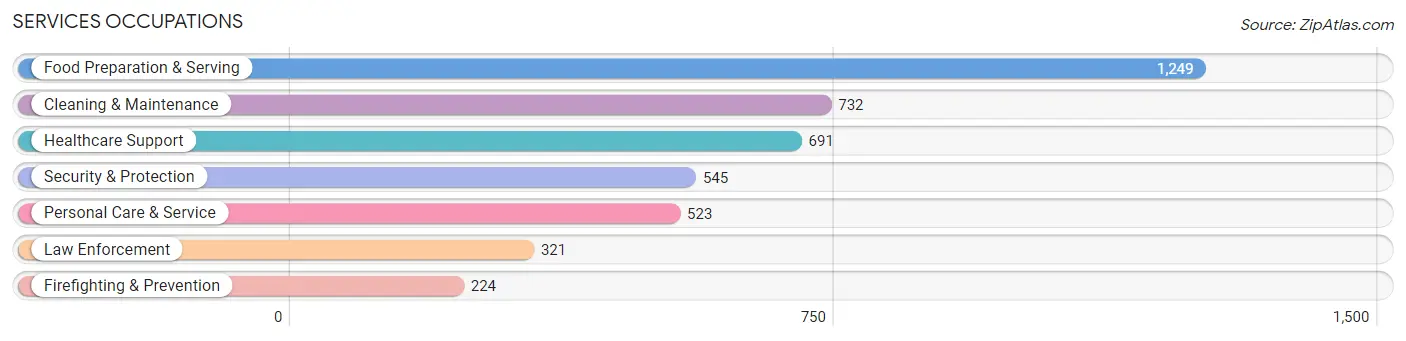
Services Occupations
The most common Services occupations in Bingham County are Food Preparation & Serving (1,249 | 5.8%), Cleaning & Maintenance (732 | 3.4%), Healthcare Support (691 | 3.2%), Security & Protection (545 | 2.5%), and Personal Care & Service (523 | 2.4%).
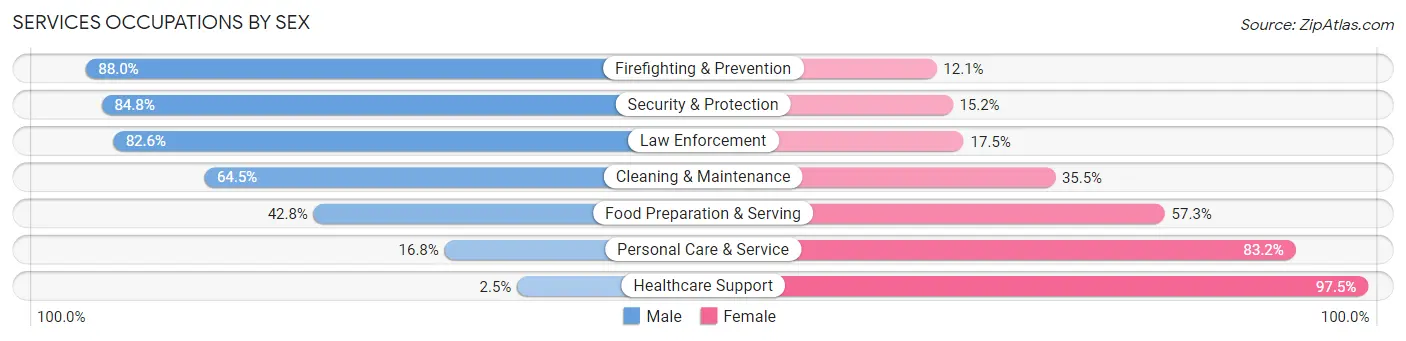
Services Occupations by Sex
Within the Services occupations in Bingham County, the most male-oriented occupations are Firefighting & Prevention (87.9%), Security & Protection (84.8%), and Law Enforcement (82.6%), while the most female-oriented occupations are Healthcare Support (97.5%), Personal Care & Service (83.2%), and Food Preparation & Serving (57.3%).
| Occupation | Male | Female |
| Healthcare Support | 17 (2.5%) | 674 (97.5%) |
| Security & Protection | 462 (84.8%) | 83 (15.2%) |
| Firefighting & Prevention | 197 (87.9%) | 27 (12.0%) |
| Law Enforcement | 265 (82.6%) | 56 (17.4%) |
| Food Preparation & Serving | 534 (42.7%) | 715 (57.3%) |
| Cleaning & Maintenance | 472 (64.5%) | 260 (35.5%) |
| Personal Care & Service | 88 (16.8%) | 435 (83.2%) |
| Total (Category) | 1,573 (42.1%) | 2,167 (57.9%) |
| Total (Overall) | 12,105 (55.9%) | 9,531 (44.1%) |
Sales and Office Occupations
The most common Sales and Office occupations in Bingham County are Office & Administration (2,048 | 9.5%), and Sales & Related (1,830 | 8.5%).

Sales and Office Occupations by Sex
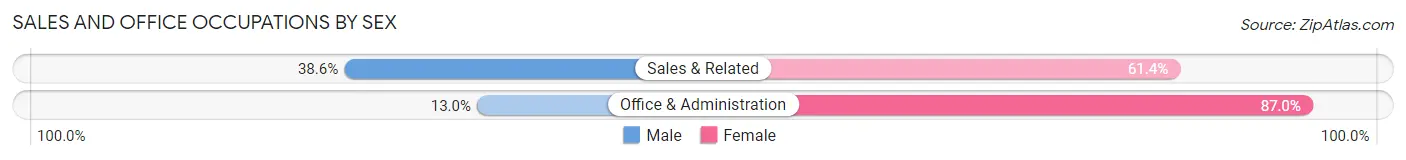
| Occupation | Male | Female |
| Sales & Related | 706 (38.6%) | 1,124 (61.4%) |
| Office & Administration | 267 (13.0%) | 1,781 (87.0%) |
| Total (Category) | 973 (25.1%) | 2,905 (74.9%) |
| Total (Overall) | 12,105 (55.9%) | 9,531 (44.1%) |
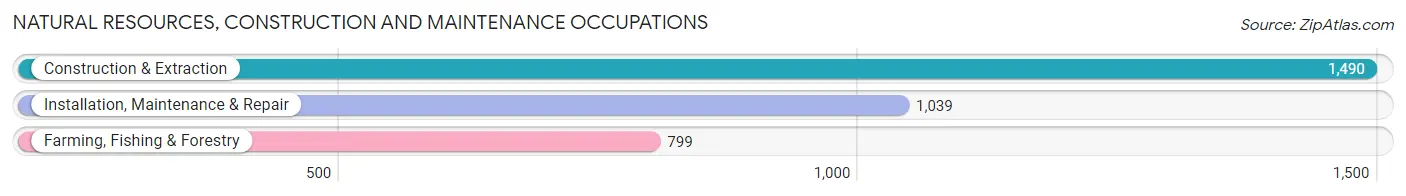
Natural Resources, Construction and Maintenance Occupations
The most common Natural Resources, Construction and Maintenance occupations in Bingham County are Construction & Extraction (1,490 | 6.9%), Installation, Maintenance & Repair (1,039 | 4.8%), and Farming, Fishing & Forestry (799 | 3.7%).
Natural Resources, Construction and Maintenance Occupations by Sex
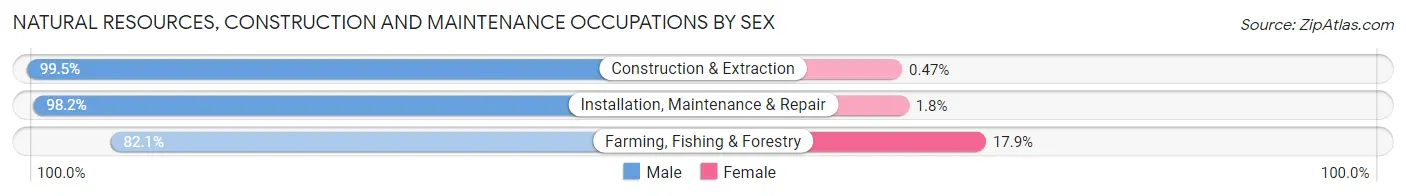
| Occupation | Male | Female |
| Farming, Fishing & Forestry | 656 (82.1%) | 143 (17.9%) |
| Construction & Extraction | 1,483 (99.5%) | 7 (0.5%) |
| Installation, Maintenance & Repair | 1,020 (98.2%) | 19 (1.8%) |
| Total (Category) | 3,159 (94.9%) | 169 (5.1%) |
| Total (Overall) | 12,105 (55.9%) | 9,531 (44.1%) |
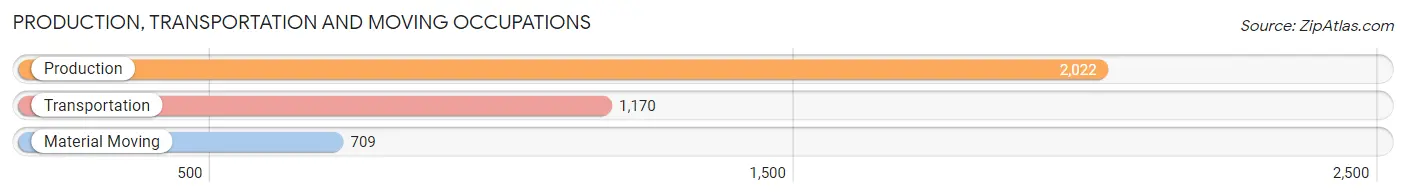
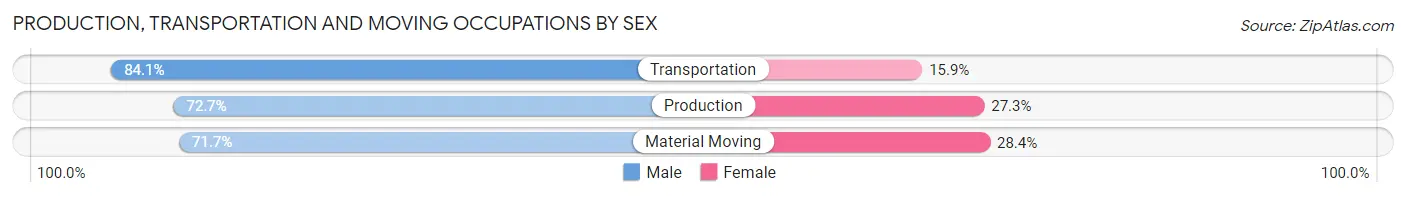
Production, Transportation and Moving Occupations
The most common Production, Transportation and Moving occupations in Bingham County are Production (2,022 | 9.3%), Transportation (1,170 | 5.4%), and Material Moving (709 | 3.3%).
Production, Transportation and Moving Occupations by Sex
| Occupation | Male | Female |
| Production | 1,470 (72.7%) | 552 (27.3%) |
| Transportation | 984 (84.1%) | 186 (15.9%) |
| Material Moving | 508 (71.7%) | 201 (28.3%) |
| Total (Category) | 2,962 (75.9%) | 939 (24.1%) |
| Total (Overall) | 12,105 (55.9%) | 9,531 (44.1%) |
Employment Industries by Sex in Bingham County
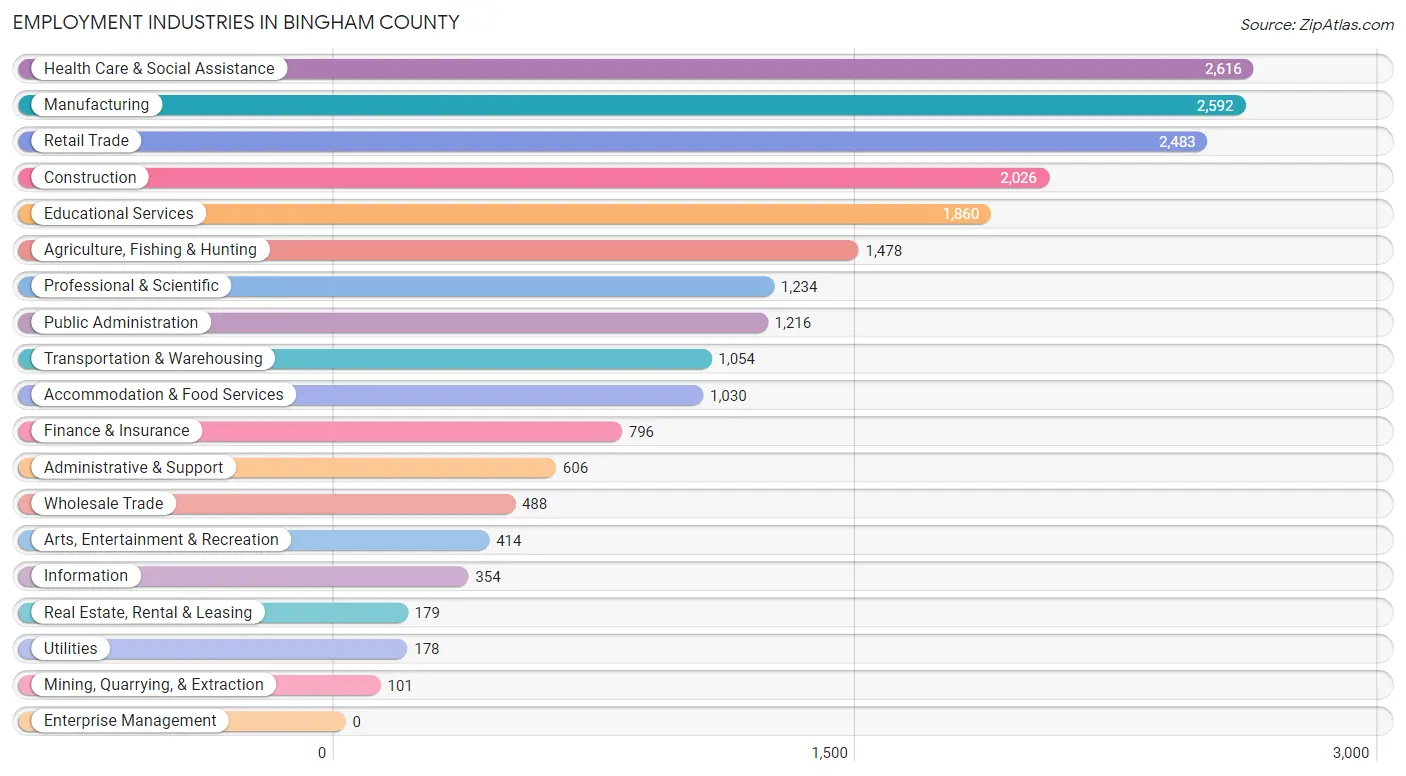
Employment Industries in Bingham County
The major employment industries in Bingham County include Health Care & Social Assistance (2,616 | 12.1%), Manufacturing (2,592 | 12.0%), Retail Trade (2,483 | 11.5%), Construction (2,026 | 9.4%), and Educational Services (1,860 | 8.6%).
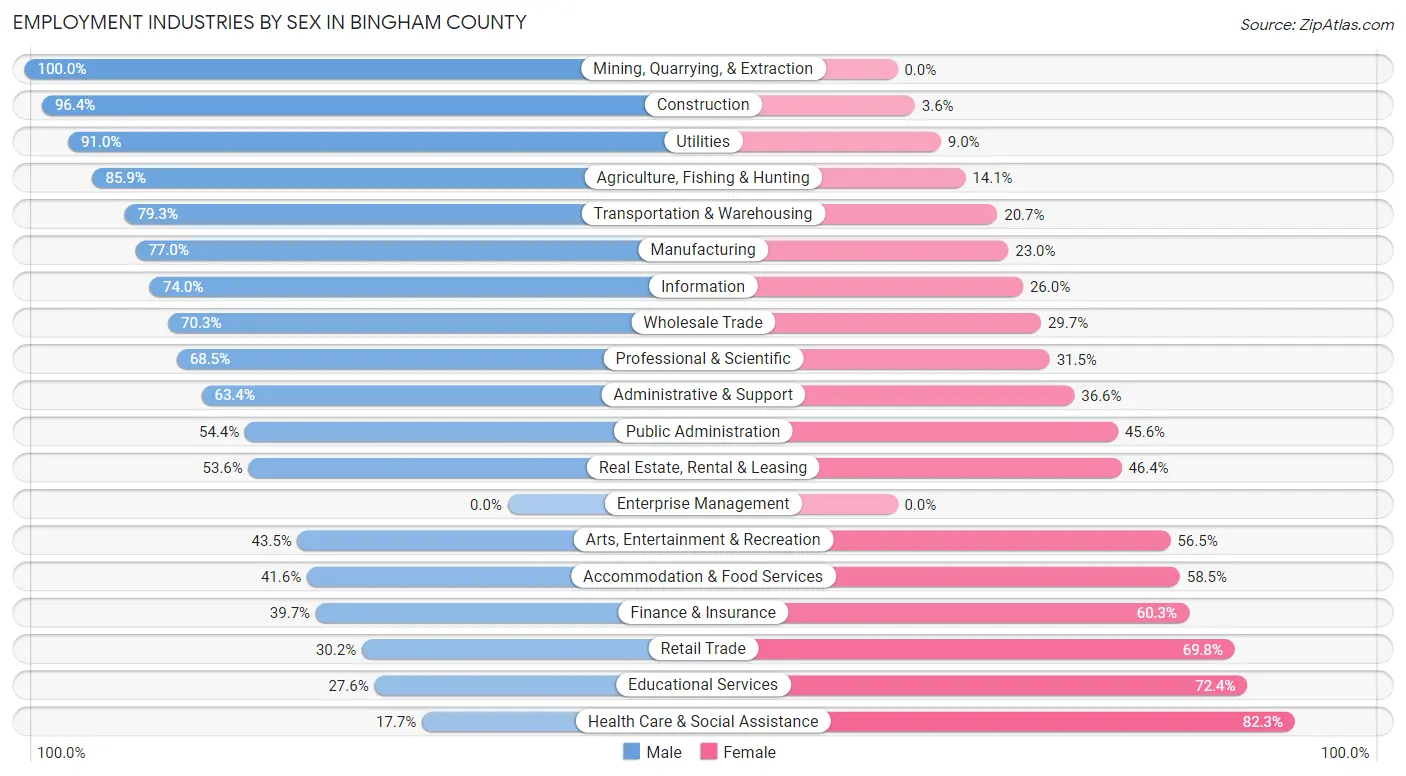
Employment Industries by Sex in Bingham County
The Bingham County industries that see more men than women are Mining, Quarrying, & Extraction (100.0%), Construction (96.4%), and Utilities (91.0%), whereas the industries that tend to have a higher number of women are Health Care & Social Assistance (82.3%), Educational Services (72.4%), and Retail Trade (69.8%).
| Industry | Male | Female |
| Agriculture, Fishing & Hunting | 1,270 (85.9%) | 208 (14.1%) |
| Mining, Quarrying, & Extraction | 101 (100.0%) | 0 (0.0%) |
| Construction | 1,953 (96.4%) | 73 (3.6%) |
| Manufacturing | 1,997 (77.0%) | 595 (23.0%) |
| Wholesale Trade | 343 (70.3%) | 145 (29.7%) |
| Retail Trade | 749 (30.2%) | 1,734 (69.8%) |
| Transportation & Warehousing | 836 (79.3%) | 218 (20.7%) |
| Utilities | 162 (91.0%) | 16 (9.0%) |
| Information | 262 (74.0%) | 92 (26.0%) |
| Finance & Insurance | 316 (39.7%) | 480 (60.3%) |
| Real Estate, Rental & Leasing | 96 (53.6%) | 83 (46.4%) |
| Professional & Scientific | 845 (68.5%) | 389 (31.5%) |
| Enterprise Management | 0 (0.0%) | 0 (0.0%) |
| Administrative & Support | 384 (63.4%) | 222 (36.6%) |
| Educational Services | 513 (27.6%) | 1,347 (72.4%) |
| Health Care & Social Assistance | 464 (17.7%) | 2,152 (82.3%) |
| Arts, Entertainment & Recreation | 180 (43.5%) | 234 (56.5%) |
| Accommodation & Food Services | 428 (41.5%) | 602 (58.5%) |
| Public Administration | 661 (54.4%) | 555 (45.6%) |
| Total | 12,105 (55.9%) | 9,531 (44.1%) |
Education in Bingham County
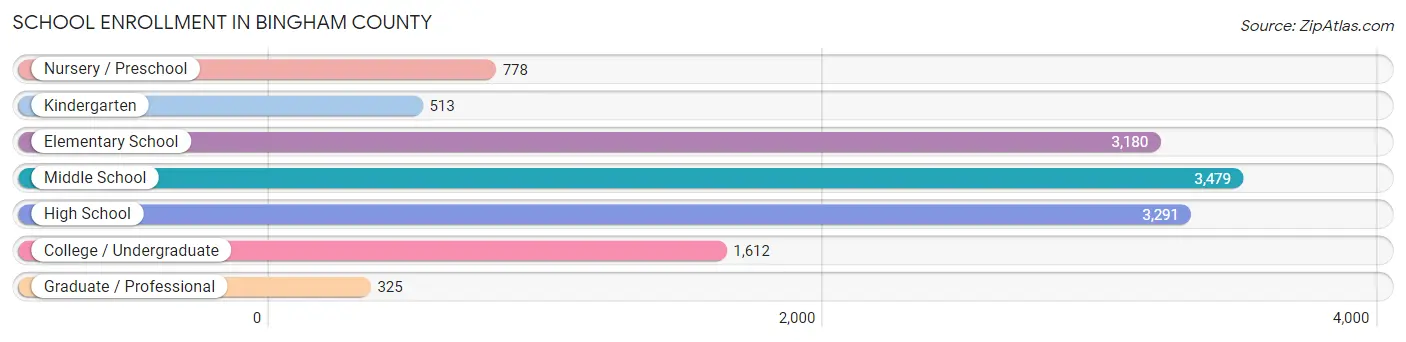
School Enrollment in Bingham County
The most common levels of schooling among the 13,178 students in Bingham County are middle school (3,479 | 26.4%), high school (3,291 | 25.0%), and elementary school (3,180 | 24.1%).
| School Level | # Students | % Students |
| Nursery / Preschool | 778 | 5.9% |
| Kindergarten | 513 | 3.9% |
| Elementary School | 3,180 | 24.1% |
| Middle School | 3,479 | 26.4% |
| High School | 3,291 | 25.0% |
| College / Undergraduate | 1,612 | 12.2% |
| Graduate / Professional | 325 | 2.5% |
| Total | 13,178 | 100.0% |
School Enrollment by Age by Funding Source in Bingham County
Out of a total of 13,178 students who are enrolled in schools in Bingham County, 1,529 (11.6%) attend a private institution, while the remaining 11,649 (88.4%) are enrolled in public schools. The age group of 3 to 4 year olds has the highest likelihood of being enrolled in private schools, with 291 (67.7% in the age bracket) enrolled. Conversely, the age group of 15 to 17 year olds has the lowest likelihood of being enrolled in a private school, with 2,290 (95.4% in the age bracket) attending a public institution.
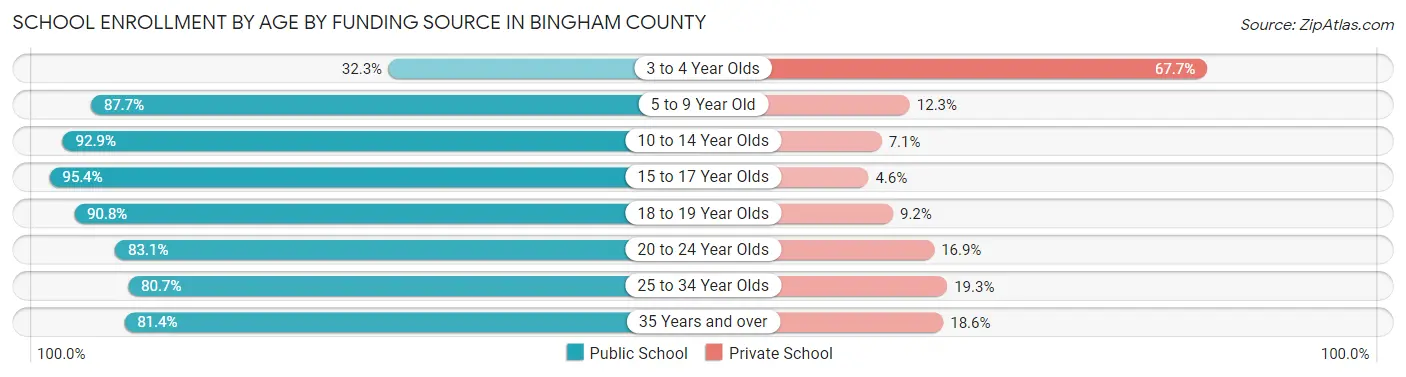
| Age Bracket | Public School | Private School |
| 3 to 4 Year Olds | 139 (32.3%) | 291 (67.7%) |
| 5 to 9 Year Old | 3,114 (87.7%) | 438 (12.3%) |
| 10 to 14 Year Olds | 4,023 (92.9%) | 307 (7.1%) |
| 15 to 17 Year Olds | 2,290 (95.4%) | 111 (4.6%) |
| 18 to 19 Year Olds | 661 (90.8%) | 67 (9.2%) |
| 20 to 24 Year Olds | 562 (83.1%) | 114 (16.9%) |
| 25 to 34 Year Olds | 339 (80.7%) | 81 (19.3%) |
| 35 Years and over | 522 (81.4%) | 119 (18.6%) |
| Total | 11,649 (88.4%) | 1,529 (11.6%) |
Educational Attainment by Field of Study in Bingham County
Education (1,326 | 20.7%), science & technology (1,078 | 16.8%), business (895 | 14.0%), arts & humanities (572 | 8.9%), and engineering (466 | 7.3%) are the most common fields of study among 6,418 individuals in Bingham County who have obtained a bachelor's degree or higher.
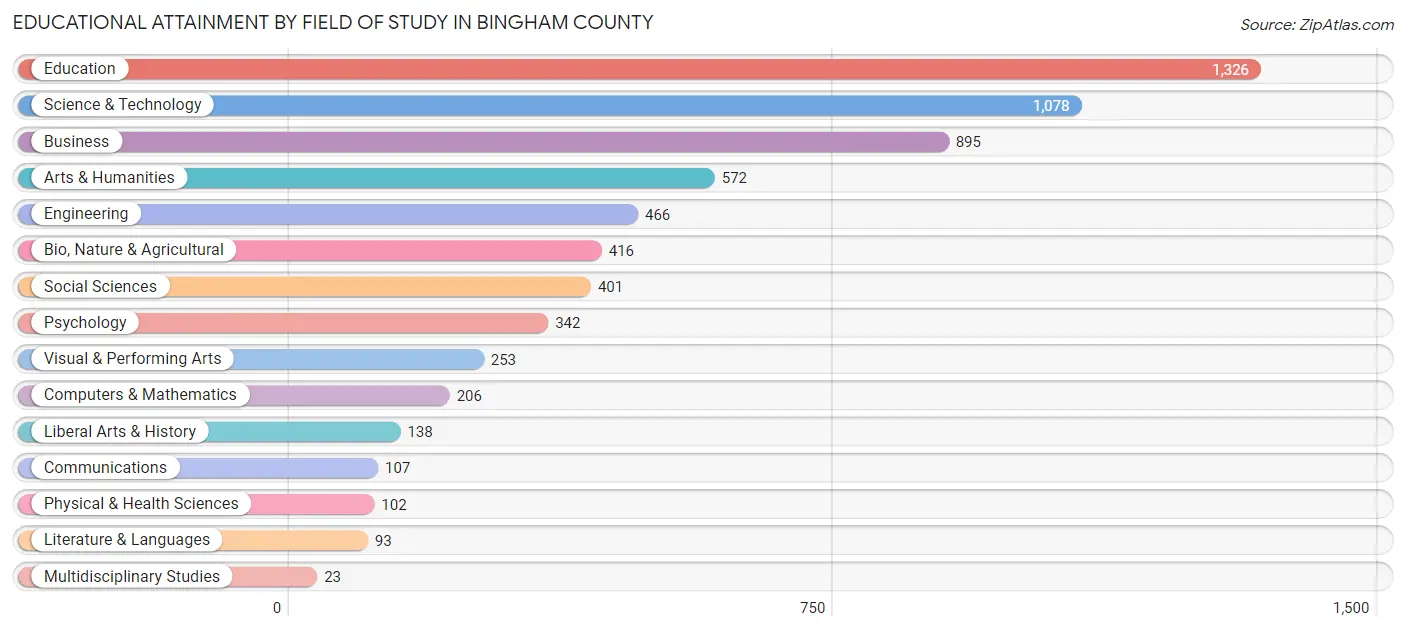
| Field of Study | # Graduates | % Graduates |
| Computers & Mathematics | 206 | 3.2% |
| Bio, Nature & Agricultural | 416 | 6.5% |
| Physical & Health Sciences | 102 | 1.6% |
| Psychology | 342 | 5.3% |
| Social Sciences | 401 | 6.2% |
| Engineering | 466 | 7.3% |
| Multidisciplinary Studies | 23 | 0.4% |
| Science & Technology | 1,078 | 16.8% |
| Business | 895 | 14.0% |
| Education | 1,326 | 20.7% |
| Literature & Languages | 93 | 1.5% |
| Liberal Arts & History | 138 | 2.1% |
| Visual & Performing Arts | 253 | 3.9% |
| Communications | 107 | 1.7% |
| Arts & Humanities | 572 | 8.9% |
| Total | 6,418 | 100.0% |
Transportation & Commute in Bingham County
Vehicle Availability by Sex in Bingham County
The most prevalent vehicle ownership categories in Bingham County are males with 2 vehicles (4,170, accounting for 35.2%) and females with 2 vehicles (2,907, making up 44.6%).
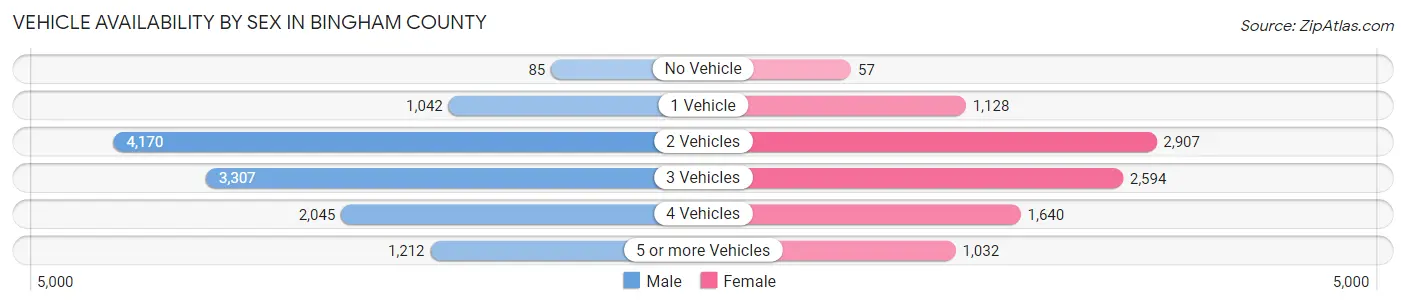
| Vehicles Available | Male | Female |
| No Vehicle | 85 (0.7%) | 57 (0.6%) |
| 1 Vehicle | 1,042 (8.8%) | 1,128 (12.0%) |
| 2 Vehicles | 4,170 (35.2%) | 2,907 (31.1%) |
| 3 Vehicles | 3,307 (27.9%) | 2,594 (27.7%) |
| 4 Vehicles | 2,045 (17.2%) | 1,640 (17.5%) |
| 5 or more Vehicles | 1,212 (10.2%) | 1,032 (11.0%) |
| Total | 11,861 (100.0%) | 9,358 (100.0%) |
Commute Time in Bingham County
The most frequently occuring commute durations in Bingham County are 10 to 14 minutes (3,536 commuters, 17.7%), 15 to 19 minutes (2,802 commuters, 14.0%), and 5 to 9 minutes (2,792 commuters, 14.0%).
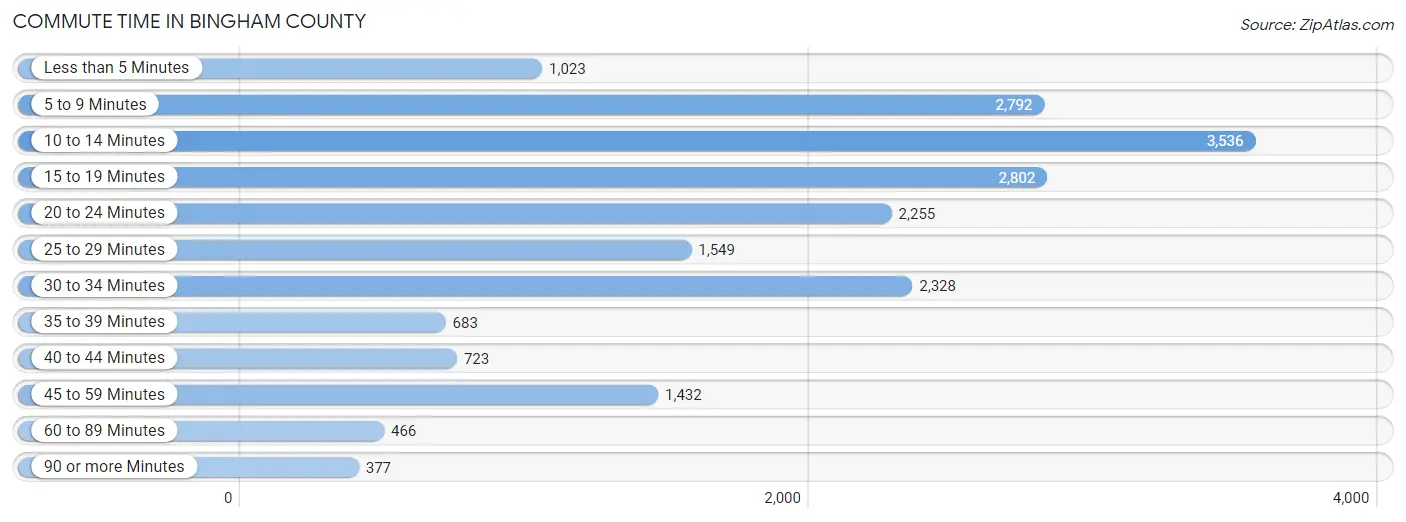
| Commute Time | # Commuters | % Commuters |
| Less than 5 Minutes | 1,023 | 5.1% |
| 5 to 9 Minutes | 2,792 | 14.0% |
| 10 to 14 Minutes | 3,536 | 17.7% |
| 15 to 19 Minutes | 2,802 | 14.0% |
| 20 to 24 Minutes | 2,255 | 11.3% |
| 25 to 29 Minutes | 1,549 | 7.8% |
| 30 to 34 Minutes | 2,328 | 11.7% |
| 35 to 39 Minutes | 683 | 3.4% |
| 40 to 44 Minutes | 723 | 3.6% |
| 45 to 59 Minutes | 1,432 | 7.2% |
| 60 to 89 Minutes | 466 | 2.3% |
| 90 or more Minutes | 377 | 1.9% |
Commute Time by Sex in Bingham County
The most common commute times in Bingham County are 10 to 14 minutes (2,038 commuters, 18.1%) for males and 10 to 14 minutes (1,498 commuters, 17.2%) for females.
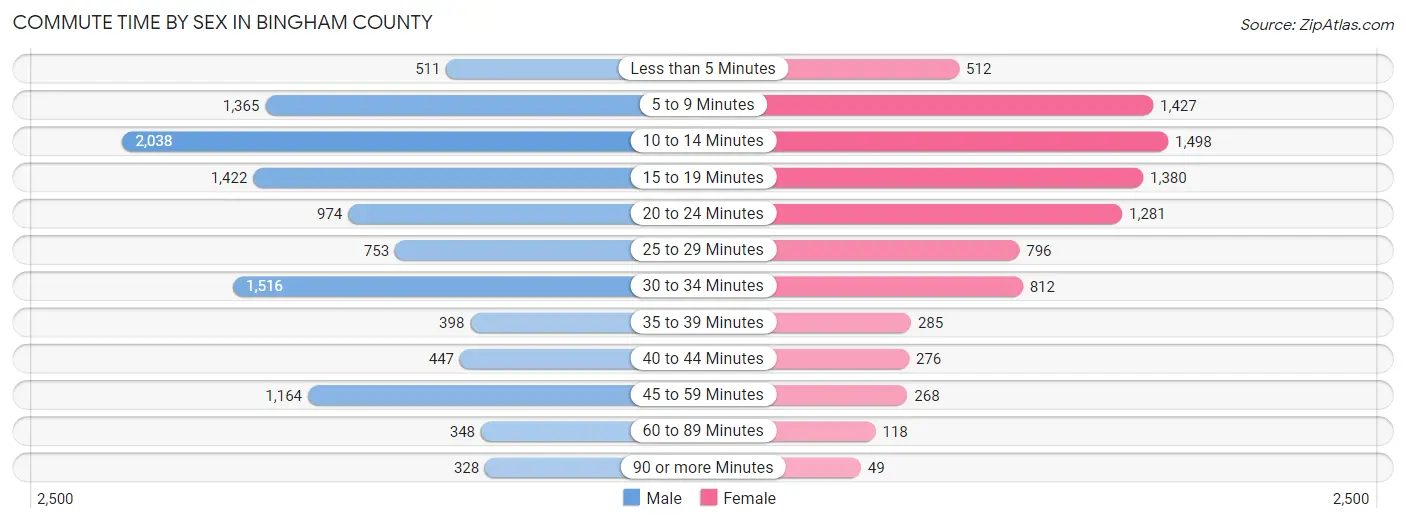
| Commute Time | Male | Female |
| Less than 5 Minutes | 511 (4.5%) | 512 (5.9%) |
| 5 to 9 Minutes | 1,365 (12.1%) | 1,427 (16.4%) |
| 10 to 14 Minutes | 2,038 (18.1%) | 1,498 (17.2%) |
| 15 to 19 Minutes | 1,422 (12.6%) | 1,380 (15.9%) |
| 20 to 24 Minutes | 974 (8.6%) | 1,281 (14.7%) |
| 25 to 29 Minutes | 753 (6.7%) | 796 (9.1%) |
| 30 to 34 Minutes | 1,516 (13.5%) | 812 (9.3%) |
| 35 to 39 Minutes | 398 (3.5%) | 285 (3.3%) |
| 40 to 44 Minutes | 447 (4.0%) | 276 (3.2%) |
| 45 to 59 Minutes | 1,164 (10.3%) | 268 (3.1%) |
| 60 to 89 Minutes | 348 (3.1%) | 118 (1.4%) |
| 90 or more Minutes | 328 (2.9%) | 49 (0.6%) |
Time of Departure to Work by Sex in Bingham County
The most frequent times of departure to work in Bingham County are 7:30 AM to 7:59 AM (1,971, 17.5%) for males and 7:30 AM to 7:59 AM (2,065, 23.7%) for females.
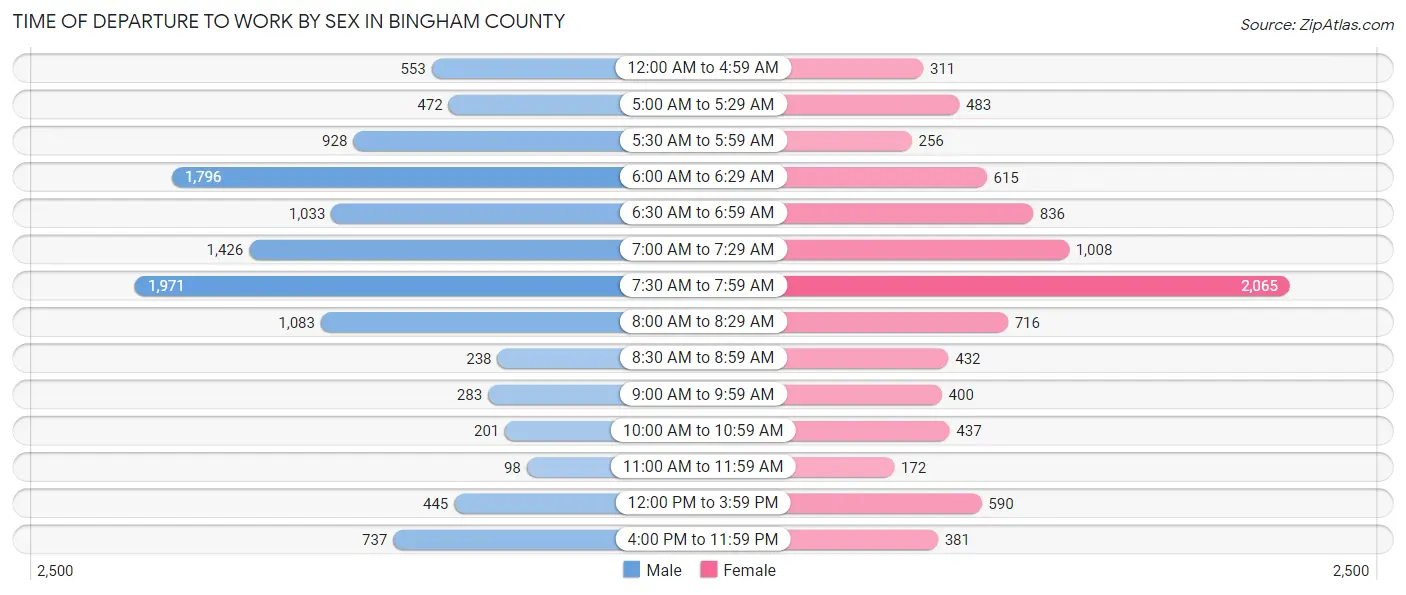
| Time of Departure | Male | Female |
| 12:00 AM to 4:59 AM | 553 (4.9%) | 311 (3.6%) |
| 5:00 AM to 5:29 AM | 472 (4.2%) | 483 (5.6%) |
| 5:30 AM to 5:59 AM | 928 (8.2%) | 256 (2.9%) |
| 6:00 AM to 6:29 AM | 1,796 (15.9%) | 615 (7.1%) |
| 6:30 AM to 6:59 AM | 1,033 (9.2%) | 836 (9.6%) |
| 7:00 AM to 7:29 AM | 1,426 (12.7%) | 1,008 (11.6%) |
| 7:30 AM to 7:59 AM | 1,971 (17.5%) | 2,065 (23.7%) |
| 8:00 AM to 8:29 AM | 1,083 (9.6%) | 716 (8.2%) |
| 8:30 AM to 8:59 AM | 238 (2.1%) | 432 (5.0%) |
| 9:00 AM to 9:59 AM | 283 (2.5%) | 400 (4.6%) |
| 10:00 AM to 10:59 AM | 201 (1.8%) | 437 (5.0%) |
| 11:00 AM to 11:59 AM | 98 (0.9%) | 172 (2.0%) |
| 12:00 PM to 3:59 PM | 445 (4.0%) | 590 (6.8%) |
| 4:00 PM to 11:59 PM | 737 (6.5%) | 381 (4.4%) |
| Total | 11,264 (100.0%) | 8,702 (100.0%) |
Housing Occupancy in Bingham County
Occupancy by Ownership in Bingham County
Of the total 15,627 dwellings in Bingham County, owner-occupied units account for 12,512 (80.1%), while renter-occupied units make up 3,115 (19.9%).
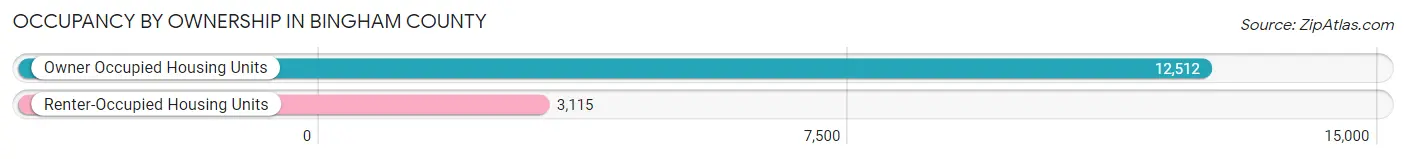
| Occupancy | # Housing Units | % Housing Units |
| Owner Occupied Housing Units | 12,512 | 80.1% |
| Renter-Occupied Housing Units | 3,115 | 19.9% |
| Total Occupied Housing Units | 15,627 | 100.0% |
Occupancy by Household Size in Bingham County
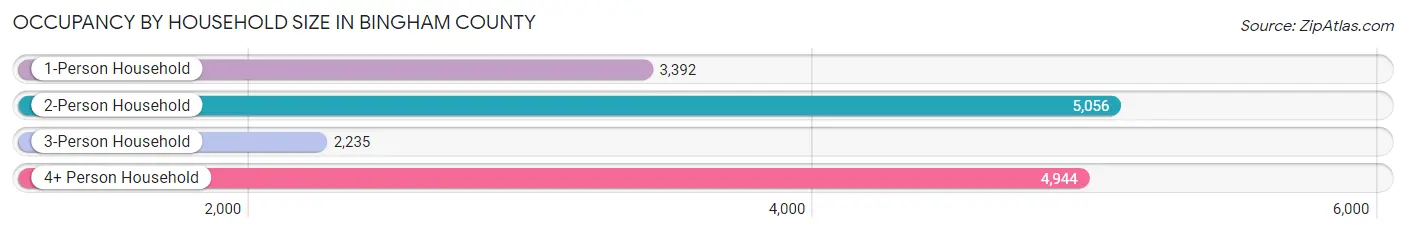
| Household Size | # Housing Units | % Housing Units |
| 1-Person Household | 3,392 | 21.7% |
| 2-Person Household | 5,056 | 32.4% |
| 3-Person Household | 2,235 | 14.3% |
| 4+ Person Household | 4,944 | 31.6% |
| Total Housing Units | 15,627 | 100.0% |
Occupancy by Ownership by Household Size in Bingham County
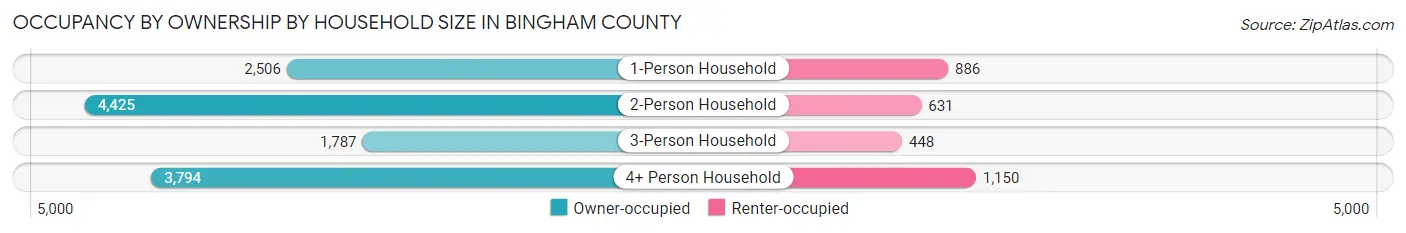
| Household Size | Owner-occupied | Renter-occupied |
| 1-Person Household | 2,506 (73.9%) | 886 (26.1%) |
| 2-Person Household | 4,425 (87.5%) | 631 (12.5%) |
| 3-Person Household | 1,787 (80.0%) | 448 (20.0%) |
| 4+ Person Household | 3,794 (76.7%) | 1,150 (23.3%) |
| Total Housing Units | 12,512 (80.1%) | 3,115 (19.9%) |
Occupancy by Educational Attainment in Bingham County
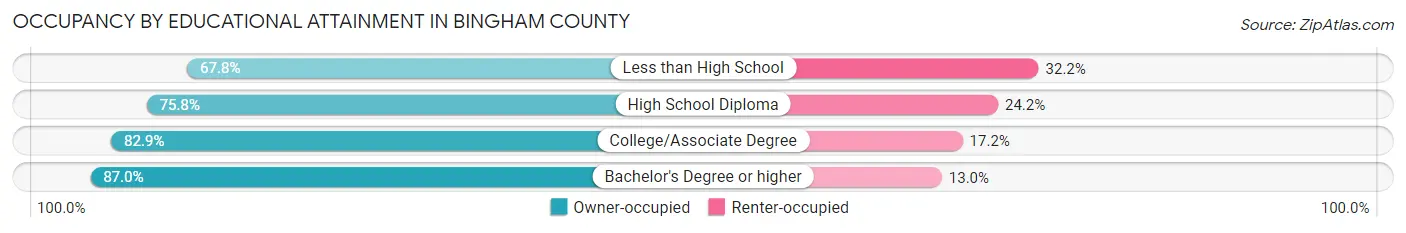
| Household Size | Owner-occupied | Renter-occupied |
| Less than High School | 1,084 (67.8%) | 515 (32.2%) |
| High School Diploma | 3,486 (75.8%) | 1,111 (24.2%) |
| College/Associate Degree | 5,237 (82.9%) | 1,084 (17.2%) |
| Bachelor's Degree or higher | 2,705 (87.0%) | 405 (13.0%) |
Occupancy by Age of Householder in Bingham County
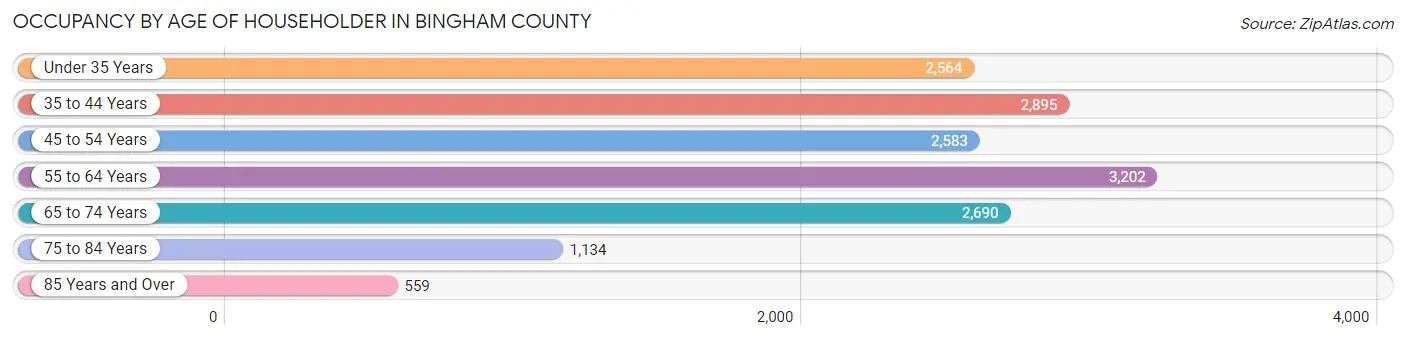
| Age Bracket | # Households | % Households |
| Under 35 Years | 2,564 | 16.4% |
| 35 to 44 Years | 2,895 | 18.5% |
| 45 to 54 Years | 2,583 | 16.5% |
| 55 to 64 Years | 3,202 | 20.5% |
| 65 to 74 Years | 2,690 | 17.2% |
| 75 to 84 Years | 1,134 | 7.3% |
| 85 Years and Over | 559 | 3.6% |
| Total | 15,627 | 100.0% |
Housing Finances in Bingham County
Median Income by Occupancy in Bingham County
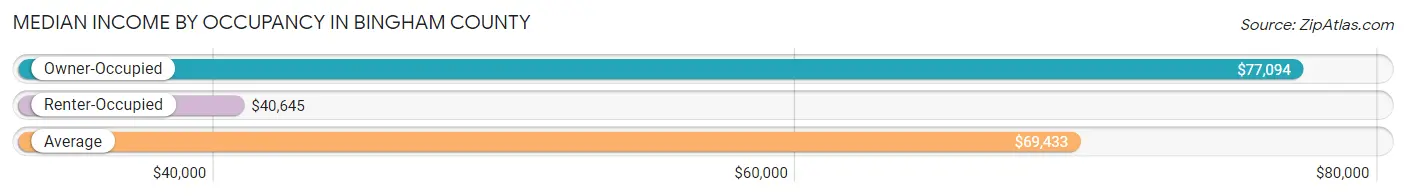
| Occupancy Type | # Households | Median Income |
| Owner-Occupied | 12,512 (80.1%) | $77,094 |
| Renter-Occupied | 3,115 (19.9%) | $40,645 |
| Average | 15,627 (100.0%) | $69,433 |
Occupancy by Householder Income Bracket in Bingham County
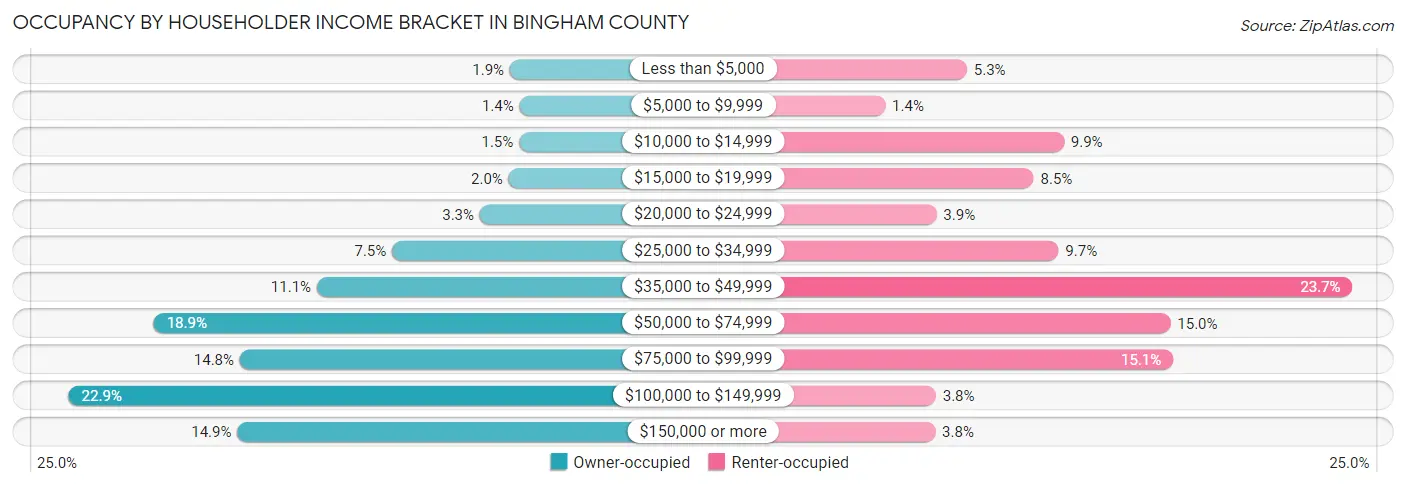
| Income Bracket | Owner-occupied | Renter-occupied |
| Less than $5,000 | 237 (1.9%) | 165 (5.3%) |
| $5,000 to $9,999 | 179 (1.4%) | 44 (1.4%) |
| $10,000 to $14,999 | 181 (1.5%) | 309 (9.9%) |
| $15,000 to $19,999 | 244 (1.9%) | 264 (8.5%) |
| $20,000 to $24,999 | 416 (3.3%) | 120 (3.8%) |
| $25,000 to $34,999 | 939 (7.5%) | 301 (9.7%) |
| $35,000 to $49,999 | 1,386 (11.1%) | 737 (23.7%) |
| $50,000 to $74,999 | 2,359 (18.9%) | 467 (15.0%) |
| $75,000 to $99,999 | 1,845 (14.7%) | 471 (15.1%) |
| $100,000 to $149,999 | 2,865 (22.9%) | 119 (3.8%) |
| $150,000 or more | 1,861 (14.9%) | 118 (3.8%) |
| Total | 12,512 (100.0%) | 3,115 (100.0%) |
Monthly Housing Cost Tiers in Bingham County
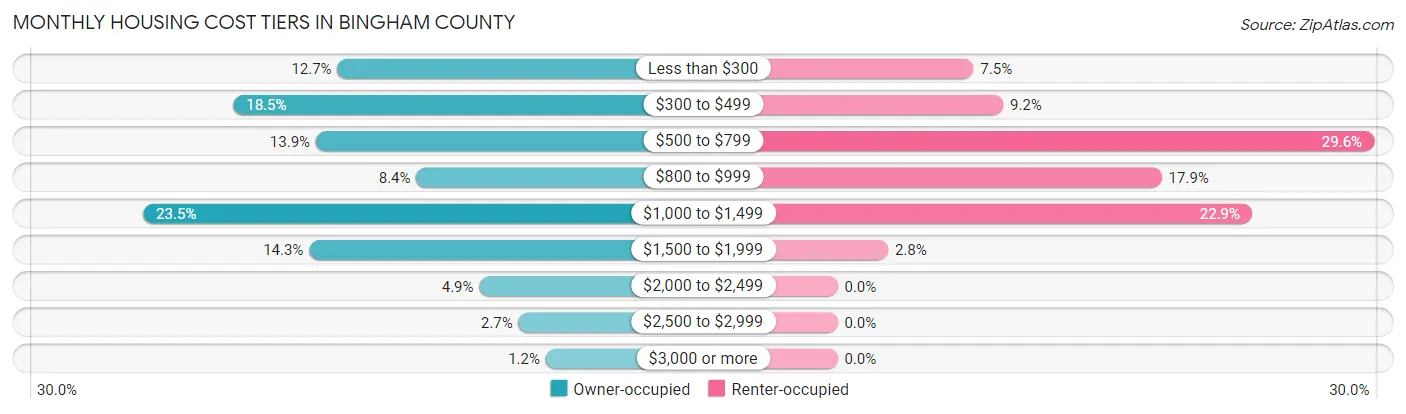
| Monthly Cost | Owner-occupied | Renter-occupied |
| Less than $300 | 1,591 (12.7%) | 234 (7.5%) |
| $300 to $499 | 2,311 (18.5%) | 285 (9.1%) |
| $500 to $799 | 1,741 (13.9%) | 923 (29.6%) |
| $800 to $999 | 1,046 (8.4%) | 558 (17.9%) |
| $1,000 to $1,499 | 2,934 (23.4%) | 713 (22.9%) |
| $1,500 to $1,999 | 1,787 (14.3%) | 87 (2.8%) |
| $2,000 to $2,499 | 611 (4.9%) | 0 (0.0%) |
| $2,500 to $2,999 | 340 (2.7%) | 0 (0.0%) |
| $3,000 or more | 151 (1.2%) | 0 (0.0%) |
| Total | 12,512 (100.0%) | 3,115 (100.0%) |
Physical Housing Characteristics in Bingham County
Housing Structures in Bingham County
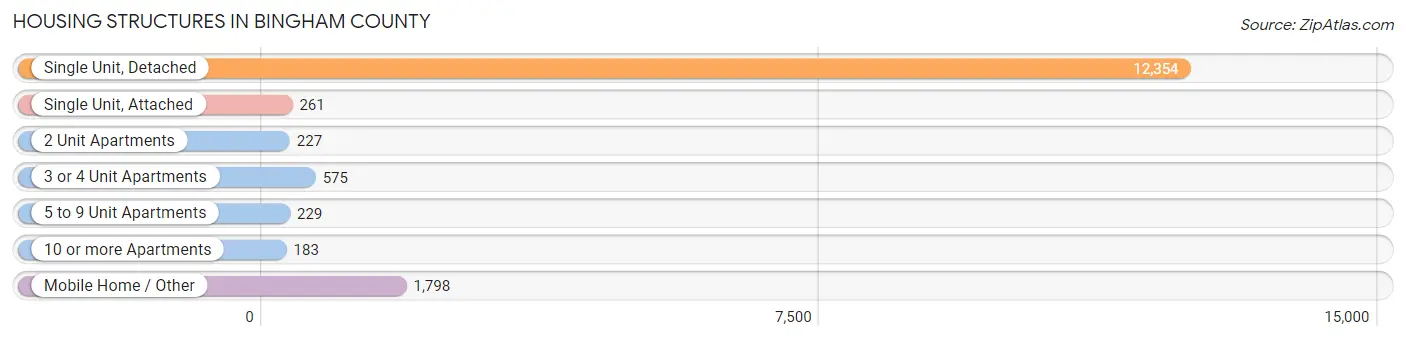
| Structure Type | # Housing Units | % Housing Units |
| Single Unit, Detached | 12,354 | 79.1% |
| Single Unit, Attached | 261 | 1.7% |
| 2 Unit Apartments | 227 | 1.5% |
| 3 or 4 Unit Apartments | 575 | 3.7% |
| 5 to 9 Unit Apartments | 229 | 1.5% |
| 10 or more Apartments | 183 | 1.2% |
| Mobile Home / Other | 1,798 | 11.5% |
| Total | 15,627 | 100.0% |
Housing Structures by Occupancy in Bingham County
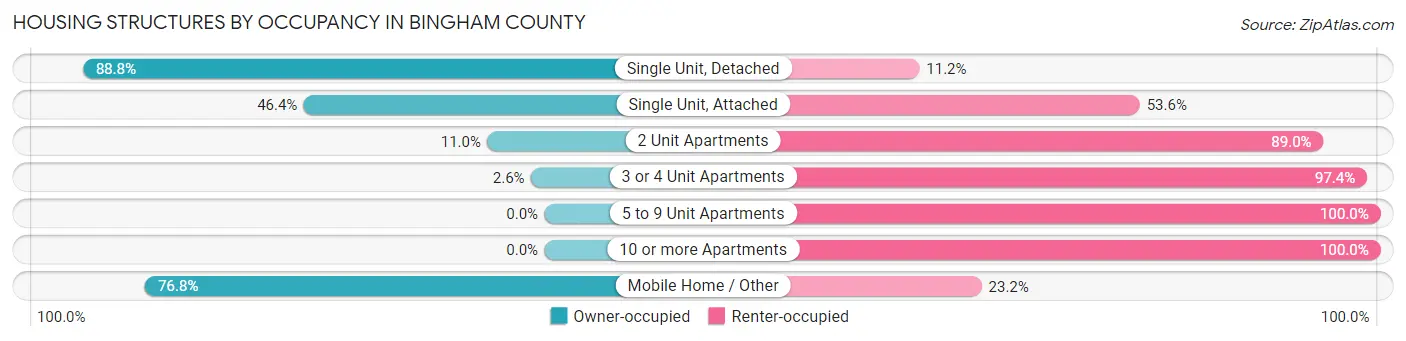
| Structure Type | Owner-occupied | Renter-occupied |
| Single Unit, Detached | 10,970 (88.8%) | 1,384 (11.2%) |
| Single Unit, Attached | 121 (46.4%) | 140 (53.6%) |
| 2 Unit Apartments | 25 (11.0%) | 202 (89.0%) |
| 3 or 4 Unit Apartments | 15 (2.6%) | 560 (97.4%) |
| 5 to 9 Unit Apartments | 0 (0.0%) | 229 (100.0%) |
| 10 or more Apartments | 0 (0.0%) | 183 (100.0%) |
| Mobile Home / Other | 1,381 (76.8%) | 417 (23.2%) |
| Total | 12,512 (80.1%) | 3,115 (19.9%) |
Housing Structures by Number of Rooms in Bingham County
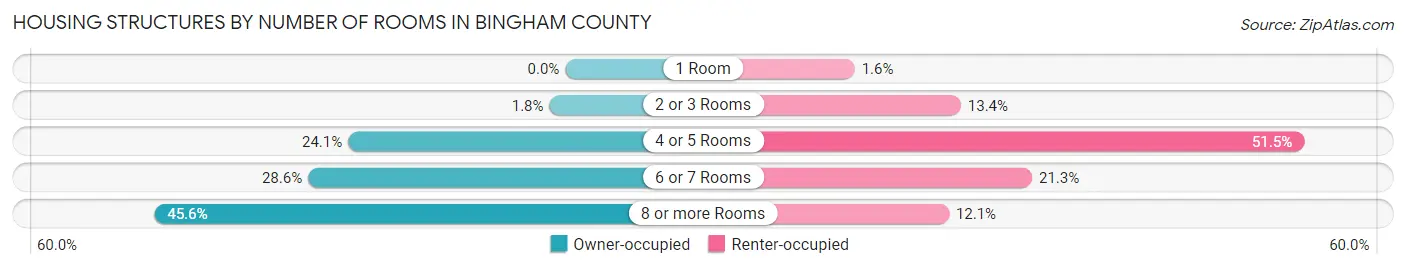
| Number of Rooms | Owner-occupied | Renter-occupied |
| 1 Room | 0 (0.0%) | 51 (1.6%) |
| 2 or 3 Rooms | 220 (1.8%) | 418 (13.4%) |
| 4 or 5 Rooms | 3,015 (24.1%) | 1,605 (51.5%) |
| 6 or 7 Rooms | 3,572 (28.5%) | 664 (21.3%) |
| 8 or more Rooms | 5,705 (45.6%) | 377 (12.1%) |
| Total | 12,512 (100.0%) | 3,115 (100.0%) |
Housing Structure by Heating Type in Bingham County
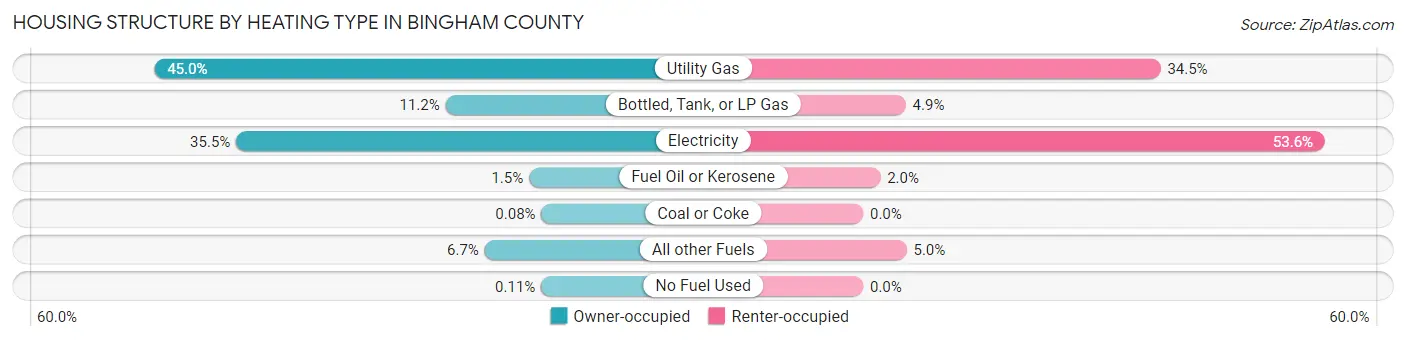
| Heating Type | Owner-occupied | Renter-occupied |
| Utility Gas | 5,627 (45.0%) | 1,074 (34.5%) |
| Bottled, Tank, or LP Gas | 1,401 (11.2%) | 154 (4.9%) |
| Electricity | 4,438 (35.5%) | 1,668 (53.5%) |
| Fuel Oil or Kerosene | 189 (1.5%) | 62 (2.0%) |
| Coal or Coke | 10 (0.1%) | 0 (0.0%) |
| All other Fuels | 833 (6.7%) | 157 (5.0%) |
| No Fuel Used | 14 (0.1%) | 0 (0.0%) |
| Total | 12,512 (100.0%) | 3,115 (100.0%) |
Household Vehicle Usage in Bingham County
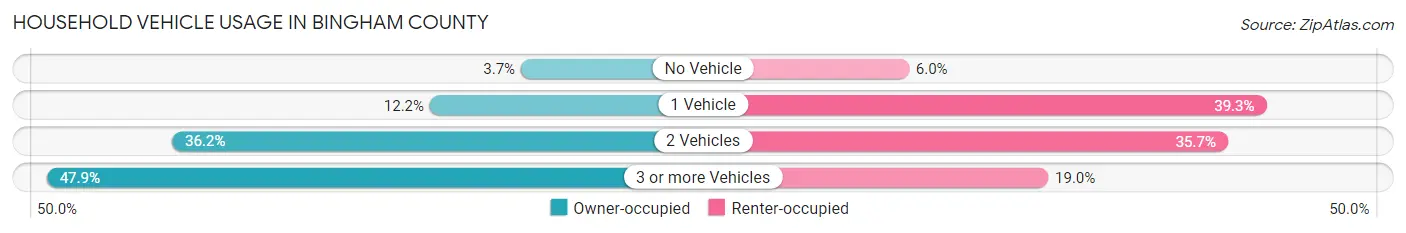
| Vehicles per Household | Owner-occupied | Renter-occupied |
| No Vehicle | 459 (3.7%) | 186 (6.0%) |
| 1 Vehicle | 1,523 (12.2%) | 1,225 (39.3%) |
| 2 Vehicles | 4,533 (36.2%) | 1,113 (35.7%) |
| 3 or more Vehicles | 5,997 (47.9%) | 591 (19.0%) |
| Total | 12,512 (100.0%) | 3,115 (100.0%) |
Real Estate & Mortgages in Bingham County
Real Estate and Mortgage Overview in Bingham County
| Characteristic | Without Mortgage | With Mortgage |
| Housing Units | 5,186 | 7,326 |
| Median Property Value | $208,500 | $248,300 |
| Median Household Income | $64,440 | $1,310 |
| Monthly Housing Costs | $385 | $149 |
| Real Estate Taxes | $1,162 | $288 |
Property Value by Mortgage Status in Bingham County
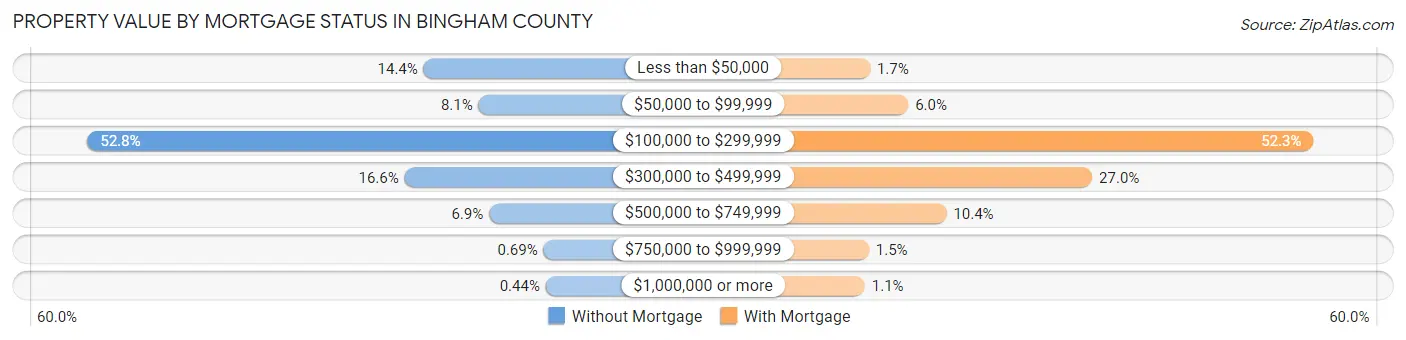
| Property Value | Without Mortgage | With Mortgage |
| Less than $50,000 | 747 (14.4%) | 121 (1.7%) |
| $50,000 to $99,999 | 421 (8.1%) | 441 (6.0%) |
| $100,000 to $299,999 | 2,740 (52.8%) | 3,833 (52.3%) |
| $300,000 to $499,999 | 860 (16.6%) | 1,981 (27.0%) |
| $500,000 to $749,999 | 359 (6.9%) | 761 (10.4%) |
| $750,000 to $999,999 | 36 (0.7%) | 111 (1.5%) |
| $1,000,000 or more | 23 (0.4%) | 78 (1.1%) |
| Total | 5,186 (100.0%) | 7,326 (100.0%) |
Household Income by Mortgage Status in Bingham County
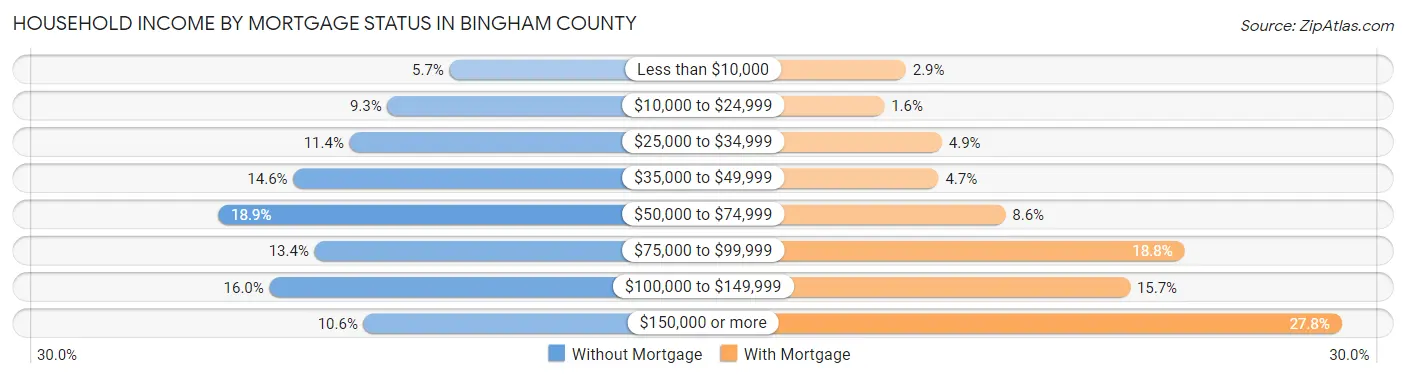
| Household Income | Without Mortgage | With Mortgage |
| Less than $10,000 | 296 (5.7%) | 210 (2.9%) |
| $10,000 to $24,999 | 480 (9.3%) | 120 (1.6%) |
| $25,000 to $34,999 | 592 (11.4%) | 361 (4.9%) |
| $35,000 to $49,999 | 759 (14.6%) | 347 (4.7%) |
| $50,000 to $74,999 | 982 (18.9%) | 627 (8.6%) |
| $75,000 to $99,999 | 696 (13.4%) | 1,377 (18.8%) |
| $100,000 to $149,999 | 830 (16.0%) | 1,149 (15.7%) |
| $150,000 or more | 551 (10.6%) | 2,035 (27.8%) |
| Total | 5,186 (100.0%) | 7,326 (100.0%) |
Property Value to Household Income Ratio in Bingham County
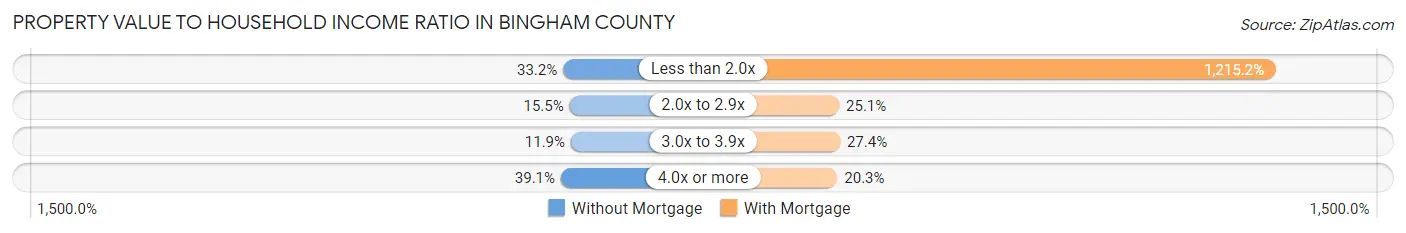
| Value-to-Income Ratio | Without Mortgage | With Mortgage |
| Less than 2.0x | 1,720 (33.2%) | 89,023 (1,215.2%) |
| 2.0x to 2.9x | 802 (15.5%) | 1,838 (25.1%) |
| 3.0x to 3.9x | 615 (11.9%) | 2,005 (27.4%) |
| 4.0x or more | 2,026 (39.1%) | 1,484 (20.3%) |
| Total | 5,186 (100.0%) | 7,326 (100.0%) |
Real Estate Taxes by Mortgage Status in Bingham County
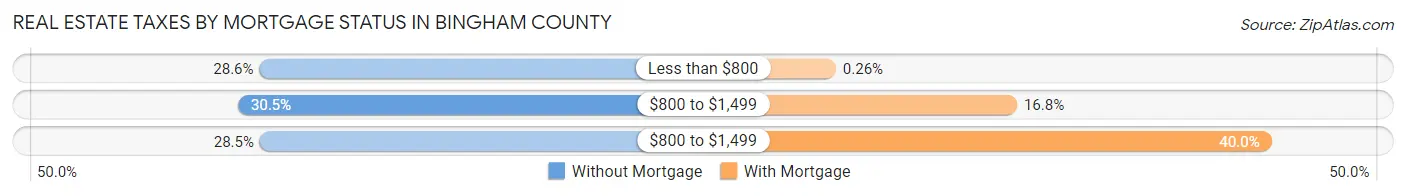
| Property Taxes | Without Mortgage | With Mortgage |
| Less than $800 | 1,481 (28.6%) | 19 (0.3%) |
| $800 to $1,499 | 1,583 (30.5%) | 1,231 (16.8%) |
| $800 to $1,499 | 1,479 (28.5%) | 2,933 (40.0%) |
| Total | 5,186 (100.0%) | 7,326 (100.0%) |
Health & Disability in Bingham County
Health Insurance Coverage by Age in Bingham County
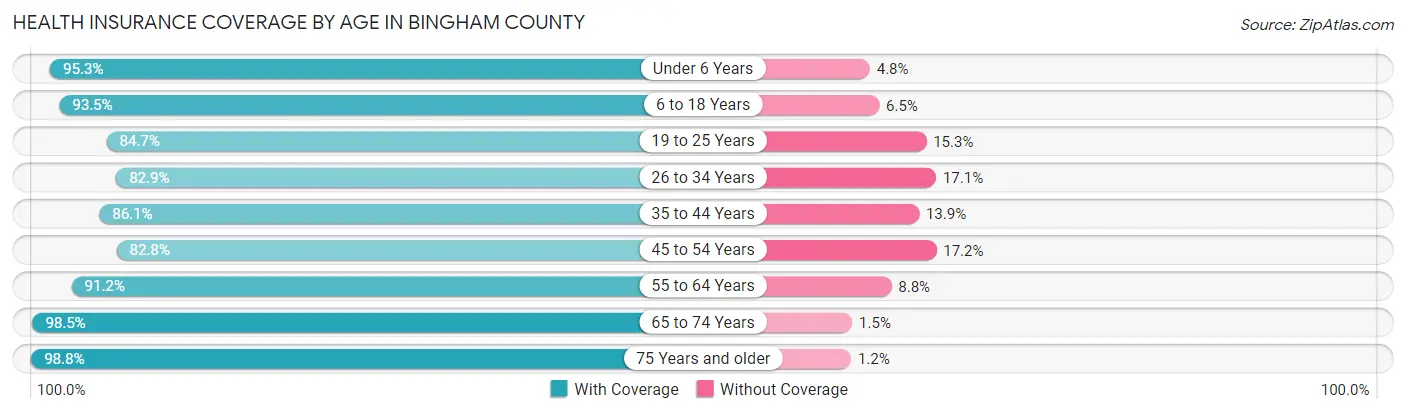
| Age Bracket | With Coverage | Without Coverage |
| Under 6 Years | 3,992 (95.3%) | 199 (4.8%) |
| 6 to 18 Years | 10,275 (93.5%) | 713 (6.5%) |
| 19 to 25 Years | 3,525 (84.7%) | 636 (15.3%) |
| 26 to 34 Years | 4,087 (82.9%) | 843 (17.1%) |
| 35 to 44 Years | 5,390 (86.1%) | 872 (13.9%) |
| 45 to 54 Years | 4,109 (82.8%) | 851 (17.2%) |
| 55 to 64 Years | 5,014 (91.2%) | 482 (8.8%) |
| 65 to 74 Years | 4,146 (98.5%) | 62 (1.5%) |
| 75 Years and older | 2,542 (98.8%) | 32 (1.2%) |
| Total | 43,080 (90.2%) | 4,690 (9.8%) |
Health Insurance Coverage by Citizenship Status in Bingham County
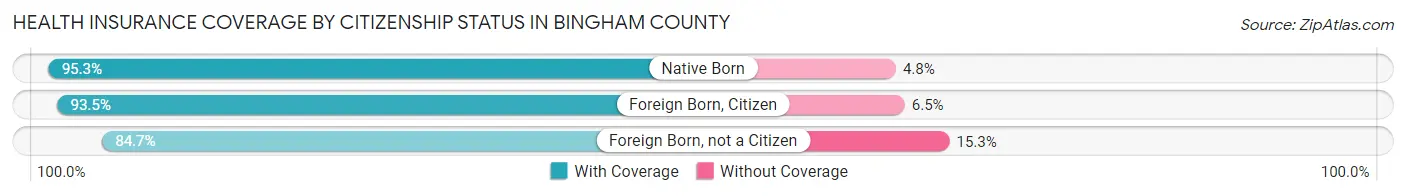
| Citizenship Status | With Coverage | Without Coverage |
| Native Born | 3,992 (95.3%) | 199 (4.8%) |
| Foreign Born, Citizen | 10,275 (93.5%) | 713 (6.5%) |
| Foreign Born, not a Citizen | 3,525 (84.7%) | 636 (15.3%) |
Health Insurance Coverage by Household Income in Bingham County
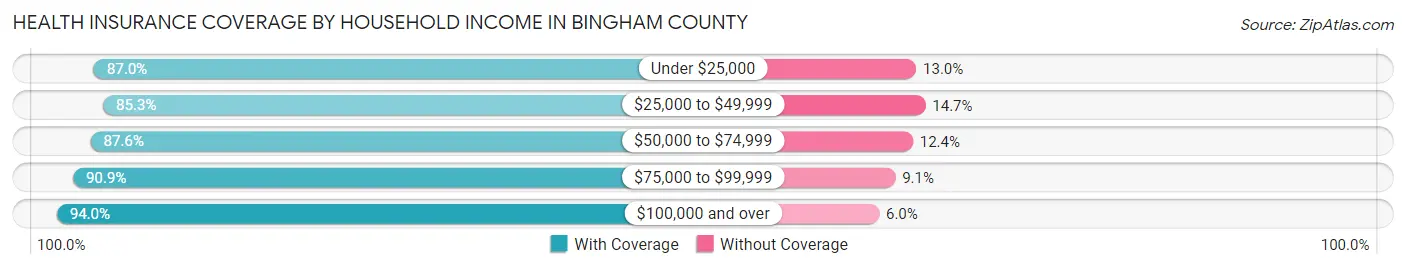
| Household Income | With Coverage | Without Coverage |
| Under $25,000 | 3,549 (87.0%) | 530 (13.0%) |
| $25,000 to $49,999 | 6,915 (85.3%) | 1,194 (14.7%) |
| $50,000 to $74,999 | 7,486 (87.6%) | 1,056 (12.4%) |
| $75,000 to $99,999 | 7,429 (90.9%) | 741 (9.1%) |
| $100,000 and over | 17,688 (94.0%) | 1,138 (6.0%) |
Public vs Private Health Insurance Coverage by Age in Bingham County
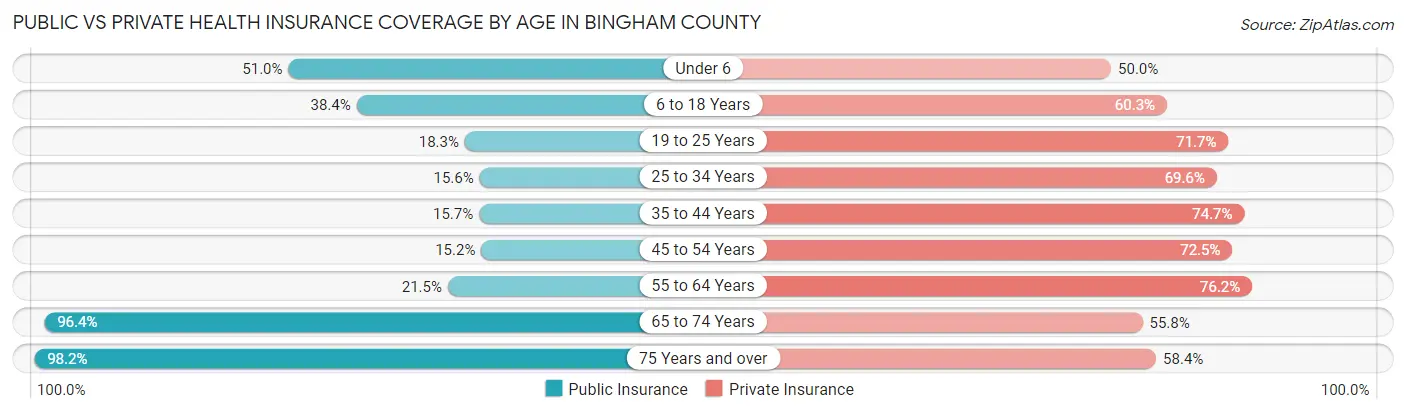
| Age Bracket | Public Insurance | Private Insurance |
| Under 6 | 2,139 (51.0%) | 2,095 (50.0%) |
| 6 to 18 Years | 4,218 (38.4%) | 6,630 (60.3%) |
| 19 to 25 Years | 761 (18.3%) | 2,985 (71.7%) |
| 25 to 34 Years | 767 (15.6%) | 3,431 (69.6%) |
| 35 to 44 Years | 980 (15.7%) | 4,679 (74.7%) |
| 45 to 54 Years | 756 (15.2%) | 3,595 (72.5%) |
| 55 to 64 Years | 1,179 (21.4%) | 4,185 (76.1%) |
| 65 to 74 Years | 4,055 (96.4%) | 2,349 (55.8%) |
| 75 Years and over | 2,528 (98.2%) | 1,502 (58.4%) |
| Total | 17,383 (36.4%) | 31,451 (65.8%) |
Disability Status by Sex by Age in Bingham County
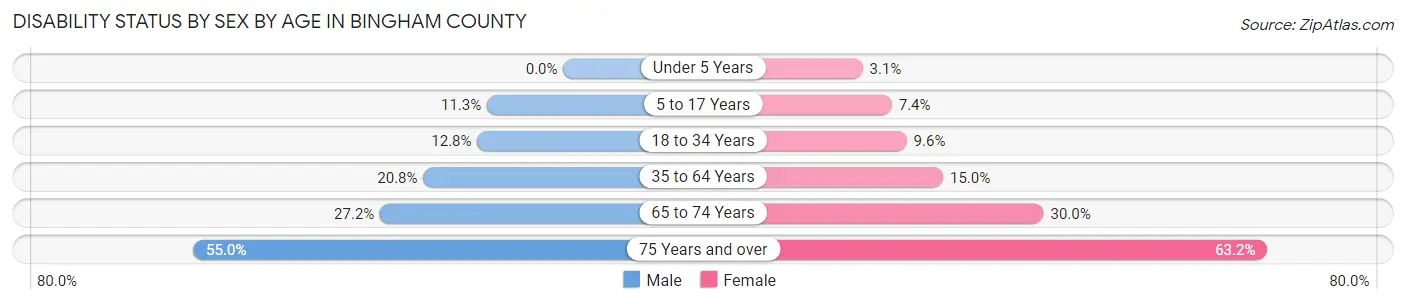
| Age Bracket | Male | Female |
| Under 5 Years | 0 (0.0%) | 52 (3.1%) |
| 5 to 17 Years | 637 (11.3%) | 398 (7.4%) |
| 18 to 34 Years | 637 (12.8%) | 469 (9.6%) |
| 35 to 64 Years | 1,759 (20.8%) | 1,242 (15.0%) |
| 65 to 74 Years | 588 (27.2%) | 613 (30.0%) |
| 75 Years and over | 630 (55.0%) | 902 (63.2%) |
Disability Class by Sex by Age in Bingham County
Disability Class: Hearing Difficulty
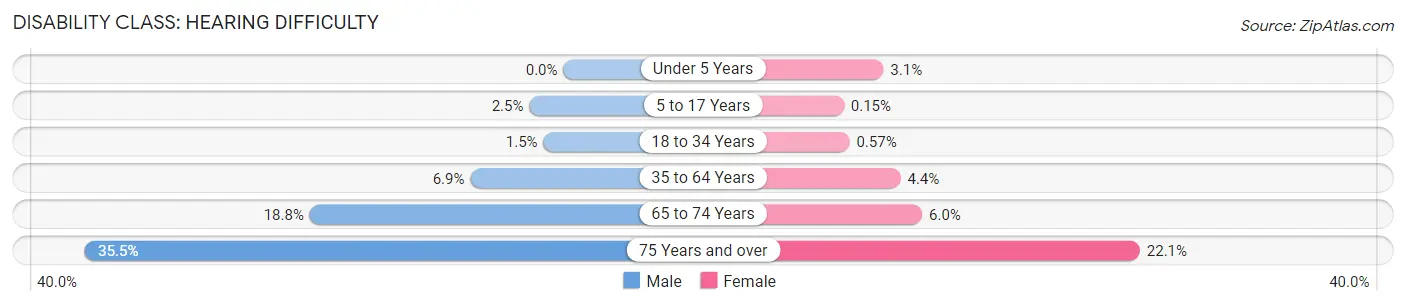
| Age Bracket | Male | Female |
| Under 5 Years | 0 (0.0%) | 52 (3.1%) |
| 5 to 17 Years | 142 (2.5%) | 8 (0.2%) |
| 18 to 34 Years | 74 (1.5%) | 28 (0.6%) |
| 35 to 64 Years | 585 (6.9%) | 360 (4.4%) |
| 65 to 74 Years | 407 (18.8%) | 122 (6.0%) |
| 75 Years and over | 407 (35.5%) | 316 (22.1%) |
Disability Class: Vision Difficulty
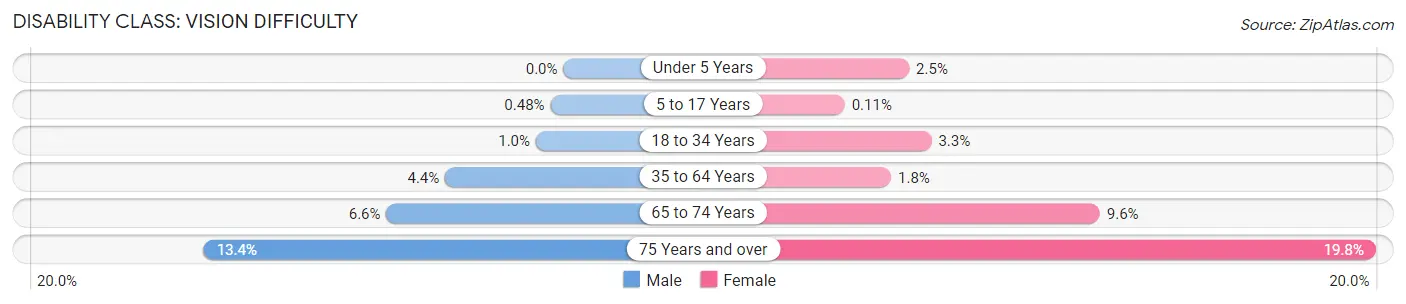
| Age Bracket | Male | Female |
| Under 5 Years | 0 (0.0%) | 42 (2.5%) |
| 5 to 17 Years | 27 (0.5%) | 6 (0.1%) |
| 18 to 34 Years | 51 (1.0%) | 162 (3.3%) |
| 35 to 64 Years | 371 (4.4%) | 151 (1.8%) |
| 65 to 74 Years | 142 (6.6%) | 196 (9.6%) |
| 75 Years and over | 153 (13.4%) | 283 (19.8%) |
Disability Class: Cognitive Difficulty
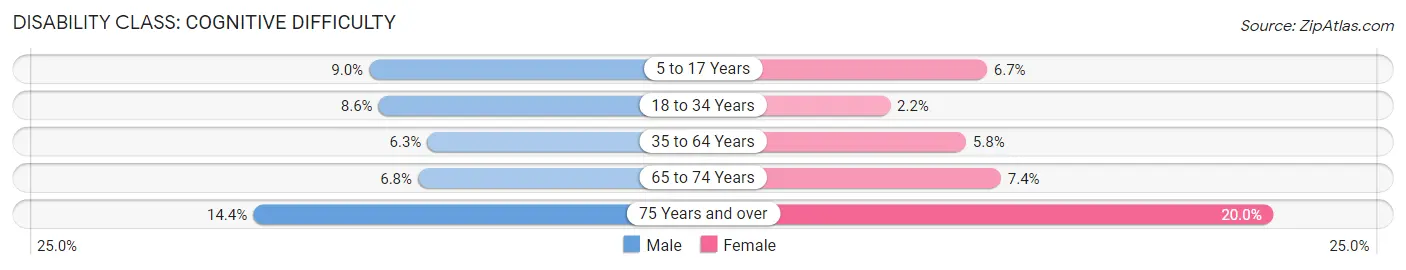
| Age Bracket | Male | Female |
| 5 to 17 Years | 507 (9.0%) | 361 (6.7%) |
| 18 to 34 Years | 428 (8.6%) | 109 (2.2%) |
| 35 to 64 Years | 535 (6.3%) | 476 (5.8%) |
| 65 to 74 Years | 146 (6.8%) | 151 (7.4%) |
| 75 Years and over | 165 (14.4%) | 286 (20.0%) |
Disability Class: Ambulatory Difficulty
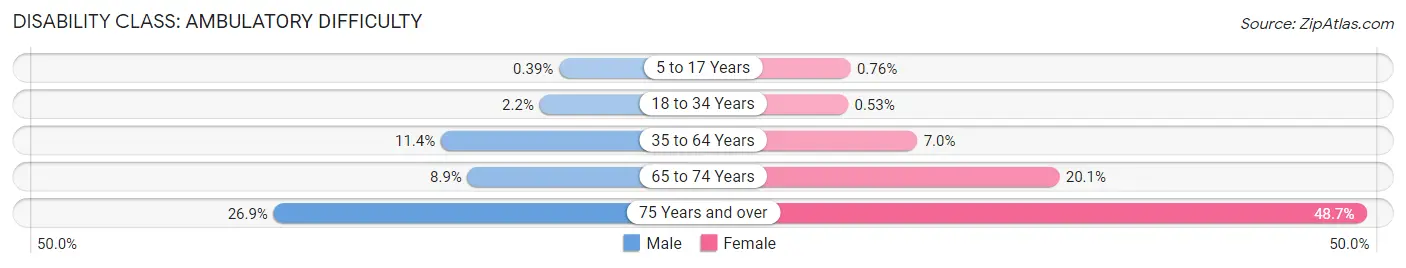
| Age Bracket | Male | Female |
| 5 to 17 Years | 22 (0.4%) | 41 (0.8%) |
| 18 to 34 Years | 109 (2.2%) | 26 (0.5%) |
| 35 to 64 Years | 960 (11.4%) | 574 (7.0%) |
| 65 to 74 Years | 192 (8.9%) | 412 (20.1%) |
| 75 Years and over | 308 (26.9%) | 695 (48.7%) |
Disability Class: Self-Care Difficulty
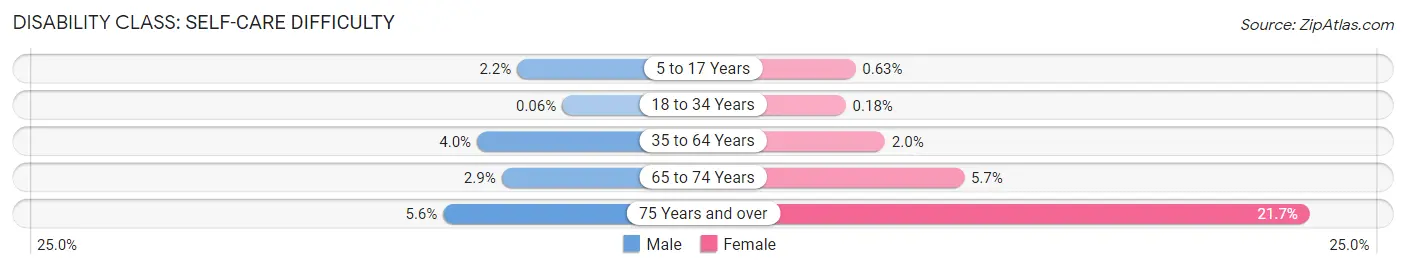
| Age Bracket | Male | Female |
| 5 to 17 Years | 121 (2.1%) | 34 (0.6%) |
| 18 to 34 Years | 3 (0.1%) | 9 (0.2%) |
| 35 to 64 Years | 339 (4.0%) | 165 (2.0%) |
| 65 to 74 Years | 62 (2.9%) | 116 (5.7%) |
| 75 Years and over | 64 (5.6%) | 310 (21.7%) |
Technology Access in Bingham County
Computing Device Access in Bingham County
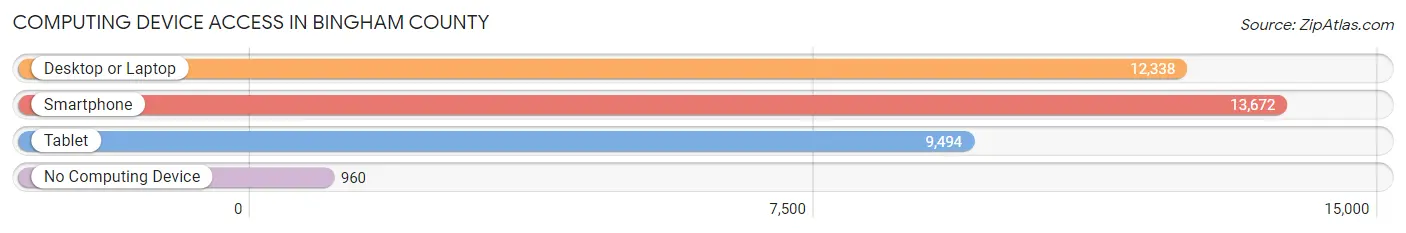
| Device Type | # Households | % Households |
| Desktop or Laptop | 12,338 | 78.9% |
| Smartphone | 13,672 | 87.5% |
| Tablet | 9,494 | 60.8% |
| No Computing Device | 960 | 6.1% |
| Total | 15,627 | 100.0% |
Internet Access in Bingham County
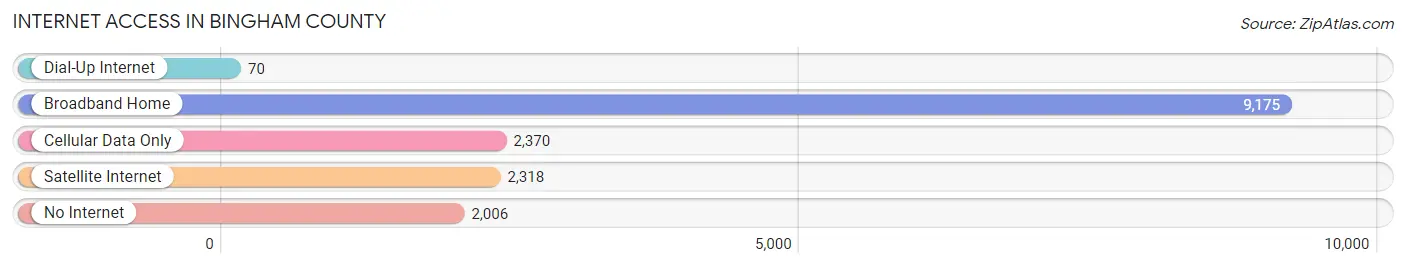
| Internet Type | # Households | % Households |
| Dial-Up Internet | 70 | 0.4% |
| Broadband Home | 9,175 | 58.7% |
| Cellular Data Only | 2,370 | 15.2% |
| Satellite Internet | 2,318 | 14.8% |
| No Internet | 2,006 | 12.8% |
| Total | 15,627 | 100.0% |
Bingham County Summary
Bingham County is located in the southeastern corner of Idaho, and is bordered by Bonneville County to the north, Caribou County to the east, and the state of Wyoming to the south and west. The county seat is Blackfoot, and the largest city is Shelley. Bingham County is part of the Idaho Falls, ID Metropolitan Statistical Area.
History
Bingham County was established in 1885, and was named after Henry Harriman Bingham, a prominent early settler in the area. The county was originally part of Oneida County, and was created from parts of Oneida and Bannock counties.
The first settlers in the area were Mormon pioneers, who arrived in the late 1840s. The first permanent settlement was established in 1864, when a group of settlers led by William H. Hooper established a settlement near the present-day town of Shelley.
The county was officially organized in 1885, and the first county seat was established in Blackfoot. The county was divided into five townships, and the first county courthouse was built in Blackfoot in 1886.
Geography
Bingham County covers an area of 1,845 square miles, and is located in the southeastern corner of Idaho. The county is bordered by Bonneville County to the north, Caribou County to the east, and the state of Wyoming to the south and west.
The Snake River runs through the county, and the county is home to several lakes, including American Falls Reservoir, Island Park Reservoir, and Grays Lake. The county is also home to several mountain ranges, including the Caribou Mountains, the Portneuf Range, and the Snake River Range.
The county has a semi-arid climate, with hot summers and cold winters. The average annual precipitation is 12.5 inches, and the average annual temperature is 48.3 degrees Fahrenheit.
Economy
The economy of Bingham County is largely based on agriculture and manufacturing. The county is home to several large agricultural operations, including dairy farms, cattle ranches, and potato farms. The county is also home to several manufacturing companies, including a large potato processing plant and a large sugar beet processing plant.
The county is also home to several large retail stores, including Walmart, Target, and Home Depot. The county is also home to several large employers, including the Idaho National Laboratory, the Idaho State University, and the Bingham County School District.
Demographics
As of the 2010 census, the population of Bingham County was 45,607. The racial makeup of the county was 90.3% White, 0.7% African American, 0.7% Native American, 0.7% Asian, 0.2% Pacific Islander, 5.3% from other races, and 2.2% from two or more races. Hispanic or Latino of any race were 11.2% of the population.
The median income for a household in the county was $41,945, and the median income for a family was $50,945. The per capita income for the county was $20,945. About 11.2% of families and 14.2% of the population were below the poverty line, including 17.2% of those under age 18 and 8.2% of those age 65 or over.
Common Questions
What is the Total Population of Bingham County?
Total Population of Bingham County is 48,253.
What is the Total Male Population of Bingham County?
Total Male Population of Bingham County is 24,367.
What is the Total Female Population of Bingham County?
Total Female Population of Bingham County is 23,886.
What is the Ratio of Males per 100 Females in Bingham County?
There are 102.01 Males per 100 Females in Bingham County.
What is the Ratio of Females per 100 Males in Bingham County?
There are 98.03 Females per 100 Males in Bingham County.
What is the Median Population Age in Bingham County?
Median Population Age in Bingham County is 34.3 Years.
What is the Average Family Size in Bingham County
Average Family Size in Bingham County is 3.6 People.
What is the Average Household Size in Bingham County
Average Household Size in Bingham County is 3.1 People.
What is Per Capita Income in Bingham County?
Per Capita income in Bingham County is $29,421.
What is the Median Family Income in Bingham County?
Median Family Income in Bingham County is $79,834.
What is the Median Household income in Bingham County?
Median Household Income in Bingham County is $69,433.
What is Income or Wage Gap in Bingham County?
Income or Wage Gap in Bingham County is 40.9%.
Women in Bingham County earn 59.1 cents for every dollar earned by a man.
What is Family Income Deficit in Bingham County?
Family Income Deficit in Bingham County is $11,313.
Families that are below poverty line in Bingham County earn $11,313 less on average than the poverty threshold level.
What is Inequality or Gini Index in Bingham County?
Inequality or Gini Index in Bingham County is 0.43.
How Large is the Labor Force in Bingham County?
There are 23,067 People in the Labor Forcein in Bingham County.
What is the Percentage of People in the Labor Force in Bingham County?
64.6% of People are in the Labor Force in Bingham County.
What is the Unemployment Rate in Bingham County?
Unemployment Rate in Bingham County is 6.1%.