Benewah County, ID
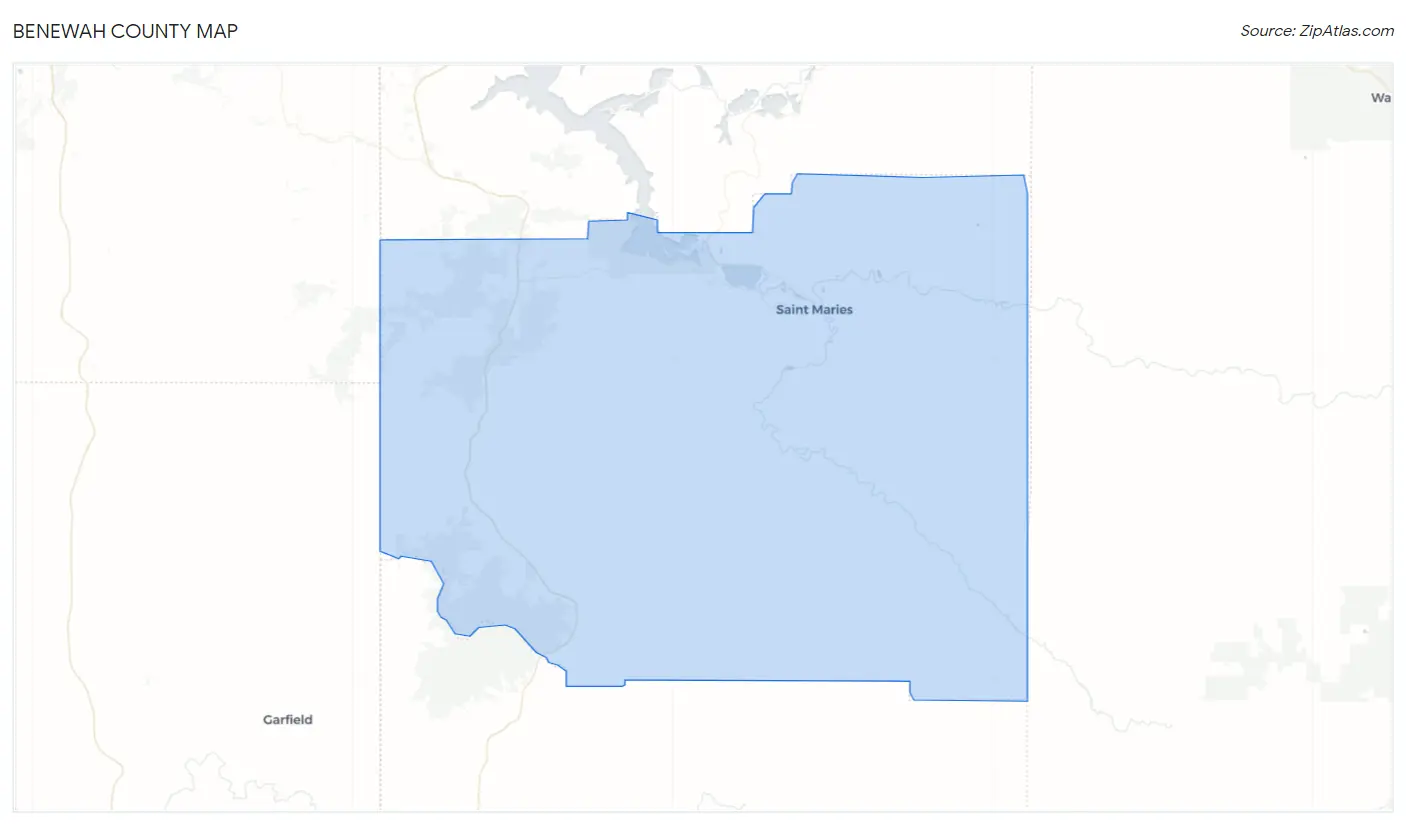
Benewah County Map
Benewah County Overview
9,731
TOTAL POPULATION
4,996
MALE POPULATION
4,735
FEMALE POPULATION
105.51
MALES / 100 FEMALES
94.78
FEMALES / 100 MALES
45.9
MEDIAN AGE
3.0
AVG FAMILY SIZE
2.5
AVG HOUSEHOLD SIZE
$28,420
PER CAPITA INCOME
$61,766
AVG FAMILY INCOME
$54,191
AVG HOUSEHOLD INCOME
42.2%
WAGE / INCOME GAP [ % ]
57.8¢/ $1
WAGE / INCOME GAP [ $ ]
$8,623
FAMILY INCOME DEFICIT
0.44
INEQUALITY / GINI INDEX
3,966
LABOR FORCE [ PEOPLE ]
50.2%
PERCENT IN LABOR FORCE
3.8%
UNEMPLOYMENT RATE
Benewah County Area Codes
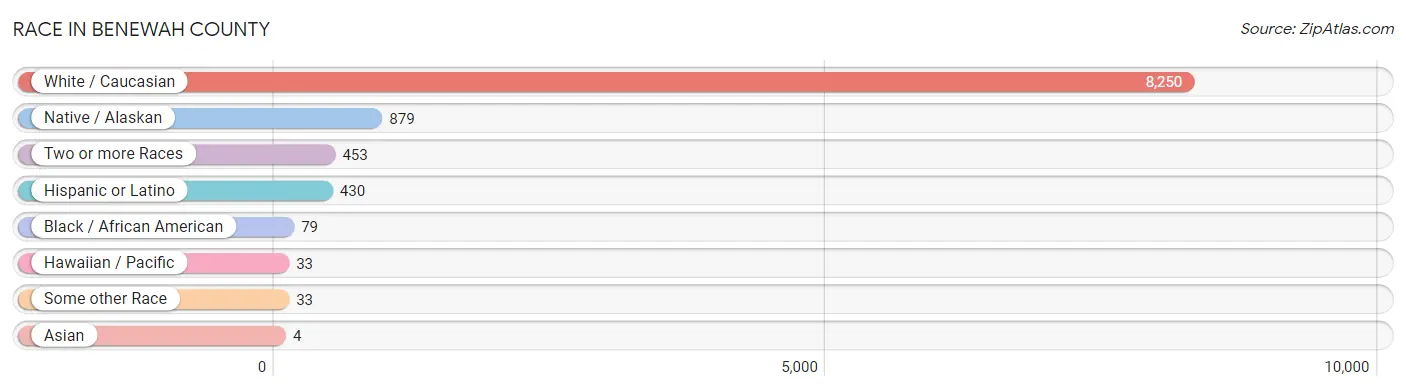
Race in Benewah County
The most populous races in Benewah County are White / Caucasian (8,250 | 84.8%), Native / Alaskan (879 | 9.0%), and Two or more Races (453 | 4.7%).
| Race | # Population | % Population |
| Asian | 4 | 0.0% |
| Black / African American | 79 | 0.8% |
| Hawaiian / Pacific | 33 | 0.3% |
| Hispanic or Latino | 430 | 4.4% |
| Native / Alaskan | 879 | 9.0% |
| White / Caucasian | 8,250 | 84.8% |
| Two or more Races | 453 | 4.7% |
| Some other Race | 33 | 0.3% |
| Total | 9,731 | 100.0% |
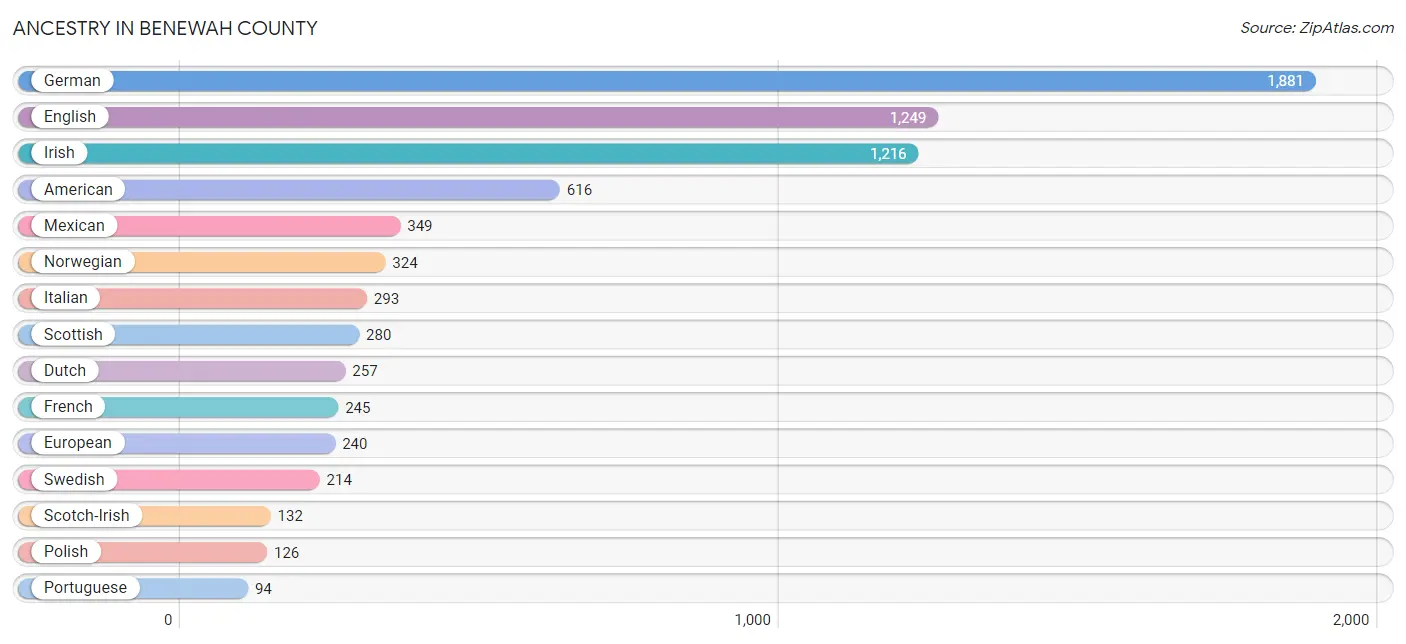
Ancestry in Benewah County
The most populous ancestries reported in Benewah County are German (1,881 | 19.3%), English (1,249 | 12.8%), Irish (1,216 | 12.5%), American (616 | 6.3%), and Mexican (349 | 3.6%), together accounting for 54.6% of all Benewah County residents.
| Ancestry | # Population | % Population |
| African | 2 | 0.0% |
| Alaska Native | 14 | 0.1% |
| American | 616 | 6.3% |
| Arab | 48 | 0.5% |
| Australian | 4 | 0.0% |
| Austrian | 13 | 0.1% |
| Bahamian | 4 | 0.0% |
| Belgian | 12 | 0.1% |
| Belizean | 1 | 0.0% |
| Blackfeet | 10 | 0.1% |
| British | 34 | 0.4% |
| Burmese | 3 | 0.0% |
| Cajun | 3 | 0.0% |
| Canadian | 18 | 0.2% |
| Celtic | 1 | 0.0% |
| Cherokee | 46 | 0.5% |
| Chippewa | 2 | 0.0% |
| Choctaw | 11 | 0.1% |
| Colville | 52 | 0.5% |
| Croatian | 11 | 0.1% |
| Cuban | 27 | 0.3% |
| Czech | 26 | 0.3% |
| Danish | 68 | 0.7% |
| Dutch | 257 | 2.6% |
| Eastern European | 15 | 0.2% |
| English | 1,249 | 12.8% |
| European | 240 | 2.5% |
| Fijian | 5 | 0.1% |
| Finnish | 22 | 0.2% |
| French | 245 | 2.5% |
| French American Indian | 1 | 0.0% |
| French Canadian | 88 | 0.9% |
| German | 1,881 | 19.3% |
| Greek | 2 | 0.0% |
| Hungarian | 38 | 0.4% |
| Icelander | 4 | 0.0% |
| Indonesian | 2 | 0.0% |
| Irish | 1,216 | 12.5% |
| Iroquois | 4 | 0.0% |
| Italian | 293 | 3.0% |
| Mexican | 349 | 3.6% |
| Native Hawaiian | 25 | 0.3% |
| Norwegian | 324 | 3.3% |
| Osage | 2 | 0.0% |
| Pakistani | 3 | 0.0% |
| Pennsylvania German | 14 | 0.1% |
| Polish | 126 | 1.3% |
| Portuguese | 94 | 1.0% |
| Potawatomi | 7 | 0.1% |
| Puerto Rican | 6 | 0.1% |
| Puget Sound Salish | 8 | 0.1% |
| Russian | 15 | 0.2% |
| Samoan | 9 | 0.1% |
| Scandinavian | 45 | 0.5% |
| Scotch-Irish | 132 | 1.4% |
| Scottish | 280 | 2.9% |
| Shoshone | 7 | 0.1% |
| Sioux | 8 | 0.1% |
| Slovak | 1 | 0.0% |
| Spaniard | 19 | 0.2% |
| Spanish | 8 | 0.1% |
| Subsaharan African | 2 | 0.0% |
| Swedish | 214 | 2.2% |
| Swiss | 7 | 0.1% |
| Syrian | 43 | 0.4% |
| Tlingit-Haida | 3 | 0.0% |
| Tsimshian | 5 | 0.1% |
| Turkish | 27 | 0.3% |
| Ukrainian | 9 | 0.1% |
| Ute | 1 | 0.0% |
| Welsh | 57 | 0.6% |
| Yakama | 5 | 0.1% |
| Yugoslavian | 3 | 0.0% |
| Yup'ik | 7 | 0.1% | View All 74 Rows |
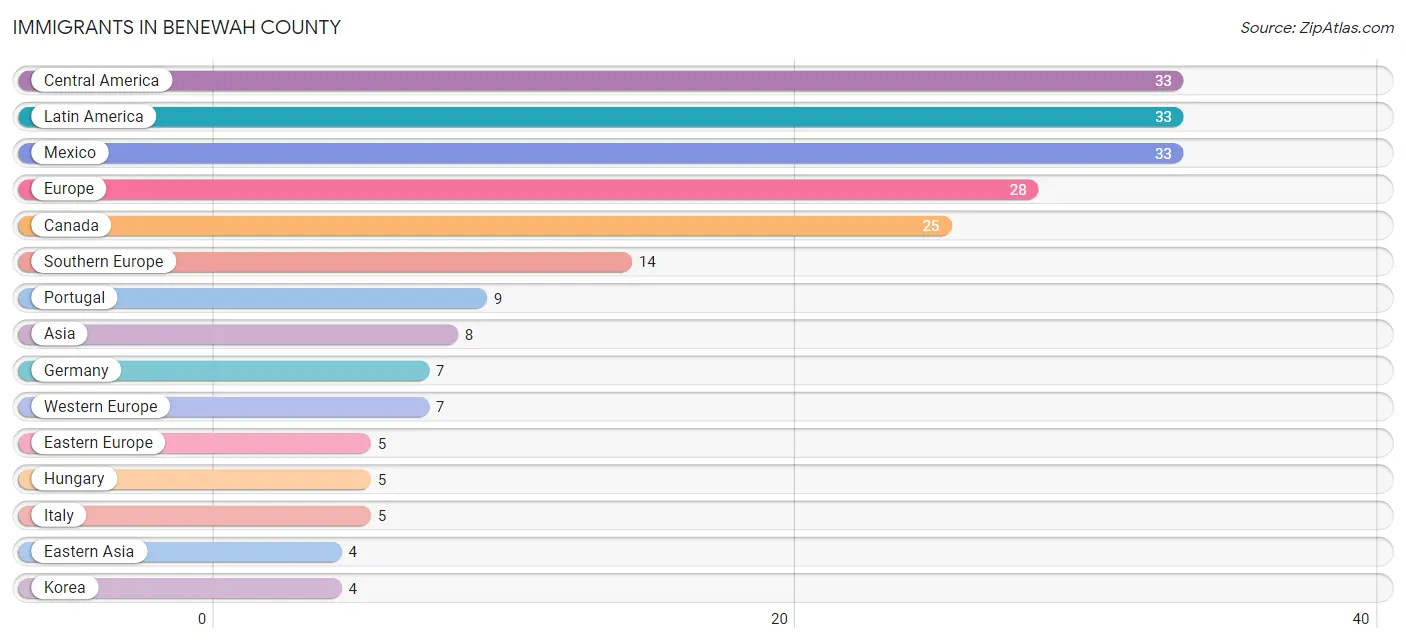
Immigrants in Benewah County
The most numerous immigrant groups reported in Benewah County came from Central America (33 | 0.3%), Latin America (33 | 0.3%), Mexico (33 | 0.3%), Europe (28 | 0.3%), and Canada (25 | 0.3%), together accounting for 1.6% of all Benewah County residents.
| Immigration Origin | # Population | % Population |
| Asia | 8 | 0.1% |
| Canada | 25 | 0.3% |
| Central America | 33 | 0.3% |
| Eastern Asia | 4 | 0.0% |
| Eastern Europe | 5 | 0.1% |
| Europe | 28 | 0.3% |
| Germany | 7 | 0.1% |
| Hungary | 5 | 0.1% |
| Italy | 5 | 0.1% |
| Korea | 4 | 0.0% |
| Latin America | 33 | 0.3% |
| Mexico | 33 | 0.3% |
| Northern Europe | 2 | 0.0% |
| Oceania | 3 | 0.0% |
| Philippines | 4 | 0.0% |
| Portugal | 9 | 0.1% |
| South Eastern Asia | 4 | 0.0% |
| Southern Europe | 14 | 0.1% |
| Western Europe | 7 | 0.1% | View All 19 Rows |
Sex and Age in Benewah County
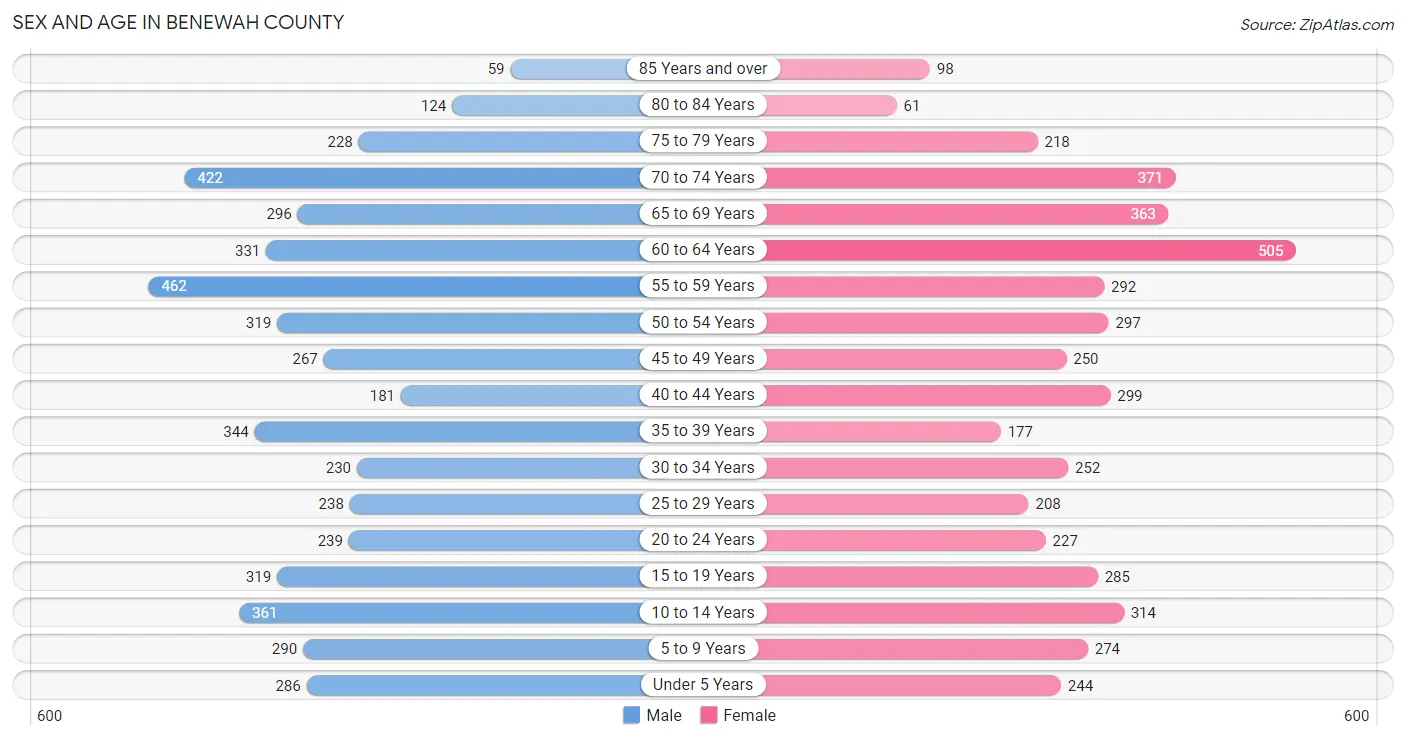
Sex and Age in Benewah County
The most populous age groups in Benewah County are 55 to 59 Years (462 | 9.2%) for men and 60 to 64 Years (505 | 10.7%) for women.
| Age Bracket | Male | Female |
| Under 5 Years | 286 (5.7%) | 244 (5.1%) |
| 5 to 9 Years | 290 (5.8%) | 274 (5.8%) |
| 10 to 14 Years | 361 (7.2%) | 314 (6.6%) |
| 15 to 19 Years | 319 (6.4%) | 285 (6.0%) |
| 20 to 24 Years | 239 (4.8%) | 227 (4.8%) |
| 25 to 29 Years | 238 (4.8%) | 208 (4.4%) |
| 30 to 34 Years | 230 (4.6%) | 252 (5.3%) |
| 35 to 39 Years | 344 (6.9%) | 177 (3.7%) |
| 40 to 44 Years | 181 (3.6%) | 299 (6.3%) |
| 45 to 49 Years | 267 (5.3%) | 250 (5.3%) |
| 50 to 54 Years | 319 (6.4%) | 297 (6.3%) |
| 55 to 59 Years | 462 (9.2%) | 292 (6.2%) |
| 60 to 64 Years | 331 (6.6%) | 505 (10.7%) |
| 65 to 69 Years | 296 (5.9%) | 363 (7.7%) |
| 70 to 74 Years | 422 (8.5%) | 371 (7.8%) |
| 75 to 79 Years | 228 (4.6%) | 218 (4.6%) |
| 80 to 84 Years | 124 (2.5%) | 61 (1.3%) |
| 85 Years and over | 59 (1.2%) | 98 (2.1%) |
| Total | 4,996 (100.0%) | 4,735 (100.0%) |
Families and Households in Benewah County
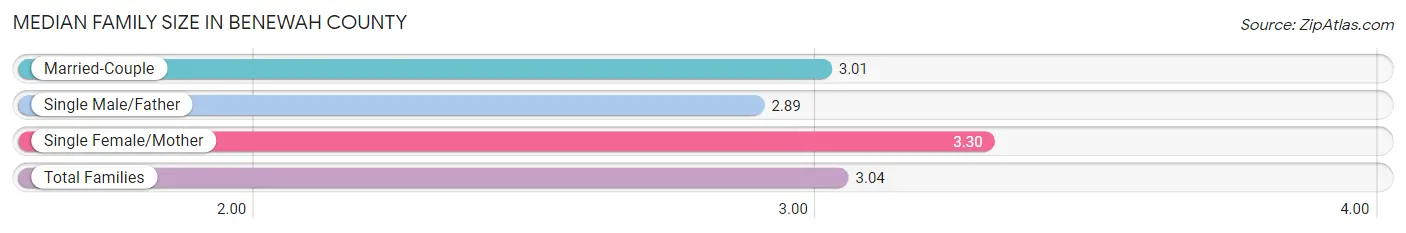
Median Family Size in Benewah County
The median family size in Benewah County is 3.04 persons per family, with single female/mother families (342 | 13.5%) accounting for the largest median family size of 3.3 persons per family. On the other hand, single male/father families (185 | 7.3%) represent the smallest median family size with 2.89 persons per family.
| Family Type | # Families | Family Size |
| Married-Couple | 2,010 (79.2%) | 3.01 |
| Single Male/Father | 185 (7.3%) | 2.89 |
| Single Female/Mother | 342 (13.5%) | 3.30 |
| Total Families | 2,537 (100.0%) | 3.04 |
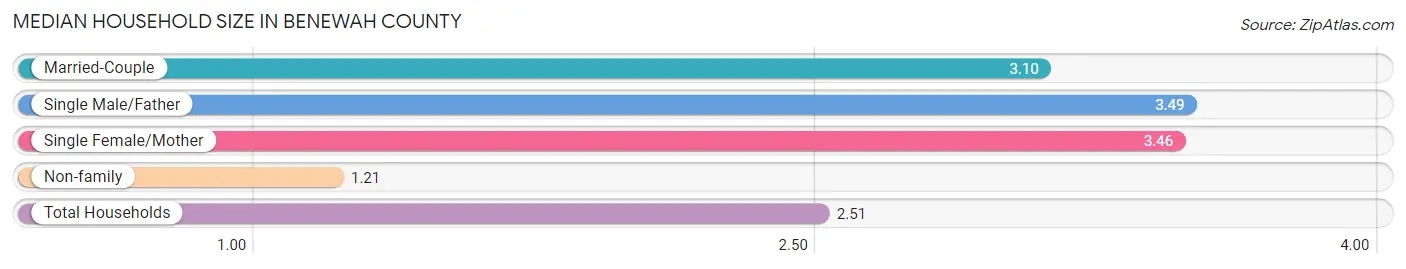
Median Household Size in Benewah County
The median household size in Benewah County is 2.51 persons per household, with single male/father households (185 | 4.8%) accounting for the largest median household size of 3.49 persons per household. non-family households (1,289 | 33.7%) represent the smallest median household size with 1.21 persons per household.
| Household Type | # Households | Household Size |
| Married-Couple | 2,010 (52.5%) | 3.10 |
| Single Male/Father | 185 (4.8%) | 3.49 |
| Single Female/Mother | 342 (8.9%) | 3.46 |
| Non-family | 1,289 (33.7%) | 1.21 |
| Total Households | 3,826 (100.0%) | 2.51 |
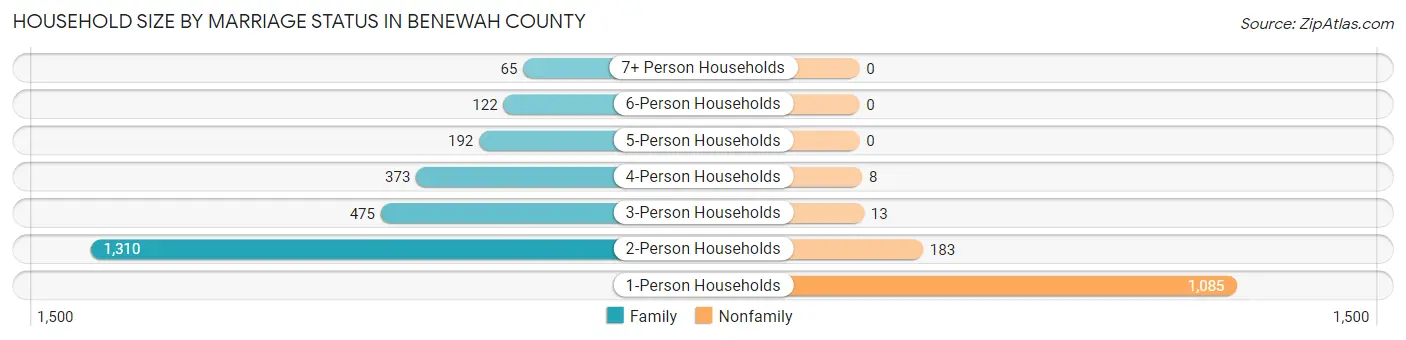
Household Size by Marriage Status in Benewah County
Out of a total of 3,826 households in Benewah County, 2,537 (66.3%) are family households, while 1,289 (33.7%) are nonfamily households. The most numerous type of family households are 2-person households, comprising 1,310, and the most common type of nonfamily households are 1-person households, comprising 1,085.
| Household Size | Family Households | Nonfamily Households |
| 1-Person Households | - | 1,085 (28.4%) |
| 2-Person Households | 1,310 (34.2%) | 183 (4.8%) |
| 3-Person Households | 475 (12.4%) | 13 (0.3%) |
| 4-Person Households | 373 (9.8%) | 8 (0.2%) |
| 5-Person Households | 192 (5.0%) | 0 (0.0%) |
| 6-Person Households | 122 (3.2%) | 0 (0.0%) |
| 7+ Person Households | 65 (1.7%) | 0 (0.0%) |
| Total | 2,537 (66.3%) | 1,289 (33.7%) |
Female Fertility in Benewah County
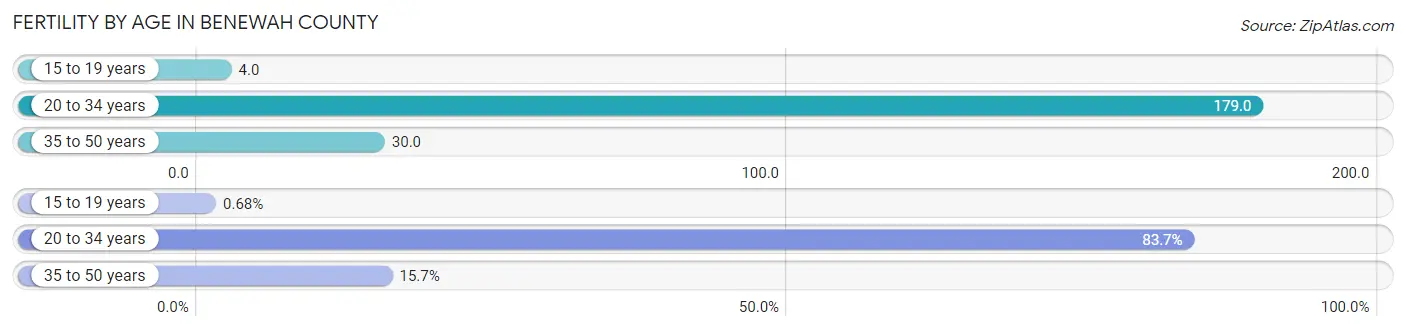
Fertility by Age in Benewah County
Average fertility rate in Benewah County is 85.0 births per 1,000 women. Women in the age bracket of 20 to 34 years have the highest fertility rate with 179.0 births per 1,000 women. Women in the age bracket of 20 to 34 years acount for 83.7% of all women with births.
| Age Bracket | Women with Births | Births / 1,000 Women |
| 15 to 19 years | 1 (0.7%) | 4.0 |
| 20 to 34 years | 123 (83.7%) | 179.0 |
| 35 to 50 years | 23 (15.7%) | 30.0 |
| Total | 147 (100.0%) | 85.0 |
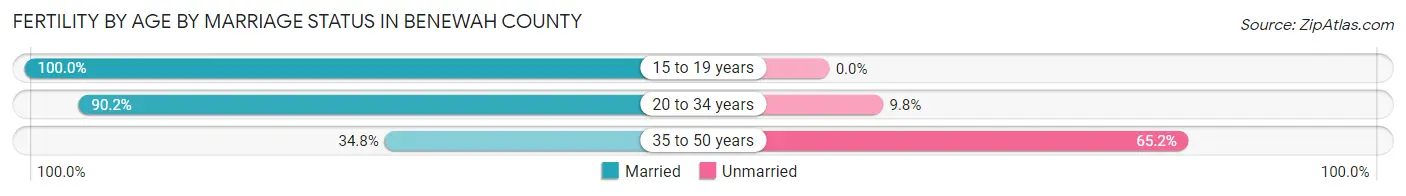
Fertility by Age by Marriage Status in Benewah County
81.6% of women with births (147) in Benewah County are married. The highest percentage of unmarried women with births falls into 35 to 50 years age bracket with 65.2% of them unmarried at the time of birth, while the lowest percentage of unmarried women with births belong to 15 to 19 years age bracket with 0.0% of them unmarried.
| Age Bracket | Married | Unmarried |
| 15 to 19 years | 1 (100.0%) | 0 (0.0%) |
| 20 to 34 years | 111 (90.2%) | 12 (9.8%) |
| 35 to 50 years | 8 (34.8%) | 15 (65.2%) |
| Total | 120 (81.6%) | 27 (18.4%) |
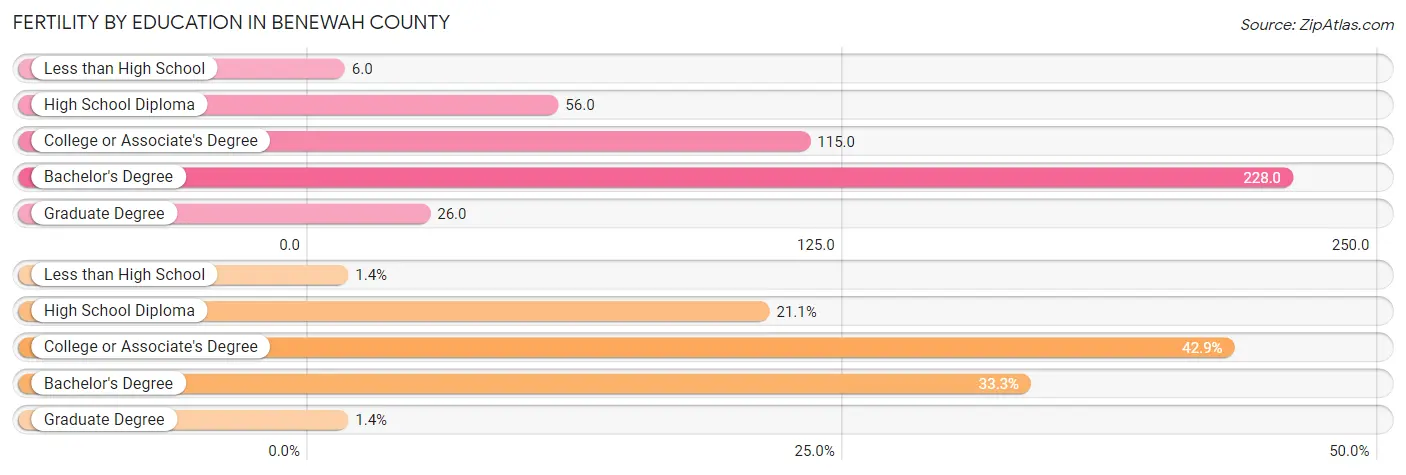
Fertility by Education in Benewah County
Average fertility rate in Benewah County is 85.0 births per 1,000 women. Women with the education attainment of bachelor's degree have the highest fertility rate of 228.0 births per 1,000 women, while women with the education attainment of less than high school have the lowest fertility at 6.0 births per 1,000 women. Women with the education attainment of college or associate's degree represent 42.9% of all women with births.
| Educational Attainment | Women with Births | Births / 1,000 Women |
| Less than High School | 2 (1.4%) | 6.0 |
| High School Diploma | 31 (21.1%) | 56.0 |
| College or Associate's Degree | 63 (42.9%) | 115.0 |
| Bachelor's Degree | 49 (33.3%) | 228.0 |
| Graduate Degree | 2 (1.4%) | 26.0 |
| Total | 147 (100.0%) | 85.0 |
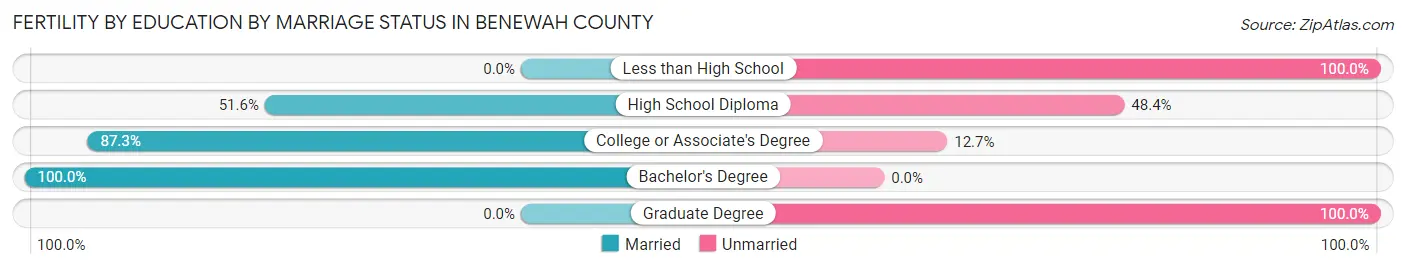
Fertility by Education by Marriage Status in Benewah County
18.4% of women with births in Benewah County are unmarried. Women with the educational attainment of bachelor's degree are most likely to be married with 100.0% of them married at childbirth, while women with the educational attainment of less than high school are least likely to be married with 100.0% of them unmarried at childbirth.
| Educational Attainment | Married | Unmarried |
| Less than High School | 0 (0.0%) | 2 (100.0%) |
| High School Diploma | 16 (51.6%) | 15 (48.4%) |
| College or Associate's Degree | 55 (87.3%) | 8 (12.7%) |
| Bachelor's Degree | 49 (100.0%) | 0 (0.0%) |
| Graduate Degree | 0 (0.0%) | 2 (100.0%) |
| Total | 120 (81.6%) | 27 (18.4%) |
Income in Benewah County
Income Overview in Benewah County
Per Capita Income in Benewah County is $28,420, while median incomes of families and households are $61,766 and $54,191 respectively.
| Characteristic | Number | Measure |
| Per Capita Income | 9,731 | $28,420 |
| Median Family Income | 2,537 | $61,766 |
| Mean Family Income | 2,537 | $79,599 |
| Median Household Income | 3,826 | $54,191 |
| Mean Household Income | 3,826 | $68,342 |
| Income Deficit | 2,537 | $8,623 |
| Wage / Income Gap (%) | 9,731 | 42.21% |
| Wage / Income Gap ($) | 9,731 | 57.79¢ per $1 |
| Gini / Inequality Index | 9,731 | 0.44 |
Earnings by Sex in Benewah County
Average Earnings in Benewah County are $33,935, $45,735 for men and $26,429 for women, a difference of 42.2%.
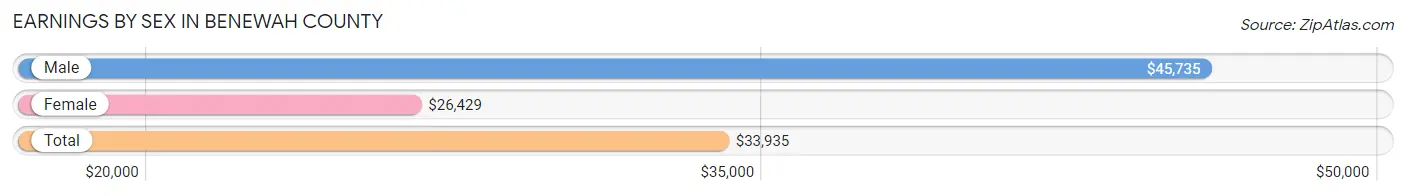
| Sex | Number | Average Earnings |
| Male | 2,324 (54.6%) | $45,735 |
| Female | 1,932 (45.4%) | $26,429 |
| Total | 4,256 (100.0%) | $33,935 |
Earnings by Sex by Income Bracket in Benewah County
The most common earnings brackets in Benewah County are $55,000 to $64,999 for men (242 | 10.4%) and $40,000 to $44,999 for women (228 | 11.8%).
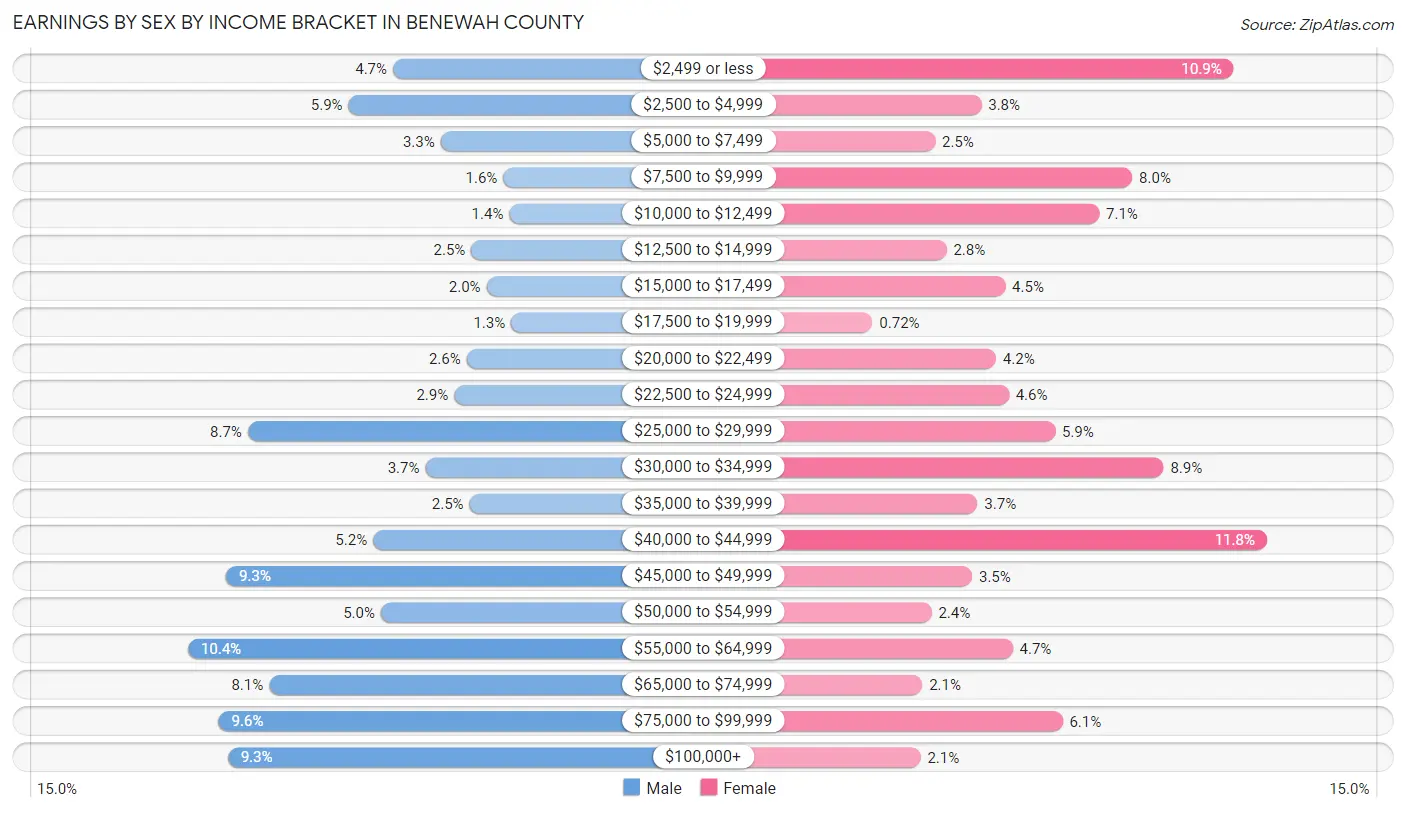
| Income | Male | Female |
| $2,499 or less | 108 (4.6%) | 210 (10.9%) |
| $2,500 to $4,999 | 137 (5.9%) | 73 (3.8%) |
| $5,000 to $7,499 | 77 (3.3%) | 48 (2.5%) |
| $7,500 to $9,999 | 36 (1.5%) | 155 (8.0%) |
| $10,000 to $12,499 | 32 (1.4%) | 137 (7.1%) |
| $12,500 to $14,999 | 57 (2.5%) | 54 (2.8%) |
| $15,000 to $17,499 | 47 (2.0%) | 86 (4.4%) |
| $17,500 to $19,999 | 31 (1.3%) | 14 (0.7%) |
| $20,000 to $22,499 | 60 (2.6%) | 81 (4.2%) |
| $22,500 to $24,999 | 68 (2.9%) | 88 (4.5%) |
| $25,000 to $29,999 | 203 (8.7%) | 113 (5.9%) |
| $30,000 to $34,999 | 87 (3.7%) | 172 (8.9%) |
| $35,000 to $39,999 | 58 (2.5%) | 71 (3.7%) |
| $40,000 to $44,999 | 121 (5.2%) | 228 (11.8%) |
| $45,000 to $49,999 | 217 (9.3%) | 68 (3.5%) |
| $50,000 to $54,999 | 116 (5.0%) | 46 (2.4%) |
| $55,000 to $64,999 | 242 (10.4%) | 90 (4.7%) |
| $65,000 to $74,999 | 189 (8.1%) | 41 (2.1%) |
| $75,000 to $99,999 | 222 (9.6%) | 117 (6.1%) |
| $100,000+ | 216 (9.3%) | 40 (2.1%) |
| Total | 2,324 (100.0%) | 1,932 (100.0%) |
Earnings by Sex by Educational Attainment in Benewah County
Average earnings in Benewah County are $47,922 for men and $29,037 for women, a difference of 39.4%. Men with an educational attainment of graduate degree enjoy the highest average annual earnings of $83,100, while those with less than high school education earn the least with $32,617. Women with an educational attainment of graduate degree earn the most with the average annual earnings of $65,750, while those with less than high school education have the smallest earnings of $16,563.
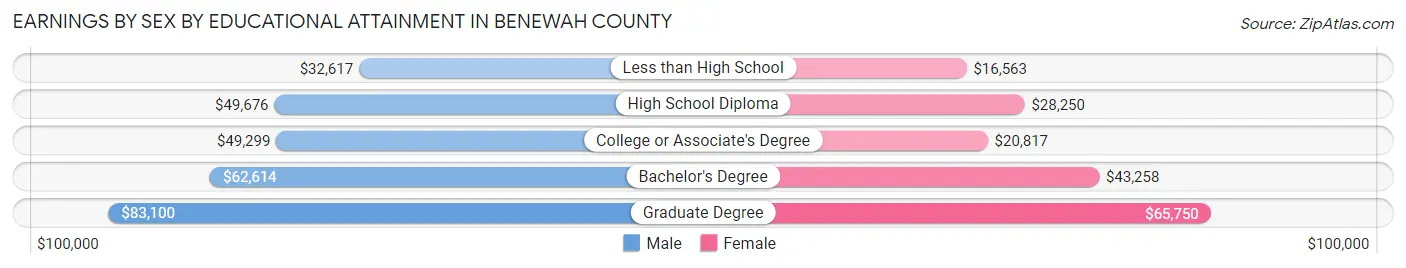
| Educational Attainment | Male Income | Female Income |
| Less than High School | $32,617 | $16,563 |
| High School Diploma | $49,676 | $28,250 |
| College or Associate's Degree | $49,299 | $20,817 |
| Bachelor's Degree | $62,614 | $43,258 |
| Graduate Degree | $83,100 | $65,750 |
| Total | $47,922 | $29,037 |
Family Income in Benewah County
Family Income Brackets in Benewah County
According to the Benewah County family income data, there are 558 families falling into the $50,000 to $74,999 income range, which is the most common income bracket and makes up 22.0% of all families. Conversely, the $10,000 to $14,999 income bracket is the least frequent group with only 28 families (1.1%) belonging to this category.
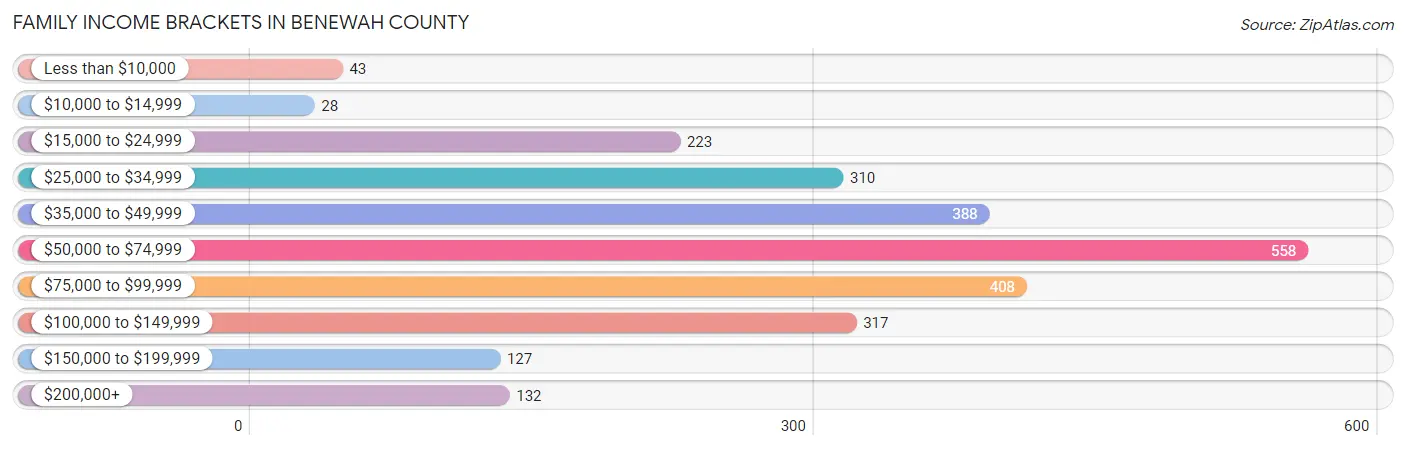
| Income Bracket | # Families | % Families |
| Less than $10,000 | 43 | 1.7% |
| $10,000 to $14,999 | 28 | 1.1% |
| $15,000 to $24,999 | 223 | 8.8% |
| $25,000 to $34,999 | 310 | 12.2% |
| $35,000 to $49,999 | 388 | 15.3% |
| $50,000 to $74,999 | 558 | 22.0% |
| $75,000 to $99,999 | 408 | 16.1% |
| $100,000 to $149,999 | 317 | 12.5% |
| $150,000 to $199,999 | 127 | 5.0% |
| $200,000+ | 132 | 5.2% |
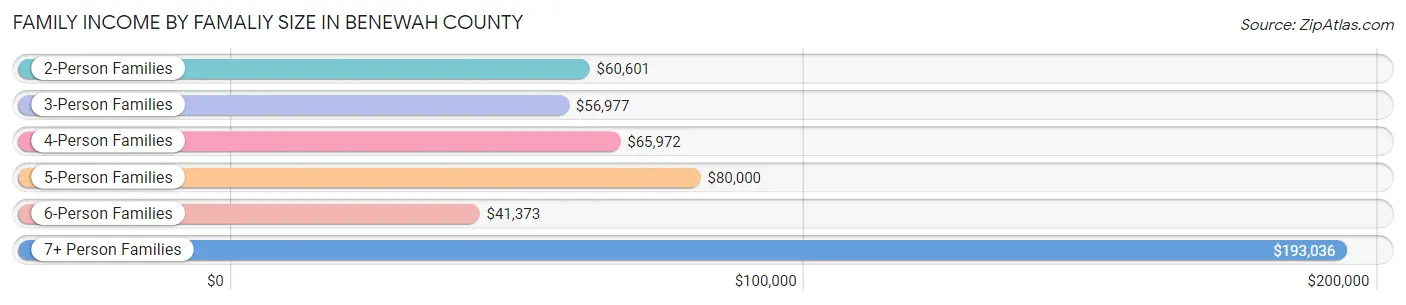
Family Income by Famaliy Size in Benewah County
7+ person families (57 | 2.2%) account for the highest median family income in Benewah County with $193,036 per family, while 2-person families (1,361 | 53.6%) have the highest median income of $30,300 per family member.
| Income Bracket | # Families | Median Income |
| 2-Person Families | 1,361 (53.6%) | $60,601 |
| 3-Person Families | 516 (20.3%) | $56,977 |
| 4-Person Families | 351 (13.8%) | $65,972 |
| 5-Person Families | 136 (5.4%) | $80,000 |
| 6-Person Families | 116 (4.6%) | $41,373 |
| 7+ Person Families | 57 (2.2%) | $193,036 |
| Total | 2,537 (100.0%) | $61,766 |
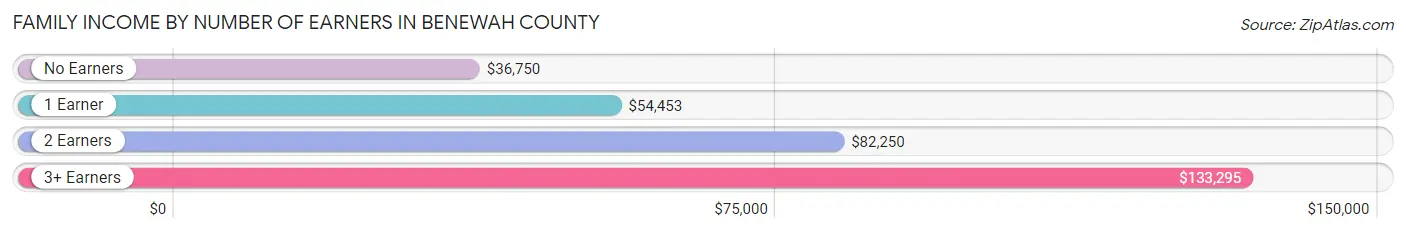
Family Income by Number of Earners in Benewah County
The median family income in Benewah County is $61,766, with families comprising 3+ earners (173) having the highest median family income of $133,295, while families with no earners (617) have the lowest median family income of $36,750, accounting for 6.8% and 24.3% of families, respectively.
| Number of Earners | # Families | Median Income |
| No Earners | 617 (24.3%) | $36,750 |
| 1 Earner | 993 (39.1%) | $54,453 |
| 2 Earners | 754 (29.7%) | $82,250 |
| 3+ Earners | 173 (6.8%) | $133,295 |
| Total | 2,537 (100.0%) | $61,766 |
Household Income in Benewah County
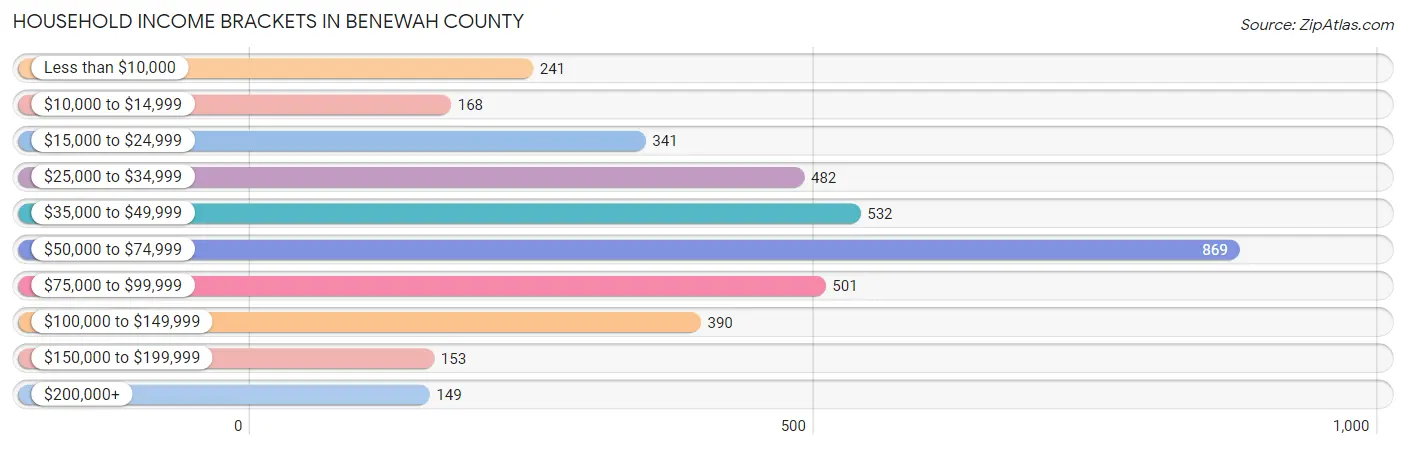
Household Income Brackets in Benewah County
With 869 households falling in the category, the $50,000 to $74,999 income range is the most frequent in Benewah County, accounting for 22.7% of all households. In contrast, only 149 households (3.9%) fall into the $200,000+ income bracket, making it the least populous group.
| Income Bracket | # Households | % Households |
| Less than $10,000 | 241 | 6.3% |
| $10,000 to $14,999 | 168 | 4.4% |
| $15,000 to $24,999 | 341 | 8.9% |
| $25,000 to $34,999 | 482 | 12.6% |
| $35,000 to $49,999 | 532 | 13.9% |
| $50,000 to $74,999 | 869 | 22.7% |
| $75,000 to $99,999 | 501 | 13.1% |
| $100,000 to $149,999 | 390 | 10.2% |
| $150,000 to $199,999 | 153 | 4.0% |
| $200,000+ | 149 | 3.9% |
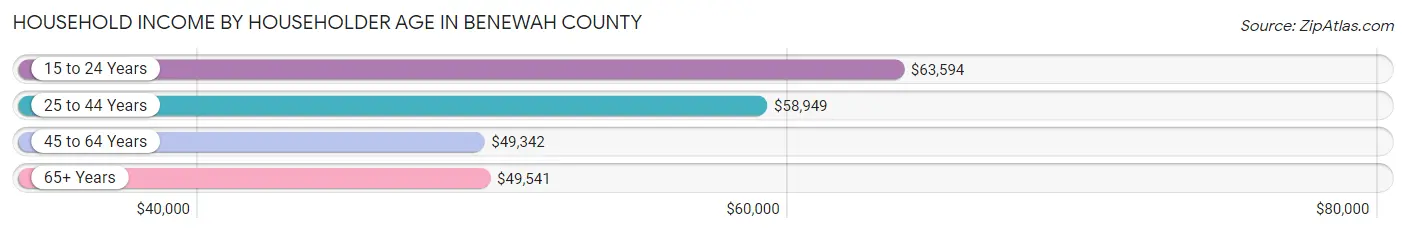
Household Income by Householder Age in Benewah County
The median household income in Benewah County is $54,191, with the highest median household income of $63,594 found in the 15 to 24 years age bracket for the primary householder. A total of 124 households (3.2%) fall into this category. Meanwhile, the 45 to 64 years age bracket for the primary householder has the lowest median household income of $49,342, with 1,454 households (38.0%) in this group.
| Income Bracket | # Households | Median Income |
| 15 to 24 Years | 124 (3.2%) | $63,594 |
| 25 to 44 Years | 915 (23.9%) | $58,949 |
| 45 to 64 Years | 1,454 (38.0%) | $49,342 |
| 65+ Years | 1,333 (34.8%) | $49,541 |
| Total | 3,826 (100.0%) | $54,191 |
Poverty in Benewah County
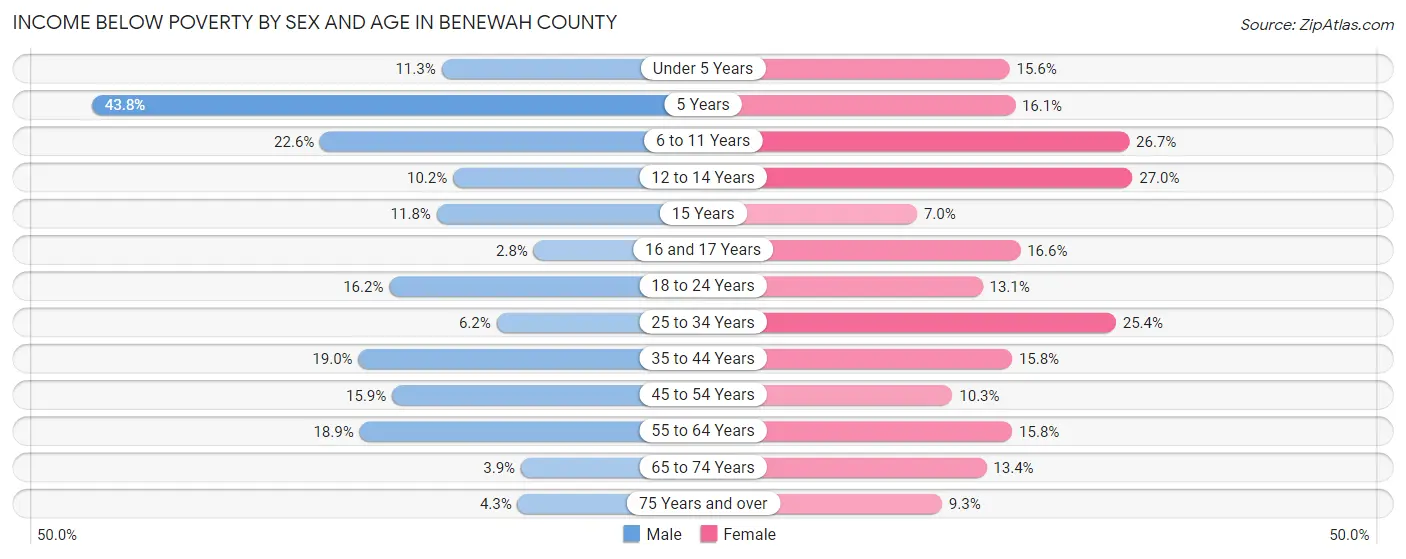
Income Below Poverty by Sex and Age in Benewah County
With 12.9% poverty level for males and 16.3% for females among the residents of Benewah County, 5 year old males and 12 to 14 year old females are the most vulnerable to poverty, with 7 males (43.8%) and 55 females (27.0%) in their respective age groups living below the poverty level.
| Age Bracket | Male | Female |
| Under 5 Years | 32 (11.3%) | 38 (15.6%) |
| 5 Years | 7 (43.8%) | 9 (16.1%) |
| 6 to 11 Years | 100 (22.6%) | 84 (26.7%) |
| 12 to 14 Years | 17 (10.2%) | 55 (27.0%) |
| 15 Years | 2 (11.8%) | 3 (7.0%) |
| 16 and 17 Years | 5 (2.8%) | 25 (16.6%) |
| 18 to 24 Years | 58 (16.2%) | 41 (13.1%) |
| 25 to 34 Years | 29 (6.2%) | 117 (25.4%) |
| 35 to 44 Years | 97 (19.0%) | 75 (15.8%) |
| 45 to 54 Years | 92 (15.9%) | 56 (10.3%) |
| 55 to 64 Years | 150 (18.9%) | 126 (15.8%) |
| 65 to 74 Years | 28 (3.9%) | 97 (13.4%) |
| 75 Years and over | 17 (4.3%) | 30 (9.3%) |
| Total | 634 (12.9%) | 756 (16.3%) |
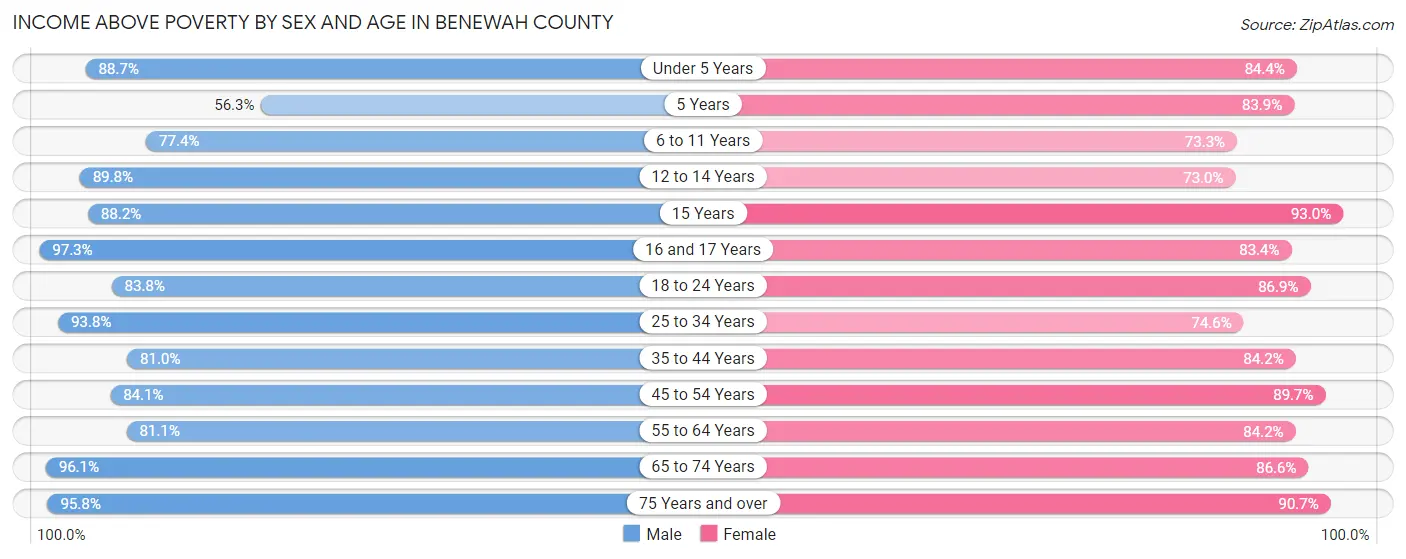
Income Above Poverty by Sex and Age in Benewah County
According to the poverty statistics in Benewah County, males aged 16 and 17 years and females aged 15 years are the age groups that are most secure financially, with 97.3% of males and 93.0% of females in these age groups living above the poverty line.
| Age Bracket | Male | Female |
| Under 5 Years | 251 (88.7%) | 206 (84.4%) |
| 5 Years | 9 (56.2%) | 47 (83.9%) |
| 6 to 11 Years | 343 (77.4%) | 231 (73.3%) |
| 12 to 14 Years | 149 (89.8%) | 149 (73.0%) |
| 15 Years | 15 (88.2%) | 40 (93.0%) |
| 16 and 17 Years | 177 (97.3%) | 126 (83.4%) |
| 18 to 24 Years | 301 (83.8%) | 273 (86.9%) |
| 25 to 34 Years | 439 (93.8%) | 343 (74.6%) |
| 35 to 44 Years | 413 (81.0%) | 400 (84.2%) |
| 45 to 54 Years | 487 (84.1%) | 490 (89.7%) |
| 55 to 64 Years | 643 (81.1%) | 671 (84.2%) |
| 65 to 74 Years | 682 (96.1%) | 626 (86.6%) |
| 75 Years and over | 383 (95.8%) | 293 (90.7%) |
| Total | 4,292 (87.1%) | 3,895 (83.8%) |
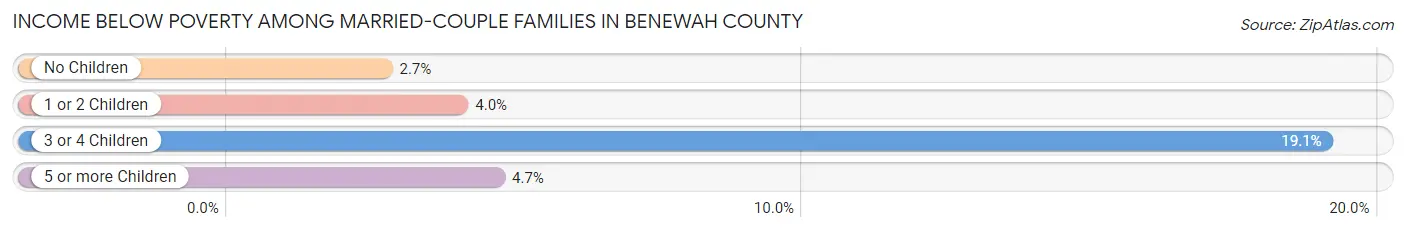
Income Below Poverty Among Married-Couple Families in Benewah County
The poverty statistics for married-couple families in Benewah County show that 4.6% or 93 of the total 2,010 families live below the poverty line. Families with 3 or 4 children have the highest poverty rate of 19.1%, comprising of 37 families. On the other hand, families with no children have the lowest poverty rate of 2.7%, which includes 35 families.
| Children | Above Poverty | Below Poverty |
| No Children | 1,264 (97.3%) | 35 (2.7%) |
| 1 or 2 Children | 455 (96.0%) | 19 (4.0%) |
| 3 or 4 Children | 157 (80.9%) | 37 (19.1%) |
| 5 or more Children | 41 (95.4%) | 2 (4.6%) |
| Total | 1,917 (95.4%) | 93 (4.6%) |
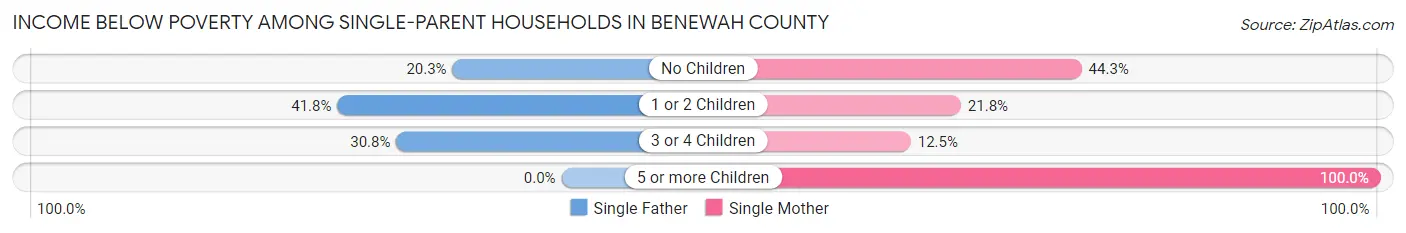
Income Below Poverty Among Single-Parent Households in Benewah County
According to the poverty data in Benewah County, 32.4% or 60 single-father households and 28.9% or 99 single-mother households are living below the poverty line. Among single-father households, those with 1 or 2 children have the highest poverty rate, with 43 households (41.7%) experiencing poverty. Likewise, among single-mother households, those with 5 or more children have the highest poverty rate, with 7 households (100.0%) falling below the poverty line.
| Children | Single Father | Single Mother |
| No Children | 13 (20.3%) | 43 (44.3%) |
| 1 or 2 Children | 43 (41.7%) | 45 (21.8%) |
| 3 or 4 Children | 4 (30.8%) | 4 (12.5%) |
| 5 or more Children | 0 (0.0%) | 7 (100.0%) |
| Total | 60 (32.4%) | 99 (28.9%) |
Income Below Poverty Among Married-Couple vs Single-Parent Households in Benewah County
The poverty data for Benewah County shows that 93 of the married-couple family households (4.6%) and 159 of the single-parent households (30.2%) are living below the poverty level. Within the married-couple family households, those with 3 or 4 children have the highest poverty rate, with 37 households (19.1%) falling below the poverty line. Among the single-parent households, those with 5 or more children have the highest poverty rate, with 7 household (58.3%) living below poverty.
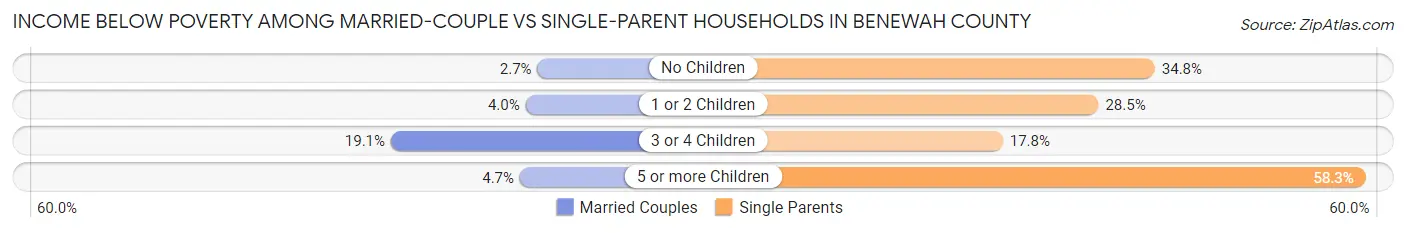
| Children | Married-Couple Families | Single-Parent Households |
| No Children | 35 (2.7%) | 56 (34.8%) |
| 1 or 2 Children | 19 (4.0%) | 88 (28.5%) |
| 3 or 4 Children | 37 (19.1%) | 8 (17.8%) |
| 5 or more Children | 2 (4.6%) | 7 (58.3%) |
| Total | 93 (4.6%) | 159 (30.2%) |
Employment Characteristics in Benewah County
Employment by Class of Employer in Benewah County
Among the 3,734 employed individuals in Benewah County, private company employees (2,228 | 59.7%), self-employed (not incorporated) (382 | 10.2%), and local government employees (372 | 10.0%) make up the most common classes of employment.
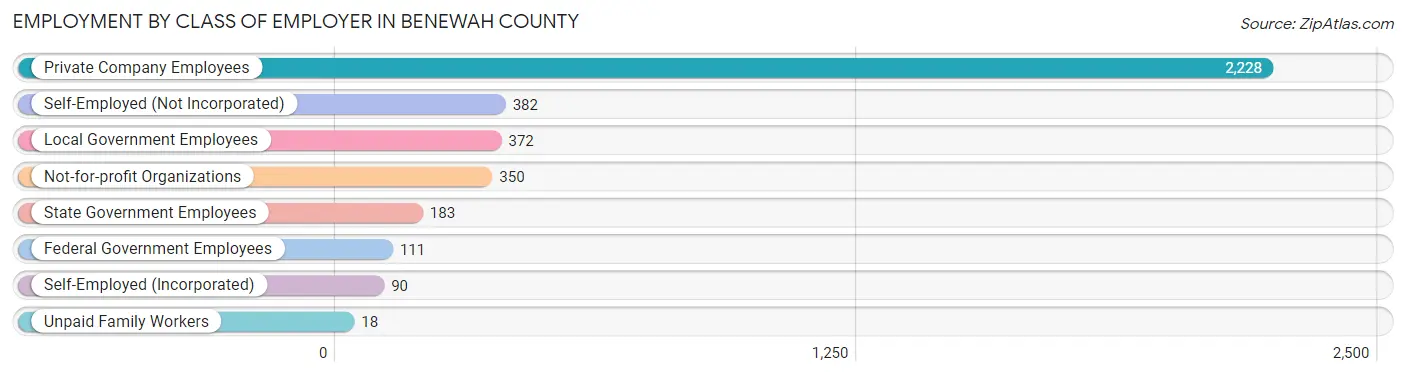
| Employer Class | # Employees | % Employees |
| Private Company Employees | 2,228 | 59.7% |
| Self-Employed (Incorporated) | 90 | 2.4% |
| Self-Employed (Not Incorporated) | 382 | 10.2% |
| Not-for-profit Organizations | 350 | 9.4% |
| Local Government Employees | 372 | 10.0% |
| State Government Employees | 183 | 4.9% |
| Federal Government Employees | 111 | 3.0% |
| Unpaid Family Workers | 18 | 0.5% |
| Total | 3,734 | 100.0% |
Employment Status by Age in Benewah County
According to the labor force statistics for Benewah County, out of the total population over 16 years of age (7,901), 50.2% or 3,966 individuals are in the labor force, with 3.8% or 151 of them unemployed. The age group with the highest labor force participation rate is 35 to 44 years, with 74.2% or 743 individuals in the labor force. Within the labor force, the 25 to 29 years age range has the highest percentage of unemployed individuals, with 11.1% or 29 of them being unemployed.
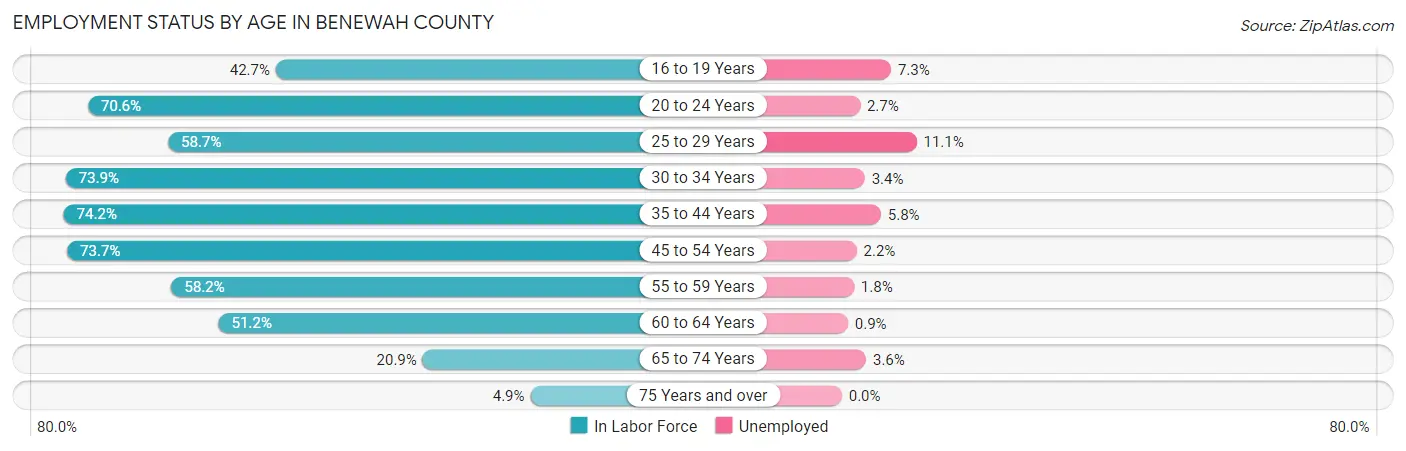
| Age Bracket | In Labor Force | Unemployed |
| 16 to 19 Years | 232 (42.7%) | 17 (7.3%) |
| 20 to 24 Years | 329 (70.6%) | 9 (2.7%) |
| 25 to 29 Years | 262 (58.7%) | 29 (11.1%) |
| 30 to 34 Years | 356 (73.9%) | 12 (3.4%) |
| 35 to 44 Years | 743 (74.2%) | 43 (5.8%) |
| 45 to 54 Years | 835 (73.7%) | 18 (2.2%) |
| 55 to 59 Years | 439 (58.2%) | 8 (1.8%) |
| 60 to 64 Years | 428 (51.2%) | 4 (0.9%) |
| 65 to 74 Years | 303 (20.9%) | 11 (3.6%) |
| 75 Years and over | 39 (4.9%) | 0 (0.0%) |
| Total | 3,966 (50.2%) | 151 (3.8%) |
Employment Status by Educational Attainment in Benewah County
According to labor force statistics for Benewah County, 65.8% of individuals (3,061) out of the total population between 25 and 64 years of age (4,652) are in the labor force, with 3.7% or 113 of them being unemployed. The group with the highest labor force participation rate are those with the educational attainment of bachelor's degree or higher, with 78.3% or 643 individuals in the labor force. Within the labor force, individuals with college / associate degree education have the highest percentage of unemployment, with 4.0% or 37 of them being unemployed.
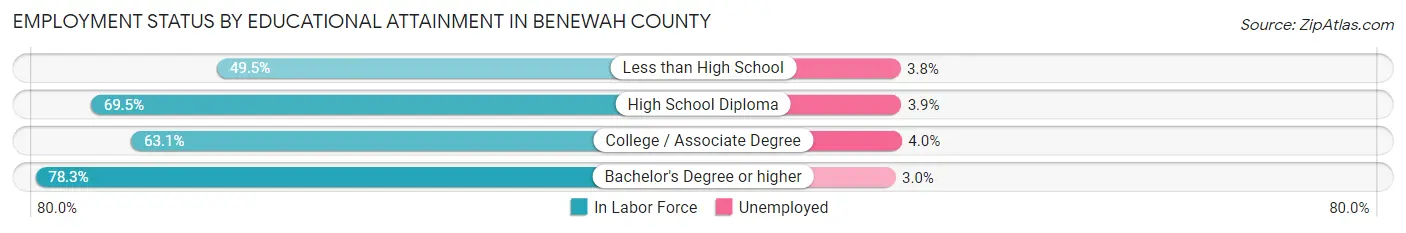
| Educational Attainment | In Labor Force | Unemployed |
| Less than High School | 371 (49.5%) | 28 (3.8%) |
| High School Diploma | 1,129 (69.5%) | 63 (3.9%) |
| College / Associate Degree | 919 (63.1%) | 58 (4.0%) |
| Bachelor's Degree or higher | 643 (78.3%) | 25 (3.0%) |
| Total | 3,061 (65.8%) | 172 (3.7%) |
Employment Occupations by Sex in Benewah County
Management, Business, Science and Arts Occupations
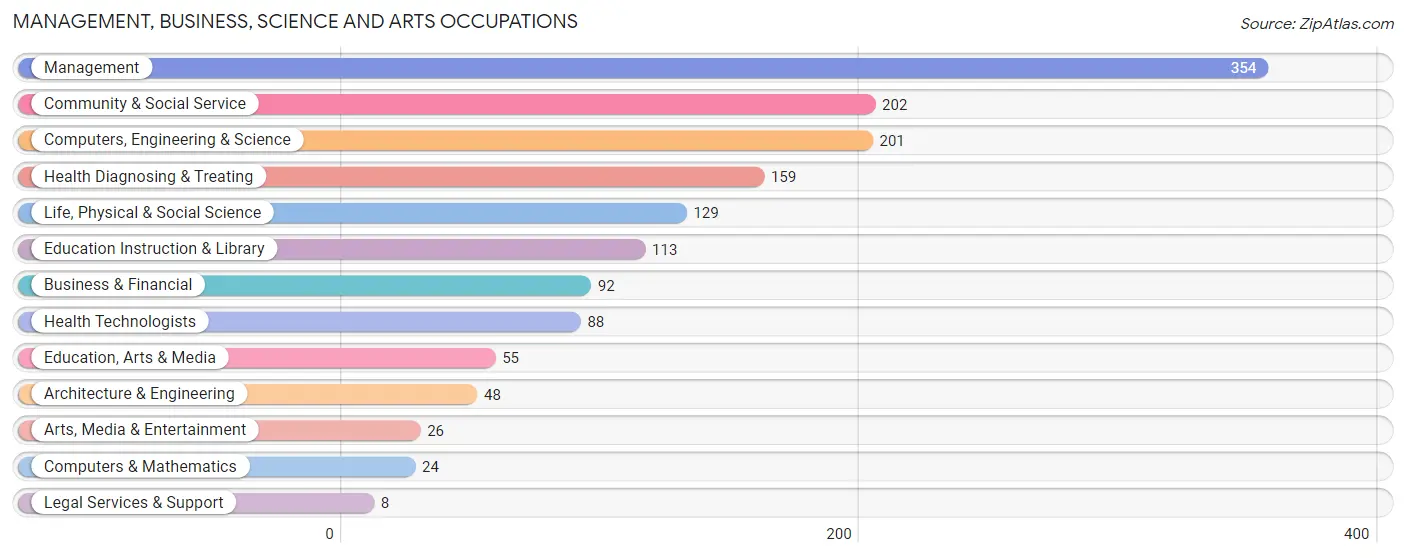
The most common Management, Business, Science and Arts occupations in Benewah County are Management (354 | 9.3%), Community & Social Service (202 | 5.3%), Computers, Engineering & Science (201 | 5.3%), Health Diagnosing & Treating (159 | 4.2%), and Life, Physical & Social Science (129 | 3.4%).
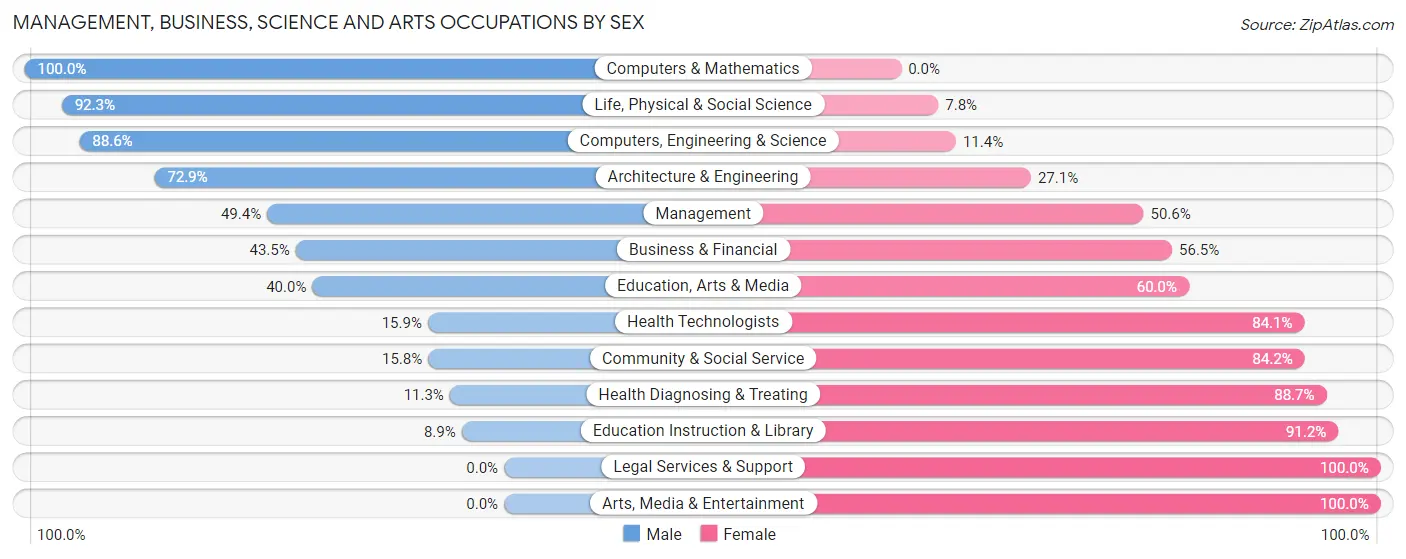
Management, Business, Science and Arts Occupations by Sex
Within the Management, Business, Science and Arts occupations in Benewah County, the most male-oriented occupations are Computers & Mathematics (100.0%), Life, Physical & Social Science (92.2%), and Computers, Engineering & Science (88.6%), while the most female-oriented occupations are Legal Services & Support (100.0%), Arts, Media & Entertainment (100.0%), and Education Instruction & Library (91.1%).
| Occupation | Male | Female |
| Management | 175 (49.4%) | 179 (50.6%) |
| Business & Financial | 40 (43.5%) | 52 (56.5%) |
| Computers, Engineering & Science | 178 (88.6%) | 23 (11.4%) |
| Computers & Mathematics | 24 (100.0%) | 0 (0.0%) |
| Architecture & Engineering | 35 (72.9%) | 13 (27.1%) |
| Life, Physical & Social Science | 119 (92.2%) | 10 (7.7%) |
| Community & Social Service | 32 (15.8%) | 170 (84.2%) |
| Education, Arts & Media | 22 (40.0%) | 33 (60.0%) |
| Legal Services & Support | 0 (0.0%) | 8 (100.0%) |
| Education Instruction & Library | 10 (8.8%) | 103 (91.1%) |
| Arts, Media & Entertainment | 0 (0.0%) | 26 (100.0%) |
| Health Diagnosing & Treating | 18 (11.3%) | 141 (88.7%) |
| Health Technologists | 14 (15.9%) | 74 (84.1%) |
| Total (Category) | 443 (44.0%) | 565 (56.0%) |
| Total (Overall) | 2,153 (56.4%) | 1,662 (43.6%) |
Services Occupations
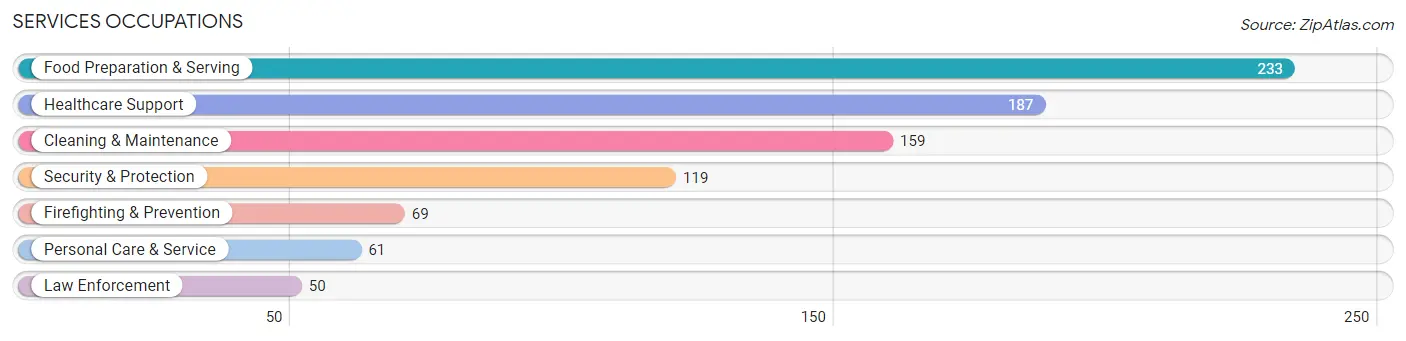
The most common Services occupations in Benewah County are Food Preparation & Serving (233 | 6.1%), Healthcare Support (187 | 4.9%), Cleaning & Maintenance (159 | 4.2%), Security & Protection (119 | 3.1%), and Firefighting & Prevention (69 | 1.8%).
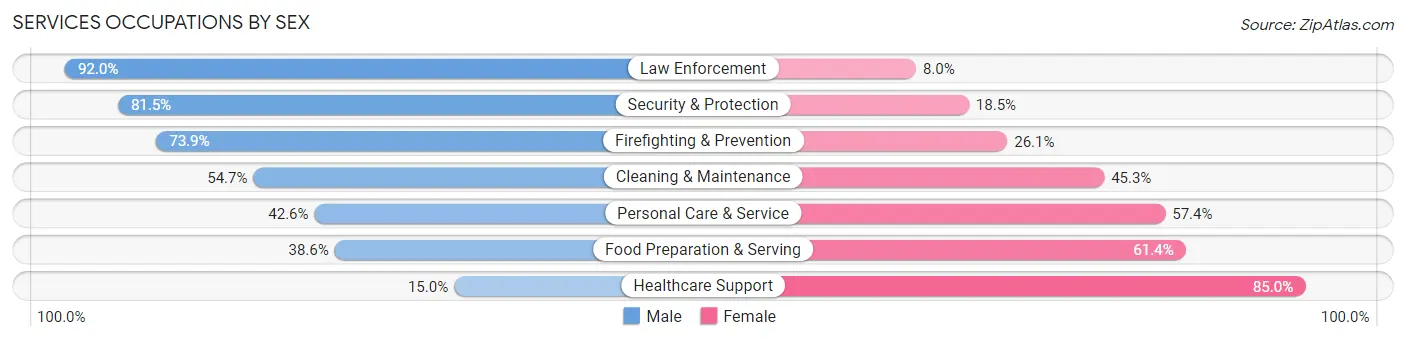
Services Occupations by Sex
Within the Services occupations in Benewah County, the most male-oriented occupations are Law Enforcement (92.0%), Security & Protection (81.5%), and Firefighting & Prevention (73.9%), while the most female-oriented occupations are Healthcare Support (85.0%), Food Preparation & Serving (61.4%), and Personal Care & Service (57.4%).
| Occupation | Male | Female |
| Healthcare Support | 28 (15.0%) | 159 (85.0%) |
| Security & Protection | 97 (81.5%) | 22 (18.5%) |
| Firefighting & Prevention | 51 (73.9%) | 18 (26.1%) |
| Law Enforcement | 46 (92.0%) | 4 (8.0%) |
| Food Preparation & Serving | 90 (38.6%) | 143 (61.4%) |
| Cleaning & Maintenance | 87 (54.7%) | 72 (45.3%) |
| Personal Care & Service | 26 (42.6%) | 35 (57.4%) |
| Total (Category) | 328 (43.2%) | 431 (56.8%) |
| Total (Overall) | 2,153 (56.4%) | 1,662 (43.6%) |
Sales and Office Occupations
The most common Sales and Office occupations in Benewah County are Sales & Related (382 | 10.0%), and Office & Administration (308 | 8.1%).
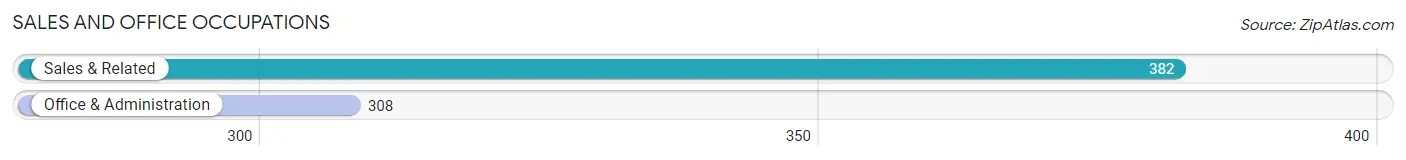
Sales and Office Occupations by Sex
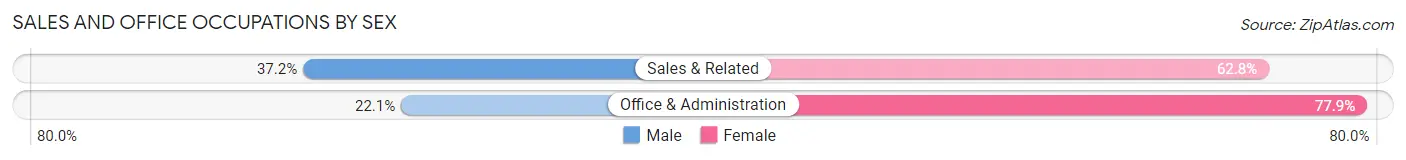
| Occupation | Male | Female |
| Sales & Related | 142 (37.2%) | 240 (62.8%) |
| Office & Administration | 68 (22.1%) | 240 (77.9%) |
| Total (Category) | 210 (30.4%) | 480 (69.6%) |
| Total (Overall) | 2,153 (56.4%) | 1,662 (43.6%) |
Natural Resources, Construction and Maintenance Occupations
The most common Natural Resources, Construction and Maintenance occupations in Benewah County are Construction & Extraction (431 | 11.3%), Installation, Maintenance & Repair (215 | 5.6%), and Farming, Fishing & Forestry (100 | 2.6%).
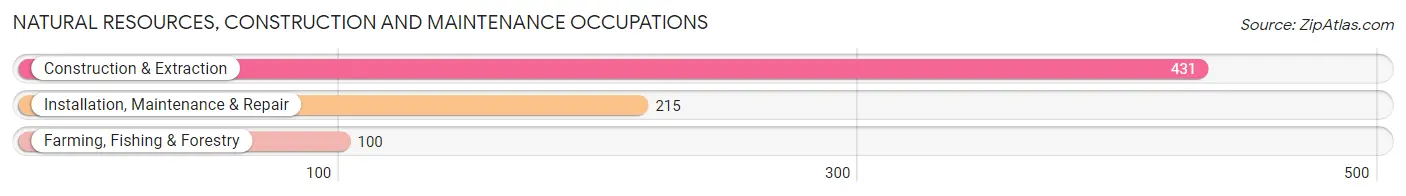
Natural Resources, Construction and Maintenance Occupations by Sex
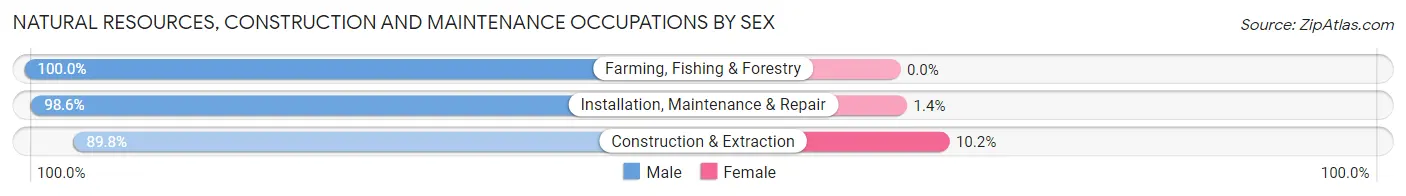
| Occupation | Male | Female |
| Farming, Fishing & Forestry | 100 (100.0%) | 0 (0.0%) |
| Construction & Extraction | 387 (89.8%) | 44 (10.2%) |
| Installation, Maintenance & Repair | 212 (98.6%) | 3 (1.4%) |
| Total (Category) | 699 (93.7%) | 47 (6.3%) |
| Total (Overall) | 2,153 (56.4%) | 1,662 (43.6%) |
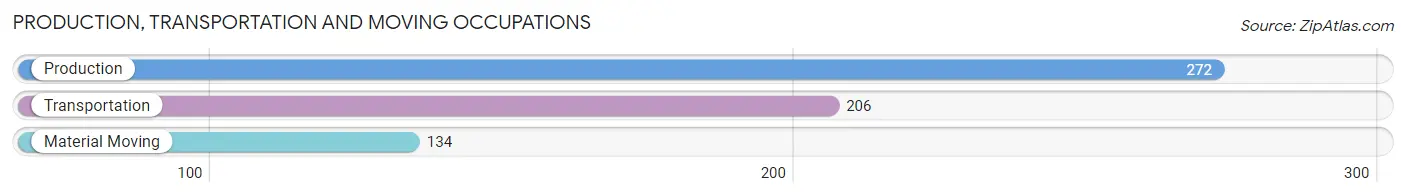
Production, Transportation and Moving Occupations
The most common Production, Transportation and Moving occupations in Benewah County are Production (272 | 7.1%), Transportation (206 | 5.4%), and Material Moving (134 | 3.5%).
Production, Transportation and Moving Occupations by Sex
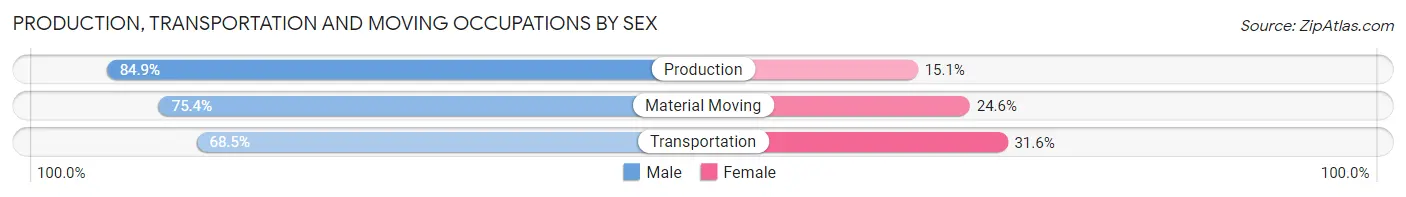
| Occupation | Male | Female |
| Production | 231 (84.9%) | 41 (15.1%) |
| Transportation | 141 (68.4%) | 65 (31.6%) |
| Material Moving | 101 (75.4%) | 33 (24.6%) |
| Total (Category) | 473 (77.3%) | 139 (22.7%) |
| Total (Overall) | 2,153 (56.4%) | 1,662 (43.6%) |
Employment Industries by Sex in Benewah County
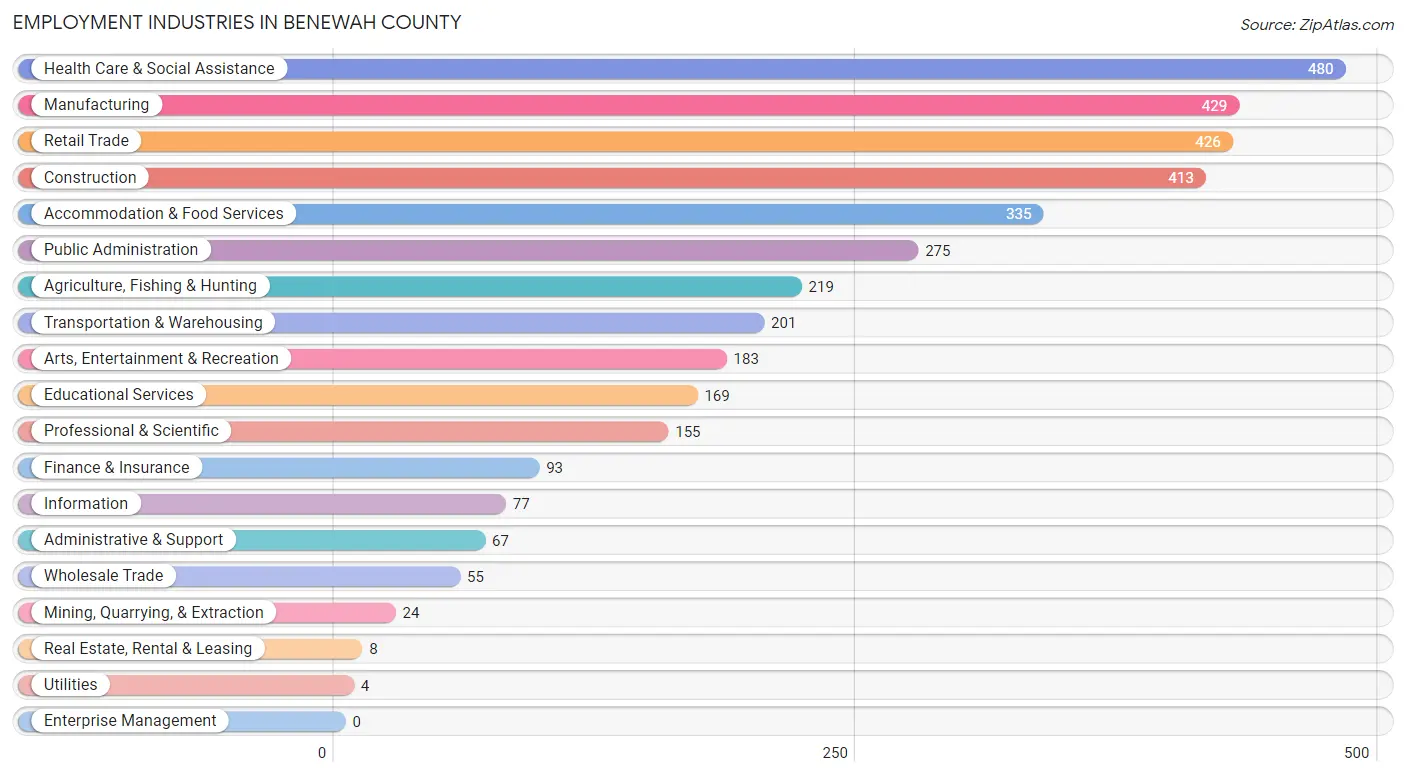
Employment Industries in Benewah County
The major employment industries in Benewah County include Health Care & Social Assistance (480 | 12.6%), Manufacturing (429 | 11.3%), Retail Trade (426 | 11.2%), Construction (413 | 10.8%), and Accommodation & Food Services (335 | 8.8%).
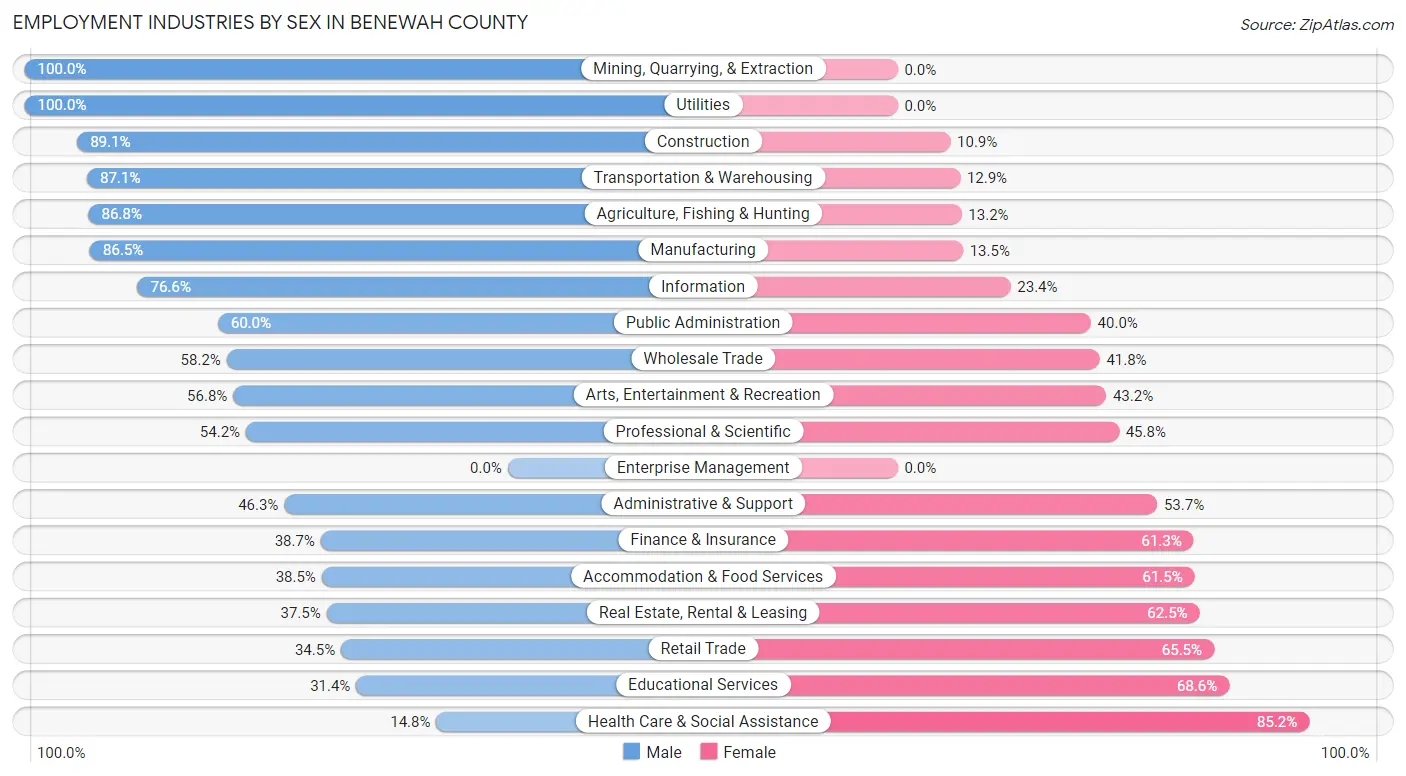
Employment Industries by Sex in Benewah County
The Benewah County industries that see more men than women are Mining, Quarrying, & Extraction (100.0%), Utilities (100.0%), and Construction (89.1%), whereas the industries that tend to have a higher number of women are Health Care & Social Assistance (85.2%), Educational Services (68.6%), and Retail Trade (65.5%).
| Industry | Male | Female |
| Agriculture, Fishing & Hunting | 190 (86.8%) | 29 (13.2%) |
| Mining, Quarrying, & Extraction | 24 (100.0%) | 0 (0.0%) |
| Construction | 368 (89.1%) | 45 (10.9%) |
| Manufacturing | 371 (86.5%) | 58 (13.5%) |
| Wholesale Trade | 32 (58.2%) | 23 (41.8%) |
| Retail Trade | 147 (34.5%) | 279 (65.5%) |
| Transportation & Warehousing | 175 (87.1%) | 26 (12.9%) |
| Utilities | 4 (100.0%) | 0 (0.0%) |
| Information | 59 (76.6%) | 18 (23.4%) |
| Finance & Insurance | 36 (38.7%) | 57 (61.3%) |
| Real Estate, Rental & Leasing | 3 (37.5%) | 5 (62.5%) |
| Professional & Scientific | 84 (54.2%) | 71 (45.8%) |
| Enterprise Management | 0 (0.0%) | 0 (0.0%) |
| Administrative & Support | 31 (46.3%) | 36 (53.7%) |
| Educational Services | 53 (31.4%) | 116 (68.6%) |
| Health Care & Social Assistance | 71 (14.8%) | 409 (85.2%) |
| Arts, Entertainment & Recreation | 104 (56.8%) | 79 (43.2%) |
| Accommodation & Food Services | 129 (38.5%) | 206 (61.5%) |
| Public Administration | 165 (60.0%) | 110 (40.0%) |
| Total | 2,153 (56.4%) | 1,662 (43.6%) |
Education in Benewah County
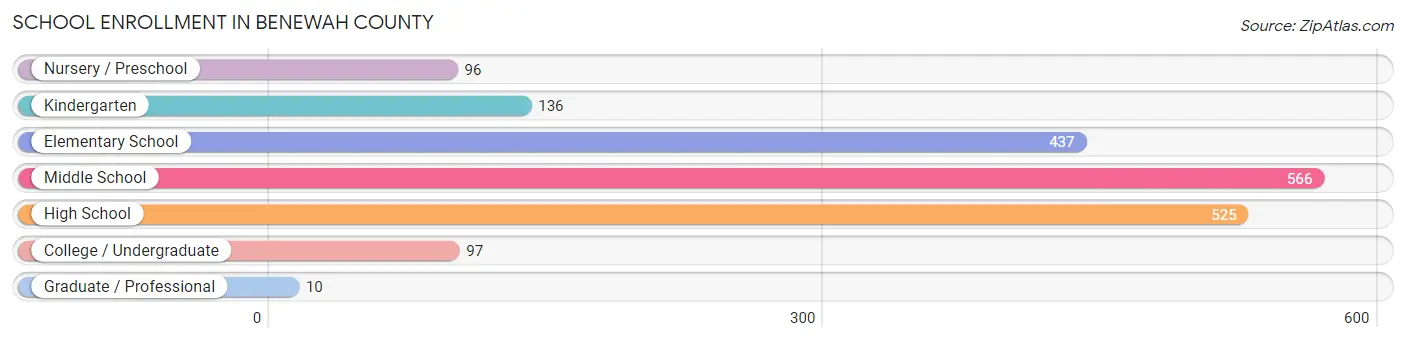
School Enrollment in Benewah County
The most common levels of schooling among the 1,867 students in Benewah County are middle school (566 | 30.3%), high school (525 | 28.1%), and elementary school (437 | 23.4%).
| School Level | # Students | % Students |
| Nursery / Preschool | 96 | 5.1% |
| Kindergarten | 136 | 7.3% |
| Elementary School | 437 | 23.4% |
| Middle School | 566 | 30.3% |
| High School | 525 | 28.1% |
| College / Undergraduate | 97 | 5.2% |
| Graduate / Professional | 10 | 0.5% |
| Total | 1,867 | 100.0% |
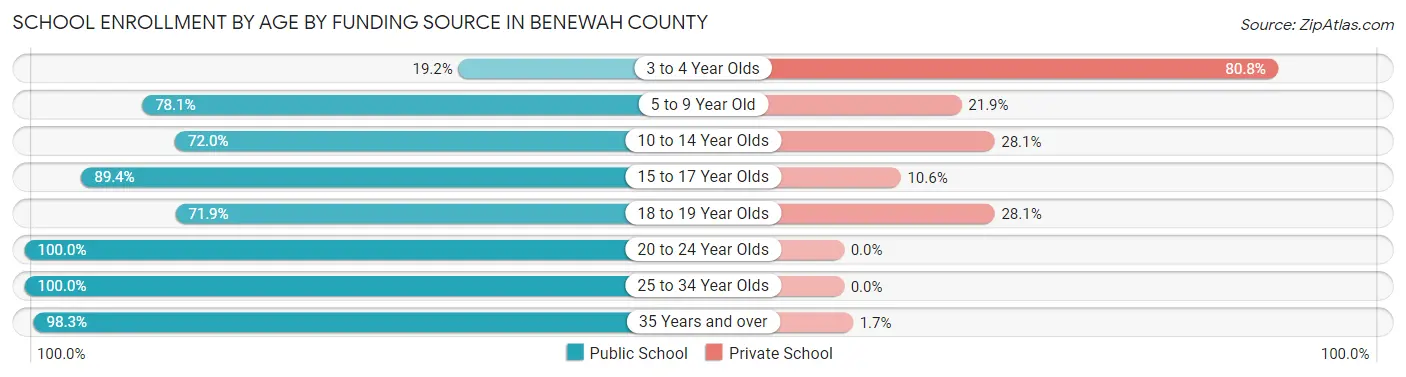
School Enrollment by Age by Funding Source in Benewah County
Out of a total of 1,867 students who are enrolled in schools in Benewah County, 461 (24.7%) attend a private institution, while the remaining 1,406 (75.3%) are enrolled in public schools. The age group of 3 to 4 year olds has the highest likelihood of being enrolled in private schools, with 97 (80.8% in the age bracket) enrolled. Conversely, the age group of 20 to 24 year olds has the lowest likelihood of being enrolled in a private school, with 21 (100.0% in the age bracket) attending a public institution.
| Age Bracket | Public School | Private School |
| 3 to 4 Year Olds | 23 (19.2%) | 97 (80.8%) |
| 5 to 9 Year Old | 406 (78.1%) | 114 (21.9%) |
| 10 to 14 Year Olds | 472 (72.0%) | 184 (28.1%) |
| 15 to 17 Year Olds | 338 (89.4%) | 40 (10.6%) |
| 18 to 19 Year Olds | 64 (71.9%) | 25 (28.1%) |
| 20 to 24 Year Olds | 21 (100.0%) | 0 (0.0%) |
| 25 to 34 Year Olds | 24 (100.0%) | 0 (0.0%) |
| 35 Years and over | 58 (98.3%) | 1 (1.7%) |
| Total | 1,406 (75.3%) | 461 (24.7%) |
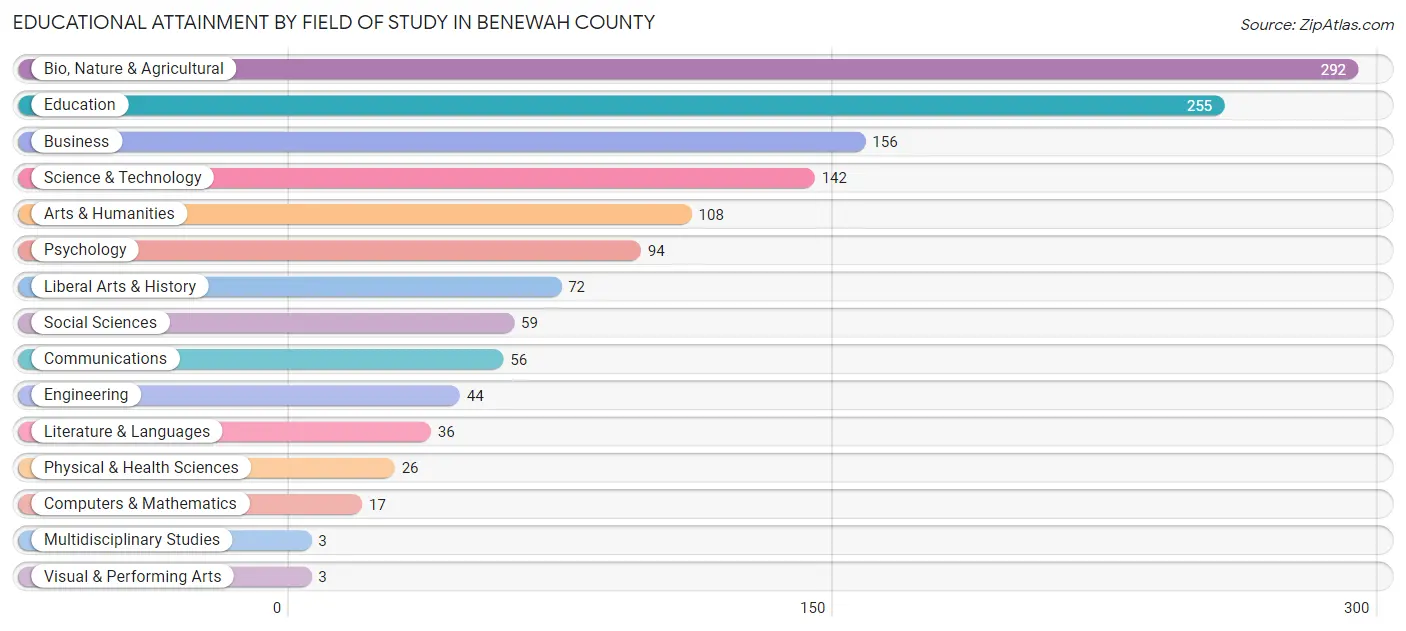
Educational Attainment by Field of Study in Benewah County
Bio, nature & agricultural (292 | 21.4%), education (255 | 18.7%), business (156 | 11.5%), science & technology (142 | 10.4%), and arts & humanities (108 | 7.9%) are the most common fields of study among 1,363 individuals in Benewah County who have obtained a bachelor's degree or higher.
| Field of Study | # Graduates | % Graduates |
| Computers & Mathematics | 17 | 1.3% |
| Bio, Nature & Agricultural | 292 | 21.4% |
| Physical & Health Sciences | 26 | 1.9% |
| Psychology | 94 | 6.9% |
| Social Sciences | 59 | 4.3% |
| Engineering | 44 | 3.2% |
| Multidisciplinary Studies | 3 | 0.2% |
| Science & Technology | 142 | 10.4% |
| Business | 156 | 11.5% |
| Education | 255 | 18.7% |
| Literature & Languages | 36 | 2.6% |
| Liberal Arts & History | 72 | 5.3% |
| Visual & Performing Arts | 3 | 0.2% |
| Communications | 56 | 4.1% |
| Arts & Humanities | 108 | 7.9% |
| Total | 1,363 | 100.0% |
Transportation & Commute in Benewah County
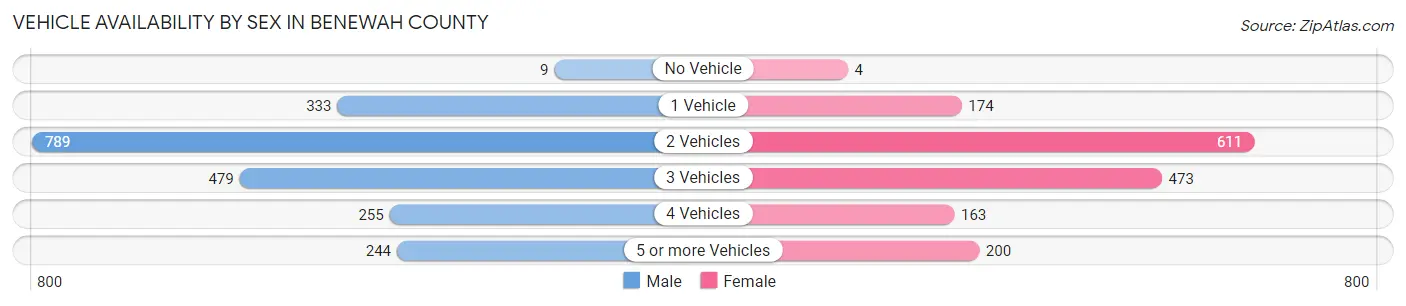
Vehicle Availability by Sex in Benewah County
The most prevalent vehicle ownership categories in Benewah County are males with 2 vehicles (789, accounting for 37.4%) and females with 2 vehicles (611, making up 48.5%).
| Vehicles Available | Male | Female |
| No Vehicle | 9 (0.4%) | 4 (0.3%) |
| 1 Vehicle | 333 (15.8%) | 174 (10.7%) |
| 2 Vehicles | 789 (37.4%) | 611 (37.6%) |
| 3 Vehicles | 479 (22.7%) | 473 (29.1%) |
| 4 Vehicles | 255 (12.1%) | 163 (10.0%) |
| 5 or more Vehicles | 244 (11.6%) | 200 (12.3%) |
| Total | 2,109 (100.0%) | 1,625 (100.0%) |
Commute Time in Benewah County
The most frequently occuring commute durations in Benewah County are 5 to 9 minutes (822 commuters, 23.7%), 15 to 19 minutes (440 commuters, 12.7%), and 10 to 14 minutes (401 commuters, 11.6%).
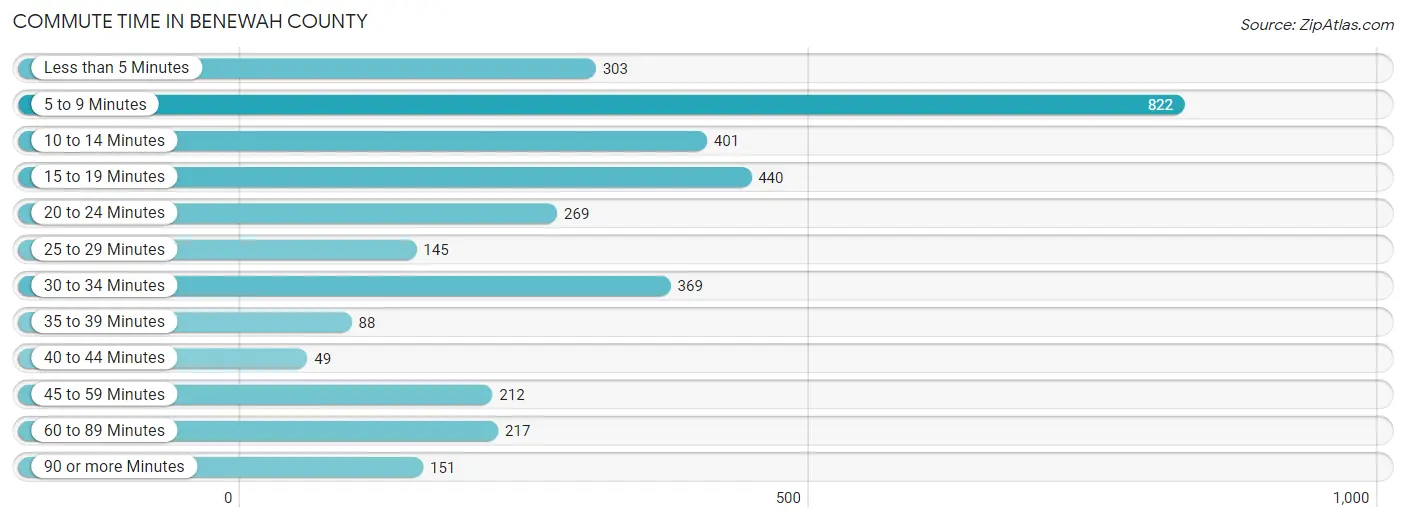
| Commute Time | # Commuters | % Commuters |
| Less than 5 Minutes | 303 | 8.7% |
| 5 to 9 Minutes | 822 | 23.7% |
| 10 to 14 Minutes | 401 | 11.6% |
| 15 to 19 Minutes | 440 | 12.7% |
| 20 to 24 Minutes | 269 | 7.8% |
| 25 to 29 Minutes | 145 | 4.2% |
| 30 to 34 Minutes | 369 | 10.6% |
| 35 to 39 Minutes | 88 | 2.5% |
| 40 to 44 Minutes | 49 | 1.4% |
| 45 to 59 Minutes | 212 | 6.1% |
| 60 to 89 Minutes | 217 | 6.3% |
| 90 or more Minutes | 151 | 4.4% |
Commute Time by Sex in Benewah County
The most common commute times in Benewah County are 5 to 9 minutes (305 commuters, 15.6%) for males and 5 to 9 minutes (517 commuters, 34.1%) for females.
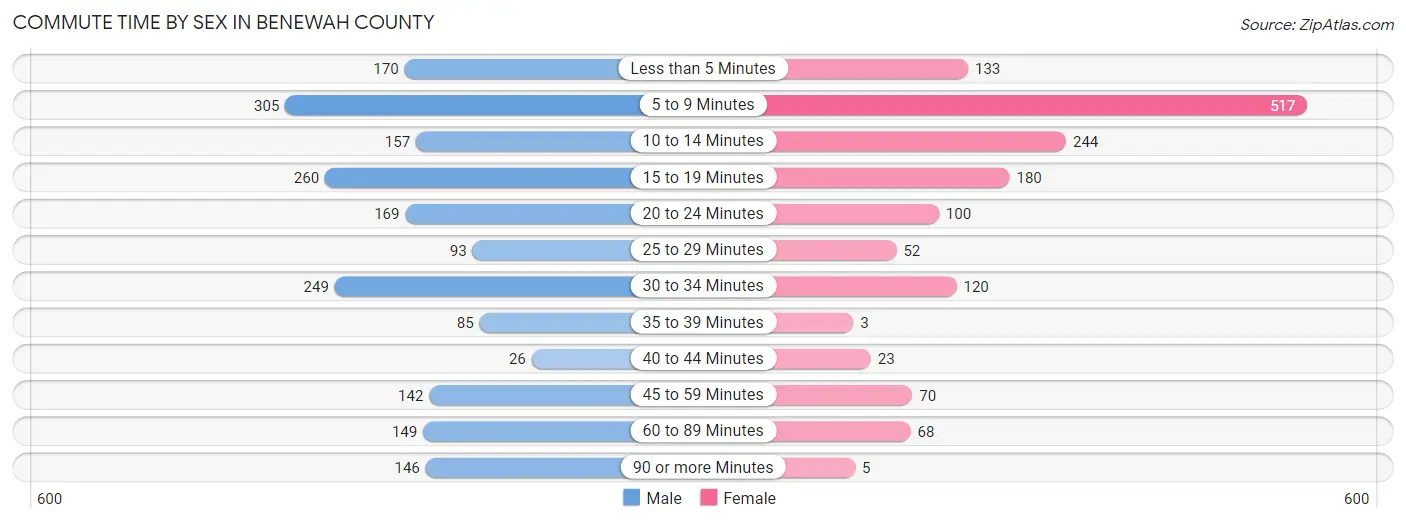
| Commute Time | Male | Female |
| Less than 5 Minutes | 170 (8.7%) | 133 (8.8%) |
| 5 to 9 Minutes | 305 (15.6%) | 517 (34.1%) |
| 10 to 14 Minutes | 157 (8.1%) | 244 (16.1%) |
| 15 to 19 Minutes | 260 (13.3%) | 180 (11.9%) |
| 20 to 24 Minutes | 169 (8.7%) | 100 (6.6%) |
| 25 to 29 Minutes | 93 (4.8%) | 52 (3.4%) |
| 30 to 34 Minutes | 249 (12.8%) | 120 (7.9%) |
| 35 to 39 Minutes | 85 (4.4%) | 3 (0.2%) |
| 40 to 44 Minutes | 26 (1.3%) | 23 (1.5%) |
| 45 to 59 Minutes | 142 (7.3%) | 70 (4.6%) |
| 60 to 89 Minutes | 149 (7.6%) | 68 (4.5%) |
| 90 or more Minutes | 146 (7.5%) | 5 (0.3%) |
Time of Departure to Work by Sex in Benewah County
The most frequent times of departure to work in Benewah County are 12:00 AM to 4:59 AM (454, 23.3%) for males and 7:00 AM to 7:29 AM (281, 18.5%) for females.
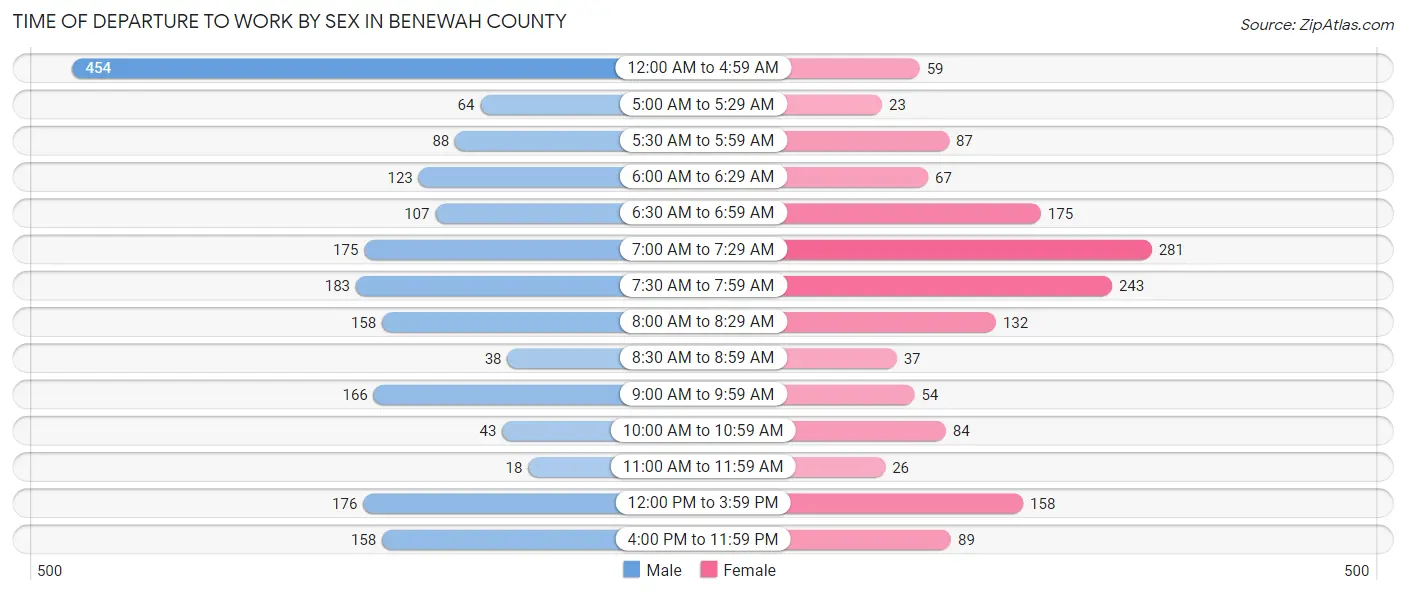
| Time of Departure | Male | Female |
| 12:00 AM to 4:59 AM | 454 (23.3%) | 59 (3.9%) |
| 5:00 AM to 5:29 AM | 64 (3.3%) | 23 (1.5%) |
| 5:30 AM to 5:59 AM | 88 (4.5%) | 87 (5.7%) |
| 6:00 AM to 6:29 AM | 123 (6.3%) | 67 (4.4%) |
| 6:30 AM to 6:59 AM | 107 (5.5%) | 175 (11.6%) |
| 7:00 AM to 7:29 AM | 175 (9.0%) | 281 (18.5%) |
| 7:30 AM to 7:59 AM | 183 (9.4%) | 243 (16.0%) |
| 8:00 AM to 8:29 AM | 158 (8.1%) | 132 (8.7%) |
| 8:30 AM to 8:59 AM | 38 (1.9%) | 37 (2.4%) |
| 9:00 AM to 9:59 AM | 166 (8.5%) | 54 (3.6%) |
| 10:00 AM to 10:59 AM | 43 (2.2%) | 84 (5.5%) |
| 11:00 AM to 11:59 AM | 18 (0.9%) | 26 (1.7%) |
| 12:00 PM to 3:59 PM | 176 (9.0%) | 158 (10.4%) |
| 4:00 PM to 11:59 PM | 158 (8.1%) | 89 (5.9%) |
| Total | 1,951 (100.0%) | 1,515 (100.0%) |
Housing Occupancy in Benewah County
Occupancy by Ownership in Benewah County
Of the total 3,826 dwellings in Benewah County, owner-occupied units account for 2,818 (73.7%), while renter-occupied units make up 1,008 (26.4%).
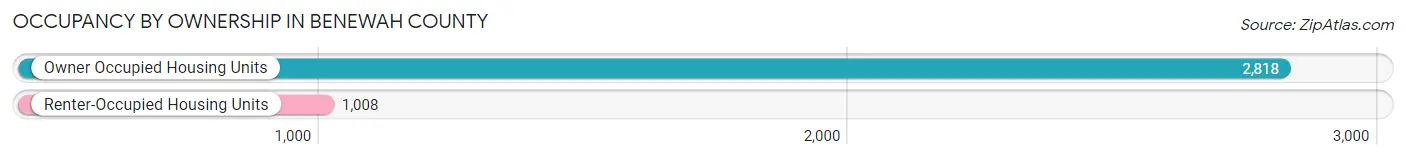
| Occupancy | # Housing Units | % Housing Units |
| Owner Occupied Housing Units | 2,818 | 73.7% |
| Renter-Occupied Housing Units | 1,008 | 26.4% |
| Total Occupied Housing Units | 3,826 | 100.0% |
Occupancy by Household Size in Benewah County
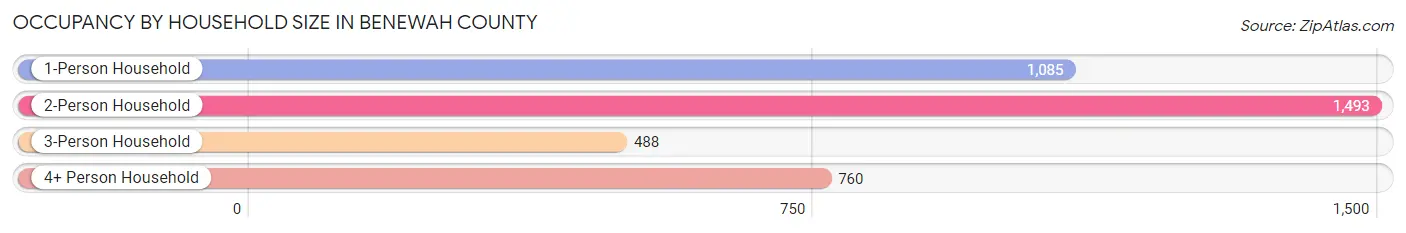
| Household Size | # Housing Units | % Housing Units |
| 1-Person Household | 1,085 | 28.4% |
| 2-Person Household | 1,493 | 39.0% |
| 3-Person Household | 488 | 12.8% |
| 4+ Person Household | 760 | 19.9% |
| Total Housing Units | 3,826 | 100.0% |
Occupancy by Ownership by Household Size in Benewah County
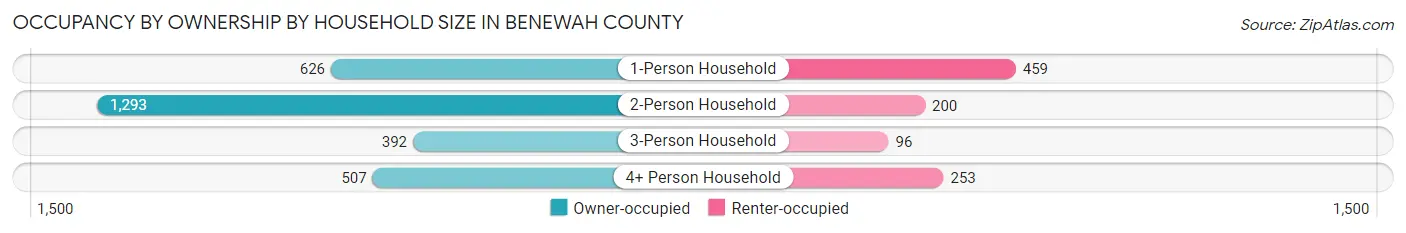
| Household Size | Owner-occupied | Renter-occupied |
| 1-Person Household | 626 (57.7%) | 459 (42.3%) |
| 2-Person Household | 1,293 (86.6%) | 200 (13.4%) |
| 3-Person Household | 392 (80.3%) | 96 (19.7%) |
| 4+ Person Household | 507 (66.7%) | 253 (33.3%) |
| Total Housing Units | 2,818 (73.7%) | 1,008 (26.4%) |
Occupancy by Educational Attainment in Benewah County
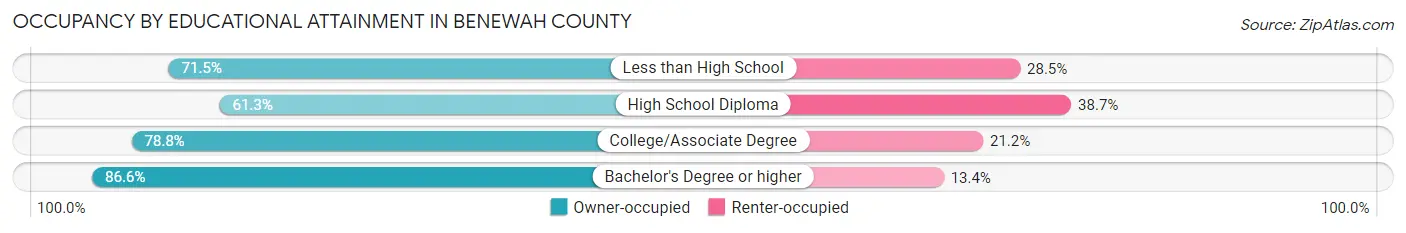
| Household Size | Owner-occupied | Renter-occupied |
| Less than High School | 358 (71.5%) | 143 (28.5%) |
| High School Diploma | 768 (61.3%) | 484 (38.7%) |
| College/Associate Degree | 1,045 (78.8%) | 281 (21.2%) |
| Bachelor's Degree or higher | 647 (86.6%) | 100 (13.4%) |
Occupancy by Age of Householder in Benewah County
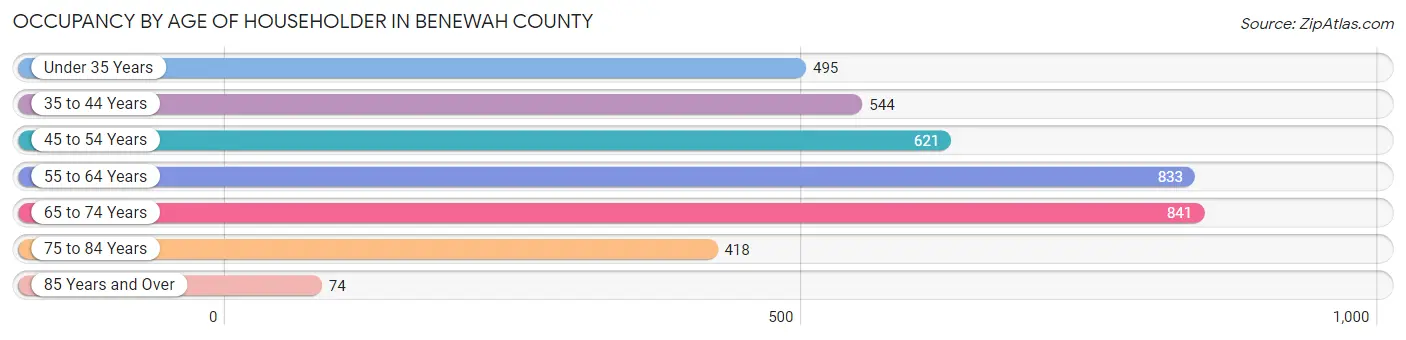
| Age Bracket | # Households | % Households |
| Under 35 Years | 495 | 12.9% |
| 35 to 44 Years | 544 | 14.2% |
| 45 to 54 Years | 621 | 16.2% |
| 55 to 64 Years | 833 | 21.8% |
| 65 to 74 Years | 841 | 22.0% |
| 75 to 84 Years | 418 | 10.9% |
| 85 Years and Over | 74 | 1.9% |
| Total | 3,826 | 100.0% |
Housing Finances in Benewah County
Median Income by Occupancy in Benewah County
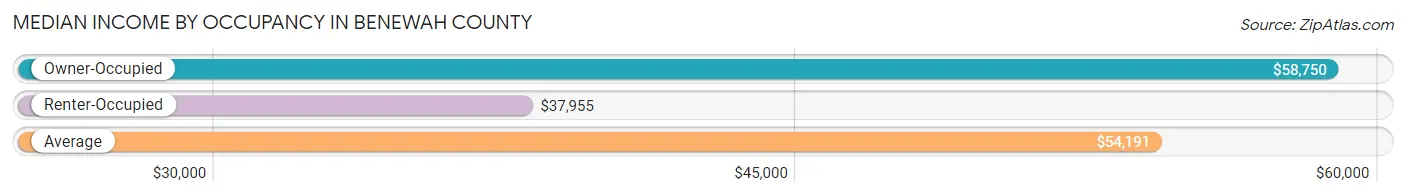
| Occupancy Type | # Households | Median Income |
| Owner-Occupied | 2,818 (73.7%) | $58,750 |
| Renter-Occupied | 1,008 (26.4%) | $37,955 |
| Average | 3,826 (100.0%) | $54,191 |
Occupancy by Householder Income Bracket in Benewah County
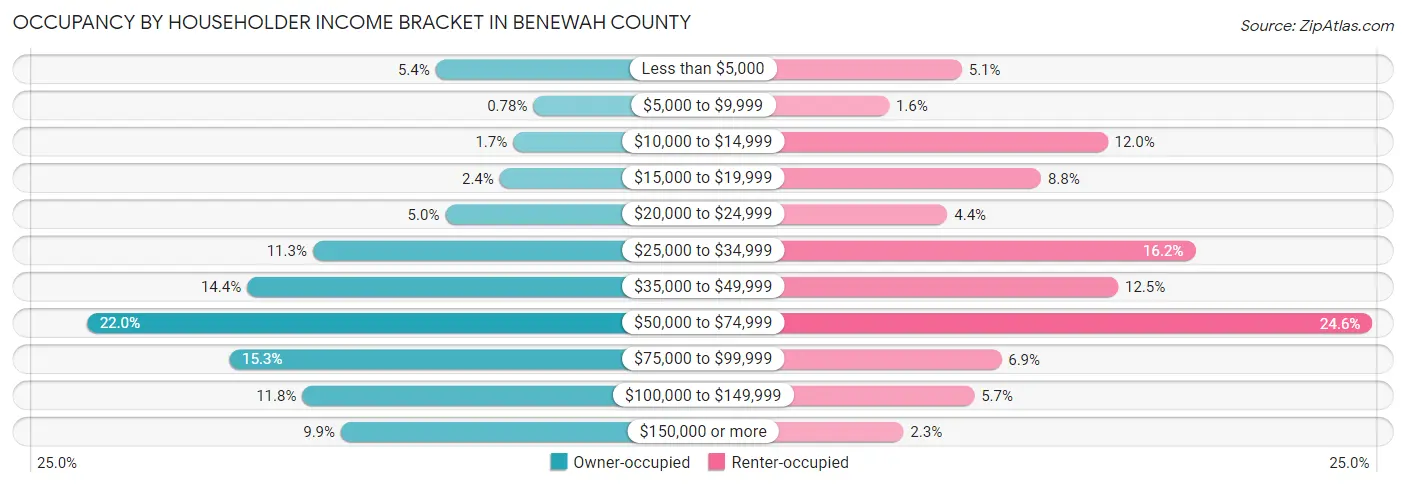
| Income Bracket | Owner-occupied | Renter-occupied |
| Less than $5,000 | 153 (5.4%) | 51 (5.1%) |
| $5,000 to $9,999 | 22 (0.8%) | 16 (1.6%) |
| $10,000 to $14,999 | 49 (1.7%) | 121 (12.0%) |
| $15,000 to $19,999 | 67 (2.4%) | 89 (8.8%) |
| $20,000 to $24,999 | 140 (5.0%) | 44 (4.4%) |
| $25,000 to $34,999 | 318 (11.3%) | 163 (16.2%) |
| $35,000 to $49,999 | 406 (14.4%) | 126 (12.5%) |
| $50,000 to $74,999 | 621 (22.0%) | 248 (24.6%) |
| $75,000 to $99,999 | 430 (15.3%) | 70 (6.9%) |
| $100,000 to $149,999 | 332 (11.8%) | 57 (5.7%) |
| $150,000 or more | 280 (9.9%) | 23 (2.3%) |
| Total | 2,818 (100.0%) | 1,008 (100.0%) |
Monthly Housing Cost Tiers in Benewah County
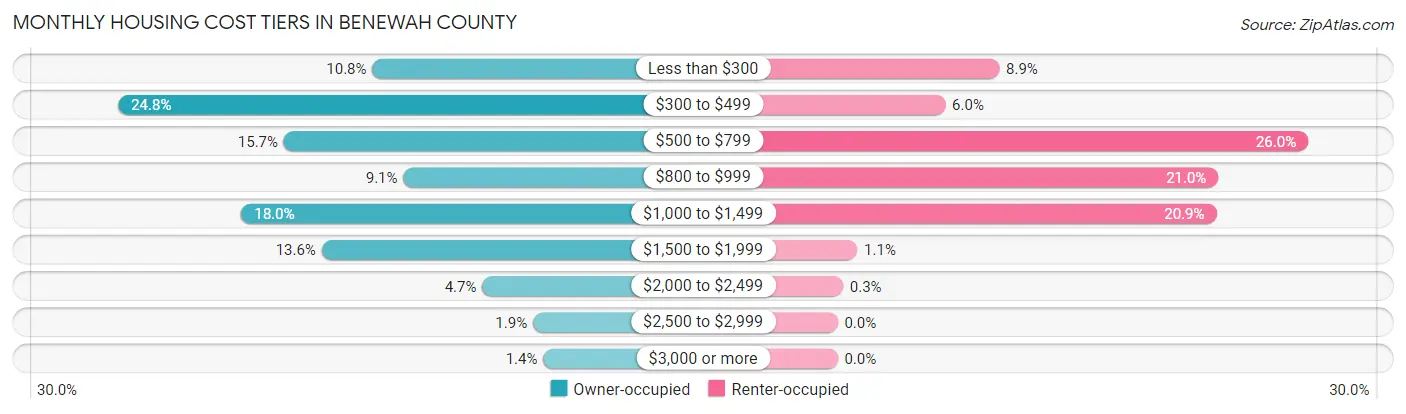
| Monthly Cost | Owner-occupied | Renter-occupied |
| Less than $300 | 304 (10.8%) | 90 (8.9%) |
| $300 to $499 | 700 (24.8%) | 60 (5.9%) |
| $500 to $799 | 442 (15.7%) | 262 (26.0%) |
| $800 to $999 | 256 (9.1%) | 212 (21.0%) |
| $1,000 to $1,499 | 508 (18.0%) | 211 (20.9%) |
| $1,500 to $1,999 | 383 (13.6%) | 11 (1.1%) |
| $2,000 to $2,499 | 133 (4.7%) | 3 (0.3%) |
| $2,500 to $2,999 | 54 (1.9%) | 0 (0.0%) |
| $3,000 or more | 38 (1.3%) | 0 (0.0%) |
| Total | 2,818 (100.0%) | 1,008 (100.0%) |
Physical Housing Characteristics in Benewah County
Housing Structures in Benewah County
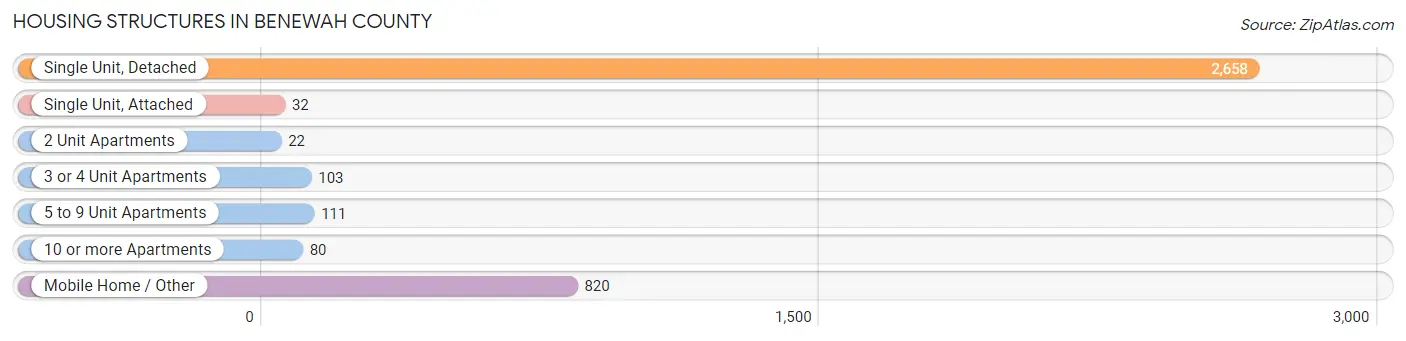
| Structure Type | # Housing Units | % Housing Units |
| Single Unit, Detached | 2,658 | 69.5% |
| Single Unit, Attached | 32 | 0.8% |
| 2 Unit Apartments | 22 | 0.6% |
| 3 or 4 Unit Apartments | 103 | 2.7% |
| 5 to 9 Unit Apartments | 111 | 2.9% |
| 10 or more Apartments | 80 | 2.1% |
| Mobile Home / Other | 820 | 21.4% |
| Total | 3,826 | 100.0% |
Housing Structures by Occupancy in Benewah County
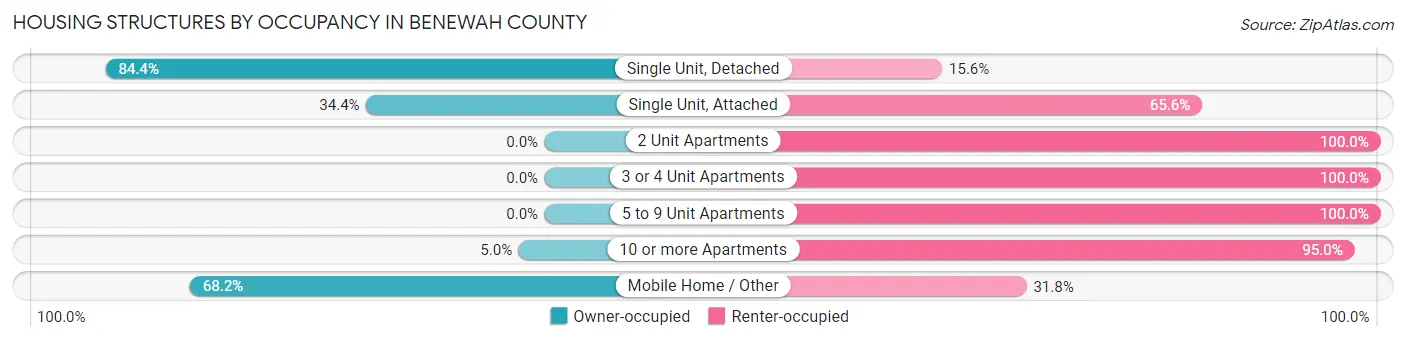
| Structure Type | Owner-occupied | Renter-occupied |
| Single Unit, Detached | 2,244 (84.4%) | 414 (15.6%) |
| Single Unit, Attached | 11 (34.4%) | 21 (65.6%) |
| 2 Unit Apartments | 0 (0.0%) | 22 (100.0%) |
| 3 or 4 Unit Apartments | 0 (0.0%) | 103 (100.0%) |
| 5 to 9 Unit Apartments | 0 (0.0%) | 111 (100.0%) |
| 10 or more Apartments | 4 (5.0%) | 76 (95.0%) |
| Mobile Home / Other | 559 (68.2%) | 261 (31.8%) |
| Total | 2,818 (73.7%) | 1,008 (26.4%) |
Housing Structures by Number of Rooms in Benewah County
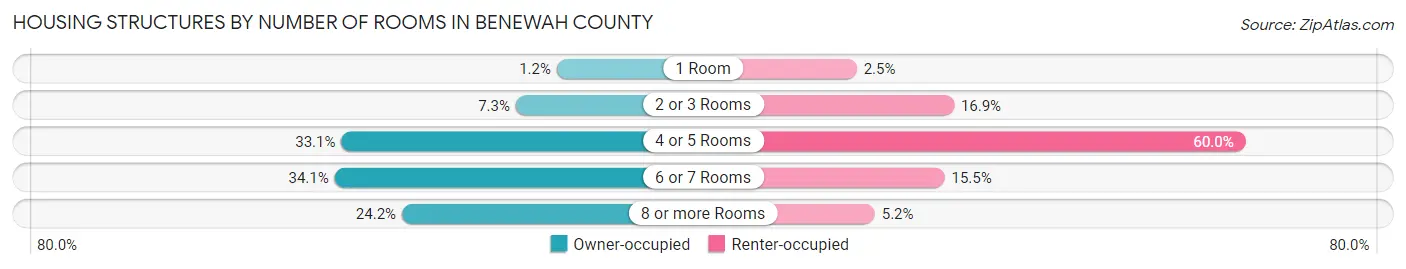
| Number of Rooms | Owner-occupied | Renter-occupied |
| 1 Room | 35 (1.2%) | 25 (2.5%) |
| 2 or 3 Rooms | 206 (7.3%) | 170 (16.9%) |
| 4 or 5 Rooms | 934 (33.1%) | 605 (60.0%) |
| 6 or 7 Rooms | 962 (34.1%) | 156 (15.5%) |
| 8 or more Rooms | 681 (24.2%) | 52 (5.2%) |
| Total | 2,818 (100.0%) | 1,008 (100.0%) |
Housing Structure by Heating Type in Benewah County
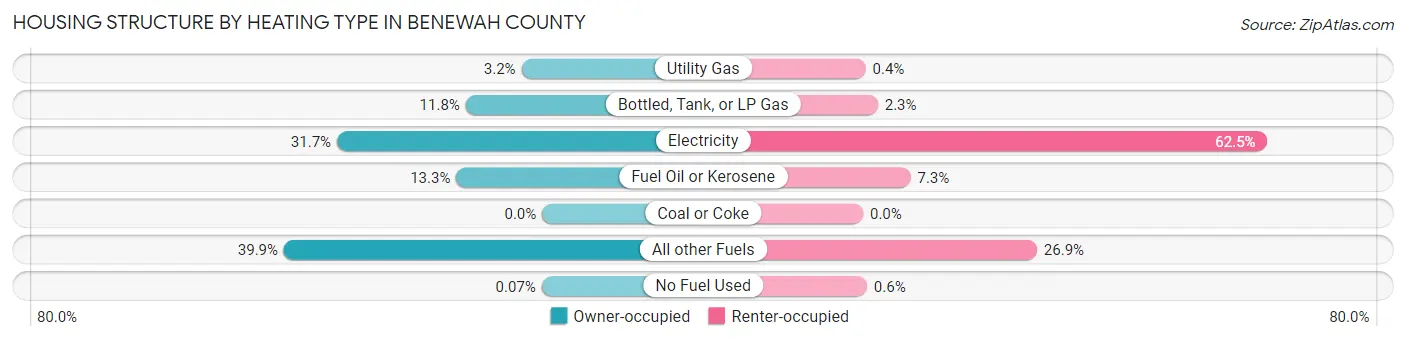
| Heating Type | Owner-occupied | Renter-occupied |
| Utility Gas | 90 (3.2%) | 4 (0.4%) |
| Bottled, Tank, or LP Gas | 333 (11.8%) | 23 (2.3%) |
| Electricity | 894 (31.7%) | 630 (62.5%) |
| Fuel Oil or Kerosene | 374 (13.3%) | 74 (7.3%) |
| Coal or Coke | 0 (0.0%) | 0 (0.0%) |
| All other Fuels | 1,125 (39.9%) | 271 (26.9%) |
| No Fuel Used | 2 (0.1%) | 6 (0.6%) |
| Total | 2,818 (100.0%) | 1,008 (100.0%) |
Household Vehicle Usage in Benewah County
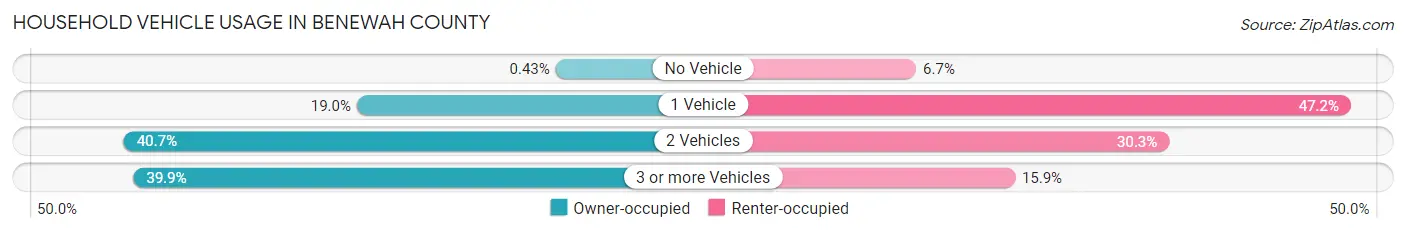
| Vehicles per Household | Owner-occupied | Renter-occupied |
| No Vehicle | 12 (0.4%) | 67 (6.7%) |
| 1 Vehicle | 535 (19.0%) | 476 (47.2%) |
| 2 Vehicles | 1,148 (40.7%) | 305 (30.3%) |
| 3 or more Vehicles | 1,123 (39.9%) | 160 (15.9%) |
| Total | 2,818 (100.0%) | 1,008 (100.0%) |
Real Estate & Mortgages in Benewah County
Real Estate and Mortgage Overview in Benewah County
| Characteristic | Without Mortgage | With Mortgage |
| Housing Units | 1,339 | 1,479 |
| Median Property Value | $221,800 | $256,700 |
| Median Household Income | $47,974 | $170 |
| Monthly Housing Costs | $381 | $38 |
| Real Estate Taxes | $1,263 | $39 |
Property Value by Mortgage Status in Benewah County
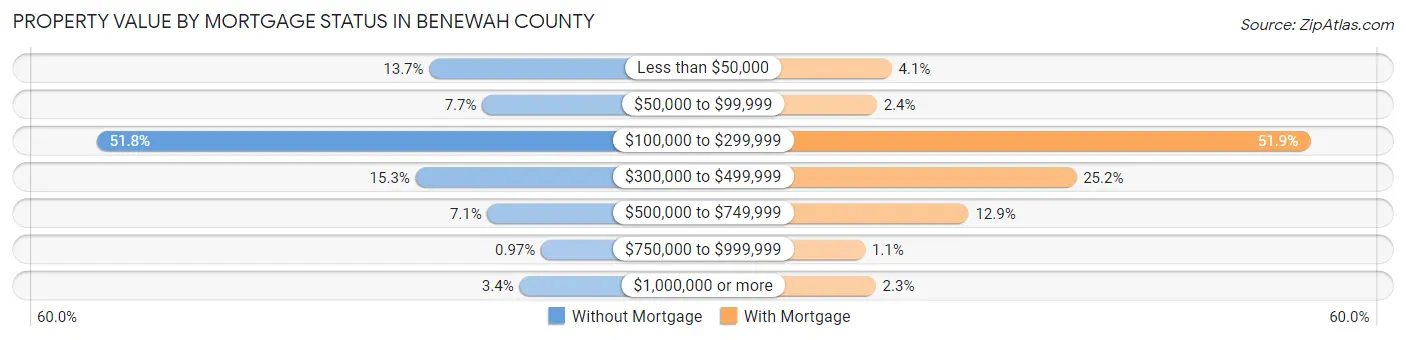
| Property Value | Without Mortgage | With Mortgage |
| Less than $50,000 | 184 (13.7%) | 61 (4.1%) |
| $50,000 to $99,999 | 103 (7.7%) | 36 (2.4%) |
| $100,000 to $299,999 | 693 (51.8%) | 768 (51.9%) |
| $300,000 to $499,999 | 205 (15.3%) | 373 (25.2%) |
| $500,000 to $749,999 | 95 (7.1%) | 191 (12.9%) |
| $750,000 to $999,999 | 13 (1.0%) | 16 (1.1%) |
| $1,000,000 or more | 46 (3.4%) | 34 (2.3%) |
| Total | 1,339 (100.0%) | 1,479 (100.0%) |
Household Income by Mortgage Status in Benewah County
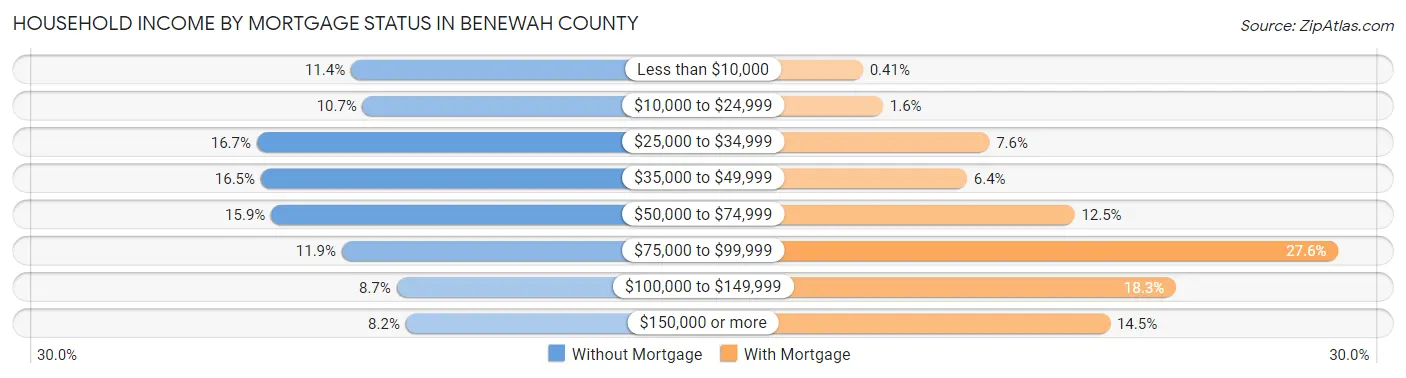
| Household Income | Without Mortgage | With Mortgage |
| Less than $10,000 | 152 (11.4%) | 6 (0.4%) |
| $10,000 to $24,999 | 143 (10.7%) | 23 (1.6%) |
| $25,000 to $34,999 | 224 (16.7%) | 113 (7.6%) |
| $35,000 to $49,999 | 221 (16.5%) | 94 (6.4%) |
| $50,000 to $74,999 | 213 (15.9%) | 185 (12.5%) |
| $75,000 to $99,999 | 159 (11.9%) | 408 (27.6%) |
| $100,000 to $149,999 | 117 (8.7%) | 271 (18.3%) |
| $150,000 or more | 110 (8.2%) | 215 (14.5%) |
| Total | 1,339 (100.0%) | 1,479 (100.0%) |
Property Value to Household Income Ratio in Benewah County
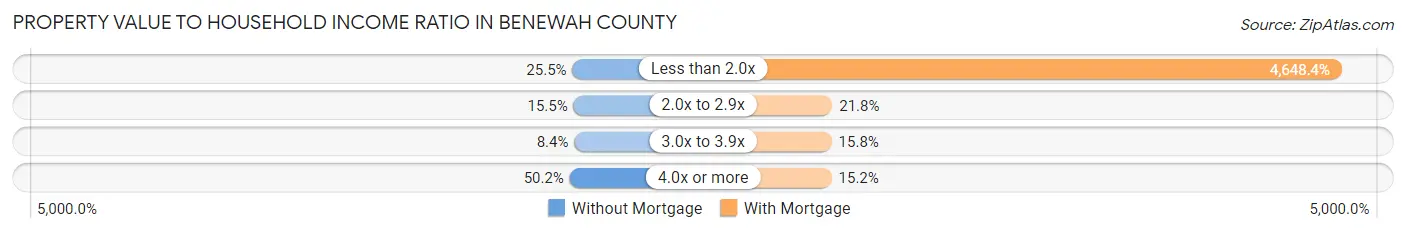
| Value-to-Income Ratio | Without Mortgage | With Mortgage |
| Less than 2.0x | 342 (25.5%) | 68,750 (4,648.4%) |
| 2.0x to 2.9x | 207 (15.5%) | 323 (21.8%) |
| 3.0x to 3.9x | 113 (8.4%) | 234 (15.8%) |
| 4.0x or more | 672 (50.2%) | 225 (15.2%) |
| Total | 1,339 (100.0%) | 1,479 (100.0%) |
Real Estate Taxes by Mortgage Status in Benewah County
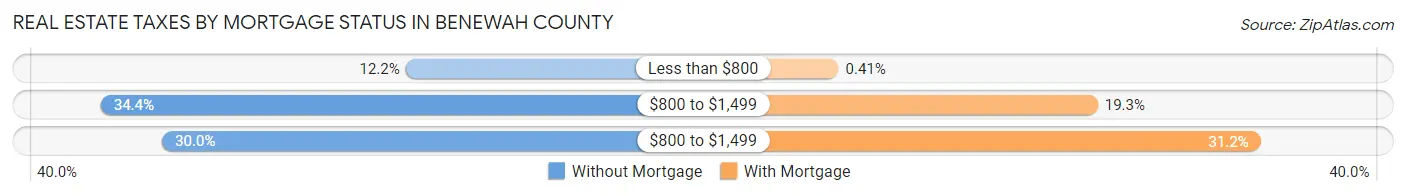
| Property Taxes | Without Mortgage | With Mortgage |
| Less than $800 | 163 (12.2%) | 6 (0.4%) |
| $800 to $1,499 | 461 (34.4%) | 286 (19.3%) |
| $800 to $1,499 | 401 (29.9%) | 462 (31.2%) |
| Total | 1,339 (100.0%) | 1,479 (100.0%) |
Health & Disability in Benewah County
Health Insurance Coverage by Age in Benewah County
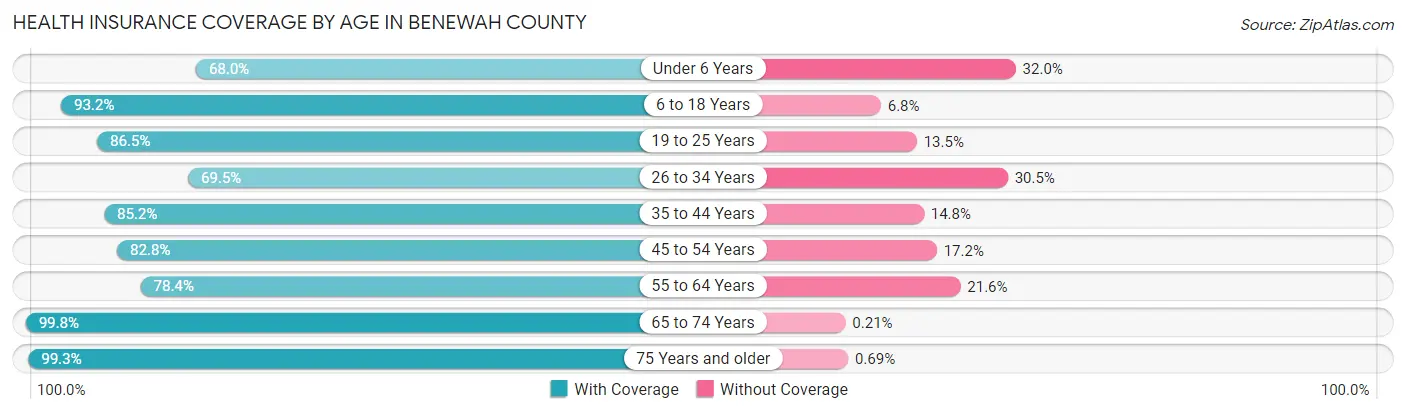
| Age Bracket | With Coverage | Without Coverage |
| Under 6 Years | 413 (68.0%) | 194 (32.0%) |
| 6 to 18 Years | 1,547 (93.2%) | 113 (6.8%) |
| 19 to 25 Years | 589 (86.5%) | 92 (13.5%) |
| 26 to 34 Years | 566 (69.5%) | 248 (30.5%) |
| 35 to 44 Years | 839 (85.2%) | 146 (14.8%) |
| 45 to 54 Years | 931 (82.8%) | 194 (17.2%) |
| 55 to 64 Years | 1,246 (78.4%) | 344 (21.6%) |
| 65 to 74 Years | 1,430 (99.8%) | 3 (0.2%) |
| 75 Years and older | 718 (99.3%) | 5 (0.7%) |
| Total | 8,279 (86.1%) | 1,339 (13.9%) |
Health Insurance Coverage by Citizenship Status in Benewah County
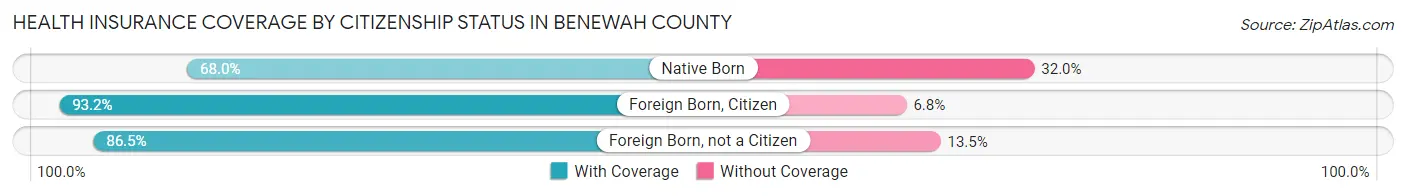
| Citizenship Status | With Coverage | Without Coverage |
| Native Born | 413 (68.0%) | 194 (32.0%) |
| Foreign Born, Citizen | 1,547 (93.2%) | 113 (6.8%) |
| Foreign Born, not a Citizen | 589 (86.5%) | 92 (13.5%) |
Health Insurance Coverage by Household Income in Benewah County
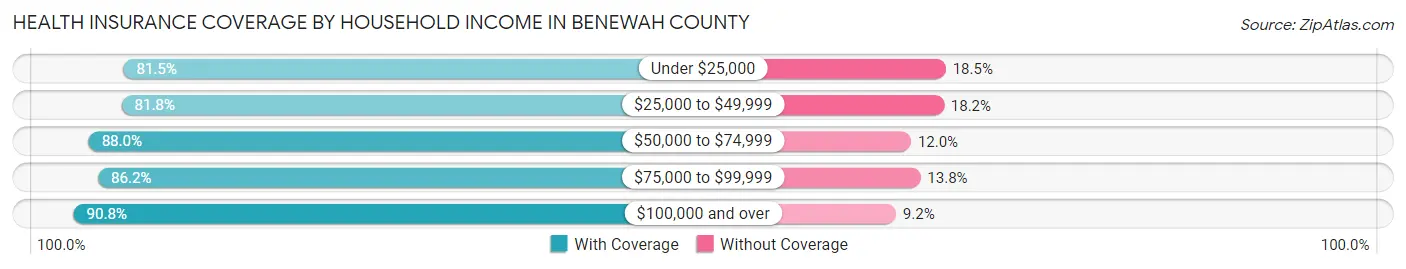
| Household Income | With Coverage | Without Coverage |
| Under $25,000 | 1,028 (81.5%) | 234 (18.5%) |
| $25,000 to $49,999 | 1,899 (81.8%) | 422 (18.2%) |
| $50,000 to $74,999 | 1,962 (88.0%) | 268 (12.0%) |
| $75,000 to $99,999 | 1,219 (86.2%) | 195 (13.8%) |
| $100,000 and over | 2,171 (90.8%) | 220 (9.2%) |
Public vs Private Health Insurance Coverage by Age in Benewah County
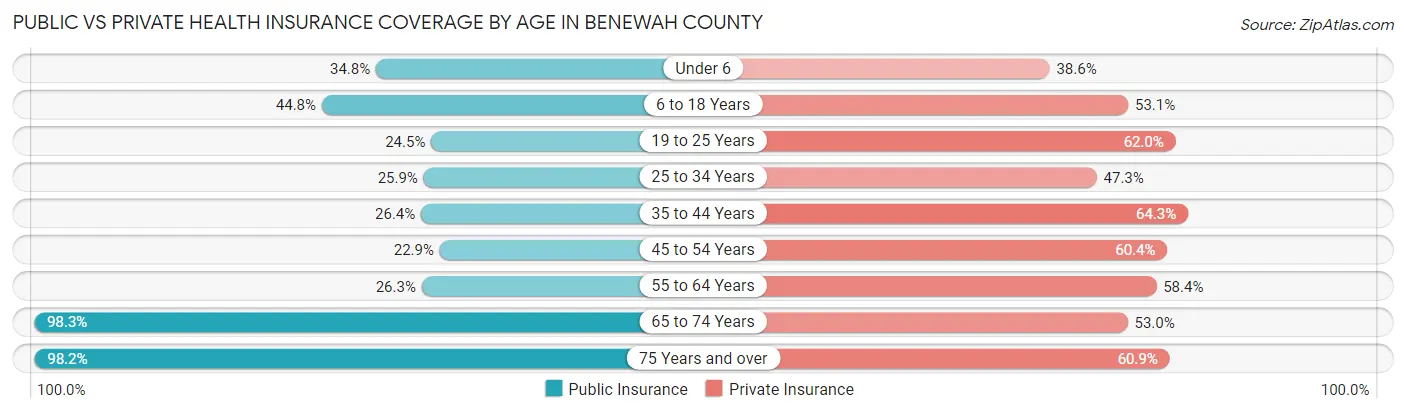
| Age Bracket | Public Insurance | Private Insurance |
| Under 6 | 211 (34.8%) | 234 (38.6%) |
| 6 to 18 Years | 744 (44.8%) | 882 (53.1%) |
| 19 to 25 Years | 167 (24.5%) | 422 (62.0%) |
| 25 to 34 Years | 211 (25.9%) | 385 (47.3%) |
| 35 to 44 Years | 260 (26.4%) | 633 (64.3%) |
| 45 to 54 Years | 258 (22.9%) | 680 (60.4%) |
| 55 to 64 Years | 418 (26.3%) | 928 (58.4%) |
| 65 to 74 Years | 1,408 (98.3%) | 760 (53.0%) |
| 75 Years and over | 710 (98.2%) | 440 (60.9%) |
| Total | 4,387 (45.6%) | 5,364 (55.8%) |
Disability Status by Sex by Age in Benewah County
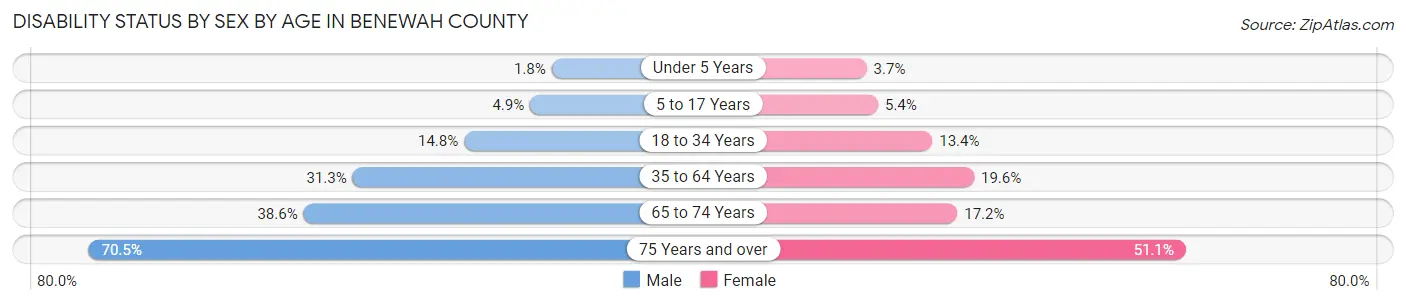
| Age Bracket | Male | Female |
| Under 5 Years | 5 (1.8%) | 9 (3.7%) |
| 5 to 17 Years | 42 (4.9%) | 42 (5.4%) |
| 18 to 34 Years | 122 (14.7%) | 104 (13.4%) |
| 35 to 64 Years | 589 (31.3%) | 357 (19.6%) |
| 65 to 74 Years | 274 (38.6%) | 124 (17.2%) |
| 75 Years and over | 282 (70.5%) | 165 (51.1%) |
Disability Class by Sex by Age in Benewah County
Disability Class: Hearing Difficulty
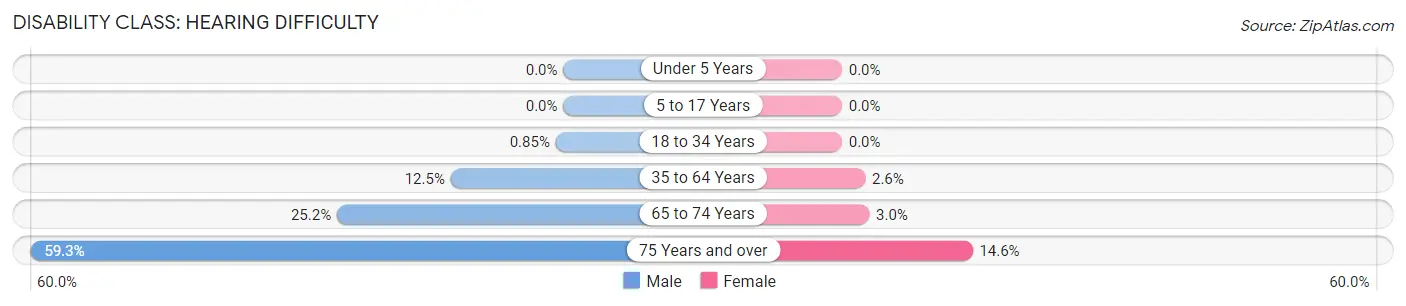
| Age Bracket | Male | Female |
| Under 5 Years | 0 (0.0%) | 0 (0.0%) |
| 5 to 17 Years | 0 (0.0%) | 0 (0.0%) |
| 18 to 34 Years | 7 (0.9%) | 0 (0.0%) |
| 35 to 64 Years | 236 (12.5%) | 47 (2.6%) |
| 65 to 74 Years | 179 (25.2%) | 22 (3.0%) |
| 75 Years and over | 237 (59.3%) | 47 (14.5%) |
Disability Class: Vision Difficulty
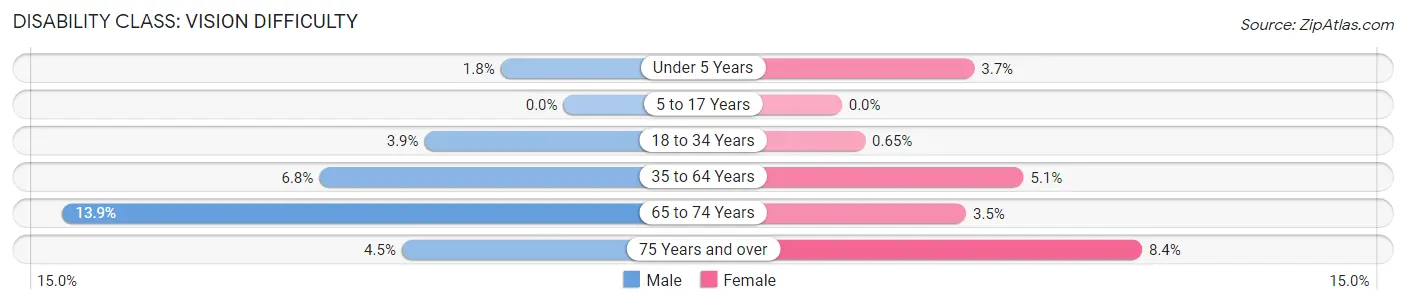
| Age Bracket | Male | Female |
| Under 5 Years | 5 (1.8%) | 9 (3.7%) |
| 5 to 17 Years | 0 (0.0%) | 0 (0.0%) |
| 18 to 34 Years | 32 (3.9%) | 5 (0.6%) |
| 35 to 64 Years | 128 (6.8%) | 92 (5.1%) |
| 65 to 74 Years | 99 (13.9%) | 25 (3.5%) |
| 75 Years and over | 18 (4.5%) | 27 (8.4%) |
Disability Class: Cognitive Difficulty
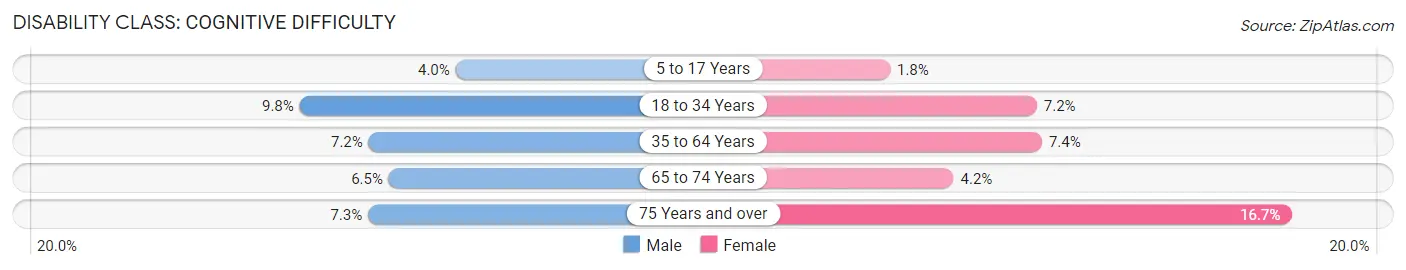
| Age Bracket | Male | Female |
| 5 to 17 Years | 34 (4.0%) | 14 (1.8%) |
| 18 to 34 Years | 81 (9.8%) | 56 (7.2%) |
| 35 to 64 Years | 136 (7.2%) | 135 (7.4%) |
| 65 to 74 Years | 46 (6.5%) | 30 (4.2%) |
| 75 Years and over | 29 (7.2%) | 54 (16.7%) |
Disability Class: Ambulatory Difficulty
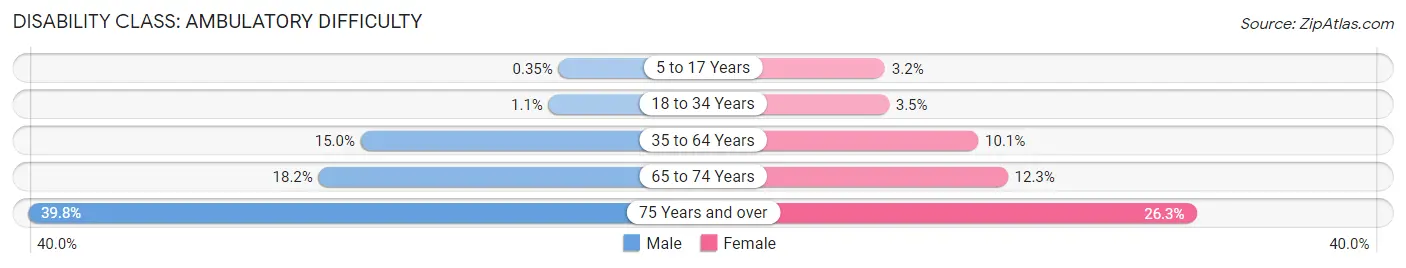
| Age Bracket | Male | Female |
| 5 to 17 Years | 3 (0.4%) | 25 (3.2%) |
| 18 to 34 Years | 9 (1.1%) | 27 (3.5%) |
| 35 to 64 Years | 283 (15.0%) | 184 (10.1%) |
| 65 to 74 Years | 129 (18.2%) | 89 (12.3%) |
| 75 Years and over | 159 (39.8%) | 85 (26.3%) |
Disability Class: Self-Care Difficulty
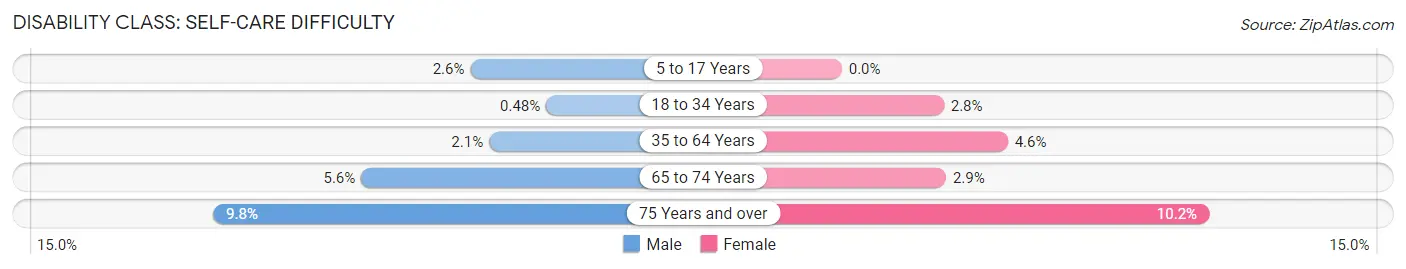
| Age Bracket | Male | Female |
| 5 to 17 Years | 22 (2.6%) | 0 (0.0%) |
| 18 to 34 Years | 4 (0.5%) | 22 (2.8%) |
| 35 to 64 Years | 39 (2.1%) | 84 (4.6%) |
| 65 to 74 Years | 40 (5.6%) | 21 (2.9%) |
| 75 Years and over | 39 (9.8%) | 33 (10.2%) |
Technology Access in Benewah County
Computing Device Access in Benewah County
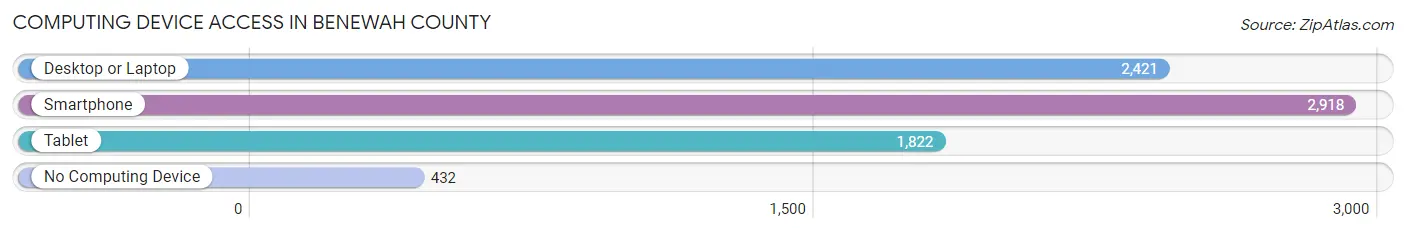
| Device Type | # Households | % Households |
| Desktop or Laptop | 2,421 | 63.3% |
| Smartphone | 2,918 | 76.3% |
| Tablet | 1,822 | 47.6% |
| No Computing Device | 432 | 11.3% |
| Total | 3,826 | 100.0% |
Internet Access in Benewah County
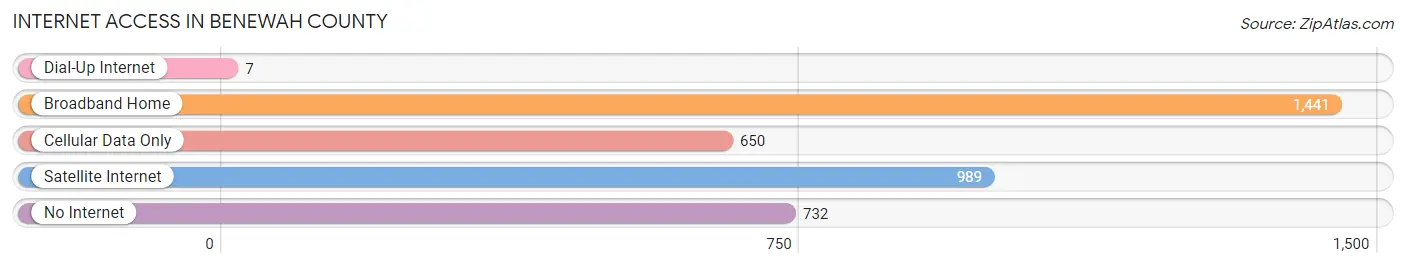
| Internet Type | # Households | % Households |
| Dial-Up Internet | 7 | 0.2% |
| Broadband Home | 1,441 | 37.7% |
| Cellular Data Only | 650 | 17.0% |
| Satellite Internet | 989 | 25.9% |
| No Internet | 732 | 19.1% |
| Total | 3,826 | 100.0% |
Benewah County Summary
Benewah County is located in the northern part of the state of Idaho, in the United States. It is bordered by Kootenai County to the north, Shoshone County to the east, Latah County to the south, and Spokane County, Washington to the west. The county seat is St. Maries, and the largest city is Plummer. The county was established in 1915 and named after Chief Benewah of the Coeur d'Alene Tribe.
Geography
Benewah County covers an area of 1,743 square miles, making it the fourth-largest county in Idaho. The terrain is mostly rolling hills, with the highest point being the summit of Mount Spokane at 5,883 feet. The county is drained by the St. Joe River, which flows through the county from north to south. The county also contains several lakes, including Lake Coeur d'Alene, Lake Pend Oreille, and Lake Chatcolet.
Climate
Benewah County has a humid continental climate, with cold winters and warm summers. The average annual temperature is 44°F, and the average annual precipitation is 22 inches.
Demographics
As of the 2010 census, there were 9,285 people, 3,717 households, and 2,541 families living in Benewah County. The population density was 5.3 people per square mile. The racial makeup of the county was 90.2% White, 0.4% African American, 4.2% Native American, 0.4% Asian, 0.1% Pacific Islander, 0.7% from other races, and 3.9% from two or more races. Hispanic or Latino of any race were 2.7% of the population.
The median income for a household in the county was $35,945, and the median income for a family was $41,944. The per capita income for the county was $17,845. About 16.2% of families and 20.2% of the population were below the poverty line, including 28.2% of those under age 18 and 11.2% of those age 65 or over.
Economy
The economy of Benewah County is largely based on agriculture and timber. The county is home to several large timber companies, including Potlatch Corporation and Weyerhaeuser. Agriculture is also important to the economy, with the county producing hay, wheat, barley, and potatoes.
The county is also home to several tourist attractions, including the Coeur d'Alene National Forest, the St. Joe River, and the Coeur d'Alene Casino. The county is also home to several ski resorts, including Silver Mountain and Lookout Pass.
History
The area that is now Benewah County was originally inhabited by the Coeur d'Alene Tribe. The tribe had lived in the area for centuries before the arrival of European settlers in the late 19th century. The area was first explored by fur traders in the early 1800s, and the first permanent settlement was established in 1871.
The area was originally part of Kootenai County, but in 1915 it was split off to form Benewah County. The county was named after Chief Benewah of the Coeur d'Alene Tribe. The county seat was originally located in Plummer, but it was moved to St. Maries in 1921.
In the early 20th century, the county was largely dependent on the timber industry. The county was also home to several large sawmills, which provided jobs for many of the county's residents. The timber industry declined in the mid-20th century, and the county's economy shifted to agriculture and tourism.
Common Questions
What is the Total Population of Benewah County?
Total Population of Benewah County is 9,731.
What is the Total Male Population of Benewah County?
Total Male Population of Benewah County is 4,996.
What is the Total Female Population of Benewah County?
Total Female Population of Benewah County is 4,735.
What is the Ratio of Males per 100 Females in Benewah County?
There are 105.51 Males per 100 Females in Benewah County.
What is the Ratio of Females per 100 Males in Benewah County?
There are 94.78 Females per 100 Males in Benewah County.
What is the Median Population Age in Benewah County?
Median Population Age in Benewah County is 45.9 Years.
What is the Average Family Size in Benewah County
Average Family Size in Benewah County is 3.0 People.
What is the Average Household Size in Benewah County
Average Household Size in Benewah County is 2.5 People.
What is Per Capita Income in Benewah County?
Per Capita income in Benewah County is $28,420.
What is the Median Family Income in Benewah County?
Median Family Income in Benewah County is $61,766.
What is the Median Household income in Benewah County?
Median Household Income in Benewah County is $54,191.
What is Income or Wage Gap in Benewah County?
Income or Wage Gap in Benewah County is 42.2%.
Women in Benewah County earn 57.8 cents for every dollar earned by a man.
What is Family Income Deficit in Benewah County?
Family Income Deficit in Benewah County is $8,623.
Families that are below poverty line in Benewah County earn $8,623 less on average than the poverty threshold level.
What is Inequality or Gini Index in Benewah County?
Inequality or Gini Index in Benewah County is 0.44.
How Large is the Labor Force in Benewah County?
There are 3,966 People in the Labor Forcein in Benewah County.
What is the Percentage of People in the Labor Force in Benewah County?
50.2% of People are in the Labor Force in Benewah County.
What is the Unemployment Rate in Benewah County?
Unemployment Rate in Benewah County is 3.8%.