Bannock County, ID
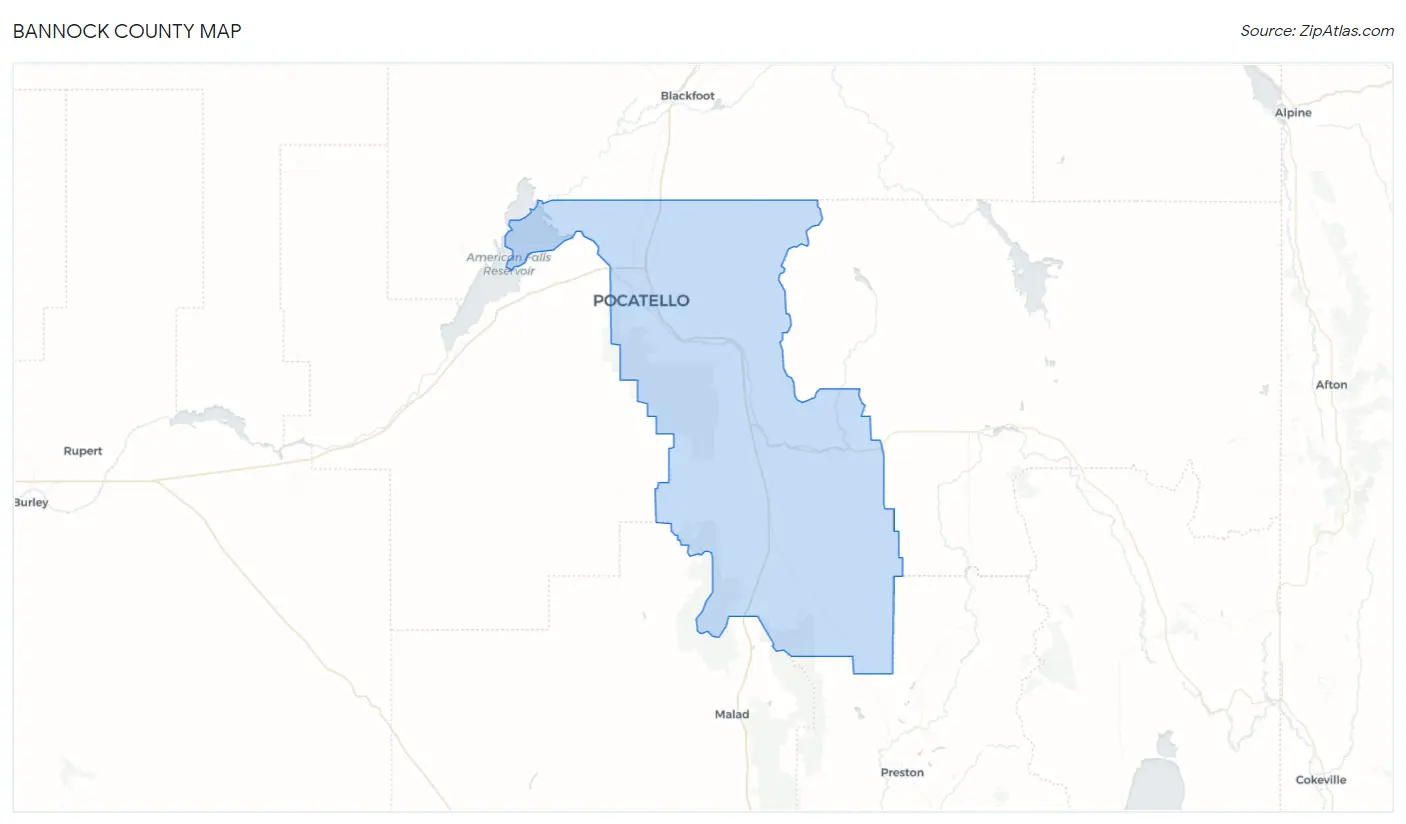
Bannock County Map
Bannock County Overview
87,434
TOTAL POPULATION
44,037
MALE POPULATION
43,397
FEMALE POPULATION
101.47
MALES / 100 FEMALES
98.55
FEMALES / 100 MALES
34.7
MEDIAN AGE
3.3
AVG FAMILY SIZE
2.6
AVG HOUSEHOLD SIZE
$30,257
PER CAPITA INCOME
$80,428
AVG FAMILY INCOME
$60,998
AVG HOUSEHOLD INCOME
35.9%
WAGE / INCOME GAP [ % ]
64.1¢/ $1
WAGE / INCOME GAP [ $ ]
$11,431
FAMILY INCOME DEFICIT
0.43
INEQUALITY / GINI INDEX
41,607
LABOR FORCE [ PEOPLE ]
61.5%
PERCENT IN LABOR FORCE
5.1%
UNEMPLOYMENT RATE
Bannock County Area Codes
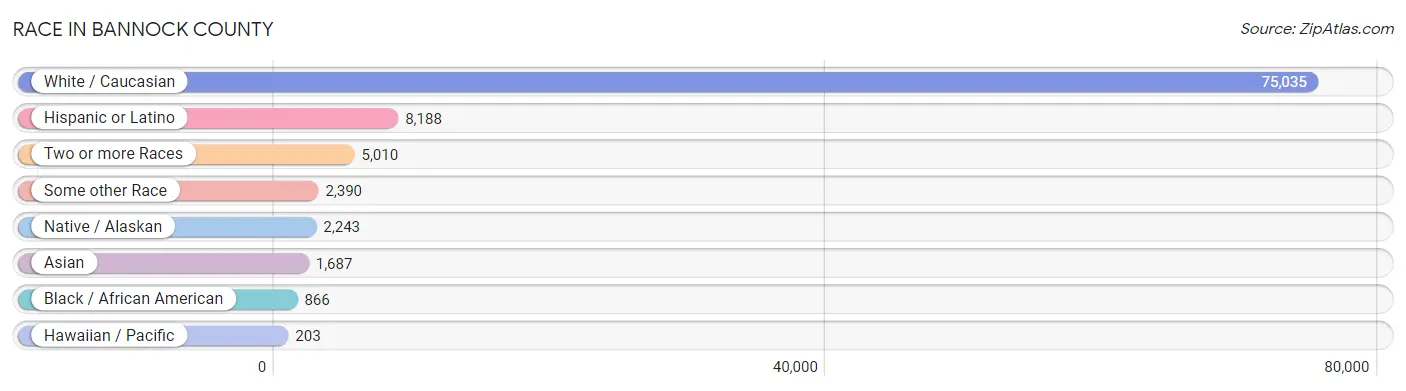
Race in Bannock County
The most populous races in Bannock County are White / Caucasian (75,035 | 85.8%), Hispanic or Latino (8,188 | 9.4%), and Two or more Races (5,010 | 5.7%).
| Race | # Population | % Population |
| Asian | 1,687 | 1.9% |
| Black / African American | 866 | 1.0% |
| Hawaiian / Pacific | 203 | 0.2% |
| Hispanic or Latino | 8,188 | 9.4% |
| Native / Alaskan | 2,243 | 2.6% |
| White / Caucasian | 75,035 | 85.8% |
| Two or more Races | 5,010 | 5.7% |
| Some other Race | 2,390 | 2.7% |
| Total | 87,434 | 100.0% |
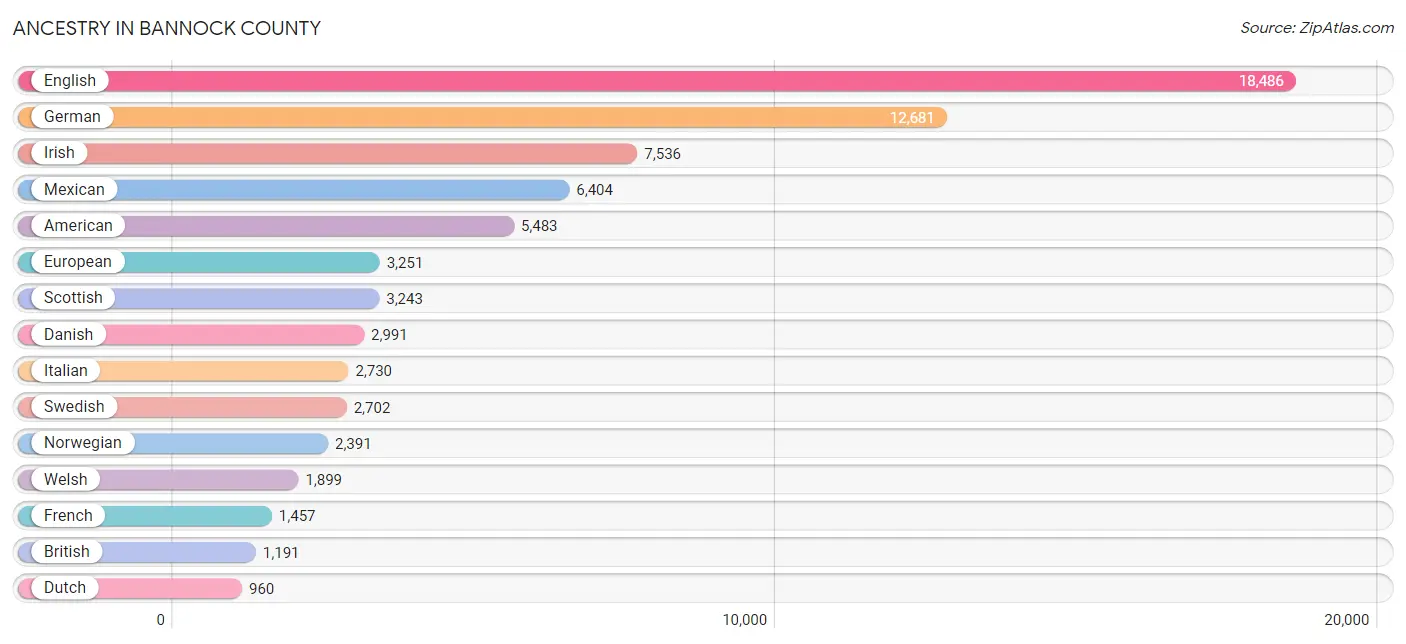
Ancestry in Bannock County
The most populous ancestries reported in Bannock County are English (18,486 | 21.1%), German (12,681 | 14.5%), Irish (7,536 | 8.6%), Mexican (6,404 | 7.3%), and American (5,483 | 6.3%), together accounting for 57.9% of all Bannock County residents.
| Ancestry | # Population | % Population |
| Afghan | 27 | 0.0% |
| African | 14 | 0.0% |
| American | 5,483 | 6.3% |
| Apache | 13 | 0.0% |
| Arab | 139 | 0.2% |
| Arapaho | 12 | 0.0% |
| Argentinean | 31 | 0.0% |
| Armenian | 36 | 0.0% |
| Assyrian / Chaldean / Syriac | 14 | 0.0% |
| Australian | 6 | 0.0% |
| Austrian | 64 | 0.1% |
| Basque | 319 | 0.4% |
| Belgian | 180 | 0.2% |
| Bhutanese | 599 | 0.7% |
| Blackfeet | 16 | 0.0% |
| Brazilian | 156 | 0.2% |
| British | 1,191 | 1.4% |
| Bulgarian | 9 | 0.0% |
| Burmese | 71 | 0.1% |
| Canadian | 210 | 0.2% |
| Carpatho Rusyn | 12 | 0.0% |
| Central American | 88 | 0.1% |
| Cherokee | 391 | 0.4% |
| Chilean | 18 | 0.0% |
| Chippewa | 103 | 0.1% |
| Choctaw | 22 | 0.0% |
| Colombian | 161 | 0.2% |
| Comanche | 12 | 0.0% |
| Cree | 8 | 0.0% |
| Creek | 38 | 0.0% |
| Croatian | 30 | 0.0% |
| Cuban | 90 | 0.1% |
| Czech | 117 | 0.1% |
| Czechoslovakian | 32 | 0.0% |
| Danish | 2,991 | 3.4% |
| Dutch | 960 | 1.1% |
| Eastern European | 83 | 0.1% |
| Ecuadorian | 26 | 0.0% |
| Egyptian | 9 | 0.0% |
| English | 18,486 | 21.1% |
| Ethiopian | 67 | 0.1% |
| European | 3,251 | 3.7% |
| Fijian | 24 | 0.0% |
| Filipino | 5 | 0.0% |
| Finnish | 257 | 0.3% |
| French | 1,457 | 1.7% |
| French Canadian | 172 | 0.2% |
| German | 12,681 | 14.5% |
| German Russian | 3 | 0.0% |
| Ghanaian | 20 | 0.0% |
| Greek | 270 | 0.3% |
| Guatemalan | 25 | 0.0% |
| Honduran | 41 | 0.1% |
| Hungarian | 56 | 0.1% |
| Icelander | 30 | 0.0% |
| Indian (Asian) | 297 | 0.3% |
| Indonesian | 47 | 0.1% |
| Inupiat | 10 | 0.0% |
| Iranian | 132 | 0.2% |
| Irish | 7,536 | 8.6% |
| Iroquois | 4 | 0.0% |
| Italian | 2,730 | 3.1% |
| Jamaican | 8 | 0.0% |
| Korean | 356 | 0.4% |
| Laotian | 211 | 0.2% |
| Latvian | 10 | 0.0% |
| Lebanese | 13 | 0.0% |
| Lithuanian | 30 | 0.0% |
| Luxembourger | 10 | 0.0% |
| Malaysian | 9 | 0.0% |
| Mexican | 6,404 | 7.3% |
| Mexican American Indian | 60 | 0.1% |
| Native Hawaiian | 262 | 0.3% |
| Navajo | 148 | 0.2% |
| New Zealander | 20 | 0.0% |
| Nigerian | 23 | 0.0% |
| Northern European | 179 | 0.2% |
| Norwegian | 2,391 | 2.7% |
| Paiute | 4 | 0.0% |
| Pakistani | 98 | 0.1% |
| Panamanian | 10 | 0.0% |
| Pennsylvania German | 33 | 0.0% |
| Pima | 12 | 0.0% |
| Polish | 948 | 1.1% |
| Portuguese | 97 | 0.1% |
| Pueblo | 19 | 0.0% |
| Puerto Rican | 496 | 0.6% |
| Romanian | 132 | 0.2% |
| Russian | 205 | 0.2% |
| Salvadoran | 12 | 0.0% |
| Samoan | 55 | 0.1% |
| Scandinavian | 583 | 0.7% |
| Scotch-Irish | 881 | 1.0% |
| Scottish | 3,243 | 3.7% |
| Seminole | 13 | 0.0% |
| Shoshone | 416 | 0.5% |
| Sierra Leonean | 45 | 0.1% |
| Sioux | 195 | 0.2% |
| Slovak | 77 | 0.1% |
| Slovene | 9 | 0.0% |
| South American | 304 | 0.4% |
| Spaniard | 285 | 0.3% |
| Spanish | 243 | 0.3% |
| Sri Lankan | 144 | 0.2% |
| Subsaharan African | 180 | 0.2% |
| Swedish | 2,702 | 3.1% |
| Swiss | 857 | 1.0% |
| Thai | 363 | 0.4% |
| Tlingit-Haida | 15 | 0.0% |
| Turkish | 29 | 0.0% |
| Ukrainian | 49 | 0.1% |
| Venezuelan | 68 | 0.1% |
| Welsh | 1,899 | 2.2% |
| Yaqui | 30 | 0.0% | View All 114 Rows |
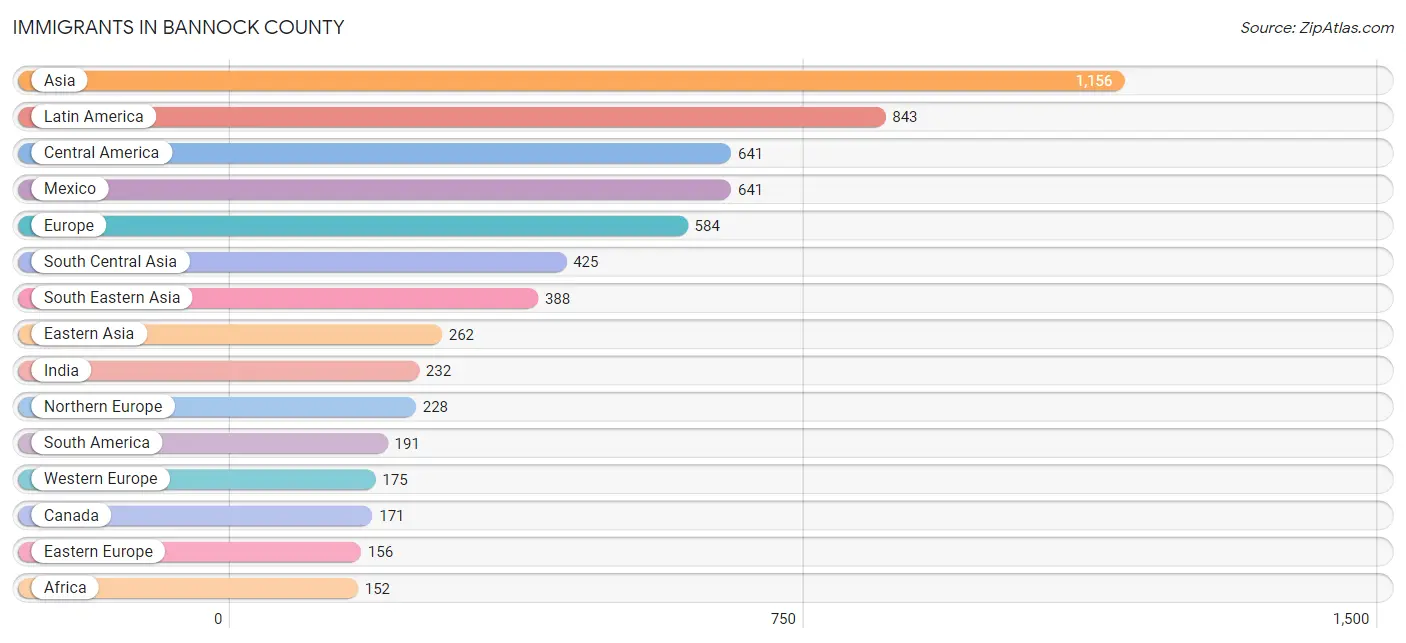
Immigrants in Bannock County
The most numerous immigrant groups reported in Bannock County came from Asia (1,156 | 1.3%), Latin America (843 | 1.0%), Central America (641 | 0.7%), Mexico (641 | 0.7%), and Europe (584 | 0.7%), together accounting for 4.4% of all Bannock County residents.
| Immigration Origin | # Population | % Population |
| Afghanistan | 45 | 0.1% |
| Africa | 152 | 0.2% |
| Asia | 1,156 | 1.3% |
| Australia | 6 | 0.0% |
| Austria | 21 | 0.0% |
| Bangladesh | 21 | 0.0% |
| Belgium | 14 | 0.0% |
| Brazil | 41 | 0.1% |
| Canada | 171 | 0.2% |
| Caribbean | 11 | 0.0% |
| Central America | 641 | 0.7% |
| Chile | 6 | 0.0% |
| China | 113 | 0.1% |
| Colombia | 135 | 0.2% |
| Croatia | 8 | 0.0% |
| Denmark | 10 | 0.0% |
| Eastern Africa | 65 | 0.1% |
| Eastern Asia | 262 | 0.3% |
| Eastern Europe | 156 | 0.2% |
| Ecuador | 9 | 0.0% |
| Egypt | 9 | 0.0% |
| England | 100 | 0.1% |
| Ethiopia | 17 | 0.0% |
| Europe | 584 | 0.7% |
| Fiji | 8 | 0.0% |
| France | 32 | 0.0% |
| Germany | 82 | 0.1% |
| Ghana | 20 | 0.0% |
| Haiti | 11 | 0.0% |
| Hong Kong | 44 | 0.1% |
| India | 232 | 0.3% |
| Indonesia | 133 | 0.2% |
| Iran | 42 | 0.1% |
| Iraq | 6 | 0.0% |
| Japan | 101 | 0.1% |
| Korea | 48 | 0.1% |
| Kuwait | 13 | 0.0% |
| Latin America | 843 | 1.0% |
| Mexico | 641 | 0.7% |
| Nepal | 47 | 0.1% |
| Netherlands | 16 | 0.0% |
| Nigeria | 58 | 0.1% |
| Northern Africa | 9 | 0.0% |
| Northern Europe | 228 | 0.3% |
| Norway | 20 | 0.0% |
| Oceania | 55 | 0.1% |
| Philippines | 99 | 0.1% |
| Romania | 44 | 0.1% |
| Russia | 34 | 0.0% |
| Saudi Arabia | 62 | 0.1% |
| Scotland | 23 | 0.0% |
| South America | 191 | 0.2% |
| South Central Asia | 425 | 0.5% |
| South Eastern Asia | 388 | 0.4% |
| Southern Europe | 25 | 0.0% |
| Spain | 14 | 0.0% |
| Sri Lanka | 38 | 0.0% |
| Switzerland | 10 | 0.0% |
| Taiwan | 2 | 0.0% |
| Thailand | 85 | 0.1% |
| Vietnam | 45 | 0.1% |
| Western Africa | 78 | 0.1% |
| Western Asia | 81 | 0.1% |
| Western Europe | 175 | 0.2% | View All 64 Rows |
Sex and Age in Bannock County
Sex and Age in Bannock County
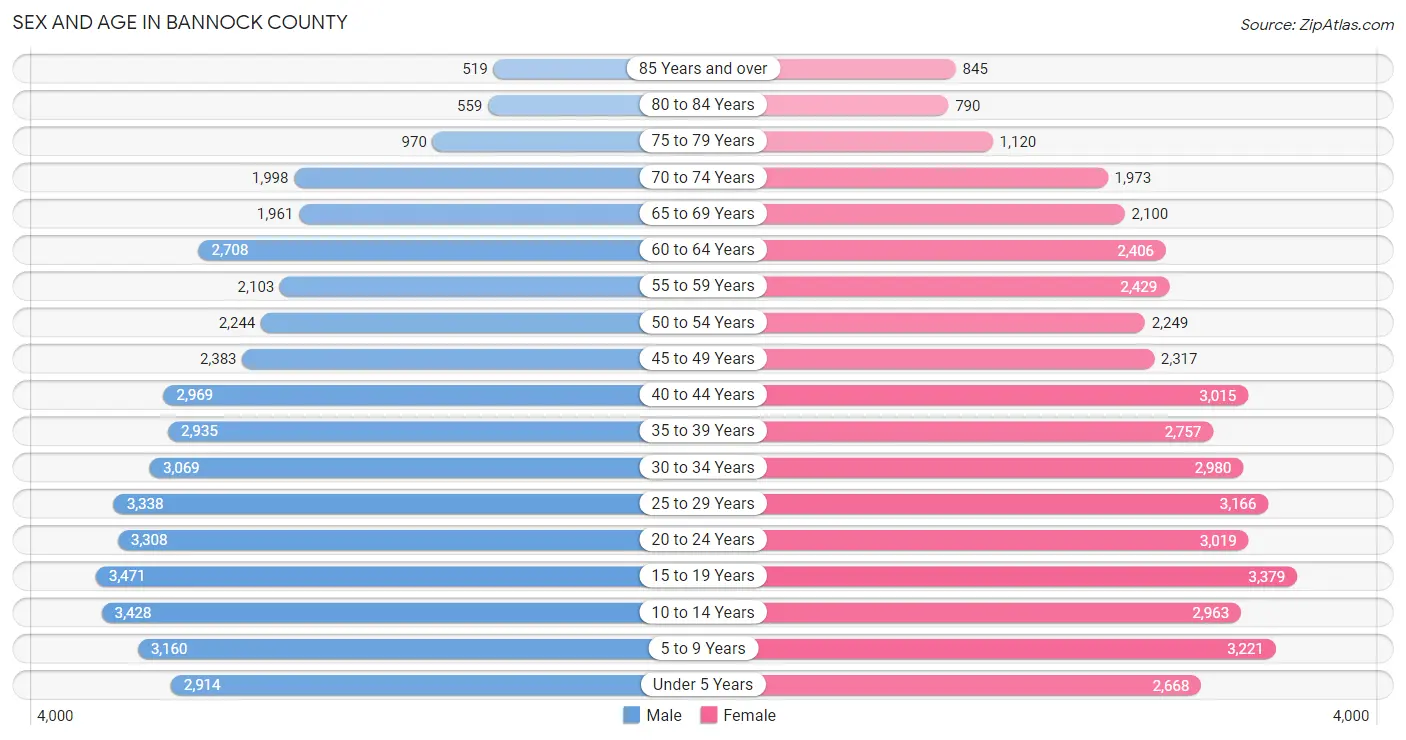
The most populous age groups in Bannock County are 15 to 19 Years (3,471 | 7.9%) for men and 15 to 19 Years (3,379 | 7.8%) for women.
| Age Bracket | Male | Female |
| Under 5 Years | 2,914 (6.6%) | 2,668 (6.1%) |
| 5 to 9 Years | 3,160 (7.2%) | 3,221 (7.4%) |
| 10 to 14 Years | 3,428 (7.8%) | 2,963 (6.8%) |
| 15 to 19 Years | 3,471 (7.9%) | 3,379 (7.8%) |
| 20 to 24 Years | 3,308 (7.5%) | 3,019 (7.0%) |
| 25 to 29 Years | 3,338 (7.6%) | 3,166 (7.3%) |
| 30 to 34 Years | 3,069 (7.0%) | 2,980 (6.9%) |
| 35 to 39 Years | 2,935 (6.7%) | 2,757 (6.4%) |
| 40 to 44 Years | 2,969 (6.7%) | 3,015 (7.0%) |
| 45 to 49 Years | 2,383 (5.4%) | 2,317 (5.3%) |
| 50 to 54 Years | 2,244 (5.1%) | 2,249 (5.2%) |
| 55 to 59 Years | 2,103 (4.8%) | 2,429 (5.6%) |
| 60 to 64 Years | 2,708 (6.1%) | 2,406 (5.5%) |
| 65 to 69 Years | 1,961 (4.4%) | 2,100 (4.8%) |
| 70 to 74 Years | 1,998 (4.5%) | 1,973 (4.5%) |
| 75 to 79 Years | 970 (2.2%) | 1,120 (2.6%) |
| 80 to 84 Years | 559 (1.3%) | 790 (1.8%) |
| 85 Years and over | 519 (1.2%) | 845 (1.9%) |
| Total | 44,037 (100.0%) | 43,397 (100.0%) |
Families and Households in Bannock County
Median Family Size in Bannock County
The median family size in Bannock County is 3.27 persons per family, with single female/mother families (2,830 | 13.8%) accounting for the largest median family size of 3.41 persons per family. On the other hand, single male/father families (1,272 | 6.2%) represent the smallest median family size with 3.16 persons per family.
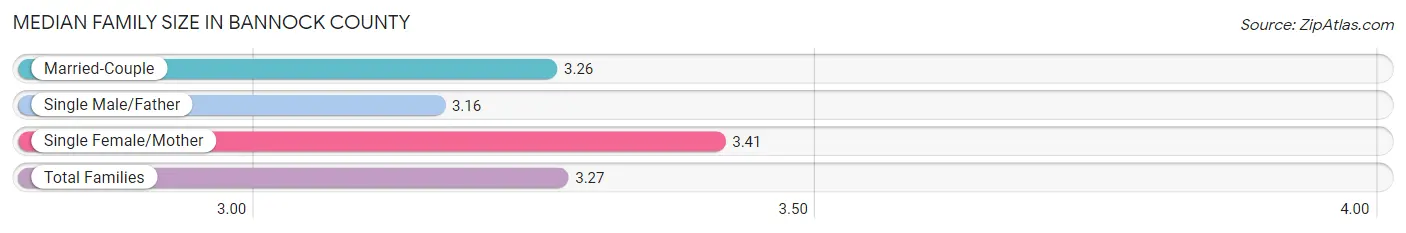
| Family Type | # Families | Family Size |
| Married-Couple | 16,455 (80.0%) | 3.26 |
| Single Male/Father | 1,272 (6.2%) | 3.16 |
| Single Female/Mother | 2,830 (13.8%) | 3.41 |
| Total Families | 20,557 (100.0%) | 3.27 |
Median Household Size in Bannock County
The median household size in Bannock County is 2.57 persons per household, with single female/mother households (2,830 | 8.6%) accounting for the largest median household size of 3.58 persons per household. non-family households (12,147 | 37.1%) represent the smallest median household size with 1.25 persons per household.
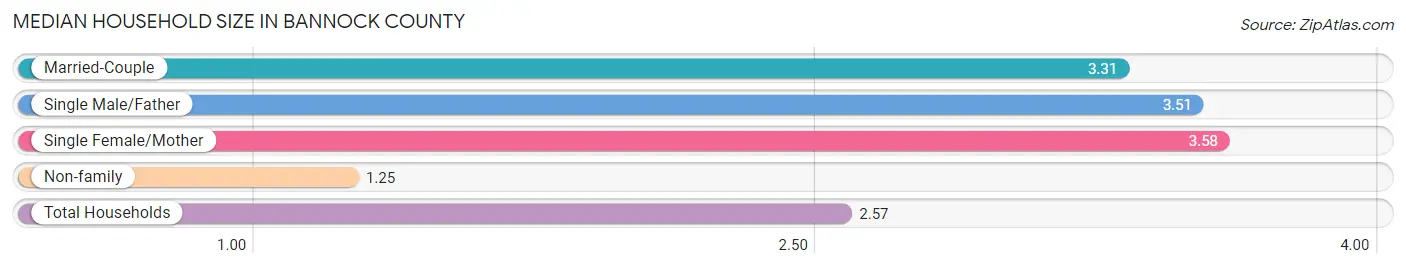
| Household Type | # Households | Household Size |
| Married-Couple | 16,455 (50.3%) | 3.31 |
| Single Male/Father | 1,272 (3.9%) | 3.51 |
| Single Female/Mother | 2,830 (8.6%) | 3.58 |
| Non-family | 12,147 (37.1%) | 1.25 |
| Total Households | 32,704 (100.0%) | 2.57 |
Household Size by Marriage Status in Bannock County
Out of a total of 32,704 households in Bannock County, 20,557 (62.9%) are family households, while 12,147 (37.1%) are nonfamily households. The most numerous type of family households are 2-person households, comprising 9,091, and the most common type of nonfamily households are 1-person households, comprising 9,913.
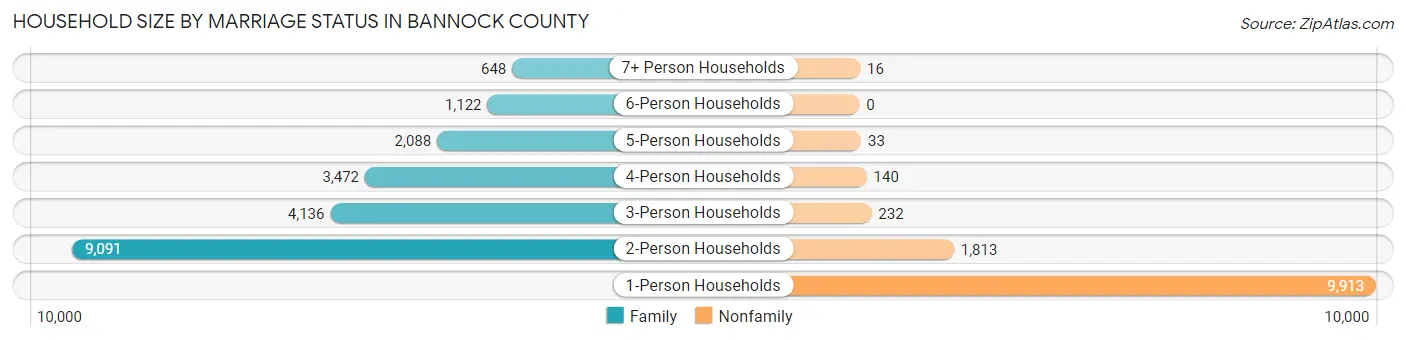
| Household Size | Family Households | Nonfamily Households |
| 1-Person Households | - | 9,913 (30.3%) |
| 2-Person Households | 9,091 (27.8%) | 1,813 (5.5%) |
| 3-Person Households | 4,136 (12.7%) | 232 (0.7%) |
| 4-Person Households | 3,472 (10.6%) | 140 (0.4%) |
| 5-Person Households | 2,088 (6.4%) | 33 (0.1%) |
| 6-Person Households | 1,122 (3.4%) | 0 (0.0%) |
| 7+ Person Households | 648 (2.0%) | 16 (0.1%) |
| Total | 20,557 (62.9%) | 12,147 (37.1%) |
Female Fertility in Bannock County
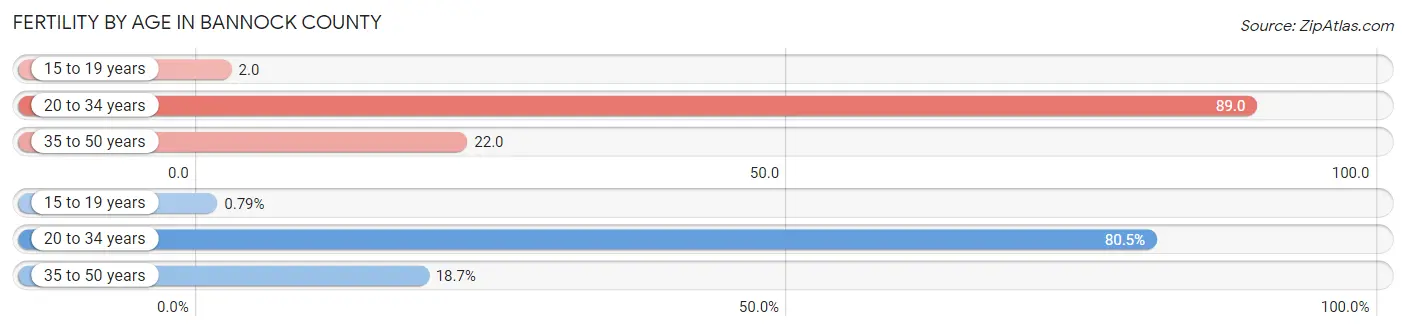
Fertility by Age in Bannock County
Average fertility rate in Bannock County is 48.0 births per 1,000 women. Women in the age bracket of 20 to 34 years have the highest fertility rate with 89.0 births per 1,000 women. Women in the age bracket of 20 to 34 years acount for 80.5% of all women with births.
| Age Bracket | Women with Births | Births / 1,000 Women |
| 15 to 19 years | 8 (0.8%) | 2.0 |
| 20 to 34 years | 817 (80.5%) | 89.0 |
| 35 to 50 years | 190 (18.7%) | 22.0 |
| Total | 1,015 (100.0%) | 48.0 |
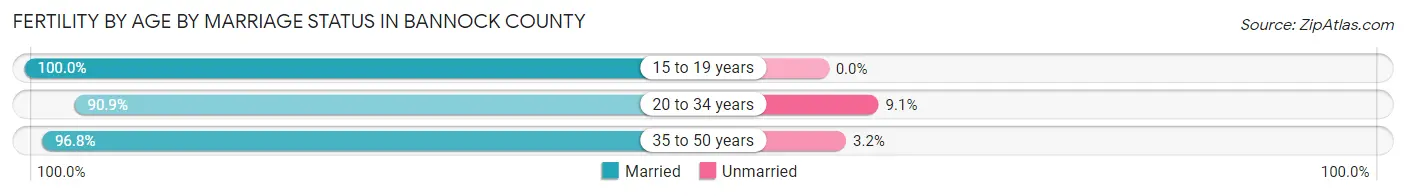
Fertility by Age by Marriage Status in Bannock County
92.1% of women with births (1,015) in Bannock County are married. The highest percentage of unmarried women with births falls into 20 to 34 years age bracket with 9.1% of them unmarried at the time of birth, while the lowest percentage of unmarried women with births belong to 15 to 19 years age bracket with 0.0% of them unmarried.
| Age Bracket | Married | Unmarried |
| 15 to 19 years | 8 (100.0%) | 0 (0.0%) |
| 20 to 34 years | 743 (90.9%) | 74 (9.1%) |
| 35 to 50 years | 184 (96.8%) | 6 (3.2%) |
| Total | 935 (92.1%) | 80 (7.9%) |
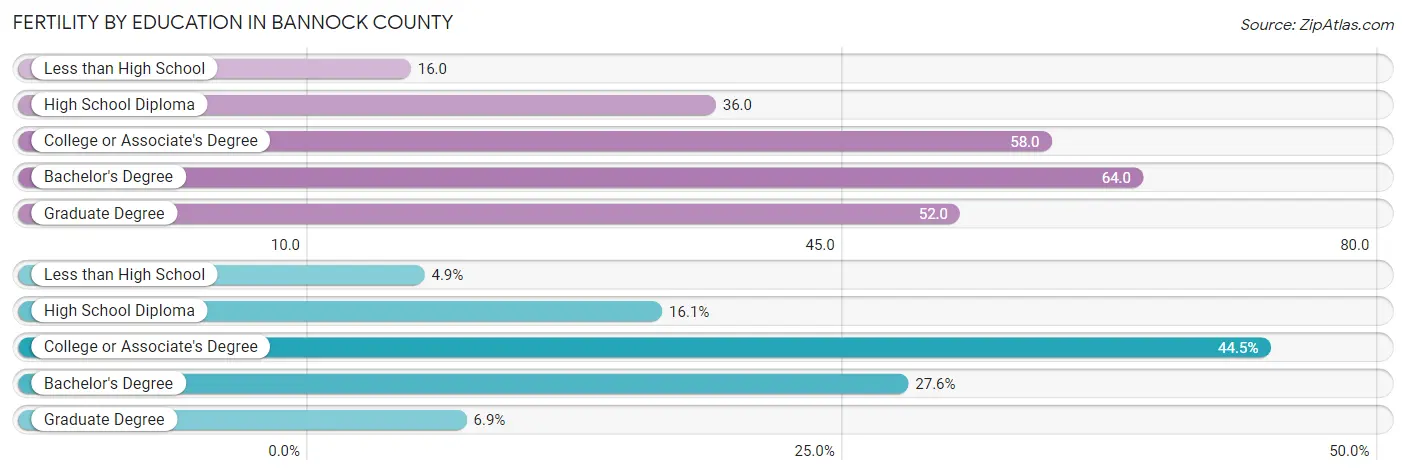
Fertility by Education in Bannock County
Average fertility rate in Bannock County is 48.0 births per 1,000 women. Women with the education attainment of bachelor's degree have the highest fertility rate of 64.0 births per 1,000 women, while women with the education attainment of less than high school have the lowest fertility at 16.0 births per 1,000 women. Women with the education attainment of college or associate's degree represent 44.5% of all women with births.
| Educational Attainment | Women with Births | Births / 1,000 Women |
| Less than High School | 50 (4.9%) | 16.0 |
| High School Diploma | 163 (16.1%) | 36.0 |
| College or Associate's Degree | 452 (44.5%) | 58.0 |
| Bachelor's Degree | 280 (27.6%) | 64.0 |
| Graduate Degree | 70 (6.9%) | 52.0 |
| Total | 1,015 (100.0%) | 48.0 |
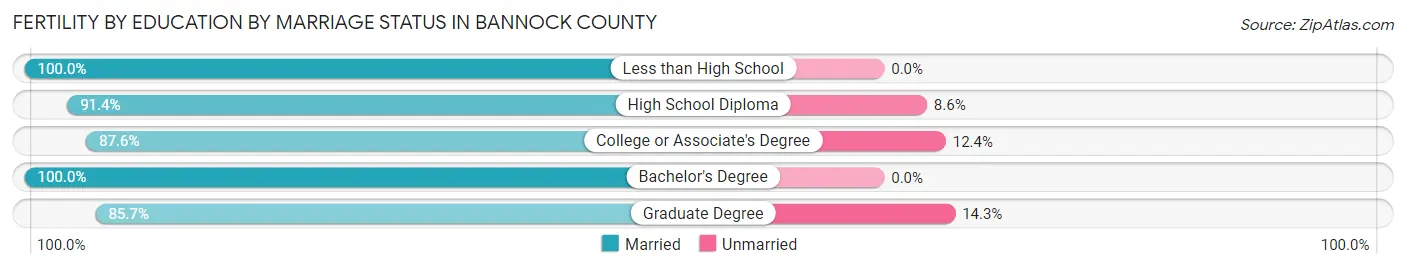
Fertility by Education by Marriage Status in Bannock County
7.9% of women with births in Bannock County are unmarried. Women with the educational attainment of less than high school are most likely to be married with 100.0% of them married at childbirth, while women with the educational attainment of graduate degree are least likely to be married with 14.3% of them unmarried at childbirth.
| Educational Attainment | Married | Unmarried |
| Less than High School | 50 (100.0%) | 0 (0.0%) |
| High School Diploma | 149 (91.4%) | 14 (8.6%) |
| College or Associate's Degree | 396 (87.6%) | 56 (12.4%) |
| Bachelor's Degree | 280 (100.0%) | 0 (0.0%) |
| Graduate Degree | 60 (85.7%) | 10 (14.3%) |
| Total | 935 (92.1%) | 80 (7.9%) |
Income in Bannock County
Income Overview in Bannock County
Per Capita Income in Bannock County is $30,257, while median incomes of families and households are $80,428 and $60,998 respectively.
| Characteristic | Number | Measure |
| Per Capita Income | 87,434 | $30,257 |
| Median Family Income | 20,557 | $80,428 |
| Mean Family Income | 20,557 | $96,262 |
| Median Household Income | 32,704 | $60,998 |
| Mean Household Income | 32,704 | $78,542 |
| Income Deficit | 20,557 | $11,431 |
| Wage / Income Gap (%) | 87,434 | 35.94% |
| Wage / Income Gap ($) | 87,434 | 64.06¢ per $1 |
| Gini / Inequality Index | 87,434 | 0.43 |
Earnings by Sex in Bannock County
Average Earnings in Bannock County are $33,464, $40,626 for men and $26,026 for women, a difference of 35.9%.
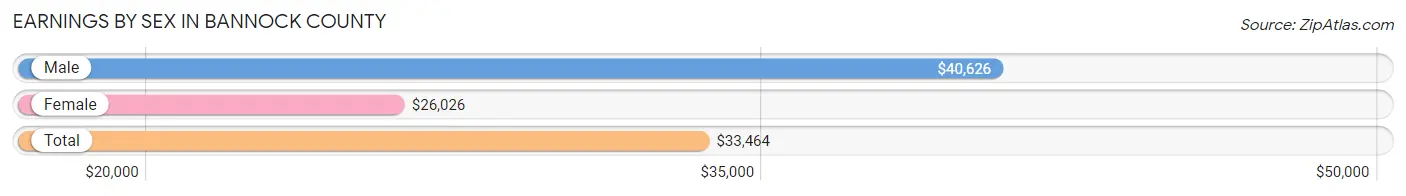
| Sex | Number | Average Earnings |
| Male | 24,204 (53.0%) | $40,626 |
| Female | 21,443 (47.0%) | $26,026 |
| Total | 45,647 (100.0%) | $33,464 |
Earnings by Sex by Income Bracket in Bannock County
The most common earnings brackets in Bannock County are $100,000+ for men (3,055 | 12.6%) and $2,499 or less for women (2,210 | 10.3%).
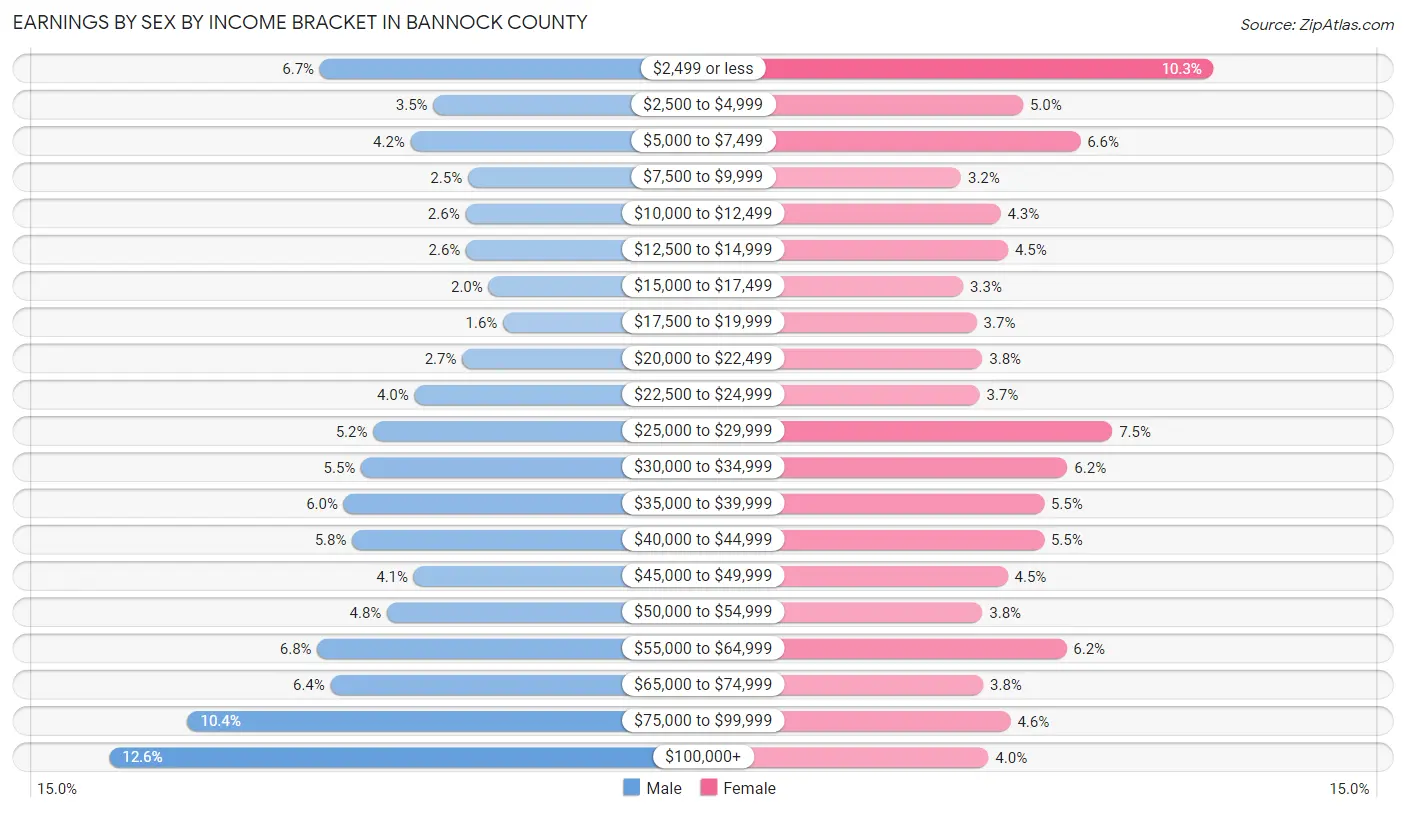
| Income | Male | Female |
| $2,499 or less | 1,621 (6.7%) | 2,210 (10.3%) |
| $2,500 to $4,999 | 849 (3.5%) | 1,062 (5.0%) |
| $5,000 to $7,499 | 1,004 (4.2%) | 1,407 (6.6%) |
| $7,500 to $9,999 | 615 (2.5%) | 689 (3.2%) |
| $10,000 to $12,499 | 632 (2.6%) | 926 (4.3%) |
| $12,500 to $14,999 | 627 (2.6%) | 972 (4.5%) |
| $15,000 to $17,499 | 474 (2.0%) | 702 (3.3%) |
| $17,500 to $19,999 | 376 (1.5%) | 782 (3.6%) |
| $20,000 to $22,499 | 654 (2.7%) | 817 (3.8%) |
| $22,500 to $24,999 | 978 (4.0%) | 800 (3.7%) |
| $25,000 to $29,999 | 1,259 (5.2%) | 1,600 (7.5%) |
| $30,000 to $34,999 | 1,341 (5.5%) | 1,329 (6.2%) |
| $35,000 to $39,999 | 1,460 (6.0%) | 1,189 (5.5%) |
| $40,000 to $44,999 | 1,402 (5.8%) | 1,187 (5.5%) |
| $45,000 to $49,999 | 983 (4.1%) | 969 (4.5%) |
| $50,000 to $54,999 | 1,165 (4.8%) | 818 (3.8%) |
| $55,000 to $64,999 | 1,638 (6.8%) | 1,323 (6.2%) |
| $65,000 to $74,999 | 1,548 (6.4%) | 821 (3.8%) |
| $75,000 to $99,999 | 2,523 (10.4%) | 986 (4.6%) |
| $100,000+ | 3,055 (12.6%) | 854 (4.0%) |
| Total | 24,204 (100.0%) | 21,443 (100.0%) |
Earnings by Sex by Educational Attainment in Bannock County
Average earnings in Bannock County are $50,080 for men and $32,757 for women, a difference of 34.6%. Men with an educational attainment of graduate degree enjoy the highest average annual earnings of $86,518, while those with less than high school education earn the least with $37,069. Women with an educational attainment of graduate degree earn the most with the average annual earnings of $62,960, while those with high school diploma education have the smallest earnings of $23,755.
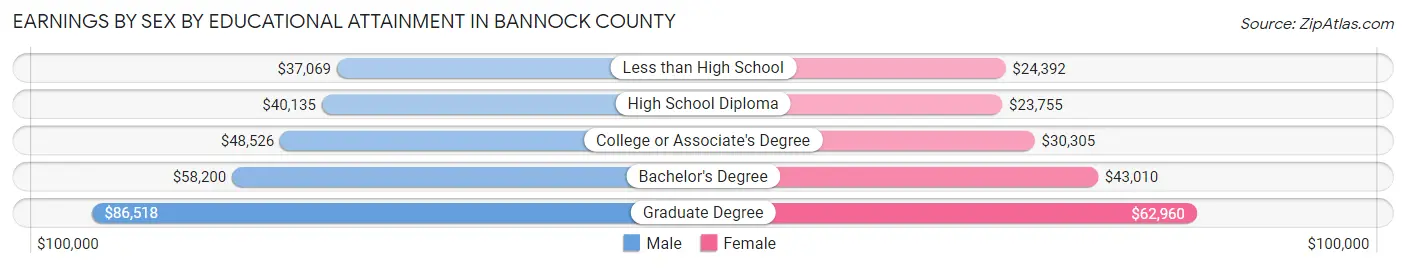
| Educational Attainment | Male Income | Female Income |
| Less than High School | $37,069 | $24,392 |
| High School Diploma | $40,135 | $23,755 |
| College or Associate's Degree | $48,526 | $30,305 |
| Bachelor's Degree | $58,200 | $43,010 |
| Graduate Degree | $86,518 | $62,960 |
| Total | $50,080 | $32,757 |
Family Income in Bannock County
Family Income Brackets in Bannock County
According to the Bannock County family income data, there are 4,296 families falling into the $100,000 to $149,999 income range, which is the most common income bracket and makes up 20.9% of all families. Conversely, the $10,000 to $14,999 income bracket is the least frequent group with only 329 families (1.6%) belonging to this category.
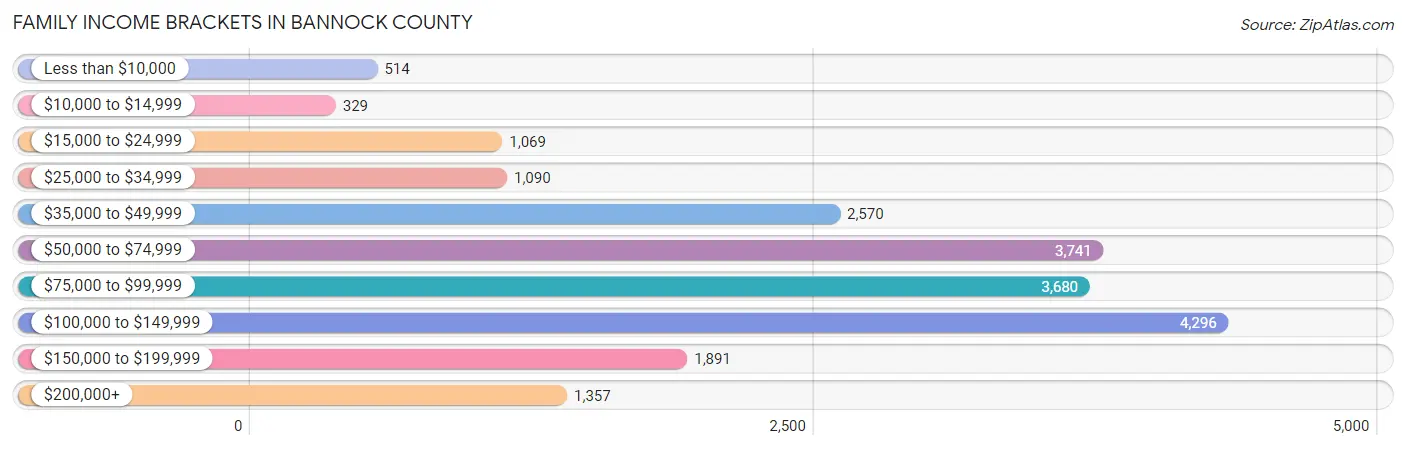
| Income Bracket | # Families | % Families |
| Less than $10,000 | 514 | 2.5% |
| $10,000 to $14,999 | 329 | 1.6% |
| $15,000 to $24,999 | 1,069 | 5.2% |
| $25,000 to $34,999 | 1,090 | 5.3% |
| $35,000 to $49,999 | 2,570 | 12.5% |
| $50,000 to $74,999 | 3,741 | 18.2% |
| $75,000 to $99,999 | 3,680 | 17.9% |
| $100,000 to $149,999 | 4,296 | 20.9% |
| $150,000 to $199,999 | 1,891 | 9.2% |
| $200,000+ | 1,357 | 6.6% |
Family Income by Famaliy Size in Bannock County
6-person families (975 | 4.7%) account for the highest median family income in Bannock County with $104,625 per family, while 2-person families (9,570 | 46.6%) have the highest median income of $37,158 per family member.
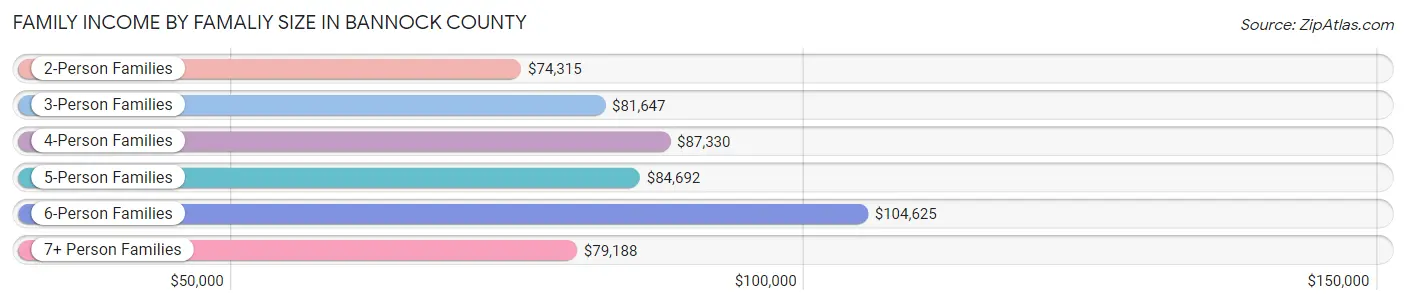
| Income Bracket | # Families | Median Income |
| 2-Person Families | 9,570 (46.6%) | $74,315 |
| 3-Person Families | 4,143 (20.2%) | $81,647 |
| 4-Person Families | 3,191 (15.5%) | $87,330 |
| 5-Person Families | 2,121 (10.3%) | $84,692 |
| 6-Person Families | 975 (4.7%) | $104,625 |
| 7+ Person Families | 557 (2.7%) | $79,188 |
| Total | 20,557 (100.0%) | $80,428 |
Family Income by Number of Earners in Bannock County
The median family income in Bannock County is $80,428, with families comprising 3+ earners (2,454) having the highest median family income of $135,789, while families with no earners (3,429) have the lowest median family income of $47,965, accounting for 11.9% and 16.7% of families, respectively.
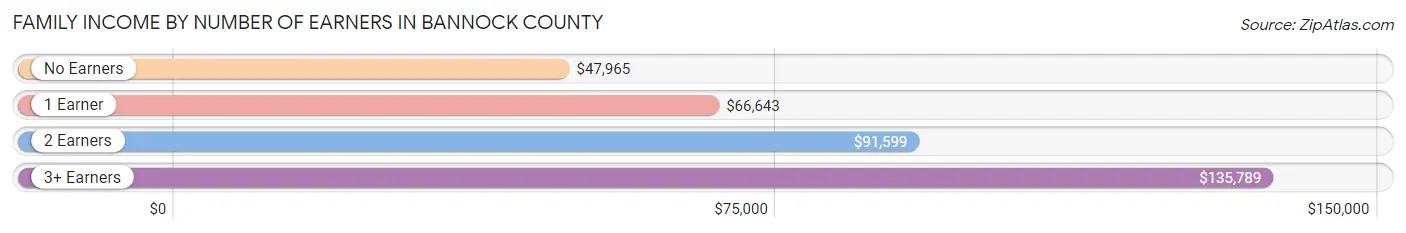
| Number of Earners | # Families | Median Income |
| No Earners | 3,429 (16.7%) | $47,965 |
| 1 Earner | 5,796 (28.2%) | $66,643 |
| 2 Earners | 8,878 (43.2%) | $91,599 |
| 3+ Earners | 2,454 (11.9%) | $135,789 |
| Total | 20,557 (100.0%) | $80,428 |
Household Income in Bannock County
Household Income Brackets in Bannock County
With 5,887 households falling in the category, the $50,000 to $74,999 income range is the most frequent in Bannock County, accounting for 18.0% of all households. In contrast, only 1,504 households (4.6%) fall into the $200,000+ income bracket, making it the least populous group.
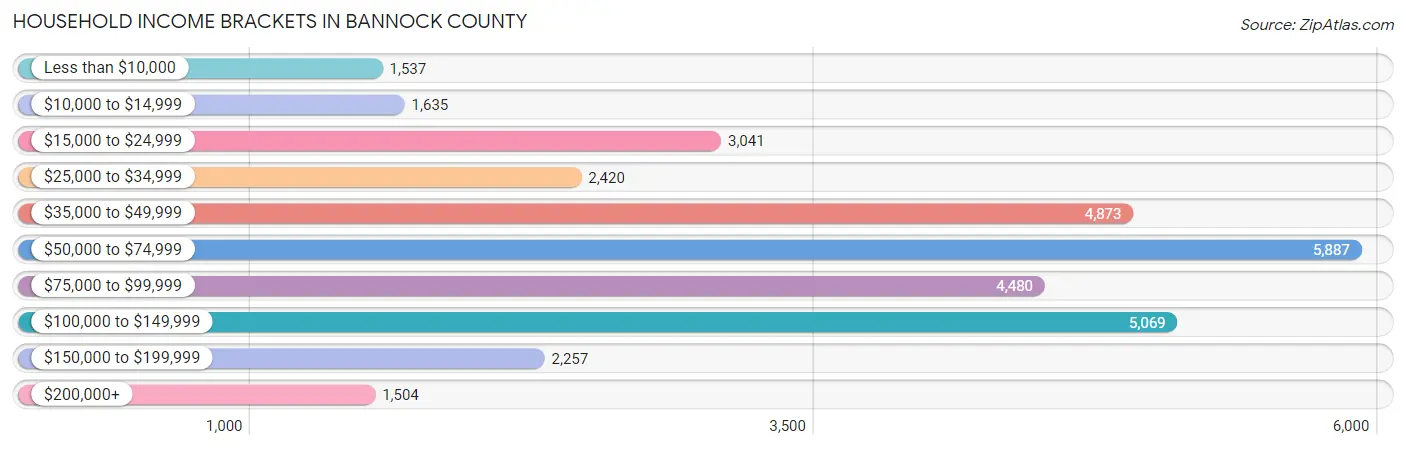
| Income Bracket | # Households | % Households |
| Less than $10,000 | 1,537 | 4.7% |
| $10,000 to $14,999 | 1,635 | 5.0% |
| $15,000 to $24,999 | 3,041 | 9.3% |
| $25,000 to $34,999 | 2,420 | 7.4% |
| $35,000 to $49,999 | 4,873 | 14.9% |
| $50,000 to $74,999 | 5,887 | 18.0% |
| $75,000 to $99,999 | 4,480 | 13.7% |
| $100,000 to $149,999 | 5,069 | 15.5% |
| $150,000 to $199,999 | 2,257 | 6.9% |
| $200,000+ | 1,504 | 4.6% |
Household Income by Householder Age in Bannock County
The median household income in Bannock County is $60,998, with the highest median household income of $75,562 found in the 45 to 64 years age bracket for the primary householder. A total of 10,961 households (33.5%) fall into this category. Meanwhile, the 15 to 24 years age bracket for the primary householder has the lowest median household income of $29,448, with 2,026 households (6.2%) in this group.
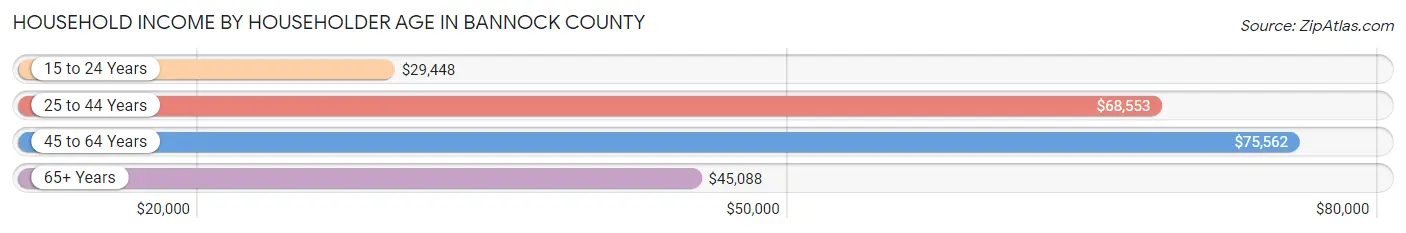
| Income Bracket | # Households | Median Income |
| 15 to 24 Years | 2,026 (6.2%) | $29,448 |
| 25 to 44 Years | 11,645 (35.6%) | $68,553 |
| 45 to 64 Years | 10,961 (33.5%) | $75,562 |
| 65+ Years | 8,072 (24.7%) | $45,088 |
| Total | 32,704 (100.0%) | $60,998 |
Poverty in Bannock County
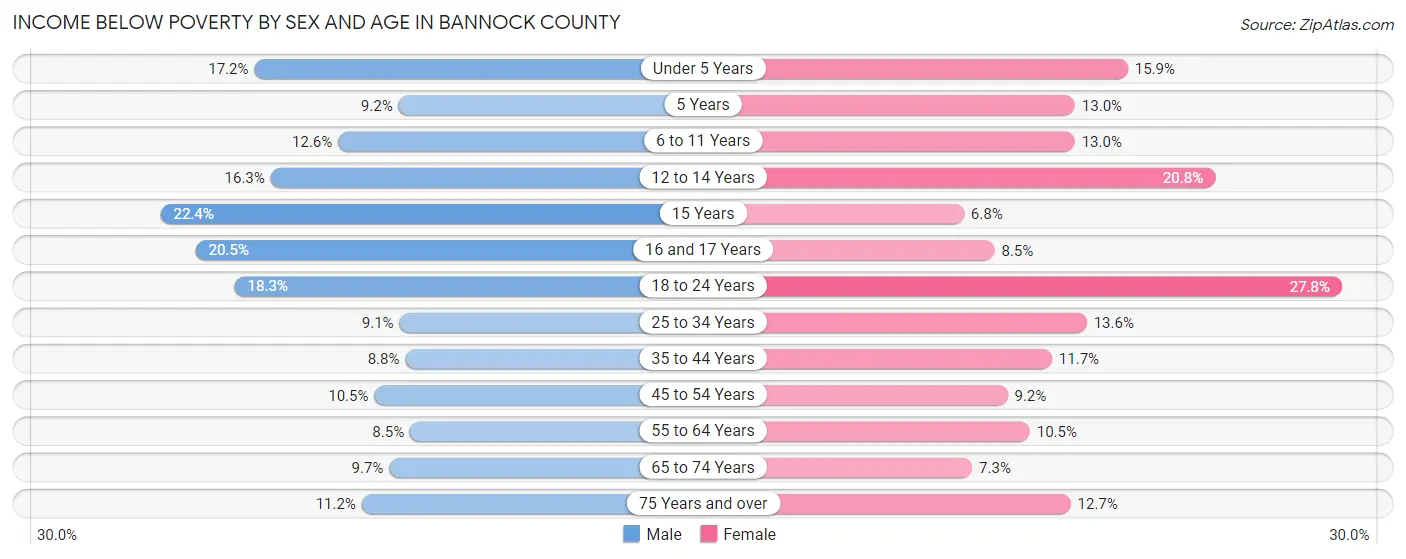
Income Below Poverty by Sex and Age in Bannock County
With 11.9% poverty level for males and 13.2% for females among the residents of Bannock County, 15 year old males and 18 to 24 year old females are the most vulnerable to poverty, with 157 males (22.4%) and 935 females (27.8%) in their respective age groups living below the poverty level.
| Age Bracket | Male | Female |
| Under 5 Years | 473 (17.2%) | 421 (15.9%) |
| 5 Years | 59 (9.2%) | 77 (13.0%) |
| 6 to 11 Years | 503 (12.6%) | 463 (13.0%) |
| 12 to 14 Years | 290 (16.3%) | 401 (20.8%) |
| 15 Years | 157 (22.4%) | 49 (6.8%) |
| 16 and 17 Years | 275 (20.5%) | 101 (8.5%) |
| 18 to 24 Years | 755 (18.3%) | 935 (27.8%) |
| 25 to 34 Years | 566 (9.1%) | 821 (13.6%) |
| 35 to 44 Years | 511 (8.8%) | 658 (11.7%) |
| 45 to 54 Years | 471 (10.5%) | 420 (9.2%) |
| 55 to 64 Years | 409 (8.5%) | 500 (10.5%) |
| 65 to 74 Years | 384 (9.7%) | 290 (7.3%) |
| 75 Years and over | 216 (11.2%) | 336 (12.7%) |
| Total | 5,069 (11.9%) | 5,472 (13.2%) |
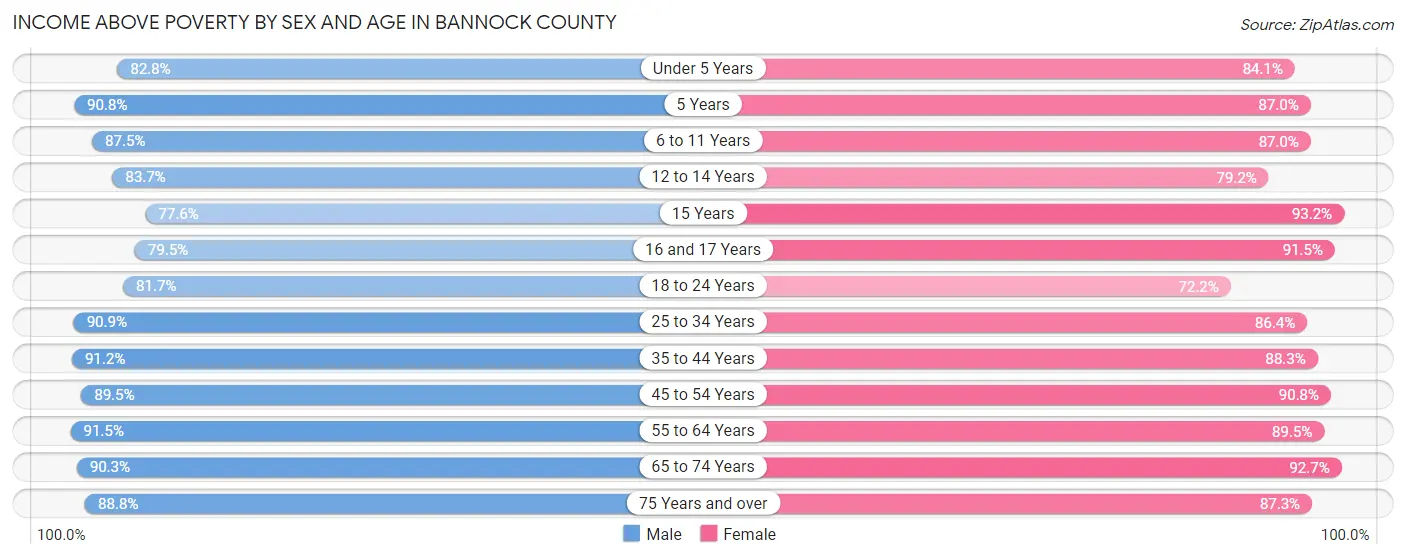
Income Above Poverty by Sex and Age in Bannock County
According to the poverty statistics in Bannock County, males aged 55 to 64 years and females aged 15 years are the age groups that are most secure financially, with 91.5% of males and 93.2% of females in these age groups living above the poverty line.
| Age Bracket | Male | Female |
| Under 5 Years | 2,276 (82.8%) | 2,221 (84.1%) |
| 5 Years | 584 (90.8%) | 516 (87.0%) |
| 6 to 11 Years | 3,504 (87.5%) | 3,107 (87.0%) |
| 12 to 14 Years | 1,489 (83.7%) | 1,529 (79.2%) |
| 15 Years | 543 (77.6%) | 672 (93.2%) |
| 16 and 17 Years | 1,068 (79.5%) | 1,087 (91.5%) |
| 18 to 24 Years | 3,370 (81.7%) | 2,423 (72.2%) |
| 25 to 34 Years | 5,633 (90.9%) | 5,200 (86.4%) |
| 35 to 44 Years | 5,298 (91.2%) | 4,965 (88.3%) |
| 45 to 54 Years | 4,002 (89.5%) | 4,131 (90.8%) |
| 55 to 64 Years | 4,378 (91.5%) | 4,276 (89.5%) |
| 65 to 74 Years | 3,575 (90.3%) | 3,703 (92.7%) |
| 75 Years and over | 1,708 (88.8%) | 2,302 (87.3%) |
| Total | 37,428 (88.1%) | 36,132 (86.9%) |
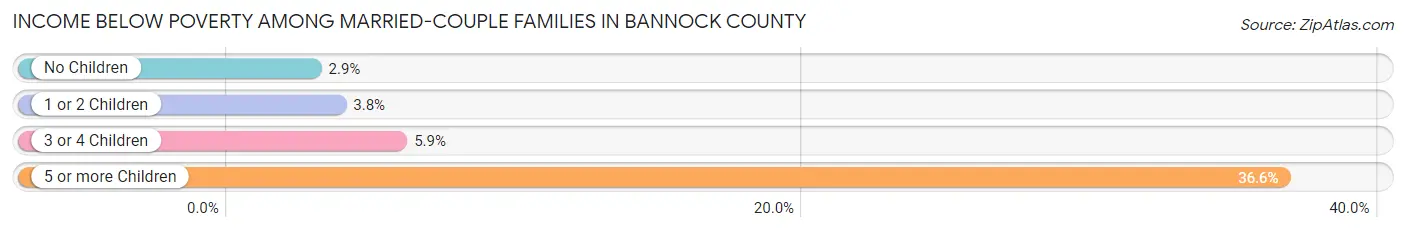
Income Below Poverty Among Married-Couple Families in Bannock County
The poverty statistics for married-couple families in Bannock County show that 4.3% or 707 of the total 16,455 families live below the poverty line. Families with 5 or more children have the highest poverty rate of 36.6%, comprising of 133 families. On the other hand, families with no children have the lowest poverty rate of 2.9%, which includes 272 families.
| Children | Above Poverty | Below Poverty |
| No Children | 9,082 (97.1%) | 272 (2.9%) |
| 1 or 2 Children | 4,311 (96.2%) | 169 (3.8%) |
| 3 or 4 Children | 2,125 (94.1%) | 133 (5.9%) |
| 5 or more Children | 230 (63.4%) | 133 (36.6%) |
| Total | 15,748 (95.7%) | 707 (4.3%) |
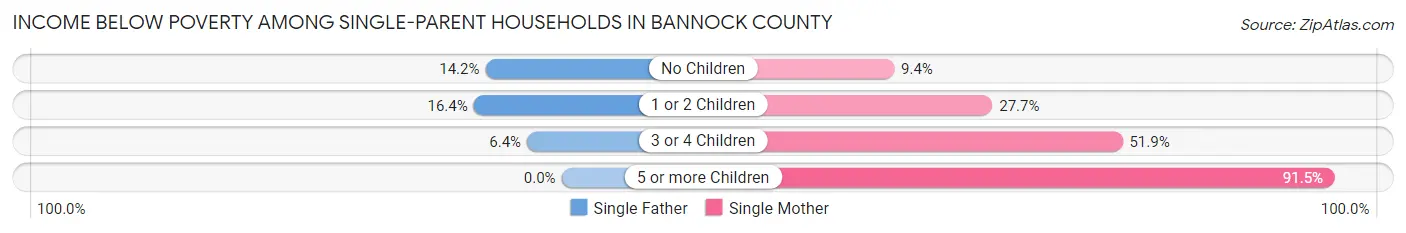
Income Below Poverty Among Single-Parent Households in Bannock County
According to the poverty data in Bannock County, 14.2% or 181 single-father households and 26.7% or 755 single-mother households are living below the poverty line. Among single-father households, those with 1 or 2 children have the highest poverty rate, with 103 households (16.4%) experiencing poverty. Likewise, among single-mother households, those with 5 or more children have the highest poverty rate, with 43 households (91.5%) falling below the poverty line.
| Children | Single Father | Single Mother |
| No Children | 67 (14.2%) | 85 (9.4%) |
| 1 or 2 Children | 103 (16.4%) | 398 (27.7%) |
| 3 or 4 Children | 11 (6.4%) | 229 (51.9%) |
| 5 or more Children | 0 (0.0%) | 43 (91.5%) |
| Total | 181 (14.2%) | 755 (26.7%) |
Income Below Poverty Among Married-Couple vs Single-Parent Households in Bannock County
The poverty data for Bannock County shows that 707 of the married-couple family households (4.3%) and 936 of the single-parent households (22.8%) are living below the poverty level. Within the married-couple family households, those with 5 or more children have the highest poverty rate, with 133 households (36.6%) falling below the poverty line. Among the single-parent households, those with 5 or more children have the highest poverty rate, with 43 household (91.5%) living below poverty.
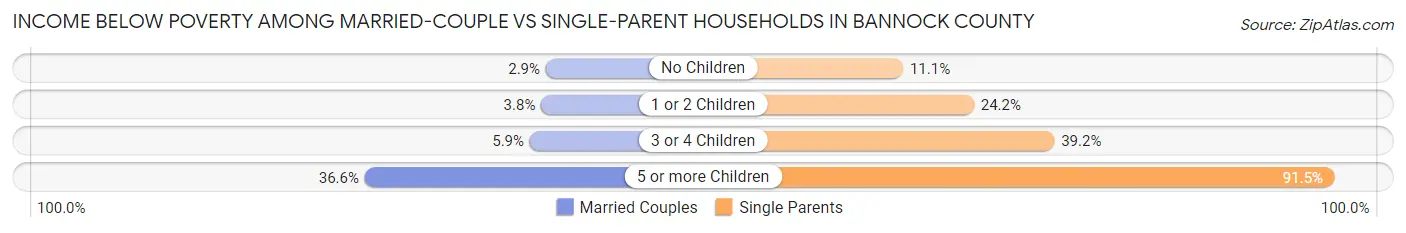
| Children | Married-Couple Families | Single-Parent Households |
| No Children | 272 (2.9%) | 152 (11.1%) |
| 1 or 2 Children | 169 (3.8%) | 501 (24.2%) |
| 3 or 4 Children | 133 (5.9%) | 240 (39.2%) |
| 5 or more Children | 133 (36.6%) | 43 (91.5%) |
| Total | 707 (4.3%) | 936 (22.8%) |
Employment Characteristics in Bannock County
Employment by Class of Employer in Bannock County
Among the 38,777 employed individuals in Bannock County, private company employees (25,568 | 65.9%), state government employees (3,593 | 9.3%), and local government employees (2,621 | 6.8%) make up the most common classes of employment.
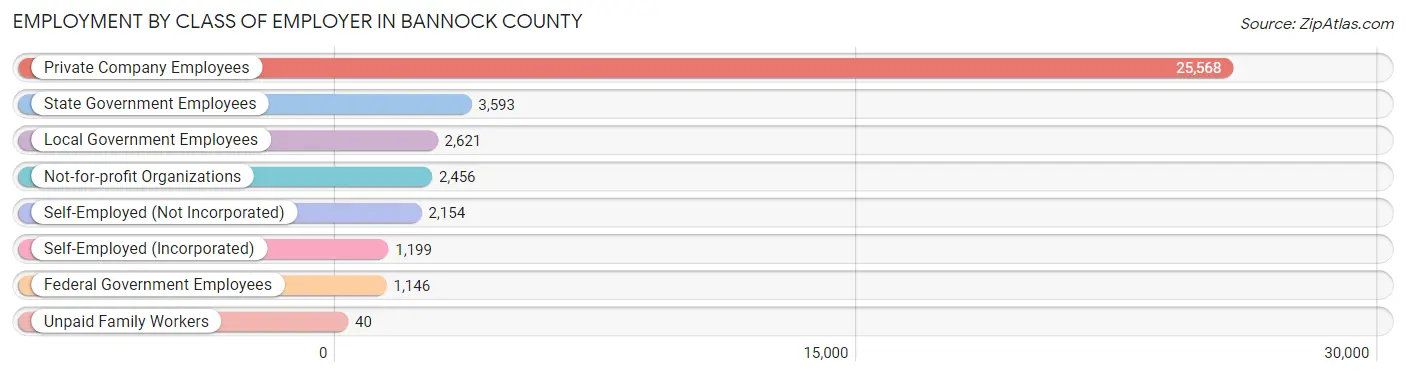
| Employer Class | # Employees | % Employees |
| Private Company Employees | 25,568 | 65.9% |
| Self-Employed (Incorporated) | 1,199 | 3.1% |
| Self-Employed (Not Incorporated) | 2,154 | 5.6% |
| Not-for-profit Organizations | 2,456 | 6.3% |
| Local Government Employees | 2,621 | 6.8% |
| State Government Employees | 3,593 | 9.3% |
| Federal Government Employees | 1,146 | 3.0% |
| Unpaid Family Workers | 40 | 0.1% |
| Total | 38,777 | 100.0% |
Employment Status by Age in Bannock County
According to the labor force statistics for Bannock County, out of the total population over 16 years of age (67,654), 61.5% or 41,607 individuals are in the labor force, with 5.1% or 2,122 of them unemployed. The age group with the highest labor force participation rate is 30 to 34 years, with 81.4% or 4,924 individuals in the labor force. Within the labor force, the 16 to 19 years age range has the highest percentage of unemployed individuals, with 15.9% or 428 of them being unemployed.
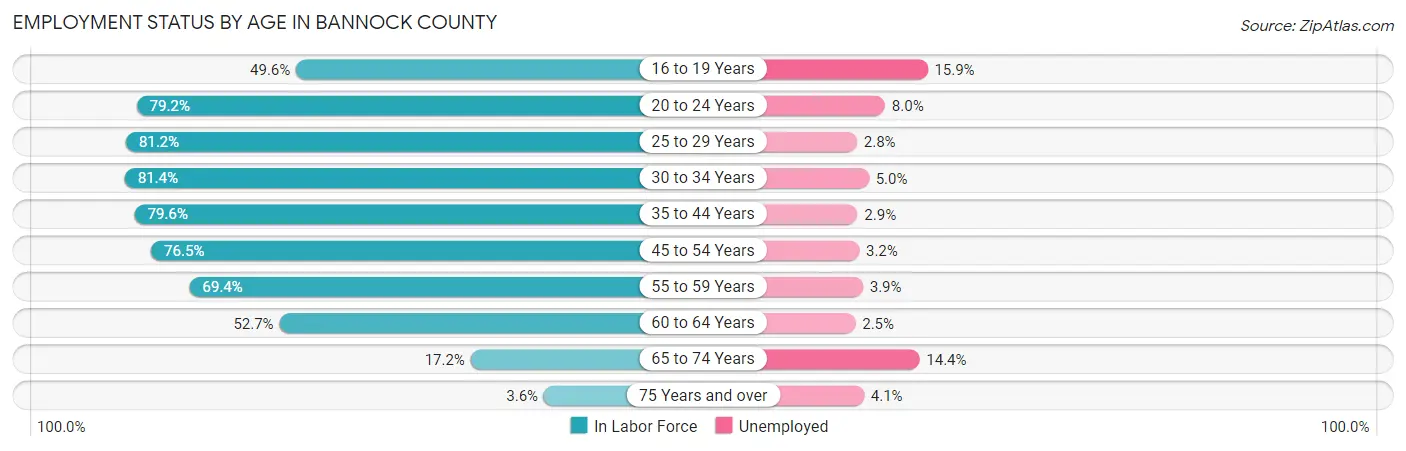
| Age Bracket | In Labor Force | Unemployed |
| 16 to 19 Years | 2,690 (49.6%) | 428 (15.9%) |
| 20 to 24 Years | 5,011 (79.2%) | 401 (8.0%) |
| 25 to 29 Years | 5,281 (81.2%) | 148 (2.8%) |
| 30 to 34 Years | 4,924 (81.4%) | 246 (5.0%) |
| 35 to 44 Years | 9,294 (79.6%) | 270 (2.9%) |
| 45 to 54 Years | 7,033 (76.5%) | 225 (3.2%) |
| 55 to 59 Years | 3,145 (69.4%) | 123 (3.9%) |
| 60 to 64 Years | 2,695 (52.7%) | 67 (2.5%) |
| 65 to 74 Years | 1,382 (17.2%) | 199 (14.4%) |
| 75 Years and over | 173 (3.6%) | 7 (4.1%) |
| Total | 41,607 (61.5%) | 2,122 (5.1%) |
Employment Status by Educational Attainment in Bannock County
According to labor force statistics for Bannock County, 75.2% of individuals (32,387) out of the total population between 25 and 64 years of age (43,068) are in the labor force, with 3.3% or 1,069 of them being unemployed. The group with the highest labor force participation rate are those with the educational attainment of bachelor's degree or higher, with 88.5% or 11,578 individuals in the labor force. Within the labor force, individuals with less than high school education have the highest percentage of unemployment, with 8.7% or 117 of them being unemployed.
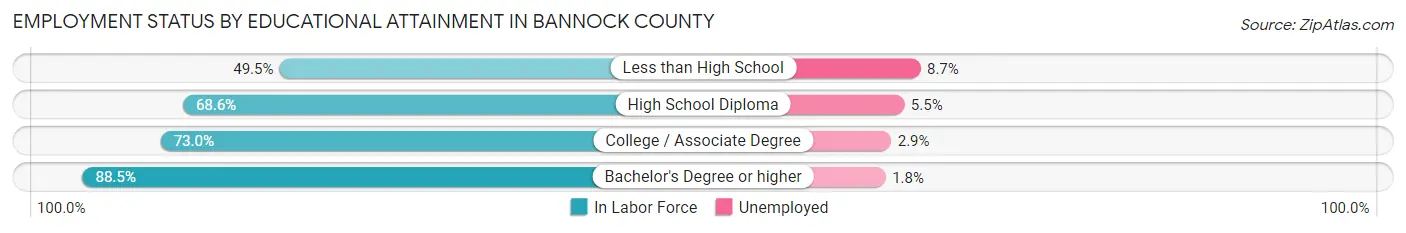
| Educational Attainment | In Labor Force | Unemployed |
| Less than High School | 1,350 (49.5%) | 237 (8.7%) |
| High School Diploma | 7,169 (68.6%) | 575 (5.5%) |
| College / Associate Degree | 12,270 (73.0%) | 487 (2.9%) |
| Bachelor's Degree or higher | 11,578 (88.5%) | 235 (1.8%) |
| Total | 32,387 (75.2%) | 1,421 (3.3%) |
Employment Occupations by Sex in Bannock County
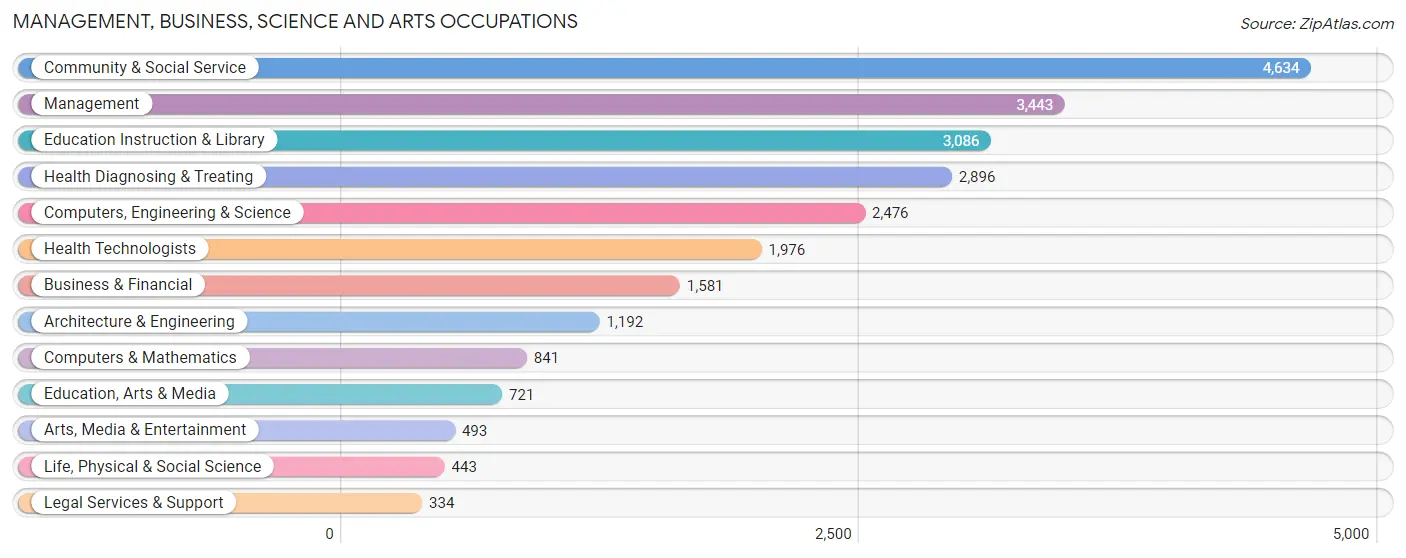
Management, Business, Science and Arts Occupations
The most common Management, Business, Science and Arts occupations in Bannock County are Community & Social Service (4,634 | 11.7%), Management (3,443 | 8.7%), Education Instruction & Library (3,086 | 7.8%), Health Diagnosing & Treating (2,896 | 7.3%), and Computers, Engineering & Science (2,476 | 6.3%).
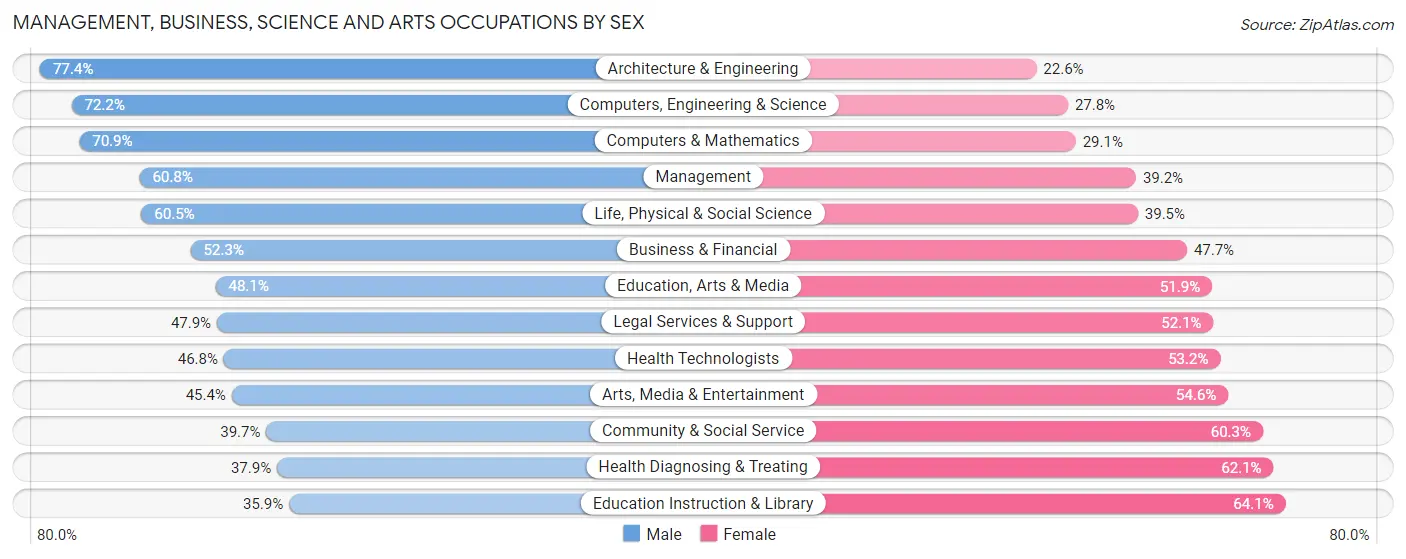
Management, Business, Science and Arts Occupations by Sex
Within the Management, Business, Science and Arts occupations in Bannock County, the most male-oriented occupations are Architecture & Engineering (77.4%), Computers, Engineering & Science (72.2%), and Computers & Mathematics (70.9%), while the most female-oriented occupations are Education Instruction & Library (64.1%), Health Diagnosing & Treating (62.1%), and Community & Social Service (60.3%).
| Occupation | Male | Female |
| Management | 2,094 (60.8%) | 1,349 (39.2%) |
| Business & Financial | 827 (52.3%) | 754 (47.7%) |
| Computers, Engineering & Science | 1,787 (72.2%) | 689 (27.8%) |
| Computers & Mathematics | 596 (70.9%) | 245 (29.1%) |
| Architecture & Engineering | 923 (77.4%) | 269 (22.6%) |
| Life, Physical & Social Science | 268 (60.5%) | 175 (39.5%) |
| Community & Social Service | 1,838 (39.7%) | 2,796 (60.3%) |
| Education, Arts & Media | 347 (48.1%) | 374 (51.9%) |
| Legal Services & Support | 160 (47.9%) | 174 (52.1%) |
| Education Instruction & Library | 1,107 (35.9%) | 1,979 (64.1%) |
| Arts, Media & Entertainment | 224 (45.4%) | 269 (54.6%) |
| Health Diagnosing & Treating | 1,097 (37.9%) | 1,799 (62.1%) |
| Health Technologists | 924 (46.8%) | 1,052 (53.2%) |
| Total (Category) | 7,643 (50.8%) | 7,387 (49.1%) |
| Total (Overall) | 20,843 (52.8%) | 18,621 (47.2%) |
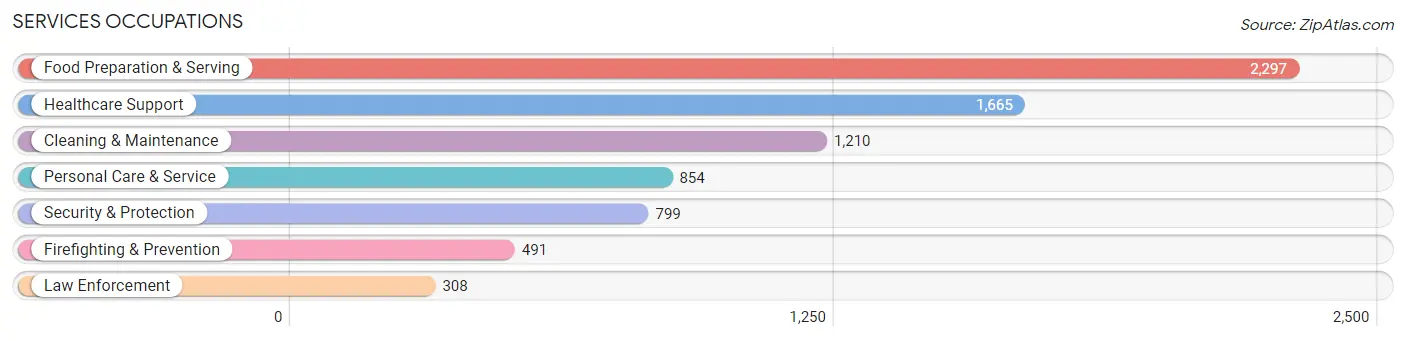
Services Occupations
The most common Services occupations in Bannock County are Food Preparation & Serving (2,297 | 5.8%), Healthcare Support (1,665 | 4.2%), Cleaning & Maintenance (1,210 | 3.1%), Personal Care & Service (854 | 2.2%), and Security & Protection (799 | 2.0%).
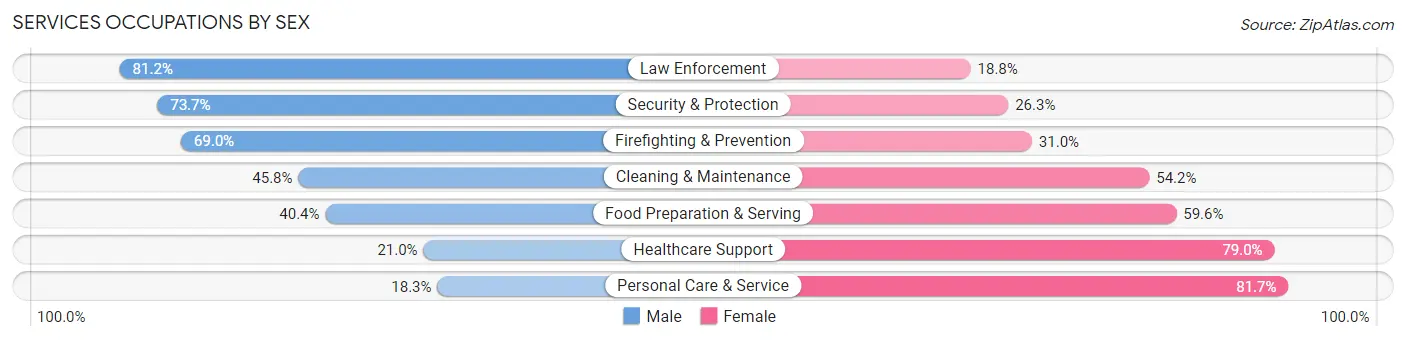
Services Occupations by Sex
Within the Services occupations in Bannock County, the most male-oriented occupations are Law Enforcement (81.2%), Security & Protection (73.7%), and Firefighting & Prevention (69.0%), while the most female-oriented occupations are Personal Care & Service (81.7%), Healthcare Support (79.0%), and Food Preparation & Serving (59.6%).
| Occupation | Male | Female |
| Healthcare Support | 350 (21.0%) | 1,315 (79.0%) |
| Security & Protection | 589 (73.7%) | 210 (26.3%) |
| Firefighting & Prevention | 339 (69.0%) | 152 (31.0%) |
| Law Enforcement | 250 (81.2%) | 58 (18.8%) |
| Food Preparation & Serving | 929 (40.4%) | 1,368 (59.6%) |
| Cleaning & Maintenance | 554 (45.8%) | 656 (54.2%) |
| Personal Care & Service | 156 (18.3%) | 698 (81.7%) |
| Total (Category) | 2,578 (37.8%) | 4,247 (62.2%) |
| Total (Overall) | 20,843 (52.8%) | 18,621 (47.2%) |
Sales and Office Occupations
The most common Sales and Office occupations in Bannock County are Office & Administration (4,684 | 11.9%), and Sales & Related (4,010 | 10.2%).

Sales and Office Occupations by Sex
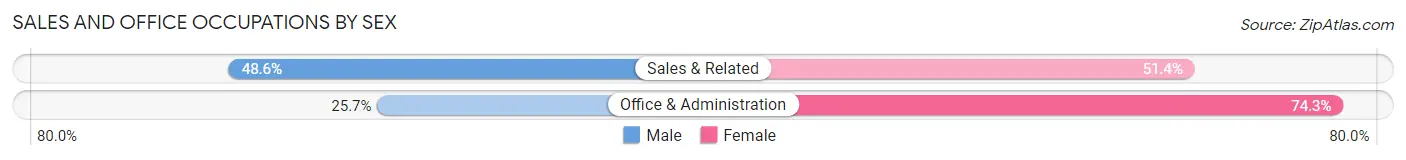
| Occupation | Male | Female |
| Sales & Related | 1,948 (48.6%) | 2,062 (51.4%) |
| Office & Administration | 1,205 (25.7%) | 3,479 (74.3%) |
| Total (Category) | 3,153 (36.3%) | 5,541 (63.7%) |
| Total (Overall) | 20,843 (52.8%) | 18,621 (47.2%) |
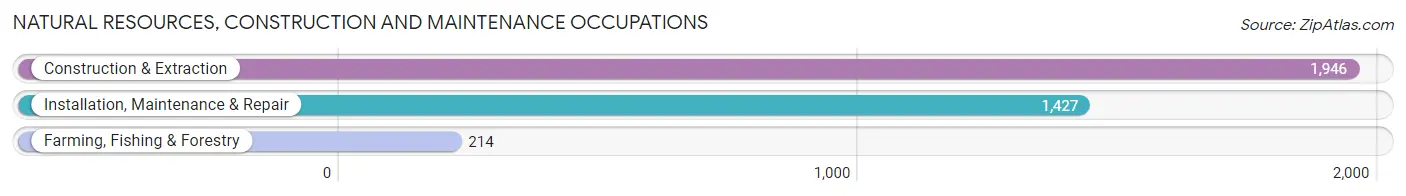
Natural Resources, Construction and Maintenance Occupations
The most common Natural Resources, Construction and Maintenance occupations in Bannock County are Construction & Extraction (1,946 | 4.9%), Installation, Maintenance & Repair (1,427 | 3.6%), and Farming, Fishing & Forestry (214 | 0.5%).
Natural Resources, Construction and Maintenance Occupations by Sex
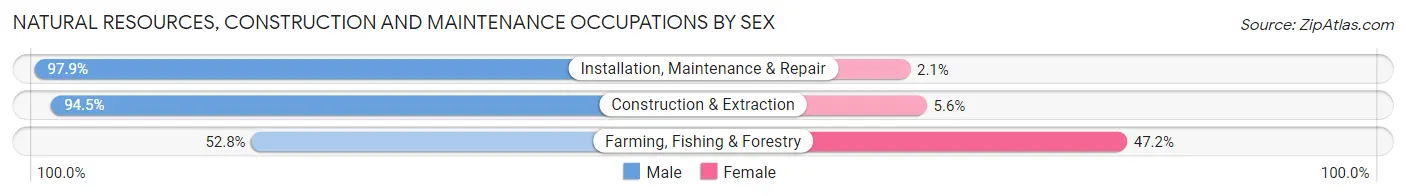
| Occupation | Male | Female |
| Farming, Fishing & Forestry | 113 (52.8%) | 101 (47.2%) |
| Construction & Extraction | 1,838 (94.5%) | 108 (5.6%) |
| Installation, Maintenance & Repair | 1,397 (97.9%) | 30 (2.1%) |
| Total (Category) | 3,348 (93.3%) | 239 (6.7%) |
| Total (Overall) | 20,843 (52.8%) | 18,621 (47.2%) |
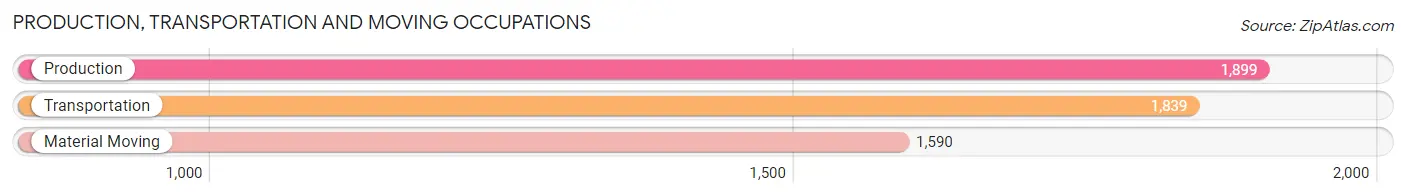
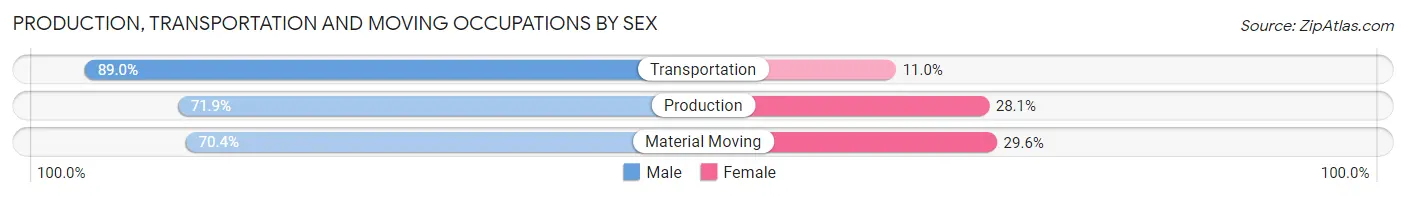
Production, Transportation and Moving Occupations
The most common Production, Transportation and Moving occupations in Bannock County are Production (1,899 | 4.8%), Transportation (1,839 | 4.7%), and Material Moving (1,590 | 4.0%).
Production, Transportation and Moving Occupations by Sex
| Occupation | Male | Female |
| Production | 1,365 (71.9%) | 534 (28.1%) |
| Transportation | 1,636 (89.0%) | 203 (11.0%) |
| Material Moving | 1,120 (70.4%) | 470 (29.6%) |
| Total (Category) | 4,121 (77.3%) | 1,207 (22.7%) |
| Total (Overall) | 20,843 (52.8%) | 18,621 (47.2%) |
Employment Industries by Sex in Bannock County
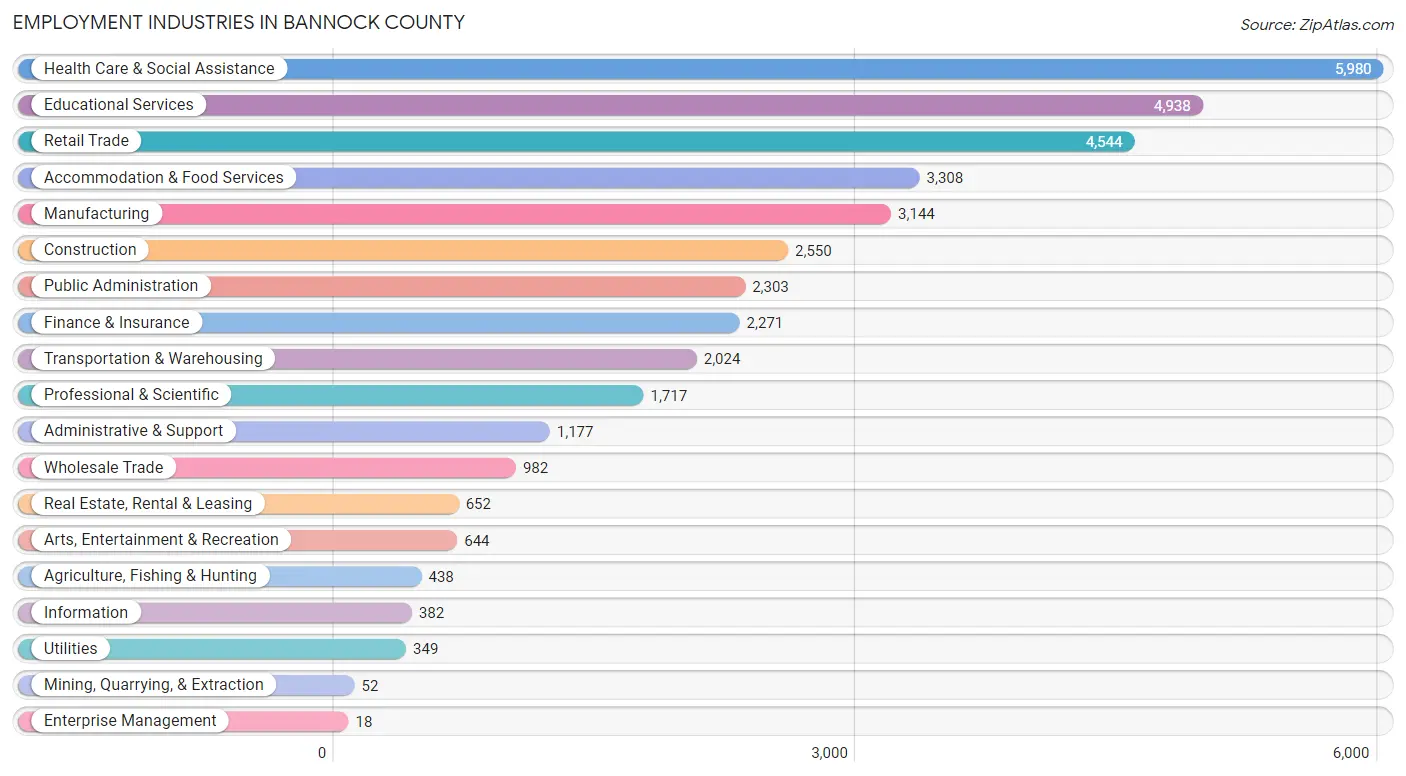
Employment Industries in Bannock County
The major employment industries in Bannock County include Health Care & Social Assistance (5,980 | 15.1%), Educational Services (4,938 | 12.5%), Retail Trade (4,544 | 11.5%), Accommodation & Food Services (3,308 | 8.4%), and Manufacturing (3,144 | 8.0%).
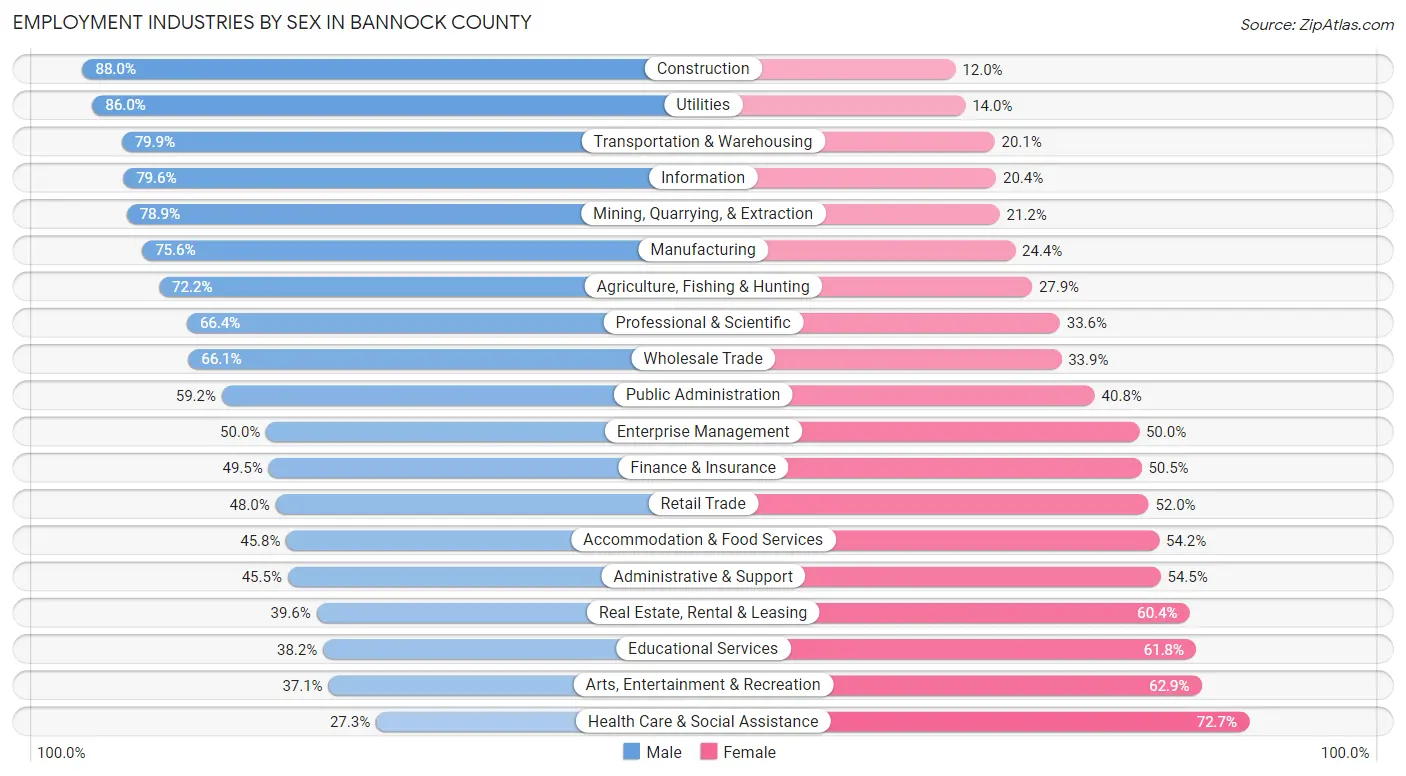
Employment Industries by Sex in Bannock County
The Bannock County industries that see more men than women are Construction (88.0%), Utilities (86.0%), and Transportation & Warehousing (79.9%), whereas the industries that tend to have a higher number of women are Health Care & Social Assistance (72.7%), Arts, Entertainment & Recreation (62.9%), and Educational Services (61.8%).
| Industry | Male | Female |
| Agriculture, Fishing & Hunting | 316 (72.2%) | 122 (27.9%) |
| Mining, Quarrying, & Extraction | 41 (78.8%) | 11 (21.1%) |
| Construction | 2,244 (88.0%) | 306 (12.0%) |
| Manufacturing | 2,378 (75.6%) | 766 (24.4%) |
| Wholesale Trade | 649 (66.1%) | 333 (33.9%) |
| Retail Trade | 2,183 (48.0%) | 2,361 (52.0%) |
| Transportation & Warehousing | 1,617 (79.9%) | 407 (20.1%) |
| Utilities | 300 (86.0%) | 49 (14.0%) |
| Information | 304 (79.6%) | 78 (20.4%) |
| Finance & Insurance | 1,124 (49.5%) | 1,147 (50.5%) |
| Real Estate, Rental & Leasing | 258 (39.6%) | 394 (60.4%) |
| Professional & Scientific | 1,140 (66.4%) | 577 (33.6%) |
| Enterprise Management | 9 (50.0%) | 9 (50.0%) |
| Administrative & Support | 536 (45.5%) | 641 (54.5%) |
| Educational Services | 1,888 (38.2%) | 3,050 (61.8%) |
| Health Care & Social Assistance | 1,631 (27.3%) | 4,349 (72.7%) |
| Arts, Entertainment & Recreation | 239 (37.1%) | 405 (62.9%) |
| Accommodation & Food Services | 1,516 (45.8%) | 1,792 (54.2%) |
| Public Administration | 1,363 (59.2%) | 940 (40.8%) |
| Total | 20,843 (52.8%) | 18,621 (47.2%) |
Education in Bannock County
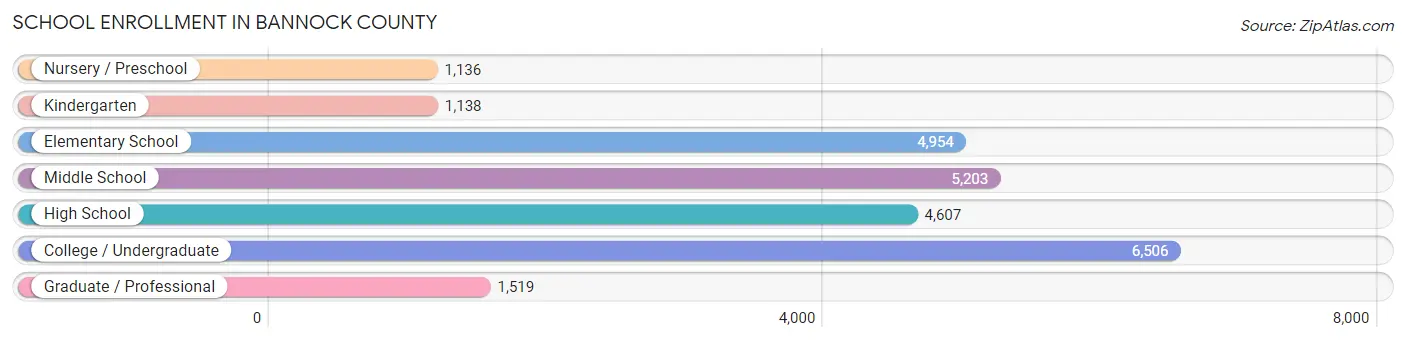
School Enrollment in Bannock County
The most common levels of schooling among the 25,063 students in Bannock County are college / undergraduate (6,506 | 26.0%), middle school (5,203 | 20.8%), and elementary school (4,954 | 19.8%).
| School Level | # Students | % Students |
| Nursery / Preschool | 1,136 | 4.5% |
| Kindergarten | 1,138 | 4.5% |
| Elementary School | 4,954 | 19.8% |
| Middle School | 5,203 | 20.8% |
| High School | 4,607 | 18.4% |
| College / Undergraduate | 6,506 | 26.0% |
| Graduate / Professional | 1,519 | 6.1% |
| Total | 25,063 | 100.0% |
School Enrollment by Age by Funding Source in Bannock County
Out of a total of 25,063 students who are enrolled in schools in Bannock County, 2,231 (8.9%) attend a private institution, while the remaining 22,832 (91.1%) are enrolled in public schools. The age group of 3 to 4 year olds has the highest likelihood of being enrolled in private schools, with 329 (49.8% in the age bracket) enrolled. Conversely, the age group of 15 to 17 year olds has the lowest likelihood of being enrolled in a private school, with 3,623 (97.4% in the age bracket) attending a public institution.
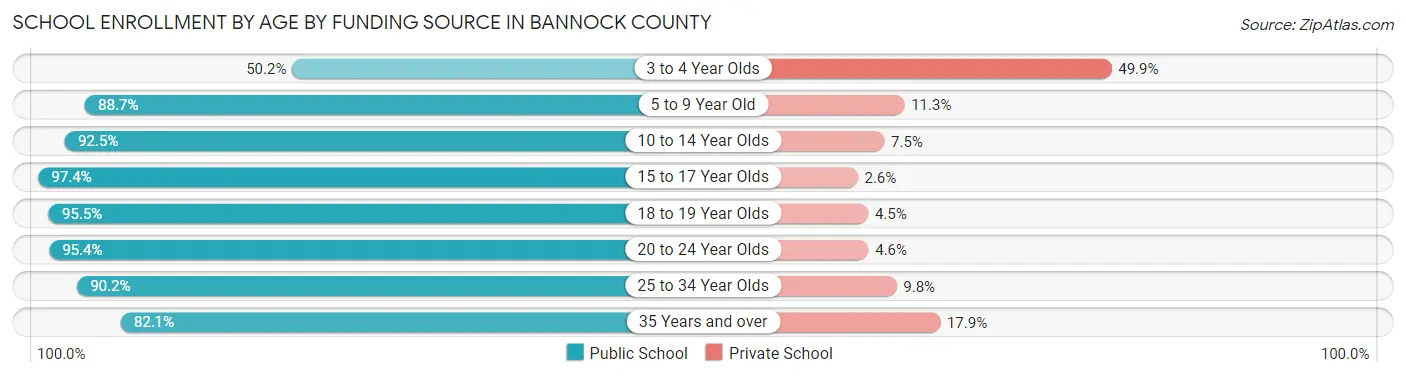
| Age Bracket | Public School | Private School |
| 3 to 4 Year Olds | 331 (50.1%) | 329 (49.8%) |
| 5 to 9 Year Old | 5,253 (88.7%) | 668 (11.3%) |
| 10 to 14 Year Olds | 5,819 (92.5%) | 474 (7.5%) |
| 15 to 17 Year Olds | 3,623 (97.4%) | 96 (2.6%) |
| 18 to 19 Year Olds | 1,856 (95.5%) | 88 (4.5%) |
| 20 to 24 Year Olds | 2,950 (95.4%) | 142 (4.6%) |
| 25 to 34 Year Olds | 1,986 (90.2%) | 216 (9.8%) |
| 35 Years and over | 1,011 (82.1%) | 221 (17.9%) |
| Total | 22,832 (91.1%) | 2,231 (8.9%) |
Educational Attainment by Field of Study in Bannock County
Science & technology (2,720 | 15.4%), education (2,609 | 14.8%), business (2,414 | 13.7%), arts & humanities (1,343 | 7.6%), and engineering (1,276 | 7.2%) are the most common fields of study among 17,645 individuals in Bannock County who have obtained a bachelor's degree or higher.
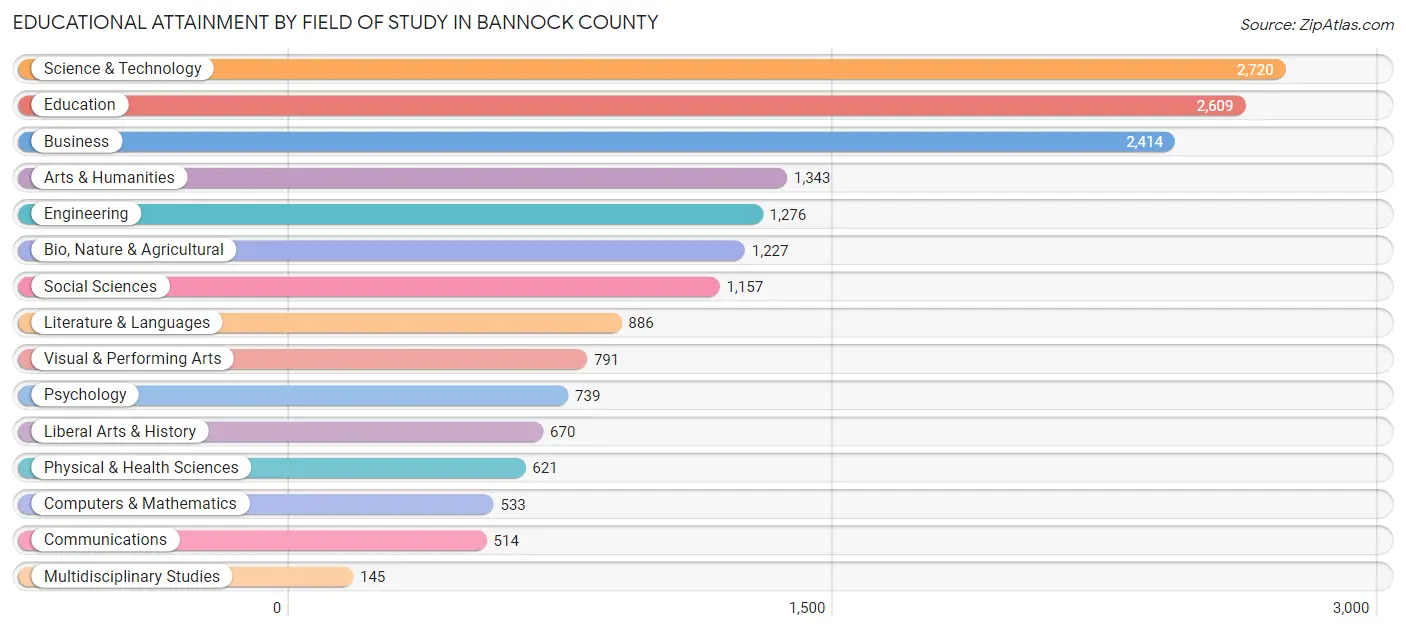
| Field of Study | # Graduates | % Graduates |
| Computers & Mathematics | 533 | 3.0% |
| Bio, Nature & Agricultural | 1,227 | 7.0% |
| Physical & Health Sciences | 621 | 3.5% |
| Psychology | 739 | 4.2% |
| Social Sciences | 1,157 | 6.6% |
| Engineering | 1,276 | 7.2% |
| Multidisciplinary Studies | 145 | 0.8% |
| Science & Technology | 2,720 | 15.4% |
| Business | 2,414 | 13.7% |
| Education | 2,609 | 14.8% |
| Literature & Languages | 886 | 5.0% |
| Liberal Arts & History | 670 | 3.8% |
| Visual & Performing Arts | 791 | 4.5% |
| Communications | 514 | 2.9% |
| Arts & Humanities | 1,343 | 7.6% |
| Total | 17,645 | 100.0% |
Transportation & Commute in Bannock County
Vehicle Availability by Sex in Bannock County
The most prevalent vehicle ownership categories in Bannock County are males with 2 vehicles (7,323, accounting for 36.1%) and females with 2 vehicles (6,585, making up 41.4%).
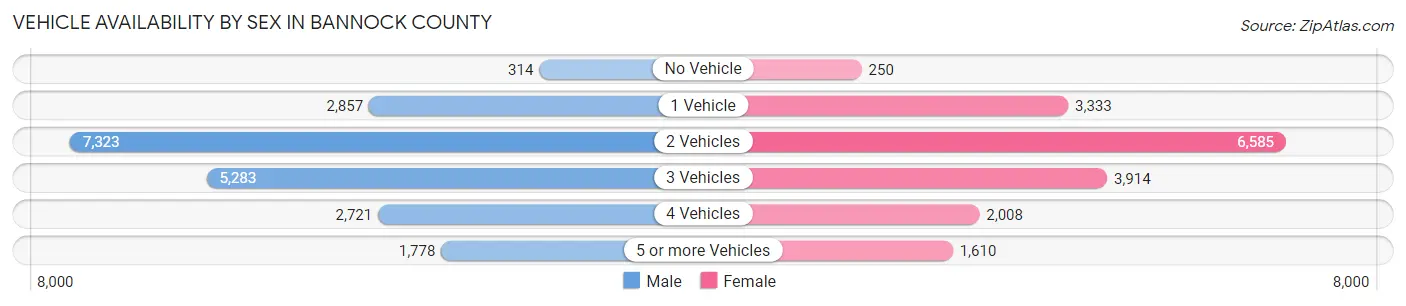
| Vehicles Available | Male | Female |
| No Vehicle | 314 (1.5%) | 250 (1.4%) |
| 1 Vehicle | 2,857 (14.1%) | 3,333 (18.8%) |
| 2 Vehicles | 7,323 (36.1%) | 6,585 (37.2%) |
| 3 Vehicles | 5,283 (26.1%) | 3,914 (22.1%) |
| 4 Vehicles | 2,721 (13.4%) | 2,008 (11.3%) |
| 5 or more Vehicles | 1,778 (8.8%) | 1,610 (9.1%) |
| Total | 20,276 (100.0%) | 17,700 (100.0%) |
Commute Time in Bannock County
The most frequently occuring commute durations in Bannock County are 10 to 14 minutes (9,755 commuters, 27.6%), 15 to 19 minutes (7,542 commuters, 21.3%), and 5 to 9 minutes (7,518 commuters, 21.3%).
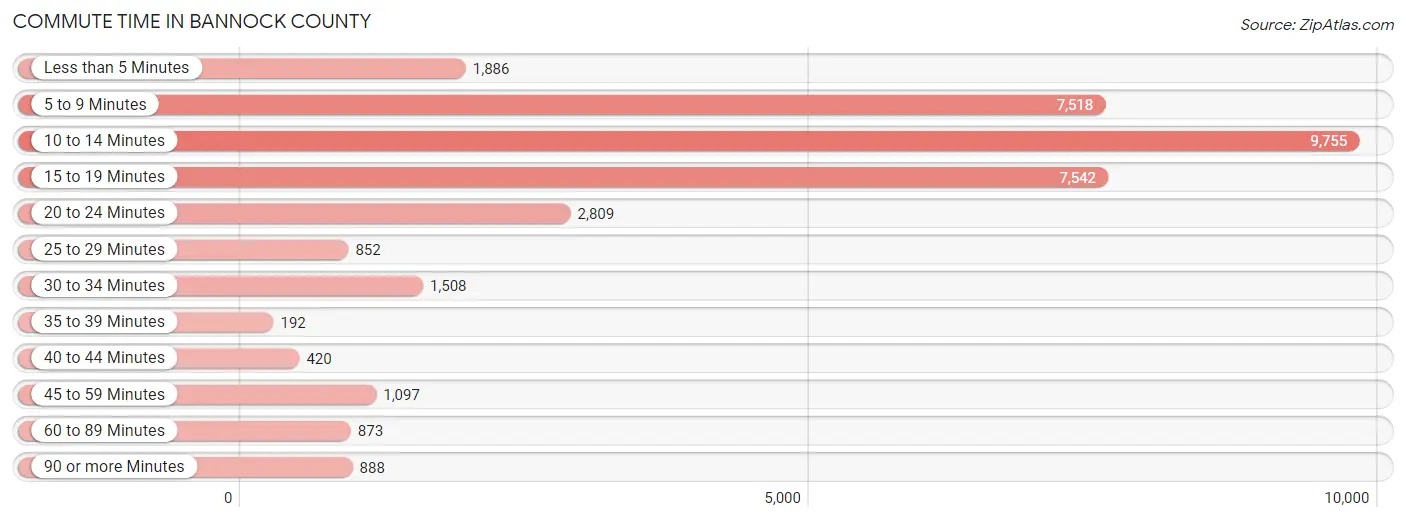
| Commute Time | # Commuters | % Commuters |
| Less than 5 Minutes | 1,886 | 5.3% |
| 5 to 9 Minutes | 7,518 | 21.3% |
| 10 to 14 Minutes | 9,755 | 27.6% |
| 15 to 19 Minutes | 7,542 | 21.3% |
| 20 to 24 Minutes | 2,809 | 8.0% |
| 25 to 29 Minutes | 852 | 2.4% |
| 30 to 34 Minutes | 1,508 | 4.3% |
| 35 to 39 Minutes | 192 | 0.5% |
| 40 to 44 Minutes | 420 | 1.2% |
| 45 to 59 Minutes | 1,097 | 3.1% |
| 60 to 89 Minutes | 873 | 2.5% |
| 90 or more Minutes | 888 | 2.5% |
Commute Time by Sex in Bannock County
The most common commute times in Bannock County are 10 to 14 minutes (4,959 commuters, 26.1%) for males and 10 to 14 minutes (4,796 commuters, 29.3%) for females.
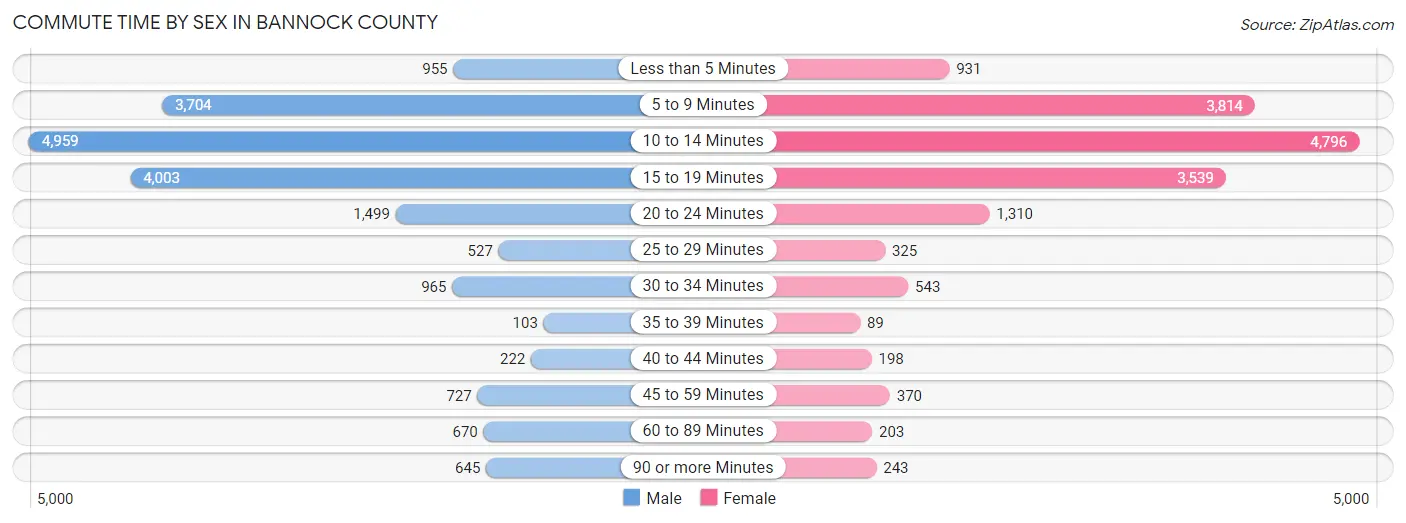
| Commute Time | Male | Female |
| Less than 5 Minutes | 955 (5.0%) | 931 (5.7%) |
| 5 to 9 Minutes | 3,704 (19.5%) | 3,814 (23.3%) |
| 10 to 14 Minutes | 4,959 (26.1%) | 4,796 (29.3%) |
| 15 to 19 Minutes | 4,003 (21.1%) | 3,539 (21.6%) |
| 20 to 24 Minutes | 1,499 (7.9%) | 1,310 (8.0%) |
| 25 to 29 Minutes | 527 (2.8%) | 325 (2.0%) |
| 30 to 34 Minutes | 965 (5.1%) | 543 (3.3%) |
| 35 to 39 Minutes | 103 (0.5%) | 89 (0.5%) |
| 40 to 44 Minutes | 222 (1.2%) | 198 (1.2%) |
| 45 to 59 Minutes | 727 (3.8%) | 370 (2.3%) |
| 60 to 89 Minutes | 670 (3.5%) | 203 (1.2%) |
| 90 or more Minutes | 645 (3.4%) | 243 (1.5%) |
Time of Departure to Work by Sex in Bannock County
The most frequent times of departure to work in Bannock County are 7:30 AM to 7:59 AM (3,019, 15.9%) for males and 7:30 AM to 7:59 AM (2,930, 17.9%) for females.
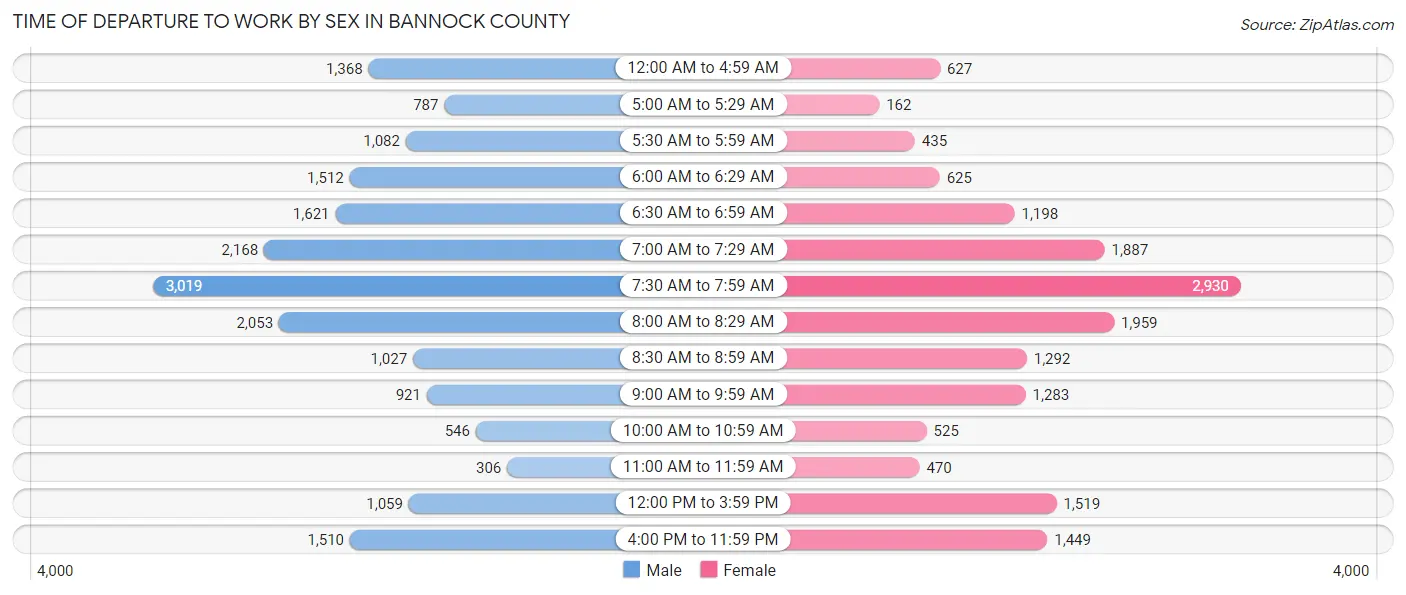
| Time of Departure | Male | Female |
| 12:00 AM to 4:59 AM | 1,368 (7.2%) | 627 (3.8%) |
| 5:00 AM to 5:29 AM | 787 (4.2%) | 162 (1.0%) |
| 5:30 AM to 5:59 AM | 1,082 (5.7%) | 435 (2.7%) |
| 6:00 AM to 6:29 AM | 1,512 (8.0%) | 625 (3.8%) |
| 6:30 AM to 6:59 AM | 1,621 (8.5%) | 1,198 (7.3%) |
| 7:00 AM to 7:29 AM | 2,168 (11.4%) | 1,887 (11.5%) |
| 7:30 AM to 7:59 AM | 3,019 (15.9%) | 2,930 (17.9%) |
| 8:00 AM to 8:29 AM | 2,053 (10.8%) | 1,959 (12.0%) |
| 8:30 AM to 8:59 AM | 1,027 (5.4%) | 1,292 (7.9%) |
| 9:00 AM to 9:59 AM | 921 (4.9%) | 1,283 (7.8%) |
| 10:00 AM to 10:59 AM | 546 (2.9%) | 525 (3.2%) |
| 11:00 AM to 11:59 AM | 306 (1.6%) | 470 (2.9%) |
| 12:00 PM to 3:59 PM | 1,059 (5.6%) | 1,519 (9.3%) |
| 4:00 PM to 11:59 PM | 1,510 (8.0%) | 1,449 (8.9%) |
| Total | 18,979 (100.0%) | 16,361 (100.0%) |
Housing Occupancy in Bannock County
Occupancy by Ownership in Bannock County
Of the total 32,704 dwellings in Bannock County, owner-occupied units account for 22,320 (68.2%), while renter-occupied units make up 10,384 (31.8%).
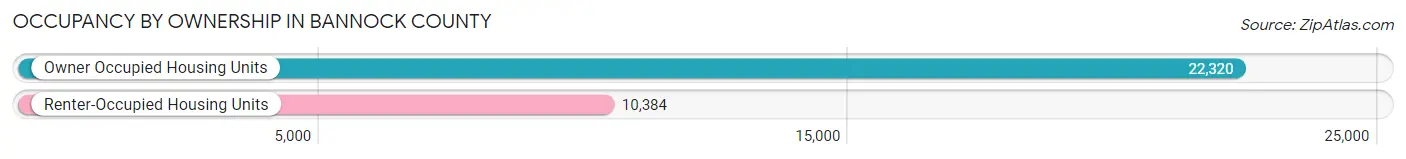
| Occupancy | # Housing Units | % Housing Units |
| Owner Occupied Housing Units | 22,320 | 68.2% |
| Renter-Occupied Housing Units | 10,384 | 31.8% |
| Total Occupied Housing Units | 32,704 | 100.0% |
Occupancy by Household Size in Bannock County
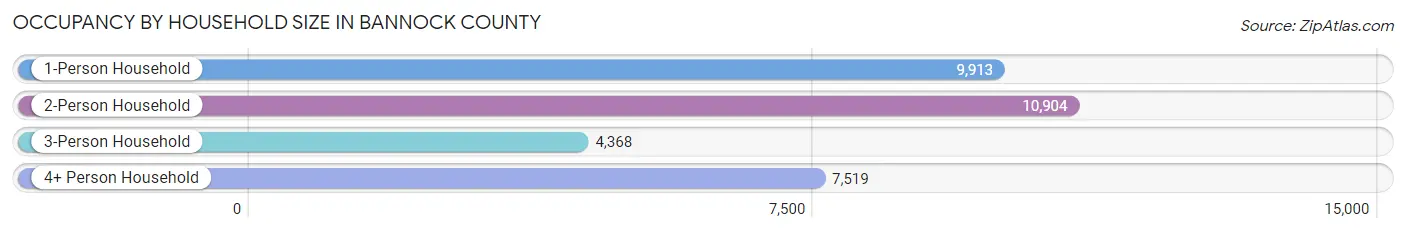
| Household Size | # Housing Units | % Housing Units |
| 1-Person Household | 9,913 | 30.3% |
| 2-Person Household | 10,904 | 33.3% |
| 3-Person Household | 4,368 | 13.4% |
| 4+ Person Household | 7,519 | 23.0% |
| Total Housing Units | 32,704 | 100.0% |
Occupancy by Ownership by Household Size in Bannock County
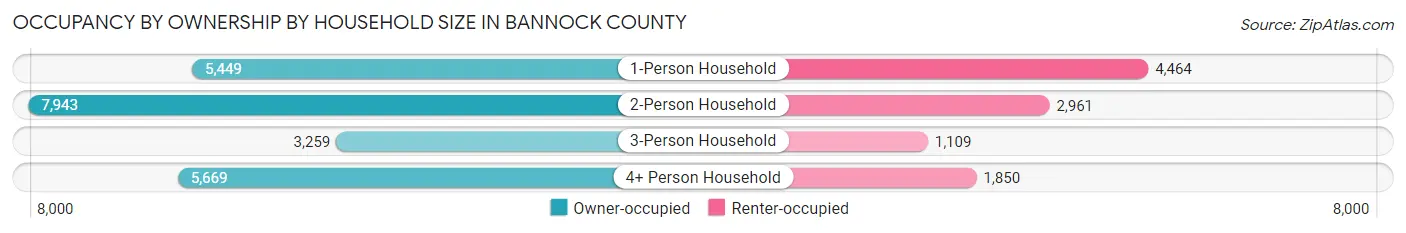
| Household Size | Owner-occupied | Renter-occupied |
| 1-Person Household | 5,449 (55.0%) | 4,464 (45.0%) |
| 2-Person Household | 7,943 (72.8%) | 2,961 (27.2%) |
| 3-Person Household | 3,259 (74.6%) | 1,109 (25.4%) |
| 4+ Person Household | 5,669 (75.4%) | 1,850 (24.6%) |
| Total Housing Units | 22,320 (68.2%) | 10,384 (31.8%) |
Occupancy by Educational Attainment in Bannock County
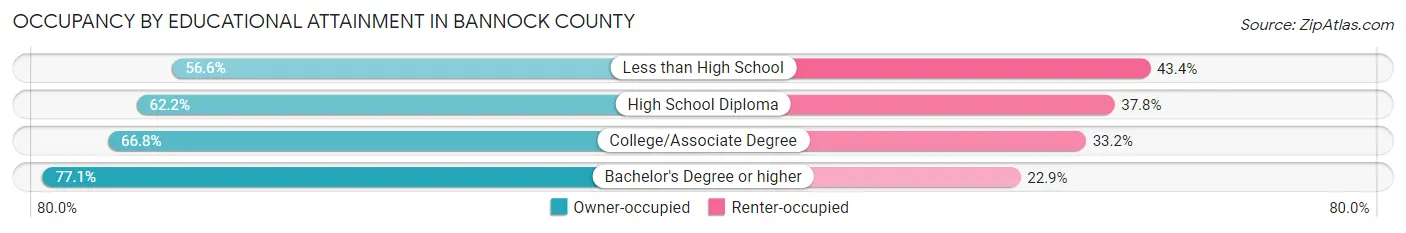
| Household Size | Owner-occupied | Renter-occupied |
| Less than High School | 1,094 (56.6%) | 840 (43.4%) |
| High School Diploma | 4,716 (62.2%) | 2,862 (37.8%) |
| College/Associate Degree | 8,875 (66.8%) | 4,418 (33.2%) |
| Bachelor's Degree or higher | 7,635 (77.1%) | 2,264 (22.9%) |
Occupancy by Age of Householder in Bannock County
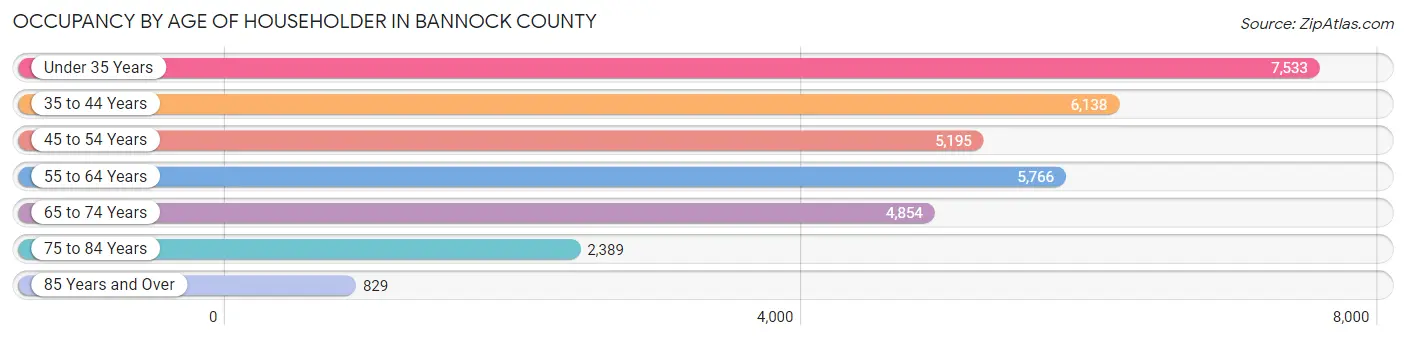
| Age Bracket | # Households | % Households |
| Under 35 Years | 7,533 | 23.0% |
| 35 to 44 Years | 6,138 | 18.8% |
| 45 to 54 Years | 5,195 | 15.9% |
| 55 to 64 Years | 5,766 | 17.6% |
| 65 to 74 Years | 4,854 | 14.8% |
| 75 to 84 Years | 2,389 | 7.3% |
| 85 Years and Over | 829 | 2.5% |
| Total | 32,704 | 100.0% |
Housing Finances in Bannock County
Median Income by Occupancy in Bannock County
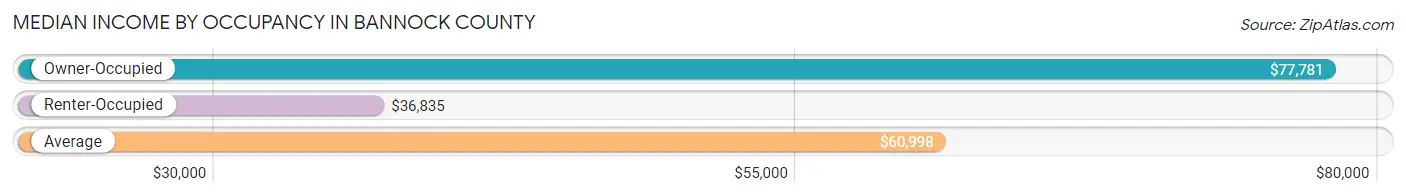
| Occupancy Type | # Households | Median Income |
| Owner-Occupied | 22,320 (68.2%) | $77,781 |
| Renter-Occupied | 10,384 (31.8%) | $36,835 |
| Average | 32,704 (100.0%) | $60,998 |
Occupancy by Householder Income Bracket in Bannock County
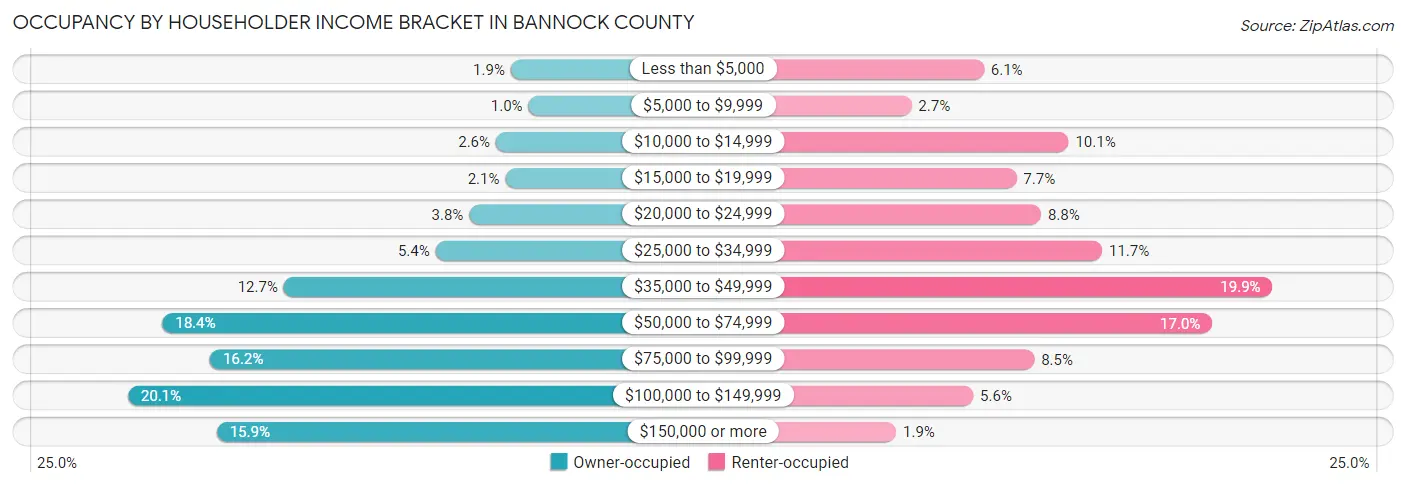
| Income Bracket | Owner-occupied | Renter-occupied |
| Less than $5,000 | 413 (1.8%) | 634 (6.1%) |
| $5,000 to $9,999 | 225 (1.0%) | 276 (2.7%) |
| $10,000 to $14,999 | 571 (2.6%) | 1,053 (10.1%) |
| $15,000 to $19,999 | 472 (2.1%) | 795 (7.7%) |
| $20,000 to $24,999 | 854 (3.8%) | 917 (8.8%) |
| $25,000 to $34,999 | 1,213 (5.4%) | 1,219 (11.7%) |
| $35,000 to $49,999 | 2,826 (12.7%) | 2,061 (19.9%) |
| $50,000 to $74,999 | 4,116 (18.4%) | 1,763 (17.0%) |
| $75,000 to $99,999 | 3,610 (16.2%) | 884 (8.5%) |
| $100,000 to $149,999 | 4,482 (20.1%) | 582 (5.6%) |
| $150,000 or more | 3,538 (15.9%) | 200 (1.9%) |
| Total | 22,320 (100.0%) | 10,384 (100.0%) |
Monthly Housing Cost Tiers in Bannock County
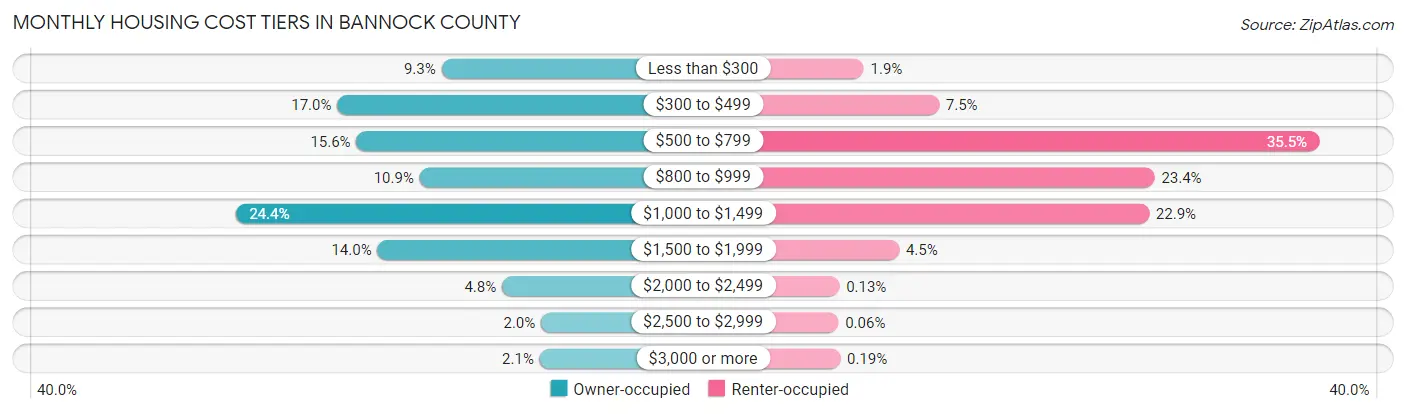
| Monthly Cost | Owner-occupied | Renter-occupied |
| Less than $300 | 2,074 (9.3%) | 200 (1.9%) |
| $300 to $499 | 3,787 (17.0%) | 776 (7.5%) |
| $500 to $799 | 3,474 (15.6%) | 3,682 (35.5%) |
| $800 to $999 | 2,433 (10.9%) | 2,425 (23.4%) |
| $1,000 to $1,499 | 5,449 (24.4%) | 2,382 (22.9%) |
| $1,500 to $1,999 | 3,127 (14.0%) | 470 (4.5%) |
| $2,000 to $2,499 | 1,080 (4.8%) | 14 (0.1%) |
| $2,500 to $2,999 | 437 (2.0%) | 6 (0.1%) |
| $3,000 or more | 459 (2.1%) | 20 (0.2%) |
| Total | 22,320 (100.0%) | 10,384 (100.0%) |
Physical Housing Characteristics in Bannock County
Housing Structures in Bannock County
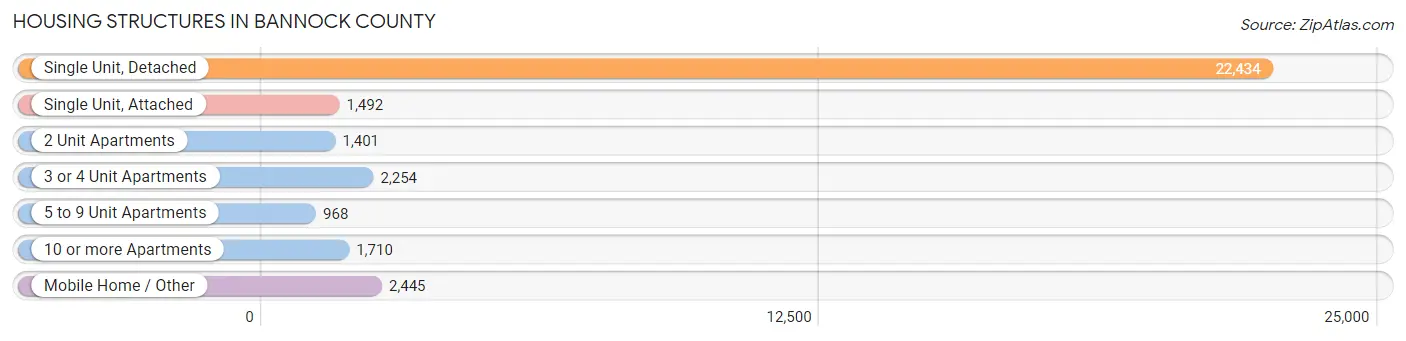
| Structure Type | # Housing Units | % Housing Units |
| Single Unit, Detached | 22,434 | 68.6% |
| Single Unit, Attached | 1,492 | 4.6% |
| 2 Unit Apartments | 1,401 | 4.3% |
| 3 or 4 Unit Apartments | 2,254 | 6.9% |
| 5 to 9 Unit Apartments | 968 | 3.0% |
| 10 or more Apartments | 1,710 | 5.2% |
| Mobile Home / Other | 2,445 | 7.5% |
| Total | 32,704 | 100.0% |
Housing Structures by Occupancy in Bannock County
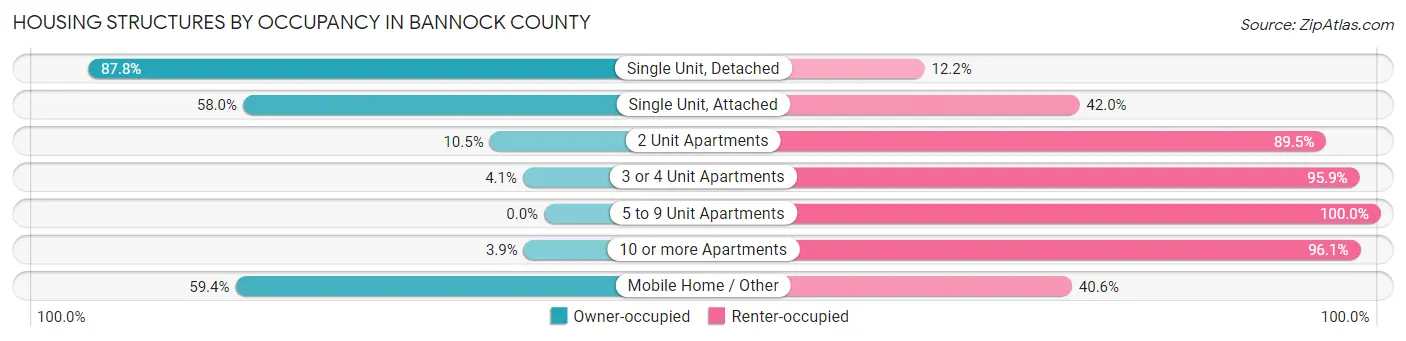
| Structure Type | Owner-occupied | Renter-occupied |
| Single Unit, Detached | 19,696 (87.8%) | 2,738 (12.2%) |
| Single Unit, Attached | 865 (58.0%) | 627 (42.0%) |
| 2 Unit Apartments | 147 (10.5%) | 1,254 (89.5%) |
| 3 or 4 Unit Apartments | 92 (4.1%) | 2,162 (95.9%) |
| 5 to 9 Unit Apartments | 0 (0.0%) | 968 (100.0%) |
| 10 or more Apartments | 67 (3.9%) | 1,643 (96.1%) |
| Mobile Home / Other | 1,453 (59.4%) | 992 (40.6%) |
| Total | 22,320 (68.2%) | 10,384 (31.8%) |
Housing Structures by Number of Rooms in Bannock County
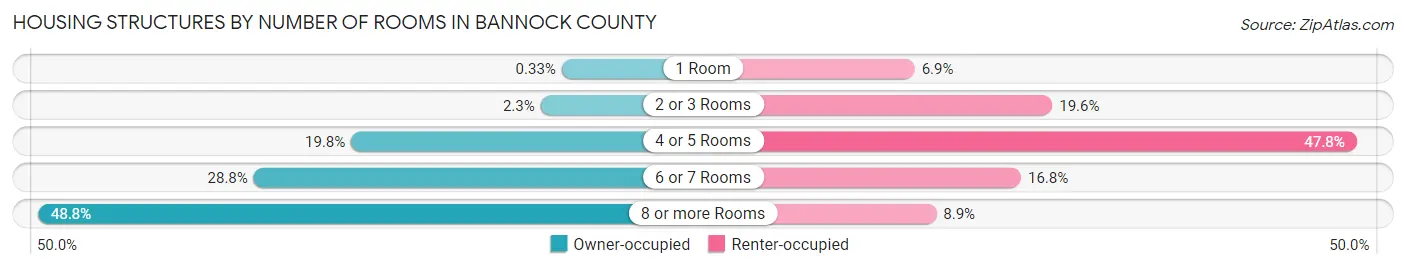
| Number of Rooms | Owner-occupied | Renter-occupied |
| 1 Room | 74 (0.3%) | 719 (6.9%) |
| 2 or 3 Rooms | 509 (2.3%) | 2,039 (19.6%) |
| 4 or 5 Rooms | 4,419 (19.8%) | 4,961 (47.8%) |
| 6 or 7 Rooms | 6,433 (28.8%) | 1,739 (16.8%) |
| 8 or more Rooms | 10,885 (48.8%) | 926 (8.9%) |
| Total | 22,320 (100.0%) | 10,384 (100.0%) |
Housing Structure by Heating Type in Bannock County
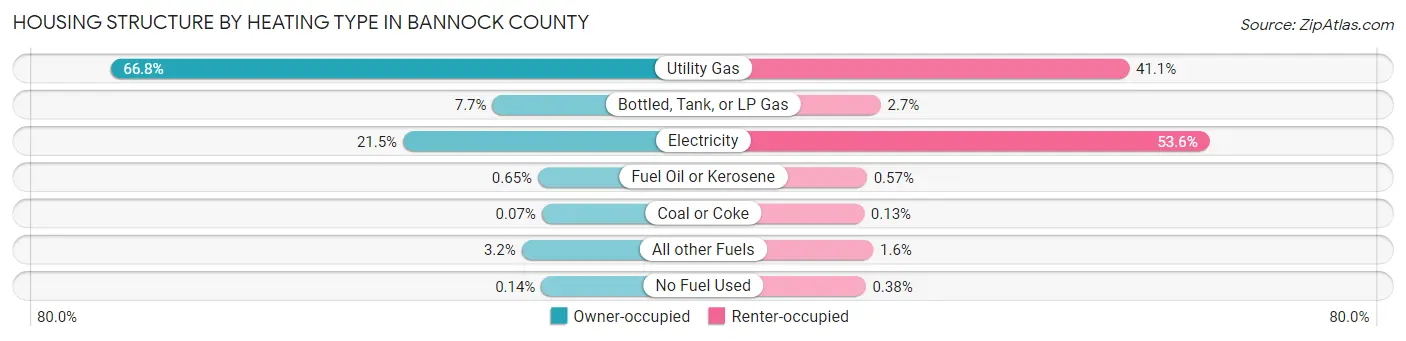
| Heating Type | Owner-occupied | Renter-occupied |
| Utility Gas | 14,899 (66.7%) | 4,270 (41.1%) |
| Bottled, Tank, or LP Gas | 1,717 (7.7%) | 280 (2.7%) |
| Electricity | 4,802 (21.5%) | 5,561 (53.5%) |
| Fuel Oil or Kerosene | 145 (0.6%) | 59 (0.6%) |
| Coal or Coke | 16 (0.1%) | 14 (0.1%) |
| All other Fuels | 709 (3.2%) | 161 (1.5%) |
| No Fuel Used | 32 (0.1%) | 39 (0.4%) |
| Total | 22,320 (100.0%) | 10,384 (100.0%) |
Household Vehicle Usage in Bannock County
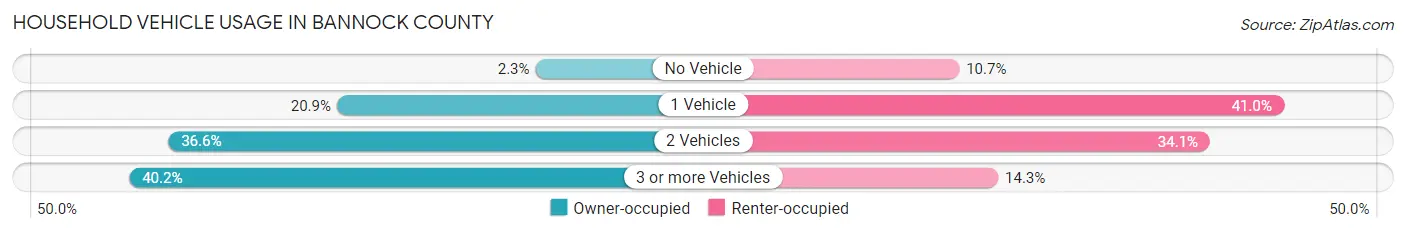
| Vehicles per Household | Owner-occupied | Renter-occupied |
| No Vehicle | 517 (2.3%) | 1,108 (10.7%) |
| 1 Vehicle | 4,655 (20.9%) | 4,253 (41.0%) |
| 2 Vehicles | 8,168 (36.6%) | 3,538 (34.1%) |
| 3 or more Vehicles | 8,980 (40.2%) | 1,485 (14.3%) |
| Total | 22,320 (100.0%) | 10,384 (100.0%) |
Real Estate & Mortgages in Bannock County
Real Estate and Mortgage Overview in Bannock County
| Characteristic | Without Mortgage | With Mortgage |
| Housing Units | 8,947 | 13,373 |
| Median Property Value | $207,200 | $248,400 |
| Median Household Income | $58,227 | $2,353 |
| Monthly Housing Costs | $432 | $459 |
| Real Estate Taxes | $1,670 | $311 |
Property Value by Mortgage Status in Bannock County
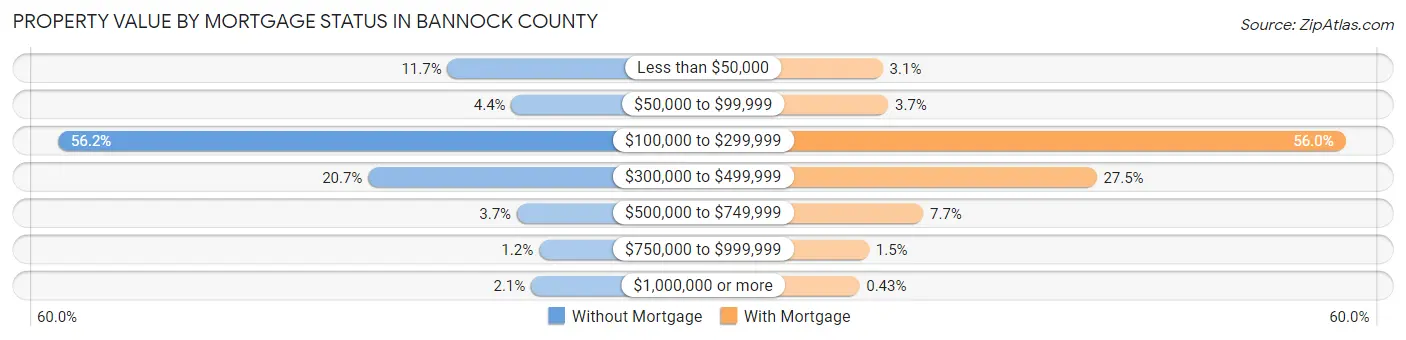
| Property Value | Without Mortgage | With Mortgage |
| Less than $50,000 | 1,044 (11.7%) | 415 (3.1%) |
| $50,000 to $99,999 | 390 (4.4%) | 497 (3.7%) |
| $100,000 to $299,999 | 5,027 (56.2%) | 7,487 (56.0%) |
| $300,000 to $499,999 | 1,855 (20.7%) | 3,682 (27.5%) |
| $500,000 to $749,999 | 334 (3.7%) | 1,032 (7.7%) |
| $750,000 to $999,999 | 108 (1.2%) | 203 (1.5%) |
| $1,000,000 or more | 189 (2.1%) | 57 (0.4%) |
| Total | 8,947 (100.0%) | 13,373 (100.0%) |
Household Income by Mortgage Status in Bannock County
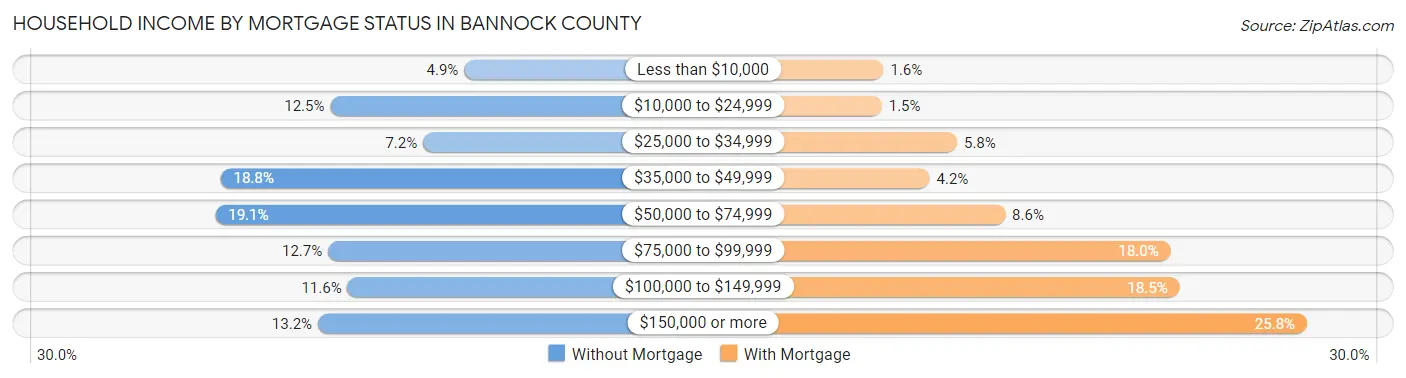
| Household Income | Without Mortgage | With Mortgage |
| Less than $10,000 | 437 (4.9%) | 214 (1.6%) |
| $10,000 to $24,999 | 1,121 (12.5%) | 201 (1.5%) |
| $25,000 to $34,999 | 647 (7.2%) | 776 (5.8%) |
| $35,000 to $49,999 | 1,682 (18.8%) | 566 (4.2%) |
| $50,000 to $74,999 | 1,709 (19.1%) | 1,144 (8.6%) |
| $75,000 to $99,999 | 1,133 (12.7%) | 2,407 (18.0%) |
| $100,000 to $149,999 | 1,033 (11.6%) | 2,477 (18.5%) |
| $150,000 or more | 1,185 (13.2%) | 3,449 (25.8%) |
| Total | 8,947 (100.0%) | 13,373 (100.0%) |
Property Value to Household Income Ratio in Bannock County
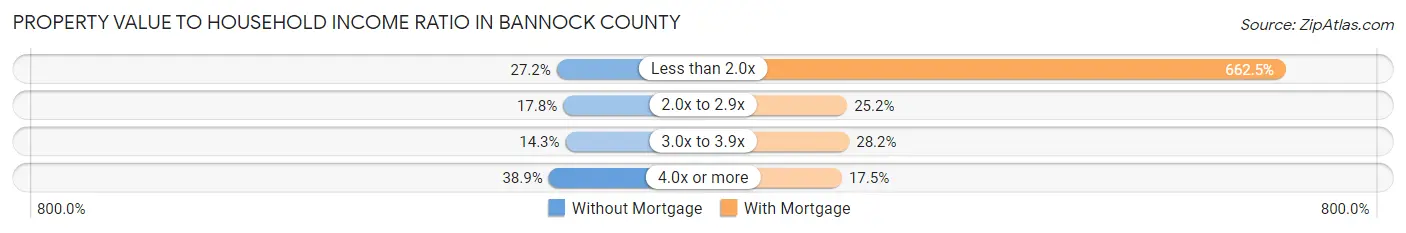
| Value-to-Income Ratio | Without Mortgage | With Mortgage |
| Less than 2.0x | 2,430 (27.2%) | 88,595 (662.5%) |
| 2.0x to 2.9x | 1,594 (17.8%) | 3,363 (25.2%) |
| 3.0x to 3.9x | 1,281 (14.3%) | 3,768 (28.2%) |
| 4.0x or more | 3,478 (38.9%) | 2,343 (17.5%) |
| Total | 8,947 (100.0%) | 13,373 (100.0%) |
Real Estate Taxes by Mortgage Status in Bannock County
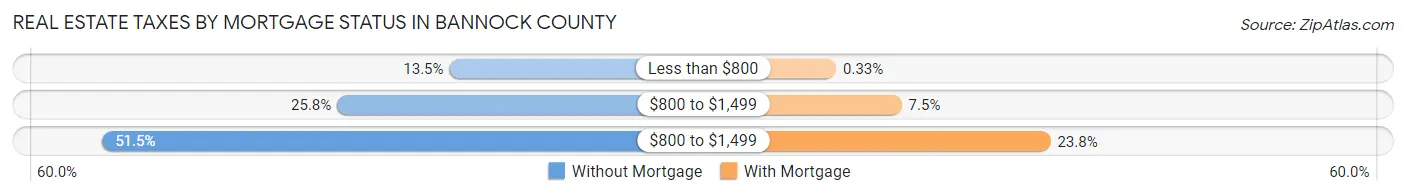
| Property Taxes | Without Mortgage | With Mortgage |
| Less than $800 | 1,203 (13.5%) | 44 (0.3%) |
| $800 to $1,499 | 2,304 (25.8%) | 1,005 (7.5%) |
| $800 to $1,499 | 4,607 (51.5%) | 3,187 (23.8%) |
| Total | 8,947 (100.0%) | 13,373 (100.0%) |
Health & Disability in Bannock County
Health Insurance Coverage by Age in Bannock County
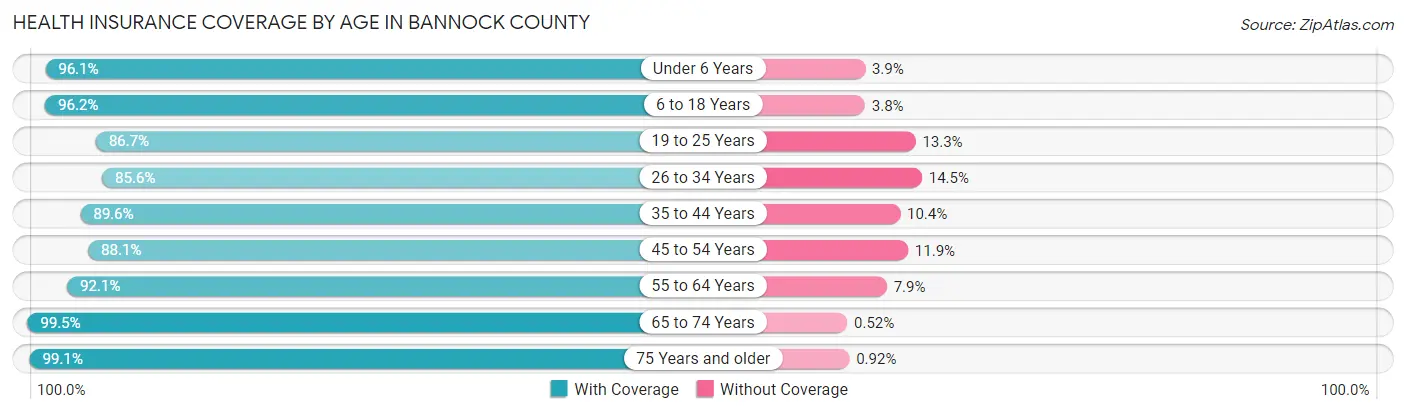
| Age Bracket | With Coverage | Without Coverage |
| Under 6 Years | 6,555 (96.1%) | 263 (3.9%) |
| 6 to 18 Years | 16,451 (96.2%) | 655 (3.8%) |
| 19 to 25 Years | 7,835 (86.7%) | 1,199 (13.3%) |
| 26 to 34 Years | 9,271 (85.6%) | 1,566 (14.4%) |
| 35 to 44 Years | 10,242 (89.6%) | 1,188 (10.4%) |
| 45 to 54 Years | 7,954 (88.1%) | 1,070 (11.9%) |
| 55 to 64 Years | 8,807 (92.1%) | 756 (7.9%) |
| 65 to 74 Years | 7,911 (99.5%) | 41 (0.5%) |
| 75 Years and older | 4,520 (99.1%) | 42 (0.9%) |
| Total | 79,546 (92.1%) | 6,780 (7.9%) |
Health Insurance Coverage by Citizenship Status in Bannock County
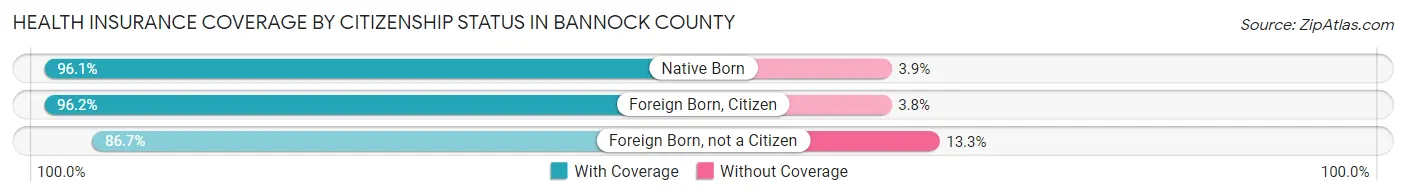
| Citizenship Status | With Coverage | Without Coverage |
| Native Born | 6,555 (96.1%) | 263 (3.9%) |
| Foreign Born, Citizen | 16,451 (96.2%) | 655 (3.8%) |
| Foreign Born, not a Citizen | 7,835 (86.7%) | 1,199 (13.3%) |
Health Insurance Coverage by Household Income in Bannock County
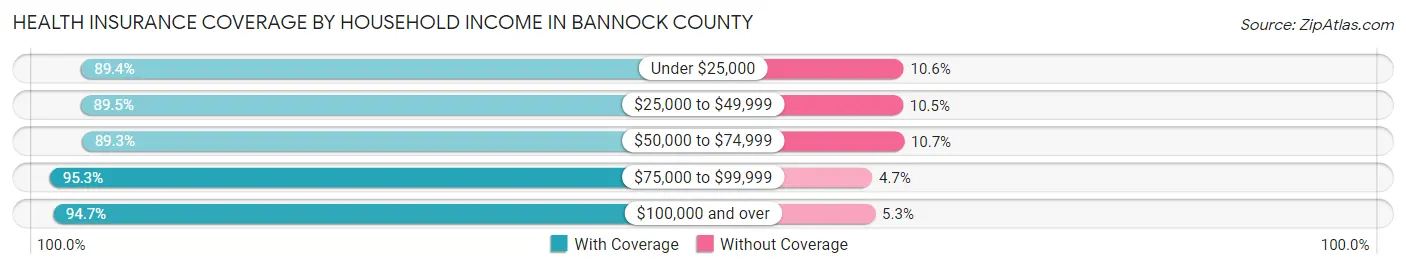
| Household Income | With Coverage | Without Coverage |
| Under $25,000 | 9,303 (89.4%) | 1,107 (10.6%) |
| $25,000 to $49,999 | 13,863 (89.5%) | 1,624 (10.5%) |
| $50,000 to $74,999 | 13,813 (89.3%) | 1,656 (10.7%) |
| $75,000 to $99,999 | 13,150 (95.3%) | 655 (4.7%) |
| $100,000 and over | 27,395 (94.7%) | 1,535 (5.3%) |
Public vs Private Health Insurance Coverage by Age in Bannock County
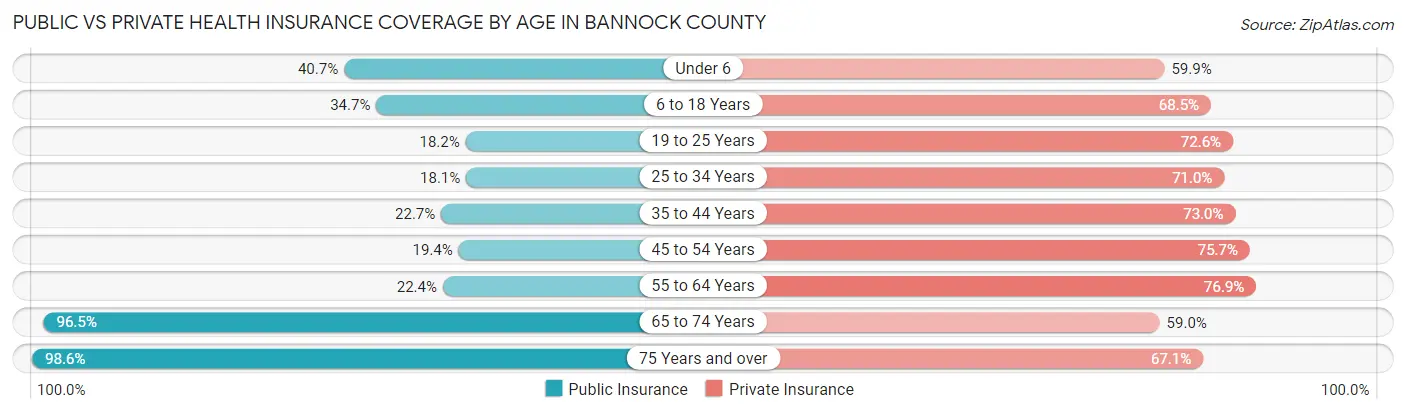
| Age Bracket | Public Insurance | Private Insurance |
| Under 6 | 2,776 (40.7%) | 4,084 (59.9%) |
| 6 to 18 Years | 5,941 (34.7%) | 11,719 (68.5%) |
| 19 to 25 Years | 1,640 (18.1%) | 6,558 (72.6%) |
| 25 to 34 Years | 1,956 (18.0%) | 7,691 (71.0%) |
| 35 to 44 Years | 2,593 (22.7%) | 8,348 (73.0%) |
| 45 to 54 Years | 1,754 (19.4%) | 6,833 (75.7%) |
| 55 to 64 Years | 2,140 (22.4%) | 7,354 (76.9%) |
| 65 to 74 Years | 7,672 (96.5%) | 4,692 (59.0%) |
| 75 Years and over | 4,498 (98.6%) | 3,059 (67.0%) |
| Total | 30,970 (35.9%) | 60,338 (69.9%) |
Disability Status by Sex by Age in Bannock County
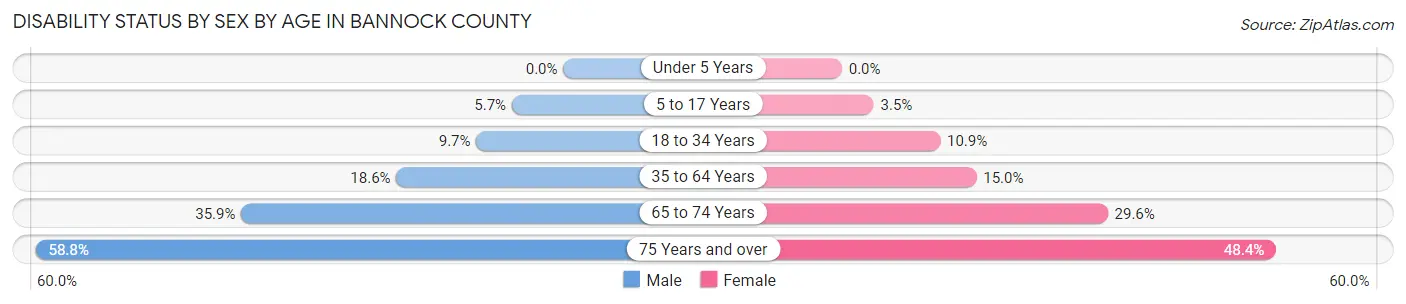
| Age Bracket | Male | Female |
| Under 5 Years | 0 (0.0%) | 0 (0.0%) |
| 5 to 17 Years | 494 (5.7%) | 287 (3.5%) |
| 18 to 34 Years | 1,065 (9.7%) | 1,147 (10.9%) |
| 35 to 64 Years | 2,801 (18.6%) | 2,239 (15.0%) |
| 65 to 74 Years | 1,420 (35.9%) | 1,182 (29.6%) |
| 75 Years and over | 1,131 (58.8%) | 1,276 (48.4%) |
Disability Class by Sex by Age in Bannock County
Disability Class: Hearing Difficulty
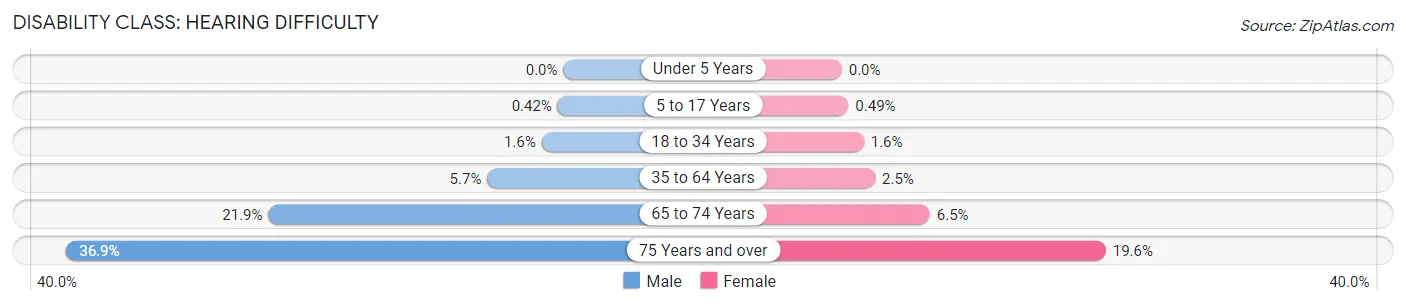
| Age Bracket | Male | Female |
| Under 5 Years | 0 (0.0%) | 0 (0.0%) |
| 5 to 17 Years | 36 (0.4%) | 40 (0.5%) |
| 18 to 34 Years | 178 (1.6%) | 171 (1.6%) |
| 35 to 64 Years | 851 (5.7%) | 370 (2.5%) |
| 65 to 74 Years | 867 (21.9%) | 261 (6.5%) |
| 75 Years and over | 710 (36.9%) | 517 (19.6%) |
Disability Class: Vision Difficulty
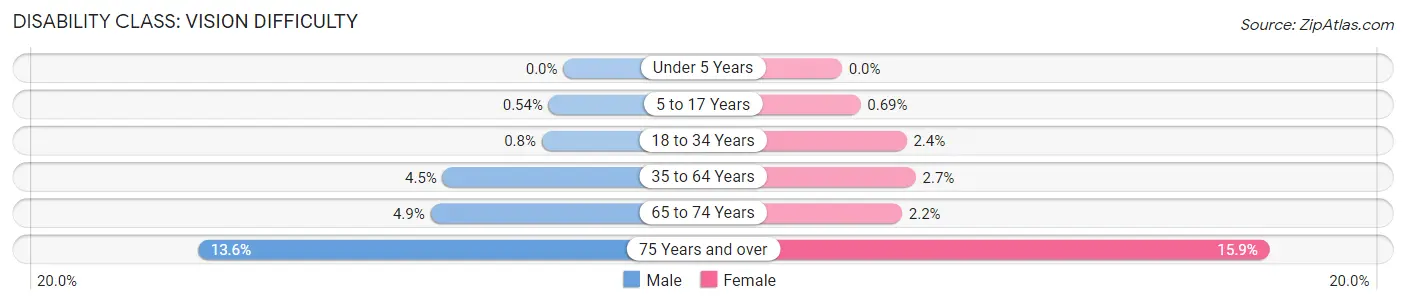
| Age Bracket | Male | Female |
| Under 5 Years | 0 (0.0%) | 0 (0.0%) |
| 5 to 17 Years | 47 (0.5%) | 56 (0.7%) |
| 18 to 34 Years | 88 (0.8%) | 251 (2.4%) |
| 35 to 64 Years | 675 (4.5%) | 410 (2.7%) |
| 65 to 74 Years | 195 (4.9%) | 89 (2.2%) |
| 75 Years and over | 261 (13.6%) | 419 (15.9%) |
Disability Class: Cognitive Difficulty
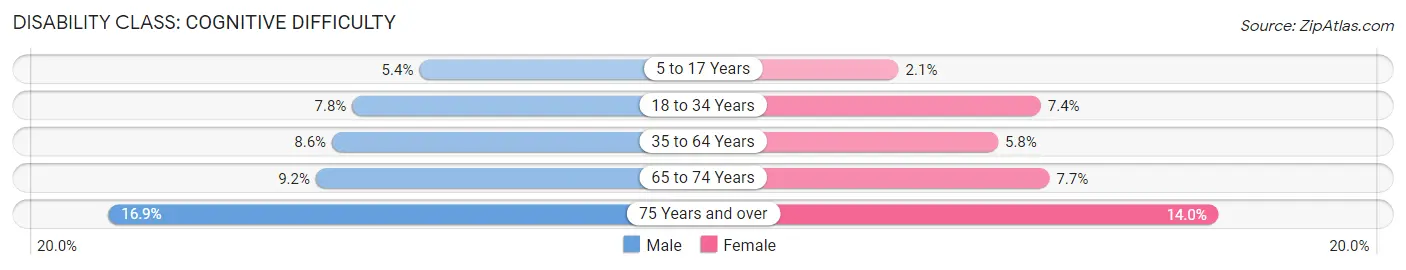
| Age Bracket | Male | Female |
| 5 to 17 Years | 462 (5.3%) | 171 (2.1%) |
| 18 to 34 Years | 862 (7.8%) | 774 (7.4%) |
| 35 to 64 Years | 1,295 (8.6%) | 867 (5.8%) |
| 65 to 74 Years | 364 (9.2%) | 308 (7.7%) |
| 75 Years and over | 325 (16.9%) | 369 (14.0%) |
Disability Class: Ambulatory Difficulty
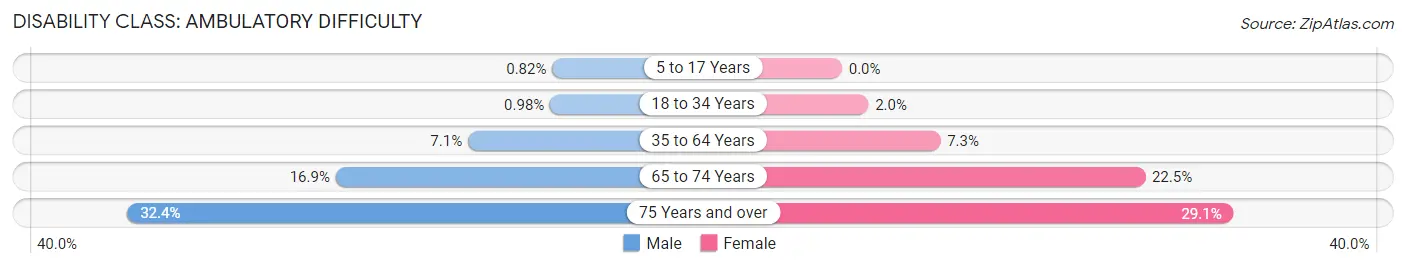
| Age Bracket | Male | Female |
| 5 to 17 Years | 71 (0.8%) | 0 (0.0%) |
| 18 to 34 Years | 108 (1.0%) | 205 (2.0%) |
| 35 to 64 Years | 1,067 (7.1%) | 1,093 (7.3%) |
| 65 to 74 Years | 669 (16.9%) | 899 (22.5%) |
| 75 Years and over | 623 (32.4%) | 767 (29.1%) |
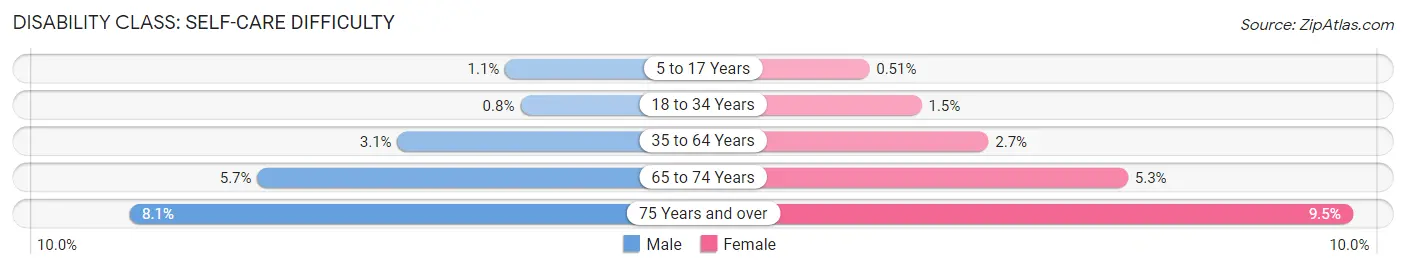
Disability Class: Self-Care Difficulty
| Age Bracket | Male | Female |
| 5 to 17 Years | 93 (1.1%) | 41 (0.5%) |
| 18 to 34 Years | 88 (0.8%) | 155 (1.5%) |
| 35 to 64 Years | 464 (3.1%) | 407 (2.7%) |
| 65 to 74 Years | 225 (5.7%) | 212 (5.3%) |
| 75 Years and over | 155 (8.1%) | 250 (9.5%) |
Technology Access in Bannock County
Computing Device Access in Bannock County
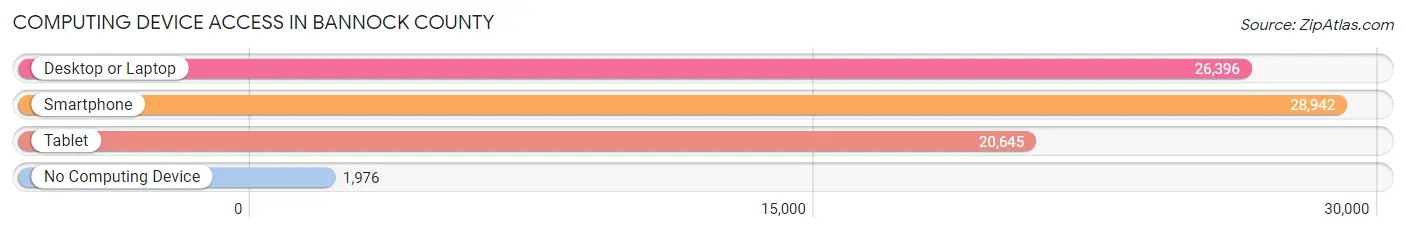
| Device Type | # Households | % Households |
| Desktop or Laptop | 26,396 | 80.7% |
| Smartphone | 28,942 | 88.5% |
| Tablet | 20,645 | 63.1% |
| No Computing Device | 1,976 | 6.0% |
| Total | 32,704 | 100.0% |
Internet Access in Bannock County
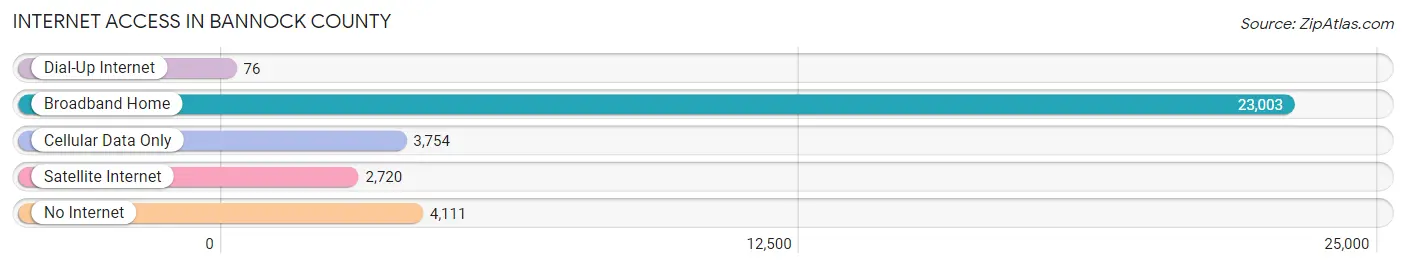
| Internet Type | # Households | % Households |
| Dial-Up Internet | 76 | 0.2% |
| Broadband Home | 23,003 | 70.3% |
| Cellular Data Only | 3,754 | 11.5% |
| Satellite Internet | 2,720 | 8.3% |
| No Internet | 4,111 | 12.6% |
| Total | 32,704 | 100.0% |
Bannock County Summary
Bannock County is located in the southeastern corner of the state of Idaho, and is bordered by Caribou County to the north, Power County to the east, and Oneida County to the south. The county seat is the city of Pocatello, which is also the largest city in the county. Bannock County is part of the Pocatello, ID Metropolitan Statistical Area.
History
Bannock County was established in 1893, and was named after the Bannock Native American tribe. The county was originally part of Oneida County, and was created to provide better government services to the area. The county was originally populated by Native American tribes, including the Shoshone, Bannock, and Paiute.
The first settlers in the area were Mormon pioneers, who arrived in the late 1800s. The first permanent settlement in the county was Fort Hall, which was established in 1834. The fort was used as a trading post and military outpost, and was a major hub of activity in the area.
The county was also home to the first railroad in Idaho, which was built in 1882. The railroad connected the county to the rest of the state, and helped to spur economic growth in the area.
Geography
Bannock County covers an area of 1,845 square miles, and is located in the southeastern corner of the state. The county is bordered by Caribou County to the north, Power County to the east, and Oneida County to the south. The county is part of the Snake River Plain, and is mostly flat and arid.
The county is home to several mountain ranges, including the Portneuf Range, the Bannock Range, and the Blackfoot Mountains. The county is also home to several rivers, including the Portneuf River, the Snake River, and the Blackfoot River.
Economy
The economy of Bannock County is largely based on agriculture, manufacturing, and tourism. The county is home to several large agricultural operations, including dairy farms, cattle ranches, and potato farms. The county is also home to several large manufacturing companies, including Simplot, a major producer of potato products.
The county is also home to several tourist attractions, including the Idaho Museum of Natural History, the Idaho Potato Museum, and the Bannock County Historical Museum. The county is also home to several ski resorts, including Pebble Creek Ski Area and Grand Targhee Resort.
Demographics
As of the 2010 census, Bannock County had a population of 82,839. The population was spread out, with 24.3% under the age of 18, 11.2% from 18 to 24, 25.2% from 25 to 44, 24.2% from 45 to 64, and 15.1% who were 65 years of age or older. The median age was 36.3 years.
The racial makeup of the county was 90.2% White, 0.7% African American, 1.2% Native American, 1.7% Asian, 0.2% Pacific Islander, 3.3% from other races, and 2.7% from two or more races. Hispanic or Latino of any race were 8.2% of the population.
The median income for a household in the county was $41,945, and the median income for a family was $50,945. The per capita income for the county was $20,945. About 11.2% of families and 15.1% of the population were below the poverty line, including 19.2% of those under age 18 and 8.2% of those age 65 or over.
Common Questions
What is the Total Population of Bannock County?
Total Population of Bannock County is 87,434.
What is the Total Male Population of Bannock County?
Total Male Population of Bannock County is 44,037.
What is the Total Female Population of Bannock County?
Total Female Population of Bannock County is 43,397.
What is the Ratio of Males per 100 Females in Bannock County?
There are 101.47 Males per 100 Females in Bannock County.
What is the Ratio of Females per 100 Males in Bannock County?
There are 98.55 Females per 100 Males in Bannock County.
What is the Median Population Age in Bannock County?
Median Population Age in Bannock County is 34.7 Years.
What is the Average Family Size in Bannock County
Average Family Size in Bannock County is 3.3 People.
What is the Average Household Size in Bannock County
Average Household Size in Bannock County is 2.6 People.
What is Per Capita Income in Bannock County?
Per Capita income in Bannock County is $30,257.
What is the Median Family Income in Bannock County?
Median Family Income in Bannock County is $80,428.
What is the Median Household income in Bannock County?
Median Household Income in Bannock County is $60,998.
What is Income or Wage Gap in Bannock County?
Income or Wage Gap in Bannock County is 35.9%.
Women in Bannock County earn 64.1 cents for every dollar earned by a man.
What is Family Income Deficit in Bannock County?
Family Income Deficit in Bannock County is $11,431.
Families that are below poverty line in Bannock County earn $11,431 less on average than the poverty threshold level.
What is Inequality or Gini Index in Bannock County?
Inequality or Gini Index in Bannock County is 0.43.
How Large is the Labor Force in Bannock County?
There are 41,607 People in the Labor Forcein in Bannock County.
What is the Percentage of People in the Labor Force in Bannock County?
61.5% of People are in the Labor Force in Bannock County.
What is the Unemployment Rate in Bannock County?
Unemployment Rate in Bannock County is 5.1%.