Zip Codes with the Highest Percentage of Population Employed in Food Preparation & Serving in Boise, ID
RELATED REPORTS & OPTIONS
Food Preparation & Serving
Boise
Compare Zip Codes
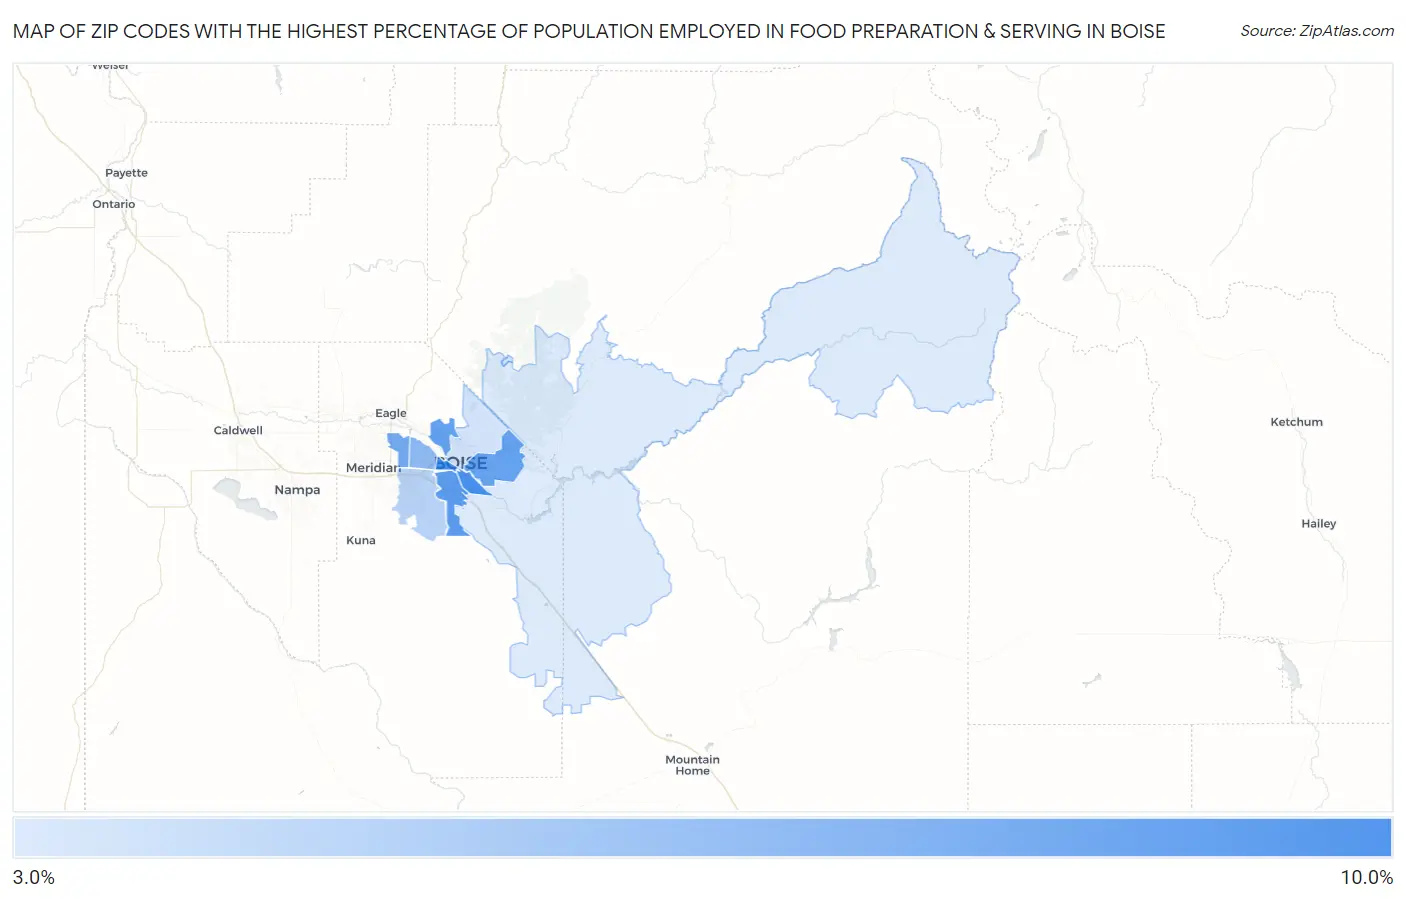
Map of Zip Codes with the Highest Percentage of Population Employed in Food Preparation & Serving in Boise
0.0%
10.0%
Zip Codes with the Highest Percentage of Population Employed in Food Preparation & Serving in Boise, ID
| Zip Code | % Employed | vs State | vs National | |
| 1. | 83706 | 8.1% | 5.7%(+2.41)#37 | 5.3%(+2.80)#4,596 |
| 2. | 83705 | 7.5% | 5.7%(+1.86)#46 | 5.3%(+2.25)#5,488 |
| 3. | 83703 | 7.3% | 5.7%(+1.58)#50 | 5.3%(+1.97)#6,017 |
| 4. | 83712 | 7.2% | 5.7%(+1.48)#52 | 5.3%(+1.87)#6,220 |
| 5. | 83713 | 6.8% | 5.7%(+1.08)#62 | 5.3%(+1.47)#7,190 |
| 6. | 83704 | 5.9% | 5.7%(+0.201)#86 | 5.3%(+0.588)#9,773 |
| 7. | 83709 | 4.6% | 5.7%(-1.03)#118 | 5.3%(-0.640)#14,384 |
| 8. | 83702 | 3.9% | 5.7%(-1.76)#139 | 5.3%(-1.37)#17,480 |
| 9. | 83716 | 3.6% | 5.7%(-2.12)#144 | 5.3%(-1.73)#18,987 |
1
Common Questions
What are the Top 5 Zip Codes with the Highest Percentage of Population Employed in Food Preparation & Serving in Boise, ID?
Top 5 Zip Codes with the Highest Percentage of Population Employed in Food Preparation & Serving in Boise, ID are:
What zip code has the Highest Percentage of Population Employed in Food Preparation & Serving in Boise, ID?
83706 has the Highest Percentage of Population Employed in Food Preparation & Serving in Boise, ID with 8.1%.
What is the Percentage of Population Employed in Food Preparation & Serving in Idaho?
Percentage of Population Employed in Food Preparation & Serving in Idaho is 5.7%.
What is the Percentage of Population Employed in Food Preparation & Serving in the United States?
Percentage of Population Employed in Food Preparation & Serving in the United States is 5.3%.