Zip Codes with the Highest Percentage of Population Employed in Agriculture, Fishing & Hunting in Tifton, GA
RELATED REPORTS & OPTIONS
Agriculture, Fishing & Hunting
Tifton
Compare Zip Codes
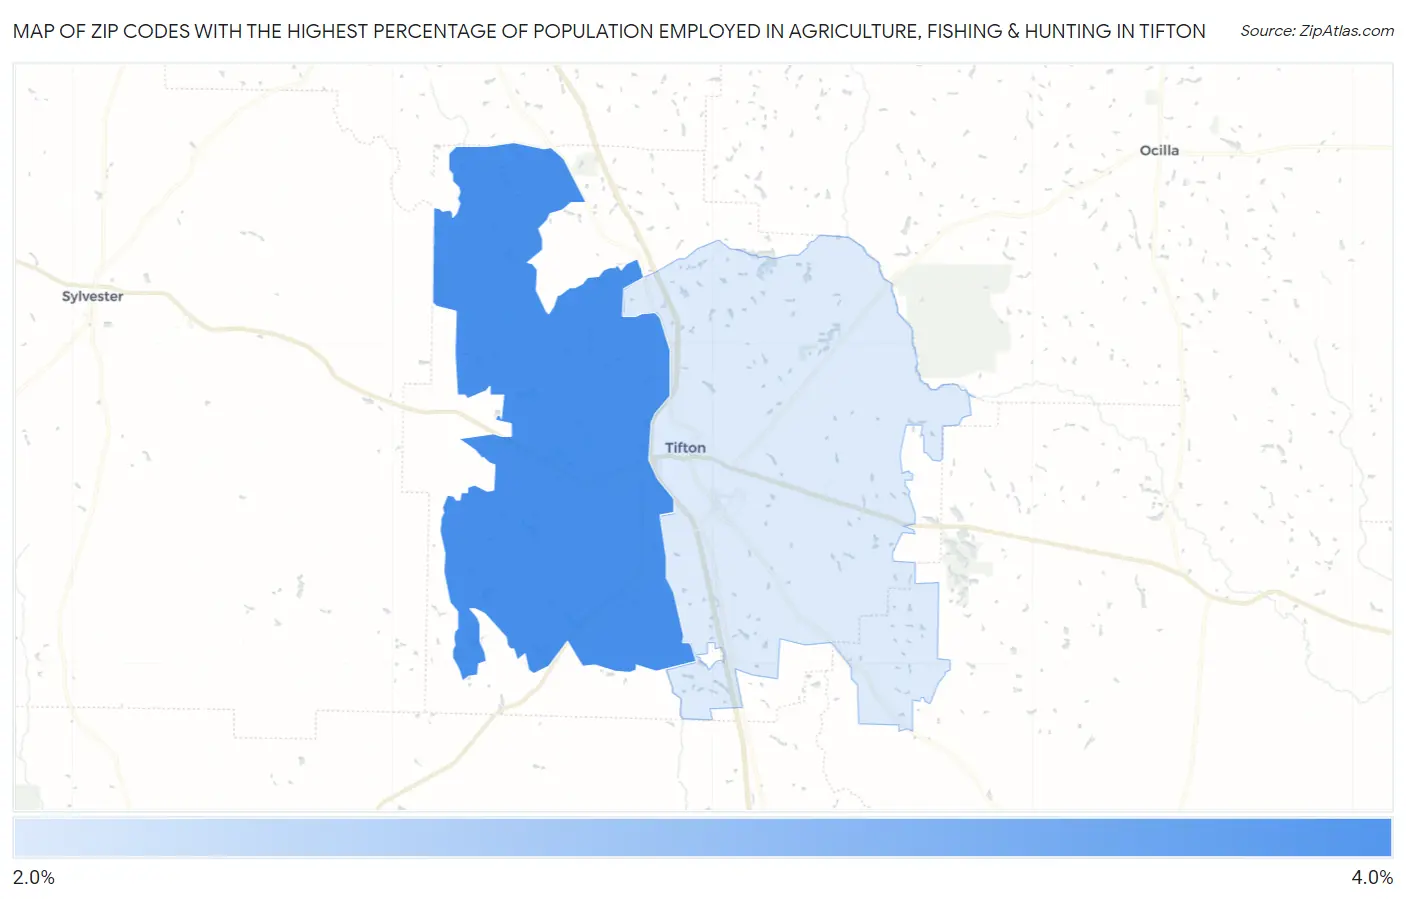
Map of Zip Codes with the Highest Percentage of Population Employed in Agriculture, Fishing & Hunting in Tifton
0.0%
4.0%
Zip Codes with the Highest Percentage of Population Employed in Agriculture, Fishing & Hunting in Tifton, GA
| Zip Code | % Employed | vs State | vs National | |
| 1. | 31793 | 3.6% | 0.91%(+2.71)#154 | 1.2%(+2.42)#9,565 |
| 2. | 31794 | 2.2% | 0.91%(+1.25)#245 | 1.2%(+0.960)#12,353 |
1
Common Questions
What are the Top Zip Codes with the Highest Percentage of Population Employed in Agriculture, Fishing & Hunting in Tifton, GA?
Top Zip Codes with the Highest Percentage of Population Employed in Agriculture, Fishing & Hunting in Tifton, GA are:
What zip code has the Highest Percentage of Population Employed in Agriculture, Fishing & Hunting in Tifton, GA?
31793 has the Highest Percentage of Population Employed in Agriculture, Fishing & Hunting in Tifton, GA with 3.6%.
What is the Percentage of Population Employed in Agriculture, Fishing & Hunting in Tifton, GA?
Percentage of Population Employed in Agriculture, Fishing & Hunting in Tifton is 2.6%.
What is the Percentage of Population Employed in Agriculture, Fishing & Hunting in Georgia?
Percentage of Population Employed in Agriculture, Fishing & Hunting in Georgia is 0.91%.
What is the Percentage of Population Employed in Agriculture, Fishing & Hunting in the United States?
Percentage of Population Employed in Agriculture, Fishing & Hunting in the United States is 1.2%.