Zip Codes with the Highest Percentage of Households with Income Below $10,000 in Quincy, FL

RELATED REPORTS & OPTIONS

Household Income | $0-10k
Population
Families and Households
Female Fertility
Female Fertility (Unmarried)
Race (Community Size)
Race (Percentage)
Ancestry (Community Size)
Ancestry (Percentage)
Immigrant Origin (Total)
Immigrant Origin (Percentage)
Income
Income (Families)
Income (Households)
Poverty
Poverty (Families)
Unemployment
Employment Occupations
Employment Industries
Employer Class
Commute Time
Commute Means
School Enrollment
Education by Degree Field
Occupancy
Finances
Physical Characteristics
Quincy
States
Florida Cities
AlachuaAltamonte SpringsApopkaArcadiaBoca RatonBonita SpringsBoynton BeachBradentonBrandonBrooksvilleCape CoralCasselberryClearwaterClermontCocoaCoral SpringsCrestviewCrystal RiverDade CityDavenportDaytona BeachDeerfield BeachDefuniak SpringsDelandDelray BeachDeltonaDunnellonEdgewaterEnglewoodEustisFort LauderdaleFort MyersFort PierceFort Walton BeachGainesvilleGulf BreezeHialeahHolidayHollywoodHomesteadHomosassaHudsonInvernessJacksonvilleJupiterKissimmeeLake CityLake WalesLake WorthLakelandLand O LakesLargoLeesburgLehigh AcresLive OakLongwoodLutzMariannaMelbourneMerritt IslandMiamiMiami BeachMiltonNaplesNew Port RicheyNew Smyrna BeachNorth Fort MyersNorth PortOcalaOkeechobeeOpa LockaOrange ParkOrlandoOrmond BeachOviedoPalm BayPalm Beach GardensPalm CoastPalm HarborPanama CityPanama City BeachPensacolaPerryPinellas ParkPlant CityPompano BeachPort CharlottePort OrangePort Saint LuciePunta GordaQuincyRiverviewSaint AugustineSaint CloudSaint PetersburgSanfordSarasotaSebastianSebringSeminoleSpring HillStuartTallahasseeTampaTarpon SpringsThe VillagesTitusvilleValricoVeniceVero BeachWesley ChapelWest Palm BeachWinter HavenWinter ParkZephyrhills
Compare Zip Codes
Comparison Subject

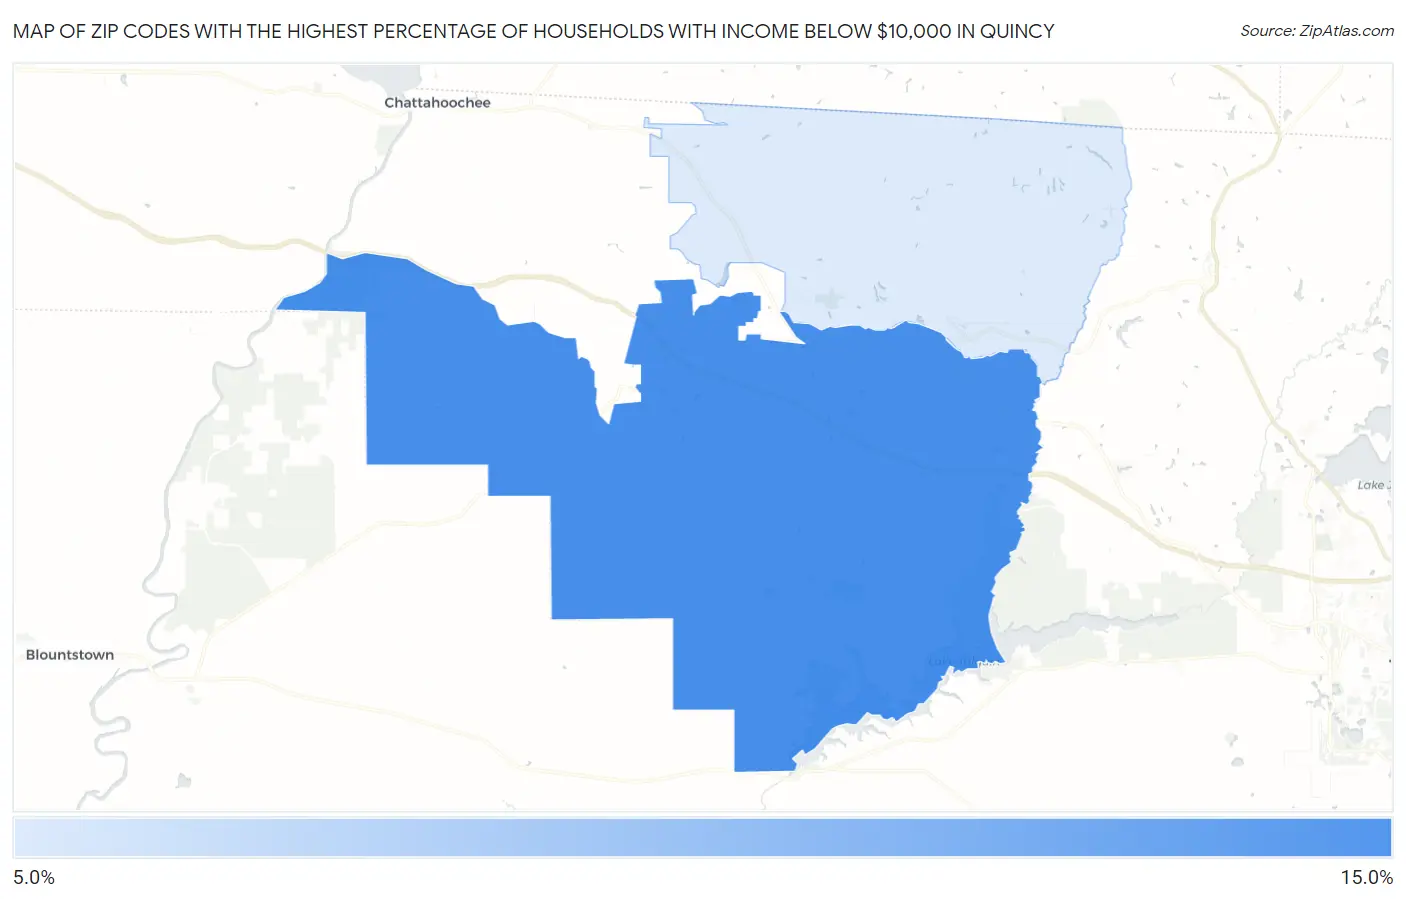
Map of Zip Codes with the Highest Percentage of Households with Income Below $10,000 in Quincy

0.0%
15.0%
Zip Codes with the Highest Percentage of Households with Income Below $10,000 in Quincy Map

Zip Codes with the Highest Percentage of Households with Income Below $10,000 in Quincy, FL

Zip Code Households with Income < $10k vs State vs National
1.3235112.8%5.2%(+7.60)#304.9%(+7.90)#2,159
2.323526.8%5.2%(+1.60)#2204.9%(+1.90)#7,406

Common Questions

What are the Top Zip Codes with the Highest Percentage of Households with Income Below $10,000 in Quincy, FL?
Top Zip Codes with the Highest Percentage of Households with Income Below $10,000 in Quincy, FL are:
#1
12.8%
#2
6.8%
What zip code has the Highest Percentage of Households with Income Below $10,000 in Quincy, FL?
32351 has the Highest Percentage of Households with Income Below $10,000 in Quincy, FL with 12.8%.
What is the Percentage of Households with Income Below $10,000 in Quincy, FL?
Percentage of Households with Income Below $10,000 in Quincy is 22.5%.
What is the Percentage of Households with Income Below $10,000 in Florida?
Percentage of Households with Income Below $10,000 in Florida is 5.2%.
What is the Percentage of Households with Income Below $10,000 in the United States?
Percentage of Households with Income Below $10,000 in the United States is 4.9%.