Zip Codes with the Highest Percentage of Population Employed in Agriculture, Fishing & Hunting in Riverview, FL

RELATED REPORTS & OPTIONS

Agriculture, Fishing & Hunting
Population
Families and Households
Female Fertility
Female Fertility (Unmarried)
Race (Community Size)
Race (Percentage)
Ancestry (Community Size)
AfricanAmericanArabArgentineanArmenianAustrianBahamianBelgianBelizeanBhutaneseBlackfeetBrazilianBritishBritish West IndianBulgarianBurmeseCanadianCentral AmericanCentral American IndianCherokeeChileanColombianCosta RicanCroatianCubanCzechCzechoslovakianDanishDominicanDutchEastern EuropeanEcuadorianEgyptianEnglishEuropeanFinnishFrenchFrench CanadianGermanGreekGuatemalanGuyaneseHaitianHonduranHoumaHungarianIndian (Asian)IrishIroquoisIsraeliItalianJamaicanKoreanLebaneseLithuanianMexicanNative HawaiianNicaraguanNigerianNorthern EuropeanNorwegianPakistaniPanamanianParaguayanPeruvianPolishPortuguesePuerto RicanRomanianRussianSalvadoranScandinavianScotch-IrishScottishSlovakSloveneSouth AmericanSpaniardSpanishSri LankanSubsaharan AfricanSwedishSwissThaiTurkishU.S. Virgin IslanderUkrainianUruguayanVenezuelanWelshWest IndianYugoslavian
Ancestry (Percentage)
AfricanAmericanArabArgentineanArmenianAustrianBahamianBelgianBelizeanBhutaneseBlackfeetBrazilianBritishBritish West IndianBulgarianBurmeseCanadianCentral AmericanCentral American IndianCherokeeChileanColombianCosta RicanCroatianCubanCzechCzechoslovakianDanishDominicanDutchEastern EuropeanEcuadorianEgyptianEnglishEuropeanFinnishFrenchFrench CanadianGermanGreekGuatemalanGuyaneseHaitianHonduranHoumaHungarianIndian (Asian)IrishIroquoisIsraeliItalianJamaicanKoreanLebaneseLithuanianMexicanNative HawaiianNicaraguanNigerianNorthern EuropeanNorwegianPakistaniPanamanianParaguayanPeruvianPolishPortuguesePuerto RicanRomanianRussianSalvadoranScandinavianScotch-IrishScottishSlovakSloveneSouth AmericanSpaniardSpanishSri LankanSubsaharan AfricanSwedishSwissThaiTurkishU.S. Virgin IslanderUkrainianUruguayanVenezuelanWelshWest IndianYugoslavian
Immigrant Origin (Total)
Immigrant Origin (Percentage)
Income
Income (Families)
Income (Households)
Poverty
Poverty (Families)
Unemployment
Employment Occupations
Employment Industries
Employer Class
Commute Time
Commute Means
School Enrollment
Education by Degree Field
Occupancy
Finances
Physical Characteristics
Riverview
Compare Zip Codes
Comparison Subject

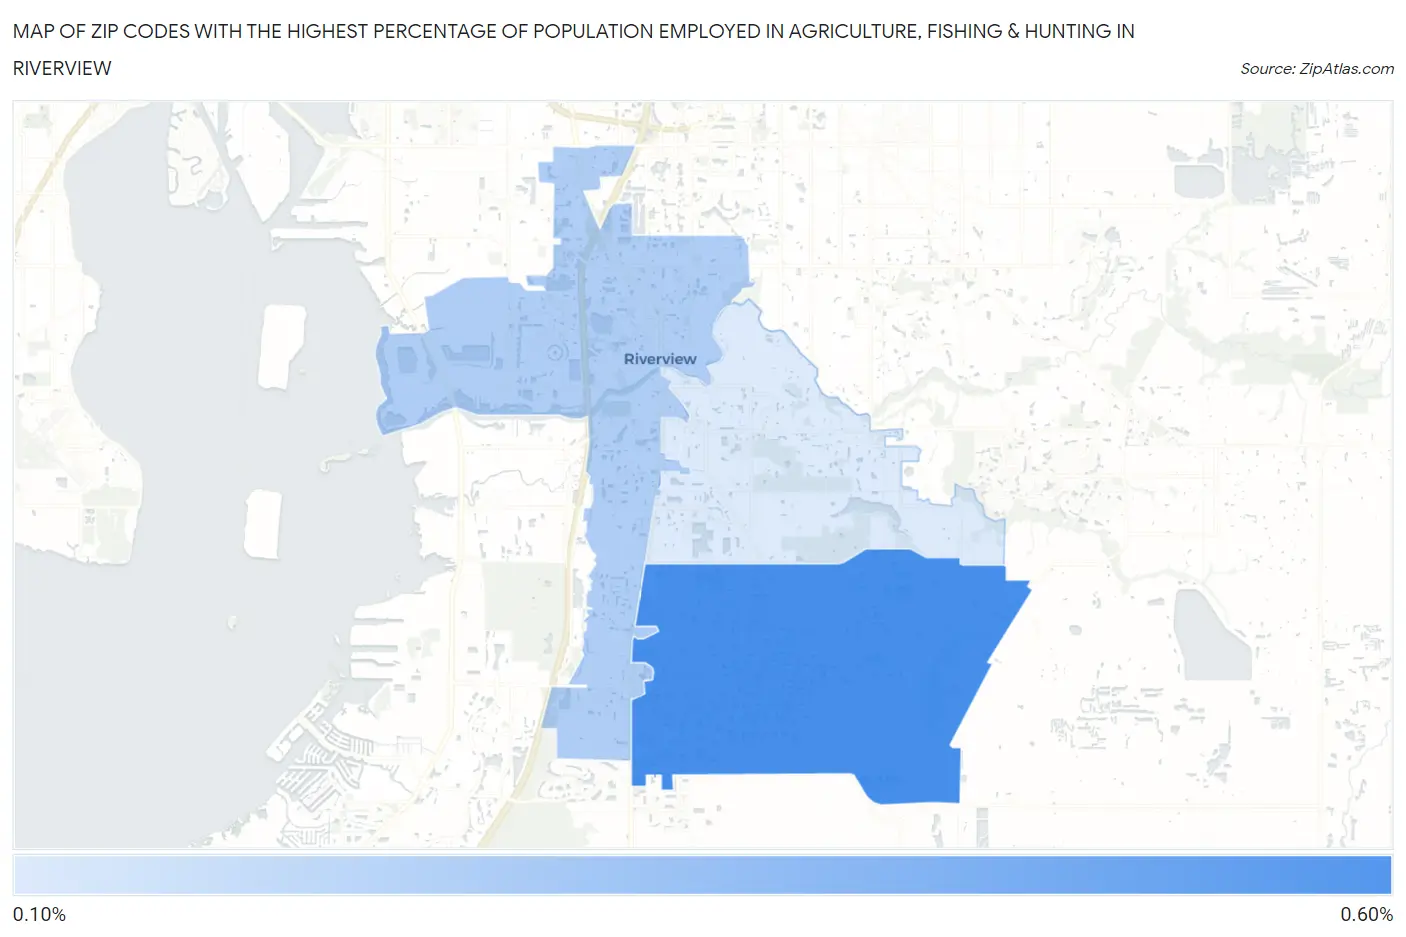
Map of Zip Codes with the Highest Percentage of Population Employed in Agriculture, Fishing & Hunting in Riverview

0.0%
0.60%
Zip Codes with the Highest Percentage of Population Employed in Agriculture, Fishing & Hunting in Riverview Map

Zip Codes with the Highest Percentage of Population Employed in Agriculture, Fishing & Hunting in Riverview, FL

Zip Code % Employed vs State vs National
1.335790.58%0.75%(-0.163)#3841.2%(-0.617)#18,611
2.335780.28%0.75%(-0.462)#5591.2%(-0.916)#21,371
3.335690.15%0.75%(-0.597)#6601.2%(-1.05)#23,033

Common Questions

What are the Top Zip Codes with the Highest Percentage of Population Employed in Agriculture, Fishing & Hunting in Riverview, FL?
Top Zip Codes with the Highest Percentage of Population Employed in Agriculture, Fishing & Hunting in Riverview, FL are:
#1
0.58%
#2
0.28%
#3
0.15%
What zip code has the Highest Percentage of Population Employed in Agriculture, Fishing & Hunting in Riverview, FL?
33579 has the Highest Percentage of Population Employed in Agriculture, Fishing & Hunting in Riverview, FL with 0.58%.
What is the Percentage of Population Employed in Agriculture, Fishing & Hunting in Riverview, FL?
Percentage of Population Employed in Agriculture, Fishing & Hunting in Riverview is 0.31%.
What is the Percentage of Population Employed in Agriculture, Fishing & Hunting in Florida?
Percentage of Population Employed in Agriculture, Fishing & Hunting in Florida is 0.75%.
What is the Percentage of Population Employed in Agriculture, Fishing & Hunting in the United States?
Percentage of Population Employed in Agriculture, Fishing & Hunting in the United States is 1.2%.