Yuman vs Laotian Average Family Size
COMPARE
Yuman
Laotian
Average Family Size
Average Family Size Comparison
Yuman
Laotians
3.47
AVERAGE FAMILY SIZE
100.0/ 100
METRIC RATING
21st/ 347
METRIC RANK
3.26
AVERAGE FAMILY SIZE
88.5/ 100
METRIC RATING
130th/ 347
METRIC RANK
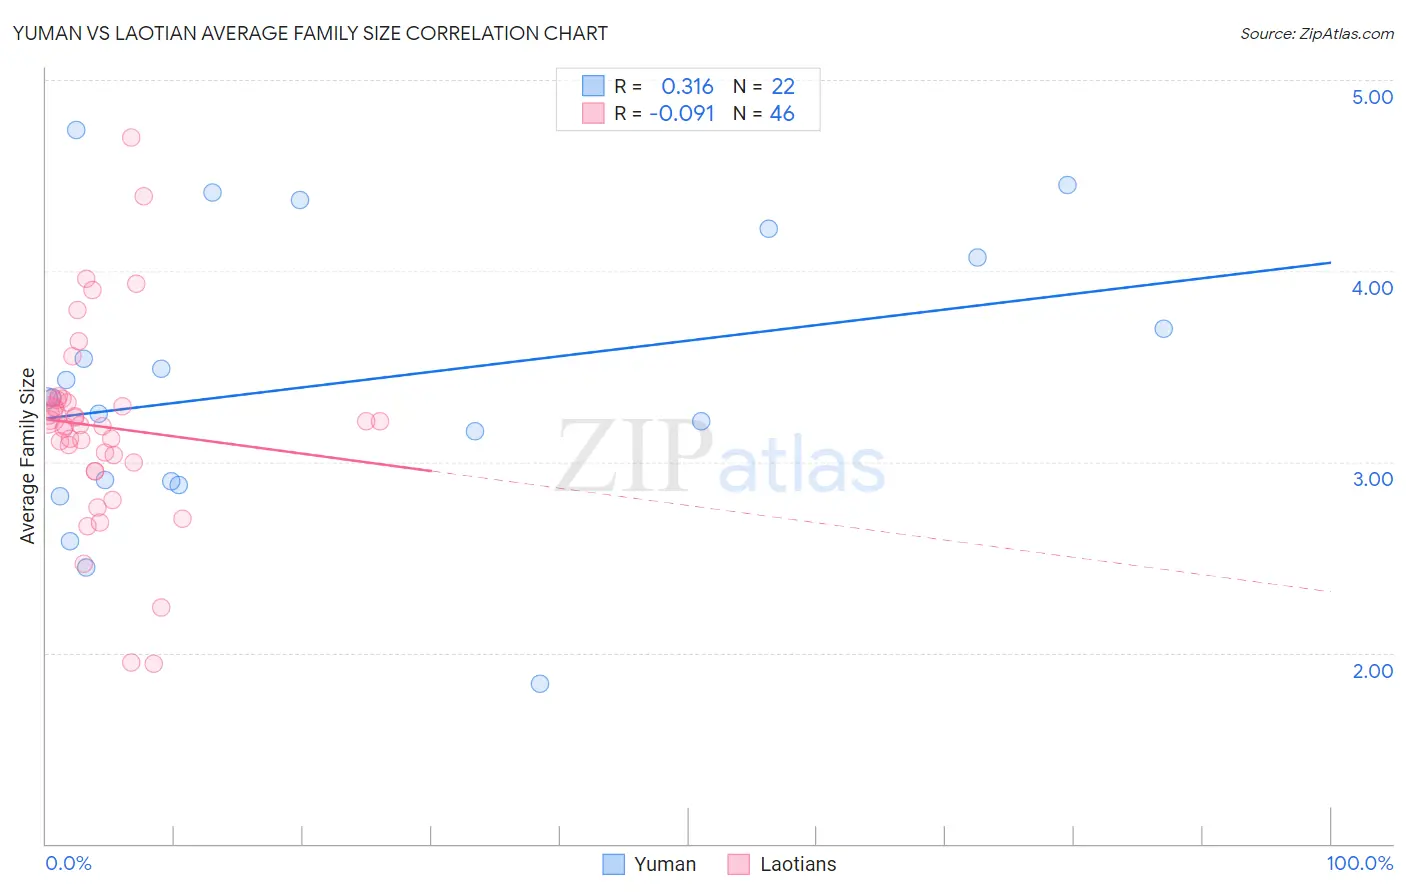
Yuman vs Laotian Average Family Size Correlation Chart
The statistical analysis conducted on geographies consisting of 40,663,604 people shows a mild positive correlation between the proportion of Yuman and average family size in the United States with a correlation coefficient (R) of 0.316 and weighted average of 3.47. Similarly, the statistical analysis conducted on geographies consisting of 224,743,344 people shows a slight negative correlation between the proportion of Laotians and average family size in the United States with a correlation coefficient (R) of -0.091 and weighted average of 3.26, a difference of 6.4%.
Average Family Size Correlation Summary
| Measurement | Yuman | Laotian |
| Minimum | 1.84 | 1.94 |
| Maximum | 4.74 | 4.70 |
| Range | 2.90 | 2.76 |
| Mean | 3.41 | 3.18 |
| Median | 3.33 | 3.20 |
| Interquartile 25% (IQ1) | 2.90 | 3.00 |
| Interquartile 75% (IQ3) | 4.07 | 3.32 |
| Interquartile Range (IQR) | 1.17 | 0.32 |
| Standard Deviation (Sample) | 0.73 | 0.52 |
| Standard Deviation (Population) | 0.72 | 0.51 |
Similar Demographics by Average Family Size
Demographics Similar to Yuman by Average Family Size
In terms of average family size, the demographic groups most similar to Yuman are Apache (3.46, a difference of 0.060%), Cheyenne (3.47, a difference of 0.25%), Mexican (3.48, a difference of 0.30%), Immigrants from Fiji (3.45, a difference of 0.35%), and Salvadoran (3.48, a difference of 0.36%).
| Demographics | Rating | Rank | Average Family Size |
| Immigrants | Central America | 100.0 /100 | #14 | Exceptional 3.49 |
| Tongans | 100.0 /100 | #15 | Exceptional 3.49 |
| Ute | 100.0 /100 | #16 | Exceptional 3.49 |
| Immigrants | El Salvador | 100.0 /100 | #17 | Exceptional 3.49 |
| Salvadorans | 100.0 /100 | #18 | Exceptional 3.48 |
| Mexicans | 100.0 /100 | #19 | Exceptional 3.48 |
| Cheyenne | 100.0 /100 | #20 | Exceptional 3.47 |
| Yuman | 100.0 /100 | #21 | Exceptional 3.47 |
| Apache | 100.0 /100 | #22 | Exceptional 3.46 |
| Immigrants | Fiji | 100.0 /100 | #23 | Exceptional 3.45 |
| Natives/Alaskans | 100.0 /100 | #24 | Exceptional 3.45 |
| Yakama | 100.0 /100 | #25 | Exceptional 3.45 |
| Native Hawaiians | 100.0 /100 | #26 | Exceptional 3.43 |
| Mexican American Indians | 100.0 /100 | #27 | Exceptional 3.43 |
| Immigrants | Latin America | 100.0 /100 | #28 | Exceptional 3.42 |
Demographics Similar to Laotians by Average Family Size
In terms of average family size, the demographic groups most similar to Laotians are Immigrants from Hong Kong (3.26, a difference of 0.010%), Immigrants from Western Asia (3.26, a difference of 0.030%), Colombian (3.26, a difference of 0.060%), Costa Rican (3.26, a difference of 0.070%), and Immigrants from Venezuela (3.26, a difference of 0.090%).
| Demographics | Rating | Rank | Average Family Size |
| Alaskan Athabascans | 92.4 /100 | #123 | Exceptional 3.27 |
| South American Indians | 91.6 /100 | #124 | Exceptional 3.26 |
| Immigrants | Cuba | 91.3 /100 | #125 | Exceptional 3.26 |
| Immigrants | Costa Rica | 90.7 /100 | #126 | Exceptional 3.26 |
| Immigrants | Syria | 90.6 /100 | #127 | Exceptional 3.26 |
| Colombians | 89.9 /100 | #128 | Excellent 3.26 |
| Immigrants | Hong Kong | 88.6 /100 | #129 | Excellent 3.26 |
| Laotians | 88.5 /100 | #130 | Excellent 3.26 |
| Immigrants | Western Asia | 87.7 /100 | #131 | Excellent 3.26 |
| Costa Ricans | 86.8 /100 | #132 | Excellent 3.26 |
| Immigrants | Venezuela | 86.3 /100 | #133 | Excellent 3.26 |
| Africans | 84.9 /100 | #134 | Excellent 3.25 |
| Panamanians | 84.2 /100 | #135 | Excellent 3.25 |
| Comanche | 82.8 /100 | #136 | Excellent 3.25 |
| Immigrants | Middle Africa | 82.4 /100 | #137 | Excellent 3.25 |