Shoshone vs Irish Family Households with Children

COMPARE

Shoshone
Race
Ancestry
AfghanAfricanAlaska NativeAlaskan AthabascanAlbanianAleutAlsatianAmericanApacheArabArapahoArgentineanArmenianAssyrian/Chaldean/SyriacAustralianAustrianBahamianBangladeshiBarbadianBasqueBelgianBelizeanBermudanBhutaneseBlackfeetBolivianBrazilianBritishBritish West IndianBulgarianBurmeseCajunCambodianCanadianCape VerdeanCarpatho RusynCelticCentral AmericanCentral American IndianCherokeeCheyenneChickasawChileanChineseChippewaChoctawColombianColvilleComancheCosta RicanCreeCreekCroatianCrowCubanCypriotCzechCzechoslovakianDanishDelawareDominicanDutchDutch West IndianEastern EuropeanEcuadorianEgyptianEnglishEstonianEthiopianEuropeanFijianFilipinoFinnishFrenchFrench American IndianFrench CanadianGermanGerman RussianGhanaianGreekGuamanian/ChamorroGuatemalanGuyaneseHaitianHmongHonduranHopiHoumaHungarianIcelanderIndian (Asian)IndonesianInupiatIranianIraqiIroquoisIsraeliItalianJamaicanJapaneseJordanianKenyanKiowaKoreanLaotianLatvianLebaneseLiberianLithuanianLumbeeLuxembourgerMacedonianMalaysianMalteseMarshalleseMenomineeMexicanMexican American IndianMongolianMoroccanNative HawaiianNavajoNepaleseNew ZealanderNicaraguanNigerianNorthern EuropeanNorwegianOkinawanOsageOttawaPaiutePakistaniPalestinianPanamanianParaguayanPennsylvania GermanPeruvianPimaPolishPortuguesePotawatomiPuebloPuerto RicanPuget Sound SalishRomanianRussianSalvadoranSamoanScandinavianScotch-IrishScottishSeminoleSenegaleseSerbianShoshoneSierra LeoneanSiouxSlavicSlovakSloveneSomaliSouth AfricanSouth AmericanSouth American IndianSoviet UnionSpaniardSpanishSpanish AmericanSpanish American IndianSri LankanSubsaharan AfricanSudaneseSwedishSwissSyrianTaiwaneseThaiTlingit-HaidaTohono O'OdhamTonganTrinidadian and TobagonianTsimshianTurkishU.S. Virgin IslanderUgandanUkrainianUruguayanUteVenezuelanVietnameseWelshWest IndianYakamaYaquiYugoslavianYumanYup'ikZimbabwean
Immigration
NonimmigrantsImmigrantsAfghanistanAfricaAlbaniaArgentinaArmeniaAsiaAustraliaAustriaBahamasBangladeshBarbadosBelarusBelgiumBelizeBoliviaBosnia and HerzegovinaBrazilBulgariaBurma/MyanmarCabo VerdeCambodiaCameroonCanadaCaribbeanCentral AmericaChileChinaColombiaCongoCosta RicaCroatiaCubaCzechoslovakiaDenmarkDominicaDominican RepublicEastern AfricaEastern AsiaEastern EuropeEcuadorEgyptEl SalvadorEnglandEritreaEthiopiaEuropeFijiFranceGermanyGhanaGreeceGrenadaGuatemalaGuyanaHaitiHondurasHong KongHungaryIndiaIndonesiaIranIraqIrelandIsraelItalyJamaicaJapanJordanKazakhstanKenyaKoreaKuwaitLaosLatin AmericaLatviaLebanonLiberiaLithuaniaMalaysiaMexicoMicronesiaMiddle AfricaMoldovaMoroccoNepalNetherlandsNicaraguaNigeriaNorth AmericaNorth MacedoniaNorthern AfricaNorthern EuropeNorwayOceaniaPakistanPanamaPeruPhilippinesPolandPortugalRomaniaRussiaSaudi ArabiaScotlandSenegalSerbiaSierra LeoneSingaporeSomaliaSouth AfricaSouth AmericaSouth Central AsiaSouth Eastern AsiaSouthern EuropeSpainSri LankaSt. Vincent and the GrenadinesSudanSwedenSwitzerlandSyriaTaiwanThailandTrinidad and TobagoTurkeyUgandaUkraineUruguayUzbekistanVenezuelaVietnamWest IndiesWestern AfricaWestern AsiaWestern EuropeYemenZaireZimbabweAzores
Irish
Race
Ancestry
AfghanAfricanAlaska NativeAlaskan AthabascanAlbanianAleutAlsatianAmericanApacheArabArapahoArgentineanArmenianAssyrian/Chaldean/SyriacAustralianAustrianBahamianBangladeshiBarbadianBasqueBelgianBelizeanBermudanBhutaneseBlackfeetBolivianBrazilianBritishBritish West IndianBulgarianBurmeseCajunCambodianCanadianCape VerdeanCarpatho RusynCelticCentral AmericanCentral American IndianCherokeeCheyenneChickasawChileanChineseChippewaChoctawColombianColvilleComancheCosta RicanCreeCreekCroatianCrowCubanCypriotCzechCzechoslovakianDanishDelawareDominicanDutchDutch West IndianEastern EuropeanEcuadorianEgyptianEnglishEstonianEthiopianEuropeanFijianFilipinoFinnishFrenchFrench American IndianFrench CanadianGermanGerman RussianGhanaianGreekGuamanian/ChamorroGuatemalanGuyaneseHaitianHmongHonduranHopiHoumaHungarianIcelanderIndian (Asian)IndonesianInupiatIranianIraqiIrishIroquoisIsraeliItalianJamaicanJapaneseJordanianKenyanKiowaKoreanLaotianLatvianLebaneseLiberianLithuanianLumbeeLuxembourgerMacedonianMalaysianMalteseMarshalleseMenomineeMexicanMexican American IndianMongolianMoroccanNative HawaiianNavajoNepaleseNew ZealanderNicaraguanNigerianNorthern EuropeanNorwegianOkinawanOsageOttawaPaiutePakistaniPalestinianPanamanianParaguayanPennsylvania GermanPeruvianPimaPolishPortuguesePotawatomiPuebloPuerto RicanPuget Sound SalishRomanianRussianSalvadoranSamoanScandinavianScotch-IrishScottishSeminoleSenegaleseSerbianSierra LeoneanSiouxSlavicSlovakSloveneSomaliSouth AfricanSouth AmericanSouth American IndianSoviet UnionSpaniardSpanishSpanish AmericanSpanish American IndianSri LankanSubsaharan AfricanSudaneseSwedishSwissSyrianTaiwaneseThaiTlingit-HaidaTohono O'OdhamTonganTrinidadian and TobagonianTsimshianTurkishU.S. Virgin IslanderUgandanUkrainianUruguayanUteVenezuelanVietnameseWelshWest IndianYakamaYaquiYugoslavianYumanYup'ikZimbabwean
Immigration
NonimmigrantsImmigrantsAfghanistanAfricaAlbaniaArgentinaArmeniaAsiaAustraliaAustriaBahamasBangladeshBarbadosBelarusBelgiumBelizeBoliviaBosnia and HerzegovinaBrazilBulgariaBurma/MyanmarCabo VerdeCambodiaCameroonCanadaCaribbeanCentral AmericaChileChinaColombiaCongoCosta RicaCroatiaCubaCzechoslovakiaDenmarkDominicaDominican RepublicEastern AfricaEastern AsiaEastern EuropeEcuadorEgyptEl SalvadorEnglandEritreaEthiopiaEuropeFijiFranceGermanyGhanaGreeceGrenadaGuatemalaGuyanaHaitiHondurasHong KongHungaryIndiaIndonesiaIranIraqIrelandIsraelItalyJamaicaJapanJordanKazakhstanKenyaKoreaKuwaitLaosLatin AmericaLatviaLebanonLiberiaLithuaniaMalaysiaMexicoMicronesiaMiddle AfricaMoldovaMoroccoNepalNetherlandsNicaraguaNigeriaNorth AmericaNorth MacedoniaNorthern AfricaNorthern EuropeNorwayOceaniaPakistanPanamaPeruPhilippinesPolandPortugalRomaniaRussiaSaudi ArabiaScotlandSenegalSerbiaSierra LeoneSingaporeSomaliaSouth AfricaSouth AmericaSouth Central AsiaSouth Eastern AsiaSouthern EuropeSpainSri LankaSt. Vincent and the GrenadinesSudanSwedenSwitzerlandSyriaTaiwanThailandTrinidad and TobagoTurkeyUgandaUkraineUruguayUzbekistanVenezuelaVietnamWest IndiesWestern AfricaWestern AsiaWestern EuropeYemenZaireZimbabweAzores
Family Households with Children
Income
Poverty
Unemployment
Labor Participation
Family Structure
Vehicle Availability
Education Level
Disability

Family Households with Children Comparison

Shoshone

Irish

Tragic
Tragic
26.5%
FAMILY HOUSEHOLDS WITH CHILDREN
0.2/ 100
METRIC RATING
287th/ 347
METRIC RANK
26.8%
FAMILY HOUSEHOLDS WITH CHILDREN
1.8/ 100
METRIC RATING
252nd/ 347
METRIC RANK

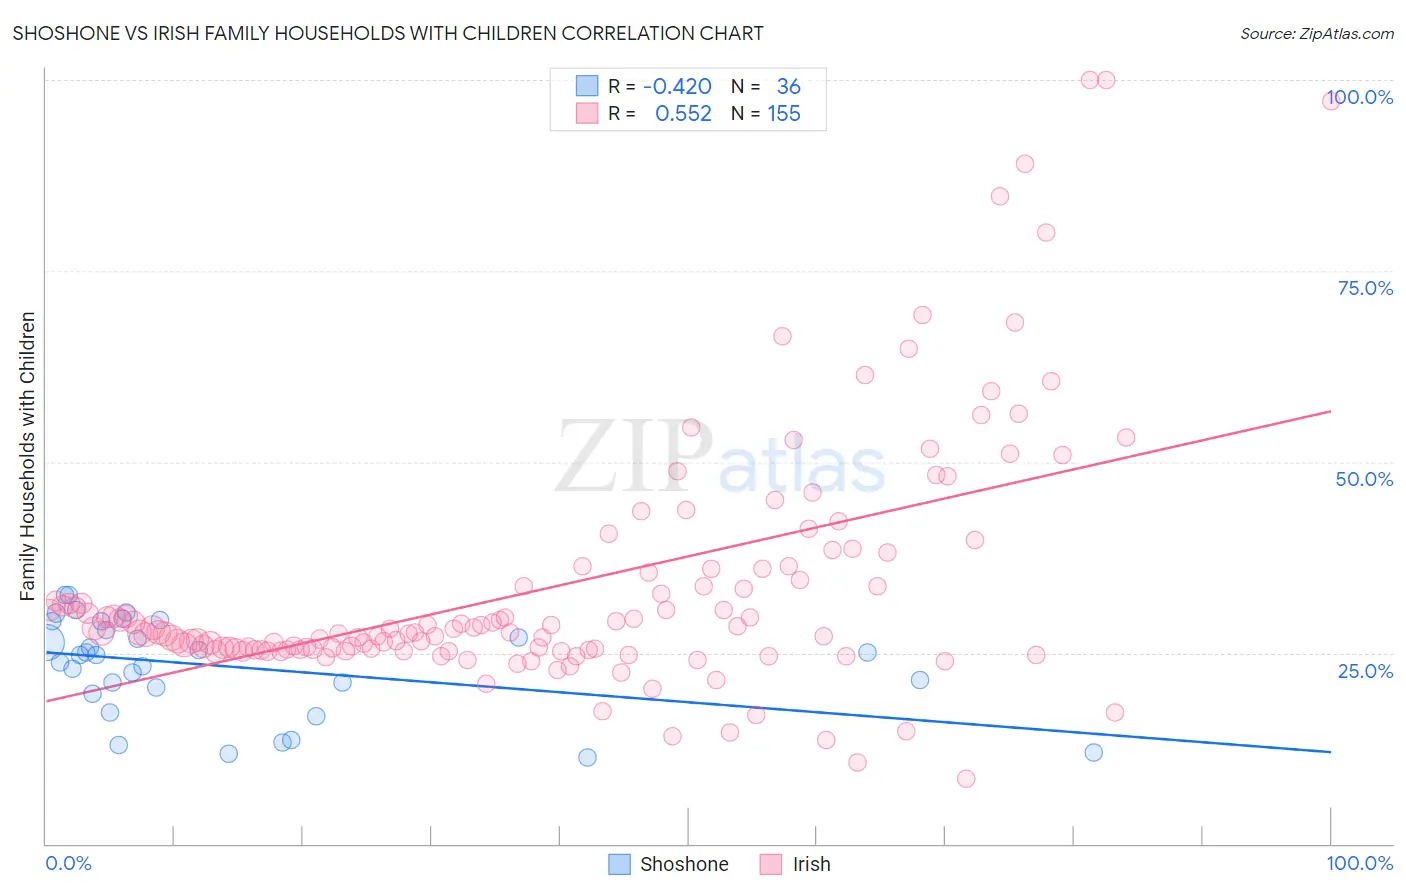
Shoshone vs Irish Family Households with Children Correlation Chart

The statistical analysis conducted on geographies consisting of 66,580,545 people shows a moderate negative correlation between the proportion of Shoshone and percentage of family households with children in the United States with a correlation coefficient (R) of -0.420 and weighted average of 26.5%. Similarly, the statistical analysis conducted on geographies consisting of 579,410,491 people shows a substantial positive correlation between the proportion of Irish and percentage of family households with children in the United States with a correlation coefficient (R) of 0.552 and weighted average of 26.8%, a difference of 1.2%.
Shoshone vs Irish Family Households with Children

Family Households with Children Correlation Summary

MeasurementShoshoneIrish
Minimum11.3%8.5%
Maximum32.6%100.0%
Range21.2%91.5%
Mean23.2%33.6%
Median24.7%27.6%
Interquartile 25% (IQ1)20.0%25.4%
Interquartile 75% (IQ3)28.6%36.0%
Interquartile Range (IQR)8.6%10.5%
Standard Deviation (Sample)6.2%16.3%
Standard Deviation (Population)6.2%16.2%

Similar Demographics by Family Households with Children

Demographics Similar to Shoshone by Family Households with Children

In terms of family households with children, the demographic groups most similar to Shoshone are Immigrants from Senegal (26.5%, a difference of 0.0%), Russian (26.5%, a difference of 0.020%), Cambodian (26.5%, a difference of 0.050%), Immigrants from Sweden (26.5%, a difference of 0.070%), and Immigrants from Canada (26.5%, a difference of 0.090%).
DemographicsRating | RankFamily Households with Children
Senegalese
0.4
/100
|
#280
Tragic
26.6%
Lithuanians
0.3
/100
|
#281
Tragic
26.6%
French American Indians
0.3
/100
|
#282
Tragic
26.6%
Immigrants | North America
0.3
/100
|
#283
Tragic
26.6%
Immigrants | Canada
0.3
/100
|
#284
Tragic
26.5%
Cambodians
0.2
/100
|
#285
Tragic
26.5%
Immigrants | Senegal
0.2
/100
|
#286
Tragic
26.5%
Shoshone
0.2
/100
|
#287
Tragic
26.5%
Russians
0.2
/100
|
#288
Tragic
26.5%
Immigrants | Sweden
0.2
/100
|
#289
Tragic
26.5%
Albanians
0.2
/100
|
#290
Tragic
26.5%
Bahamians
0.2
/100
|
#291
Tragic
26.5%
Poles
0.2
/100
|
#292
Tragic
26.5%
Blacks/African Americans
0.1
/100
|
#293
Tragic
26.5%
Latvians
0.1
/100
|
#294
Tragic
26.4%

Demographics Similar to Irish by Family Households with Children

In terms of family households with children, the demographic groups most similar to Irish are Immigrants from Bosnia and Herzegovina (26.8%, a difference of 0.030%), Italian (26.8%, a difference of 0.080%), Belgian (26.9%, a difference of 0.090%), Immigrants from Eastern Europe (26.9%, a difference of 0.10%), and Immigrants from Scotland (26.8%, a difference of 0.10%).
DemographicsRating | RankFamily Households with Children
Australians
2.8
/100
|
#245
Tragic
26.9%
Jamaicans
2.5
/100
|
#246
Tragic
26.9%
Potawatomi
2.2
/100
|
#247
Tragic
26.9%
Immigrants | Kazakhstan
2.2
/100
|
#248
Tragic
26.9%
Immigrants | Eastern Europe
2.1
/100
|
#249
Tragic
26.9%
Belgians
2.1
/100
|
#250
Tragic
26.9%
Immigrants | Bosnia and Herzegovina
1.9
/100
|
#251
Tragic
26.8%
Irish
1.8
/100
|
#252
Tragic
26.8%
Italians
1.5
/100
|
#253
Tragic
26.8%
Immigrants | Scotland
1.5
/100
|
#254
Tragic
26.8%
German Russians
1.5
/100
|
#255
Tragic
26.8%
Scotch-Irish
1.4
/100
|
#256
Tragic
26.8%
Slavs
1.3
/100
|
#257
Tragic
26.8%
Immigrants | Cuba
1.3
/100
|
#258
Tragic
26.8%
Immigrants | Lithuania
1.2
/100
|
#259
Tragic
26.8%