Romanian vs Guamanian/Chamorro Average Family Size
COMPARE
Romanian
Guamanian/Chamorro
Average Family Size
Average Family Size Comparison
Romanians
Guamanians/Chamorros
3.18
AVERAGE FAMILY SIZE
3.7/ 100
METRIC RATING
238th/ 347
METRIC RANK
3.29
AVERAGE FAMILY SIZE
98.6/ 100
METRIC RATING
100th/ 347
METRIC RANK
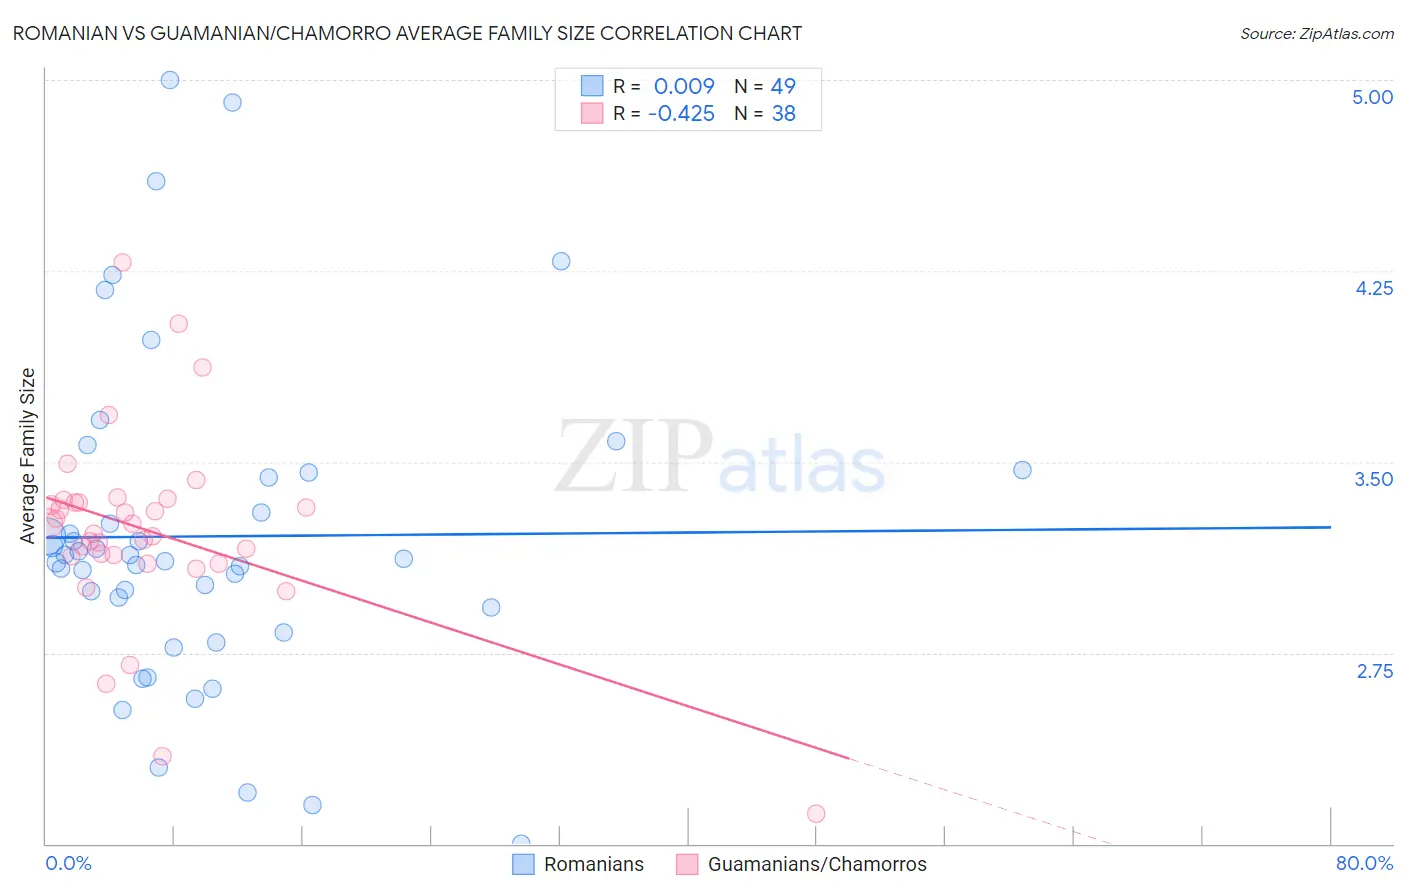
Romanian vs Guamanian/Chamorro Average Family Size Correlation Chart
The statistical analysis conducted on geographies consisting of 377,712,240 people shows no correlation between the proportion of Romanians and average family size in the United States with a correlation coefficient (R) of 0.009 and weighted average of 3.18. Similarly, the statistical analysis conducted on geographies consisting of 221,865,945 people shows a moderate negative correlation between the proportion of Guamanians/Chamorros and average family size in the United States with a correlation coefficient (R) of -0.425 and weighted average of 3.29, a difference of 3.5%.
Average Family Size Correlation Summary
| Measurement | Romanian | Guamanian/Chamorro |
| Minimum | 2.00 | 2.12 |
| Maximum | 5.00 | 4.28 |
| Range | 3.00 | 2.16 |
| Mean | 3.21 | 3.23 |
| Median | 3.12 | 3.24 |
| Interquartile 25% (IQ1) | 2.88 | 3.13 |
| Interquartile 75% (IQ3) | 3.45 | 3.34 |
| Interquartile Range (IQR) | 0.57 | 0.21 |
| Standard Deviation (Sample) | 0.64 | 0.38 |
| Standard Deviation (Population) | 0.63 | 0.38 |
Similar Demographics by Average Family Size
Demographics Similar to Romanians by Average Family Size
In terms of average family size, the demographic groups most similar to Romanians are Immigrants from Romania (3.18, a difference of 0.0%), Immigrants from Portugal (3.18, a difference of 0.050%), Houma (3.18, a difference of 0.050%), Immigrants from Turkey (3.18, a difference of 0.060%), and Osage (3.18, a difference of 0.070%).
| Demographics | Rating | Rank | Average Family Size |
| Basques | 5.2 /100 | #231 | Tragic 3.19 |
| Cherokee | 4.7 /100 | #232 | Tragic 3.18 |
| Brazilians | 4.5 /100 | #233 | Tragic 3.18 |
| Iranians | 4.5 /100 | #234 | Tragic 3.18 |
| Immigrants | Turkey | 4.2 /100 | #235 | Tragic 3.18 |
| Immigrants | Portugal | 4.2 /100 | #236 | Tragic 3.18 |
| Immigrants | Romania | 3.7 /100 | #237 | Tragic 3.18 |
| Romanians | 3.7 /100 | #238 | Tragic 3.18 |
| Houma | 3.4 /100 | #239 | Tragic 3.18 |
| Osage | 3.2 /100 | #240 | Tragic 3.18 |
| Immigrants | Japan | 3.0 /100 | #241 | Tragic 3.18 |
| Hungarians | 3.0 /100 | #242 | Tragic 3.18 |
| Immigrants | Moldova | 2.9 /100 | #243 | Tragic 3.18 |
| Immigrants | Southern Europe | 2.9 /100 | #244 | Tragic 3.18 |
| Immigrants | Brazil | 2.7 /100 | #245 | Tragic 3.18 |
Demographics Similar to Guamanians/Chamorros by Average Family Size
In terms of average family size, the demographic groups most similar to Guamanians/Chamorros are Immigrants from Oceania (3.29, a difference of 0.010%), Barbadian (3.29, a difference of 0.010%), Nigerian (3.29, a difference of 0.010%), Immigrants from Burma/Myanmar (3.29, a difference of 0.020%), and West Indian (3.29, a difference of 0.020%).
| Demographics | Rating | Rank | Average Family Size |
| Peruvians | 99.2 /100 | #93 | Exceptional 3.30 |
| Sierra Leoneans | 99.0 /100 | #94 | Exceptional 3.30 |
| Immigrants | Lebanon | 99.0 /100 | #95 | Exceptional 3.30 |
| U.S. Virgin Islanders | 98.8 /100 | #96 | Exceptional 3.29 |
| Immigrants | Oceania | 98.7 /100 | #97 | Exceptional 3.29 |
| Barbadians | 98.6 /100 | #98 | Exceptional 3.29 |
| Nigerians | 98.6 /100 | #99 | Exceptional 3.29 |
| Guamanians/Chamorros | 98.6 /100 | #100 | Exceptional 3.29 |
| Immigrants | Burma/Myanmar | 98.6 /100 | #101 | Exceptional 3.29 |
| West Indians | 98.5 /100 | #102 | Exceptional 3.29 |
| Immigrants | Western Africa | 98.4 /100 | #103 | Exceptional 3.29 |
| Bolivians | 98.3 /100 | #104 | Exceptional 3.29 |
| Immigrants | Ghana | 98.1 /100 | #105 | Exceptional 3.29 |
| Paiute | 98.0 /100 | #106 | Exceptional 3.29 |
| Ghanaians | 98.0 /100 | #107 | Exceptional 3.29 |