Puerto Rican vs Immigrants from Sri Lanka Single Mother Households
COMPARE
Puerto Rican
Immigrants from Sri Lanka
Single Mother Households
Single Mother Households Comparison
Puerto Ricans
Immigrants from Sri Lanka
8.7%
SINGLE MOTHER HOUSEHOLDS
0.0/ 100
METRIC RATING
336th/ 347
METRIC RANK
5.6%
SINGLE MOTHER HOUSEHOLDS
98.0/ 100
METRIC RATING
79th/ 347
METRIC RANK
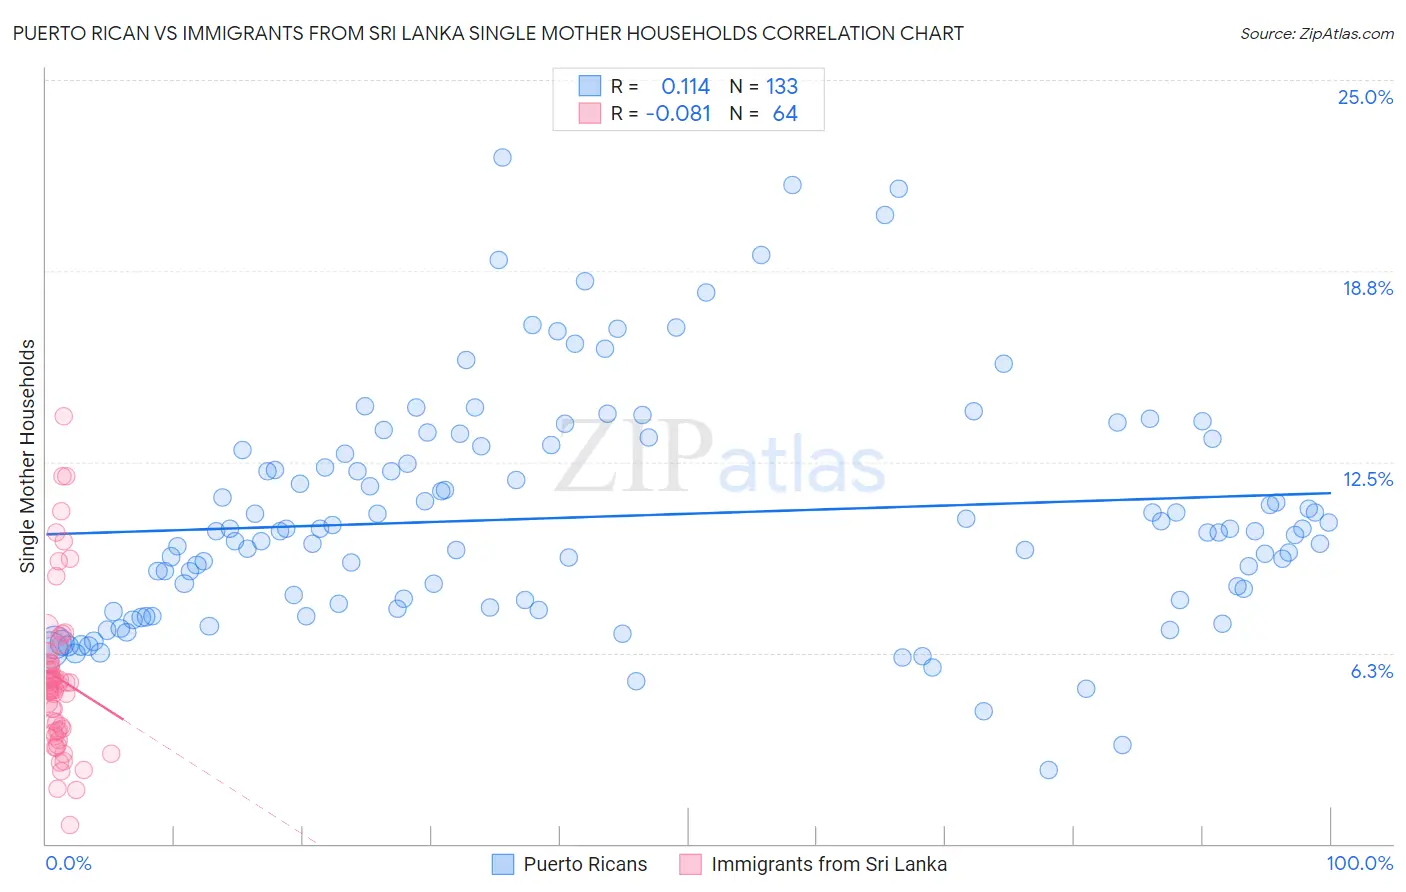
Puerto Rican vs Immigrants from Sri Lanka Single Mother Households Correlation Chart
The statistical analysis conducted on geographies consisting of 525,510,984 people shows a poor positive correlation between the proportion of Puerto Ricans and percentage of single mother households in the United States with a correlation coefficient (R) of 0.114 and weighted average of 8.7%. Similarly, the statistical analysis conducted on geographies consisting of 149,613,913 people shows a slight negative correlation between the proportion of Immigrants from Sri Lanka and percentage of single mother households in the United States with a correlation coefficient (R) of -0.081 and weighted average of 5.6%, a difference of 54.9%.
Single Mother Households Correlation Summary
| Measurement | Puerto Rican | Immigrants from Sri Lanka |
| Minimum | 2.4% | 0.60% |
| Maximum | 22.5% | 14.0% |
| Range | 20.0% | 13.4% |
| Mean | 10.7% | 5.4% |
| Median | 10.2% | 5.1% |
| Interquartile 25% (IQ1) | 7.8% | 3.7% |
| Interquartile 75% (IQ3) | 12.9% | 6.1% |
| Interquartile Range (IQR) | 5.1% | 2.4% |
| Standard Deviation (Sample) | 3.8% | 2.6% |
| Standard Deviation (Population) | 3.8% | 2.6% |
Similar Demographics by Single Mother Households
Demographics Similar to Puerto Ricans by Single Mother Households
In terms of single mother households, the demographic groups most similar to Puerto Ricans are Immigrants from Dominica (8.7%, a difference of 0.040%), Immigrants from Liberia (8.7%, a difference of 0.33%), Liberian (8.6%, a difference of 1.1%), Navajo (8.8%, a difference of 1.2%), and Cape Verdean (8.9%, a difference of 1.3%).
| Demographics | Rating | Rank | Single Mother Households |
| Hopi | 0.0 /100 | #329 | Tragic 8.5% |
| Inupiat | 0.0 /100 | #330 | Tragic 8.5% |
| Sioux | 0.0 /100 | #331 | Tragic 8.5% |
| U.S. Virgin Islanders | 0.0 /100 | #332 | Tragic 8.6% |
| Liberians | 0.0 /100 | #333 | Tragic 8.6% |
| Immigrants | Liberia | 0.0 /100 | #334 | Tragic 8.7% |
| Immigrants | Dominica | 0.0 /100 | #335 | Tragic 8.7% |
| Puerto Ricans | 0.0 /100 | #336 | Tragic 8.7% |
| Navajo | 0.0 /100 | #337 | Tragic 8.8% |
| Cape Verdeans | 0.0 /100 | #338 | Tragic 8.9% |
| Blacks/African Americans | 0.0 /100 | #339 | Tragic 9.0% |
| Lumbee | 0.0 /100 | #340 | Tragic 9.1% |
| Tohono O'odham | 0.0 /100 | #341 | Tragic 9.1% |
| Menominee | 0.0 /100 | #342 | Tragic 9.2% |
| Dominicans | 0.0 /100 | #343 | Tragic 9.2% |
Demographics Similar to Immigrants from Sri Lanka by Single Mother Households
In terms of single mother households, the demographic groups most similar to Immigrants from Sri Lanka are Czech (5.6%, a difference of 0.11%), Immigrants from Moldova (5.6%, a difference of 0.11%), Swiss (5.6%, a difference of 0.20%), Romanian (5.6%, a difference of 0.21%), and Immigrants from Malaysia (5.7%, a difference of 0.32%).
| Demographics | Rating | Rank | Single Mother Households |
| Immigrants | Netherlands | 98.4 /100 | #72 | Exceptional 5.6% |
| Immigrants | Asia | 98.4 /100 | #73 | Exceptional 5.6% |
| Immigrants | North America | 98.3 /100 | #74 | Exceptional 5.6% |
| Slovenes | 98.3 /100 | #75 | Exceptional 5.6% |
| New Zealanders | 98.2 /100 | #76 | Exceptional 5.6% |
| Romanians | 98.1 /100 | #77 | Exceptional 5.6% |
| Swiss | 98.1 /100 | #78 | Exceptional 5.6% |
| Immigrants | Sri Lanka | 98.0 /100 | #79 | Exceptional 5.6% |
| Czechs | 97.9 /100 | #80 | Exceptional 5.6% |
| Immigrants | Moldova | 97.9 /100 | #81 | Exceptional 5.6% |
| Immigrants | Malaysia | 97.8 /100 | #82 | Exceptional 5.7% |
| Immigrants | Hungary | 97.8 /100 | #83 | Exceptional 5.7% |
| Carpatho Rusyns | 97.7 /100 | #84 | Exceptional 5.7% |
| Hungarians | 97.6 /100 | #85 | Exceptional 5.7% |
| Finns | 97.6 /100 | #86 | Exceptional 5.7% |